Article

Detection of Abnormal Vibration Dampers on Transmission Lines in UAV Remote Sensing Images with PMA-YOLO

1
School of Electronics and Information Engineering, Anhui University, Hefei 230601, China
2
Hefei Institutes of Physical Science, Chinese Academy of Sciences, Hefei 230031, China
*
Author to whom correspondence should be addressed.
Remote Sens. 2021, 13(20), 4134; https://doi.org/10.3390/rs13204134
Submission received: 26 August 2021 / Revised: 2 October 2021 / Accepted: 14 October 2021 / Published: 15 October 2021
(This article belongs to the Special Issue Computer Vision and Deep Learning for Remote Sensing Applications)

Abstract

:
The accurate detection and timely replacement of abnormal vibration dampers on transmission lines are critical for the safe and stable operation of power systems. Recently, unmanned aerial vehicles (UAVs) have become widely used to inspect transmission lines. In this paper, we constructed a data set of abnormal vibration dampers (DAVDs) on transmission lines in images obtained by UAVs. There are four types of vibration dampers in this data set, and each vibration damper may be rusty, defective, or normal. The challenges in the detection of abnormal vibration dampers on transmission lines in the images captured by UAVs were as following: the images had a high resolution as well as the objects of vibration dampers were relatively small and sparsely distributed, and the backgrounds of cross stage partial networks of the images were complex due to the fact that the transmission lines were erected in a variety of outdoor environments. Existing methods of ground-based object detection significantly reduced the accuracy when dealing with complex backgrounds and small objects of abnormal vibration dampers detection. To address these issues, we proposed an end-to-end parallel mixed attention You Only Look Once (PMA-YOLO) network to improve the detection performance for abnormal vibration dampers. The parallel mixed attention (PMA) module was introduced and integrated into the YOLOv4 network. This module combines a channel attention block and a spatial attention block, and the convolution results of the input feature maps in parallel, allowing the network to pay more attention to critical regions of abnormal vibration dampers in complex background images. Meanwhile, in view of the problem that abnormal vibration dampers are prone to missing detections, we analyzed the scale and ratio of the ground truth boxes and used the K-means algorithm to re-cluster new anchors for abnormal vibration dampers in images. In addition, we introduced a multi-stage transfer learning strategy to improve the efficiency of the original training method and prevent overfitting by the network. The experimental results showed that the m A P @ 0.5 for PMA-YOLO in the detection of abnormal vibration dampers reached 93.8% on the test set of DAVD, 3.5% higher than that of YOLOv4. When the multi-stage transfer learning strategy was used, the m A P @ 0.5 was improved by a further 0.2%.

Graphical Abstract

1. Introduction

The components of transmission lines include transmission towers, power lines, vibration dampers, insulators, etc. These components are prone to physical faults after being exposed to extreme weather conditions and high mechanical tension for a long period [1,2]. Vibration dampers are important components of transmission lines and mainly used to protect power lines from the periodic vibrations caused by wind, so as to reduce accidents such as transmission line fatigue and strand breakage [3]. A vibration damper consists of two hammers, a steel strand, and a wire clamp. Normally, two hammers are fixed at both ends of the steel strand, and the vibration damper is fixed on a power line through its wire clamp. Exposed to the outdoors for a long time, the vibration dampers are prone to rust. The surface of vibration damper may initially fade and then develop into several dark brown irregular blocks as rain and snow continue to erode it, eventually spreading to the entire vibration damper. In addition, once the steel strand is loosened, which is typically caused by rust, the hammers of vibration damper are prone to deformation, slide, and fall [4,5]. If the above abnormalities occur to the vibration dampers, power transmission will be affected, meaning that accurate detection and timely replacement of abnormal vibration dampers are of great importance to ensuring safe and stable operation of the power system [6].
The above features make it possible to detect the abnormality of vibration dampers using visual imaging technology. Traditionally, the color or shape features of vibration dampers are inspected by professional and experienced inspectors on foot, who use telescopes or infrared thermal imagers to check the appearance of each vibration damper [7,8]. As a result, this method is therefore time-consuming, laborious, and potentially dangerous. The accuracy of inspection results is also limited by the skills of the inspectors. With the continuous development of UAV technology, inspection by UAVs has gradually started to be applied to the power industry [9,10]. The inspector remotely operates the UAV to capture a large number of images of vibration dampers, which are then automatically analyzed using the trained computer vision model. The inspection technology by UAV is low cost, high security, and high efficiency [11,12,13].
The methods based on computer vision have achieved some success in terms of the detection of abnormal objects. However, on the one hand, the resolution of UAV remote sensing images is very high, and the vibration dampers in images are relatively small and sparsely distributed. On the other hand, the backgrounds of these images are complex because the transmission lines are erected in different outdoor environments. The existing methods still cannot meet the requirements for accurate location and classification of abnormal vibration dampers from images, and thus further research is needed. The main contributions of our work can be summarized as follows:
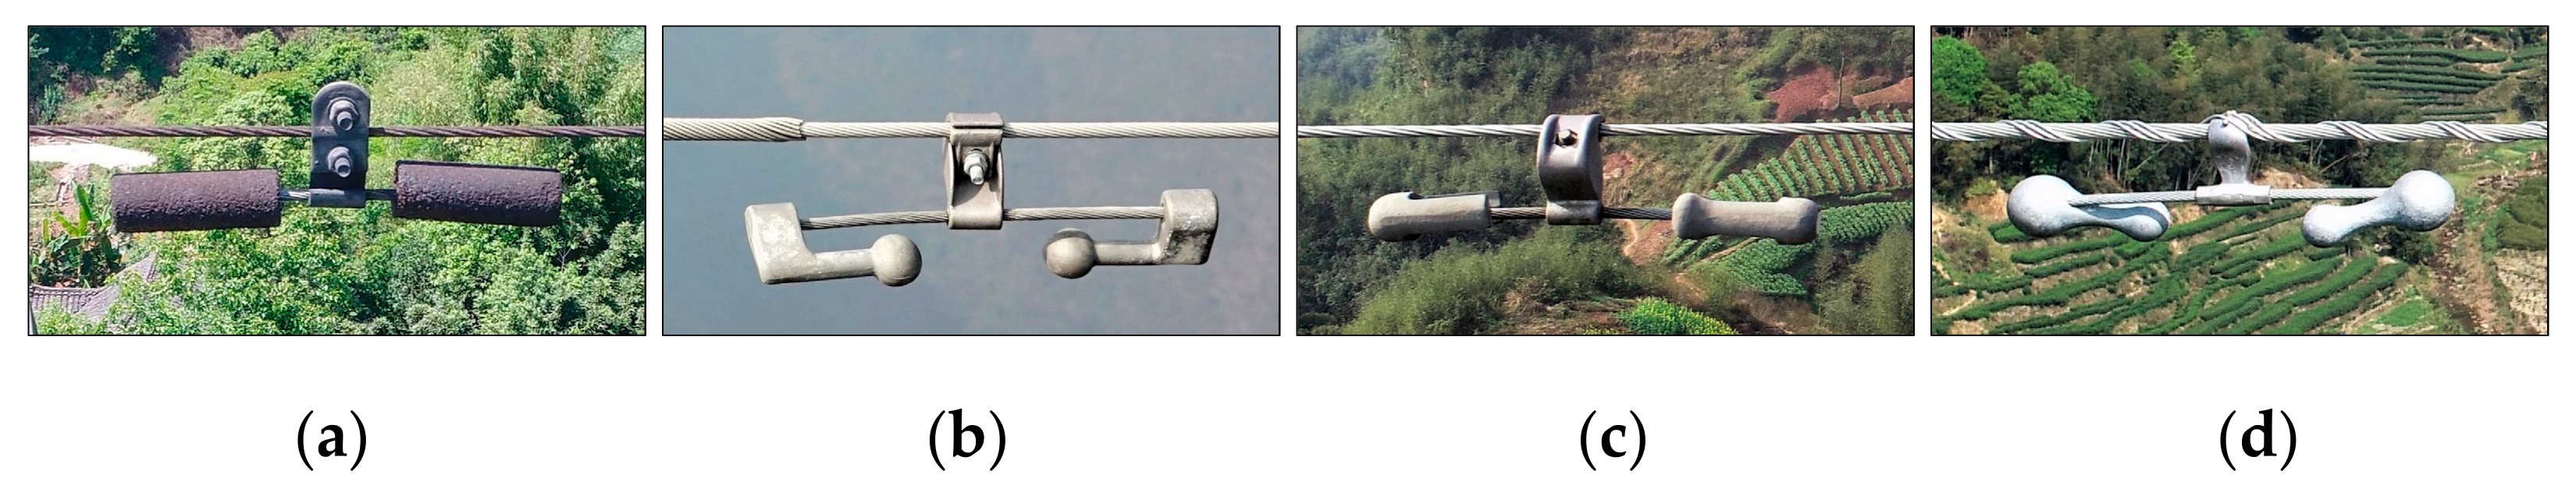
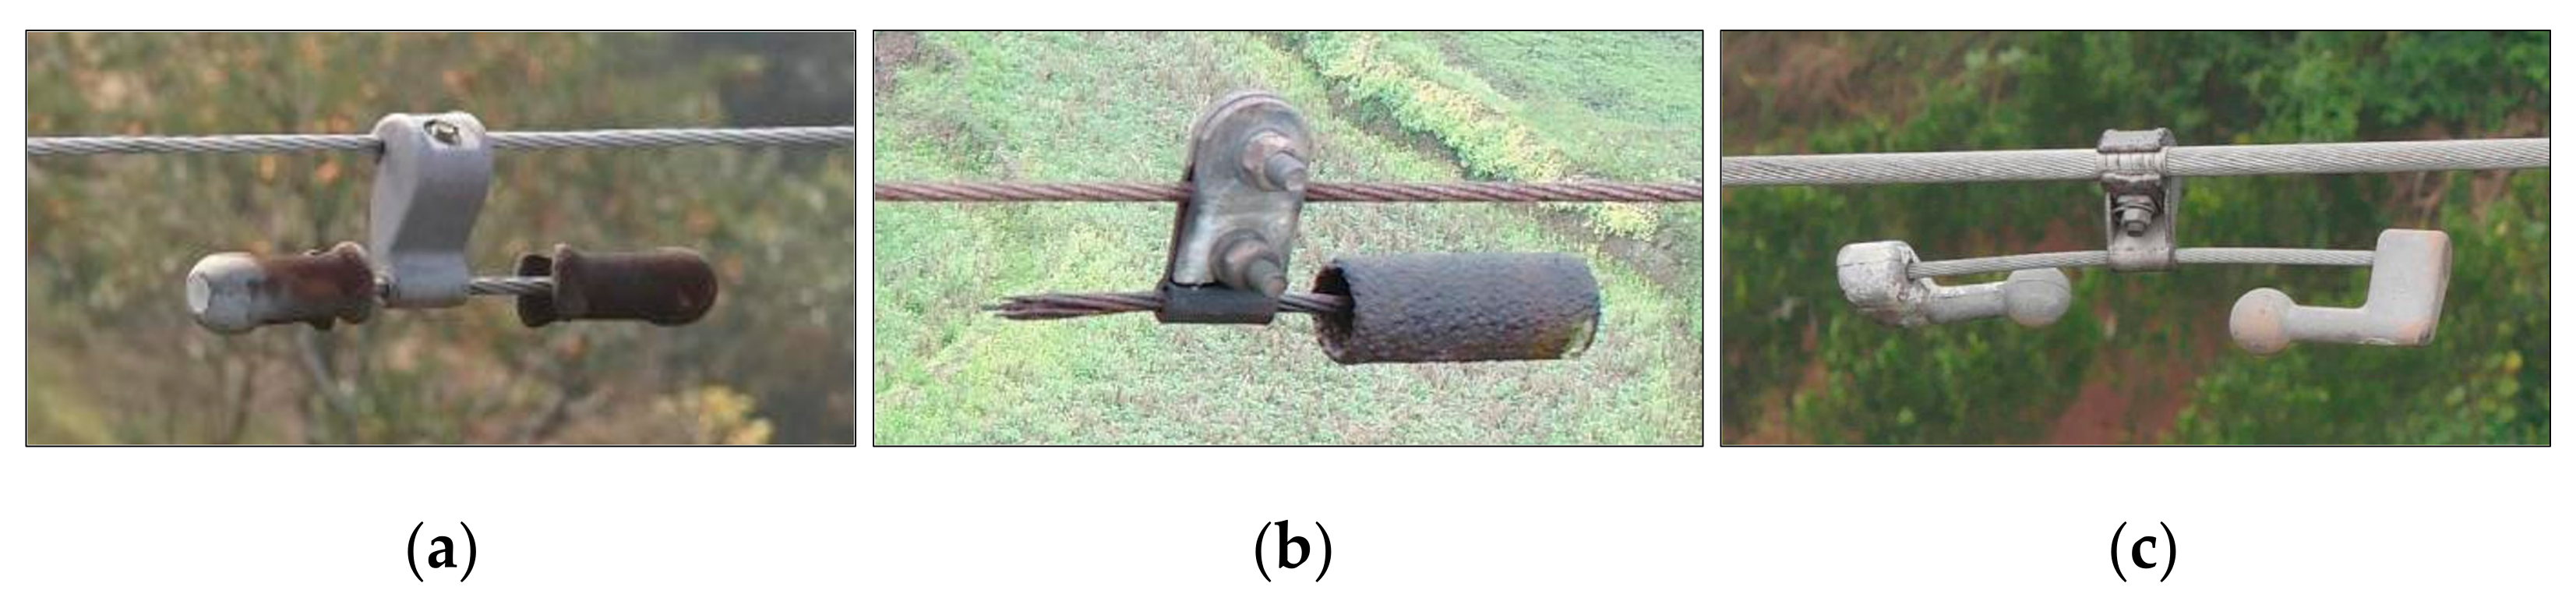
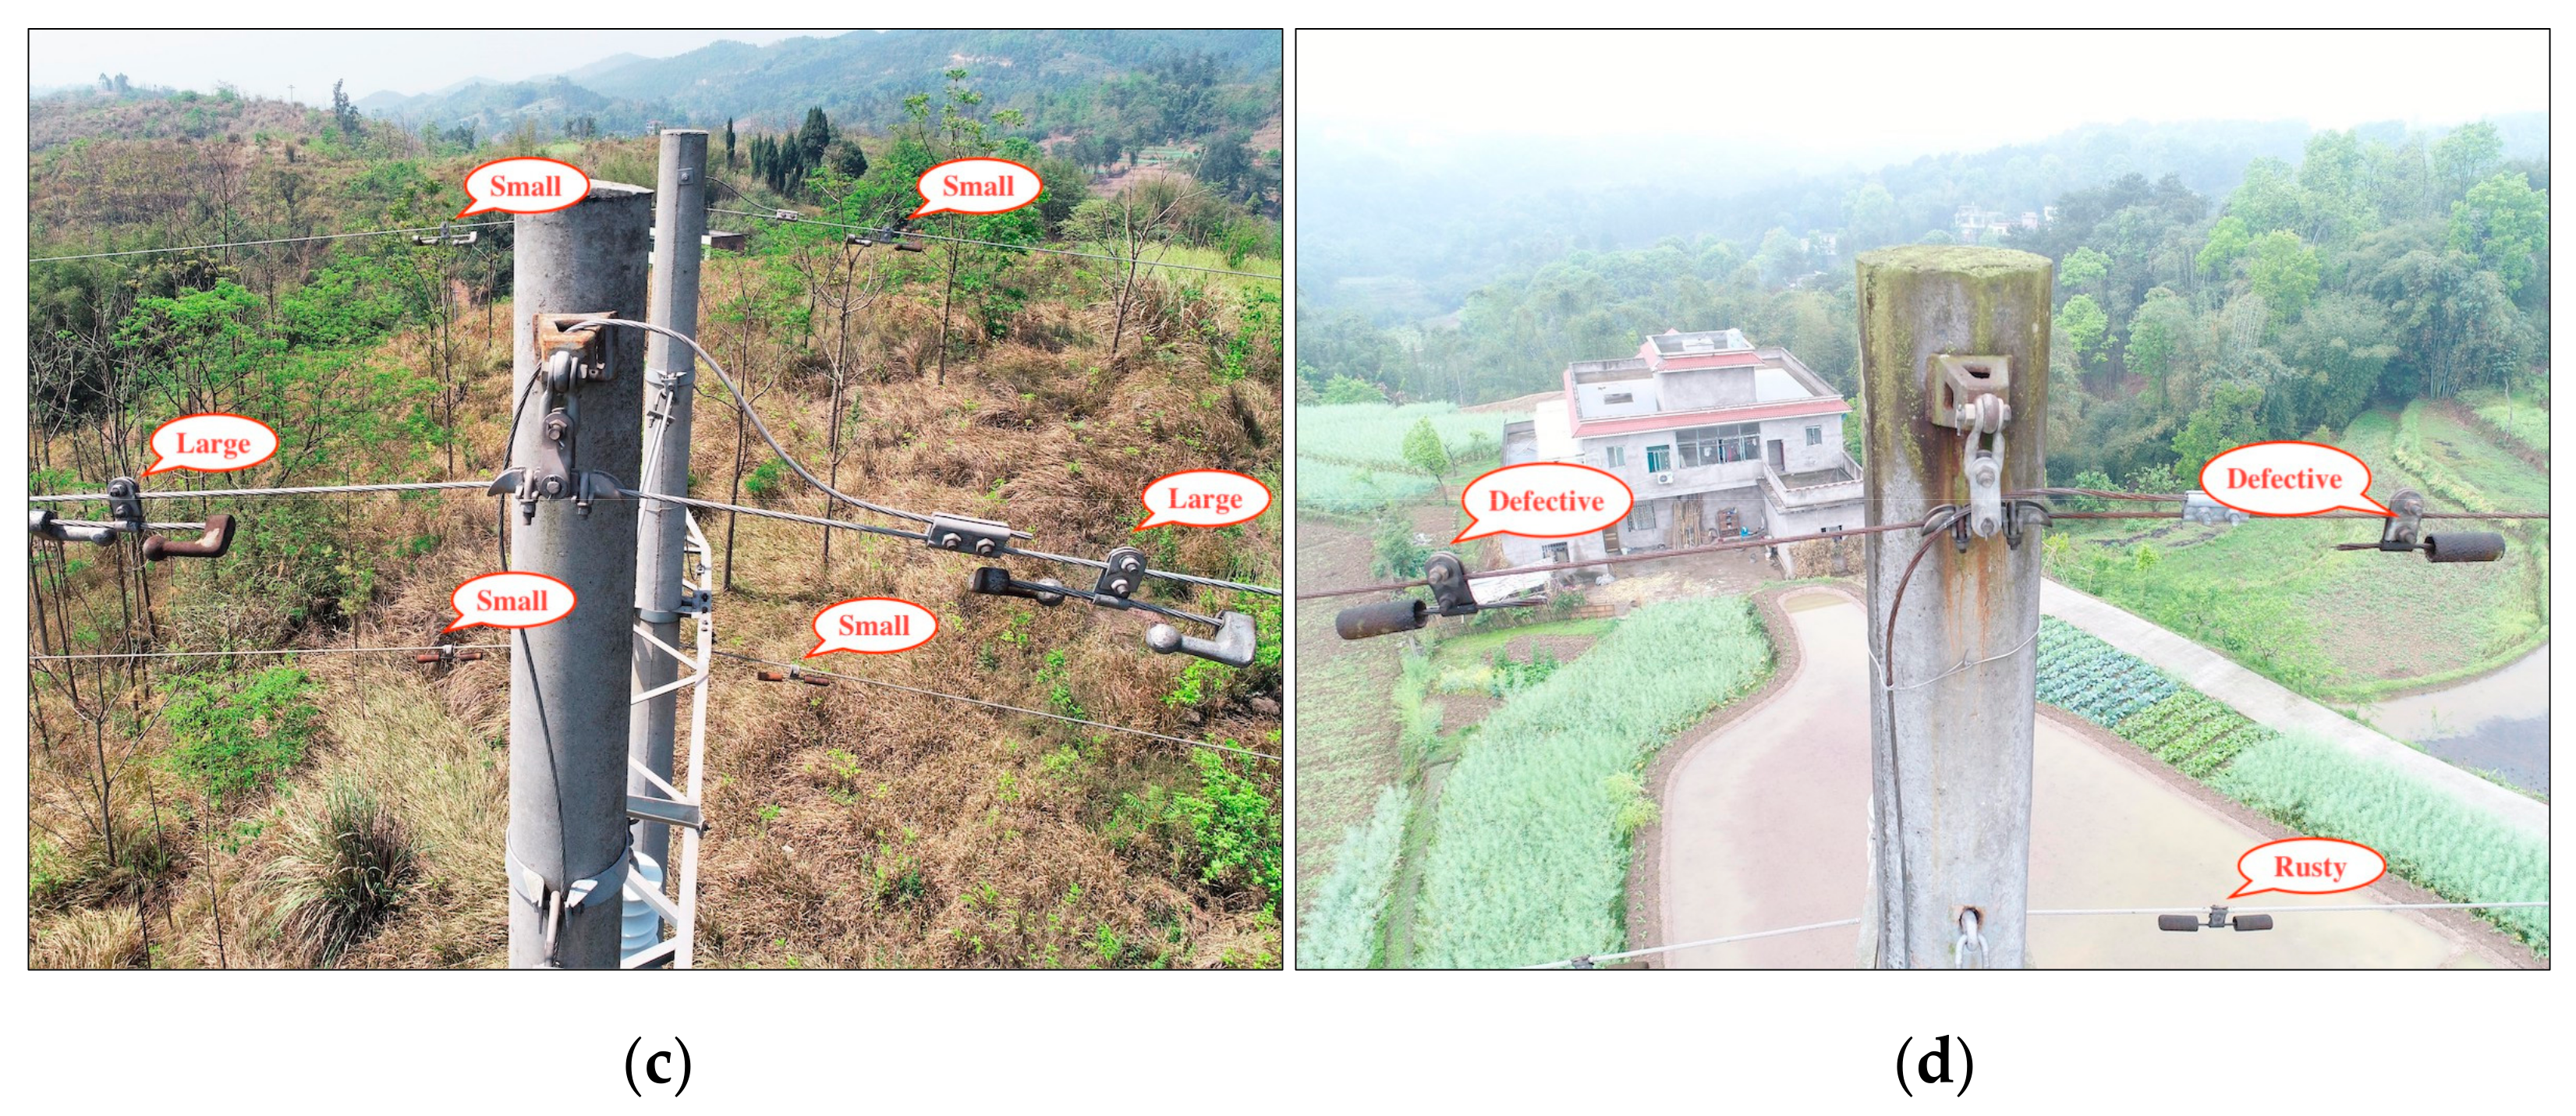
  • We constructed a data set of abnormal vibration dampers called DAVD using images of transmission lines obtained by UAVs. DAVD contains four types of vibration dampers: FD (cylindrical type), FDZ (bell type), FDY (fork type), and FFH (hippocampus type), and each vibration damper may be rusty, defective, or normal.
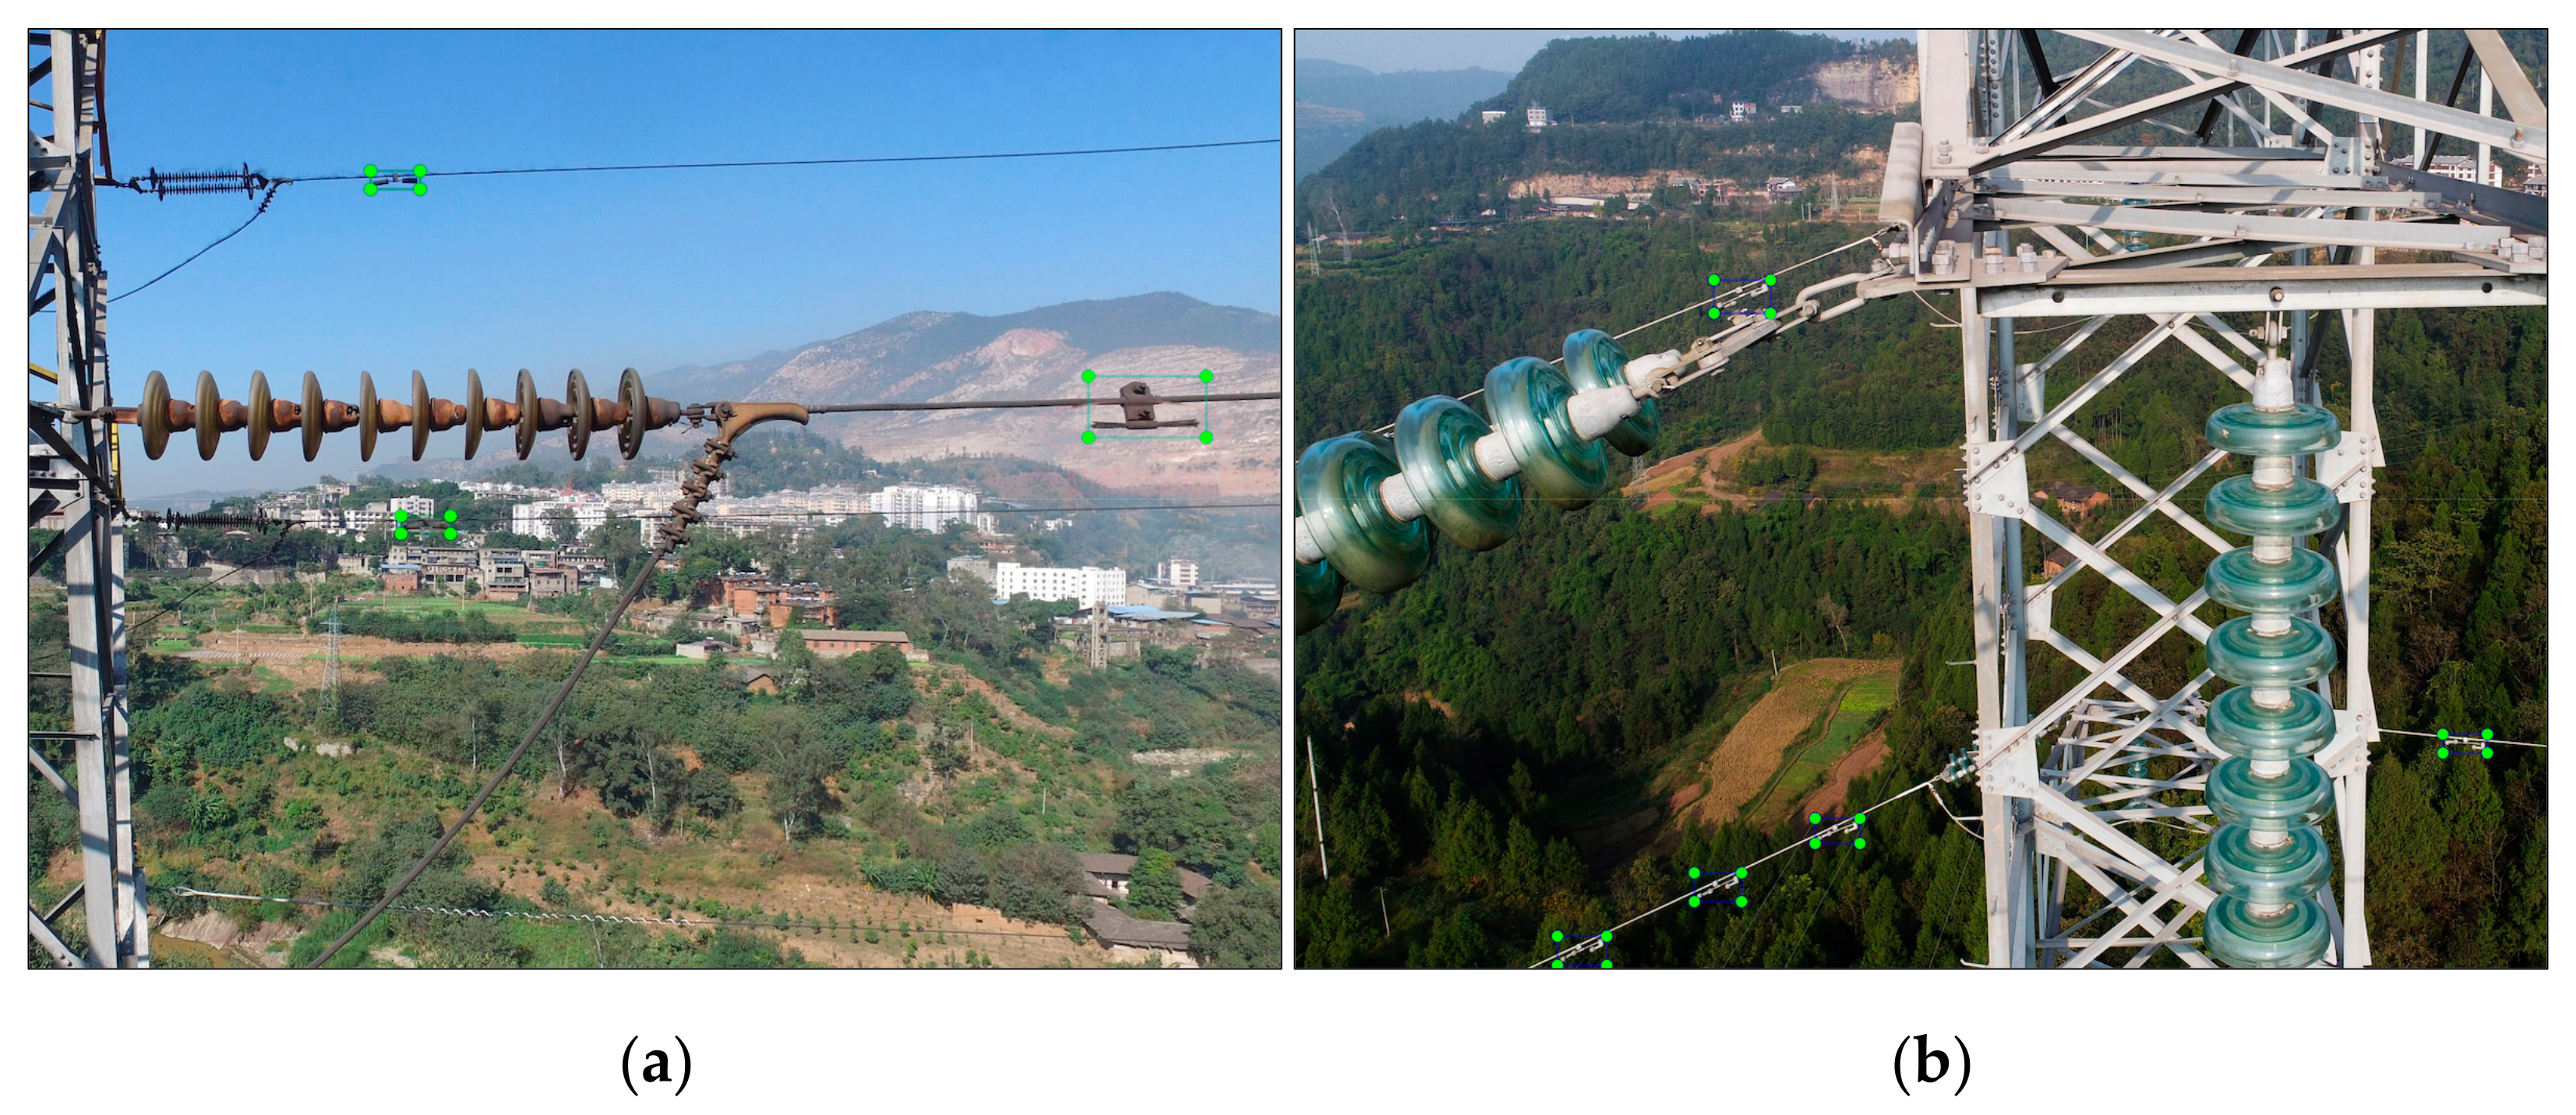
  • We proposed a detection method for abnormal vibration dampers called PMA-YOLO. More specifically, we introduced and integrated a PMA module into YOLOv4 [14] to enhance the critical features of abnormal vibration dampers in images with complex backgrounds. This module combined a channel attention block, a spatial attention block, and the convolution results from the input feature map in parallel. In addition, given the small sizes of abnormal vibration dampers in images, we used the K-means algorithm to re-cluster the new anchors for abnormal vibration dampers, which reduced the rate of missed detection.
  • We introduced a multi-stage transfer learning strategy, which was combined with freezing and fine-tuning methods, to improve the training efficiency and prevent overfitting by the network. Compared with other mainstream object detection methods, the proposed method significantly improved the detection accuracy of abnormal vibration dampers.
The remaining sections of this paper are organized as follows. Section 2 discusses the current literature regarding object detection. Section 3 introduces DAVD and gives an overview of image preprocessing methods. Section 4 describes the proposed PMA-YOLO network. Section 5 presents and analyzes the experimental results. Finally, Section 6 contains the conclusion of this paper and suggestions for future work.

2. Related Work

Based on differences in terms of feature description and localization, the methods used to detect abnormal components on transmission lines using computer vision can be classified into three categories: image processing-based detection methods, classical machine learning-based detection methods, and deep learning-based detection methods.

2.1. Image Processing-Based Detection Methods

Image processing-based detection methods generally apply threshold segmentation or other algorithms for target detection based on the texture or contrast difference between fault regions and backgrounds [15]. Wu et al. [16] used a threshold to segment vibration dampers from backgrounds and then established a deformation model by using gray mean gradient and a Laplace operator. They detected the segmented vibration dampers based on the contour features. However, when the background of an image is complex, this method has difficulty in detecting the edges of vibration dampers. In addition, the use of a grayscale image tends to increase information loss, resulting in missing or false detections. Huang et al. [17] enhanced the features of the vibration dampers by several methods including local difference processing, edge intensity mapping, and image fusion, and then segmented the vibration dampers using threshold segmentation and morphological processing. The degree of corrosion of the vibration dampers was classified based on the RAR (rusty area ratio) and CSI (color shade index) scales. Although the detection rate of rusty vibration dampers was shown to reach 93% with complex backgrounds, this method is strongly affected by illumination, and the results of corrosion detection are not ideal under conditions of low contrast. Hou et al. [18] proposed a new method for swimming target detection based on the discrete cosine transform algorithm, the target detection algorithm, and the traditional cam-shift algorithm. By combining frame subtraction and background subtraction, the advanced moving target detection algorithm can detect the entire area of interest. Sravanthi et al. [19] proposed an object detection method in the water region for low-cost UFV. Waterline detection was performed using the K-means algorithm and fast marching method. Objects were detected in the water region by a modified gradient-based image processing algorithm. Generally speaking, methods based on images are widely used in object detection. However, these methods rely on human experience for accurate image analysis and have some limitations when it comes to detecting detection of small objects with complex backgrounds. In addition, it is also worth mentioning that image processing in itself is a part of the detection methodology, which is commonly used both in traditional ML (machine learning)-based and DL (deep learning)-based approaches [20].

2.2. Classical Machine Learning-Based Detection Methods

In the detection methods based on classical machine learning, researchers typically extract designed features using a sliding window from images; then, these features are classified by a support vector machine (SVM) or other classical classifiers [21]. Dan et al. [22] proposed a glass insulator detection method that used the Haar feature and an AdaBoost cascade classifier. They used the color feature to segment insulators, and then extracted the Haar features from them. They analyzed these features using an AdaBoost cascade classifier to complete the detection of the insulators. This method has difficulty in achieving the expected accuracy when the insulators are occluded in images. There are other ML methods in traditional engineering prediction applications, which use time series data related to mechanical faults. Gabriel et al. [23] proposed a machine learning method to detect wheel defects, which is based on novel features for classifying time series data and used for classification with SVM. Combined with mature classifiers, classical machine learning methods have achieved good performance in some specific applications. However, the ML methods use a disjoint pipeline to extract static features, classify regions, predict bounding boxes for high scoring regions, which are slow and hard to optimize because each component must be trained separately [20]. Meanwhile, the methods use feature engineering to design manual features such as color, texture, and edge gradient in the images, which are always trained and tested on special small-scale data sets [24]. In UAV images, the resolution is very high, and objects on the transmission lines are relatively small. Moreover, the color and texture of objects are similar to those of complex backgrounds, which will lead to false detection of the abnormal vibration dampers.

2.3. Deep Learning-Based Detection Methods

Different from classical machine learning-based detection methods, the detection methods based on deep learning use convolutional neural networks (CNNs) to extract and analyze features of objects autonomously from images. The deep learning-based object detection methods can be divided into two-stage methods (e.g., Faster R-CNN [25], and Cascade R-CNN [26]) and one-stage methods (e.g., SSD [27], and YOLOv4 [14]) [28]. The detection speed of the two-stage method is usually slower than that of the one-stage method, and the network weight size is usually greater than the one-stage method. Ji et al. [29] developed a scheme that combined a Faster R-CNN (faster region-based convolutional neural network), a HOG-based deformable part model (DPM), and a Haar-based AdaBoost cascade classifier to detect abnormal vibration dampers. They exploited various features of the vibration damper, such as the color, shape, and texture, and proposed a combined detector based on geometric positional relationships. Although this method combined the detection results from the three methods to achieve a higher detection accuracy, it was time-consuming and showed poor real-time performance. Chen et al. [30] proposed a framework for electrical component recognition algorithms based on SRCNN and YOLOv3. The SRCNN network was used to achieve super-resolution reconstruction of blurred UAV inspection images of defective vibration dampers. Then the YOLO V3 accomplished the detection of insulators and vibration dampers. The study of vibration damper slippage is also very interesting. Liu et al. [5] developed an intelligent fault diagnosis method for vibration damper slippage in power lines. In the detection stage, Faster R-CNN was introduced to locate the vibration dampers in UAV inspection images. To diagnose the slippage fault, a distance constraint method was introduced to divide the detected vibration dampers into different groups.
One-stage algorithms, such as YOLO and SSD, have made significant advances in defect detection by utilizing a single CNN network to predict the classes and locations of various objects directly. The YOLOv4 algorithm, in particular, is based on the original YOLO object detection architecture and adopts the most advanced optimization strategy available in the field of CNN in recent years. It has been optimized to varying degrees in terms of data processing, backbone network, network training, activation function, loss function, etc. The effect of the YOLOv4 algorithm achieves the new baseline of object detection to achieve the balance between speed and precision. Therefore, YOLOv4 [14] is used as the baseline network to detect the abnormal vibration dampers on transmission lines. However, the objects of vibration dampers are relatively small in high-resolution images captured by UAV, and the backgrounds of these images are complex. As a result, a PMA module was designed and integrated into YOLOv4 to develop the accuracy of detection in this paper. The PMA-YOLO network can detect three classes of vibration dampers (i.e., rusty, defective, and normal) at the same time, and the m A P @ 0.5 could reach 94.0%.

3. Data Set

In this paper, we constructed a data set of abnormal vibration dampers called DAVD. The UAV remote sensing images contained in DAVD were drawn from inspections of transmission lines carried out by the China Electric Power Research Institute. The data acquisition platform was a UAV developed by DJI Innovation Technology Co., Ltd. (Phantom 4 Pro V2.0 model) as shown in Figure 1a. The resolution of the images was 4864 × 3648, and the UAV maintained a distance of about 10 m from the transmission tower during each inspection as shown in Figure 1b.

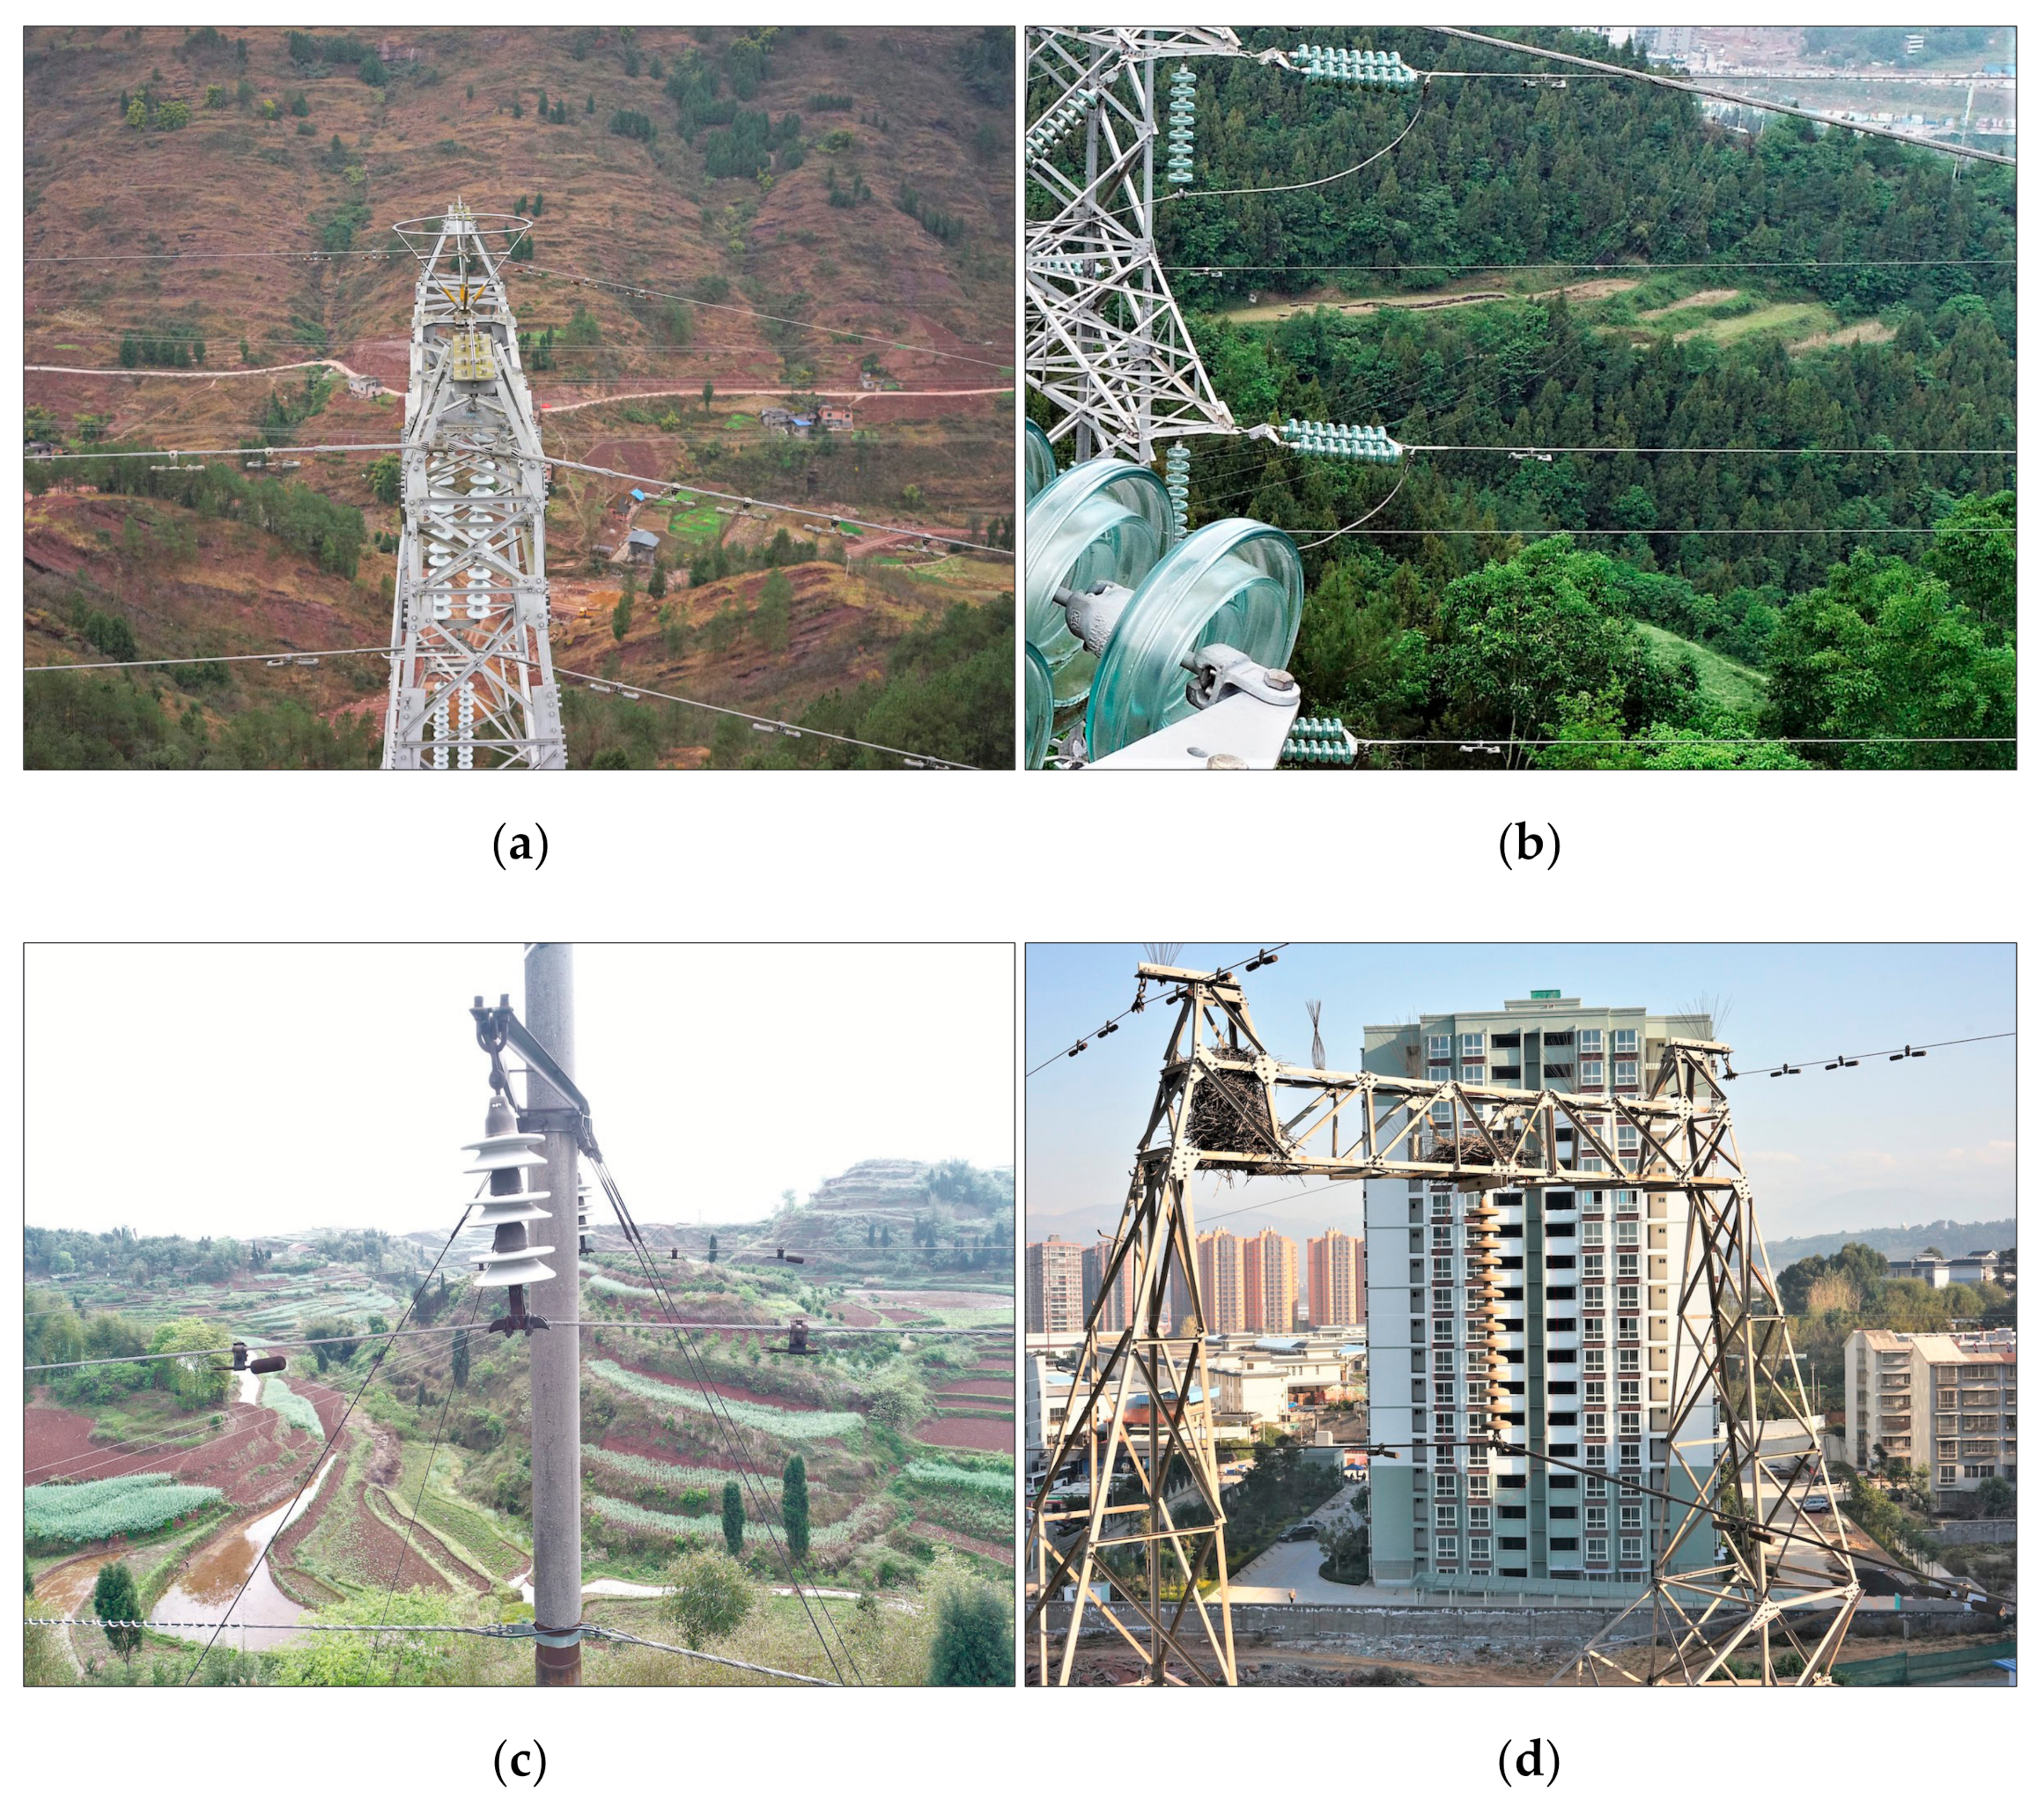
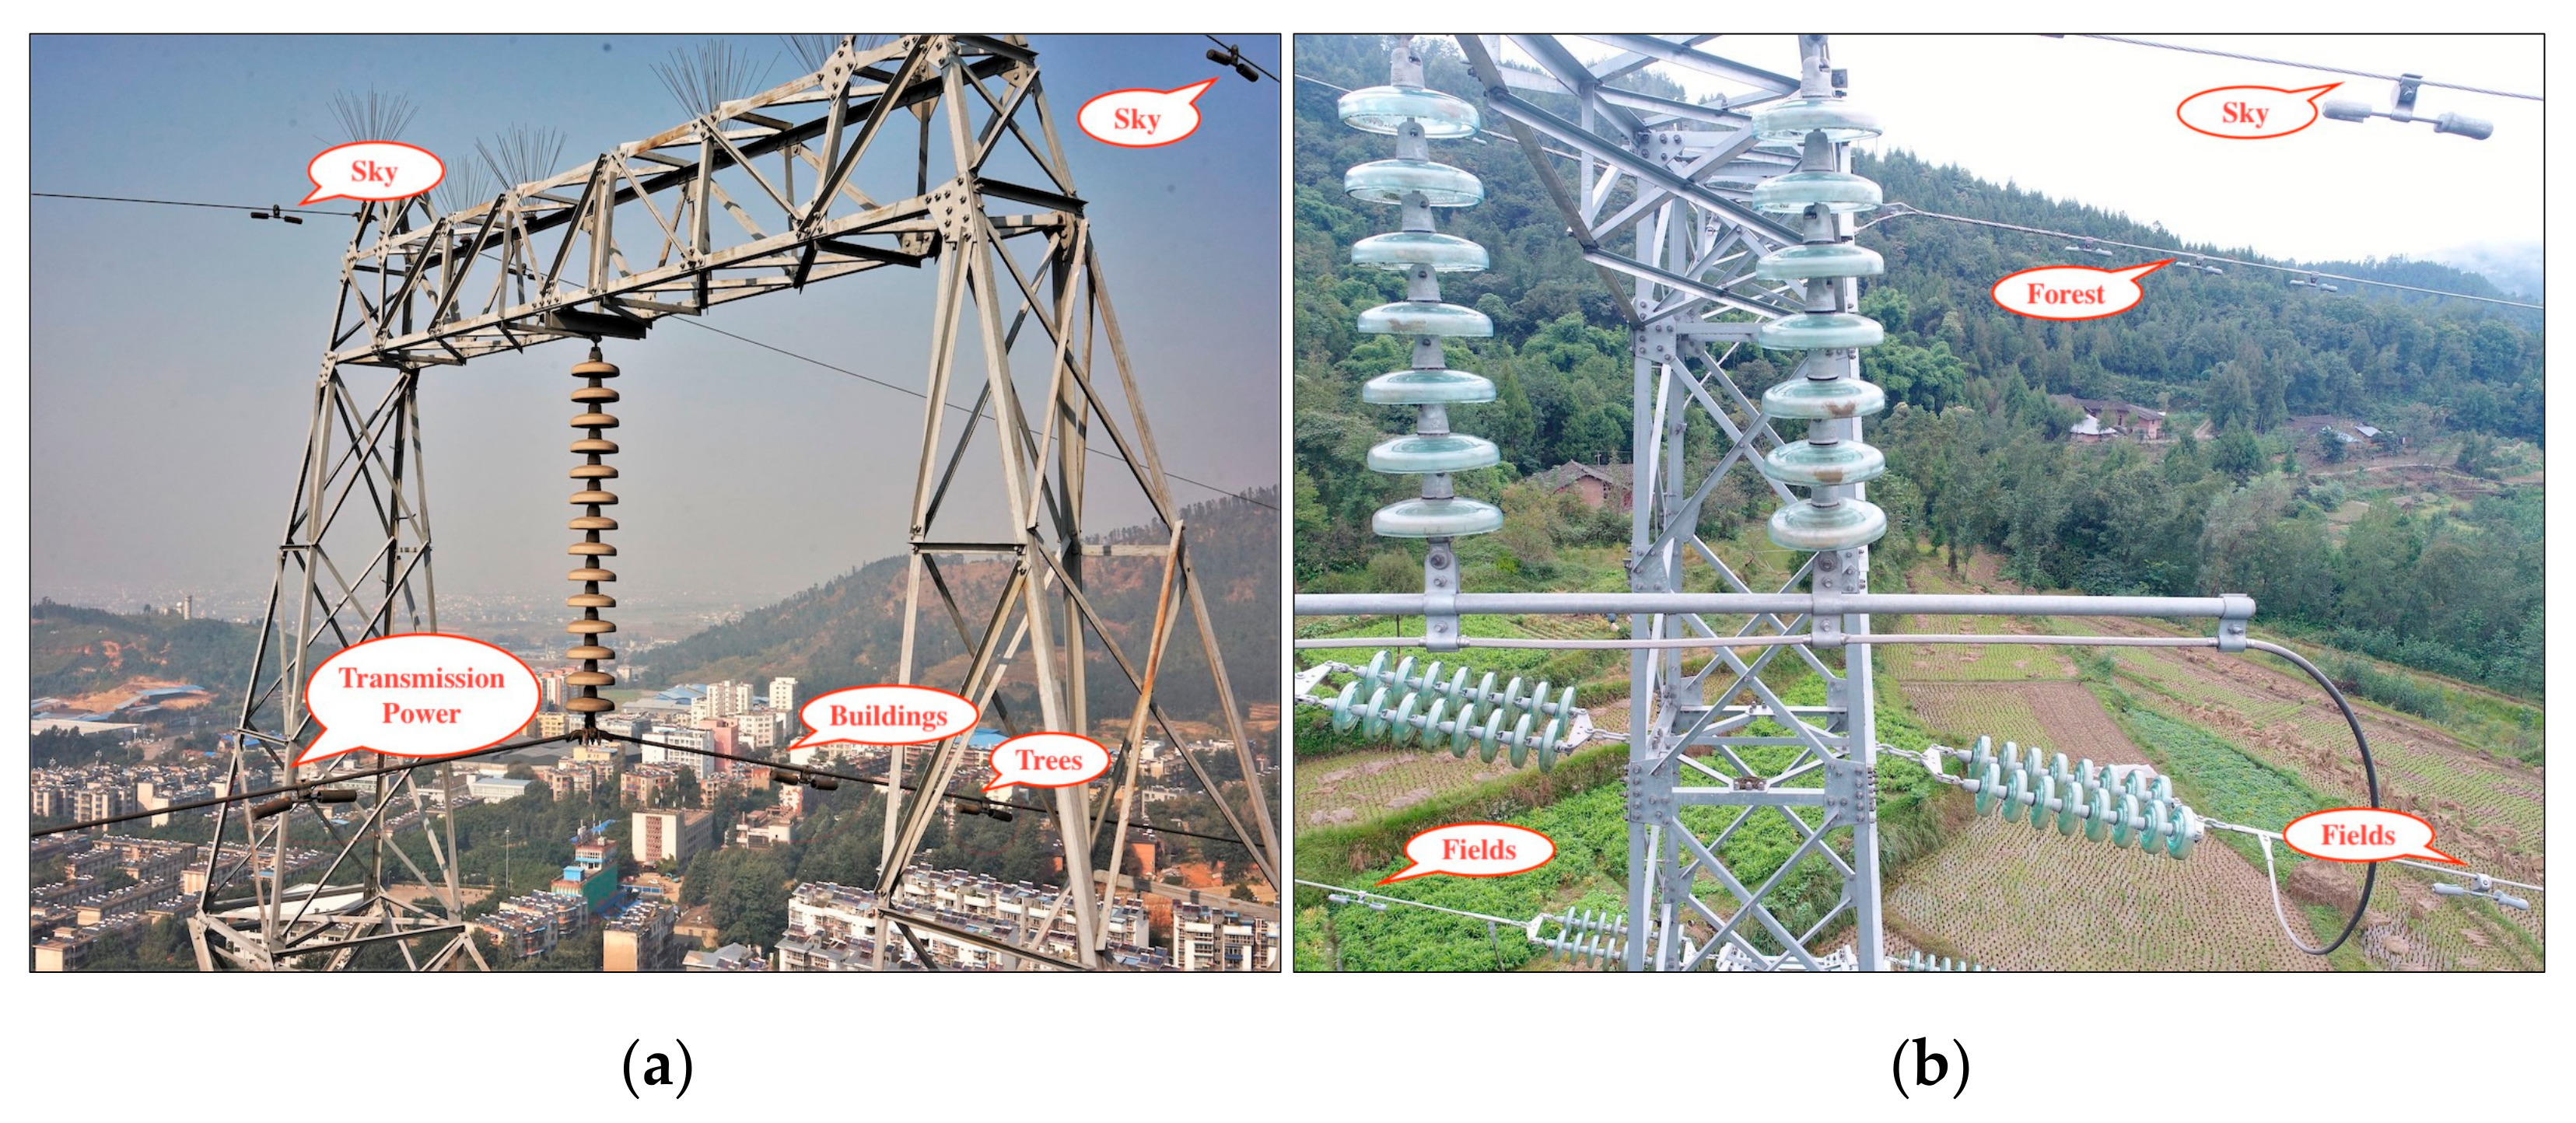
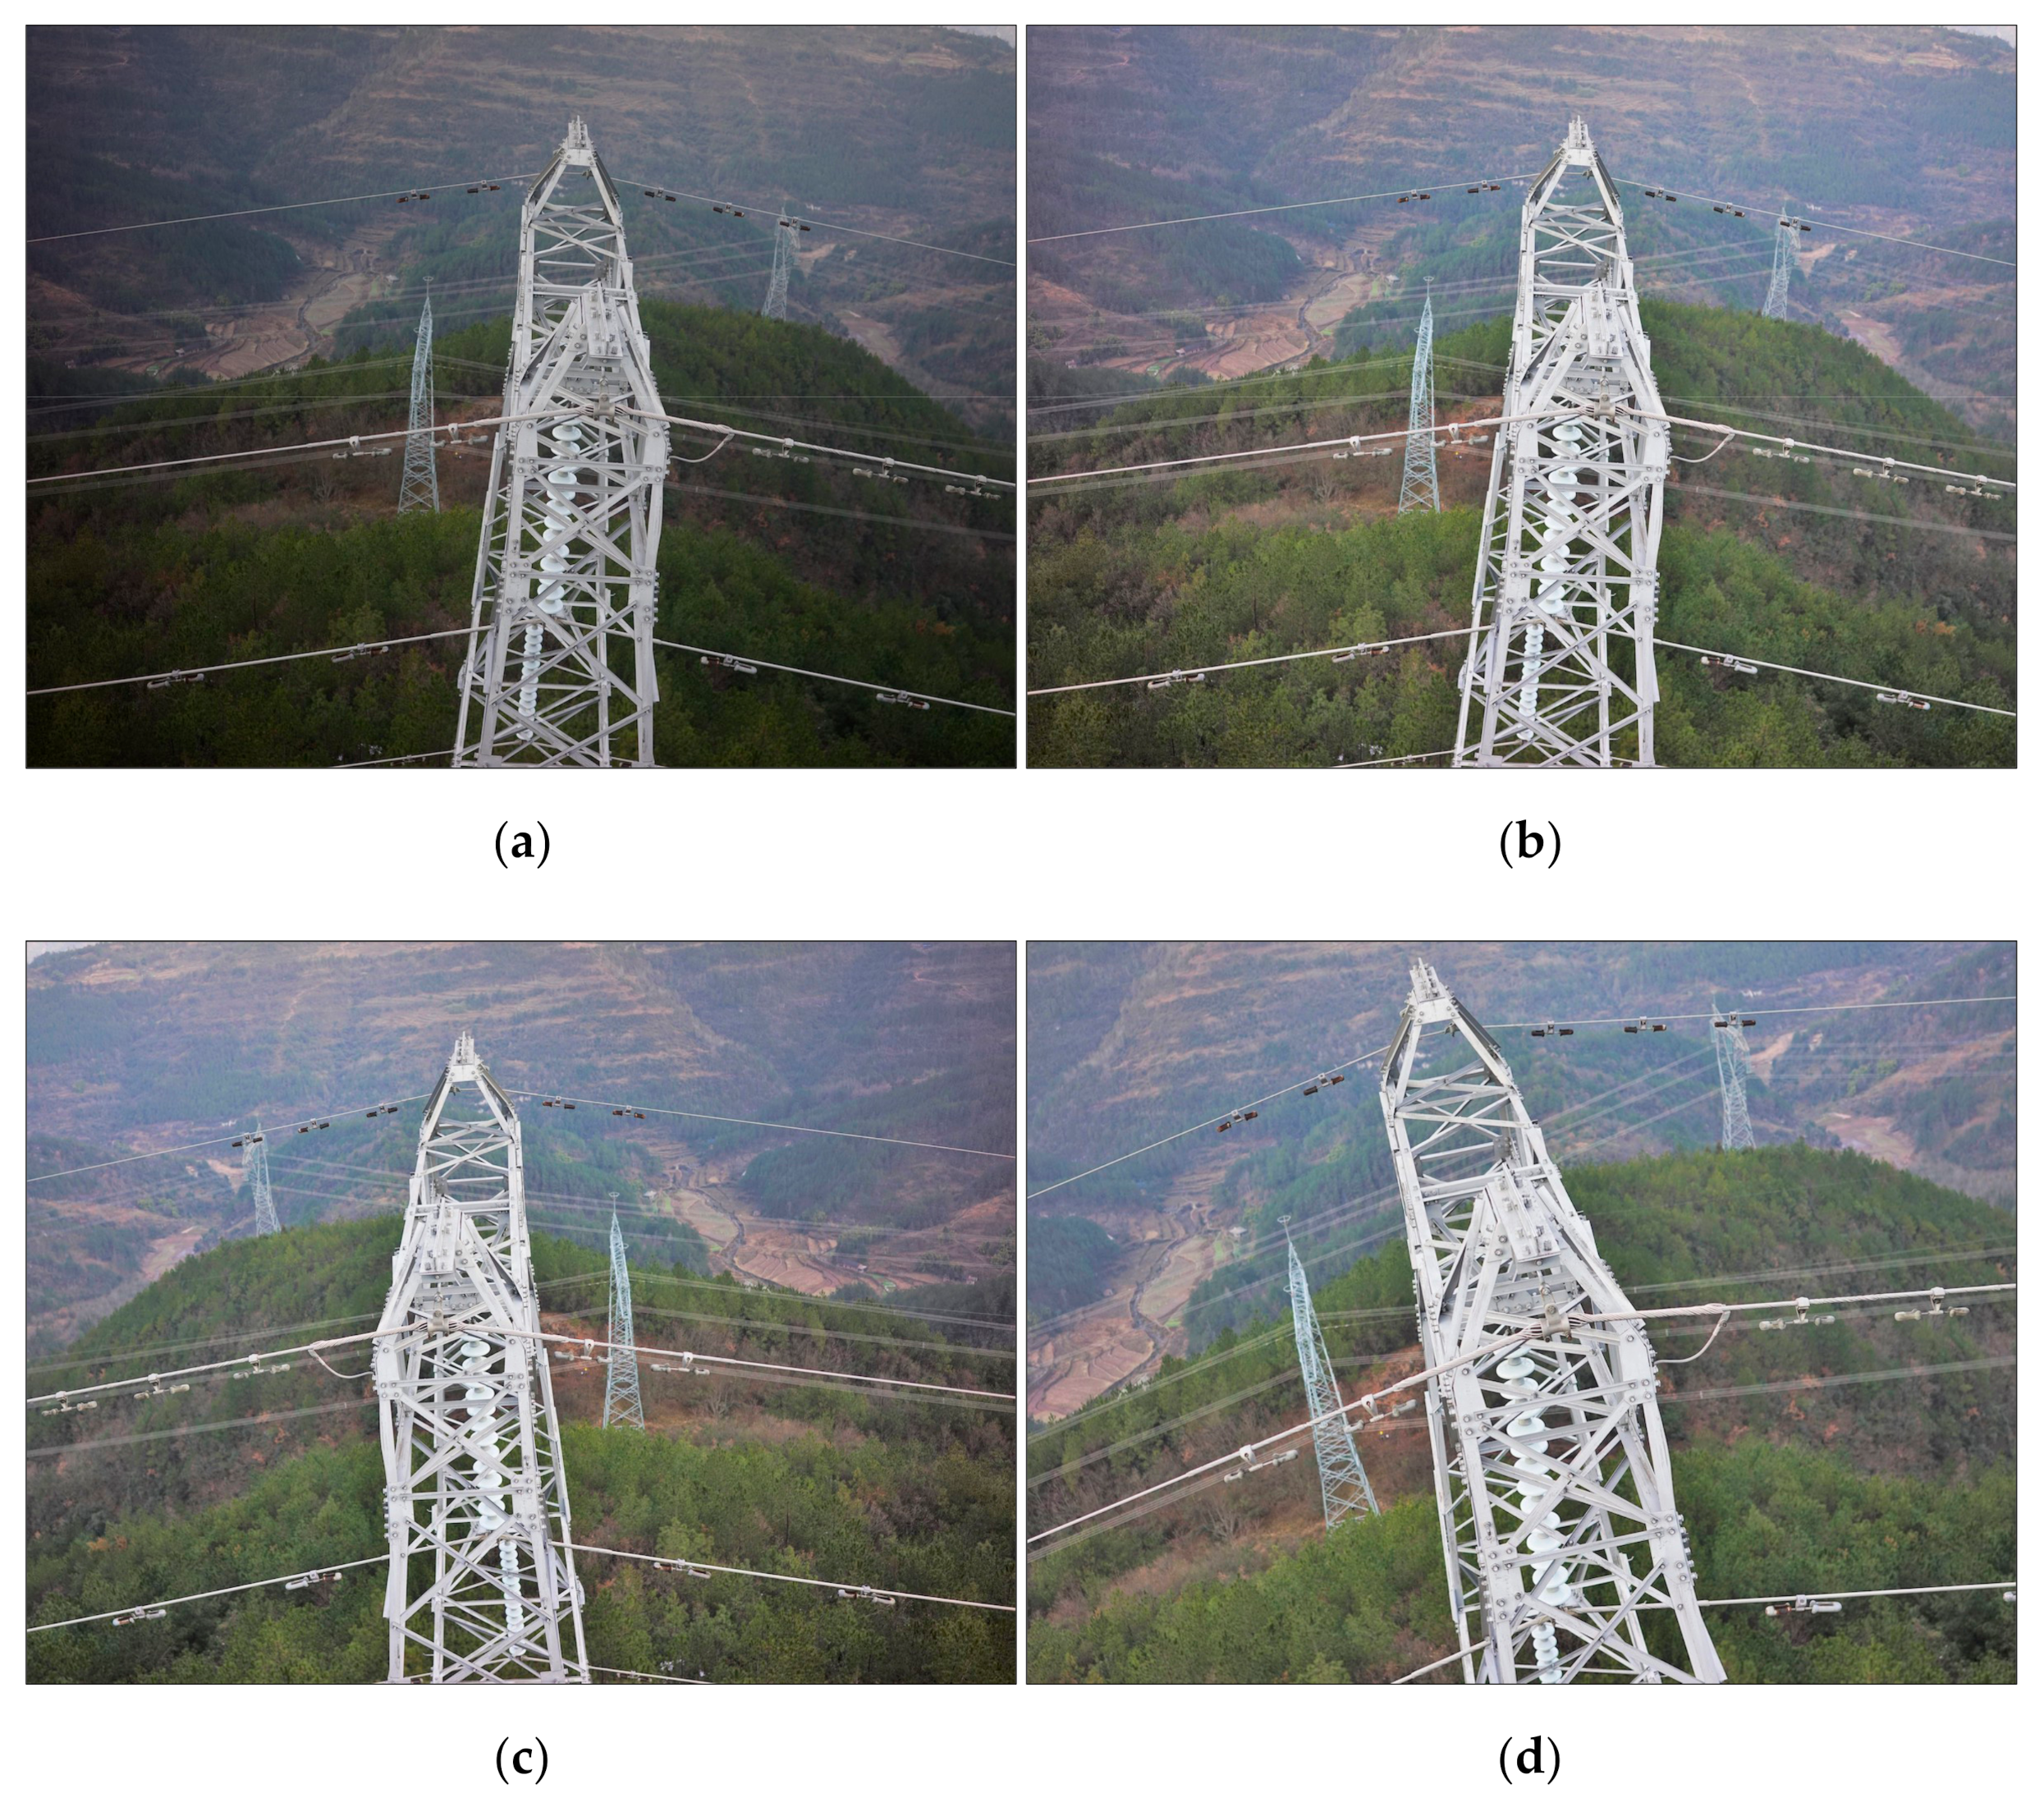
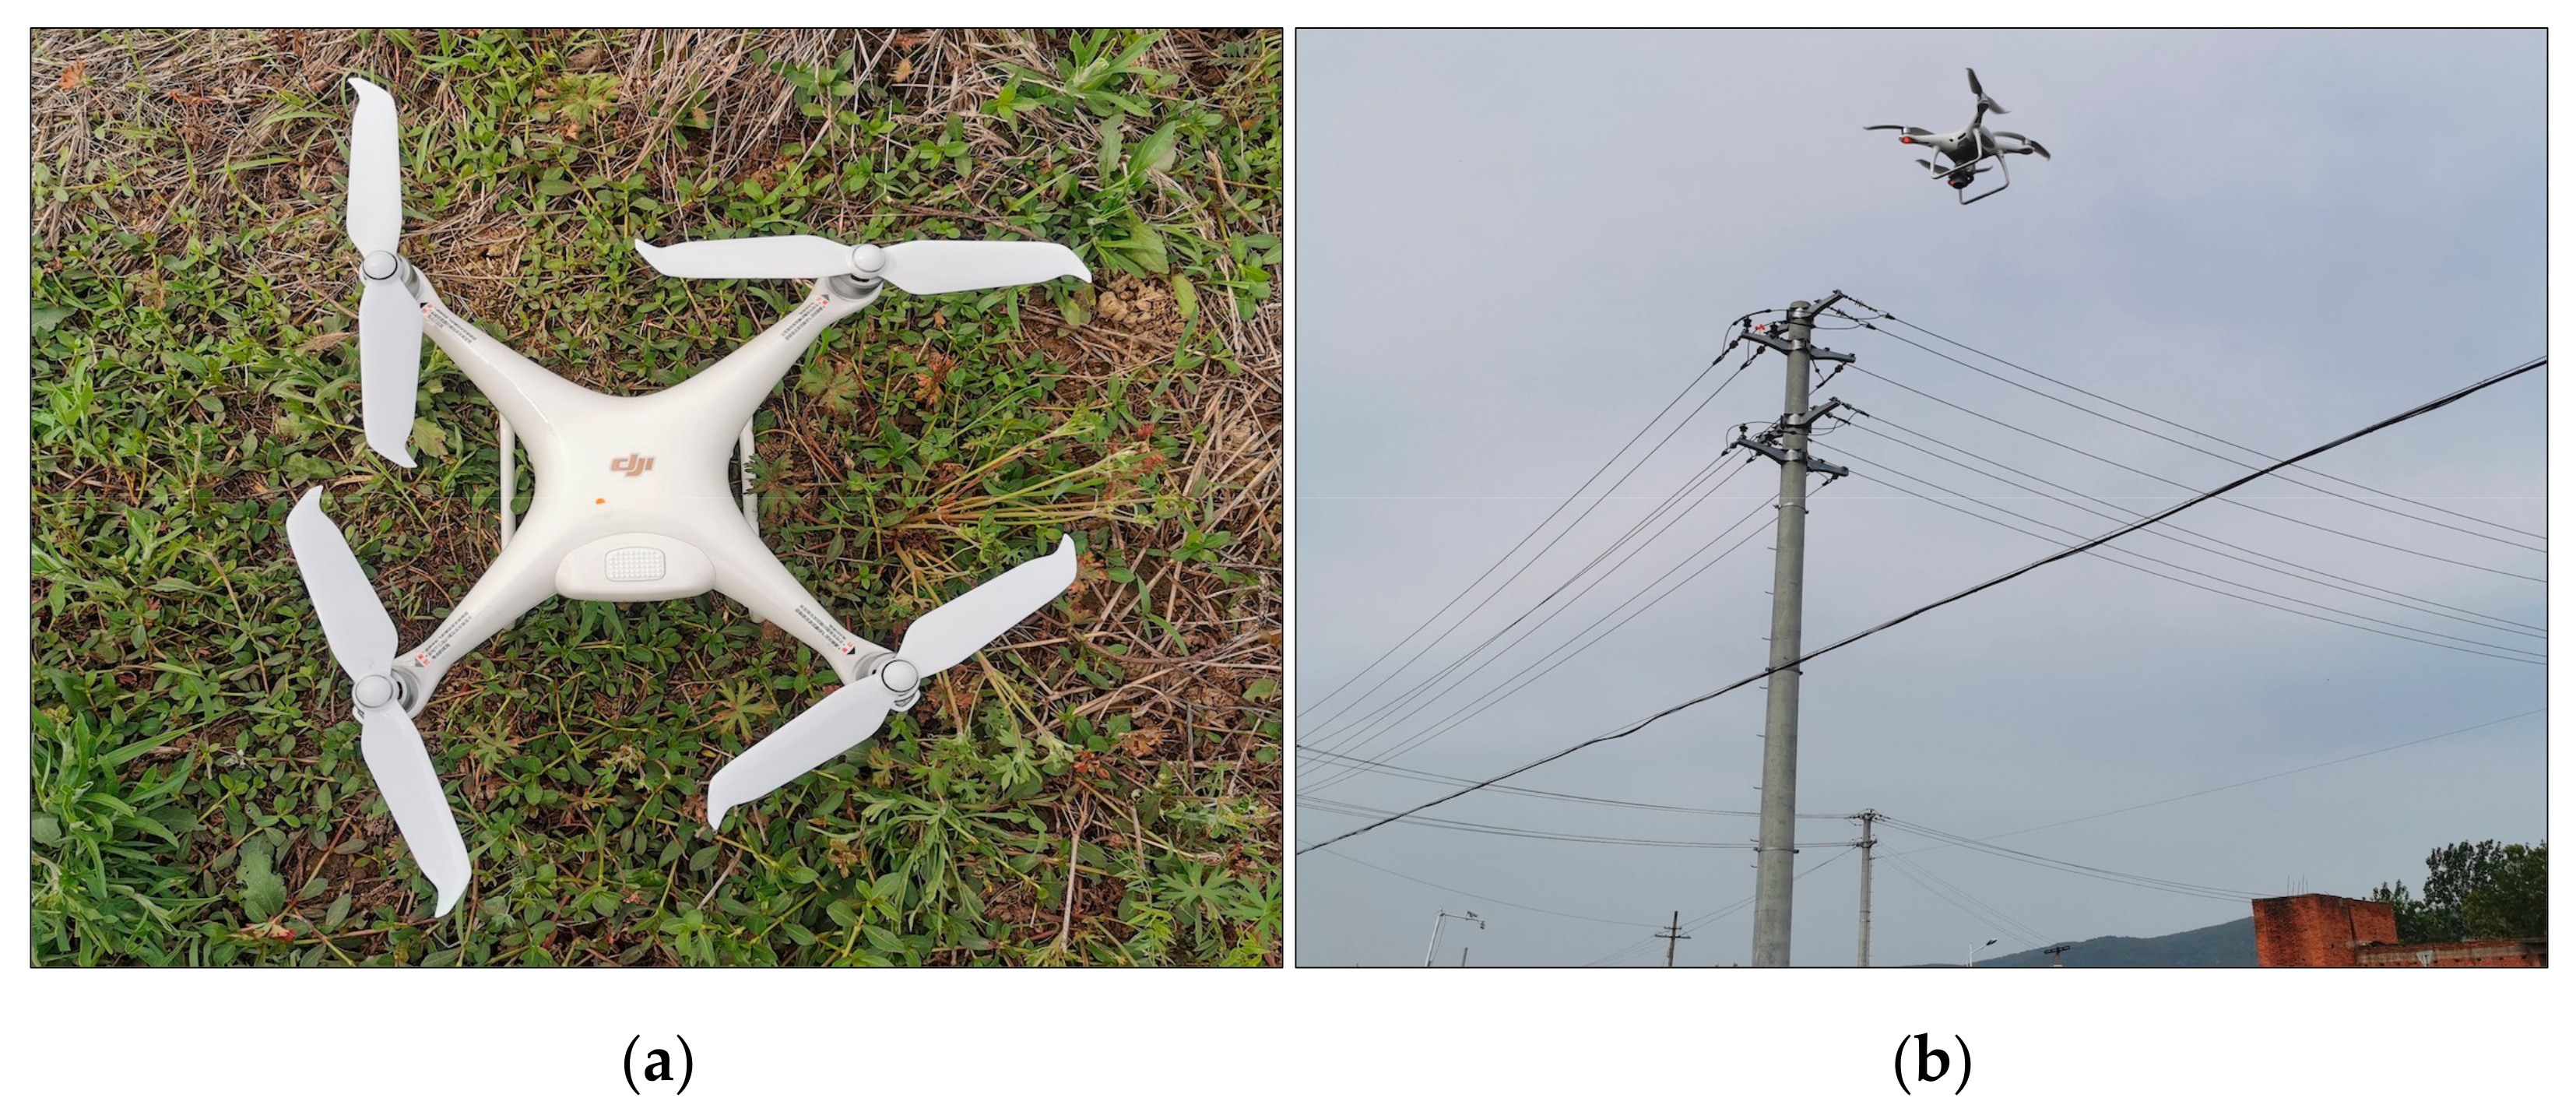
3.1. Screening of UAV Remote Sensing Images

Due to the different types of scenarios used, the types of vibration dampers used on transmission lines were also different. Power relevant workers generally choose the appropriate type of vibration damper based on the actual vibration frequency of the transmission line. The most common types of vibration damper are FD (cylindrical type), FDZ (bell type), FDY (fork type), and FFH (hippocampus type). Different types of vibration dampers also differ in terms of their shape as shown in Figure 2. Hence, in this study, images containing these four types of vibration dampers were screened from all UAV inspection images. In addition, each vibration damper may be rusty, defective, or normal as shown in Figure 3.
After screening, we obtained 960 UAV remote sensing images. Vibration dampers are often used in mountainous areas, forests, fields, residential areas, and other types of terrain as shown in Figure 4. In these images, the background contexts of the vibration dampers were also diverse, and included the sky, buildings, transmission towers, and trees (Figure 5a,b). Furthermore, the multiple sizes and multiple classes of vibration dampers in an image were also considered in image screening (Figure 5c,d), and there were approximately 350 images with multiple classes.

3.2. Preprocessing of UAV Remote Sensing Images

Due to the changes in illumination, it is difficult to extract the features accurately from images. The presence of complex backgrounds also affects the detection accuracy. We therefore applied several image enhancement strategies to improve the quality and contrast of the images. On the one hand, in order to address the issue of uneven brightness caused by the illumination angle, we applied gamma correction [31] to process the images, which compensated for the lack of illumination and highlighted the details of shaded areas. The formula for this correction is shown in Equation (1). On the other hand, to mitigate the blurring and low levels of contrast caused by gloomy weather (fog, etc.), we use the MSR algorithm [32] to process the images. This approach enhances contrast using linearly weighted multiple fixed-scale SSR (single-scale Retinex), and the formula for this is shown in Equation (2).
S = c r γ
R x , y = i = 1 k W i log I x , y log I x ,   y F i x ,   y
The performance of deep learning networks partly depends on the richness of the data set. The use of appropriate data augmentation methods can improve the generalizability of networks. We randomly selected some UAV remote sensing images after image enhancement and rotated these images 15° or flipped them horizontally to obtain images of vibration dampers with a richer range of angles. Since it would take a long time to train the network on the high-resolution images, we resized the images to the original ratio and to a size of 800 × 600 pixels. The use of data augmentation increased the number of images in DAVD from 960 to 1810. Some examples of these preprocessed images are shown in Figure 6.

3.3. Annotation of UAV Remote Sensing Images

To obtain the ground truths for DAVD, we used LabelImg (https://github.com/tzutalin/labelImg, accessed on 13 October 2021) to annotate the preprocessed images as shown in Figure 7. The rules for annotation were as follows:
  • If there was corrosion on the surface of the vibration damper, it was annotated as “rusty”;
  • If the head of the vibration damper had fallen off or the steel strand was bent, it was annotated as “defective”;
  • If the vibration damper did not have either of these two faults, it was annotated as “normal”.
The annotated data were organized in strict accordance with the Pascal VOC [33] format, and the annotated files were stored in XML format. We randomly selected 80% of images from the data set for use as the training set, and the remaining 20% were used as the test set. Annotation statistics for DAVD are shown in Table 1.

4. Method

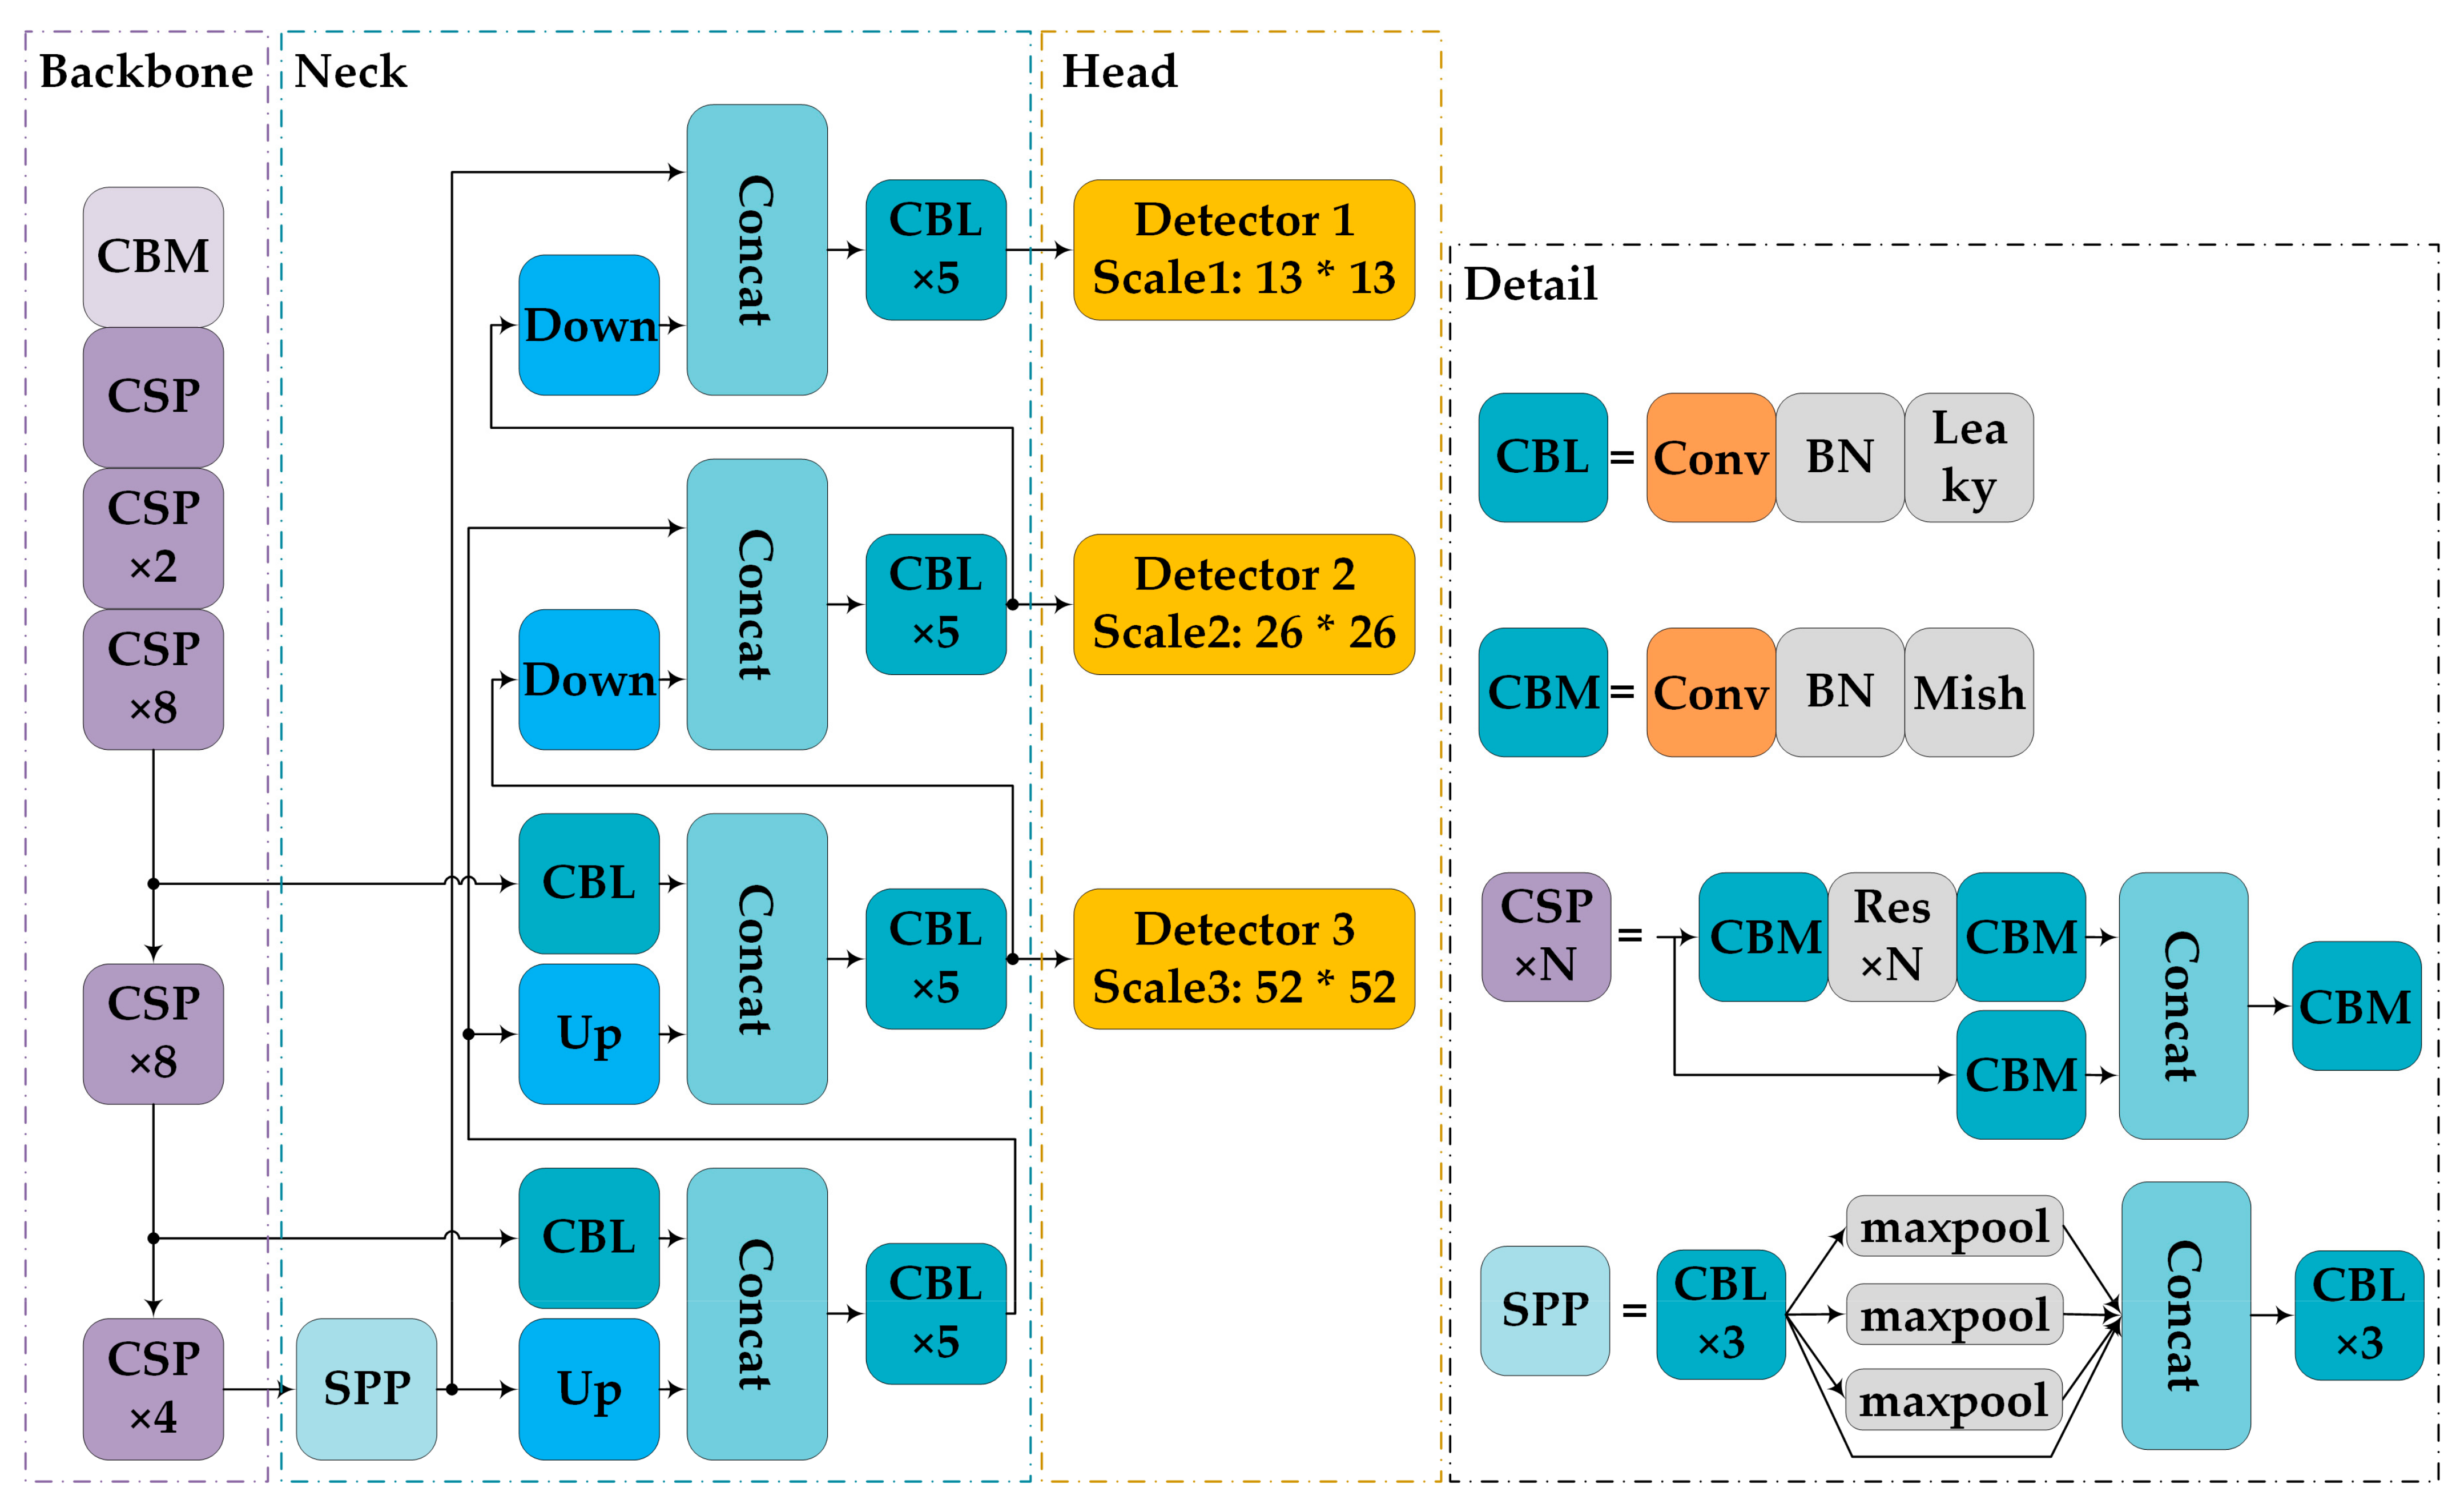
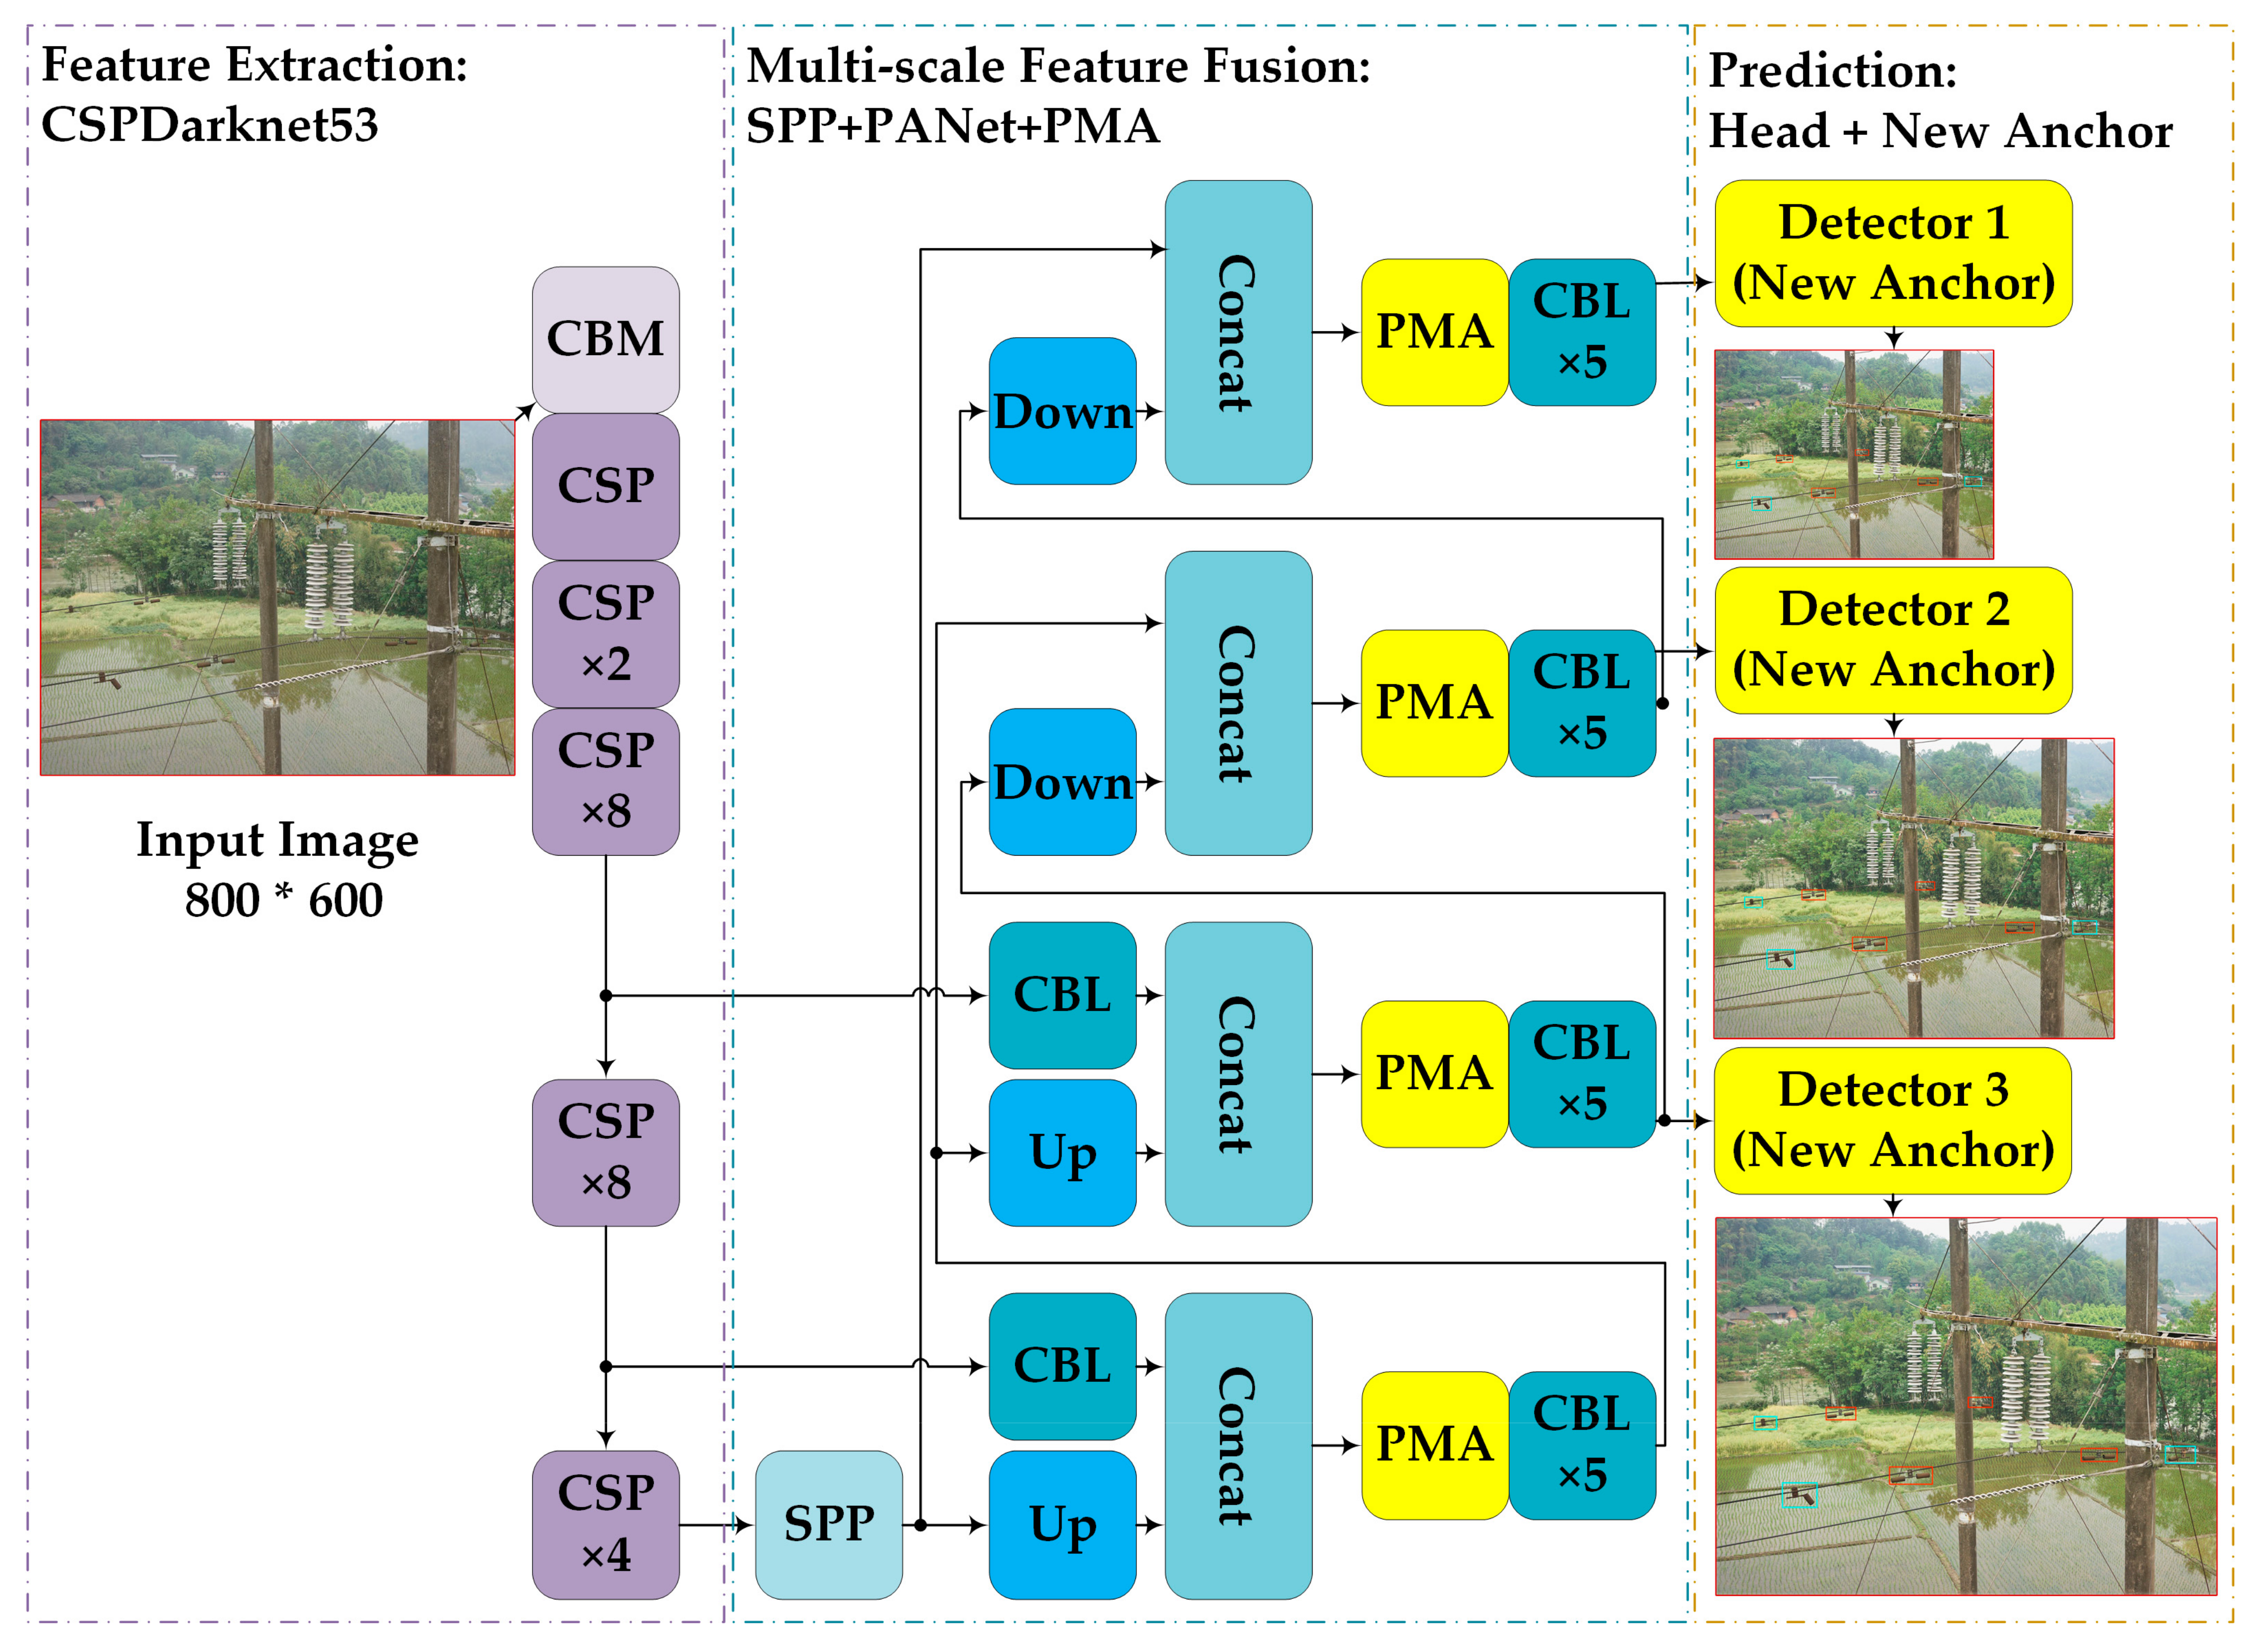
4.1. YOLOv4 Network Architecture

The YOLOv4 [14] network is a one-stage object detection method that carries out object localization and classification via direct regression of the relative positions of candidate boxes. Based on the original YOLOv3 [34] architecture, YOLOv4 [14] has been further improved to different degrees in terms of the backbone, feature fusion, and other aspects, giving it not only a high detection accuracy but also a fast detection speed. The architecture of the original YOLOv4 network [14] is shown in Figure 8.
Original YOLOv4 [14] consists of three main parts: a backbone, neck, and head. In the backbone, the CSPDarknet53 is used to extract features that combines CSPNet (cross stage partial network) [35] and Darknet53 [34]. CSPDarknet53 effectively reduces the need for repetitive gradient learning and, thus, improves the learning ability of the network. The detailed structure of the CSP module is shown in Figure 8. This module has two branches, one of which follows the residual structure of Darknet53, and the other applies a simple convolution operation. Finally, the Concat block combines the output features from the two branches.
In the neck, SPP (spatial pyramid pooling) [36] is applied as an additional module. This converts a feature map of any size into a fixed-size feature vector using four max-pooling layers of different scales, which greatly increases the receptive field. In addition, YOLOv4 [14] also exploits an idea from PANet (path aggregation network) [37] and fuses feature maps at three different scales in the backbone. Compared with FPN (feature pyramid network) [38], PANet adds the bottom-up path augmentation, which improves the transmission of the low-level features.
The head consists of three detection branches. The three feature maps output from the neck are used to detect objects at different scales. Firstly, anchors of multiple sizes are applied to the feature maps, and the results are then output via convolution, which contain class confidence levels, object scores, and the positions of the prediction boxes. Finally, non-maximum suppression (NMS) is used to filter out redundant prediction boxes to achieve object detection.

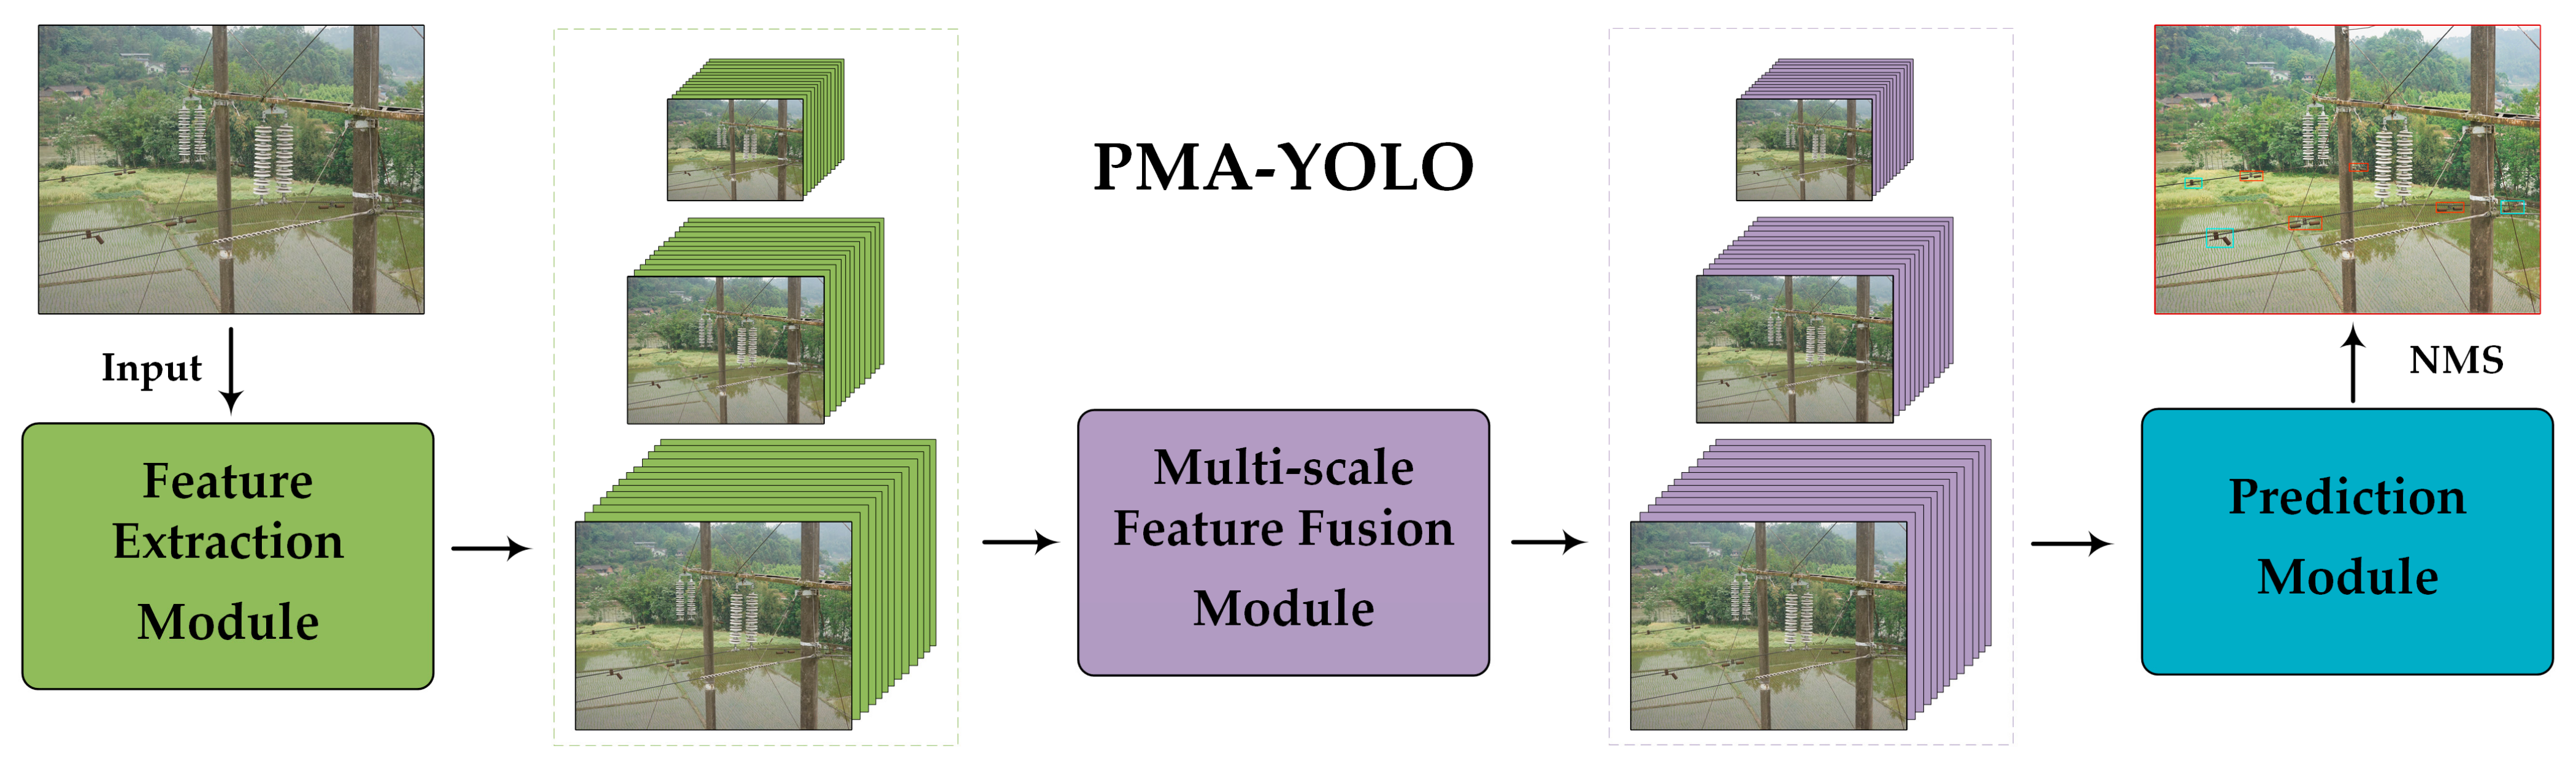
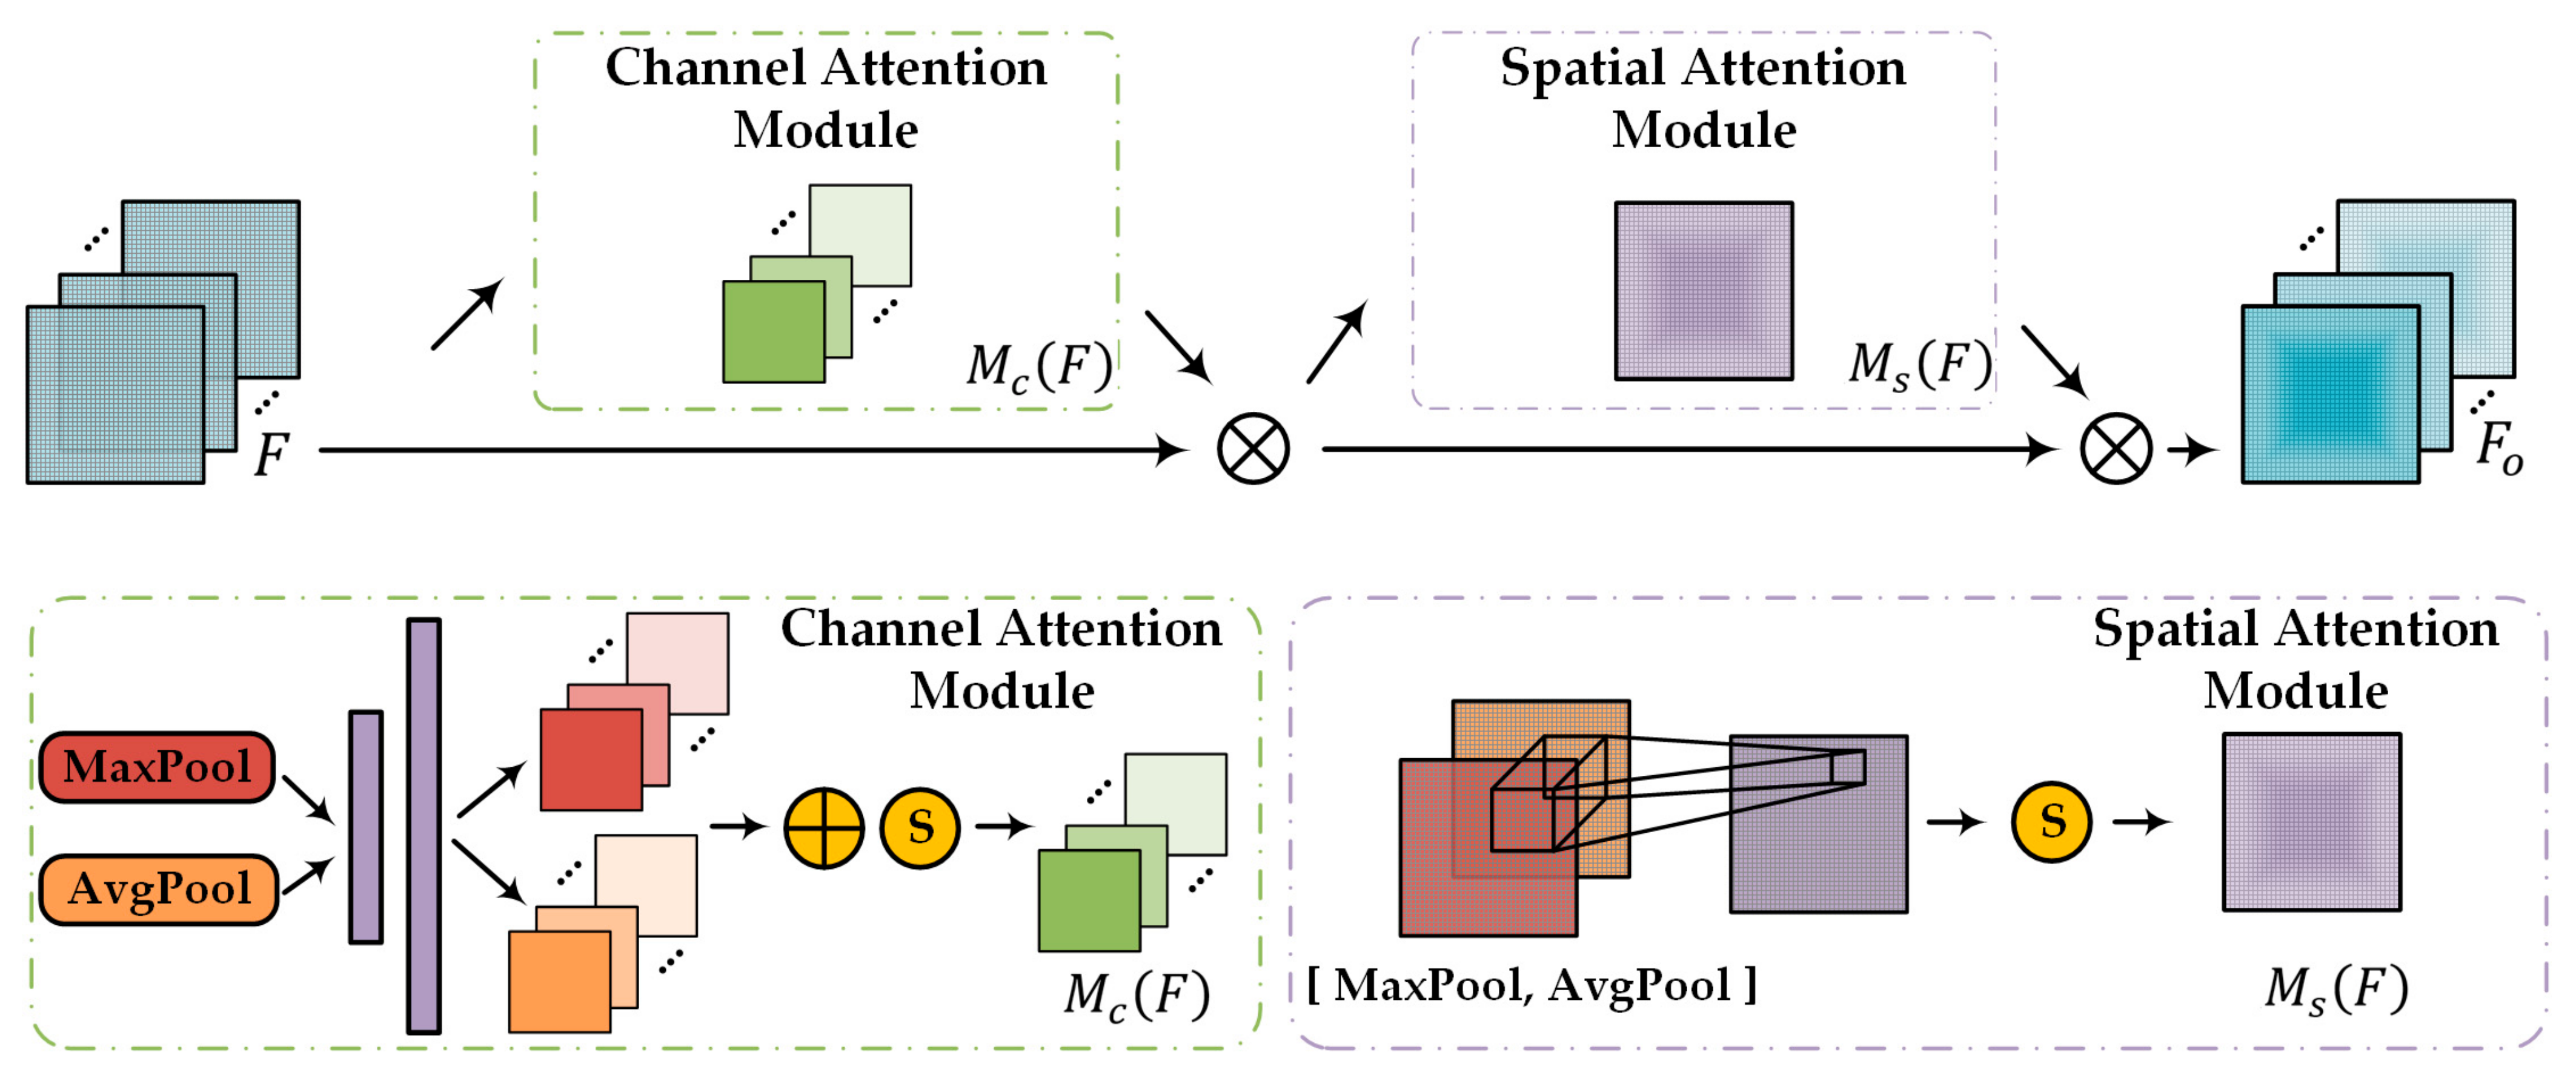
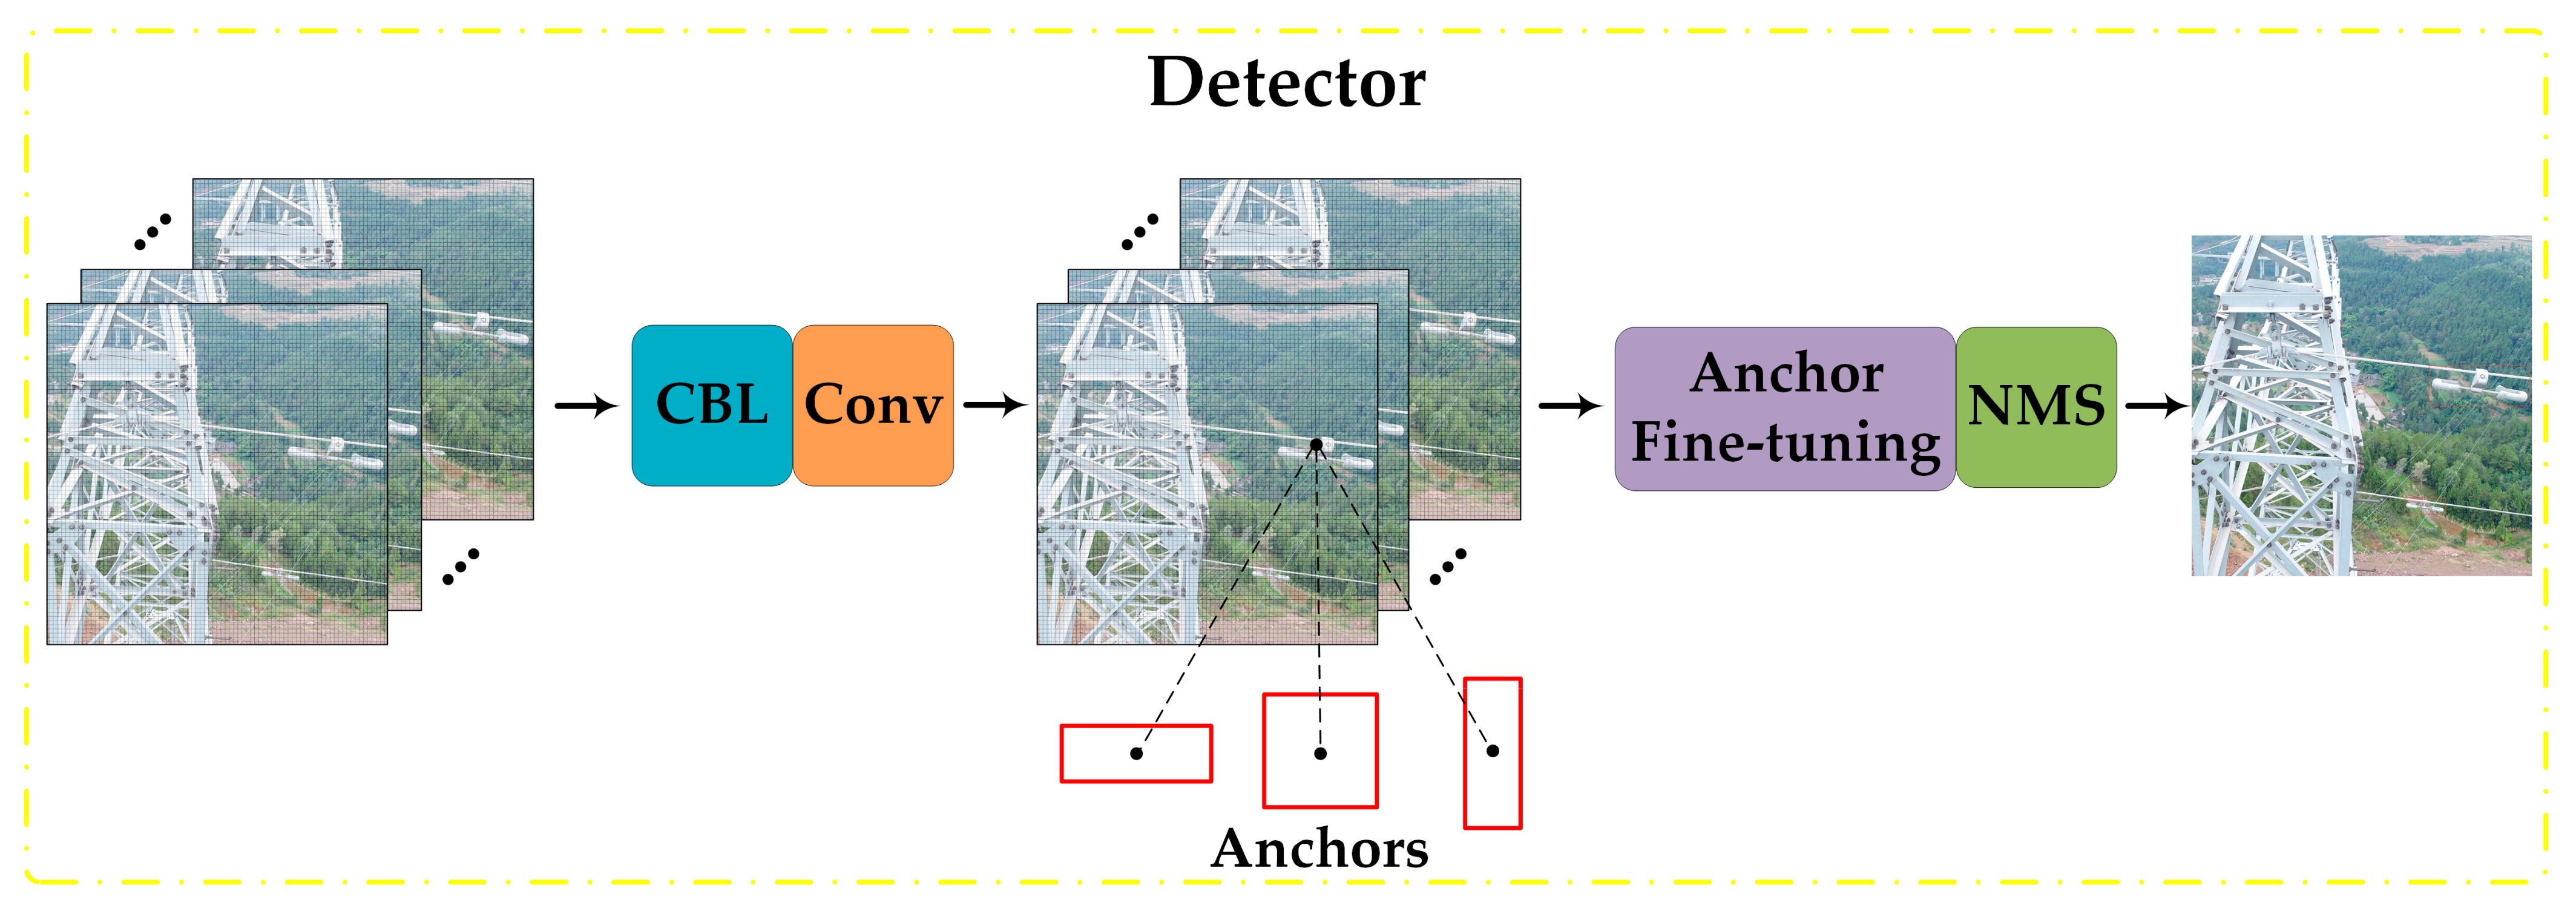
4.2. Architecture of the PMA-YOLO Network

The backgrounds of the UAV remote sensing images in DAVD were complex, and the different types of faults result in a diverse range of shapes and small sizes for abnormal vibration dampers. Since existing methods cannot meet the need for accurate location and classification of abnormal vibration dampers, we propose an end-to-end PMA-YOLO network, based on YOLOv4 [14] (Figure 8), to improve the detection performance for abnormal vibration dampers.
Our PMA-YOLO network includes three main modules: a feature extraction module, a multi-scale feature fusion module, and a prediction module. The overall architecture of PMA-YOLO is shown in Figure 9. More specifically, in the feature extraction module, we use the original CSPDarknet53 from the YOLOv4 [14] network. The residual edges in CSPDarknet53 are beneficial for reducing the number of parameters, meaning that this module can improve the efficiency of feature extraction for abnormal vibration dampers. In the multi-scale feature fusion module, we leave the original YOLOv4 [14] feature fusion unchanged and add a PMA module after each Concat block, as shown in Figure 10. Since a Concat block combines low-level and high-level features, it inevitably fuses redundant information. The addition of the PMA module can effectively improve feature extraction for critical regions and can reduce the focus on useless background information. In the multi-scale prediction module, we applied the prediction method from YOLOv4 [14], using the K-means algorithm to design new anchors that are more suitable for abnormal vibration dampers. Since there are many small abnormal vibration dampers in DAVD that are difficult to locate, the appropriate selection of anchors can give a provide a better fit for this small size and is beneficial in terms of improving the detection accuracy of small abnormal vibration dampers.

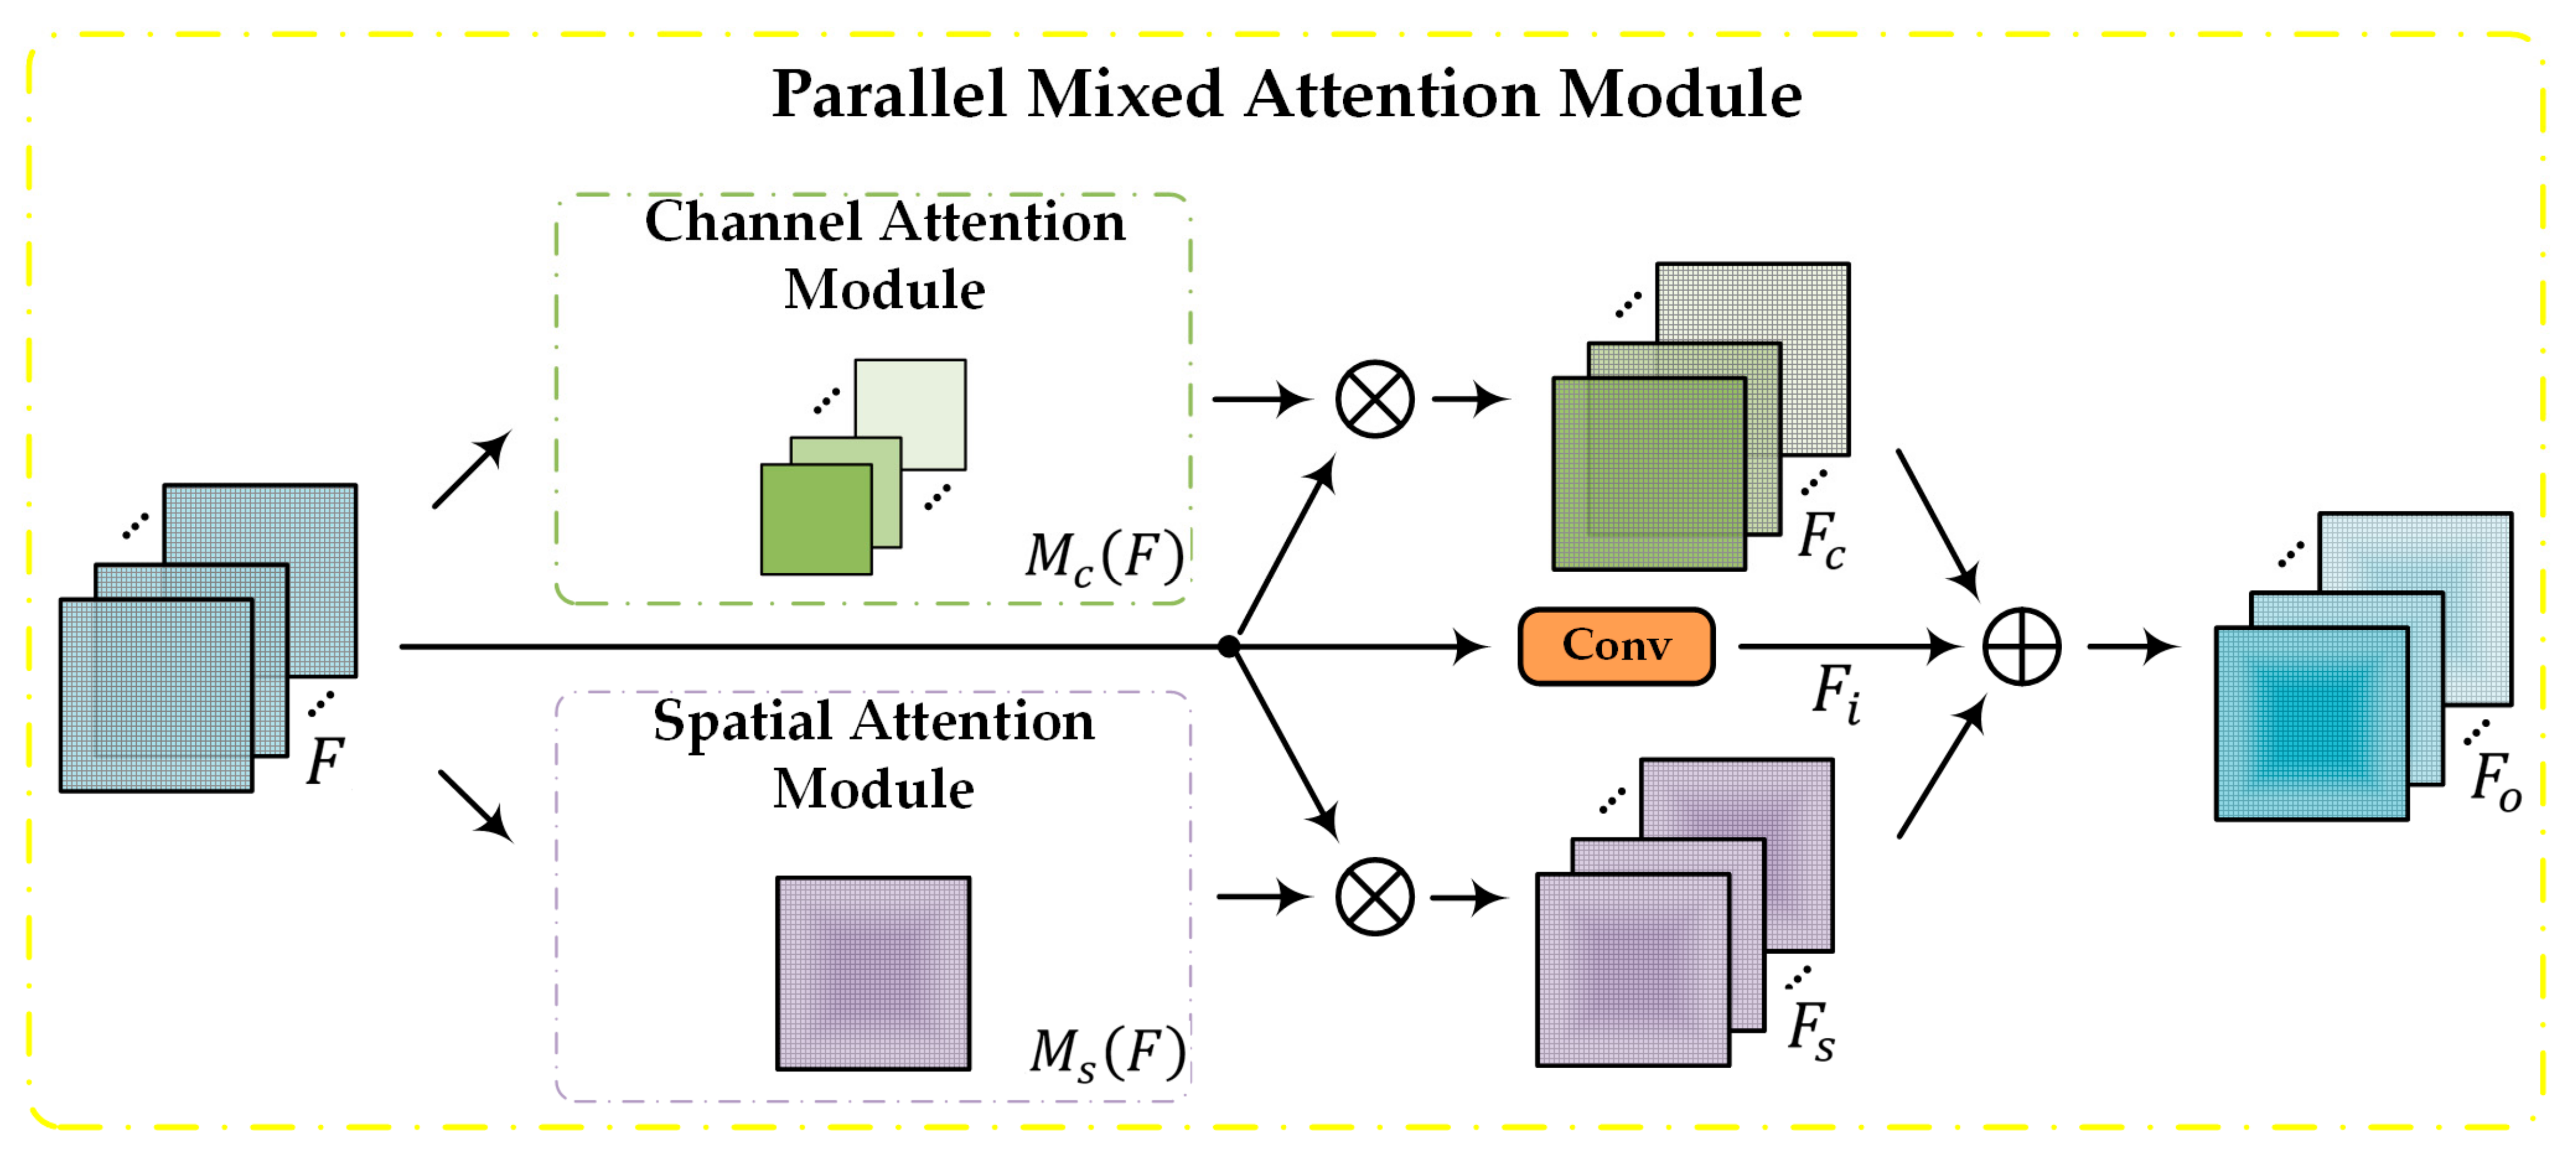
4.2.1. PMA (Parallel Mixed Attention)

In the multi-scale feature fusion module, the Concat block fuses various features indiscriminately. The addition of an attention module enables the network to focus on learning the more critical regions of abnormal vibration dampers under conditions of complex backgrounds. CBAM [39] is a lightweight and universal attention module. With a serial structure consisting of a channel attention module and a spatial attention module, CBAM can combine the channel and spatial features in sequence. The architecture of this module is shown in Figure 11.
However, this structure cannot meet the needs of a system for the detection of abnormal vibration dampers in images. The main reason for this is that in a serial structure, if the channel attention module does not accurately extract the critical features of abnormal vibration dampers, the output of the subsequent spatial attention module will be strongly affected. In addition, due to the two pooling operations in the serial structure, the features of small abnormal vibration dampers in images become increasingly weak, making detection more difficult.
In view of this, we propose a PMA module based on CBAM [39], and the architecture for our module is shown in Figure 12. Firstly, the input feature map F is fed into the channel attention and spatial attention modules to obtain the spatial weights M c F and channel weights M s F , respectively. Then, we merged M c F and M s F with F using element-wise multiplication to obtain the channel attention feature map F c and the spatial attention feature map F s , respectively. Then, 3 × 3 convolution was applied to F to increase the receptive field and enhance the representation ability of small target features, so that the feature map F i could be obtained. Finally, by adding F c , F s , and the convolution result F i , we obtained the mixed attention feature map F o . Compared with CBAM, our approach had the following characteristics. The use of the PMA module avoided the effect of the two sub attention modules and gave better attention to the critical regions of abnormal vibration dampers complementarily. In addition, the PMA module directly fuses the convolution results from the input feature map with the mixed attention feature map; this enhances the representation ability of the output feature map while ensuring that information on the small abnormal vibration dampers is not lost.
We use Grad-CAM [40] to visualization the results of the output feature map. We extracted activation heat maps from partial detection images of YOLOv4 [14] combined with different attention modules such as CBMA and our PMA, as shown in Figure 13. It can be observed that the network with the PMA module more precisely located the critical regions of vibration dampers than the CBAM module. Compared with the CBAM modules, the PMA module payed less attention to the backgrounds and, thus, provided a more correct classification.

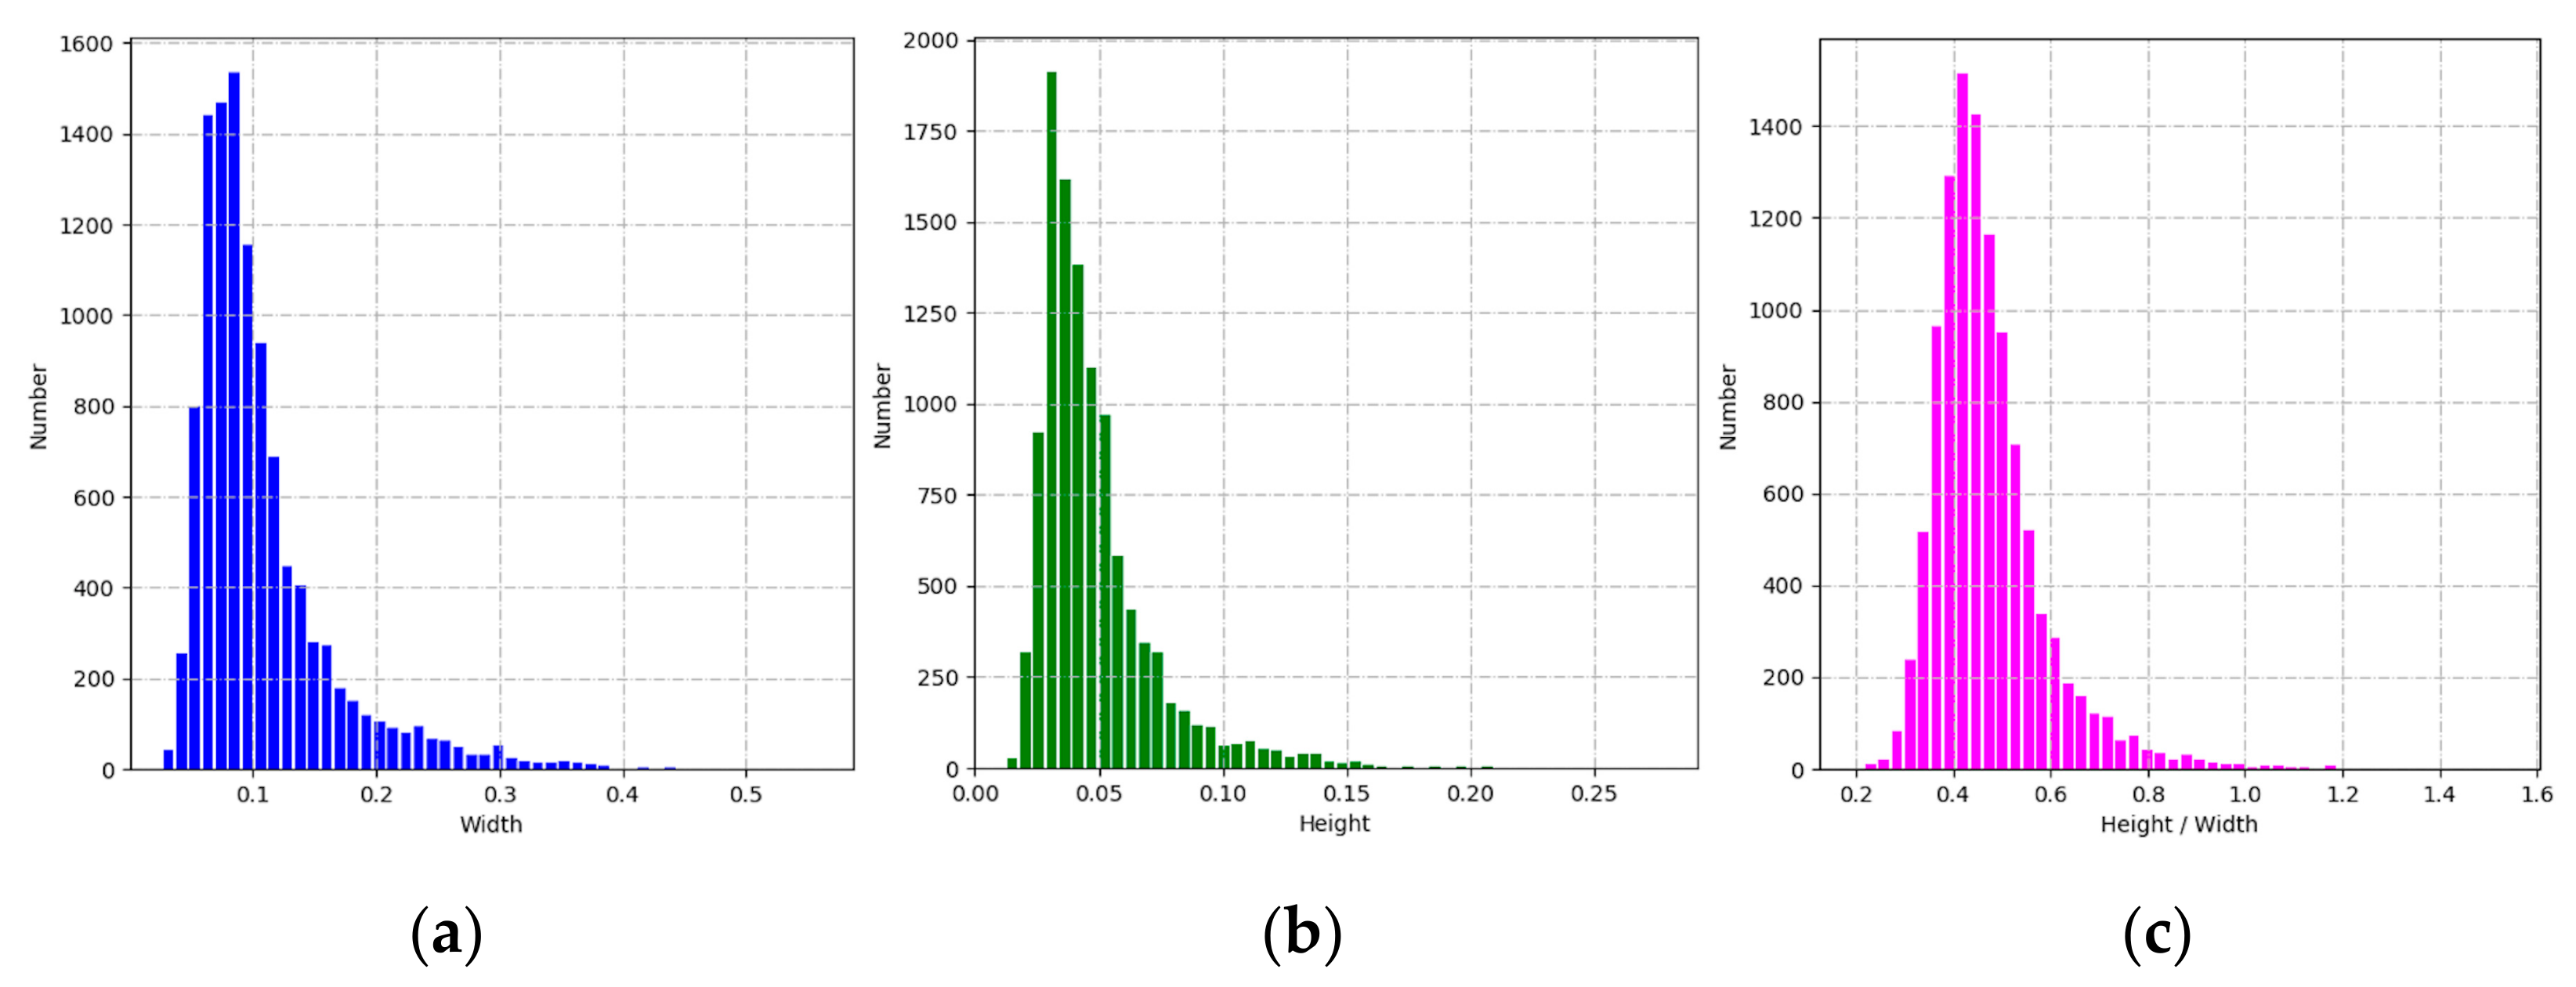
4.2.2. Anchors Design Based on the K-Means Algorithm

In the multi-scale prediction module, anchors of different sizes were applied to the feature maps, and these anchors were then fine-tuned using the trained offset parameters (see Figure 14). The scale and ratio of the preset anchors could significantly affect the localization effects. Unlike the MS COCO (Microsoft Common Objects in Context) data set, there were more small targets in DAVD due to the wide field of view of the UAV’s camera. There may therefore be some problems with the use of the original anchors such as localization errors, a greater proportion of background in the regression box, and missed detection of small abnormal vibration dampers. To solve the above problems, we designed new anchors based on the K-means algorithm. We first studied the scale and aspect ratio distribution of all the abnormal vibration dampers in DAVD as shown in Figure 15. It can be seen that the ratios of the width and height of the abnormal vibration dampers relative to the images were concentrated at 0.1 and 0.04, respectively, indicating that the sizes of abnormal vibration dampers are small in DAVD. We then applied the K-means algorithm to re-cluster new anchors in which a new distance metric was used instead of standard k-means with Euclidean distance. An expression for the distance metric is given in Equation (3).
d b o x , c e n t r o i d = 1 I O U b o x , c e n t r o i d
The IOU refers to the ratio of the intersection to the union of two boxes. Finally, we applied a linear adjustment to the scales of the anchors based on the sizes of three feature maps in the prediction module. The anchors are shown in Table 2.

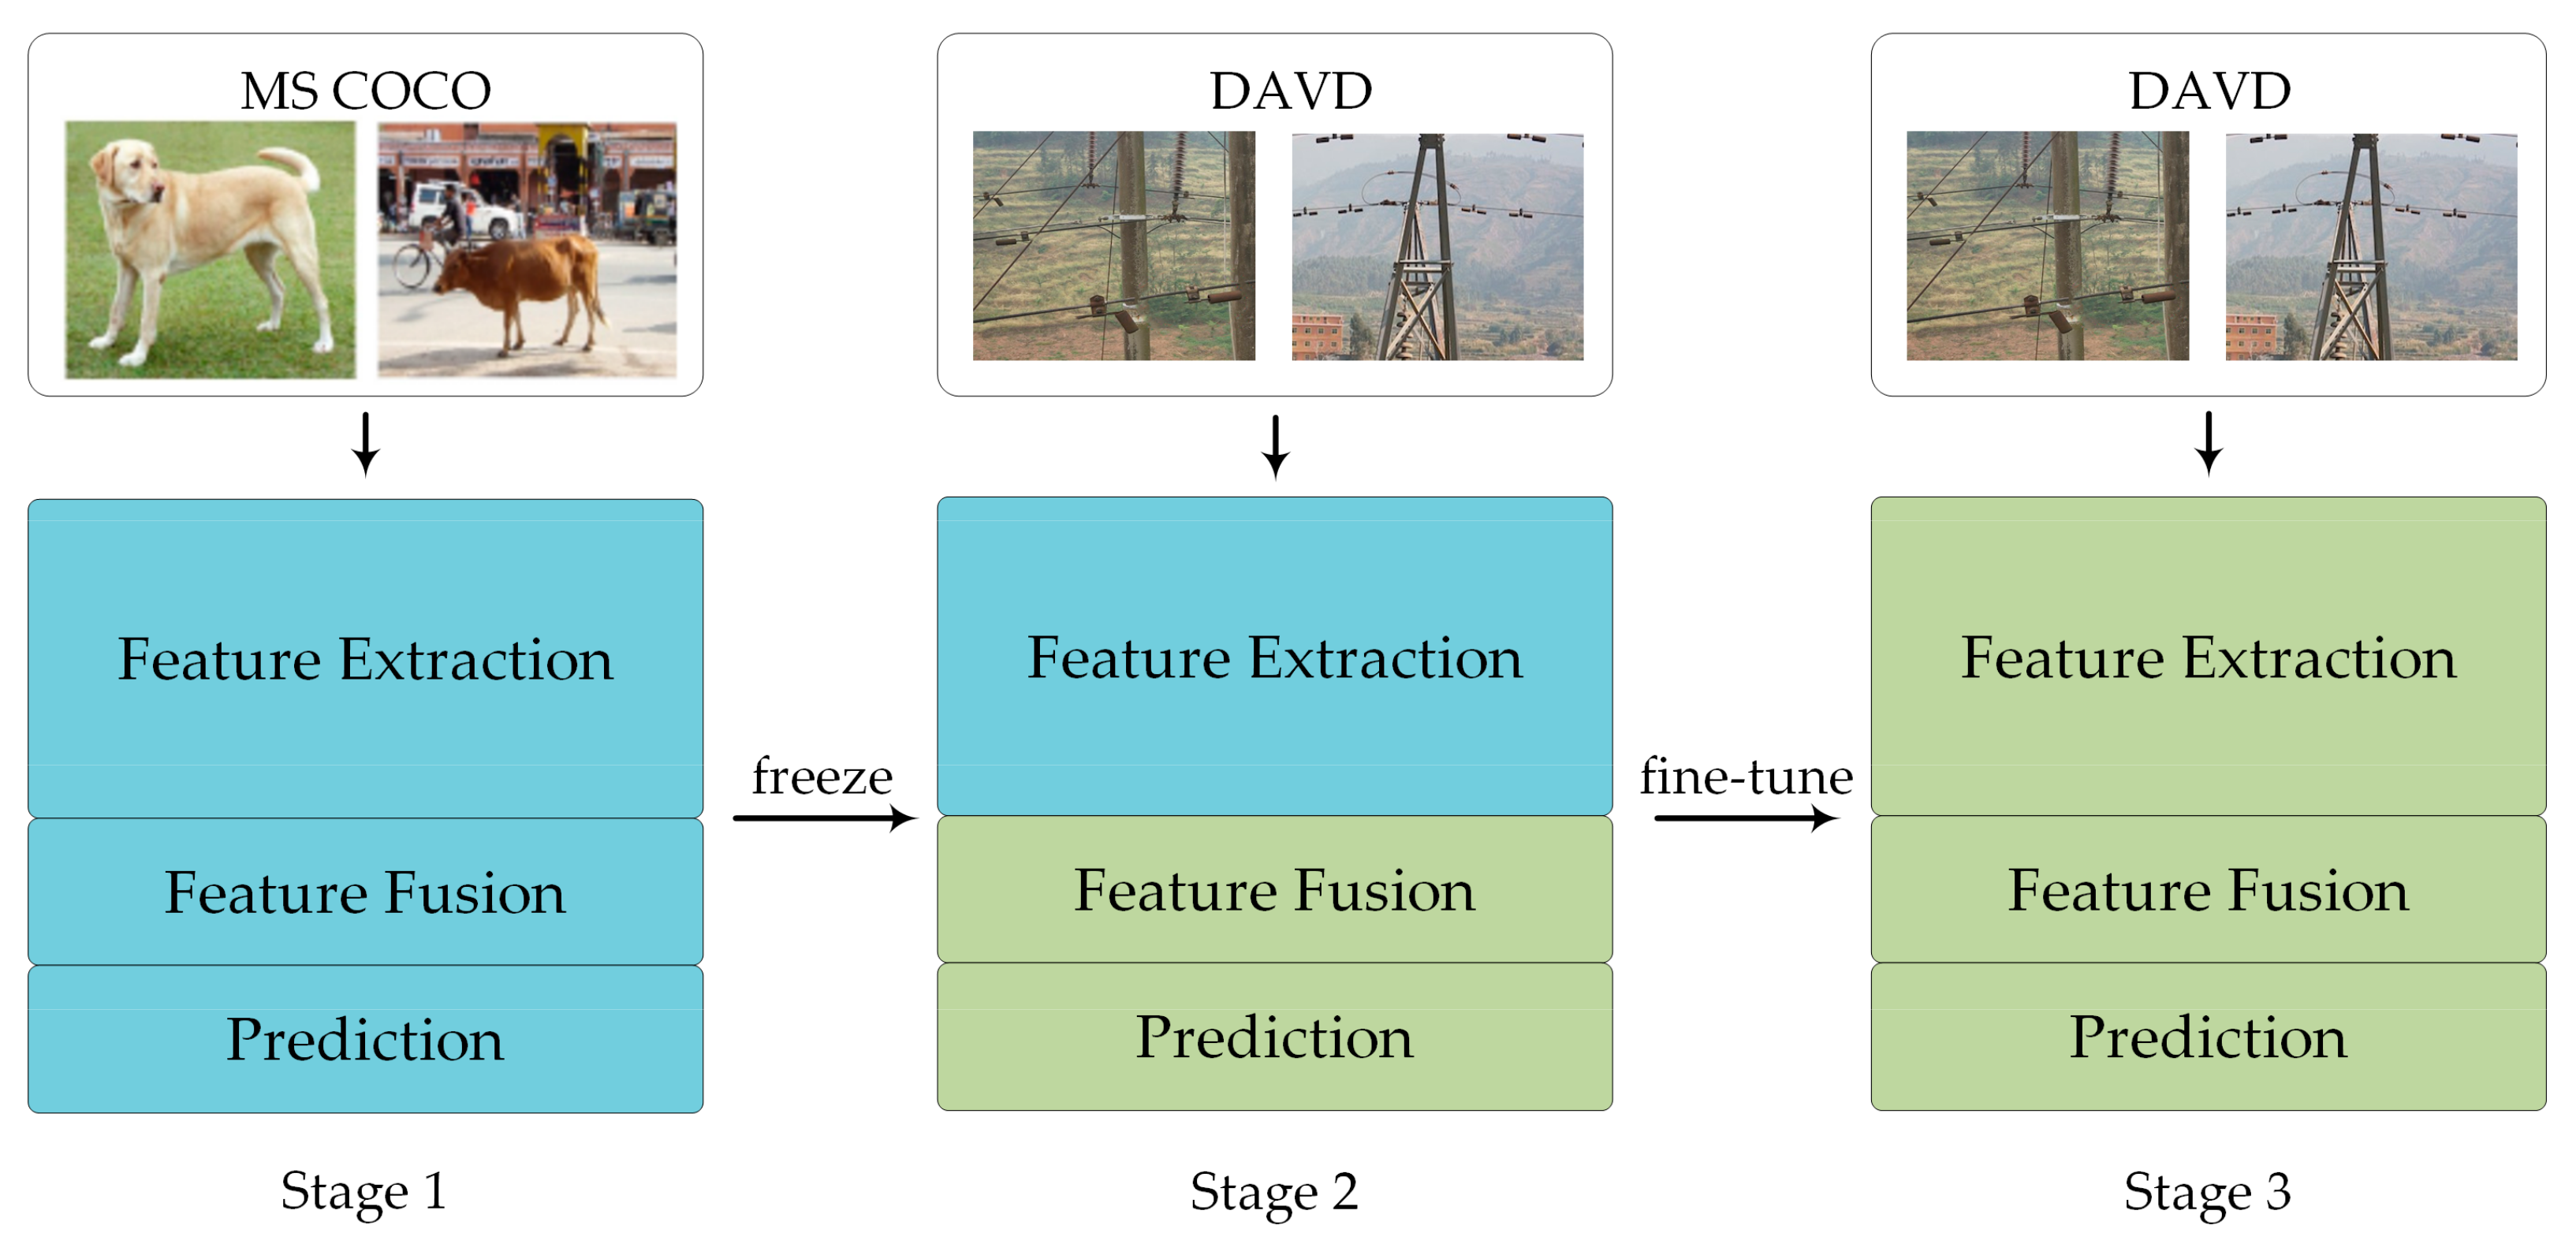
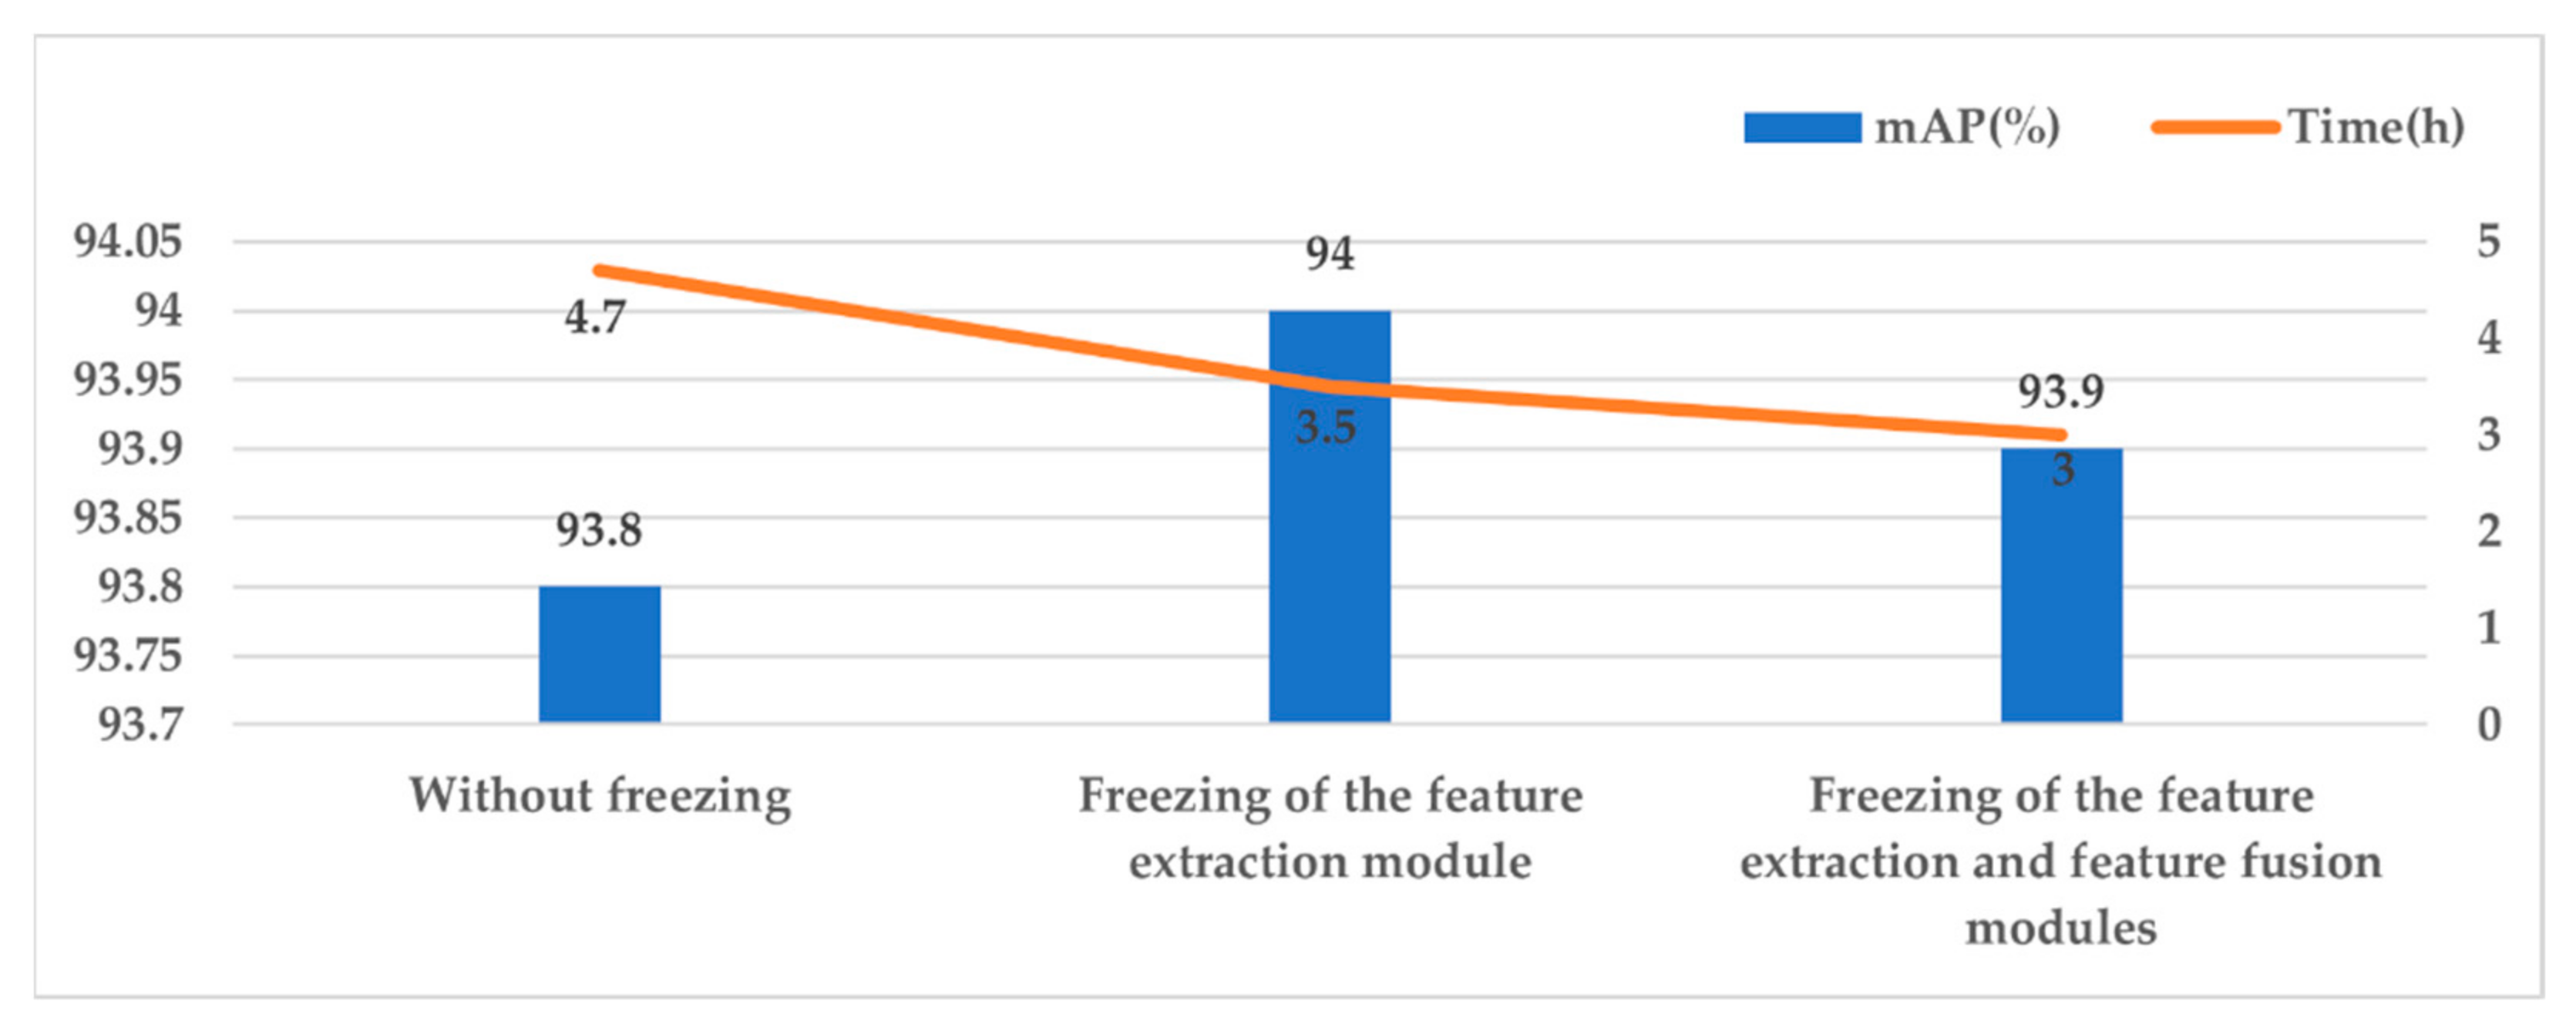
4.3. Training Strategy

The loss function of the PMA-YOLO network includes the location loss L l o c , confidence loss L c o n , and classification loss L c l a , and it is shown in Equation (4). More specifically, we used the complete intersection over union (CIoU) loss [41] to determine L l o c . Unlike the traditional mean square error (MSE) approach, CIoU takes into account the distance and overlap rate between the prediction box and anchor and can therefore better reflect the positional relationships between the prediction box and the ground truth. An expression for L l o c is given in Equation (5). In addition, same as YOLOv4 [14], we used a binary cross entropy function and a cross entropy function to calculate the confidence and classification losses, respectively. Expressions for L c o n and L c l a are shown given in Equations (6) and (7), respectively.
L o s s = L l o c + L c o n + L c l a
L l o c = i = 0 S × S j = 0 B I i j o b j 1 I o U + ρ 2 b , b g t c 2 + ν 1 I o U + ν ν 4 π 2 a r c t a n w g t h g t a r c t a n w h 2
L c o n = i = 0 S × S j = 0 B I i j o b j C ^ i j log C i j + 1 C ^ i j log 1 C i j λ n o o b j i = 0 S × S j = 0 B I i j n o o b j C ^ i j log C i j + 1 C ^ i j log 1 C i j  
L c l a = i = 0 S × S c c l a s s e s I i j o b j P i ^ c log P i c + 1 P i ^ c log 1 P i c  
Due to the small number of annotated images in the data set, the accuracy of detection for the trained network was low. In particular, the convolution layer of the feature extraction module requires sufficient training to extract the critical features from images. Yosinski et al. [42] point out that the results obtained from transferring network features are better than randomly initializing parameters when training large networks. In addition, the appropriate use of techniques, such as freezing and fine-tuning parameters, can not only improve the training efficiency but also avoid overfitting.
Hence, to further improve the performance in terms of detection of abnormal vibration dampers, we introduced a multi-stage transfer learning strategy to optimize the training of the PMA-YOLO network, in which we used MS COCO as the source domain and DAVD as the target domain. In the first stage, we used the parameters obtained after pre-training based on MS COCO to initialize our PMA-YOLO network, and select an appropriate pre-freeze layer for knowledge transfer. In the second stage, we froze the convolution layers that were located before the pre-freeze layer selected in the first stage and trained the convolution layers after the pre-freeze layer with a higher learning rate. In the third stage, we use a fine-tuning operation. We unfroze the convolution layers that were frozen in the second stage, dynamically adjusting the learning rate, and fine-tuned all the layer parameters. This process is illustrated in Figure 16.

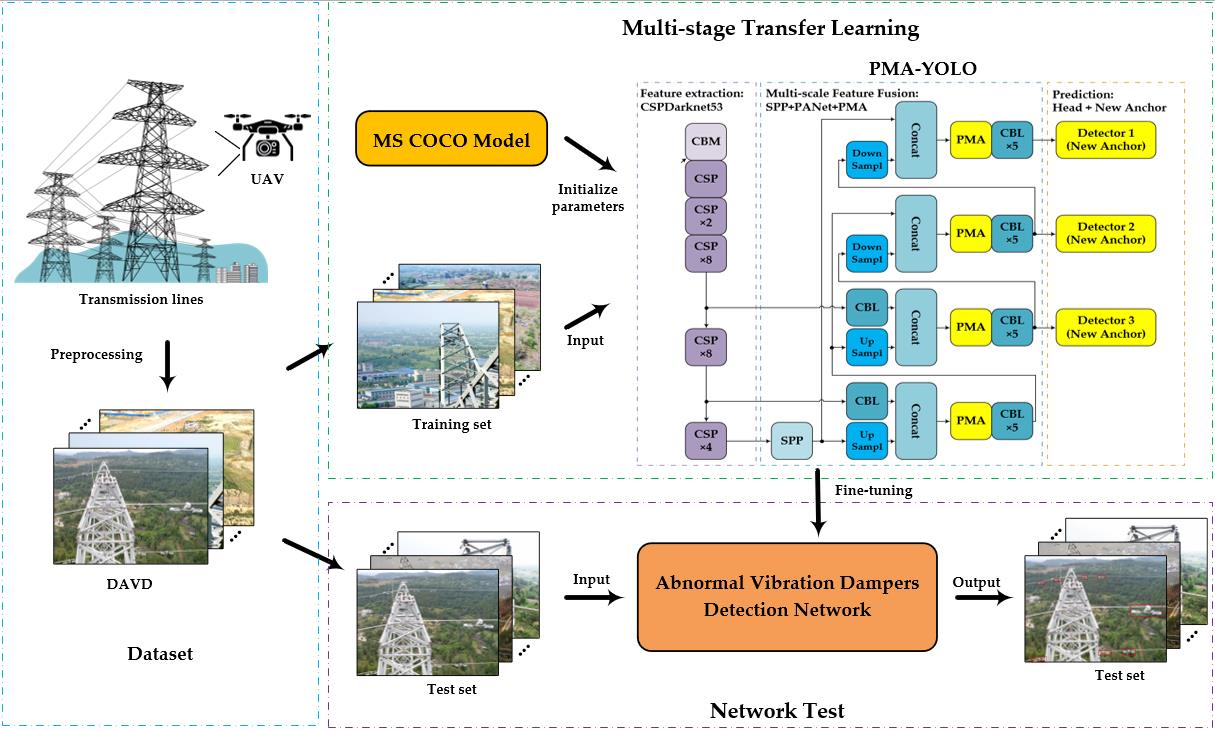
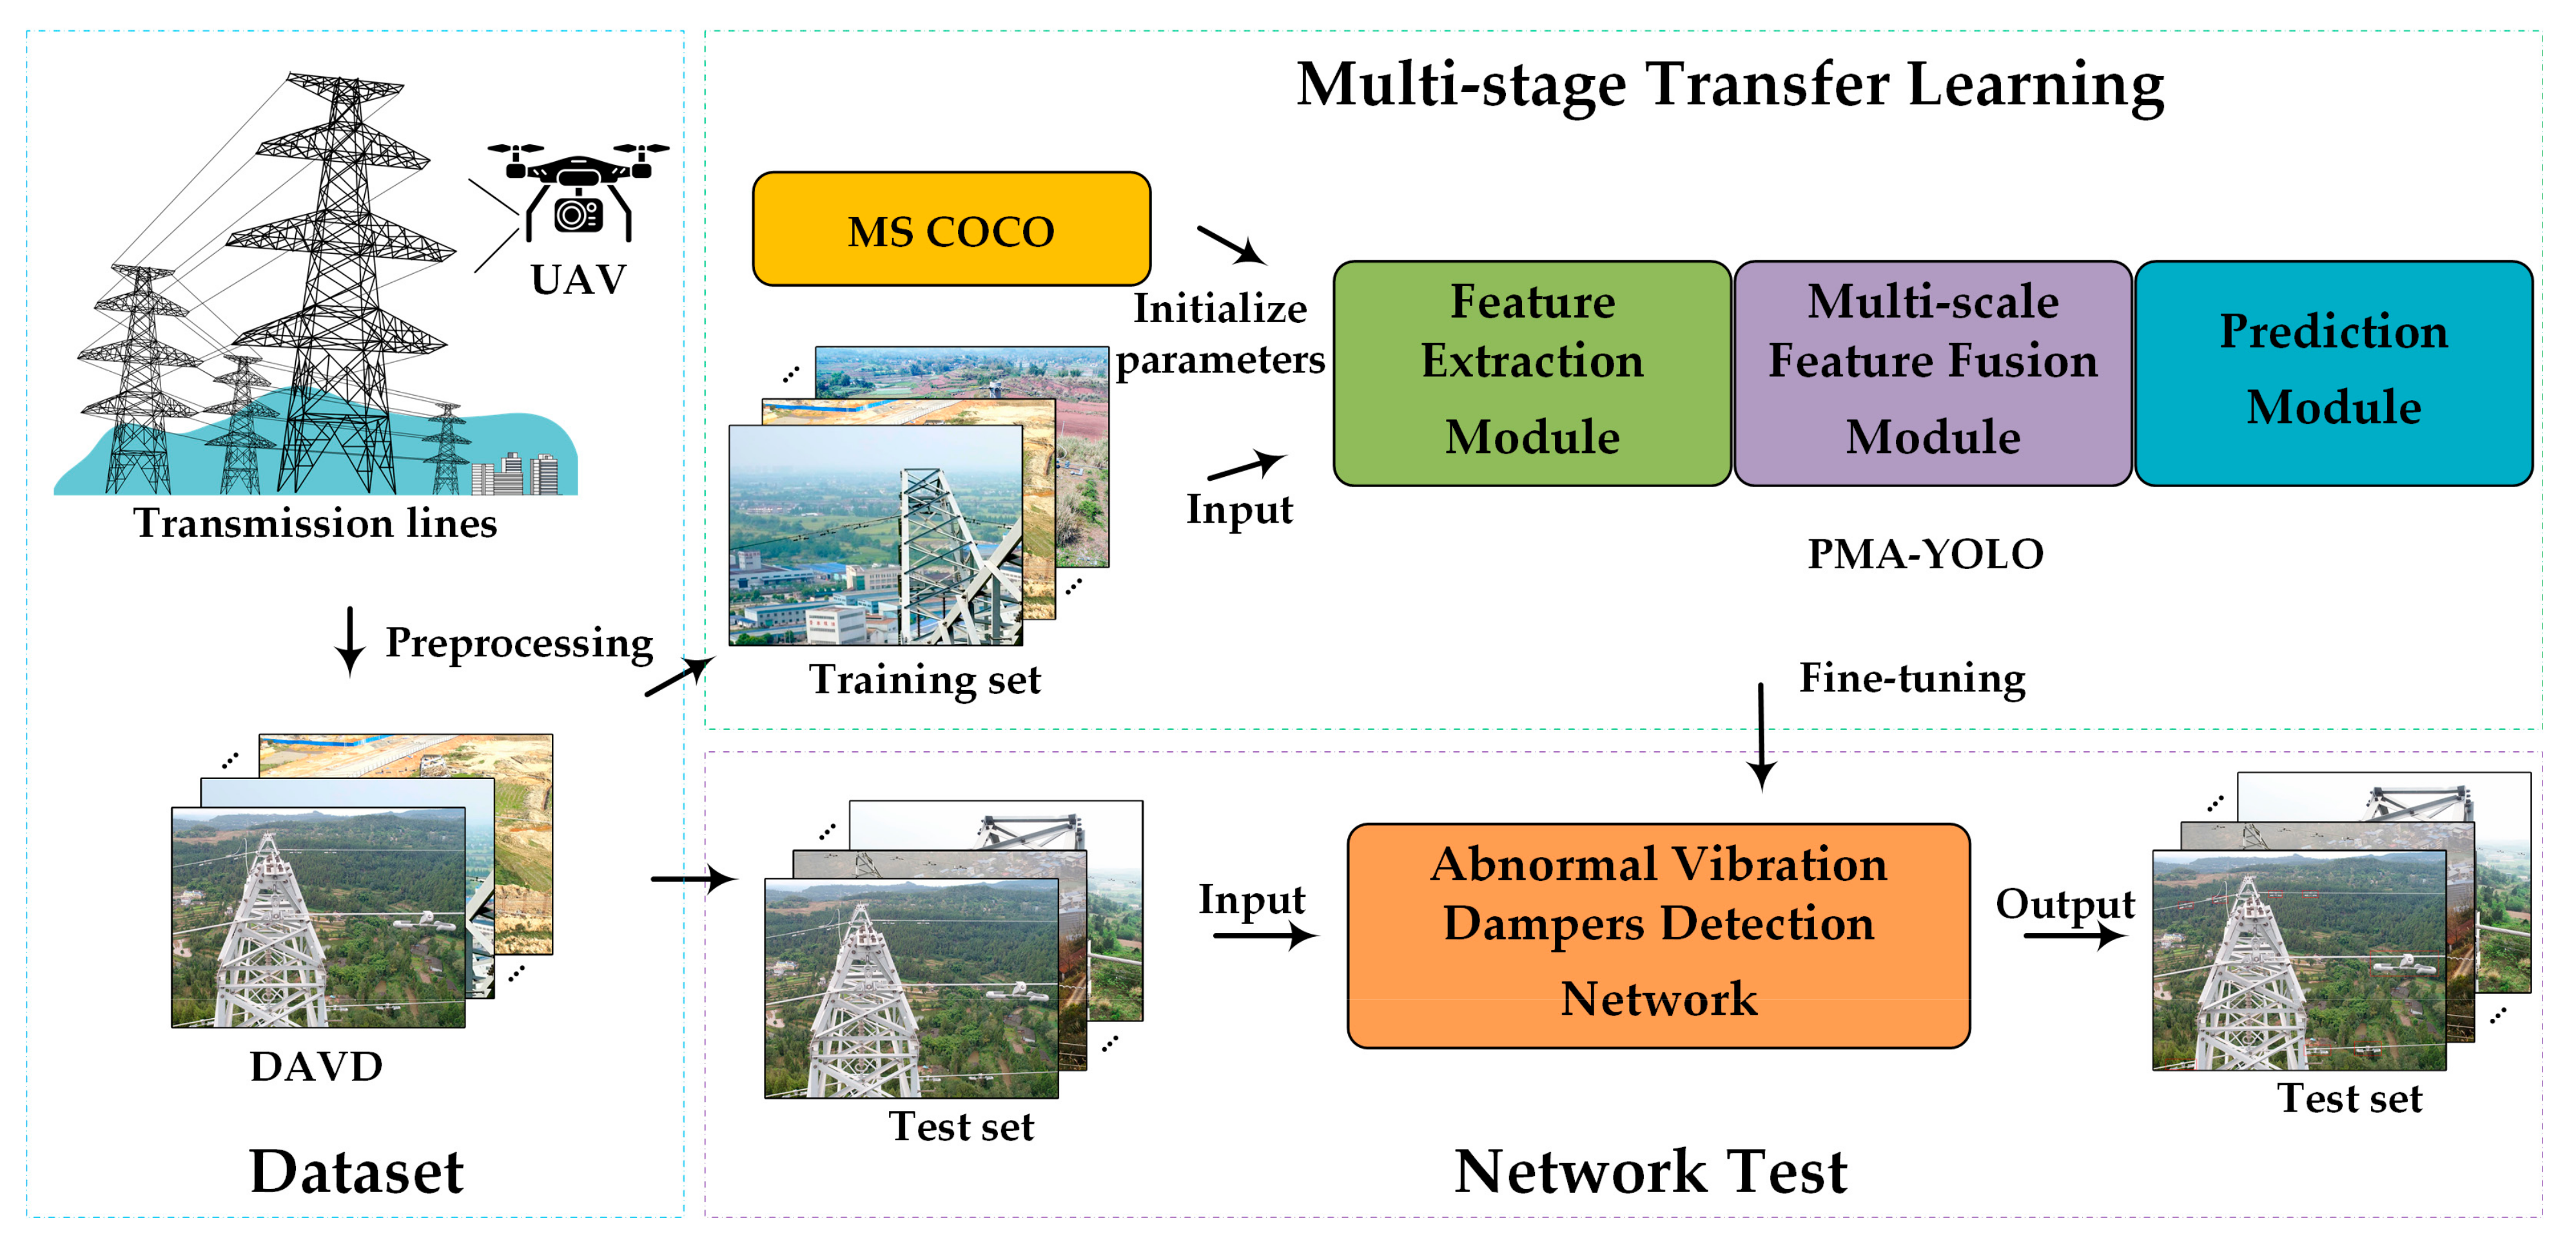
4.4. Methods Framework

Figure 17 shows a schematic framework for our abnormal vibration damper detection method. This schematic framework consists of three parts: an image preprocessing module, a multi-stage transfer learning module, and a testing module of the PMA-YOLO network. We used a UAV to inspect transmission lines in complex environments and capture images, and then constructed a data set of abnormal vibration dampers called DAVD. We trained our PMA-YOLO network using multi-stage transfer learning strategy in which we initialized the parameters using the COCO model, freezing, and fine-tuning. Once the PMA-YOLO network was well trained, it was used to detect abnormal vibration dampers from images obtained by UAVs.
The specific steps of abnormal vibration dampers detection were as follows:
  • The images of vibration dampers on transmission lines were acquired by UAV;
  • Gamma correction and MSR algorithms were used to preprocess the images, and then image augmentation methods, such as horizontal flip and 15° rotation, were implemented;
  • All the images were resized to 800 × 600 × 3 and divided into a training set and a test set according to the ratio of 8:2;
  • The training images are annotated by LabelImg, and the classes and boxes of vibration dampers were saved into XML files;
  • The PMA-YOLO network was pre-trained based on MS COCO to obtain the initial parameters for knowledge transfer;
  • The parameters of PMA-YOLO were fine-tuned in our DAVD by freezing;
  • The loss value of the training set was observed. The model was saved when the Loss value reached the minimum value;
  • The model of the PMA-YOLO network was used to detect the abnormal vibration dampers in the test images.

5. Experimental Results and Analysis

5.1. Experimental Environment and Parameters

The configuration used in our experiments in terms of the hardware and the software platform is shown in Table 3.
The experimental parameters used to train the PMA-YOLO network are shown in Table 4. In the process of the multi-stage transfer learning training, the initial learning rates of the second and third stages were 0.005 and 0.001, respectively, and the other training parameters were consistent with those given in Table 4.

5.2. Performance Evaluation Metrics

The most common performance evaluation metrics used for object detection were the precision, recall, A P (average precision), and m A P (mean average precision). Precision indicates the proportion of samples with positive annotations from all the samples predicted as positive, whereas the recall is defined as the proportion of samples successfully predicted as positive among all the samples annotated as positive. The definitions of precision and recall are given in Equations (8) and (9), respectively. The A P is calculated by the enclosed area of the precision–recall (P–R) curve and is defined in Equation (10). The m A P is the primary evaluation matrix and measures the overall detection effect of the network. An expression for this metric is given in Equation (11), where N represents the number of classes.
In this paper, we used the precision, recall, and m A P @ 0.5 as evaluation metrics to measure the effectiveness of our PMA-YOLO network.
P r e c i s i o n = T P T P + F P
R e c a l l = T P T P + F N
A P = 0 1 P R d R
m A P = i = 1 N A P N
where T P represents true positive, F P represents false positive, and F N represents false negative. More specifically, T P means that the sample was both positive in actuality and positive in the test results; F P means that the sample was negative in actuality and positive in the test results; and F N means that the sample was negative in actuality and negative in the test results.

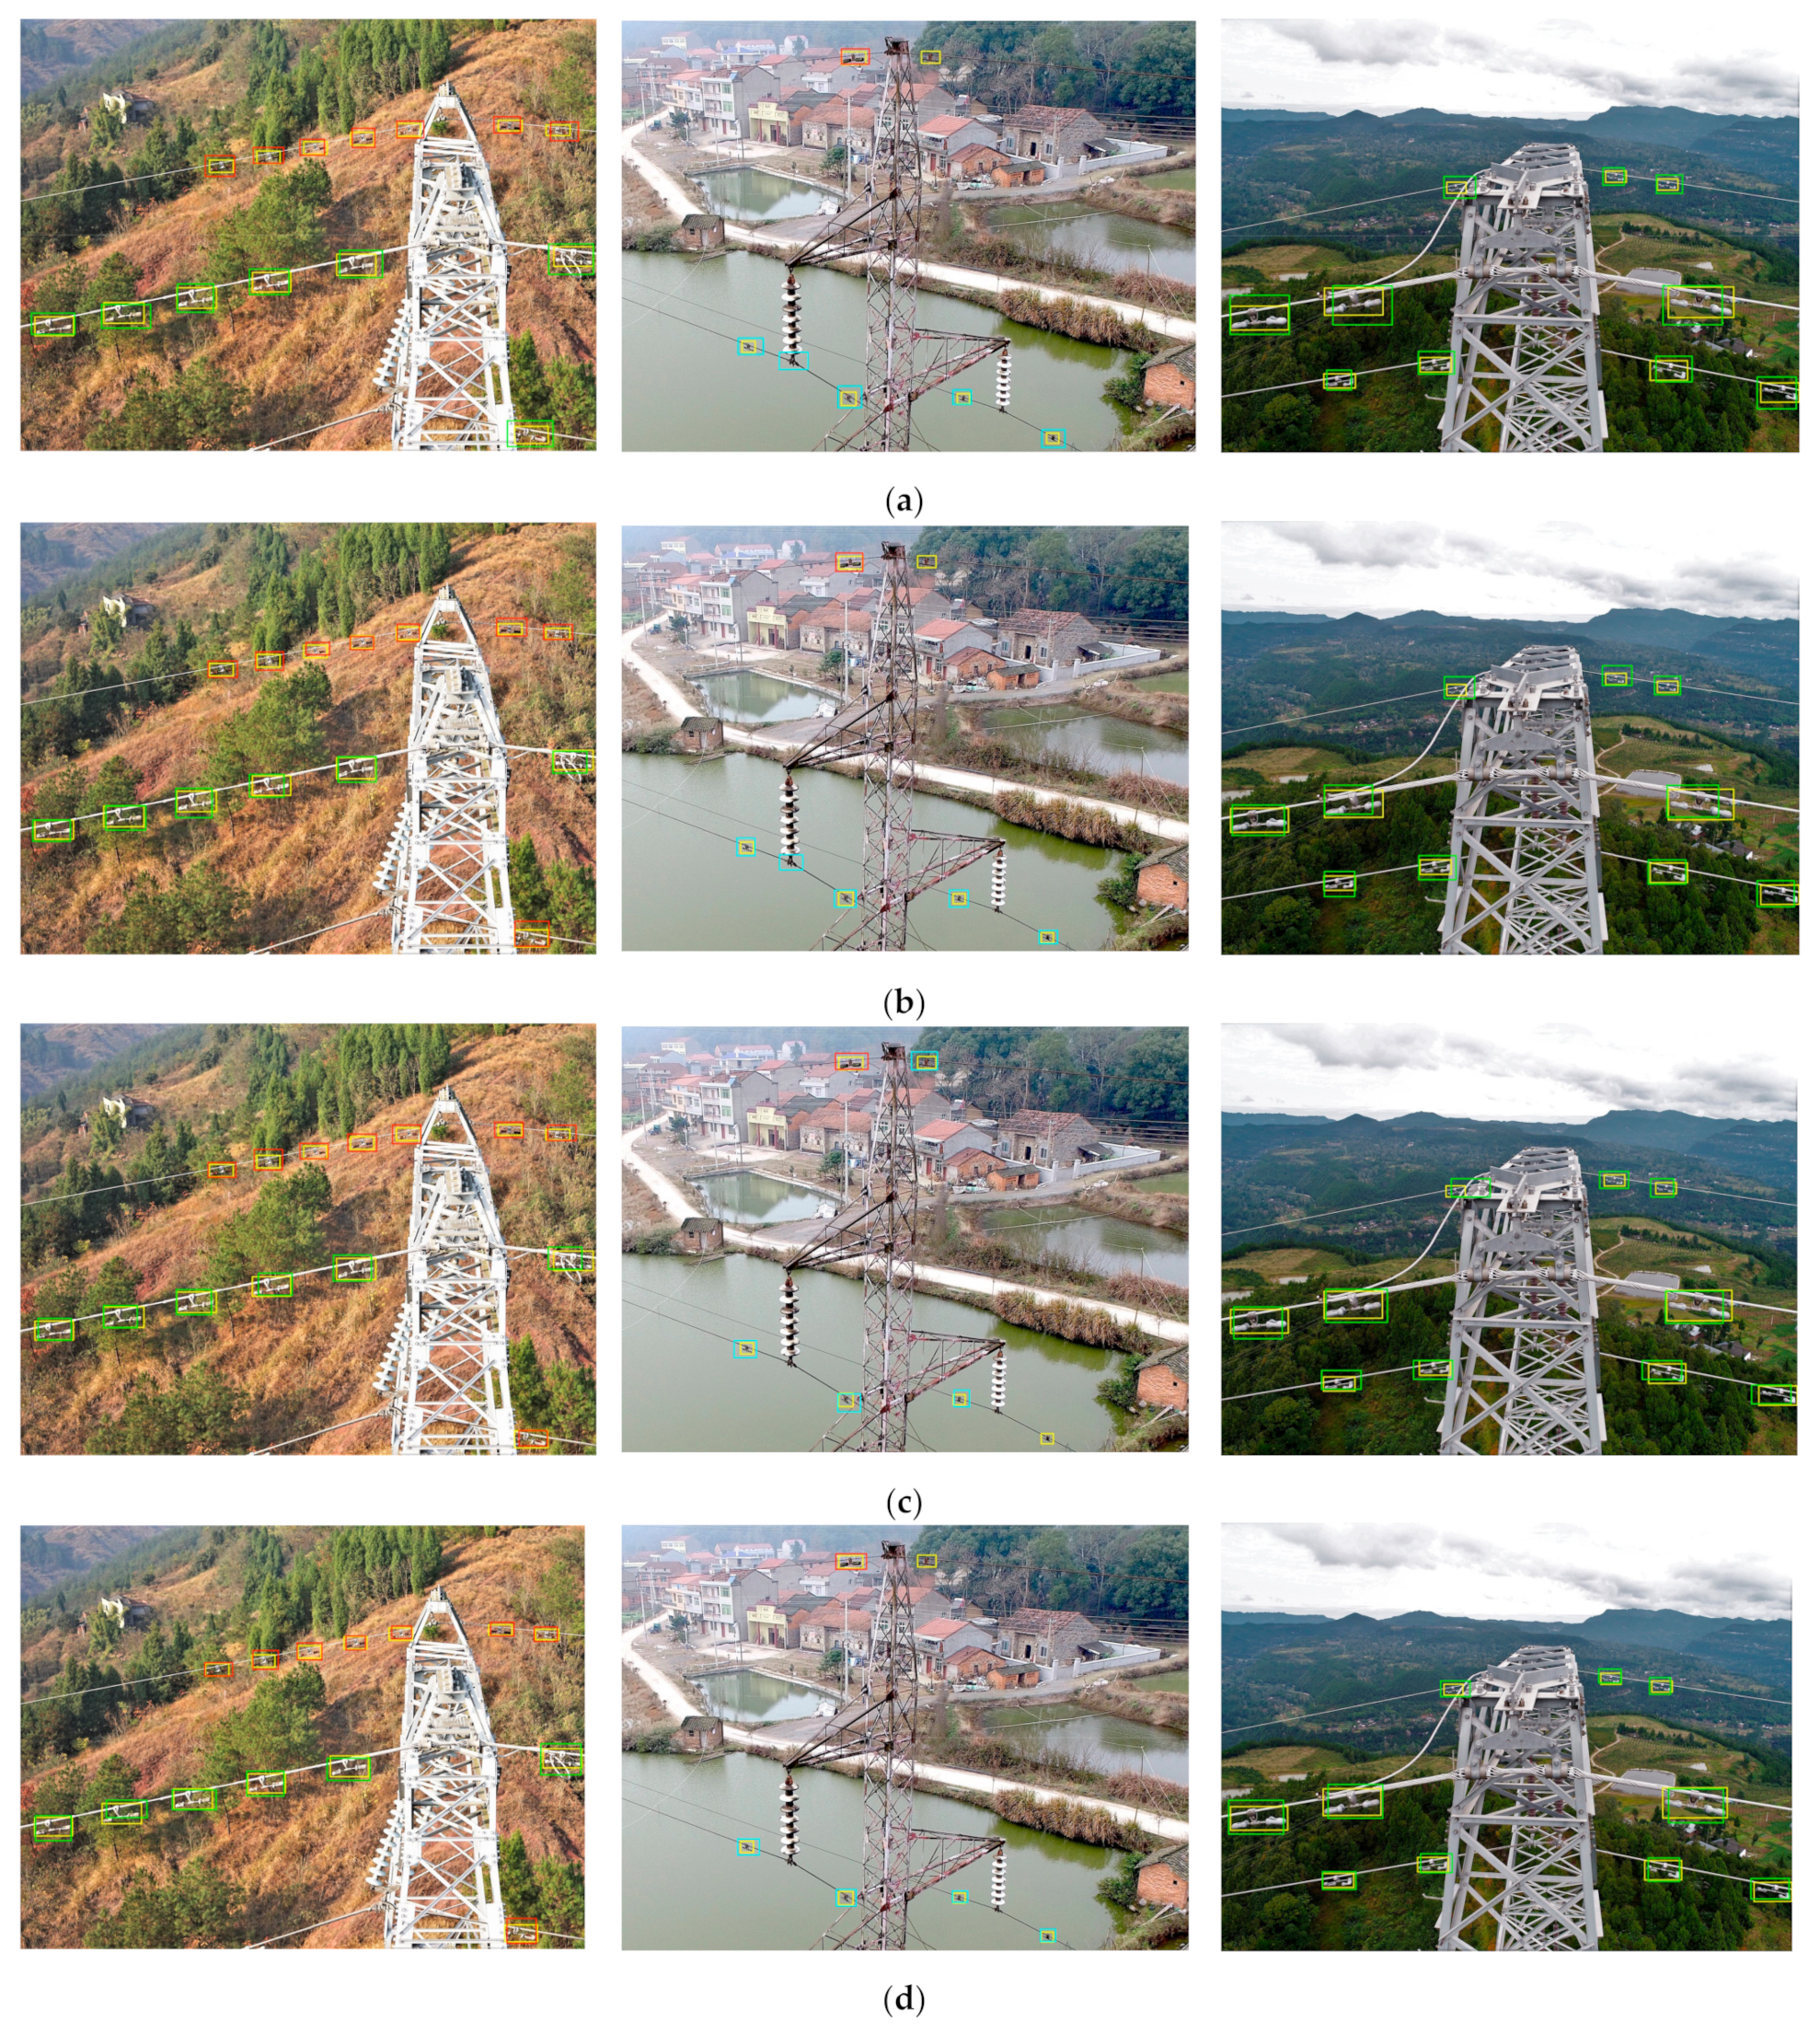
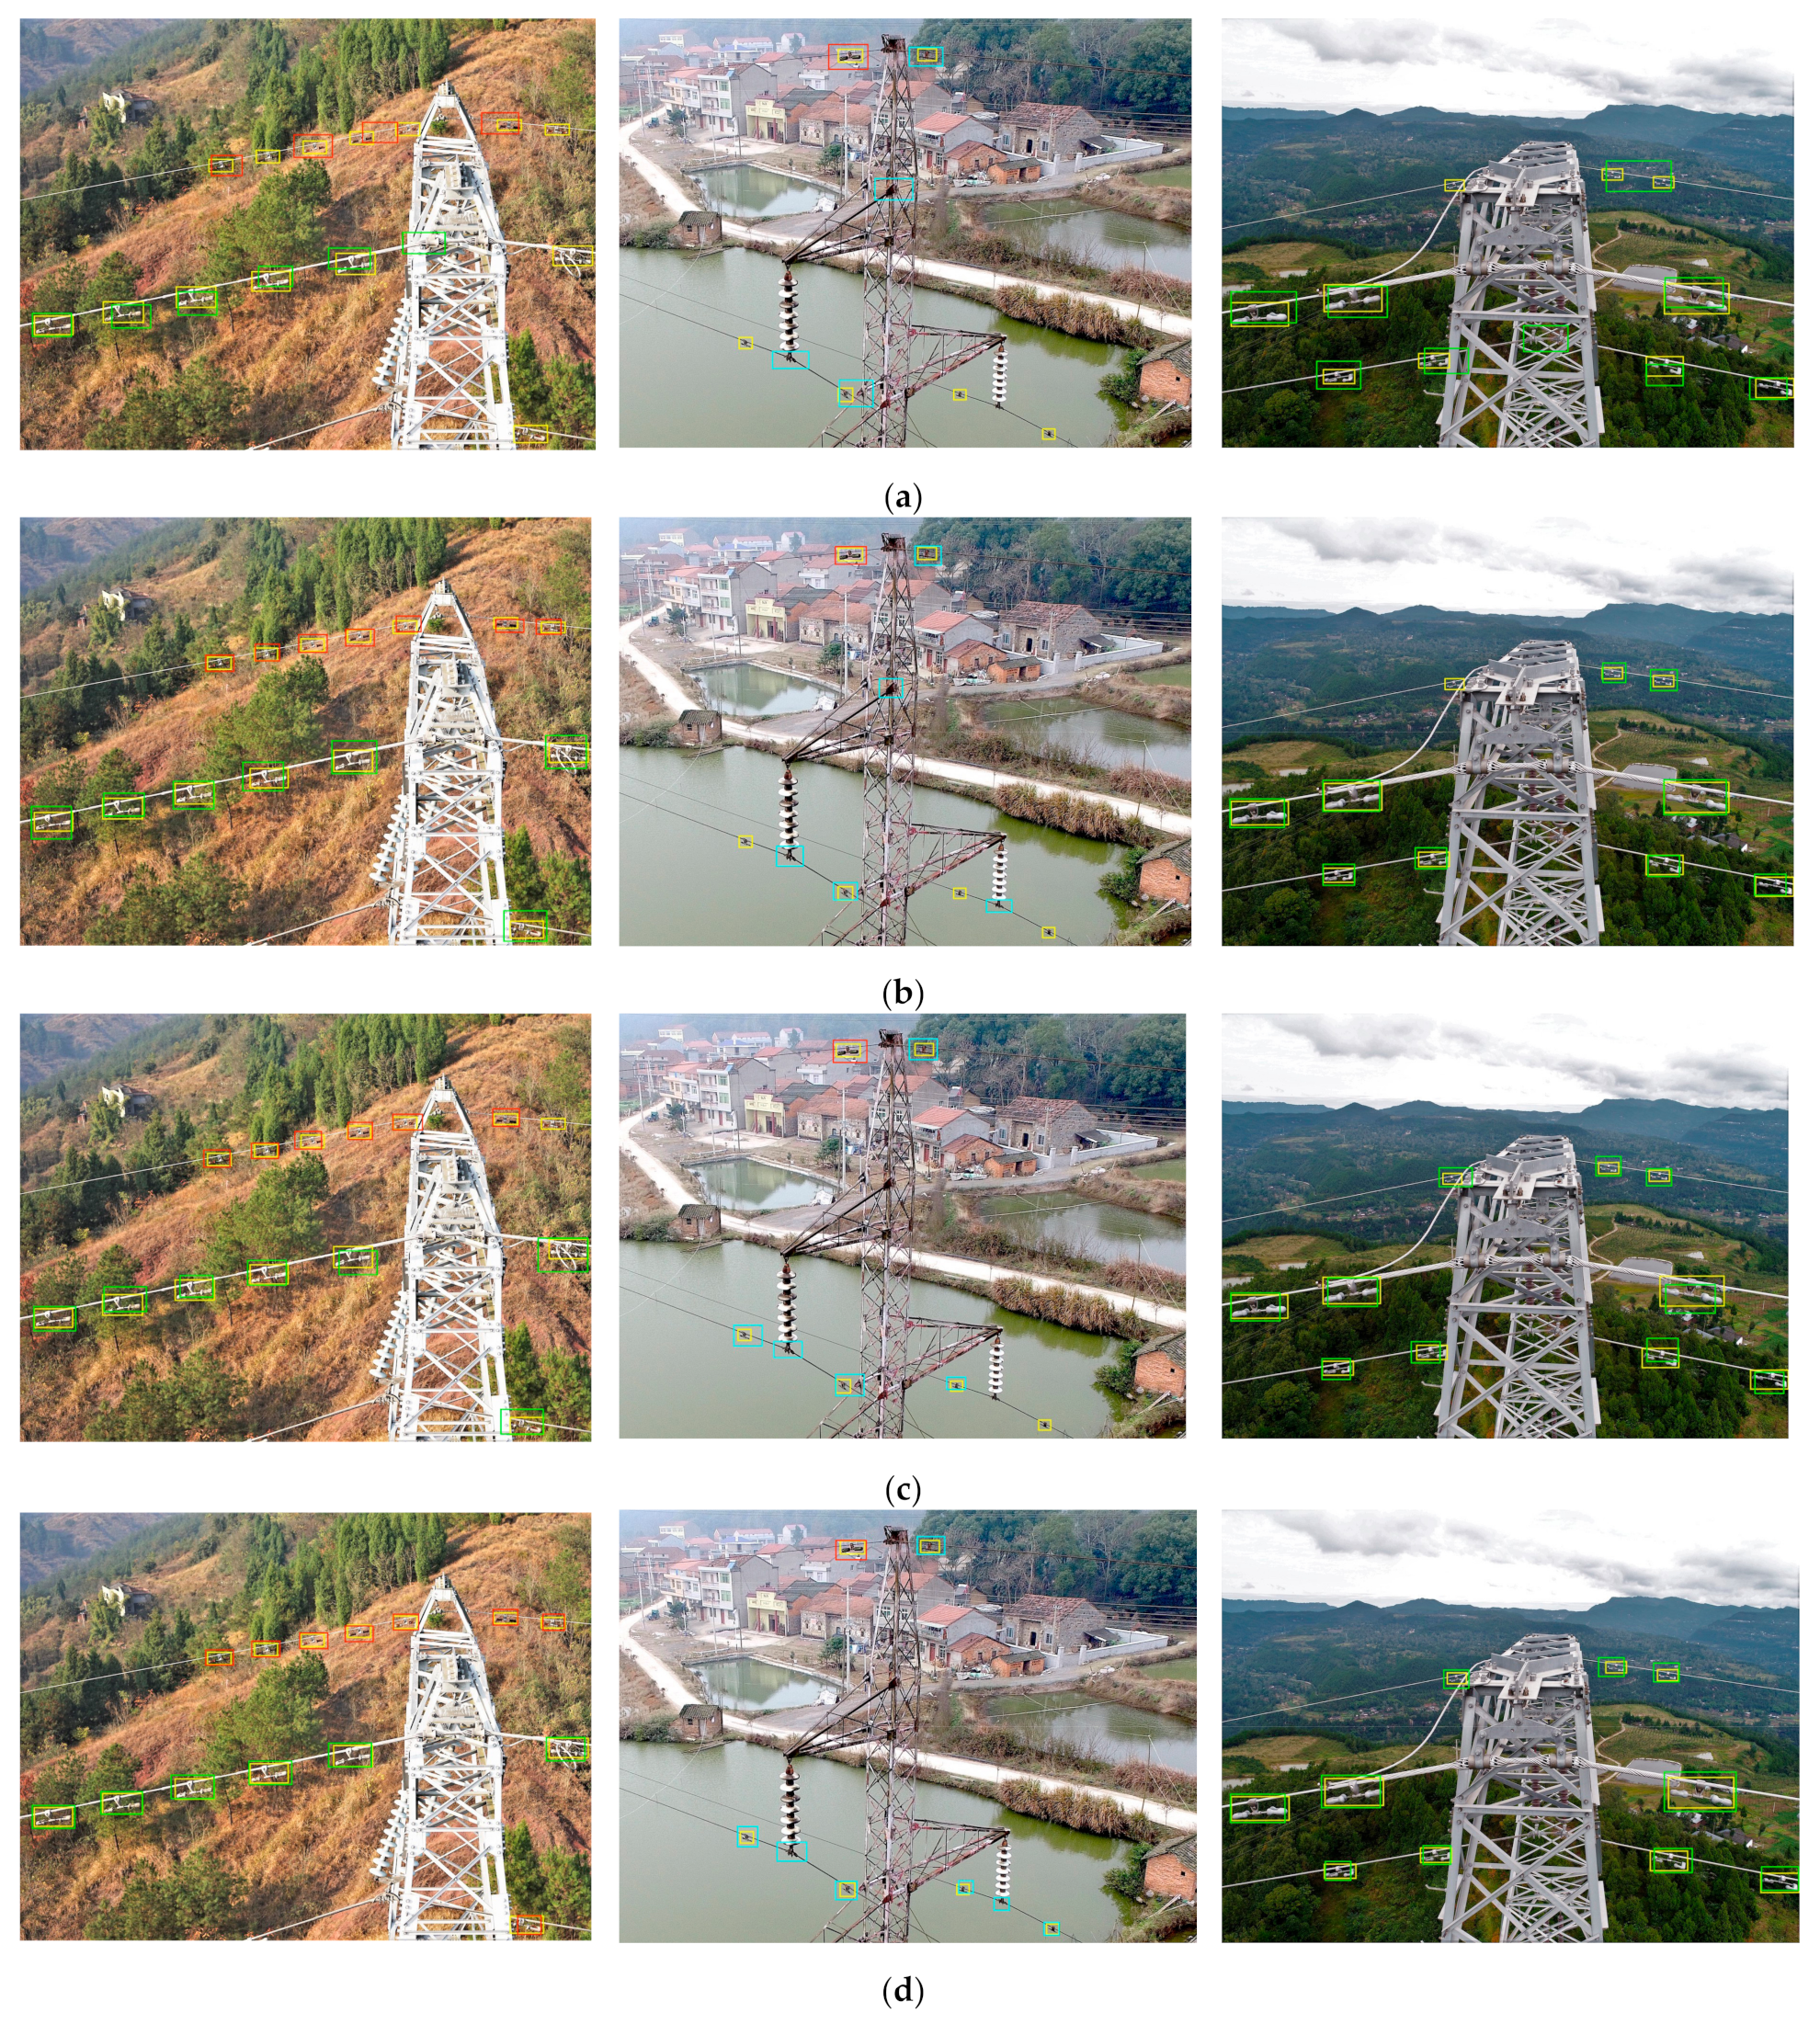
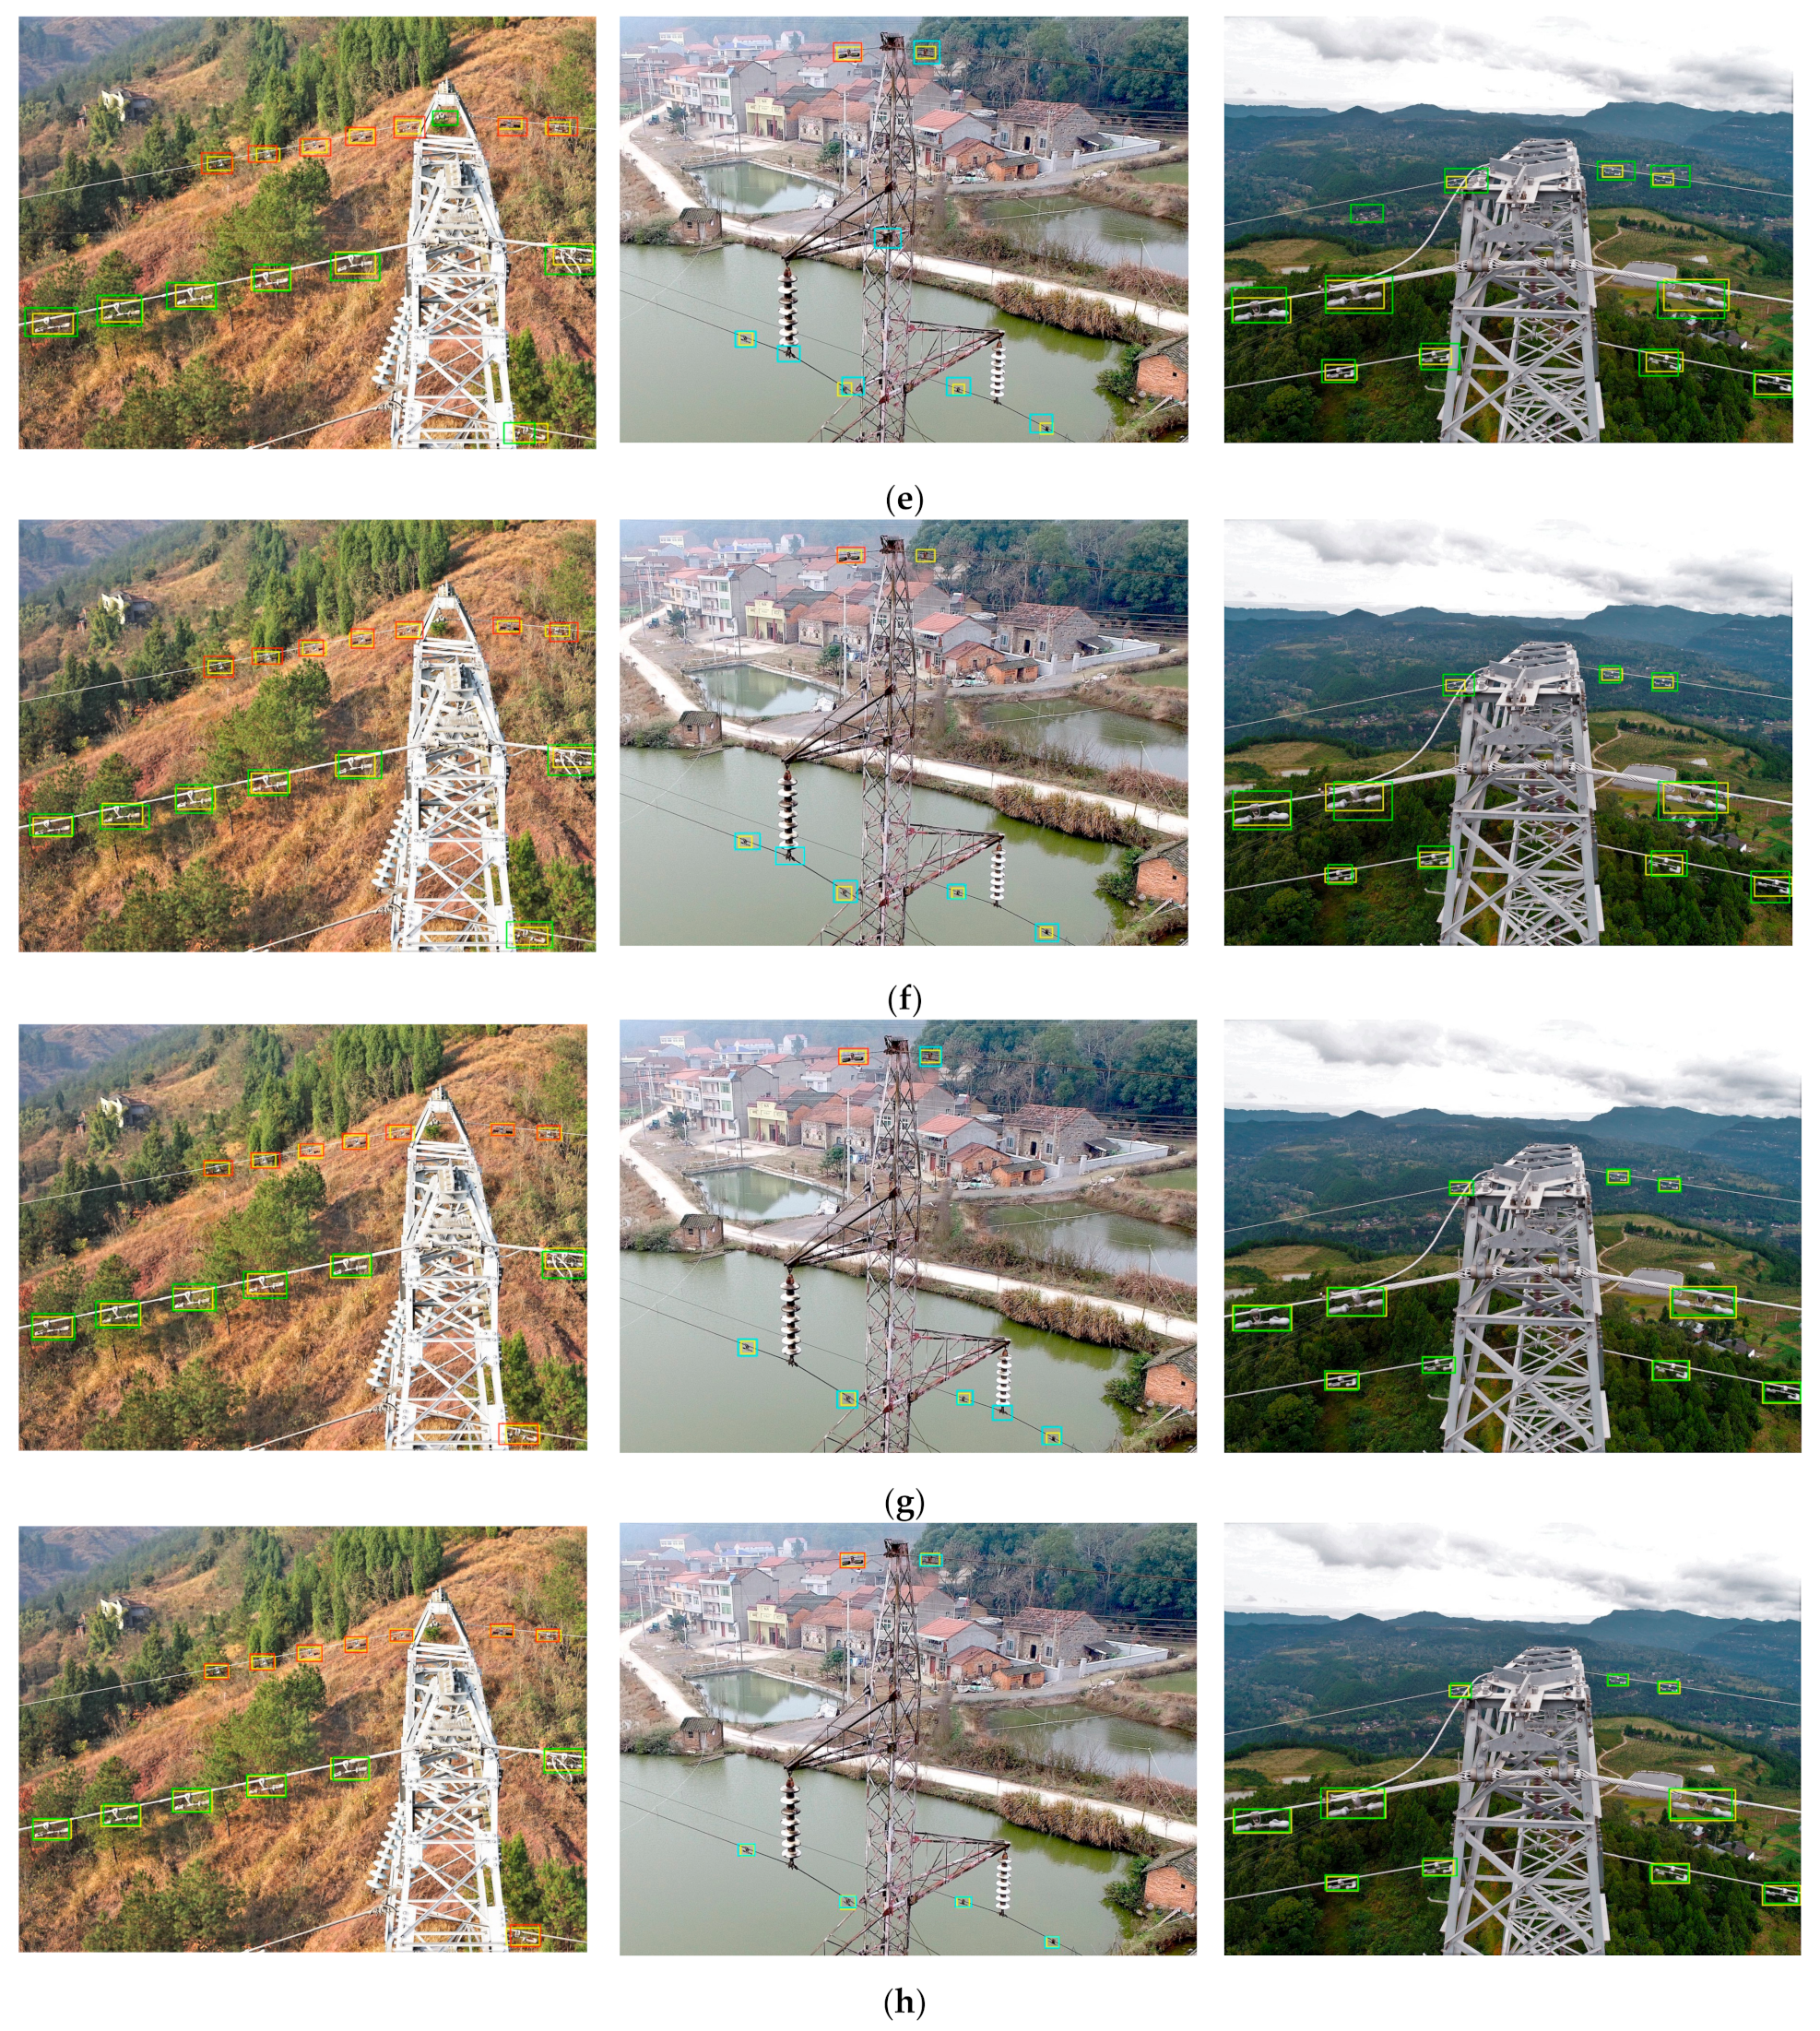
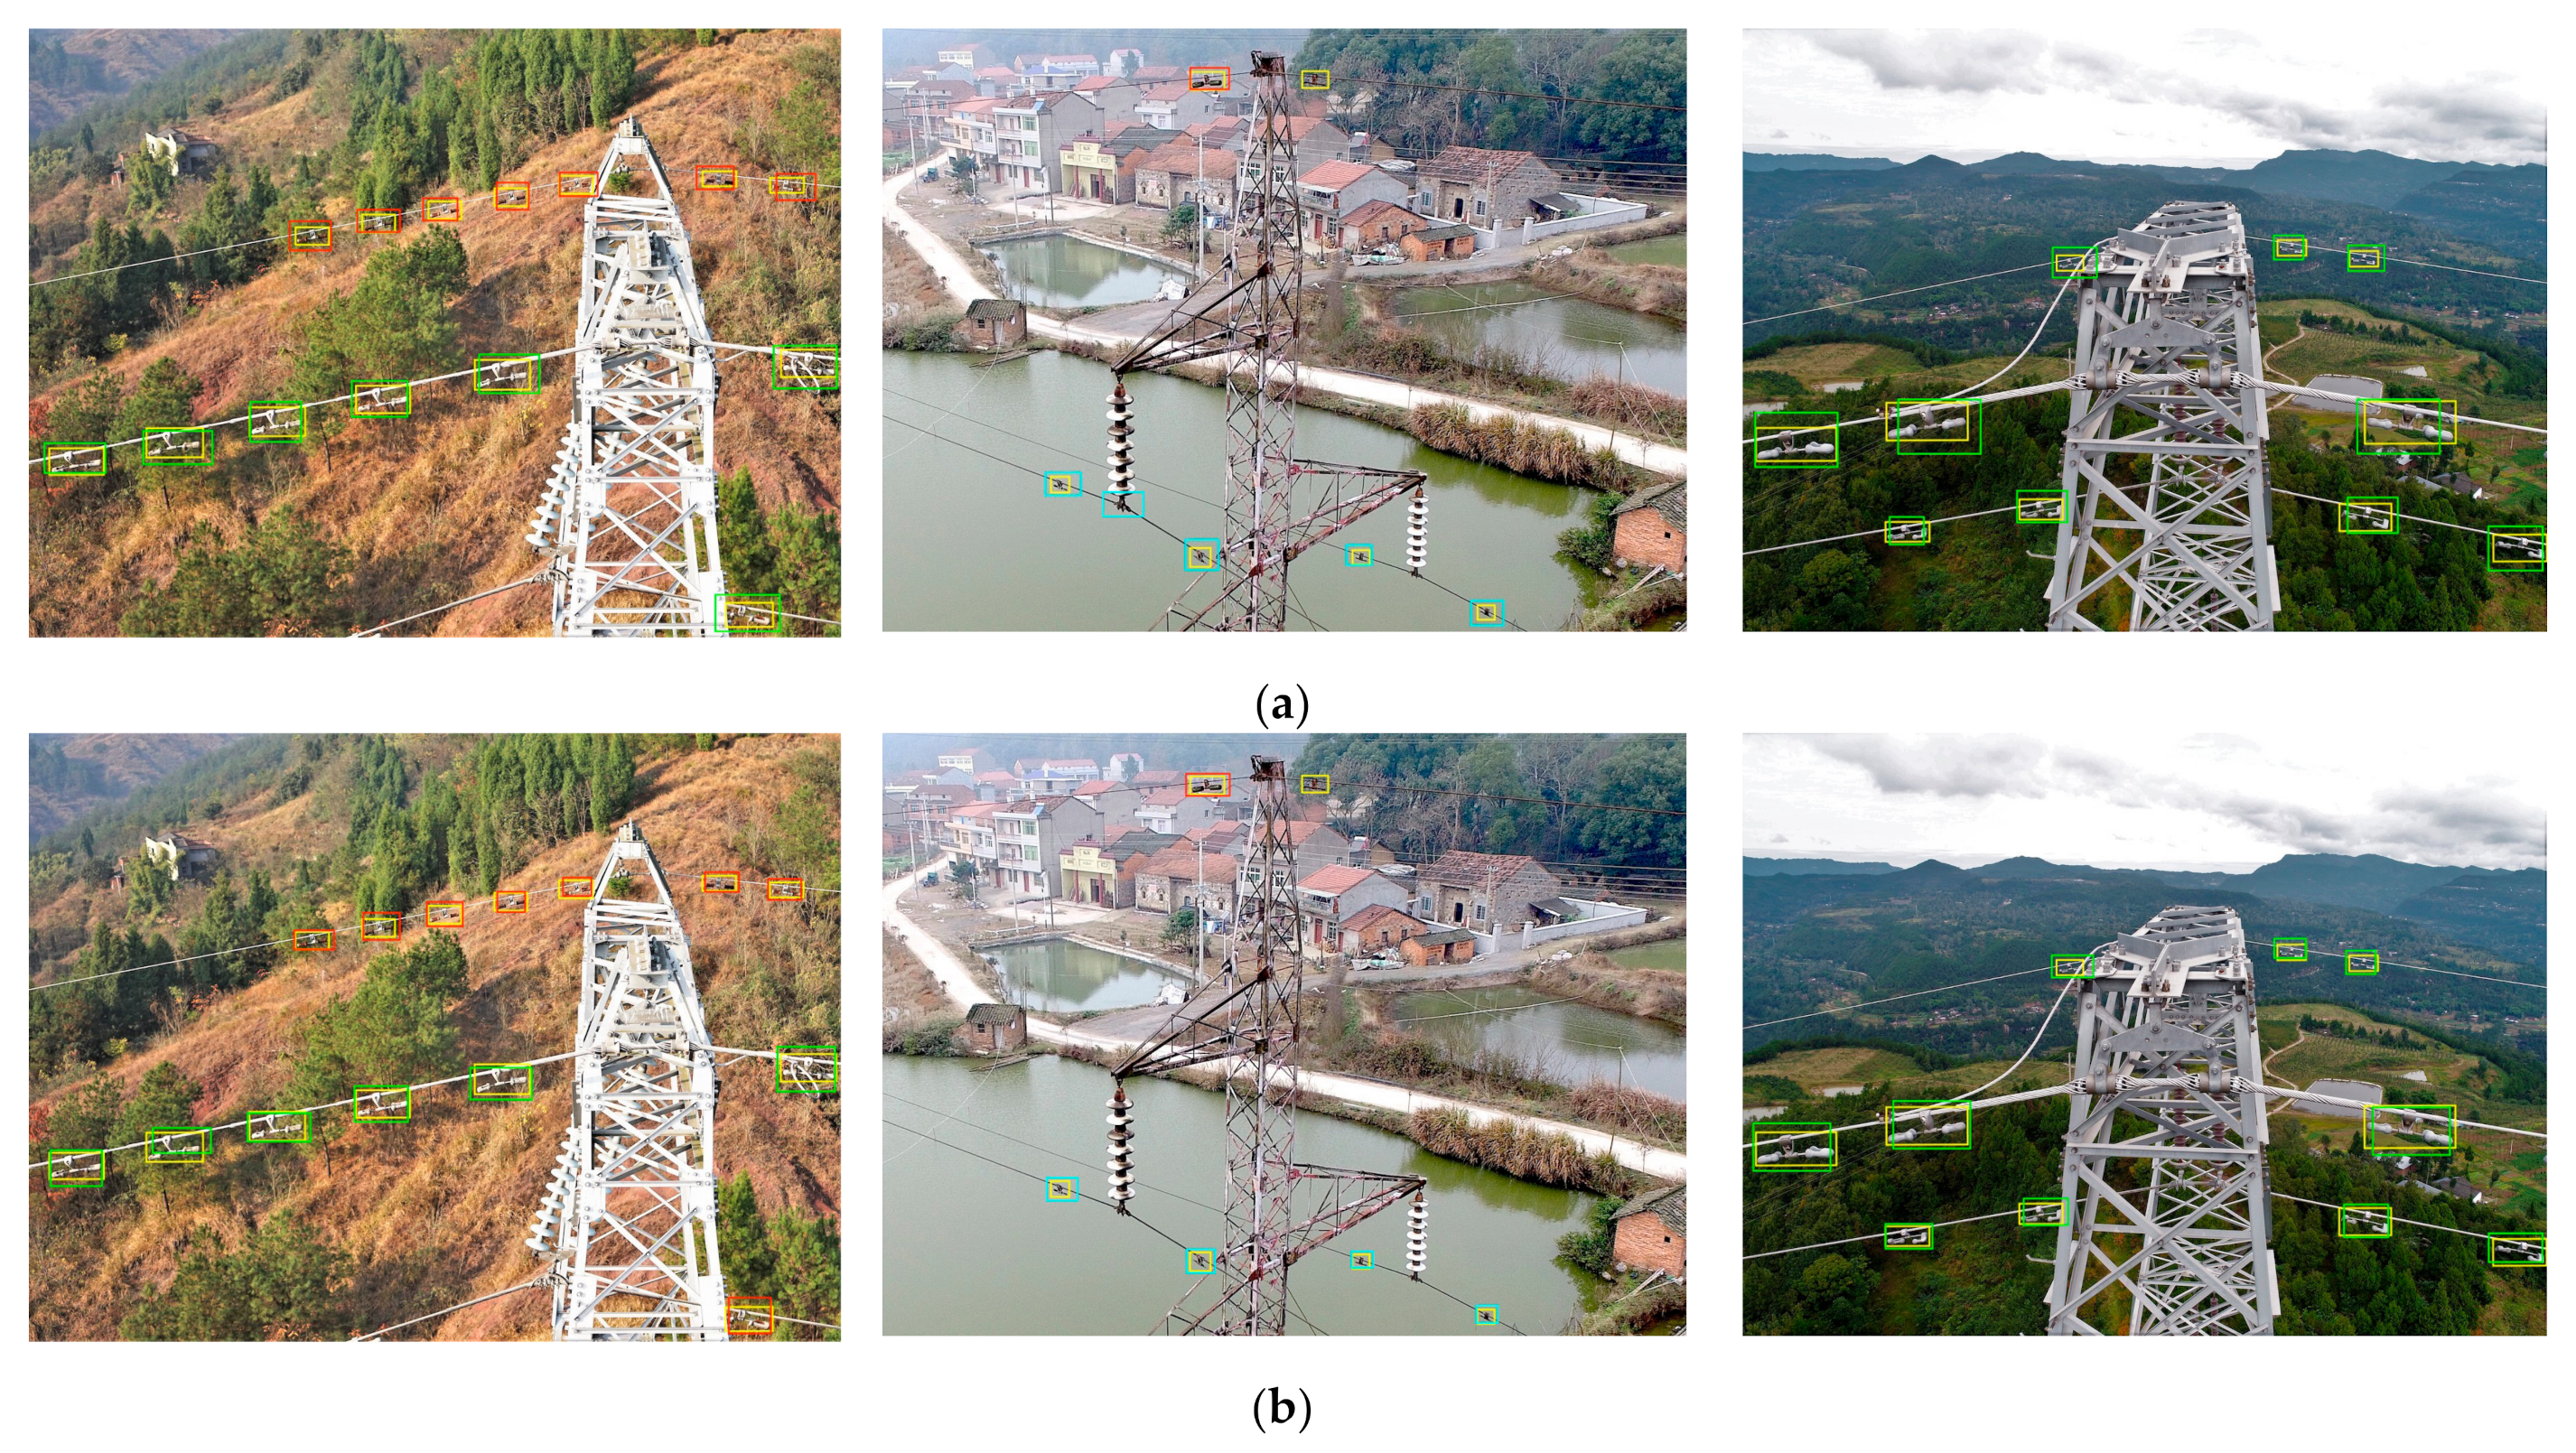
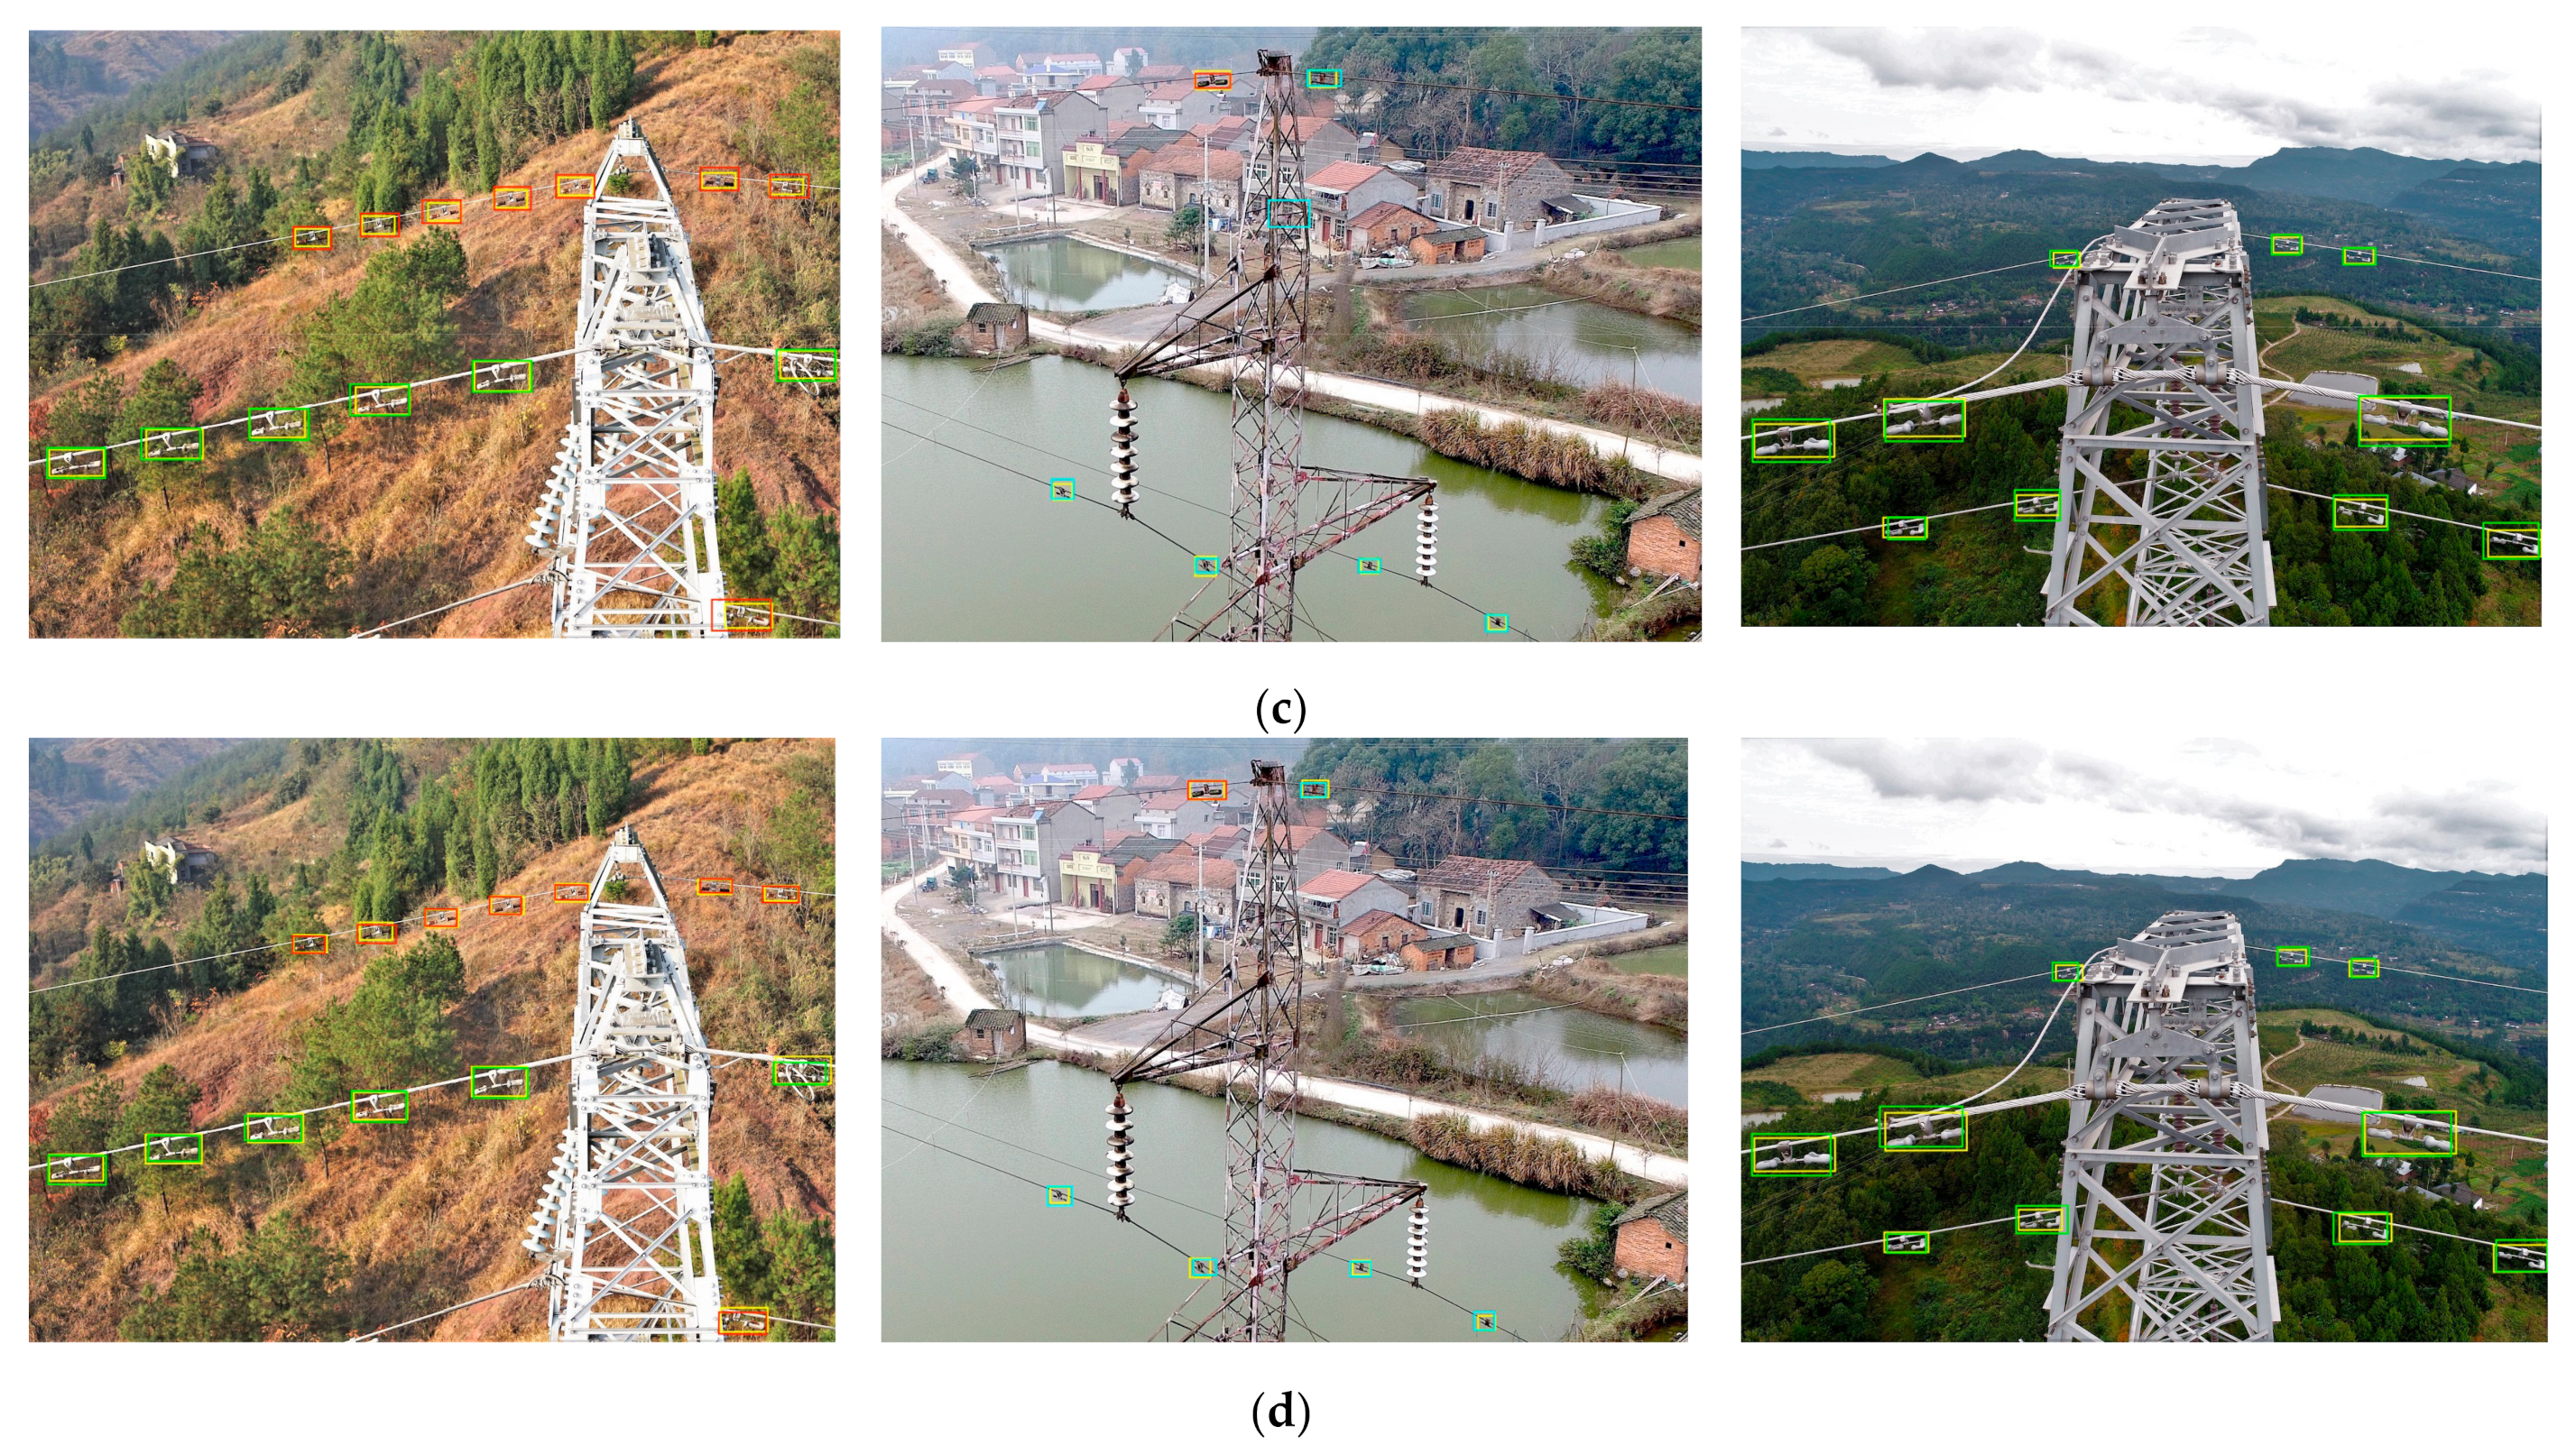
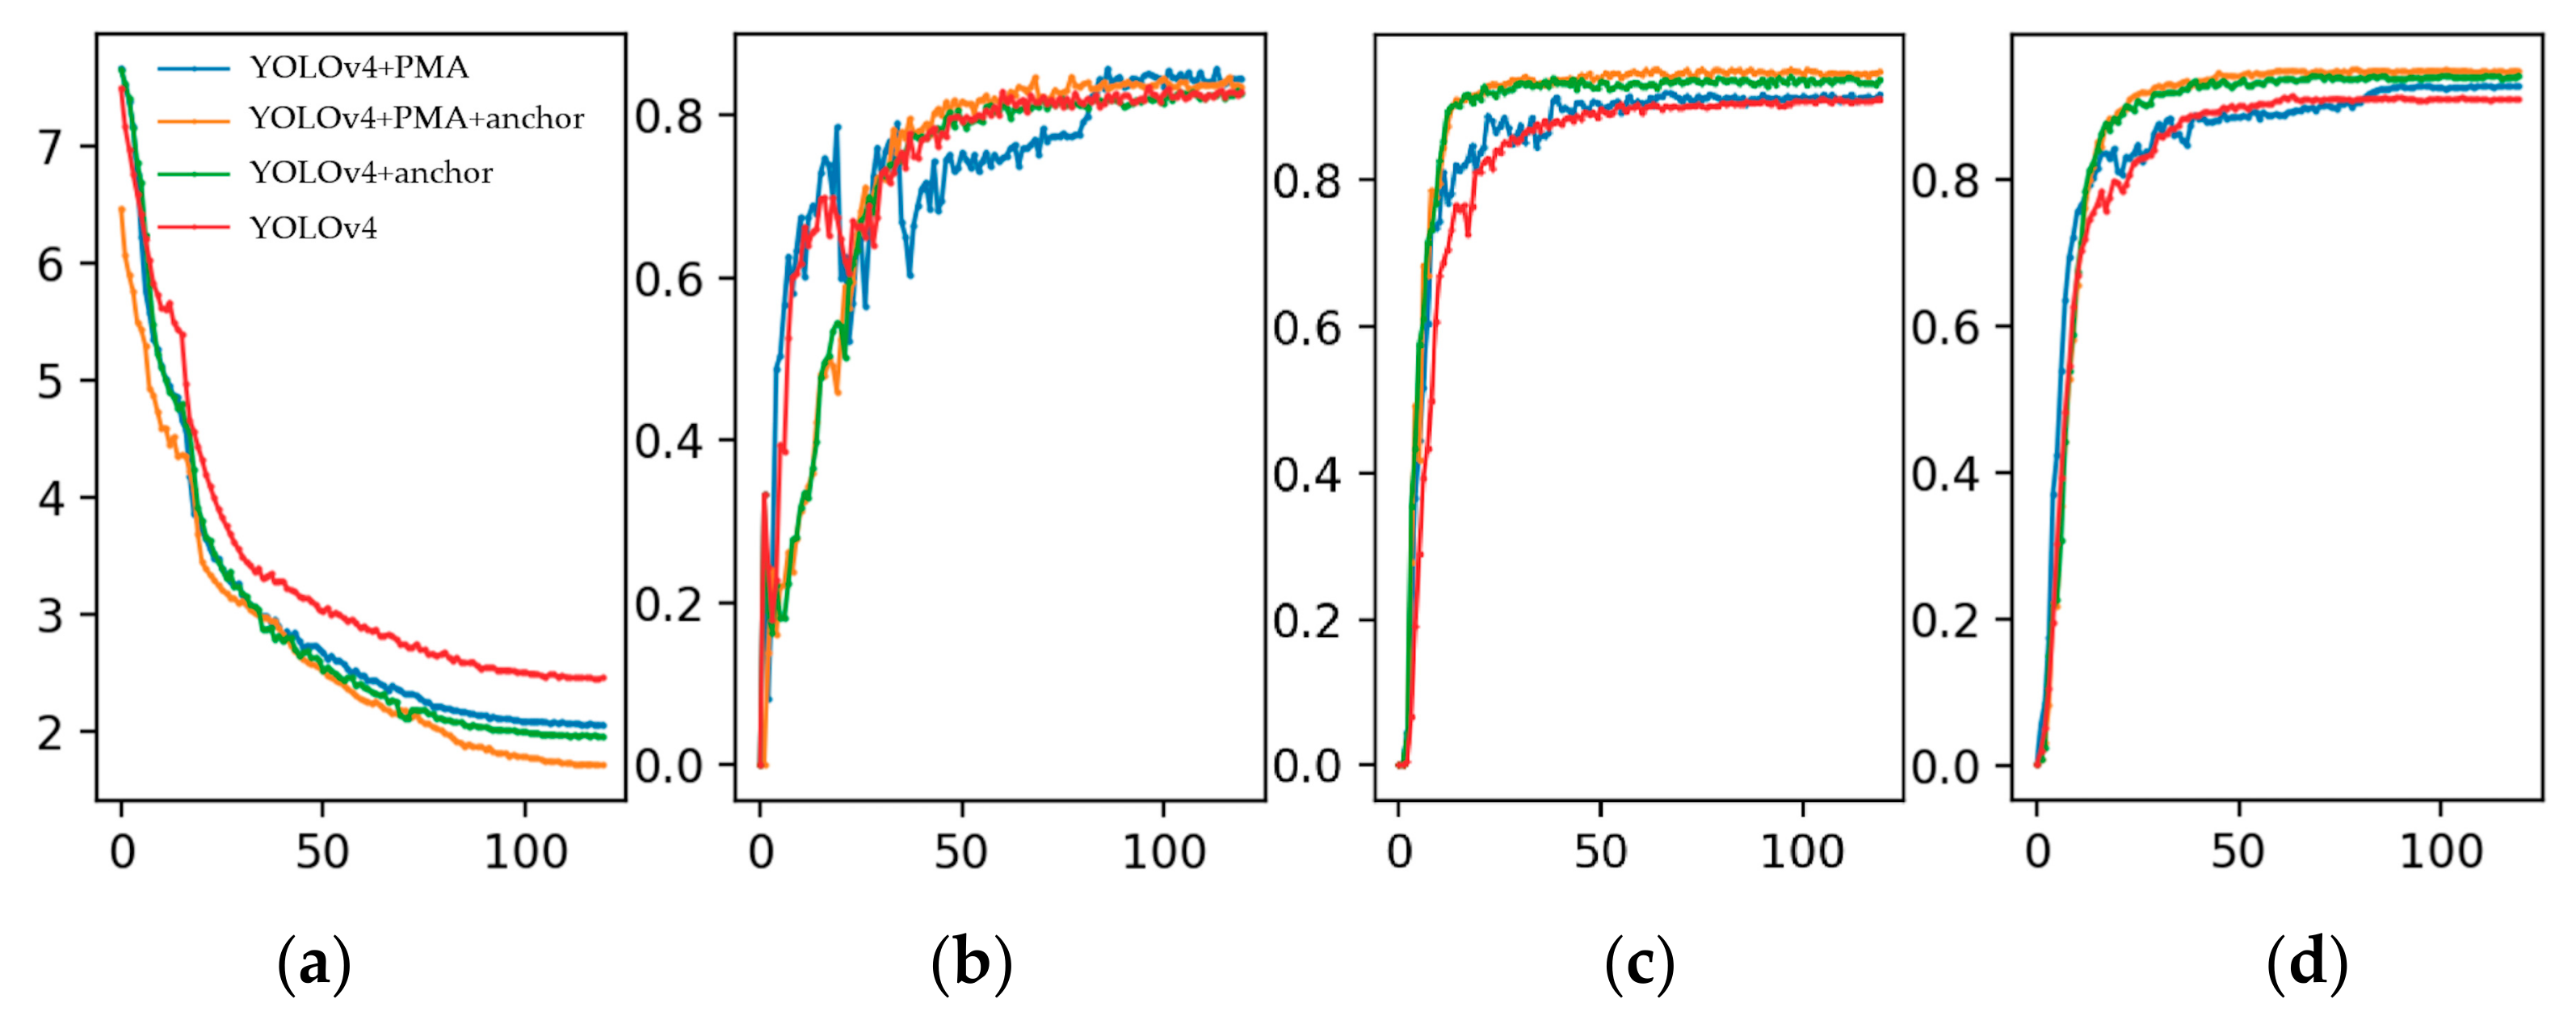
5.3. Results and Analysis

5.3.1. Comparison of Different Attention Modules

In this experiment, we compared the performance of networks that included different attention modules, and the results are shown in Table 5. It can be seen that compared with YOLOv4, there was no improvement in the m A P for the network that included a squeeze-and-excitation (SE) [43] module. Although the precision was improved by 1.2%, the recall showed a decrease of 0.6%. This means that for the detection of abnormal vibration dampers, the effect of enhancing the features only in the channel dimension was not ideal. The m A P for the network that included CBAM was slightly higher than for SE. CBAM was based on serially connected attention modules in the channel and spatial dimensions, which improves the m A P . Finally, compared with CBAM, our proposed PMA module performed better. Our module not only paid more attention to the abnormal regions by connecting channel and spatial dimensions in parallel but also made full use of the input feature map to retain a rich range of information. This improved the m A P by 0.5% compared with CBAM. Figure 18 shows a visualization of the results including different attention modules in the YOLOv4 model. It can be seen that compared with the SE and CBAM modules, the network can accurately classify some of the more difficult samples when the PMA module is included, as it can better grasp the details of the image from the channel and spatial dimensions and can focus on the more comprehensive and accurate features of abnormal vibration dampers.

5.3.2. Comparison of Different Training Strategies

In this experiment, we compared the performance of PMA-YOLO using three training strategies, which are without freezing parameters, freezing of the feature extraction module parameters and freezing of the feature extraction module, and the feature fusion module parameters. It can be seen from Figure 19, that the network without the multi-stage transfer learning strategy took the longest time to train, and the training time decreased gradually with an increase in the number of frozen layers. The reason for this is that when more layers are frozen, fewer layers need to be trained, and the corresponding computational parameters are therefore significantly reduced. In terms of detection results, when no parameters were frozen, the m A P for direct training was 93.8%, and this value gradually increased with an increase in the number of frozen layers. However, the value of the m A P for freezing of the feature extraction module was 0.1% higher than for freezing of both the feature extraction module and the feature fusion module. The reason for this is that in the latter case, the position of freezing was in the deep feature layers, and the learned features were therefore very abstract and unsuitable for transfer. The freezing position in the former case was shallow, meaning that the transfer effect was better and the m A P could reach the optimal value of 94.0%.

5.3.3. Comparison of Different Object Detection Networks

To further verify the effectiveness of the proposed network for the detection of abnormal vibration dampers, we compared our PMA-YOLO model with other object detection networks such as SSD [27], Faster R-CNN [25], RetinaNet [44], Cascade R-CNN [26], YOLOv3 [34], YOLOv4 [14], and YOLOv5x [45]. The results are shown in Table 6. In terms of the A P for all classes and the m A P , the proposed network was better than the other networks. On the basis of YOLOv3, YOLOv4 introduced numerous innovations. However, the structure of YOLOv5x was very similar to that of YOLOv4. Therefore, the performance of YOLOv4 and YOLOv5x were obviously better than YOLOv3. The A P for the “defective” class was lower than for the other two classes because the faults that can affect vibration dampers are variable and give irregular shapes. In addition, the sizes of vibration dampers after damage are reduced, which makes detection more difficult. Figure 20 shows a visualization of the test results for the different networks. Unlike in mainstream object detection networks, there was almost no offset between the detection boxes of the proposed network and the ground truth boxes, and our approach was able to accurately locate and classify all abnormal vibration dampers in the UAV remote sensing images.

6. Discussion

We used YOLOv4 as a baseline network and compared the detection performance for abnormal vibration dampers when the PMA module and new anchors were added. The results of an ablation experiment and a visualization of the test results are shown in Table 7 and Figure 21, respectively. It can be seen that the test results from YOLOv4 contain many missed detections and false detections. After adding the PMA module, the m A P improved by 1.6% and the precision by 0.9%. There was almost no false detection in Figure 21b, meaning that the PMA module effectively suppresses the complex background features, accurately extracting the critical features of abnormal vibration dampers, and reducing the false detection rate. Similarly, when the new anchors were used, both the m A P and recall rate improved by 3.3%. There were also virtually no missed detections in Figure 21c, meaning that for the detection of small abnormal vibration dampers, anchor optimization can improve the IOU during the prediction stage, thus reducing the number of missed detections. When these two modules are fused, the precision and recall reach 81.8% and 93.8%, respectively, and the m A P also improved by 3.5%. It can be seen from Figure 21d that the prediction boxes are closer to the ground truth boxes, indicating that the interaction of the two modules can effectively improve the classification and localization of abnormal vibration dampers in the YOLOv4 network.
To demonstrate the advantages of each improved module more clearly and intuitively, we compare the loss function and evaluation metric curves for each module during training. The results are shown in Figure 22. It can be seen from the graph that compared with YOLOv4, the additions of the PMA module and the new anchors were both helpful in terms of reducing the loss and accelerating the convergence of the network. These two operations also improved the precision and recall, respectively. Although the precision rate curve fluctuated in the initial stage of training, it stabilized in the latter stages.

7. Conclusions

In recent years, as an indispensable component, the vibration damper plays an important role in ensuring the safe operation of power systems. Due to the enormous variations in the appearances of vibration dampers caused by scale, viewpoint, color, and cluttered backgrounds, this leads to increases in the computational cost of developing an effective abnormal vibration dampers detection network, which then becomes a challenging problem. In this paper, we combined a PMA module and K-means clustering method for anchors with a multi-stage transfer learning strategy to optimize the YOLOv4 network. Finally, we proposed our PMA-YOLO network for the detection of abnormal vibration dampers.
The findings of this paper can be summarized as follows:
  • We screened UAV remote sensing images containing various vibration dampers to construct a data set of abnormal vibration dampers called DAVD. To improve the generalizability of the network and to avoid overfitting, we applied several pre-processing methods.
  • Our PMA module was integrated into the YOLOv4 network. This combined a channel attention module and a spatial attention module with the convolution results of the input feature map in parallel, meaning that the network was able to pay more attention to critical features.
  • Based on the characteristics of the numerous, small, abnormal vibration dampers in DAVD, we used the K-means algorithm to re-cluster a new set of anchors that were more suitable for the abnormal vibration dampers, thus reducing the probability of missed detection.
  • Finally, we introduced a multi-stage transfer learning strategy to train the PMA-YOLO network and used different freezing positions to carry out comparison experiments, to improve the training efficiency of the network and avoid overfitting.
Our experimental results show that the m A P @ 0.5 for our PMA-YOLO network reached 93.8% on the test set, a value 3.5% higher than for the basic YOLOv4 model. The performance was improved by a further 0.2% when the multi-stage transfer learning strategy was applied.
In this paper, a data set of abnormal vibration dampers called DAVD was created, which contains rusty, defective, and normal vibration dampers on transmission lines in UAV images. Several image preprocessing methods were applied to improve the quality and contrast of the images. And the data augmentation method was used to advance the generalizability of the network and to avoid overfitting. Then the PMA-YOLO network was developed to accurately detect the abnormal vibration dampers. In the network, the K-means algorithm re-clustered a new set of anchors that are more suitable for the abnormal vibration dampers, which are relatively small and sparsely distributed. The PMA module combined channel and spatial attention in parallel was integrated into the network, which paid attention to important features of abnormal vibration dampers while reducing the influence of complex backgrounds in the images. Moreover, to improve the training efficiency and avoid overfitting, a multi-stage transfer learning strategy was introduced to train the PMA-YOLO network. The experimental results show that the m A P @ 0.5 for our PMA-YOLO network reached 93.8% on the test set, a value 3.5% higher than for the basic YOLOv4 network. The performance improved by a further 0.2% when the multi-stage transfer learning strategy was applied.
However, the PMA-YOLO network involved slightly higher numbers of parameters and were more computational when the proposed attention module was embedded. In future work, we will focus on introducing network compression methods, such as pruning and quantization, to improve detection speed while maintaining detection accuracy. Furthermore, we will continue to collect UAV images of defective vibration hammers in future inspections, and we will further study data augmentation methods to increase data diversity.

Author Contributions

Conceptualization, Y.R.; Data curation, W.B. and N.W.; Formal analysis, W.B. and Y.R.; investigation, N.W. and X.Y.; methodology, Y.R., W.B. and G.H.; resources, W.B., N.W. and X.Y.; supervision, W.B. and N.W.; validation, Y.R. and G.H.; Writing—original draft, Y.R.; Writing—review and editing, W.B., Y.R., N.W. and G.H. All authors have read and agreed to the published version of the manuscript.

Funding

This research was funded by the National Key Research and Development Program of China (grant number 2020YFF0303803), and the National Natural Science Foundation of China (grant number 61672032).

Institutional Review Board Statement

Not applicable.

Informed Consent Statement

Not applicable.

Data Availability Statement

The DAVD data set can be downloaded from: https://github.com/RnYngxx/DAVD (accessed on 29 September 2021).

Acknowledgments

The authors sincerely thank the anonymous reviewers for their critical comments and suggestions for improving the manuscript.

Conflicts of Interest

The authors declare no conflict of interest.

References

  1. Sadykova, D.; Pernebayeva, D.; Bagheri, M.; James, A. IN-YOLO: Real-time detection of outdoor high voltage insulators using UAV imaging. IEEE Trans. Power Deliv. 2019, 35, 1599–1601. [Google Scholar] [CrossRef]
  2. Liang, H.; Zuo, C.; Wei, W. Detection and evaluation method of transmission line defects based on deep learning. IEEE Access 2020, 8, 38448–38458. [Google Scholar] [CrossRef]
  3. Siddiqui, Z.A.; Park, U. A drone based transmission line components inspection system with deep learning technique. Energies 2020, 13, 3348. [Google Scholar] [CrossRef]
  4. Jiang, S.; Jiang, W.; Huang, W.; Yang, L. UAV-based oblique photogrammetry for outdoor data acquisition and offsite visual inspection of transmission line. Remote Sens. 2017, 9, 278. [Google Scholar] [CrossRef] [Green Version]
  5. Liu, X.; Lin, Y.; Jiang, H.; Miao, X.; Chen, J. Slippage fault diagnosis of dampers for transmission lines based on faster R-CNN and distance constraint. Electr. Power Syst. Res. 2021, 199, 107449. [Google Scholar] [CrossRef]
  6. Yang, H.; Guo, T.; Shen, P.; Chen, F.; Wang, W.; Liu, X. Anti-vibration hammer detection in UAV image. In Proceedings of the 2017 2nd International Conference on Power and Renewable Energy (ICPRE), Chengdu, China, 20–23 September 2017; pp. 204–207. [Google Scholar] [CrossRef]
  7. Du, C.; van der Sar, T.; Zhou, T.X.; Upadhyaya, P.; Casola, F.; Zhang, H.; Onbasli, M.C.; Ross, C.A.; Walsworth, R.L.; Tserkovnyak, Y.; et al. Control and local measurement of the spin chemical potential in a magnetic insulator. Science 2017, 357, 195–198. [Google Scholar] [CrossRef] [Green Version]
  8. Jenssen, R.; Roverso, D. Automatic autonomous vision-based power line inspection: A review of current status and the potential role of deep learning. Int. J. Electr. Power Energy Syst. 2018, 99, 107–120. [Google Scholar] [CrossRef] [Green Version]
  9. Kraft, M.; Piechocki, M.; Ptak, B.; Walas, K. Autonomous, onboard vision-based trash and litter detection in low altitude aerial images collected by an unmanned aerial vehicle. Remote Sens. 2021, 13, 965. [Google Scholar] [CrossRef]
  10. Lee, S.; Song, Y.; Kil, S.-H. Feasibility analyses of real-time detection of wildlife using UAV-derived thermal and rgb images. Remote Sens. 2021, 13, 2169. [Google Scholar] [CrossRef]
  11. Zhang, R.; Yang, B.; Xiao, W.; Liang, F.; Liu, Y.; Wang, Z. Automatic extraction of high-voltage power transmission objects from UAV lidar point clouds. Remote Sens. 2019, 11, 2600. [Google Scholar] [CrossRef] [Green Version]
  12. Zhang, Y.; Yuan, X.; Li, W.; Chen, S. Automatic power line inspection using UAV images. Remote Sens. 2017, 9, 824. [Google Scholar] [CrossRef] [Green Version]
  13. Mirallès, F.; Pouliot, N.; Montambault, S. State-of-the-art review of computer vision for the management of power transmission lines. In Proceedings of the 2014 3rd International Conference on Applied Robotics for the Power Industry (CARPI), Foz do Iguacu, Brazil, 14–16 October 2014; pp. 1–6. [Google Scholar] [CrossRef]
  14. Bochkovskiy, A.; Wang, C.-Y.; Liao, H.-J.M. YOLOv4 optimal speed and accuracy of object detection. arXiv 2020, arXiv:2004.10934. [Google Scholar]
  15. Li, W.; Ye, G.; Feng, H.; Wang, S.; Chang, W. Recognition of insulator based on developed MPEG-7 texture feature. In Proceedings of the 2010 3rd International Congress on Image and Signal Processing (CISP), Yantai, China, 16–18 October 2010; pp. 265–268. [Google Scholar] [CrossRef]
  16. Wu, H.; Xi, Y.; Fang, W.; Sun, X.; Jiang, L. Damper detection in helicopter inspection of power transmission line. In Proceedings of the 2014 4th International Conference on Instrumentation and Measurement, Computer, Communication and Control (IMCCC), Harbin, China, 18–20 September 2014; pp. 628–632. [Google Scholar] [CrossRef]
  17. Huang, X.; Zhang, X.; Zhang, Y.; Zhao, L. A method of identifying rust status of dampers based on image processing. IEEE Trans. Instrum. Meas. 2020, 69, 5407–5417. [Google Scholar] [CrossRef]
  18. Sravanthi, R.; Sarma, A.S.V. Efficient image-based object detection for floating weed collection with low cost unmanned floating vehicles. Soft Comput. 2021, 25, 13093–13101. [Google Scholar] [CrossRef]
  19. Hou, J.; Li, B. Swimming target detection and tracking technology in video image processing. Microprocess. Microsyst. 2021, 80, 103535. [Google Scholar] [CrossRef]
  20. Yang, L.; Fan, J.; Liu, Y.; Li, E.; Peng, J.; Liang, Z. A review on state-of-the-art power line inspection techniques. IEEE Trans. Instrum. Meas. 2020, 69, 9350–9365. [Google Scholar] [CrossRef]
  21. Jabid, T.; Uddin, M.Z. Rotation invariant power line insulator detection using local directional pattern and support vector machine. In Proceedings of the 2016 International Conference on Innovations in Science, Engineering and Technology (ICISET), Dhaka, Bangladesh, 28–29 October 2016; pp. 1–4. [Google Scholar] [CrossRef]
  22. Dan, Z.; Hong, H.; Qian, R. An insulator defect detection algorithm based on computer vision. In Proceedings of the 2017 IEEE International Conference on Information and Automation (ICIA), Macao, China, 18–20 July 2017; pp. 361–365. [Google Scholar] [CrossRef]
  23. Krummenacher, G.; Ong, C.S.; Koller, S.; Kobayashi, S.; Buhmann, J.M. Wheel defect detection with machine learning. IEEE Trans. Intell. Transp. Syst. 2017, 19, 1176–1187. [Google Scholar] [CrossRef]
  24. Wen, Q.; Luo, Z.; Chen, R.; Yang, Y.; Li, G. Deep learning approaches on defect detection in high resolution aerial images of insulators. Sensors 2021, 21, 1033. [Google Scholar] [CrossRef]
  25. Ren, S.; He, K.; Girshick, R.; Sun, J. Faster R-CNN: Towards real-time object detection with region proposal networks. IEEE Trans. Pattern Anal. Mach. Intell. 2017, 39, 1137–1149. [Google Scholar] [CrossRef] [Green Version]
  26. Cai, Z.; Vasconcelos, N. Cascade R-CNN: Delving into high quality object detection. In Proceedings of the 2018 IEEE/CVF Conference on Computer Vision and Pattern Recognition (CVPR), Salt Lake City, UT, USA, 18–23 June 2018; pp. 6154–6162. [Google Scholar] [CrossRef] [Green Version]
  27. Liu, W.; Anguelov, D.; Erhan, D.; Szegedy, C.; Reed, S.; Fu, C.Y.; Berg, A.C. SSD: Single shot multibox detector. arXiv 2015, arXiv:1512.02325. [Google Scholar]
  28. Nguyen, V.N.; Jenssen, R.; Roverso, D. Intelligent monitoring and inspection of power line components powered by UAVs and deep learning. IEEE Power Energy Technol. Syst. J. 2019, 6, 11–21. [Google Scholar] [CrossRef]
  29. Ji, Z.; Liao, Y.; Zheng, L.; Wu, L.; Yu, M.; Feng, Y. An assembled detector based on geometrical constraint for power component recognition. Sensors 2019, 19, 3517. [Google Scholar] [CrossRef] [Green Version]
  30. Chen, H.; He, Z.; Shi, B.; Zhong, T. Research on recognition method of electrical components based on YOLO V3. IEEE Access 2019, 7, 157818–157829. [Google Scholar] [CrossRef]
  31. Liu, B.; Wang, X.; Jin, W.; Chen, Y.; Liu, C. Infrared image detail enhancement based on local adaptive gamma correction. Chin. Opt. Lett. 2012, 10, 25–29. [Google Scholar]
  32. Rahman, Z.; Jobson, D.; Woodell, G. Multi-scale retinex for color image enhancement. In Proceedings of the 3rd IEEE International Conference on Image Processing (ICIP), Lausanne, Switzerland, 19 September 1996; pp. 1003–1006. [Google Scholar] [CrossRef]
  33. Everingham, M.; Van Gool, L.; Williams, C.K.; Winn, J.; Zisserman, A. The pascal Visual Object Classes (VOC) challenge. Int. J. Comput. Vis. 2010, 88, 303–338. [Google Scholar] [CrossRef] [Green Version]
  34. Redmon, J.; Farhadi, A. YOLOv3: An incremental improvement. arXiv 2018, arXiv:1804.02767. [Google Scholar]
  35. Wang, C.-Y.; Liao, H.-Y.M.; Wu, Y.-H.; Chen, P.-Y.; Hsieh, J.-W.; Yeh, I.-H. CSPNet: A New backbone that can enhance learning capability of CNN. In Proceedings of the 2020 IEEE/CVF Conference on Computer Vision and Pattern Recognition Workshops (CVPRW), Seattle, WA, USA, 14–19 June 2020; pp. 1571–1580. [Google Scholar] [CrossRef]
  36. He, K.; Zhang, X.; Ren, S.; Sun, J. Spatial pyramid pooling in deep convolutional networks for visual recognition. IEEE Trans. Pattern Anal. Mach. Intell. 2015, 37, 1904–1916. [Google Scholar] [CrossRef] [Green Version]
  37. Liu, S.; Qi, L.; Qin, H.; Shi, J.; Jia, J. Path aggregation network for instance segmentation. In Proceedings of the 2018 IEEE/CVF Conference on Computer Vision and Pattern Recognition (CVPR), Salt Lake City, UT, USA, 18–23 June 2018; pp. 8759–8768. [Google Scholar] [CrossRef] [Green Version]
  38. Lin, T.Y.; Dollar, P.; Girshick, R.; He, K.; Hariharan, B.; Belongie, S. Feature pyramid networks for object detection. In Proceedings of the 2017 IEEE Conference on Computer Vision and Pattern Recognition (CVPR), Honolulu, HI, USA, 21–26 July 2017. [Google Scholar] [CrossRef] [Green Version]
  39. Woo, S.; Park, J.; Lee, J.; Kweon, I.S. CBAM: Convolutional block attention module. In Proceedings of the 2018 European Conference on Computer Vision (ECCV), Munich, Germany, 8–14 September 2018; pp. 3–19. [Google Scholar] [CrossRef] [Green Version]
  40. Selvaraju, R.R.; Cogswell, M.; Das, A.; Vedantam, R.; Parikh, D.; Batra, D. Grad-CAM: Visual Explanations from Deep Networks via Gradient-Based Localization. In Proceedings of the 2017 IEEE International Conference on Computer Vision (ICCV), Venice, Italy, 22–29 October 2017; pp. 618–626. [Google Scholar] [CrossRef] [Green Version]
  41. Zheng, Z.; Wang, P.; Liu, W.; Ye, R.; Ren, D. Distance-IoU Loss: Faster and better learning for bounding box regression. arXiv 2019, arXiv:1911.08287. [Google Scholar]
  42. Yosinski, J.; Clune, J.; Bengio, Y.; Lipson, H. How transferable are features in deep neural networks? In Proceedings of the 28th Conference on Neural Information Processing Systems (NIPS), Montreal, QC, Canada, 8–13 December 2014; pp. 3320–3328. [Google Scholar]
  43. Hu, J.; Sun, G.; Albanie, S.; Wu, E. Squeeze-and-excitation networks. IEEE Trans. Pattern Anal. Mach. Intell. 2019, 42, 2011–2023. [Google Scholar] [CrossRef] [Green Version]
  44. Lin, T.; Goyal, P.; Girshick, R.; He, K.; Dollár, P. Focal loss for dense object detection. In Proceedings of the 2017 IEEE International Conference on Computer Vision (ICCV), Venice, Italy, 22–29 October 2017; pp. 2999–3007. [Google Scholar] [CrossRef] [Green Version]
  45. Ultralytics. Yolov5. Available online: https://github.com/ultralytics/yolov5 (accessed on 22 September 2021).
Figure 1. (a) Phantom 4 Pro V2.0 UAV; (b) Acquisition of inspection data by the UAV.
Remotesensing 13 04134 g001
Figure 2. Four common types of vibration dampers: (a) FD; (b) FDZ; (c) FDY; (d) FFH.
Remotesensing 13 04134 g002
Figure 3. Three common states of vibration dampers: (a) rusty; (b) defective; (c) normal.
Remotesensing 13 04134 g003
Figure 4. Different types of complex backgrounds in UAV remote sensing images: (a) mountainous area; (b) forest; (c) fields; (d) residential area.
Remotesensing 13 04134 g004
Figure 5. Different background contexts, sizes, and classes of vibration dampers in images: (a) and (b) containing sky, buildings, transmission towers, and trees; (c) containing small and large objects; (d) containing two classes of vibration dampers: “defective” and “rusty”.
Remotesensing 13 04134 g005aRemotesensing 13 04134 g005b
Figure 6. Examples of preprocessed UAV remote sensing images: (a) original image; (b) gamma correction and MSR; (c) horizontal flip; (d) 15° rotation.
Remotesensing 13 04134 g006
Figure 7. Examples of annotated UAV remote sensing images: (a) containing “rusty” and “defective” dampers; (b) containing “normal” dampers.
Remotesensing 13 04134 g007
Figure 8. The architecture of the Original YOLOv4 [14] network.
Remotesensing 13 04134 g008
Figure 9. Overall architecture of the PMA-YOLO network.
Remotesensing 13 04134 g009
Figure 10. Architecture of the PMA-YOLO network.
Remotesensing 13 04134 g010
Figure 11. Architecture of CBAM.
Remotesensing 13 04134 g011
Figure 12. Architecture of the PMA module.
Remotesensing 13 04134 g012
Figure 13. Grad-CAM results from YOLOv4 combined with different attention modules: (a) original image; (b) CBAM; (c) PMA.
Remotesensing 13 04134 g013
Figure 14. Architecture of the prediction branch.
Remotesensing 13 04134 g014
Figure 15. Scale and aspect ratio distribution of all targets in DAVD: (a) distribution of widths; (b) distribution of heights; (c) distribution of aspect ratios (height/ width).
Remotesensing 13 04134 g015
Figure 16. Our multi-stage transfer learning strategy.
Remotesensing 13 04134 g016
Figure 17. Schematic framework of our abnormal vibration damper detection network.
Remotesensing 13 04134 g017
Figure 18. Visualization of the test results from combining different attention modules with YOLOv4: (a) YOLOv4; (b) YOLOv4 + SE; (c) YOLOv4 + CBAM; (d) YOLOv4 + PMA. The ground truth boxes and prediction boxes for “rusty”, “defective”, and “normal” dampers are shown in yellow, red, blue, and green, respectively.
Remotesensing 13 04134 g018
Figure 19. The results of multi-stage transfer learning strategy.
Remotesensing 13 04134 g019
Figure 20. Visualization of the test results for the mainstream object detection networks: (a) SSD512; (b) Faster R-CNN + FPN; (c) RetinaNet; (d) Cascade R-CNN+; (e) YOLOv3; (f) YOLOv4; (g) YOLOv5x; (h) PMA-YOLO. The ground truth boxes and the prediction boxes for “rusty”, “defective”, and “normal” dampers are shown in yellow, red, blue, and green, respectively.
Remotesensing 13 04134 g020aRemotesensing 13 04134 g020b
Figure 21. Visualization of test results from combining different modules with YOLOv4: (a) YOLOv4; (b) YOLOv4 + PMA; (c) YOLOv4 + anchors; (d) YOLOv4 + PMA + anchors. The ground truth boxes and prediction boxes for “rusty”, “defective”, and “normal” dampers are shown in yellow, red, blue, and green, respectively.
Remotesensing 13 04134 g021aRemotesensing 13 04134 g021b
Figure 22. Graphs of the loss function and evaluation metrics during training: (a) loss function; (b) precision; (c) recall; (d) m A P .
Remotesensing 13 04134 g022
Table 1. Sample distribution for different classes in DAVD.
ClassesTraining SetTest Set
ImagesObjectsImagesObjects
Rusty6413872160957
Defective208112250276
Normal6863766175964
Total144887603622197
Table 2. Size of the anchors.
Prediction BranchFeature MapAnchors
1 (large) 19 × 19 52 × 25
78 × 33
117 × 57
2 (medium) 38 × 38 38 × 17
38 × 20
47 × 19
3 (small) 76 × 76 21 × 10
27 × 13
28 × 18
Table 3. Configuration of the experimental environment.
PlatformConfiguration
Operating systemUbuntu18.04 LTS 64-bits
CPUIntel(R) Core (TM) i7-9700
GPUNVIDIA GeForce RTX 2080Ti
GPU acceleratorCUDA 10.1 and cuDNN 7.6.5
Deep learning framePyTorch1.5
CompilersPyCharm and Anaconda
Scripting languagePython 3.7
Table 4. Experimental parameters.
ParametersConfiguration
Input size 416 × 416 × 3
Optimization algorithmSGD
Batch size8
Training epochs120
Learning rate0.01
Momentum0.937
Weight decay0.0005
Table 5. Detection results from adding different attention modules to YOLOv4.
NetworkP (%)R (%)mAP@0.5 (%)
YOLOv479.190.090.3
YOLOv4 + SE80.389.490.3
YOLOv4 + CBAM80.990.591.4
YOLOv4 + PMA81.090.891.9
Table 6. Detection results for some mainstream object detection networks.
NetworkRusty (AP)Defective (AP)Normal (AP)mAP@0.5 (%)
SSD51286.974.784.982.1
Faster R-CNN + FPN89.777.288.785.2
RetinaNet87.184.387.086.2
Cascade R-CNN+ 191.690.991.191.2
YOLOv388.678.986.784.7
YOLOv493.487.690.090.3
YOLOv5x94.890.594.293.2
Ours96.492.393.294.0
1 Cascade R-CNN+: Cascade R-CNN + ResNet101-SE + FPN + Focal loss.
Table 7. Detection results from adding different modules to YOLOv4.
BaselinePMAAnchorsP (%)R (%)mAP@0.5 (%)
YOLOv4××79.190.090.3
×81.090.891.9
×78.493.393.6
81.893.893.8
Publisher’s Note: MDPI stays neutral with regard to jurisdictional claims in published maps and institutional affiliations.

