Article

Estimating Vertical Distribution of Leaf Water Content within Wheat Canopies after Head Emergence

1
Key Laboratory of Quantitative Remote Sensing Information Technology, Aerospace Information Research Institute, Chinese Academy of Sciences, Beijing 100094, China
2
Key Laboratory of Digital Earth Science, Aerospace Information Research Institute, Chinese Academy of Sciences, Beijing 100094, China
3
College of Life Information Science and Instrument Engineering, Hangzhou Dianzi University, Hangzhou 310018, China
4
Department of Agriculture, Forests, Nature and Energy (DAFNE), Università della Tuscia, Via San Camillo de Lellis, 01100 Viterbo, Italy
*
Author to whom correspondence should be addressed.
Remote Sens. 2021, 13(20), 4125; https://doi.org/10.3390/rs13204125
Submission received: 2 September 2021 / Revised: 10 October 2021 / Accepted: 13 October 2021 / Published: 14 October 2021

Abstract

:
Monitoring vertical profile of leaf water content (LWC) within wheat canopies after head emergence is vital significant for increasing crop yield. However, the estimation of vertical distribution of LWC from remote sensing data is still challenging due to the effects of wheat spikes and the efficacy of sensor measurement from the nadir direction. Using two-year field experiments with different growth stages after head emergence, N rates, wheat cultivars, we investigated the vertical distribution of LWC within canopies, the changes of canopy reflectance after spikes removal, the relationship between spectral indices and LWC in the upper-, middle- and bottom-layer. The interrelationship among vertical LWC were constructed, and four ratio of reflectance difference (RRD) type of indices were proposed based on the published WI and NDWSI indices to determine vertical distribution of LWC. The results indicated a bell shape distribution of LWC in wheat plants with the highest value appeared at the middle layer, and significant linear correlations between middle-LWC vs. upper-LWC and middle-LWC vs. bottom-LWC (r ≥ 0.92) were identified. The effects of wheat spikes on spectral reflectance mainly occurred in near infrared to shortwave infrared regions, which then decreased the accuracy of LWC estimation. Spectral indices at the middle layer outperformed the other two layers in LWC assessment and were less susceptible to wheat spikes effects, in particular, the newly proposed narrow-band WI-4 and NDWSI-4 indices exhibited great potential in tracking the changes of middle-LWC (R2 = 0.82 and 0.84, respectively). By taking into account the effects of wheat spikes and the interrelationship of vertical LWC within canopies, an indirect induction strategy was developed for modeling the upper-LWC and bottom-LWC. It was found that the indirect induction models based on the WI-4 and NDWSI-4 indices were more effective than the models obtained from conventional direct estimation method, with R2 of 0.78 and 0.81 for the upper-LWC estimation, and 0.75 and 0.74 for the bottom-LWC estimation, respectively.

Graphical Abstract

1. Introduction

Leaf water content (LWC) in crops is closely associated with physiological processes and morphological structure of plants [1]. In agricultural practice, proper application of fertilizer can promote the growth of plant root, then enhance the ability of water uptakes from soil [2,3]. Abiotic stresses (e.g., nitrogen or phosphorus stress), by contrast, generally reduce crop water conductivity and lead to a decreased LWC [4], which would slow the rate of photosynthetic carbon assimilation and restrain the productivity and growth of crops [5,6]. Therefore, accurate estimation and real time detection of LWC and its vertical distribution with crop canopies, particularly in various functional leaf layers, is helpful for understanding the real water status and water transfer process in plants, and making sound decisions for effective water and fertilization management in precision agriculture.
Remote sensing technology has been successfully applied in monitoring physical and chemical changes in crops across different scales [7,8,9,10]. The fundamental of remote estimation is the interaction between plant chemical compositions, such as LWC, with electromagnetic radiation [11]. Numerous research efforts focus on developing approaches for LWC estimation based on spectral regions from red edge to SWIR [12,13]. There are two widespread methods: (1) the use of spectral indices calculated by the reflectance of wavebands relevant to leaf water status (e.g., water index and normalized difference water index) [14,15], and (2) radiative transfer modeling, that simulates the light penetration path through the canopy, based on physical laws [16]. However, in both these methods it is generally assumed that plant canopies are vertically homogeneous. A major problem arises from the fact that a non-uniformed vertical distribution of many leaf biochemical parameters, including LWC, among different leaf positions has been reported for various crops [17,18,19,20]. This would be one of the principal factors controlling the total light reflected from the canopy [21] and influencing the sensitivity of spectral indices to leaf biochemical parameters. Therefore, particular emphasis needs to be placed on the vertical distribution of LWC when studying on the quantitative models for remote precision monitoring.
Few studies have been carried out to detect the vertical distribution of leaf parameters within canopy using remotely sensed data. The majority of spectral measurements are collected using ground-based spectroscopy, since the sensor is capable of viewing an area of interest with high spectral and spatial resolutions, providing accurate information on the underlying mechanisms of vertical leaf compositions monitoring. In this context, researchers tried to develop estimation models for the vertical distribution of leaf variables [20,22]. Li et al. [23] investigated the contributions of different vertical layers to canopy reflectance spectra by removing wheat tissues gradually from top to the bottom, and concluded that the information about leaves in the bottom layer were usually failed to be captured. However, how deep the sensors can sense is partly dependent on the canopy deep of target of interest. Ciganda et al. [24], working on maize, reported that the red-edge chlorophyll index (CIred edge) could sense the chlorophyll content of the upper seven to nine leaf layers, when employing a hierarchical regression. From the results of Luo et al. [25], leaf nitrogen (N) content of reed in the top three layers can be accurately quantified based on canopy reflectance. The interrelationship of vertical leaf N distribution within the canopy was simulated by a statistical method and used for the estimation of leaf N content for the whole canopy. In addition, a physically based multiple-layer canopy reflectance model was proposed by Wang et al. [21], and was successfully tested in depicting vertical profiles of leaf variables for winter wheat [26]. They suggested that the penetration characteristics and sensitivity of spectral bands used in the spectral indices should also be considered. Based on these results, several wavebands in the NIR and SWIR regions were identified as effective wavelengths for building spectral indices or estimation models for assessing the vertical leaf N distribution [20,22,27].
For the case of LWC, a bell-shaped vertical trend of LWC distribution has been reported in wheat canopies [23,28]. However, there have been few studies concentrating on the challenging issue of detecting vertical distribution of LWC within canopies based on reflectance data and spectral indices derived [28], especially for the canopy after head emergence stage. Studies have demonstrated that the reflectance of crop canopies could be changed by the emergence of crop spikes at the late growth stages [29,30], which would increase the uncertainty for estimation of LWC vertical distribution. Nevertheless, how wheat spikes affect canopy reflectance across the full spectral regions and the assessment of vertical profile of LWC in crop canopies are still poorly understood. Deep knowledge of these mechanisms issues would facilitate to develop a suitable retrieval strategy, and consequently improve the accuracy of estimation of vertical LWC distribution.
The objectives of this study were (1) to investigate the vertical profile of LWC within winter wheat canopies and identify the interrelationship of LWC among the different vertical layers; (2) to analyze the effects of wheat spikes on canopy spectral reflectance and the performance of published water-related spectral indices in quantifying the vertical LWC in wheat; (3) to estimate vertical distribution of LWC within canopies using a newly proposed indirect induction method, then compare its prediction ability with the conventional estimation method.

2. Materials and Methods

2.1. Field Experiments

The field experiments were conducted at the National Experiment Site for Precision Agriculture (40°10.6′N, 116°26.3′E), Beijing, China (Figure 1). This site has a sub-humid continental monsoon climate, with a mean annual rainfall of 507.7 mm and a mean annual temperature of 13.8 °C. Experiment 1 (Exp. 1) was conducted in 2007. Nine winter wheat cultivars were planted with a density of 3 × 10⁶ plants ha−1 and a row spacing of 25 cm, which included Lumai21, Jing411, Jingken49, Jing9843, Jingdong12, 9158, 6211, I-93, Laizhou3279. Nitrogen fertilizer as urea was applied at the pre-planting and the stem elongation stages; 345 kg ha−1 compound fertilizer consists of 15% nitrogen, 15% phosphorus and 15% potassium were used prior to sowing. Each cultivar was planted in a plot with an area of 45 × 10.8 m2. Experiment 2 (Exp. 2) was conducted in 2017. Two cultivars of Lunxuan167 and Jingdong18 were investigated. Four N fertilization rates were applied for all cultivars: 0 (N0), 150 kg ha−1 (N150), 300 kg ha−1 (N300), and 450 kg ha−1 (N450). Each cultivar was grown in plots of 15 m × 9 m size, on a silty clay loam soil.
Canopy spectral measurement and sampling dates were selected during the late growth periods of wheat, i.e., 9 May (Head emergence, Z54), 19 May (Heading, Z59) and 29 May (Milk-filling, Z73) in Exp.1, 9 May (Head emergence, Z54) and 27 May (Milk-filling, Z73) in Exp. 2. It should be noted that, in Exp. 2, in order to focus on investigating the effects of wheat spikes on canopy spectral reflectance and vertical distribution of LWC estimate, for each plot, wheat spikes were removed from the plant after accomplishing spectral measurement for the entire canopy under the premise of ensuring that all other conditions remained unchanged.

2.2. Canopy Spectral Reflectance Measurement

An ASD FieldSpec 3 spectrometer (Analytical Spectral Devices, Boulder, CO, USA) was used to measure the canopy spectral reflectance, with a 25° field-of-view fiber optics. It records the spectral radiance between 350 and 1050 nm with a sampling interval of 1.40 nm and a resolution of 3 nm, and between 1000 and 2500 nm with a sampling interval of 2 nm and a resolution of 10 nm. The measurements were performed under clear sky conditions between 10:00 am and 14:00 pm (Beijing local time).
Within each plot, three subplots with an area of 1 m × 0.6 m (4 rows × 0.6 m long, 0.6 m2) were randomly selected, canopy spectral reflectance was measured at a height of about 1 m above wheat canopies from the nadir direction. Notably, in Exp. 2, after collecting spectral reflectance of entire canopy, all of wheat spikes in the subplot were carefully cut off, and the spectral reflectance of the remaining canopy without spikes was measured. Each spectral measurement of the two experiments was preceded by a dark current measurement and a white reference measurement was taken before and after canopy spectral measurement, using a 99% white Spectralon® (Labsphere, Inc., North Sutton, NH, USA) reference panel. Ten scans were determined and averaged to obtain the spectral reflectance of the entire canopy or canopy without spikes for each subplot. Three averaged subplots’ spectra were used to represent the reflectance of entire canopy or canopy without spikes for each plot.

2.3. Vertical Leaf Water Content Distribution Measurement

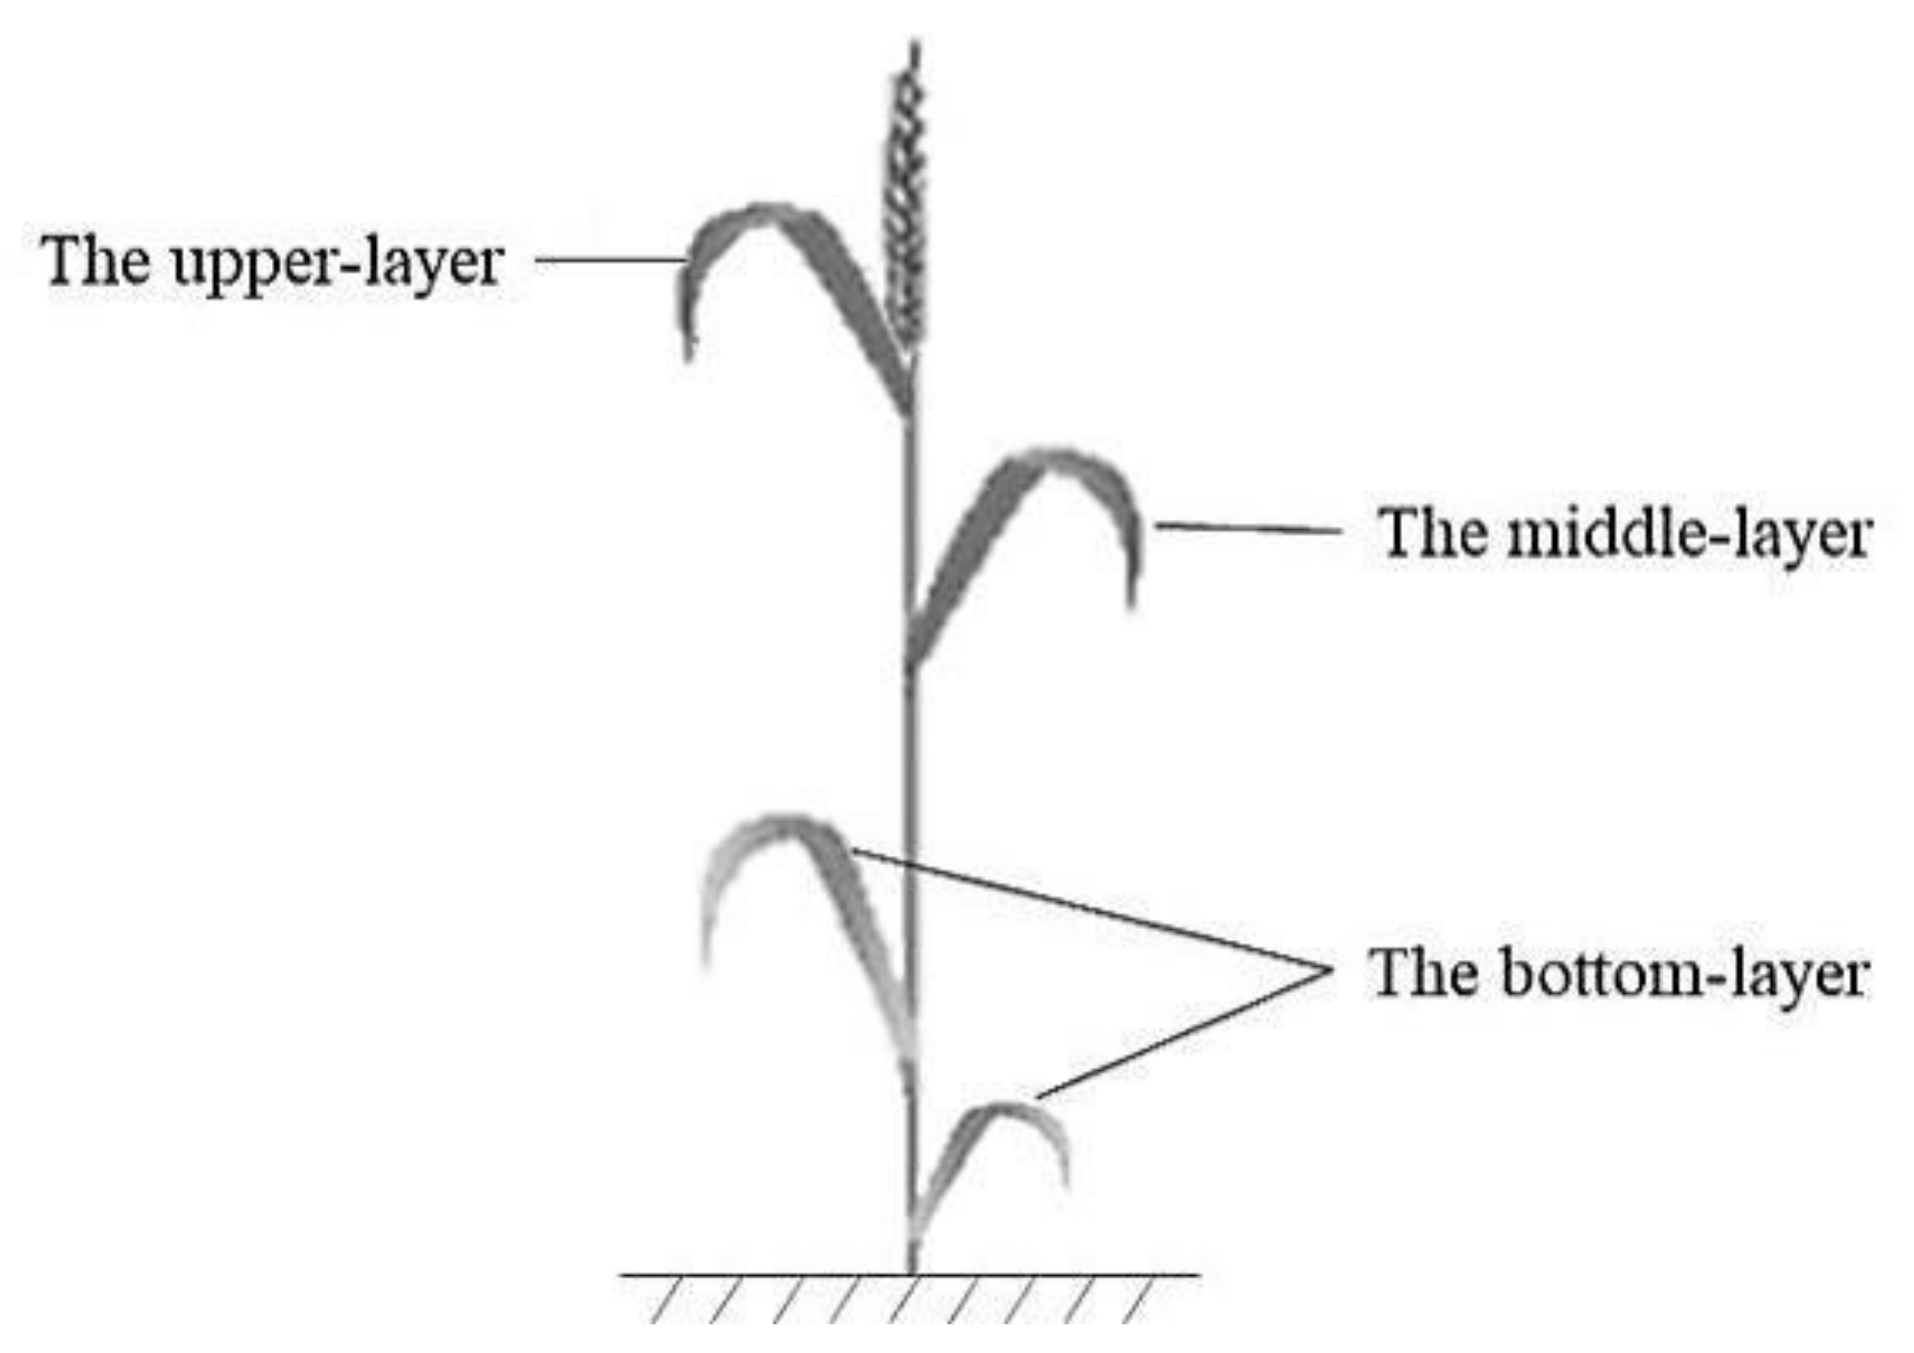
All samples of wheat in each subplot within the footprint of canopy reflectance acquisitions, were harvested by cutting off the plants at the soil level, and immediately placed in black plastic bags and kept cool until they were brought back to determine LWC in the laboratory. To quantify vertical profiles of LWC within wheat canopy, we divided the plant into three vertical layers according to various functions of leaves, as shown in Figure 2. The top first leaf (i.e., flag leaf) was assigned to the upper-layer, since its important role in contributing to the major part of photosynthesis of canopy and significantly to grain yield and quality at the late growth stages [31], and the top second leaf was assigned to the middle-layer. In addition, the top third and the leaves below were assigned to the bottom-layer, in consideration of the fact that they were proven to be more sensitive to nutrient and water deficiency [32] and leaves below the top third began to senesce during the milk-filling period, mainly consisting of the yellow and withered leaves, which was particularly pronounced for the N0 treatment.
For each subplot, leaves belonging to the same vertical layer were cut from the stems and weighed immediately to obtain the fresh weight (FW) using analytical balance. Then they were dried at 105 °C for 30 min in an oven and subsequently dried at 80 °C until constant weight, dry weight (DW) of leaves were recorded after weighing. Leaf water content (LWC) (%) was calculated using the method of weight ratio [33]. The LWC in a given vertical layer of three subplots were finally averaged to represent the LWC in the corresponding layer of the plot.
LWC   ( % ) = F W D W F W × 100 %

2.4. Published Spectral Indices

A set of 15 published spectral indices related to leaf water variables of different plants were explored to evaluate the effects of wheat spikes on their performance in vertical distribution of LWC estimation (Table 1).

2.5. Construction of New RRD Type of Spectral Indices

Differences in vegetation canopy geometry and illumination angles during the spectral measurements could cause the confounding effects of scattering that are unrelated to leaf biochemical parameters [43]. The theory of multiple signal correction (MSC) was proposed for separating the biochemical light absorption (e.g., LWC) from the physical light scatter for NIR data [44]. For an individual spectrum or sample, the MSC model was expressed as follows:
R i k = a i + b i R k ¯ + e i k       i = 1 , , n ;     k = 1 , , λ w
where R i k represents spectral reflectance for sample i at wavelength k; a i and b i represent the additive and multiplicative effects for sample i respectively; R k ¯ represents the “standard” value at wavelength k, which is usually expressed by the average value of all samples at wavelength k; e i k represents residual with respect to all other effects in the spectrum that cannot be modeled by a i and b i for sample i at wavelength k. After the transposition, the scatter corrected spectrum R i k ,   c o r r e c t e d was calculated by:
R i k ,   c o r r e c t e d = ( R i k a i ) / b i
Equations (2) and (3) suggest that the derivation of the relationship between spectral reflectance and leaf biochemical content requires to eliminate the variations due to the additive offset and the multiplicative effect. However, the extract values of scatter coefficients ai and bi are not unique, they depend on different sample datasets of R k ¯ used [43].
In this study, the ratio of reflectance difference (RRD) type of indices was explored, which is formulated as:
R R D = R λ 1 R λ 3 R λ 2 R λ 4       ( λ 1 λ 3 , λ 2 λ 4 )
From the formation of RRD, it is obvious that the scatter coefficients ai and bi will be eliminated, thus be insensitive to the sample datasets. Therefore, it can be expressed in Equation (5) as well.
R R D = R λ 1 , c o r r e c t e d R λ 3 , c o r r e c t e d R λ 2 , c o r r e c t e d R λ 4 , c o r r e c t e d     ( λ 1 λ 3 , λ 2 λ 4 )
Because of the excellent performance of the published WI and NDWSI indices in estimating the vertical LWC profile over other spectral indices tested (see Section 3.3), inspired, we optimized them to construct four new RRD type of spectral indices from three or four narrow spectral bands, referred to as WI-3 and WI-4, NDWSI-3 and NDWSI-4, which were defined by the following equations:
W I 3 = R 900 R λ 3 R 970 R λ 3
W I 4 = R 900 R λ 3 R 970 R λ 4
N D W S I 3 = ( R 850 R λ 3 ) ( R 970 R λ 3 ) ( R 850 R λ 3 ) + ( R 970 R λ 3 )
N D W S I 4 = ( R 850 R λ 3 ) ( R 970 R λ 4 ) ( R 850 R λ 3 ) + ( R 970 R λ 4 )
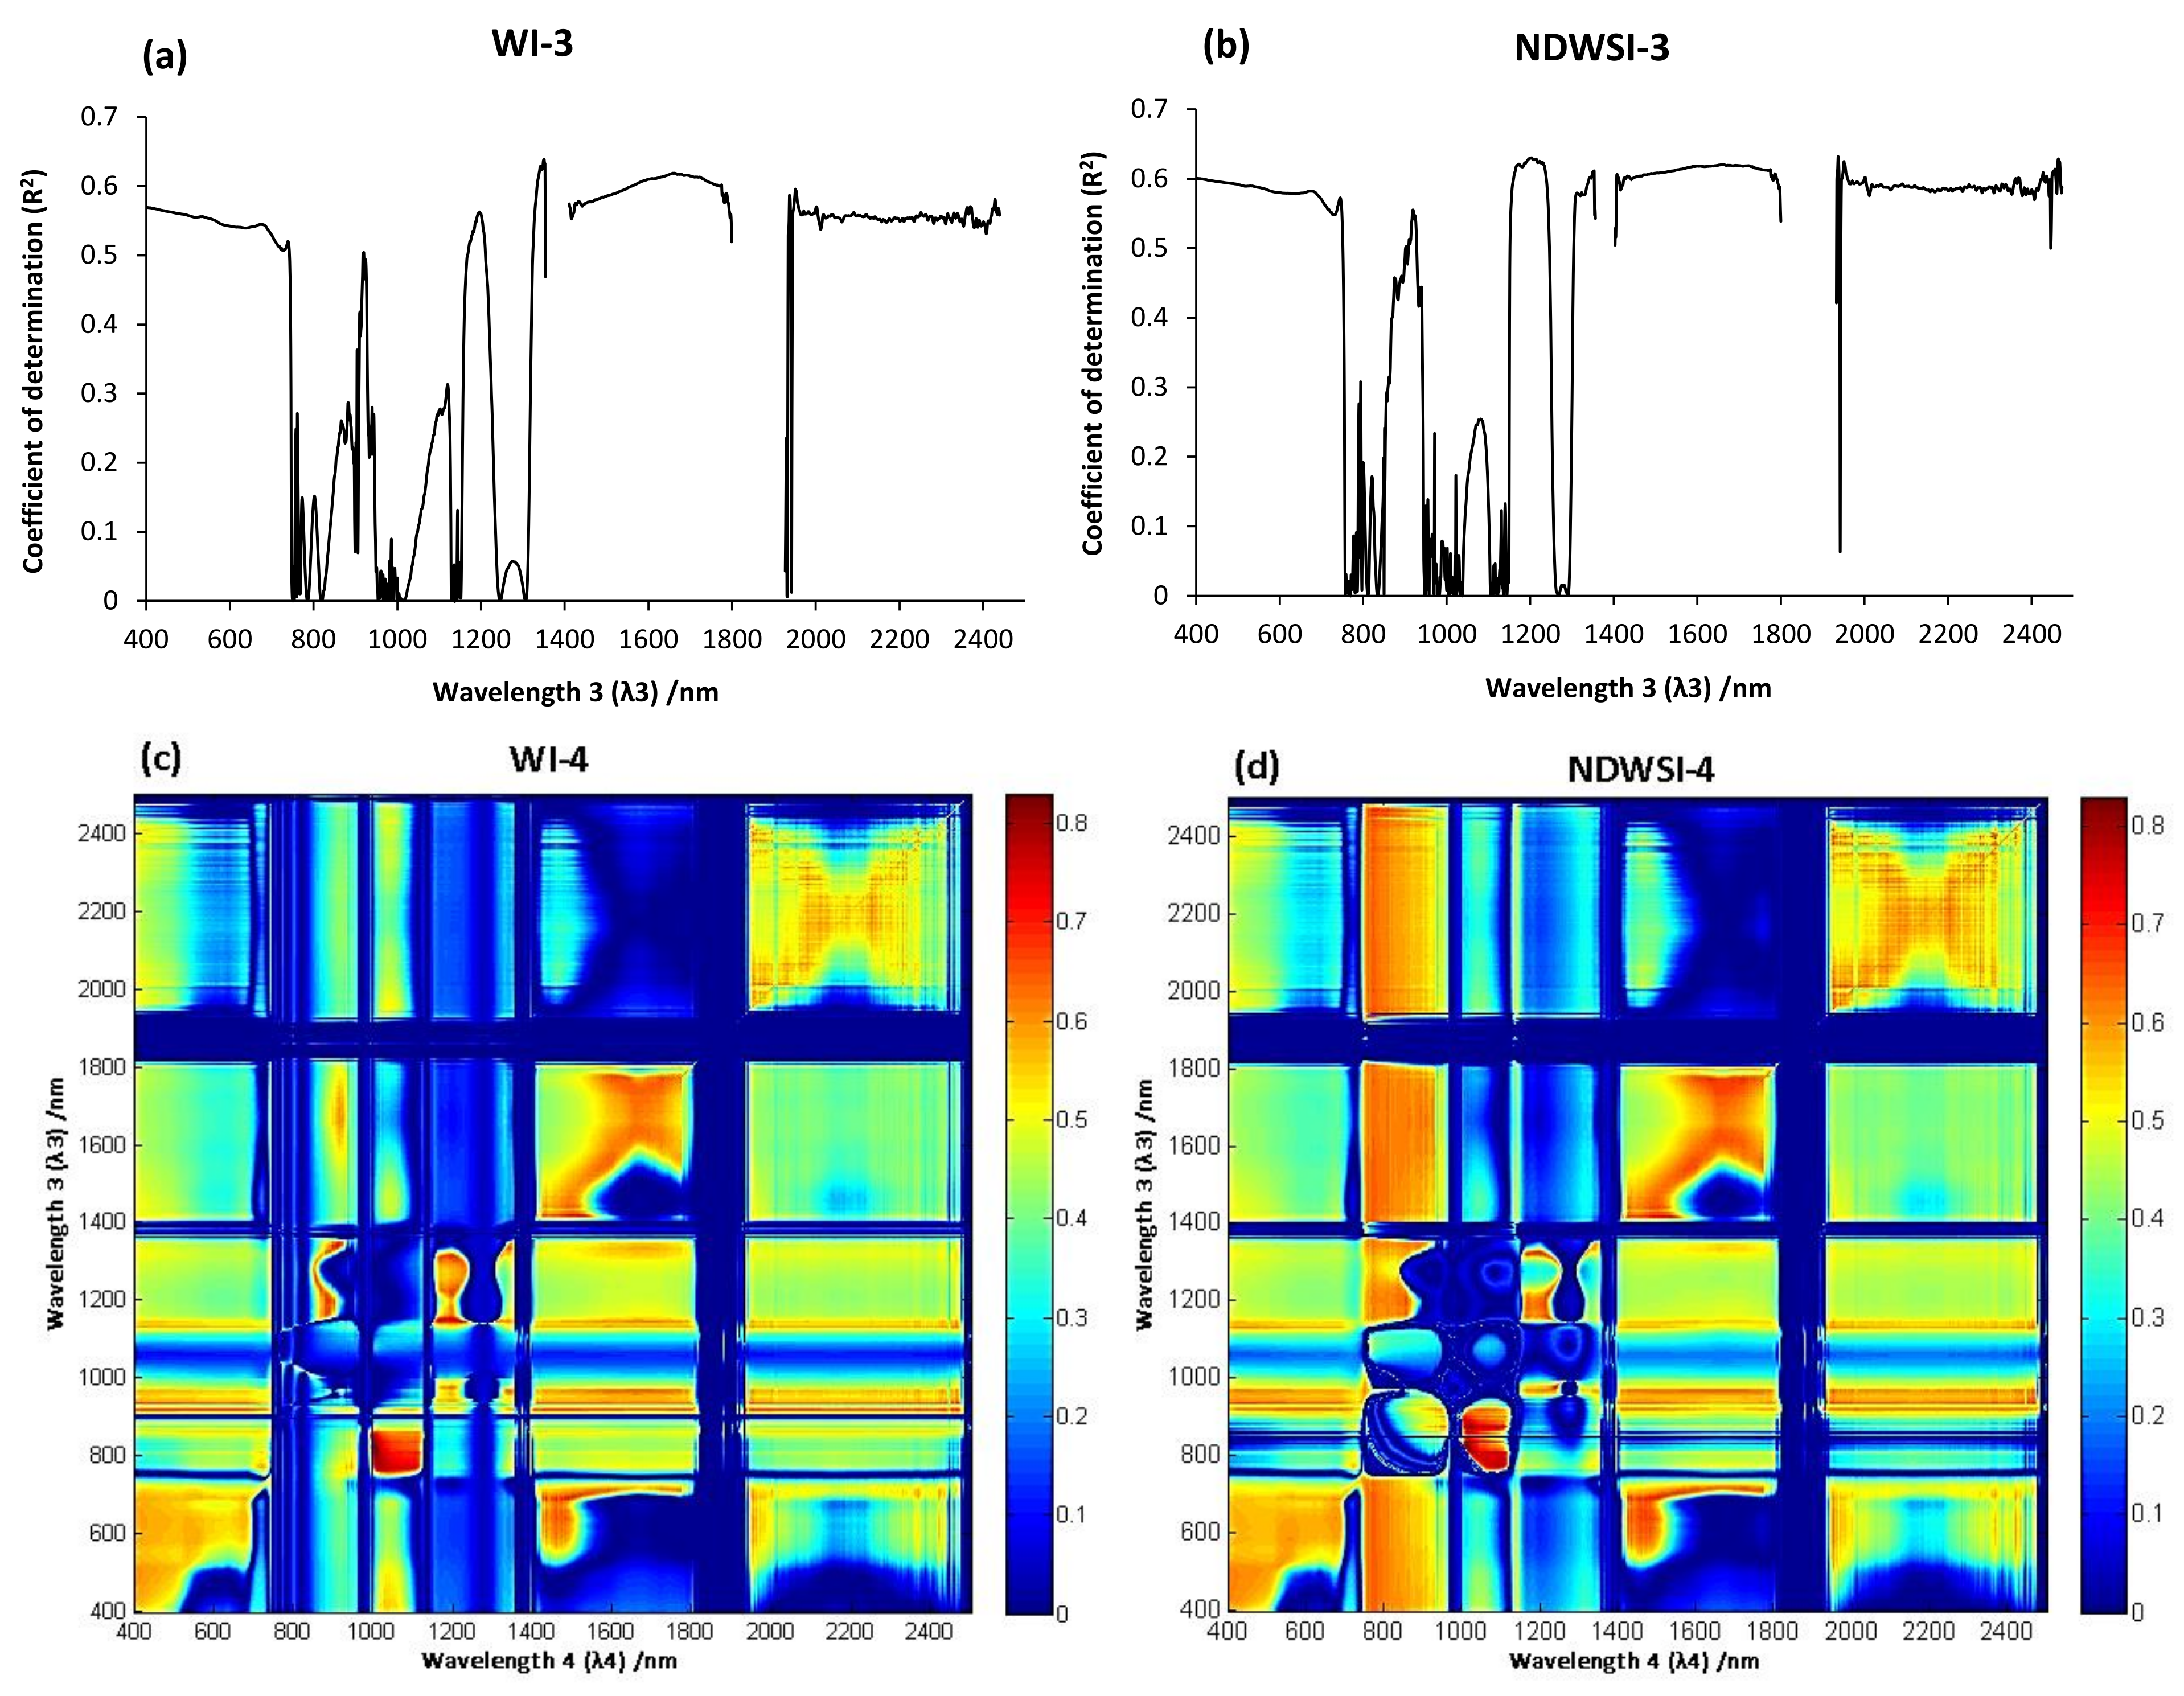
where 850 nm, 900 nm and 970 nm are the existing wavebands in the WI or NDWSI indices, λ3 and λ4 are the third or/and forth wavebands in the four new RRD type of spectral indices. To find the optimum λ3 and λ4 in each index for estimating vertical distribution of LWC, we calculated the spectral reflectance of every band, or all two bands combinations, from 400–2500 nm, to combine with the reflectance of existing bands, respectively, and then correlated with the LWC in the middle-layer. The λ3 in the WI-3 and NDWSI-3, or the λ3 and λ4 in the WI-4 and NDWSI-4 were consequently selected by the values of coefficient of determination (R2). All the calculations were implemented using MATLAB 8.3 (The MathWorks, Inc., Nat-ick, MA, USA). From our result, λ3 = 1350 nm for WI-3, λ3 = 1200 nm for NDWSI-3, λ3 = 825 nm and λ4 = 1013 nm for WI-4 and NDWSI-4, so the four new narrow-band spectral indices were:
W I 3 = R 900 R 1350 R 970 R 1350
W I 4 = R 900 R 825 R 970 R 1013
N D W S I 3 = R 850 R 970 R 850 + R 970 2 R 1200
N D W S I 4 = ( R 850 R 825 ) ( R 970 R 1013 ) ( R 850 R 825 ) + ( R 970 R 1013 )

2.6. Data Analysis

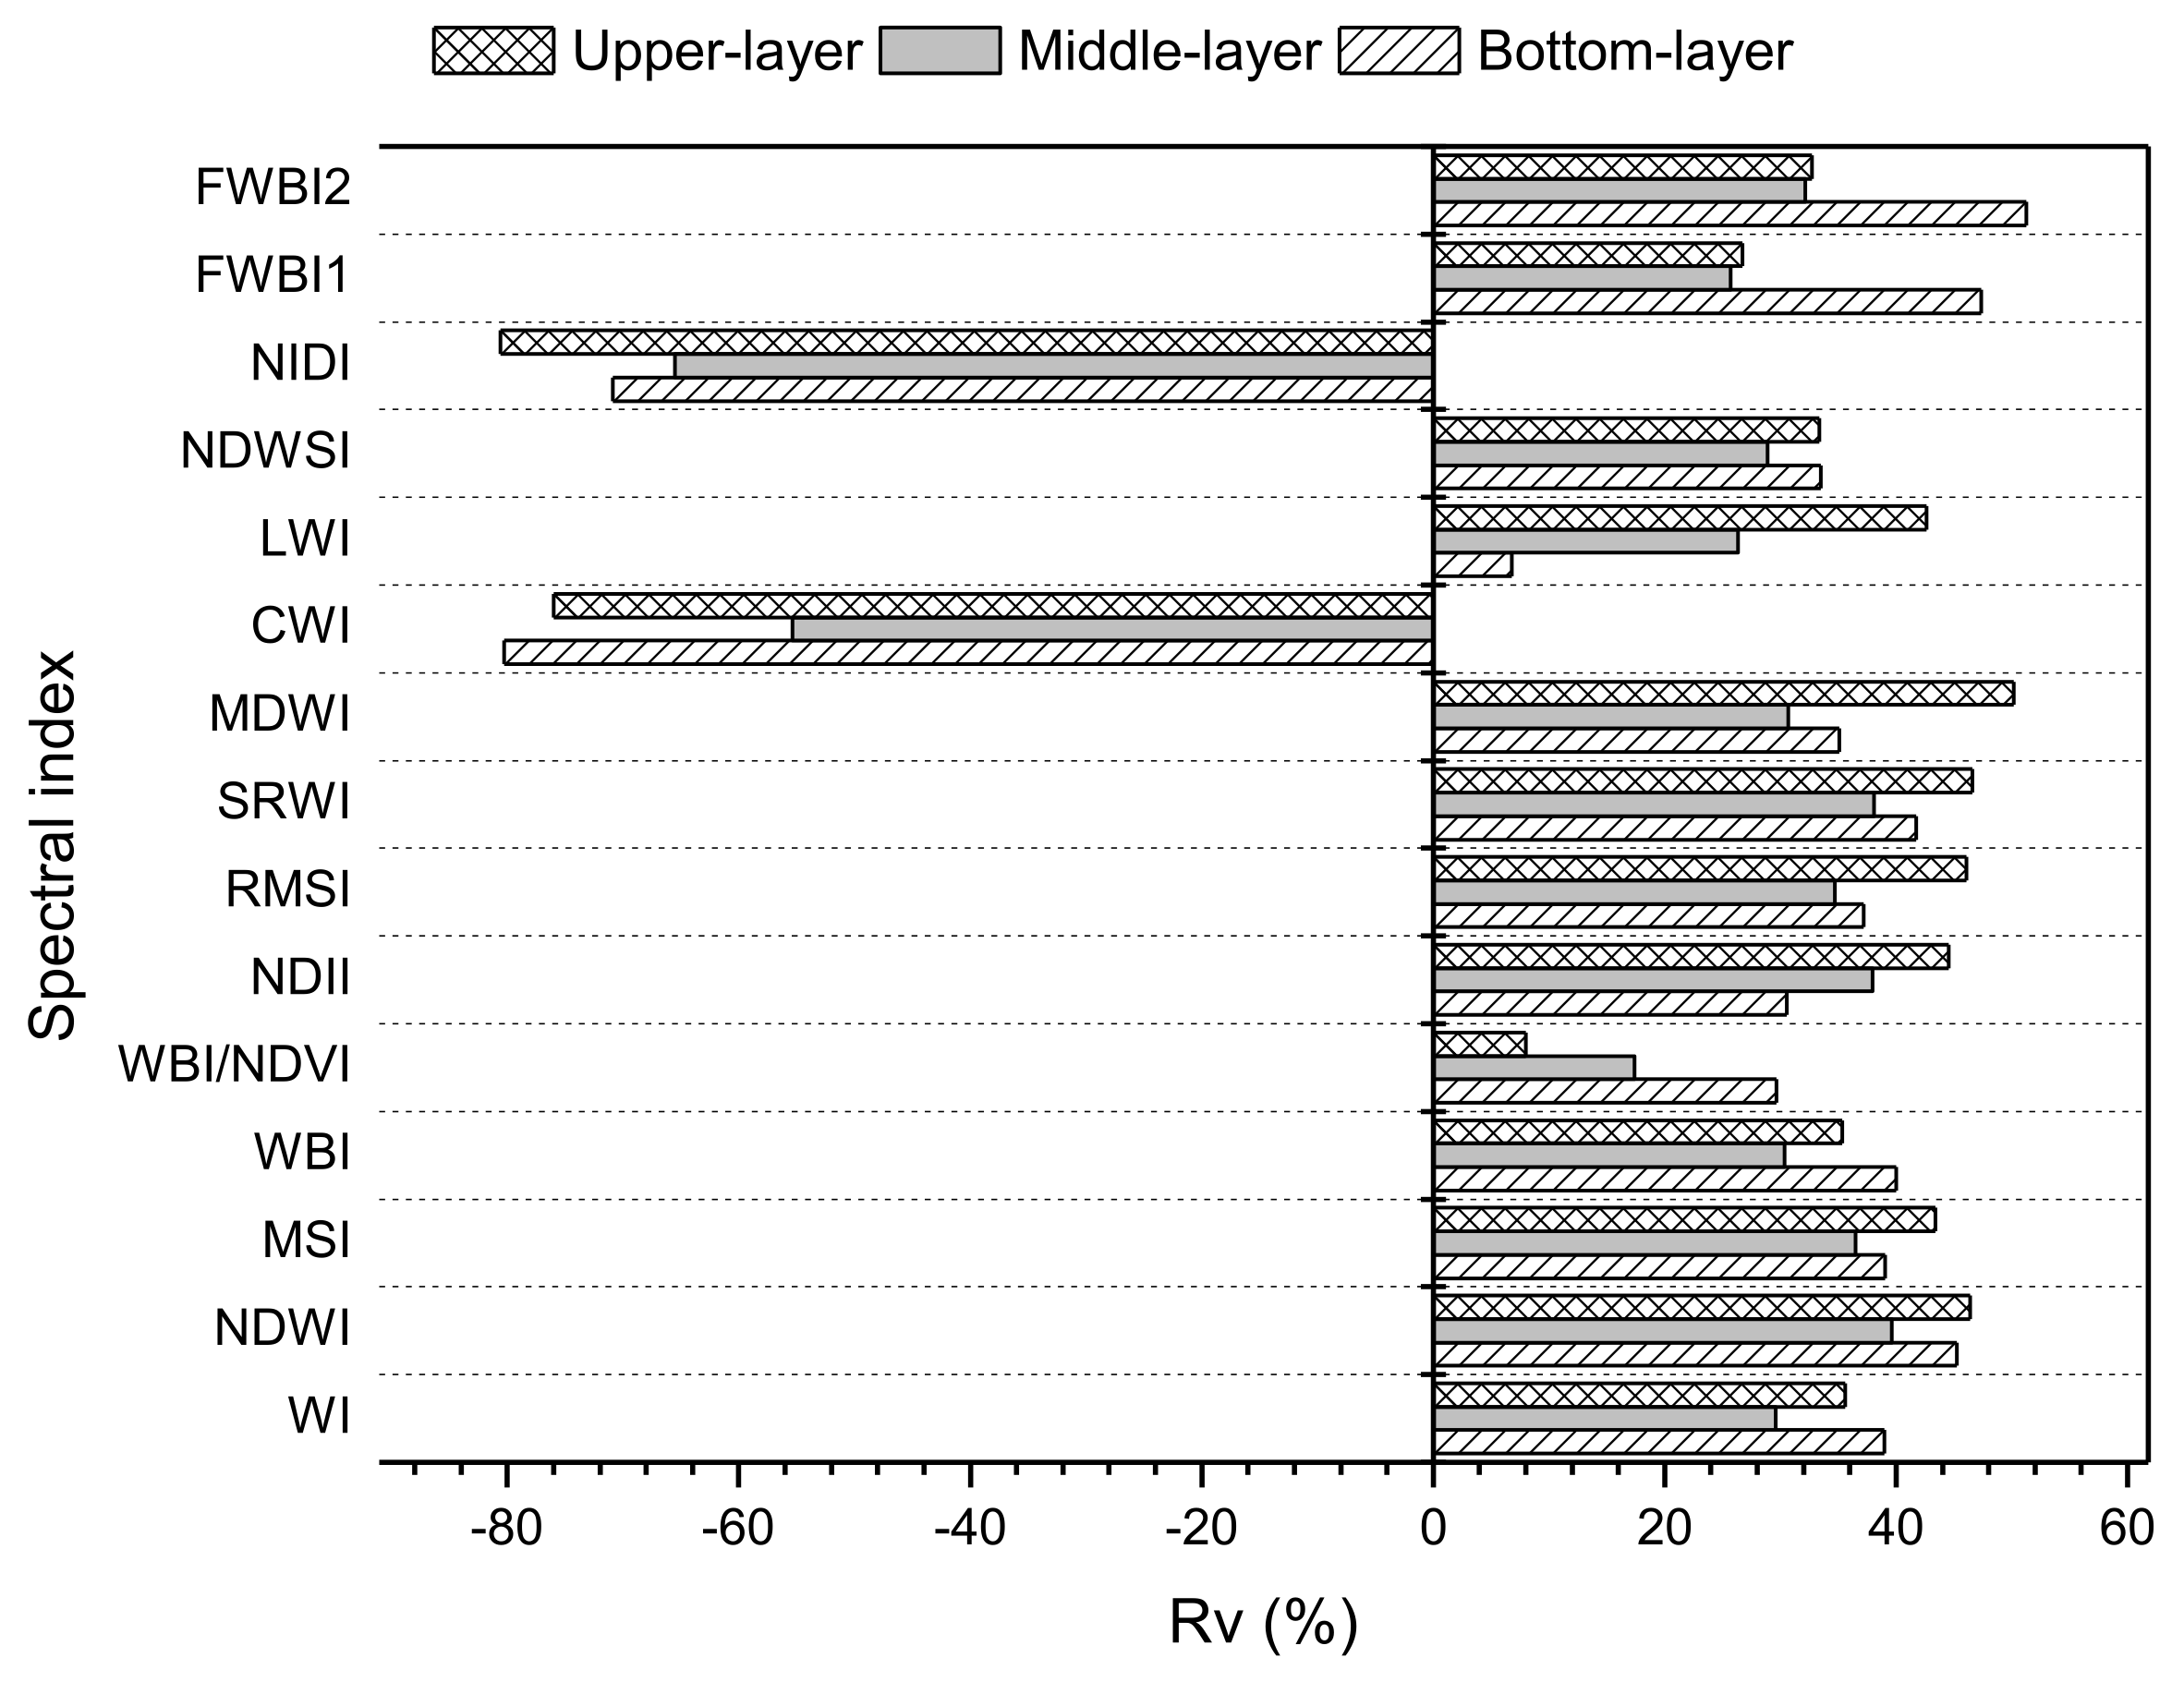
The datasets collected in Exp. 2 were used to explore the influences of wheat spikes on spectral reflectance and the accuracy of vertical LWC estimation, while datasets collected in Exp. 1 and 2 were used for modeling. The values of coefficients of determination (R2) between LWC in vertical layers and published spectral indices, derived from spectral reflectance of the entire canopy with or without spikes, were calculated, which were referred to as R2entirecanopy and R2canopywithout spikes, respectively. A relative variation rate (Rv, %) was used to compare the performance of each spectral index with respect to vertical LWC before and after spike removal, which was formulated as Equation (14). A higher Rv of R2 suggests a higher degree of variations in spectral indices, i.e., effects of spikes, on vertical LWC estimation.
R V   o f   R 2   ( % ) = R 2 c a n o p y   w i t h o u t   s p i k e s R 2 e n t i r e   c a n o p y R 2 e n t i r e   c a n o p y
where Rv of R2(%) indicates the change of the accuracy of estimation models for LWC in a given vertical layer before and after spike removal. The Rv of R2(%) > 0 represents an increase in model accuracy after removing spikes, whereas the Rv of R2(%) < 0 represents a decrease.
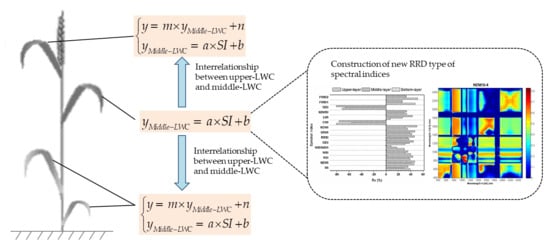
Linear regression was used to model the relationship between spectral indices and LWC in different vertical layers using the SPSS 18.0 software (SPSS Inc., Chicago, IL, USA). In this study, we proposed an indirect induction method to establish models for LWC in the upper- and bottom-layer, by considering the effects of wheat spikes and the interrelationship of vertical LWC within canopies. Their estimation model was as follows:
y = m × y M i d d l e L W C + n y M i d d l e L W C = a × S I + b
where y indicates the LWC in the upper-layer or the bottom-layer, coefficients m and n indicate the slope and intercept of relationship between middle-LWC and upper-LWC, or middle-LWC and bottom-LWC; yMiddle-LWC indicates the LWC in the middle-layer, SI indicates the spectral indices used, coefficients a and b indicate the slope and intercept of estimation model for middle-LWC.
The validity of models was assessed based on leave-one-out cross-validation approach. Apart from R2 and root mean square error (RMSE) were employed to test the performance of the models in vertical LWC prediction, the relative error (RE) and Nash–Sutcliffe efficiency (NSE, calculated as Equation (16)) were used to evaluate the predictive ability of models, which were classified into four and three categories respectively by researchers [45,46], as shown in Table 2.
N S E = 1 i = 1 n ( y i y ^ i ) 2 i = 1 n ( y i y ¯ i ) 2
where y i and y ^ i are the measured and estimated LWC in a given vertical layers, y ¯ i is the mean of the measured LWC in a corresponding layer.

3. Results

3.1. Vertical Variation of LWC within Wheat Canopies

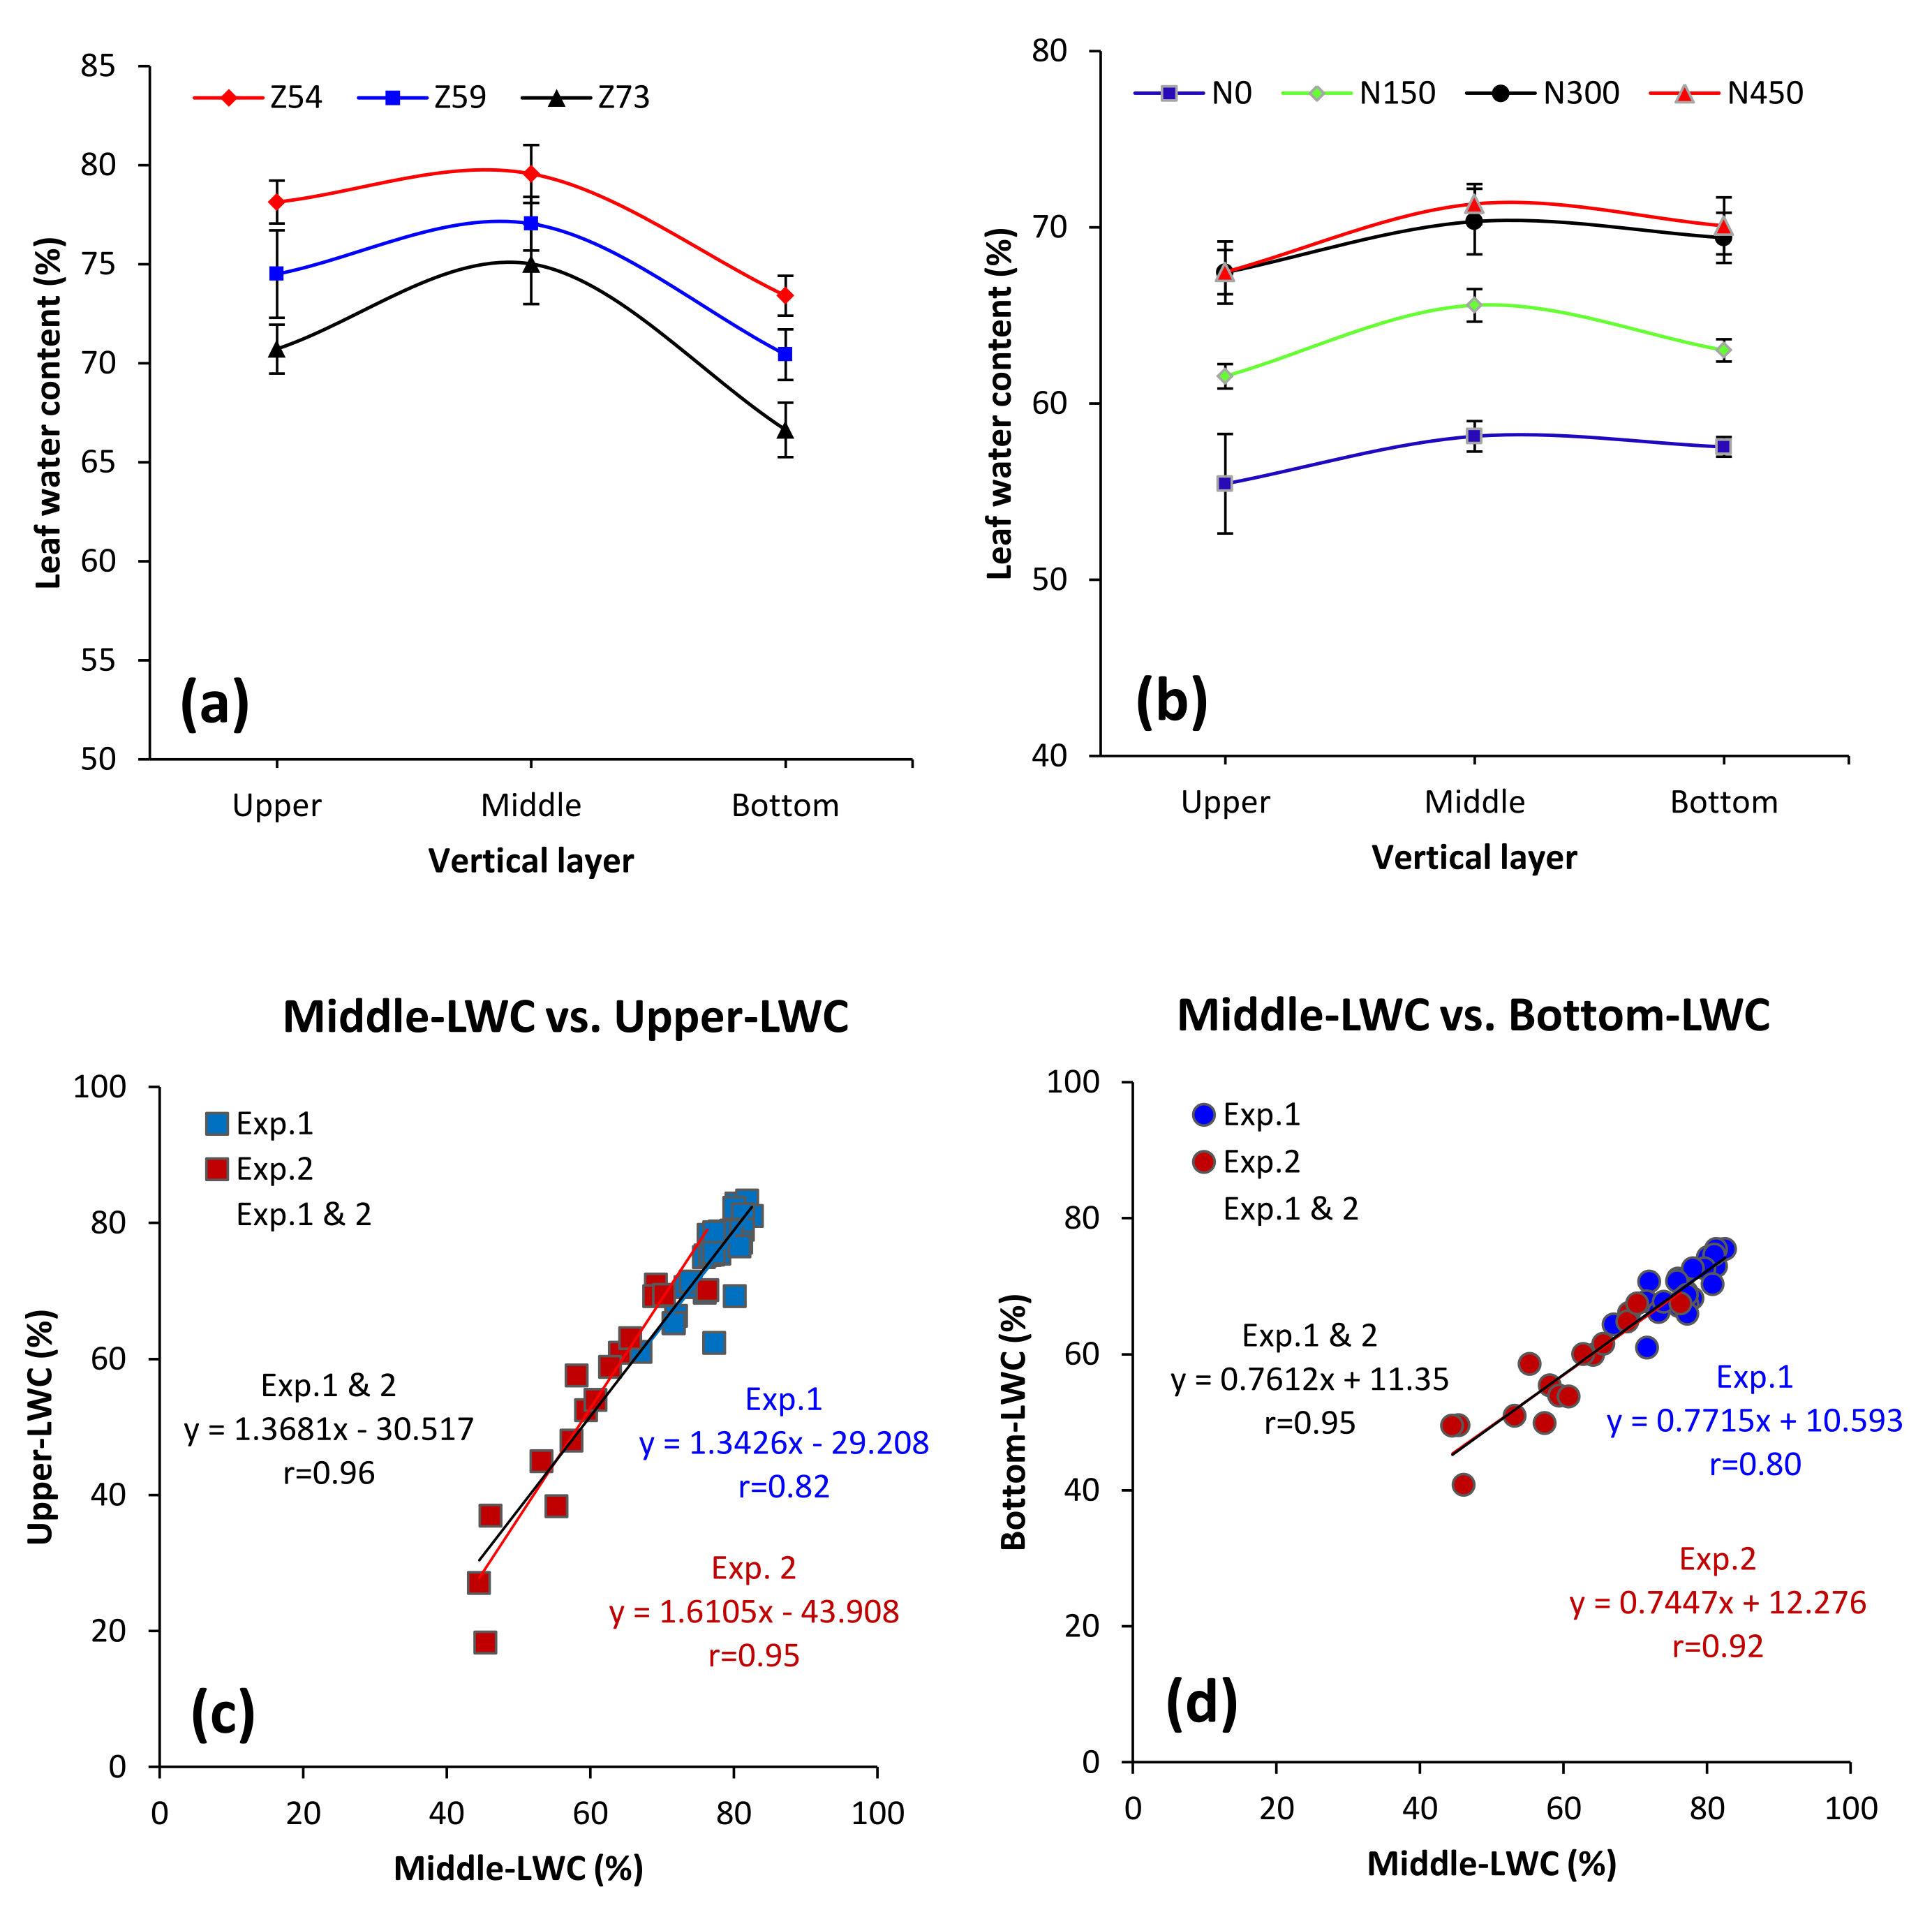
The vertical profiles of LWC within wheat canopies across different growth stages and different N rates are presented in Figure 3a,b. We can observe that the LWC in the three vertical layers were all gradually decreased after the head emergence stage of wheat. However, for each vertical layer, the treatments with higher N rates (i.e., N300 and N450) had higher LWC in comparison to those with lower N rates (i.e., N0 and N150), although the differences between N300 and N450 were not distinctive, indicating that appropriate application of N fertilizer could improve the LWC to a certain extent. However, for all treatments, there was a similar vertical distribution pattern of LWC, showing great vertical heterogeneity within canopies. Leaves in the middle layer had the largest LWC among the three layers of wheat, while the LWC in the upper layer were slightly lower or higher than that in the bottom layer. Moreover, the middle-LWC was strongly and linearly related to the upper-LWC and bottom-LWC, with correlation coefficient of 0.95 and 0.92, respectively (Figure 3c,d).

3.2. Effects of Wheat Spikes on Canopy Spectral Reflectance

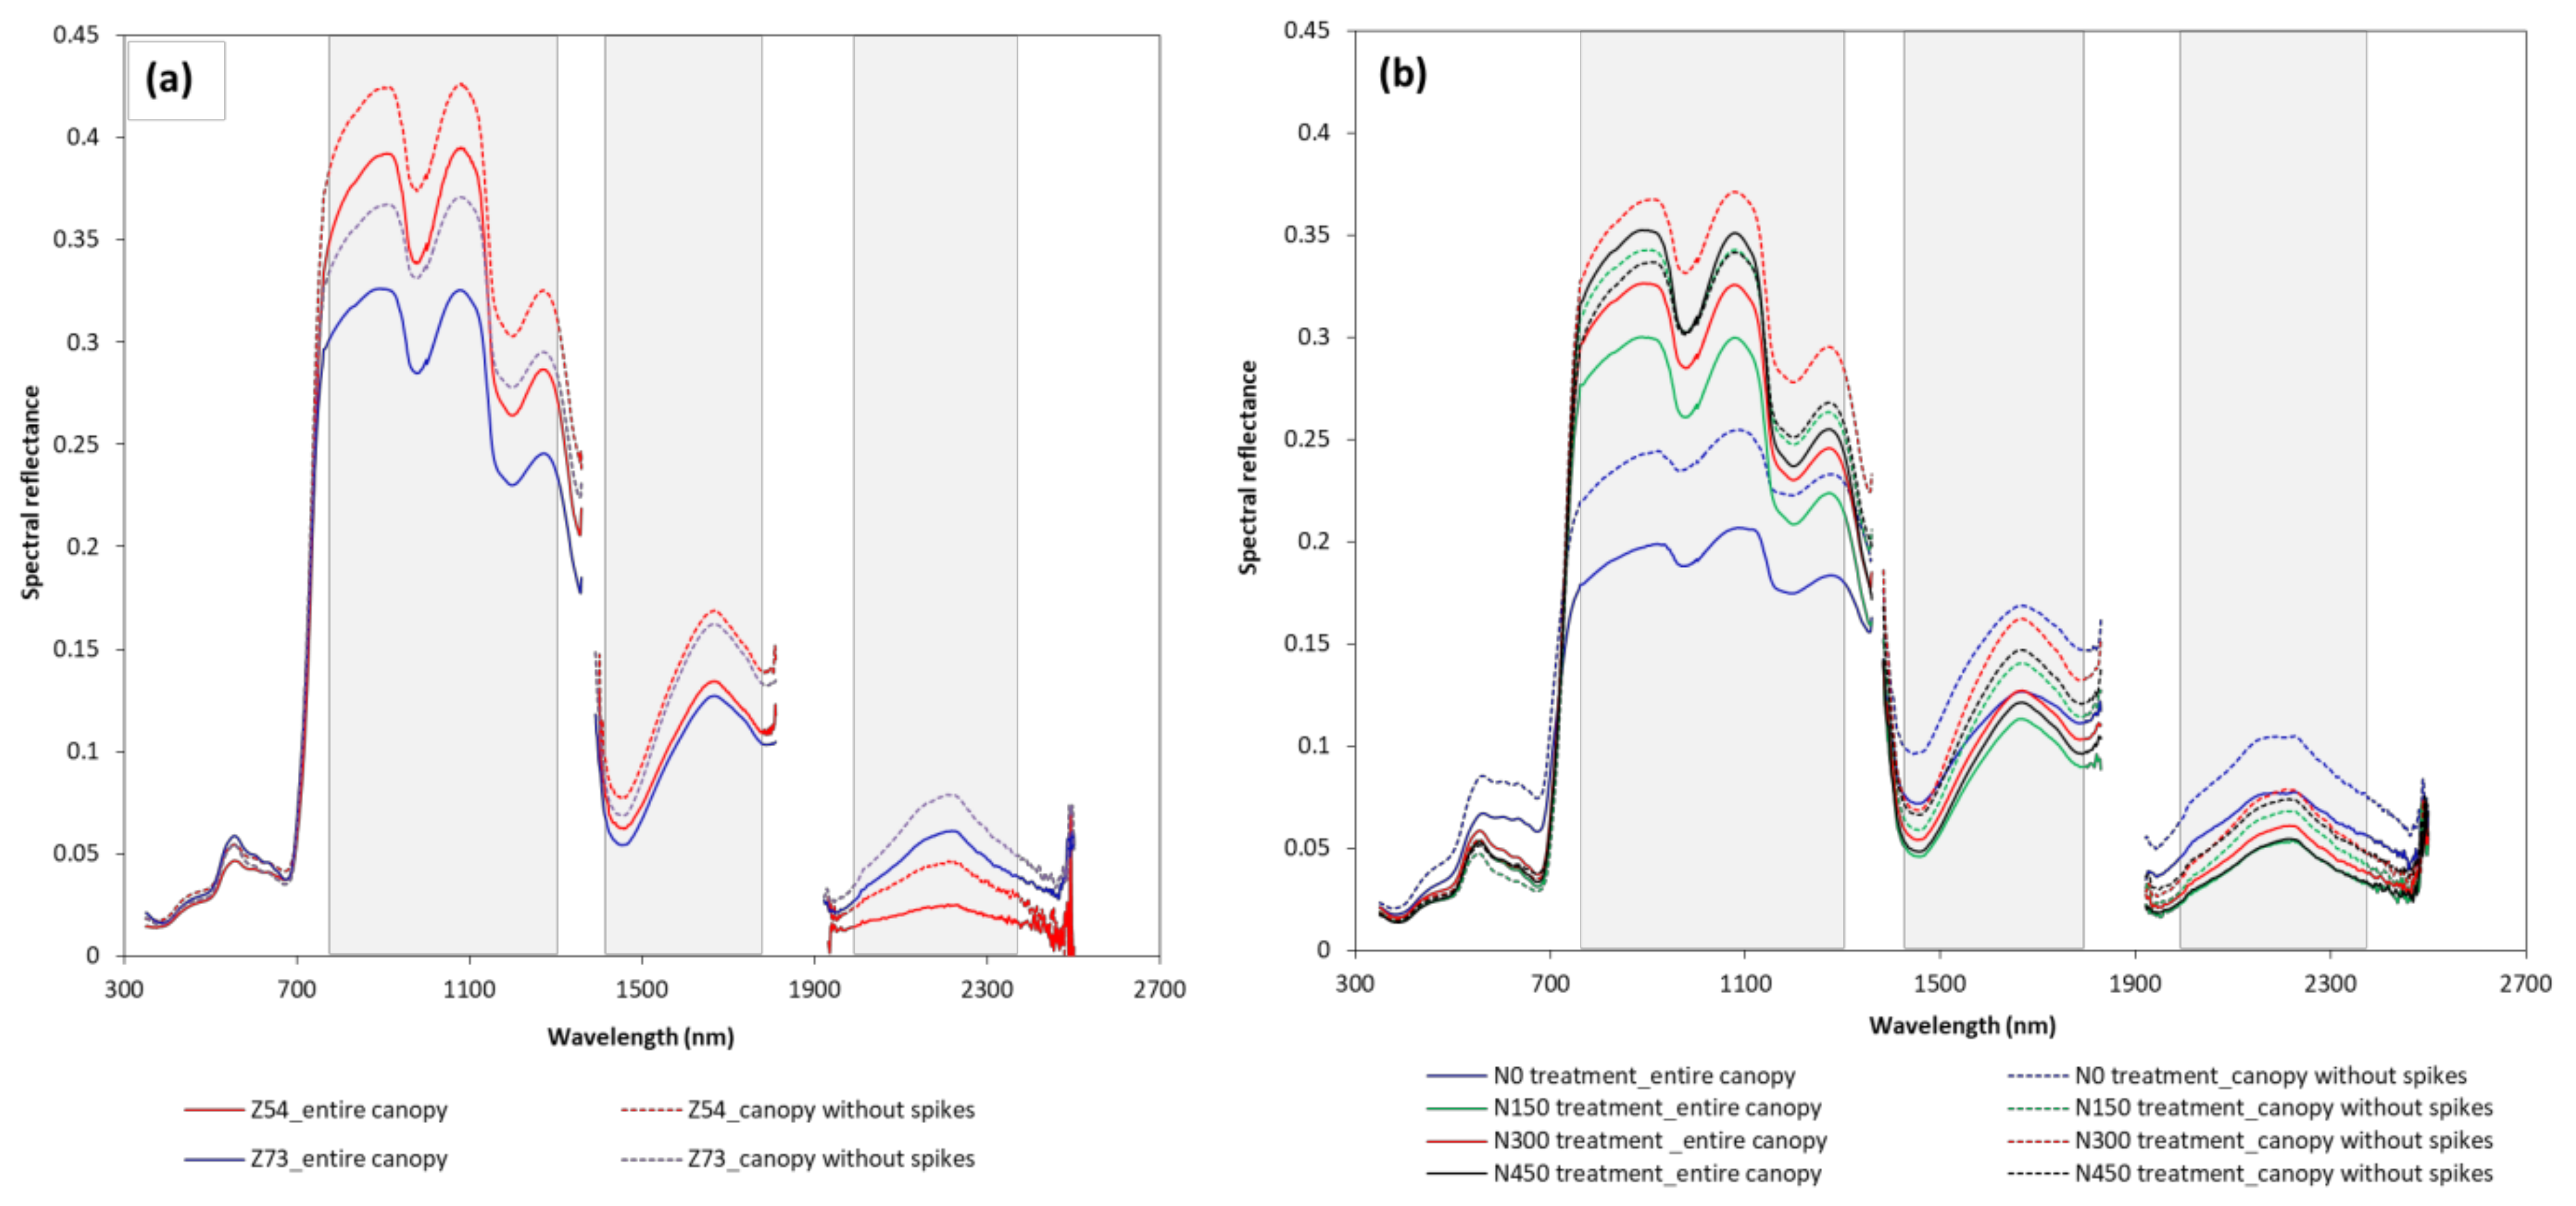
To inspect the effects of wheat spikes on spectral reflectance, we compared spectral reflectance of the entire canopy and the canopy without spikes over spectral range from 400 to 2500 nm at different growth stages and N rates (Figure 4). Note that the noises caused by the effect of water vapor in the air above the canopy in the spectral reflectance values, ranged from 1360–1370 nm, 1830–1920 nm and 2440–2500 nm, were removed.
As shown in Figure 4a,b, wheat spikes had a remarkable effect on canopy spectra. Judging by the response of canopy reflectance to spikes removal in different spectral regions, the largest changes occurred in the NIR and SWIR regions (730–2500 nm), where the reflectance values of canopy without spikes were generally higher than those of the corresponding entire canopy at the same growth stage and N treatment, and little variation was observed in the visible region (400–730 nm). Through carefully examining the reflectance spectra in Figure 4, we were able to detect that spectral reflectance in the 800–1250 nm, 1400–1780 nm and 2000–2350 nm ranges strongly responded to the removal of spikes, which included the sensitive spectral bands utilized to calculate leaf water-related spectral indices in Table 1. In addition, the comparable extents of differences of canopy reflectance before and after spikes removal were shown between the two late growth stages under the same N treatment (Figure 4a), whereas bigger extents of differences appeared among N fertilization treatments (Figure 4b). Compared to the higher N treatments, reflectance of canopy without spikes under the N0 treatment was considerably different from the original reflectance in visible and SWIR (1400–2500 nm) regions. However, among different N rates, the amplitudes of the differences in reflectance before and after spikes removal within NIR high plateau from 730 to 1300 nm were not distinct, except for the N450 with relatively small difference being observed.

3.3. Effects of Wheat Spikes on Relationships between Published Spectral Indices and LWC in Vertical Layers

Given that the wheat spikes contributed differently to canopy spectral reflectance over 400 to 2500 nm (Figure 4), they might have different effects on the estimation accuracy of LWC in different vertical layers. The R2entire canopy and R2canopy without spikes of linear regression analyses for the relationships between published spectral indices and LWC in the upper-, middle- and bottom-layer are summarized in Table 3. In general, for all vertical layers, the values of R2entire canopy were all lower than the corresponding R2canopy without spikes, except for the CWI and NIDI, suggesting that the presence of wheat spikes negatively affects the accuracy of spectral indices in assessing the vertical LWC variation. This may present a convincing evidence for the decreased accuracy of leaf biochemical estimation models when the data obtained after the heading stage were pooled [47]. To further quantify the attenuation influence of spikes on LWC estimation in each vertical layer, we calculated the Rv between R2entire canopy and R2canopy without spikes of each spectral index for the three vertical layers. The results are shown in Figure 5. An important information revealed by Figure 5 is that the spikes had significant, but different, effects on the sensitivity of spectral indices to changes in the vertical LWC within canopies, depending on the vertical layers. Specifically, for almost all spectral indices, the Rv of R2 in the middle layer yielded the smallest values compared with the upper- and bottom-layer, apart from the WBI/NDVI, LWI and NDII, whose Rv of R2 in the middle layer ranked the second place. These results indicated that the assessment of middle-LWC was less susceptible to the effect of spikes, whereas the estimation of upper-LWC or bottom-LWC was relative strongly influenced.
In addition, we further compared the performances of spectral indices in LWC determination in different vertical layers before spikes removal, based on datasets from Exp.1 and 2. As presented in Table 4, almost all published spectral indices achieved the best R2 in the relationship with respect to the middle-LWC, whereas the weakest relationships were found in the bottom layer. In consideration of the significant relationships between middle-LWC vs. upper-LWC and middle-LWC vs. bottom-LWC (Figure 3c,d), it was expected that the LWC in the upper and bottom layers could be indirectly assessed by the remote estimation model of middle-LWC at the late stage of wheat, as a result, reducing the variability due to the wheat spikes and improving vertical LWC estimates within canopies.

3.4. Estimation of Vertical LWC Distribution of Wheat Using a Method of Indirect Induction

As illustrated in Table 4 and Figure 5, the best behaviors in terms of both sensitivity to LWC changes of the middle layer and less sensitivity to wheat spikes effects, were shown by the NDWSI, WI, WBI and FWBI1 (which were indicated in bold in Table 4). These indices yielded R2 values larger than 0.56, while Rv of R2 values less than 30%. Since the formulas and band combinations of the WI, WBI and FWBI1 showed remarkable consistency (Table 1), we used the WI as a representation. Given the fact that both the additive and multiplicative effects exist in canopy reflectance measurements across different wheat cultivars over growth stages, the WI and NDWSI were optimized by adding the third or/and forth wavebands to construct the four new RRD type of indices, expecting to reduce those effects on LWC estimation based on the MSC theory. Reflectance of each waveband or a large number of two-band combinations over the range of 400–2500 nm, were tested as the R λ 3 or R λ 3 and R λ 4 combination in WI-3, NDWSI-3, WI-4 and NDWSI-4 equations (i.e., Equations (6)–(9)), then related to the middle-LWC. The R2 value was used to evaluate which waveband or band combination should be selected to develop the best performing RRD type of indices (Figure 6). As shown in Figure 6a,b, in the selection of the third waveband used in the WI-3 and NDWSI-3, the high significance area all appeared in NIR region. It was worth noting that there are two peaks, λ 3 = 1350   nm in the WI-3 and λ 3 = 1200   nm in the NDWSI-3, achieving the highest R2 values for determination of middle-LWC.
In the selection of the third and fourth band combination used in the WI-4 and NDWSI-4, R2 contour maps of the two four-band RRD indices showed similar patterns (Figure 6c,d). The indices that consisted of red-NIR region or NIR-NIR region as λ 3 and λ 4 , i.e., WI-4 indices with λ 3 : 685–700 nm and λ 4 : 1450–1500 nm, λ 3 : 770–850 nm and λ 4 : 1000–1110 nm, as well as λ 3 : 1415–1425 nm and λ 4 : 1480–1525 nm; NDWSI-4 indices with λ 3 : 620–700 nm and λ 4 : 1450–1490 nm, λ 3 : 790–895 nm and λ 4 : 1000–1115 nm, as well as λ 3 : 1415–1425 nm and λ 4 : 1480–1540 nm, revealed high determination of coefficients relating to the middle-LWC (R2 > 0.65). Maximum R2 appeared in λ 3 = 825   nm and λ 4 = 1013   nm for both the WI-4 and NDWSI-4 indices.
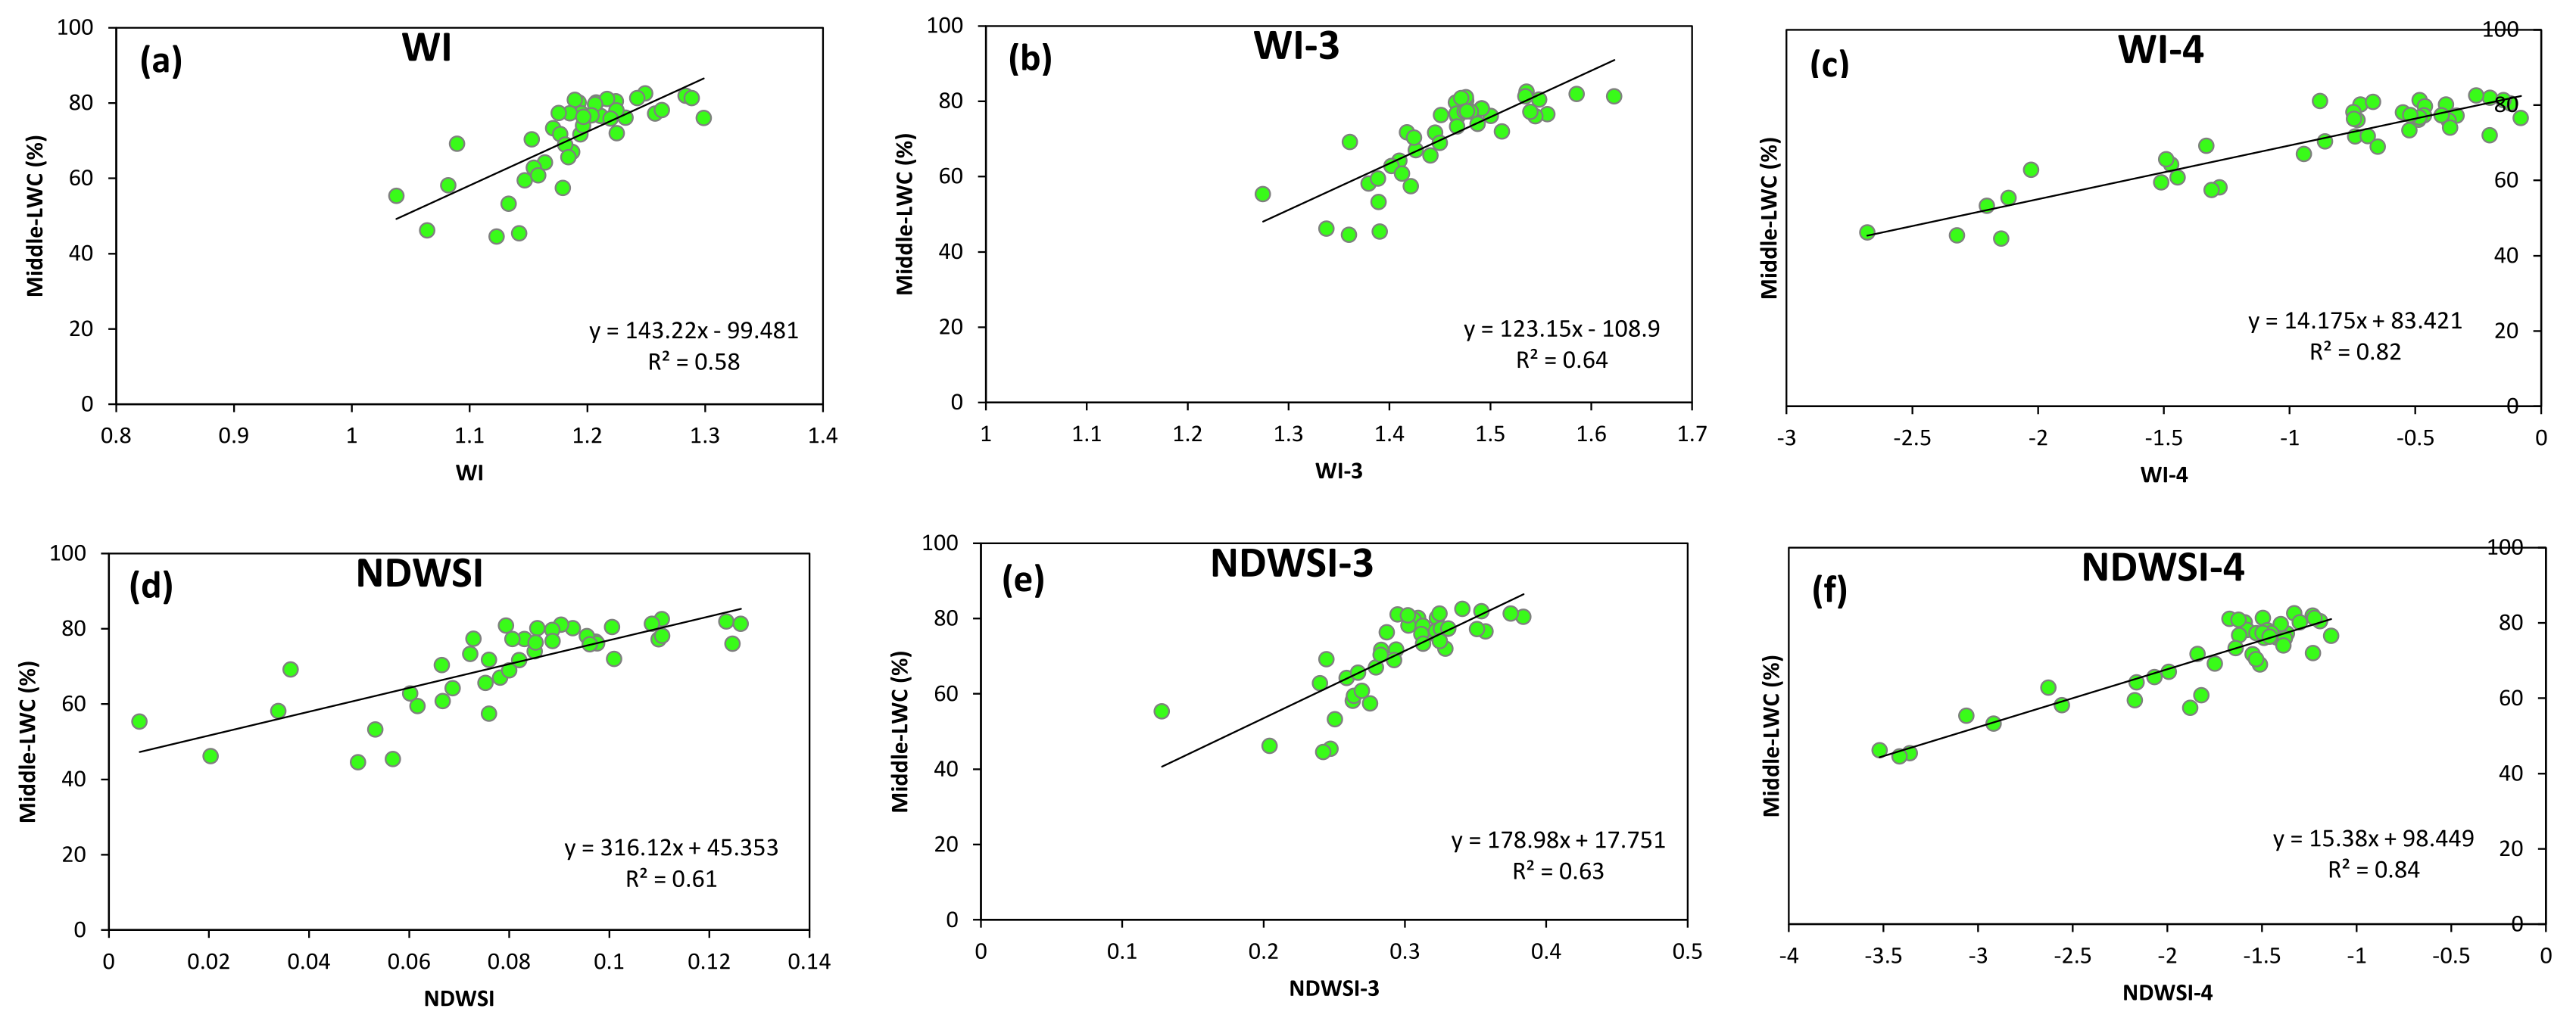
Figure 7 shows the comparisons of performances of the optimal RRD type of indices and the corresponding published spectral indices in the middle-LWC estimation. The WI-3 ( ( R 900 R 1350 ) / ( R 970 R 1350 ) ) and WI-4 ( ( R 900 R 825 ) / ( R 970 R 1013 ) ) outperformed the WI with increase of R2 values by 10% and 41%, while the NDWSI-3 ( ( R 850 R 970 ) / ( R 850 + R 970 2 R 1200 ) ) and NDWSI-4 ( ( ( R 850 R 825 ) ( R 970 R 1013 ) ) / ( ( R 850 R 825 ) + ( R 970 R 1013 ) ) ) were superior over the NDWSI with increase of R2 values by 3% and 38%, respectively. Being more effective than the three-band RRD indices, the two four-band RRD indices reduced the saturation of spectral indices to some degree and increased the accuracy of LWC estimation, where the WI-4 and NDWSI-4 explained 82% and 84% of the variation in middle-LWC at the late stages.
Since the significant and linear relationships between middle-LWC vs. upper-LWC and middle-LWC vs. bottom-LWC (Figure 3c,d), along with the distinct sound behaviors of the WI-4 and NDWSI-4 indices which were clearly identifiable in Figure 7 with respect to the middle-LWC, we developed estimation models through a method of indirect induction for the upper-LWC and bottom-LWC respectively as follows:
y U p p e r L W C =   1 . 6105 × y M i d d l e L W C 43.908 y M i d d l e L W C =   a × S I + b
y B o t t o m L W C = 0 . 7447 × y M i d d l e L W C + 12.276 y M i d d l e L W C =   a × S I + b
where y U p p e r L W C , y B o t t o m L W C and y M i d d l e L W C indicate the LWC in the upper-, bottom- and middle-layer, respectively; SI indicates the WI-4 or NDWSI-4 index, which were formulated as Equations (11) and (13); coefficients a and b indicate the slope and intercept of estimation model based on the WI-4 or NDWSI-4, as shown in Figure 7c,f.

3.5. Validation of Vertical LWC Distribution Models

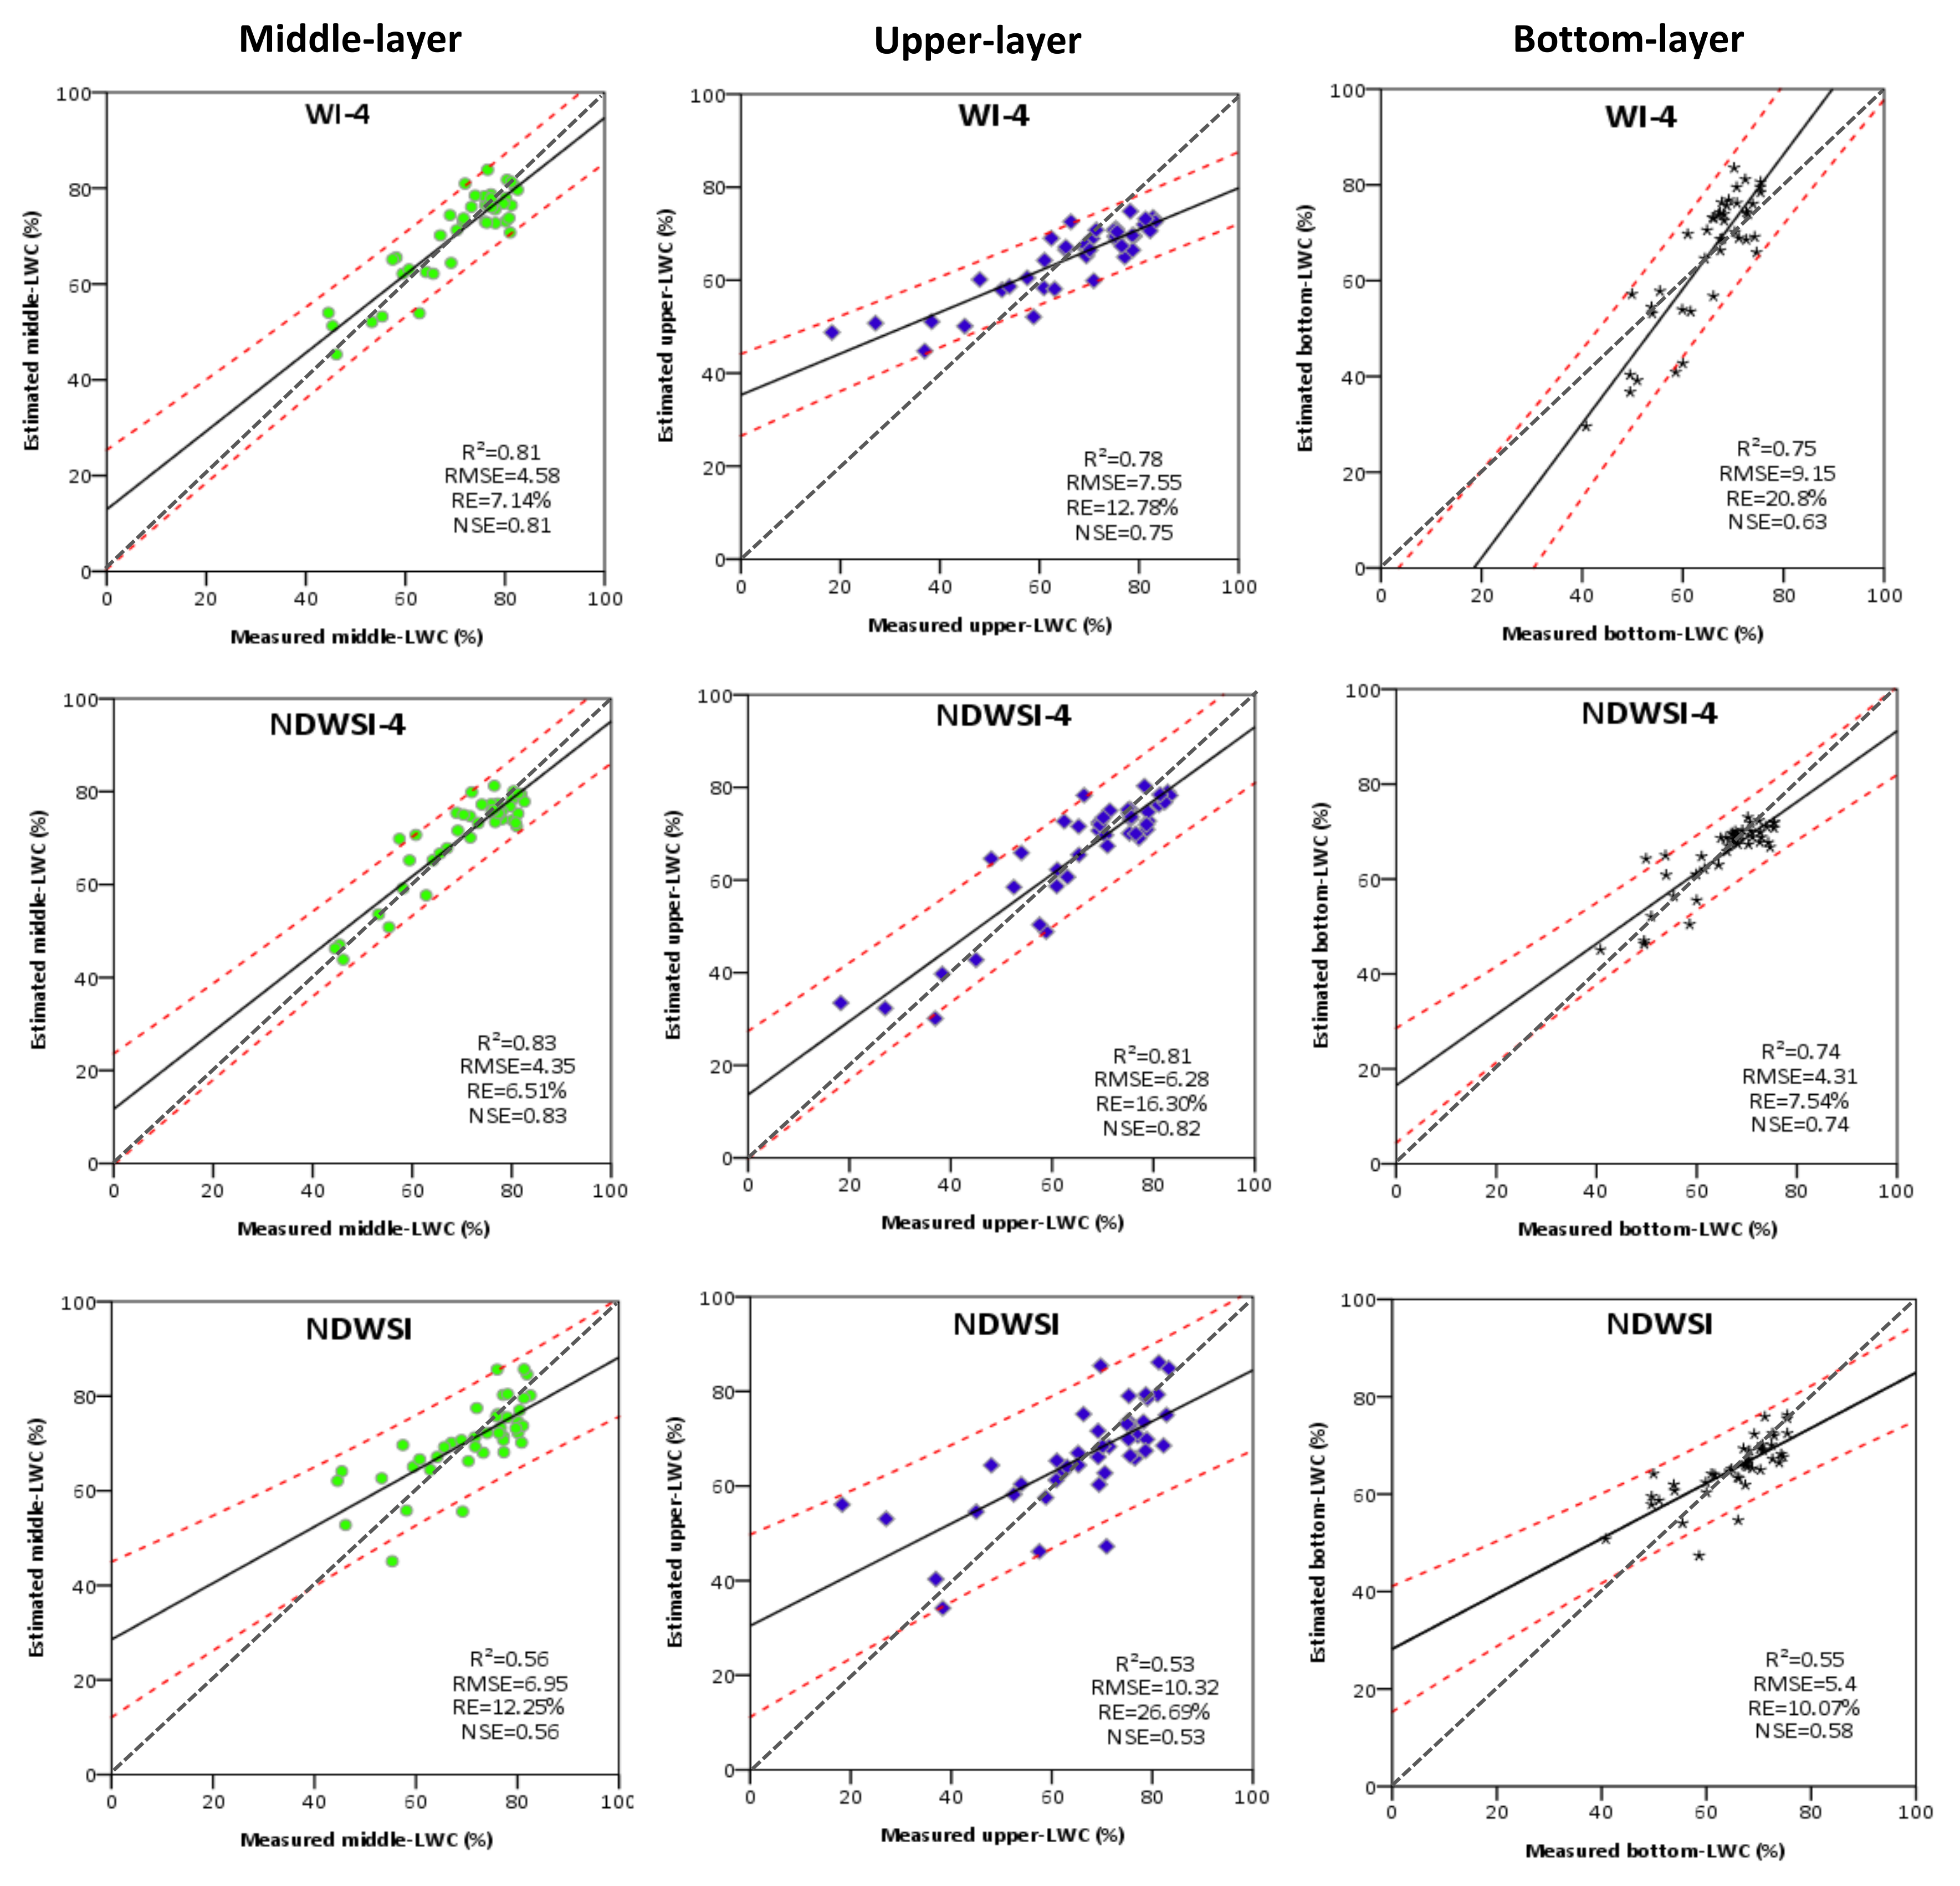
To validate the predictive ability and acceptability of the estimation models of vertical LWC described in Section 3.4, the estimated LWC in the middle-, upper- and bottom-layer, derived from models based on the WI-4, NDWSI-4 and the best performing published NDWSI, were compared to the measured LWC in the corresponding vertical layers (Figure 8). It can be observed that for all plots, all REs were less than 30%, NSEs were larger than 0.5, and almost all scatters fell into the 95% confidence intervals of prediction, confirming the acceptability of all models tested. The WI-4 and NDWSI-4 predictions for the LWC in the three vertical layers exhibited advantages over the published NDWSI (R2 < 0.6), which had led to very higher coefficients of determination (R2 ≥ 0.74). Specifically, for the middle-layer, we have found a very consistent agreement between LWC values measured and those estimated by WI-4 and NDWSI-4, with R2 and NSE values higher than 0.8, and REs lower than 10%. The NDWSI-4 models performed the best in estimating the LWC in the top two layers, which explained 83% and 81% the variations in middle-LWC and upper-LWC, respectively. For the bottom layer, the WI-4 and NDWSI-4 produced similar result, with R2 of 0.75 and 0.74. However, the NDWSI-4 estimate was more preferable, since it generated lower RMSE and RE values, as well as larger NSE, expressing distribution of scattering points being closer to the one-to-one line than the WI-4 estimate.
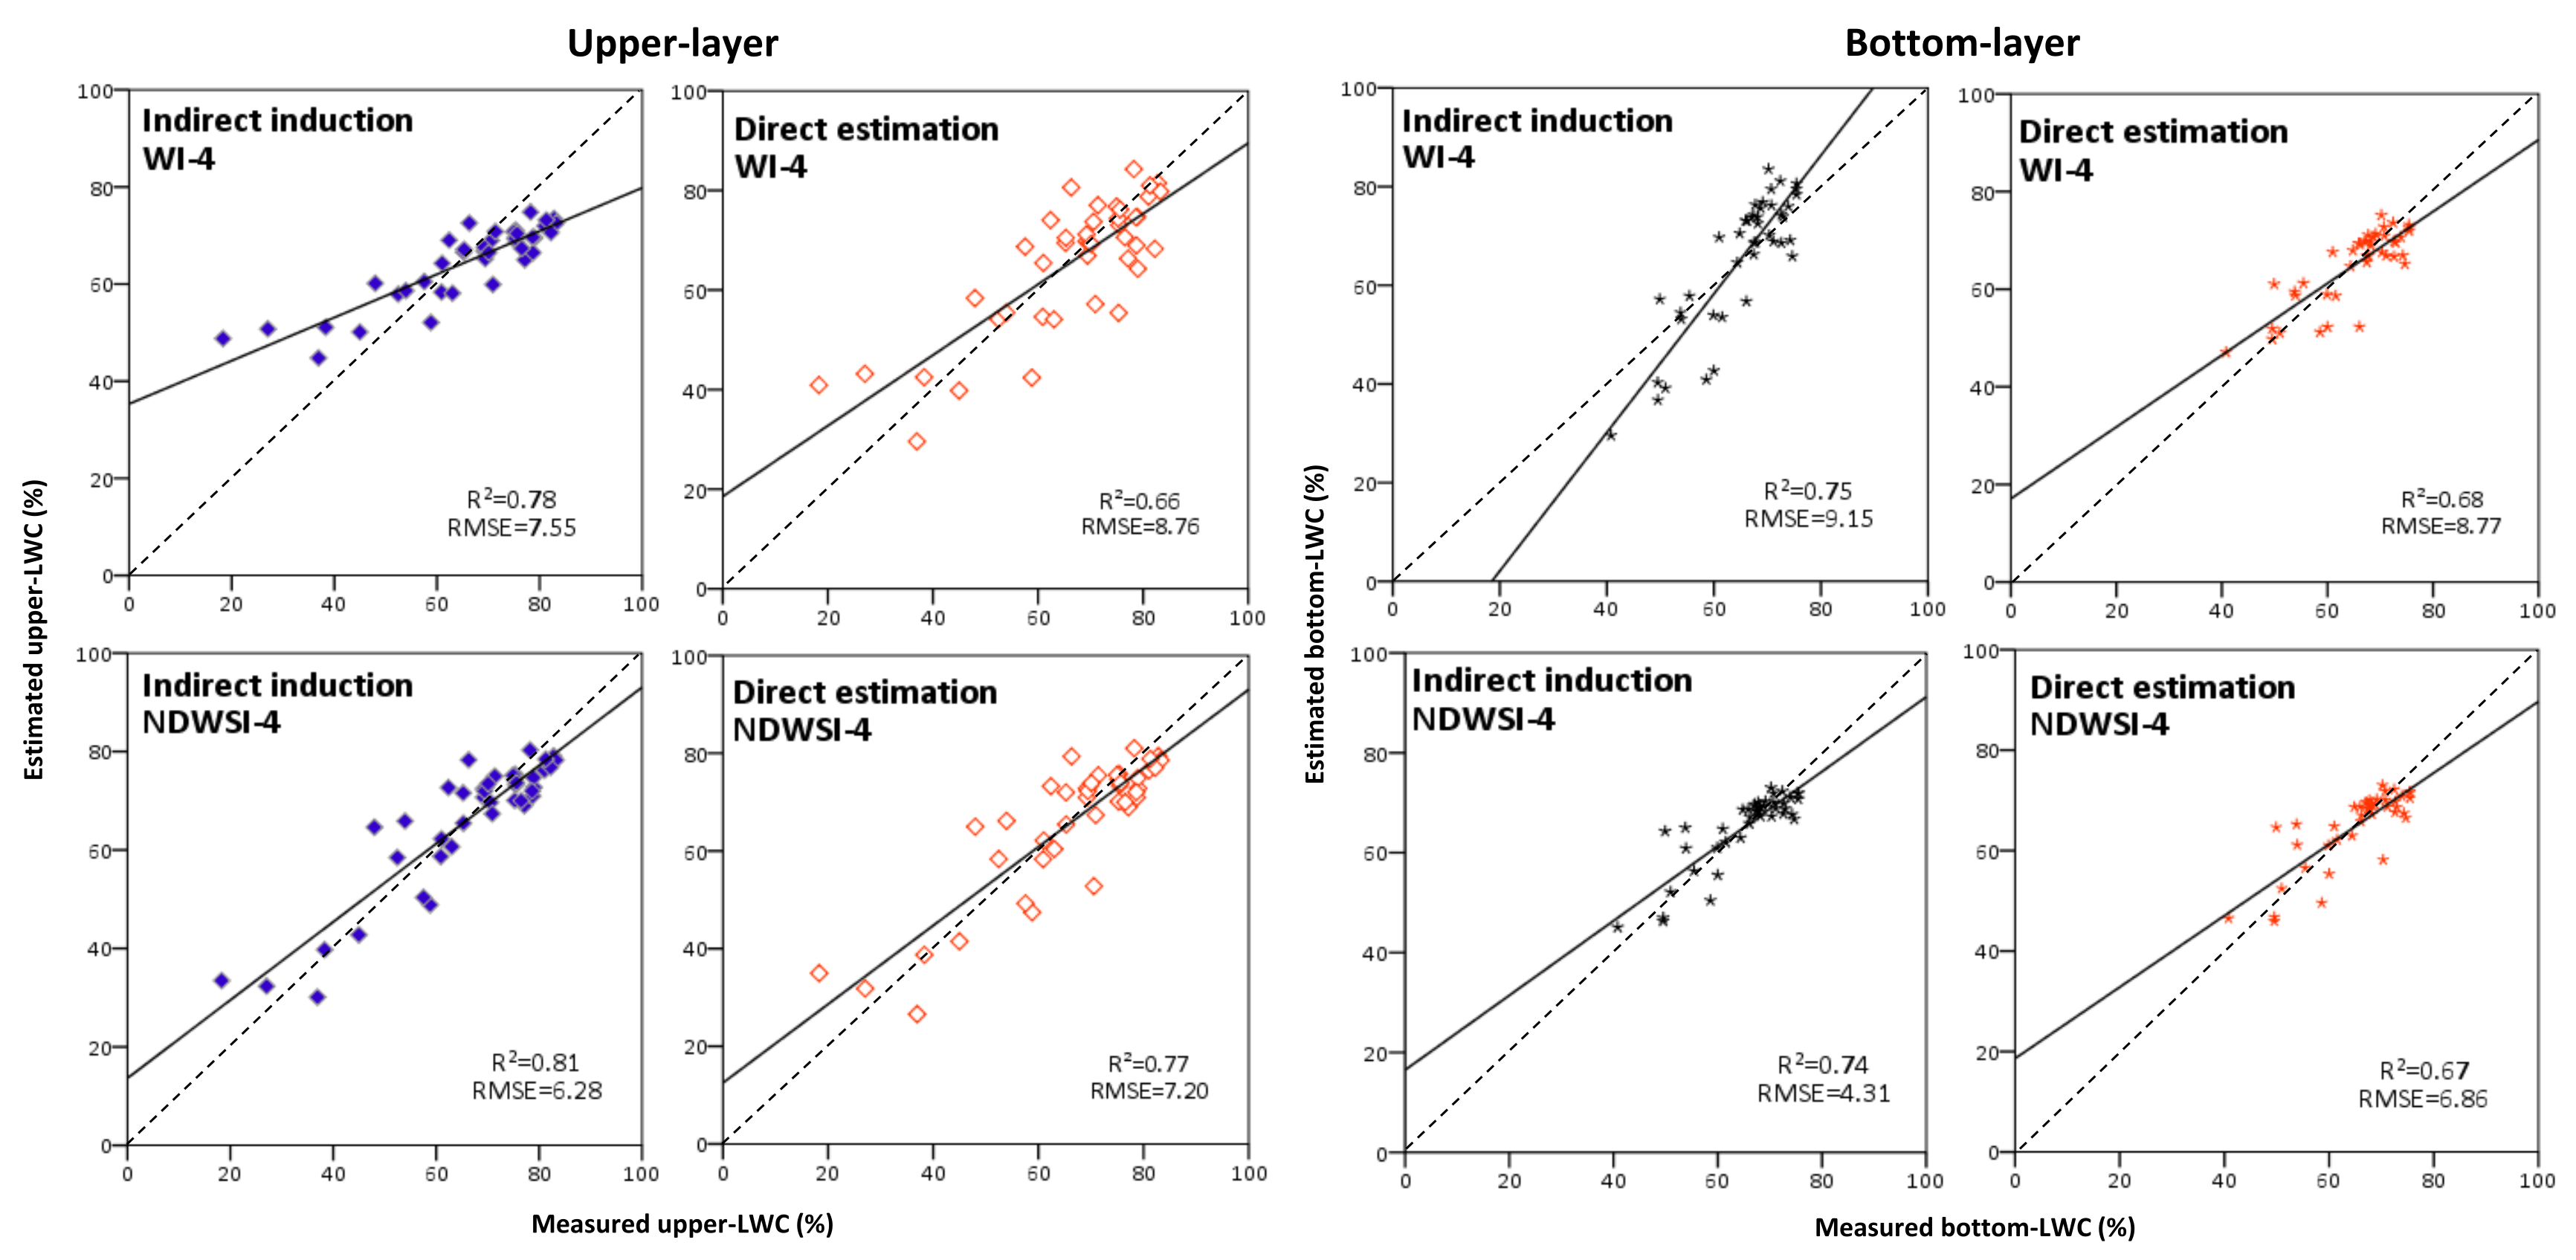
In order to evaluate whether the indirect induction method proposed in this study has merit in vertical LWC prediction, we compared it with the conventional direct estimation method. Linear estimation models between the upper-LWC and WI-4 and NDWSI-4, as well as between the bottom-LWC and WI-4 and NDWSI-4, were directly developed without taking into account the spikes effects and internal relationship of LWC among vertical layers. The model validations based on the two methods for the upper and bottom layers are shown in Figure 9. The most encouraging result is that, for the two layers, all LWC models established by the indirect induction method outperformed the models developed by the direct estimation, indicated by the increase in R2 from 0.66 to 0.78 and from 0.77 to 0.81 for the models based on the WI-4 and NDWSI-4 for the upper-LWC, while the increase in R2 from 0.68 to 0.75 and from 0.67 to 0.74 for the bottom-LWC, respectively.

4. Discussion

After the head emergence stage of winter wheat, wheat spikes grow out and the canopies become more and more dense, literature shows that leaf biochemical variables based on remote sensing technique perform well in the early stage, however, it tends to produce uncertainty or error during the reproductive stage [48], and then could result in more difficulties to monitor their vertical profile within canopies. Thus, it is vital to fully understand the effects of spikes on canopy reflectance and the detection degree of leaf information in different vertical layers by remotely sensed data, then to derive spectral indices to estimate vertical leaf biochemical parameters. In this work, we explored the remote estimation of the vertical distribution of LWC, considering the effects of spikes, using field data of winter wheat. From the chemical analyses determined in the laboratory, the variation trend in LWC, with higher values in the middle leaves than in the upper and bottom leaves across different growth phases and N rates, was in agreement with the results of Li et al. [23]. This is mostly because water is transported from the bottom shaded leaves to the top sunlit leaves, in an effort to provide materials to reach the maximum total canopy photosynthesis, but the top leaves (i.e., the fully expanded flag leaves) exhibited less LWC due to being more directly exposed to solar irradiance and consume more water through evapotranspiration [28].
The effects of spikes and other plant components (e.g., stem) on canopy spectral characteristics have gradually attracted attention, relevant researches have been conducted using wavelengths lower than 1000 nm [30,49]. However, spectral discrepancies across the whole spectrum required concern for an improved understanding of the interaction between spectral reflectance and leaf biochemical parameters across the canopy vertical profile. In this study, we investigated canopy spectral characteristics, before and after spikes removal, from 400 nm to 2500 nm, across different N rates, wheat cultivars and growth stages. Our results showed that the values of reflectance for the entire canopy were largely lower than those for the canopy without spikes at NIR and SWIR regions, which was similar to the findings of Haboudane et al. [8] and He et al. [50]. Based on the theory reported in literature, that a beam of radiation becomes diffuse as it passes through the crop canopy, and when it encounters different geometric structures of plant tissues, it will be scattered at each refractive discontinuity [51], the results from our study could be mainly explained by the fact that the emergence of spikes changed the original canopy structures, resulting in changes of the radiation path and light distribution within wheat canopies, and consequently influenced the multiple scattering effects of canopy reflectance, thereby inducing a decrease in spectral reflectance.
In comparison to the visible region, the emerged spikes had larger effects on the canopy reflectance ranged from NIR to SWIR (730–2500 nm), expressing larger variations in these regions (Figure 4). It should be noted that the reflectance of wavebands sensitive to leaf water or water stress were included as well. These bands were usually employed in leaf water-related spectral indices, in turn, led to the significant differences in their performances in estimating the vertical LWC before and after removing spikes. Gutierrez et al. [30] and He et al. [50] found that the spike effects could alter and make weaker relationships between spectral indices and crop variables (e.g., crop yield and LAI), our results showed similarities and differences with such findings through the controlled experiment for either remaining or removing wheat spikes. The appearance of spikes decreased the accuracy of the vertical distribution of LWC estimation, but there were differences in the degrees of the effects depending on the vertical layers, since the superior insensitivity of middle-LWC estimation to the spike effects were revealed, compared to the upper- and bottom-LWC estimation (especially for the NDWSI, WI, WBI and FWBI1 in Table 3). In addition, better correlation between spectral indices and the middle-LWC than the other two layers shown in this work (Table 4) were consistent with the results of Liu et al. [28], this provides an evident for differences of ability of the nadir remote sensing data in detecting vertical LWC. By comparing the finding reported in Li et al. [32], that the reflectance of leaves positioned in the upper layer contributed relative more to the reflected light gathered by sensors, the result of this study is probably because the spikes negatively affected the LWC information acquisition of upper leaves after head emergence stage, thus tending to obtain lower estimation accuracy than the middle-LWC.
Compared with the estimation of crop biochemical variables at the leaf or canopy scales, the estimation of their vertical distribution within canopies is challenging, especially during growth periods after spikes appearance. Some studies have attempted to explore a multi-angular remote sensing technology and conduct a great deal of work for enhancing the vertical variables retrieval [19,52]. Although this approach can provide more information on canopy vertical structure by viewing from different angles than that only from a single nadir direction, there are still shortcomings. For instance, complex operation and time-consuming operation of multi-angle spectral measurements [53], as well as the added uncertainty resulting from view angle effects on spectral indices [54]. Jacquemoud et al. [55] reported that the accuracy of vegetation parameters estimation depends largely on the retrieval technique. In this study, we tried to detect the vertical distribution of LWC within wheat canopies based on canopy reflectance obtained from the nadir observation, using a new method of indirect induction. Firstly, by consideration of the efficacy of remote sensing in detecting vertical LWC and the wheat spikes effects on the estimation of LWC in each vertical layer, we identified the most effective leaf layer (i.e., the middle layer) in which the spectral indices not only achieved the highest sensitive to the corresponding LWC but also less susceptible to the emergence of spikes, and developed the estimation model for this layer based on the MSC theory. Subsequently, accompanied with the significant internal relationship of LWC among vertical layers, the LWC in the remaining layers were indirectly deduced by the estimation model of the above effective layer. In the vertical LWC determination, our optimized three- or four-narrow-band spectral indices, WI-3, WI-4, NDWSI-3 and NDWSI-4, presented substantially better behavior in detecting the LWC across all the treatments than the original indices, in particular for the WI-4 and NDWSI-4 (R2 higher than 0.81 in middle-LWC assessment). These four new spectral indices were designed by adding one or two NIR bands into the WI and NDWSI on the basis of RRD formulation. Their advantage probably relies on the compensation of additive and multiplicative effects resulted from different canopy structures, anisotropic multiply scattering and soil background by using the MSC method, because the effects are common in the measurements of canopy spectral reflectance but have nothing to do with leaf biochemical parameters, i.e., LWC in this study. Similarly, the formula of RRD was also used by researchers to develop spectral indices, such as the modified SR ( m S R 705 = ( R 750 R 445 ) / ( R 705 R 445 ) ) and modified NDVI ( m N D 705 = ( R 750 R 705 ) / ( R 750 + R 705 2 R 445 ) ) , the MERIS terrestrial chlorophyll index ( M T C I = ( R 754 R 709 ) / ( R 709 R 681 ) ) , the structure-insensitive pigment index ( S I P I = ( R 800 R 445 ) / ( R 800 R 680 ) ) and the modified difference ratio ( M D R = ( R 1271 R 410 ) / ( R 1342 R 410 ) ) [7,56,57,58], they all have been proven to be an improvement in terms of sensitivity to leaf pigment and leaf water contents when applied across a wide range of plant species, leaf structures and growth stages. From the comparison results between methods of the indirect induction and the conventional direct estimation (Figure 9), we concluded that the newly proposed approach contributed to achieve the higher potential of canopy spectra obtained from the nadir direction in monitoring vertical profiles of LWC after head emergence of wheat. Due to the limitation of samples, this method needs to be further studied by more experimental data and crop cultivars with different geometry types in the future. Although an increasing number of optical satellite images are freely available, the use of space-based imaging spectroscopy to quantify the vertical LWC distribution within crop canopies is still relatively challenging, because of the limited spatial and spectral resolutions. However, the application of narrow-band spectral indices to detect leaf biochemical parameter details has been an intended goal for studies of canopy physiology and ecology, our results provides support for the selection of spectral bands to design future sensors, and eventually to advance the identification and mapping of the vertical LWC from satellite data.

5. Conclusions

This study shows that leaf water content (LWC) within winter wheat canopies tended to be higher in the middle layer and lower in the upper and bottom layers, the middle-LWC yielded very strong correlations with the upper-LWC and bottom-LWC after head emergence stage. The effects of wheat spikes on canopy reflectance were analyzed. We found that the presence of spikes had significant effects on the reflectance in NIR to SWIR spectral regions, with the water absorption bands included. In addition, the spikes effects negatively impacted on the estimation of LWC in the vertical layers. However, LWC in the middle layer was identified to be the most highly sensitive to almost all earlier proposed water-related spectral indices and be more resistant to wheat spikes effects, showing an advantage over the upper and bottom layers. This implied the potential of applying middle-LWC estimation models to extend the determination of LWC also in the other layers. Based on the results, a method of indirect induction was proposed to establish models of vertical distribution of LWC, by considering the effects of wheat spikes. The narrow-band WI-4 ( ( R 900 R 825 ) / ( R 970 R 1013 ) ) and NDWSI-4 ( ( ( R 850 R 825 ) ( R 970 R 1013 ) ) / ( ( R 850 R 825 ) + ( R 970 R 1013 ) ) ) indices were developed based on the multiply signal correction theory and achieved the highest sensitivity in capturing variations in the middle-LWC. Importantly, the prediction accuracy of LWC in the upper and bottom layers was shown to be improved by the indirect models derived from these two indices, compared to the direct estimation. Future studies on more crop or vegetation species will be of importance for validating and improving the method developed here.

Author Contributions

W.K. processed and analyzed the field measurements and hyperspectral data, and wrote the manuscript. W.H., L.T. and C.L. guided the data analysis and provided suggestions for the study. L.M. and X.Z. designed the experiment and were involved in the ground data collection. R.C. revised, provided suggestions and edited the manuscript. All authors have read and agreed to the published version of the manuscript.

Funding

This work was founded by the National Natural Science Foundation of China (Grant No. 41901369), the Bureau of International Co-operation Chinese Academy of Sciences (Grant No. 181811KYSB20160040), the Special Fund for Basic Scientific Research Project in the central scientific research institutes (Institute of Grassland Research of CAAS) (Grant No. 1610332020026), and the Natural Science Foundation of Zhejiang Province (Grant No. LQ19D010009).

Institutional Review Board Statement

Not applicable.

Informed Consent Statement

Not applicable.

Data Availability Statement

The datasets referred to in this paper are available from the corresponding author on reasonable request.

Acknowledgments

The authors are grateful to Hong Chang, Bin Wu and Huiqin Ma for their assistance in data collection. The authors are grateful to the reviewers for their helpful comments. We also would like to acknowledge the contributions from the field campaign at the National Experimental Station for Precision Agriculture, Beijing, China.

Conflicts of Interest

The authors declare no conflict of interest.

References

  1. Sydoruk, V.A.; Fiorani, F.; Jahnke, S.; Krause, H.-J. Design and characterization of microwave cavity resonators for noninvasive monitoring of plant water distribution. IEEE Trans. Microw. Theory Tech. 2016, 64, 2894–2904. [Google Scholar] [CrossRef]
  2. Brown, S.C.; Keatinge, J.D.H.; Gregory, P.J.; Cooper, P.J.M. Effects of fertilizer, variety and location on barley production under rainfed conditions in northern syria 1. Root and shoot growth. Field Crop. Res. 1987, 16, 53–66. [Google Scholar] [CrossRef]
  3. Cooper, P.J.M.; Gregory, P.J.; Keatinge, J.D.H.; Brown, S.C. Effects of fertilizer, variety and location on barley production under rainfed conditions in northern syria 2. Soil water dynamics and crop water use. Field Crop. Res. 1987, 16, 67–84. [Google Scholar] [CrossRef]
  4. Quintero, J.M.; Fournier, J.M.; Benlloch, M. Water transport in sunflower root systems: Effects of aba, ca2+ status and hgcl2. J. Exp. Bot. 1999, 50, 1607–1612. [Google Scholar] [CrossRef]
  5. Lawlor, D.W.; Cornic, G. Photosynthetic carbon assimilation and associated metabolism in relation to water deficits in higher plants. Plant Cell Environ. 2002, 25, 275–294. [Google Scholar] [CrossRef] [Green Version]
  6. Araus, J.L.; Slafer, G.A.; Royo, C.; Dolores Serret, M. Breeding for yield potential and stress adaptation in cereals. Crit. Rev. Plant Sci. 2008, 27, 377–412. [Google Scholar] [CrossRef]
  7. Sims, D.A.; Gamon, J.A. Relationships between leaf pigment content and spectral reflectance across a wide range of species, leaf structures and developmental stages. Remote Sens. Environ. 2002, 81, 337–354. [Google Scholar] [CrossRef]
  8. Haboudane, D.; Miller, J.R.; Pattey, E.; Zarco-Tejada, P.J.; Strachan, I.B. Hyperspectral vegetation indices and novel algorithms for predicting green lai of crop canopies: Modeling and validation in the context of precision agriculture. Remote Sens. Environ. 2004, 90, 337–352. [Google Scholar] [CrossRef]
  9. Clevers, J.; Kooistra, L. Using hyperspectral remote sensing data for retrieving canopy chlorophyll and nitrogen content. IEEE J. Sel. Top. Appl. Earth Obs. Remote Sens. 2012, 5, 574–583. [Google Scholar] [CrossRef]
  10. Campos-Taberner, M.; Garcia-Haro, F.J.; Camps-Valls, G.; Grau-Muedra, G.; Nutini, F.; Crema, A.; Boschetti, M. Multitemporal and multiresolution leaf area index retrieval for operational local rice crop monitoring. Remote Sens. Environ. 2016, 187, 102–118. [Google Scholar] [CrossRef]
  11. Ihuoma, S.O.; Madramootoo, C.A. Recent advances in crop water stress detection. Comput. Electron. Agric. 2017, 141, 267–275. [Google Scholar] [CrossRef]
  12. Peng, Z.G.; Lin, S.Z.; Zhang, B.Z.; Wei, Z.; Liu, L.; Han, N.N.; Cai, J.B.; Chen, H. Winter wheat canopy water content monitoring based on spectral transforms and “three-edge” parameters. Agric. Water Manag. 2020, 240, 106306. [Google Scholar] [CrossRef]
  13. Rasheed, F.; Delagrange, S.; Lorenzetti, F. Detection of plant water stress using leaf spectral responses in three poplar hybrids prior to the onset of physiological effects. Int. J. Remote Sens. 2020, 41, 5127–5146. [Google Scholar] [CrossRef]
  14. Penuelas, J.; Pinol, J.; Ogaya, R.; Filella, I. Estimation of plant water concentration by the reflectance water index wi (r900/r970). Int. J. Remote Sens. 1997, 18, 2869–2875. [Google Scholar] [CrossRef]
  15. Gao, B.C. Ndwi—A normalized difference water index for remote sensing of vegetation liquid water from space. Remote Sens. Environ. 1996, 58, 257–266. [Google Scholar] [CrossRef]
  16. Zarco-Tejada, P.J.; Rueda, C.A.; Ustin, S.L. Water content estimation in vegetation with modis reflectance data and model inversion methods. Remote Sens. Environ. 2003, 85, 109–124. [Google Scholar] [CrossRef]
  17. Ciganda, V.; Gitelson, A.; Schepers, J. Vertical profile and temporal variation of chlorophyll in maize canopy: Quantitative “crop vigor” indicator by means of reflectance-based techniques. Agron. J. 2008, 100, 1409–1417. [Google Scholar] [CrossRef] [Green Version]
  18. Widlowski, J.L.; Taberner, M.; Pinty, B.; Bruniquel-Pinel, V.; Disney, M.; Fernandes, R.; Gastellu-Etchegorry, J.P.; Gobron, N.; Kuusk, A.; Lavergne, T.; et al. Third radiation transfer model intercomparison (rami) exercise: Documenting progress in canopy reflectance models. J. Geophys. Res.-Atmos. 2007, 112. [Google Scholar] [CrossRef] [Green Version]
  19. Huang, W.J.; Yang, Q.Y.; Pu, R.L.; Yang, S.Y. Estimation of nitrogen vertical distribution by bi-directional canopy reflectance in winter wheat. Sensors 2014, 14, 20347–20359. [Google Scholar] [CrossRef] [Green Version]
  20. He, J.Y.; Zhang, X.B.; Guo, W.T.; Pan, Y.Y.; Yao, X.; Cheng, T.; Zhu, Y.; Cao, W.X.; Tian, Y.C. Estimation of vertical leaf nitrogen distribution within a rice canopy based on hyperspectral data. Front. Plant Sci. 2020, 10, 1802. [Google Scholar] [CrossRef]
  21. Wang, Q.; Li, P.H. Canopy vertical heterogeneity plays a critical role in reflectance simulation. Agric. For. Meteorol. 2013, 169, 111–121. [Google Scholar] [CrossRef]
  22. Ye, H.C.; Huang, W.J.; Huang, S.Y.; Wu, B.; Dong, Y.Y.; Cui, B. Remote estimation of nitrogen vertical distribution by consideration of maize geometry characteristics. Remote Sens. 2018, 10, 17. [Google Scholar] [CrossRef] [Green Version]
  23. Li, H.; Zhao, C.; Yang, G.; Feng, H. Variations in crop variables within wheat canopies and responses of canopy spectral characteristics and derived vegetation indices to different vertical leaf layers and spikes. Remote Sens. Environ. 2015, 169, 358–374. [Google Scholar] [CrossRef]
  24. Ciganda, V.S.; Gitelson, A.A.; Schepers, J. How deep does a remote sensor sense? Expression of chlorophyll content in a maize canopy. Remote Sens. Environ. 2012, 126, 240–247. [Google Scholar] [CrossRef]
  25. Luo, J.H.; Ma, R.H.; Feng, H.H.; Li, X.C. Estimating the total nitrogen concentration of reed canopy with hyperspectral measurements considering a non-uniform vertical nitrogen distribution. Remote Sens. 2016, 8, 789. [Google Scholar] [CrossRef] [Green Version]
  26. Zhao, C.J.; Li, H.L.; Li, P.S.; Yang, G.J.; Gu, X.H.; Lan, Y.B. Effect of vertical distribution of crop structure and biochemical parameters of winter wheat on canopy reflectance characteristics and spectral indices. IEEE Geosci. Remote Sens. Mag. 2017, 55, 236–247. [Google Scholar] [CrossRef]
  27. Li, L.; Jakli, B.; Lu, P.; Ren, T.; Ming, J.; Liu, S.; Wang, S.; Lu, J. Assessing leaf nitrogen concentration of winter oilseed rape with canopy hyperspectral technique considering a non-uniform vertical nitrogen distribution. Ind. Crop. Prod. 2018, 116, 1–14. [Google Scholar] [CrossRef]
  28. Liu, S.S.; Peng, Y.; Du, W.; Le, Y.; Li, L. Remote estimation of leaf and canopy water content in winter wheat with different vertical distribution of water-related properties. Remote Sens. 2015, 7, 4626–4650. [Google Scholar] [CrossRef] [Green Version]
  29. Slaton, M.R.; Hunt, E.R.; Smith, W.K. Estimating near-infrared leaf reflectance from leaf structural characteristics. Am. J. Bot. 2001, 88, 278–284. [Google Scholar] [CrossRef]
  30. Gutierrez, M.; Paul Reynolds, M.; Klatt, A.R. Effect of leaf and spike morphological traits on the relationship between spectral reflectance indices and yield in wheat. Int. J. Remote Sens. 2015, 36, 701–718. [Google Scholar] [CrossRef]
  31. Gaju, O.; DeSilva, J.; Carvalho, P.; Hawkesford, M.J.; Griffiths, S.; Greenland, A.; Foulkes, M.J. Leaf photosynthesis and associations with grain yield, biomass and nitrogen-use efficiency in landraces, synthetic-derived lines and cultivars in wheat. Field Crop. Res. 2016, 193, 1–15. [Google Scholar] [CrossRef]
  32. Li, H.; Zhao, C.; Huang, W.; Yang, G. Non-uniform vertical nitrogen distribution within plant canopy and its estimation by remote sensing: A review. Field Crop. Res. 2013, 142, 75–84. [Google Scholar] [CrossRef]
  33. Jones, C.L.; Weckler, P.R.; Maness, N.O.; Stone, M.L.; Jayasekara, R. Estimating water stress in plants using hyperspectral sensing. System 2004. [Google Scholar] [CrossRef]
  34. Hunt, E.R., Jr.; Rock, B.N. Detection of changes in leaf water content using near- and middle-infrared reflectances. Remote Sens. Environ. 1989, 30, 43–54. [Google Scholar]
  35. Xu, H.R.; Ying, Y.B.; Fu, X.P.; Zhu, S.P. Near-infrared spectroscopy in detecting leaf miner damage on tomato leaf. Biosyst. Eng. 2007, 96, 447–454. [Google Scholar] [CrossRef]
  36. Hardisky, M.; Klemas, V.; Smart, R. The influence of soil salinity, growth form, and leaf moisture on the spectral radiance of spartina alterniflora canopies. Photogramm. Eng. Remote Sens. 1983, 49, 77–83. [Google Scholar]
  37. Eitel, J.U.H.; Gessler, P.E.; Smith, A.M.S.; Robberecht, R. Suitability of existing and novel spectral indices to remotely detect water stress in populus spp. For. Ecol. Manag. 2006, 229, 170–182. [Google Scholar] [CrossRef]
  38. Seelig, H.-D.; Hoehn, A.; Stodieck, L.S.; Klaus, D.M.; Adams, W.W.; Emery, W.J. Plant water parameters and the remote sensing r (1300)/r (1450) leaf water index: Controlled condition dynamics during the development of water deficit stress. Irrig. Sci. 2009, 27, 357–365. [Google Scholar] [CrossRef]
  39. Hunt, E.R.; Daughtry, C.S.T.; Eitel, J.U.H.; Long, D.S. Remote sensing leaf chlorophyll content using a visible band index. Agron. J. 2011, 103, 1090–1099. [Google Scholar] [CrossRef] [Green Version]
  40. Kim, D.M.; Zhang, H.; Zhou, H.; Du, T.; Wu, Q.; Mockler, T.C.; Berezin, M.Y. Highly sensitive image-derived indices of water-stressed plants using hyperspectral imaging in swir and histogram analysis. Sci. Rep. 2015, 5, 1–11. [Google Scholar] [CrossRef] [Green Version]
  41. Strachan, I.B.; Pattey, E.; Boisvert, J.B. Impact of nitrogen and environmental conditions on corn as detected by hyperspectral reflectance. Remote Sens. Environ. 2002, 80, 213–224. [Google Scholar] [CrossRef]
  42. Harris, A.; Bryant, R.G.; Baird, A.J. Mapping the effects of water stress on sphagnum: Preliminary observations using airborne remote sensing. Remote Sens. Environ. 2006, 100, 363–378. [Google Scholar] [CrossRef]
  43. Datt, B. Remote sensing of water content in eucalyptus leaves. Aust. J. Bot. 1999, 47, 909–923. [Google Scholar] [CrossRef]
  44. Geladi, P.; Macdougall, D.; Martens, H. Linearization and scatter-correction for near-infrared reflectance spectra of meat. Appl. Spectrosc. 1985, 39, 491–500. [Google Scholar] [CrossRef]
  45. Richter, K.; Atzberger, C.; Hank, T.B.; Mauser, W. Derivation of biophysical variables from earth observation data: Validation and statistical measures. J. Appl. Remote Sens. 2012, 6, 063557. [Google Scholar] [CrossRef]
  46. Jamieson, P.D.; Porter, J.R.; Wilson, D.R. A test of the computer-simulation model arc-wheat1 on wheat crops grown in new zealand. Field Crop. Res. 1991, 27, 337–350. [Google Scholar] [CrossRef]
  47. Yu, K.; Lenz-Wiedemann, V.; Chen, X.; Bareth, G. Estimating leaf chlorophyll of barley at different growth stages using spectral indices to reduce soil background and canopy structure effects. ISPRS J. Photogramm. Remote Sens. 2014, 97, 58–77. [Google Scholar] [CrossRef]
  48. Raj, R.; Walker, J.P.; Pingale, R.; Nandan, R.; Naik, B.; Jagarlapudi, A. Leaf area index estimation using top-of-canopy airborne rgb images. Int. J. Appl. Earth Obs. Geoinf. 2021, 96, 102282. [Google Scholar] [CrossRef]
  49. Yu, K.Q.; Zhao, Y.R.; Li, X.L.; Shao, Y.N.; Liu, F.; He, Y. Hyperspectral imaging for mapping of total nitrogen spatial distribution in pepper plant. PLoS ONE 2014, 9, e116205. [Google Scholar] [CrossRef]
  50. He, J.; Zhang, N.; Su, X.; Lu, J.; Yao, X.; Cheng, T.; Zhu, Y.; Cao, W.; Tian, Y. Estimating leaf area index with a new vegetation index considering the influence of rice panicles. Remote Sens. 2019, 11, 1809. [Google Scholar] [CrossRef] [Green Version]
  51. Grant, L. Diffuse and specular characteristics of leaf reflectance. Remote Sens. Environ. 1987, 22, 309–322. [Google Scholar] [CrossRef]
  52. Kong, W.; Huang, W.; Casa, R.; Zhou, X.; Ye, H.; Dong, Y. Off-nadir hyperspectral sensing for estimation of vertical profile of leaf chlorophyll content within wheat canopies. Sensors 2017, 17, 2711. [Google Scholar] [CrossRef] [Green Version]
  53. Roosjen, P.P.J.; Brede, B.; Suomalainen, J.M.; Bartholomeus, H.M.; Kooistra, L.; Clevers, J.G.P.W. Improved estimation of leaf area index and leaf chlorophyll content of a potato crop using multi-angle spectral data—potential of unmanned aerial vehicle imagery. Int. J. Appl. Earth Obs. Geoinf. 2018, 66, 14–26. [Google Scholar] [CrossRef]
  54. Verrelst, J.; Schaepman, M.E.; Koetz, B.; Kneubuehler, M. Angular sensitivity analysis of vegetation indices derived from chris/proba data. Remote Sens. Environ. 2008, 112, 2341–2353. [Google Scholar] [CrossRef]
  55. Jacquemoud, S.; Bacour, C.; Poilve, H.; Frangi, J.P. Comparison of four radiative transfer models to simulate plant canopies reflectance: Direct and inverse mode. Remote Sens. Environ. 2000, 74, 471–481. [Google Scholar] [CrossRef]
  56. Dash, J.; Curran, P.J. The meris terrestrial chlorophyll index. Int. J. Remote. Sens. 2004, 25, 5403–5413. [Google Scholar] [CrossRef]
  57. Penuelas, J.; Baret, F.; Filella, I. Semiempirical indices to assess carotenoids chlorophyll a ratio from leaf spectral reflectance. Photosynthetica 1995, 31, 221–230. [Google Scholar]
  58. Li, X.A.; Sun, Z.Q.; Lu, S.; Omasa, K.J. A multi-angular invariant spectral index for the estimation of leaf water content across a wide range of plant species in different growth stages. Remote Sens. Environ. 2021, 253, 19. [Google Scholar] [CrossRef]
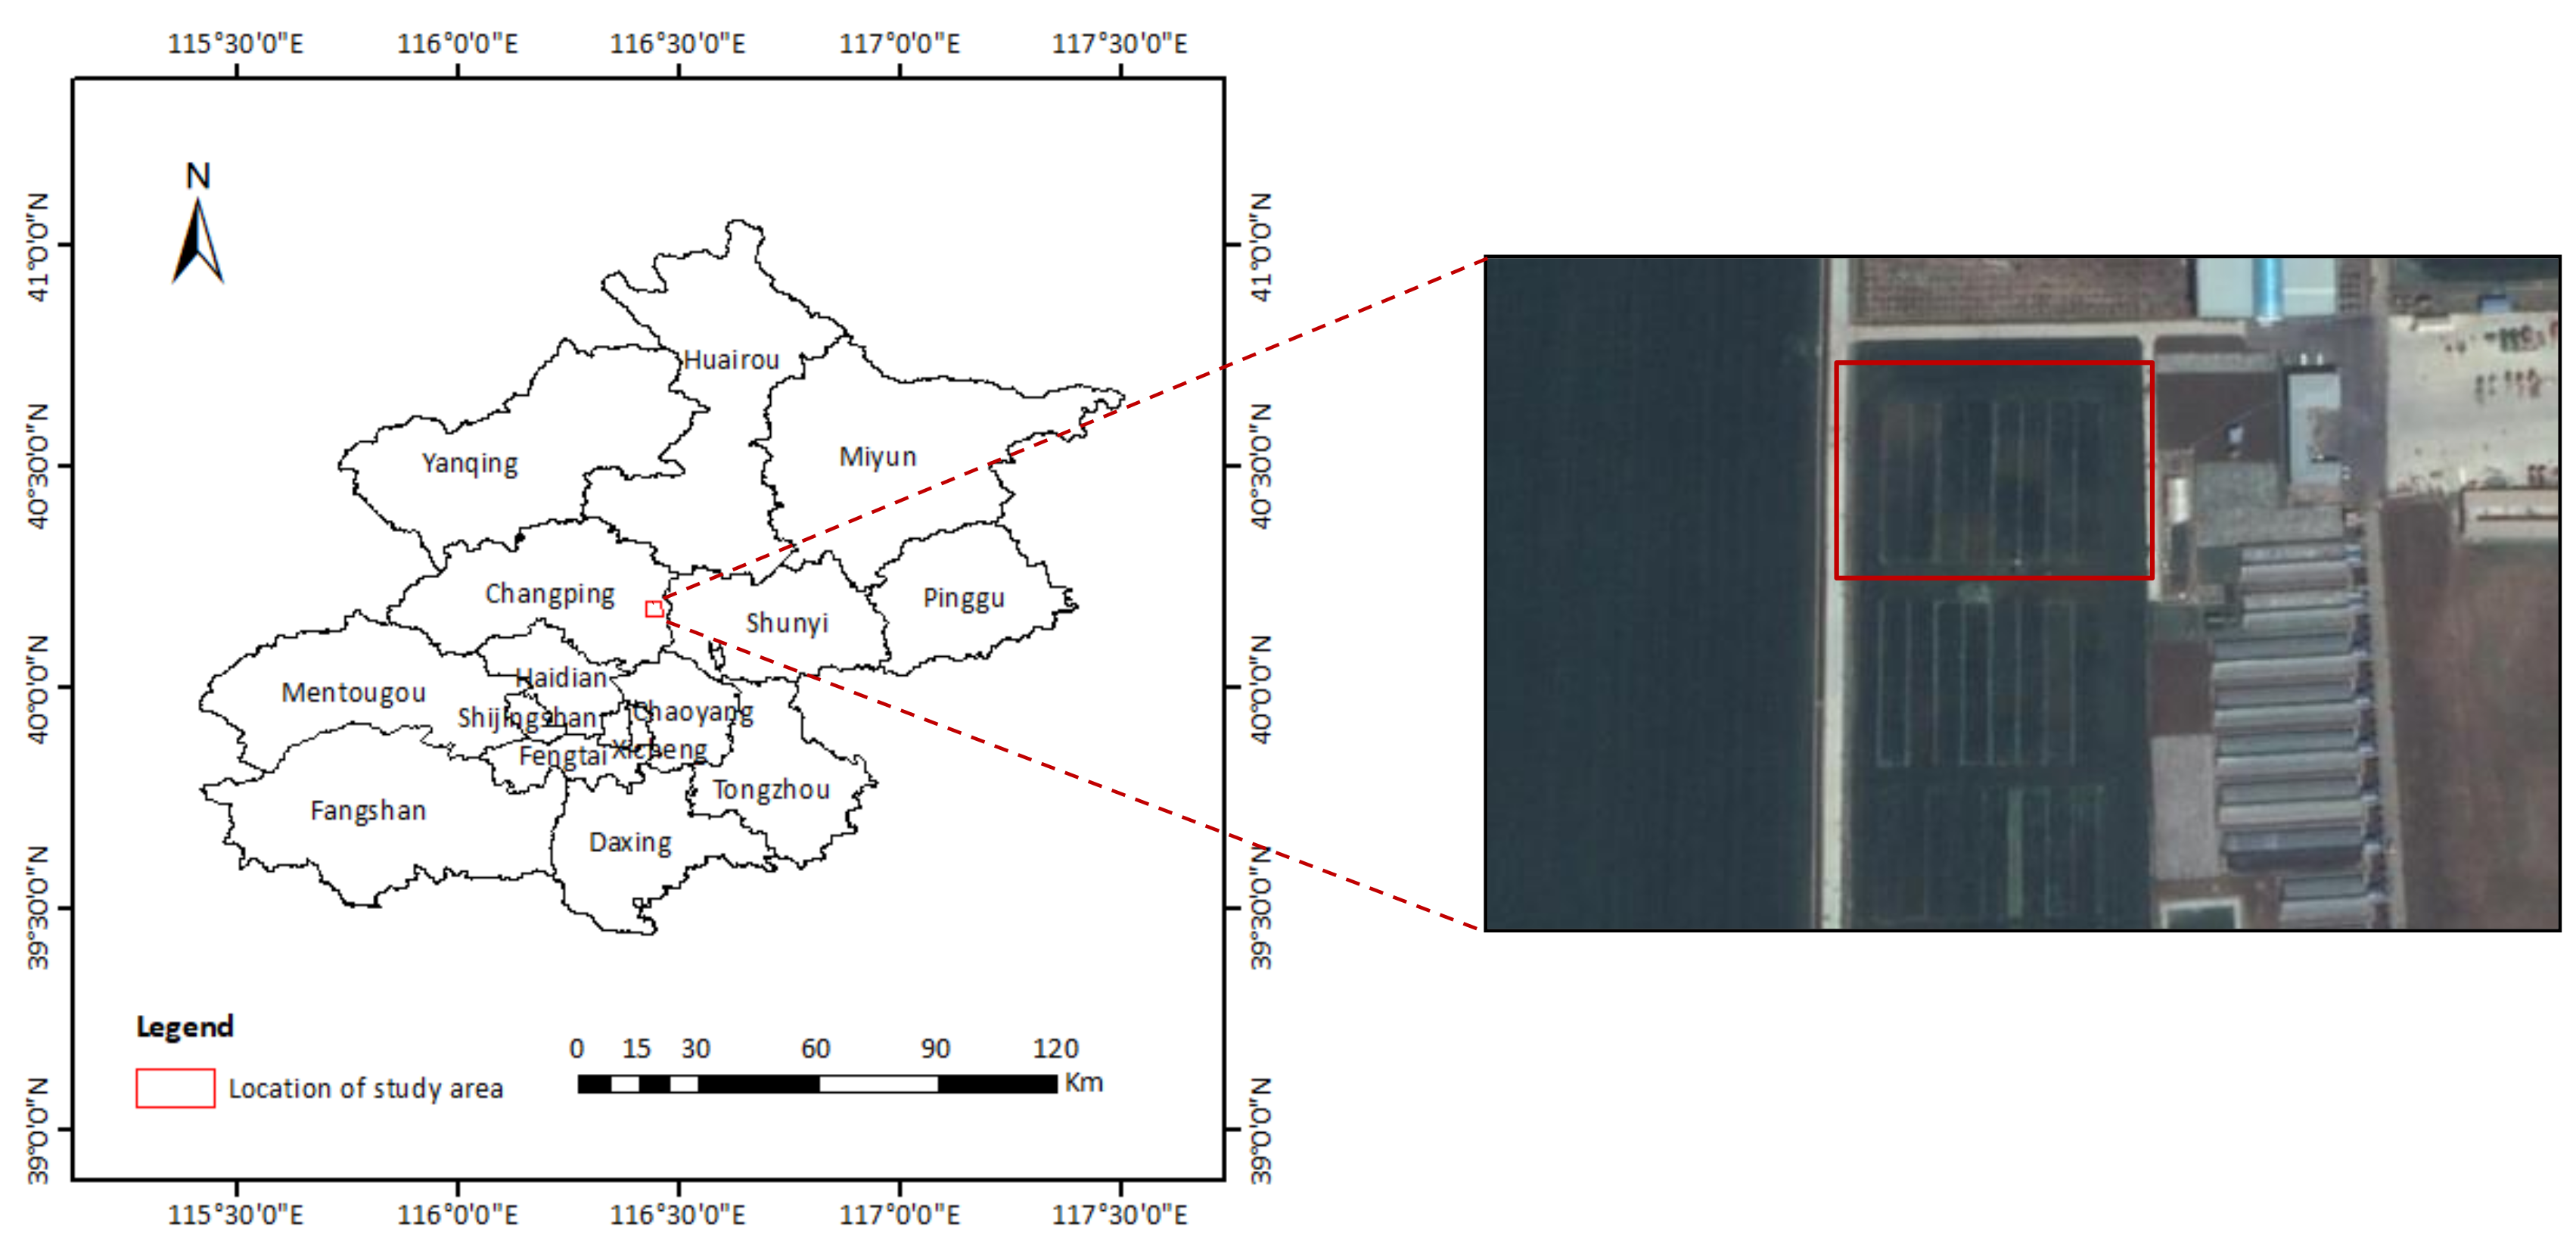
Figure 1. The location of the study area.
Remotesensing 13 04125 g001
Figure 2. The schematic diagram of vertical division of leaves within wheat canopy.
Remotesensing 13 04125 g002
Figure 3. Vertical profiles of LWC within wheat canopies (a) at different growth stages; (b) under different N treatments at the head emergence stage (Z54), error bars represent standard deviation of vertical LWC measurements; the relationships between (c) the middle-LWC vs. the upper-LWC and (d) the middle-LWC vs. the bottom-LWC for both experiments.
Remotesensing 13 04125 g003
Figure 4. Spectral reflectance of the entire wheat canopy and the canopy without spikes (a) at different growth stages under the N300 treatment, and (b) under different N treatments at the milk-filling stage (Z73).
Remotesensing 13 04125 g004
Figure 5. The relative variation rate (Rv) of R2 of relationships between published spectral indices and LWC in the upper-, middle- and bottom-layer before and after removing spikes.
Remotesensing 13 04125 g005
Figure 6. The R2 curves between middle-LWC vs. (a) the WI-3 and (b) NDWSI-3 indices when using each waveband over 400–2500 nm as the third band ( λ 3 ); R2 contour maps between middle-LWC vs. (c) the WI-4 and (d) NDWSI-4 indices when using all possible combinations over 400–2500 nm as the third ( λ 3 ) and forth bands ( λ 4 ).
Remotesensing 13 04125 g006
Figure 7. Scattering plots of relationships between the optimal RRD type of indices/the corresponding published spectral indices and the middle-LWC for the entire canopy. Subplots (ac) show the relationships between the WI, WI-3, WI-4 and middle-LWC respectively, subplots (df) show the relationships between the NDWSI, NDWSI-3, NDWSI-4 and middle-LWC respectively.
Remotesensing 13 04125 g007
Figure 8. Validation of estimation models derived from the WI-4, NDWSI-4 and NDWSI for the middle-LWC (green point), the upper-LWC (blue diamond) and the bottom-LWC (black star). The black solid lines indicate linear fits, black dash lines indicate 1:1 line, red dash lines indicate the 95% confidence intervals of prediction.
Remotesensing 13 04125 g008
Figure 9. Comparison of validation models between measured LWC and estimated LWC in the upper-layer (blue diamond and red diamond) and bottom-layer (black star and red star) using the indirect induction and direct estimation methods. The four subplots in the first line are validation results based on the WI-4 for the upper- and bottom-layer, whereas the four subplots in the second line are validation results based on the NDWSI-4 for the upper- and bottom-layer.
Remotesensing 13 04125 g009
Table 1. Published spectral indices used in this study.
Spectral IndexFormulaReference
Water index (WI) W I = R 900 R 970 [14]
Normalized difference water index (NDWI) N D W I = R 860 R 1240 R 860 + R 1240 [15]
Moisture stress index (MSI) M S I = R 1600 R 820 [34]
Water band index (WBI) W B I = R 970 R 900 [35]
WBI/normalized difference vegetation index (WBI/NDVI) W B I / N D V I = R 970 R 900 / R 800 R 680 R 800 + R 680 [14]
Normalized difference infrared index (NDII) N D I I = R 850 R 1650 R 850 + R 1650 [36]
Reciprocal of moisture stress index (RMSI) R M S I = R 860 R 1650 [36]
Simple ratio water index (SRWI) S R W I = R 860 R 1240 [16]
Maximum difference water index (MDWI) M D W I = R max 1500 1750 R min 1500 1750 R max 1500 1750 + R min 1500 1750 [37]
Composite water index (CWI) C W I = R 1660 × R 1820 [13]
Leaf water index (LWI) L W I = R 1300 R 1450 [38]
Normalized different water stress index (NDWSI) N D W S I = R 850 R 970 R 850 + R 970 [39]
Novel image-derived index (NIDI) N I D I = R 1529 R 1416 [40]
Floating-position water band index (FWBI1) F W B I 1 = R 900 R min 930 980 [41]
Floating-position water band index (FWBI2) F W B I 2 = R 920 R min 960 1000 [42]
Table 2. Classification of predictive ability of models evaluated by the RE and NSE.
ExcellentGoodFairUnsuitable
RE<10%10%–20%20–30%>30%
NSE≥0.90.5–0.8-0.1–0.4
Table 3. The R2entire canopy and R2canopy without spikes between published spectral indices and the LWC in different vertical layers. Colors correspond to the level of performances of spectral indices, from light blue for minimum R2 value to red for maximum R2 value.
Spectral IndexR2entire canopyR2canopy without spikes
Upper-LayerMiddle-LayerBottom-LayerUpper-LayerMiddle-LayerBottom-Layer
WI0.390.470.290.530.610.4
NDWI0.360.440.280.530.610.4
MSI0.320.40.280.460.550.39
WBI0.380.470.290.520.60.4
WBI/NDVI0.360.410.280.390.480.36
NDII0.340.410.30.480.560.39
RMSI0.360.450.310.530.60.39
SRWI0.370.450.320.550.620.4
MDWI0.270.380.240.40.490.32
CWI0.460.380.440.110.170.09
LWI0.290.390.250.410.490.27
NDWSI0.440.50.370.580.650.41
NIDI0.320.340.260.080.120.06
FWBI10.380.50.330.570.630.42
FWBI20.380.480.330.560.630.44
Table 4. The R2 between published spectral indices derived from spectral reflectance of the entire canopy and the LWC for the three vertical layers by using datasets from Exp. 1 and 2. Colors correspond to the level of performances of spectral indices, from light blue for minimum R2 value to red for maximum R2 value.
Spectral IndexUpper-LayerMiddle-LayerBottom-Layer
WI0.560.580.54
NDWI0.470.470.45
MSI0.400.420.38
WBI0.550.580.54
WBI/NDVI0.420.490.44
NDII0.420.440.41
RMSI0.410.410.40
SRWI0.460.470.45
MDWI0.470.500.46
CWI0.010.050.03
LWI0.450.460.44
NDWSI0.590.610.58
NIDI0.330.380.30
FWBI10.560.560.52
FWBI20.530.540.50
Publisher’s Note: MDPI stays neutral with regard to jurisdictional claims in published maps and institutional affiliations.