Abstract
Land surface albedo (LSA) is an important parameter that affects surface–air interactions and controls the surface radiation energy budget. The spatial and temporal variation characteristics of LSA reflect land surface changes and further influence the local climate. Ganzhou District, which belongs to the middle of the Hexi Corridor, is a typical irrigated agricultural and desert area in Northwest China. The study of the interaction of LSA and the land surface is of great significance for understanding the land surface energy budget and for ground measurements. In this study, high spatial and temporal resolution GF-1 wide field view (WFV) data were used to explore the spatial and temporal variation characteristics of LSA in Ganzhou District. First, the surface albedo of Ganzhou District was estimated by the GF-1 WFV. Then, the estimated results were verified by the surface measured data, and the temporal and spatial variation characteristics of surface albedo from 2014 to 2018 were analyzed. The interaction between albedo and precipitation or temperature was analyzed based on precipitation and temperature data. The results show that the estimation of surface albedo based on GF-1 WFV data was of high accuracy, which can meet the accuracy requirements of spatial and temporal variation characteristic analysis of albedo. There are obvious geographic differences in the spatial distribution of surface albedo in Ganzhou, with the overall distribution characteristics being high in the north and low in the middle. The interannual variation in annual average surface albedo in Ganzhou shows a trend of slow fluctuations and gradual increases. The variation in annual albedo is characterized by “double peaks and a single valley”, with the peaks occurring from December to February at the end and beginning of the year, and the valley occurring from June to August. Surface albedo was negatively correlated with precipitation and temperature in most areas of Ganzhou.
1. Introduction
Shortwave land surface albedo, which is defined as the ratio of the reflected solar radiation at the land surface to the total incoming solar radiation over the entire solar spectrum and represents the reflection ability of the surface to solar radiation [1], is an important parameter in land surface processes and climate simulation studies. Accurate estimation of surface albedo is essential in considering the surface energy budget.
Field albedo is obtained from measured radiation flux data at surface flux sites, and albedo is calculated from the ratio of downward shortwave radiation flux to upward shortwave radiation flux [2]. However, due to the complexity and diversity of underlying surface types and the strong heterogeneity of the land surface, albedo obtained from the measured site data can only represent a very small range of areas around the site, and the global distribution of radiation flux sites is low; therefore, this method cannot be used to obtain spatially continuous large-scale surface albedo monitoring.
Remote sensing observation data have a wide observation range and high spatial and temporal resolution and can be repeatedly observed in the same area. Therefore, remote sensing is considered as the most convenient method for large-scale land surface monitoring [3,4,5]. With the rapid development of satellite remote sensing and the continuous optimization of albedo remote sensing estimation algorithms, the number of albedo satellite remote sensing products released and operating commercially has increased dramatically, such as Moderate-resolution Imaging Spectroradiometer (MODIS) [6], Airborne Visible Infrared Imaging Spectrometer (AVIRIS) [7], Medium Resolution Imaging Spectrometer (MERIS) [8], Visible Infrared Imaging Radiometer Suite (VIIRS) [9], Polarization and Directionality of the Earth’s Reflectance (POLDER) [10,11], Clouds and the Earth’s Radiant Energy System (CERES) [12], Meteosat [13], and Meteosat Second Generation (MSG) [14]. These products have played a dramatically important role in regional and global analyses.
Based on the availability of so many satellites and sensors, spatial and temporal variations are monitored at global and regional scales. Wang [15] investigated the spatial distribution and temporal variation of regional surface albedo in China using NOAA/AVHRR (National Oceanic and Atmospheric Administration/Advanced Very High Resolution Radiometer) data from 1982 to 2000. Zhang [16] studied the variation characteristics of surface albedo on the North Alaskan slope using surface albedo obtained from the inversion of AVHRR data from 1985 to 1998. Atlaskina [17] used the MODIS surface albedo product MCD43C3 from 2000 to 2013 to study the spatial and temporal variation characteristics of surface albedo and its relationship with snow cover, temperature, vegetation index, and precipitation in the Northern Hemisphere in spring snow-covered areas. Tsvetsinskaya [18] used MODIS data to obtain surface albedo in global arid areas and analyzed the spatial and temporal variations in global desert surface albedo. The results showed that the surface albedo of different arid regions in the world was very different.
These analyses, which were based on coarse resolution data, were focused on large-scale analyses, and high spatial resolution studies were still needed for regional-scale refinement. Wu [19] used a combination of high spatial resolution HJ satellite and long-time series GLASS albedo data to analyze the spatial and temporal characteristics of surface albedo in the Heihe River Basin, China. The results showed that the spatial distribution of surface albedo in the Heihe River Basin varied significantly, with lower surface albedo in the upstream area and higher surface albedo in the midstream and downstream desert of the basin; the annual variation in surface albedo in the basin was like a “U”, with the highest albedo in winter, followed by spring and autumn, and the lowest in summer. Regarding interannual variation, the albedo in the downstream area of the Heihe River showed an upward trend, while that in the upstream area showed a downward trend. Due to the influence of data mosaics and clouds, the time resolution of Wu’s research data was low. Wang [20] analyzed the spatial and temporal characteristics of the albedo of Dongkemadi Glacier in the Tanggula Mountains based on Landsat TM images during summer ablation and MOD10A1 data during 2000–2009.
Limited by the long revisit cycle of Landsat, it is difficult to capture the quick change in the land surface. With a spatial resolution of 16 m and a revisit period of 2 days, the GF-1 WFV has the advantage of high spatial and temporal resolution monitoring ability. We applied the direct estimation method to GF-1 WFV sensors to establish the relationship between TOA reflectivity and surface albedo. Albedo estimated from GF-1 WFV data was applied to identify the spatial and temporal characteristics of land surface albedo in Ganzhou District, Gansu, China. In this study, a comprehensive comparative analysis of the albedo of different land cover types was conducted. The variation characteristics of different underlying surface albedos were analyzed from interannual and intra-annual variations. This study provides a reference for improving the simulation of climate and land surface processes and contributes to an accurate understanding of surface–air interaction processes and their climate effects in the Heihe River Basin.
2. Study Area and Data
2.1. Study Area
Ganzhou District of Zhangye is in the midstream part of the Heihe River Basin and belongs to the middle section of the Hexi Corridor, ranging from 100°6′E to 100°52′E and 38°39′N to 39°24′N. It is also the political, economic, and cultural center of Zhangye and one of the most important towns on the ancient Silk Road. The main natural vegetation in Ganzhou is deciduous xerophytes, halophyte communities, and sporadic desert plant communities. The terrain in the study area is flat, with an average elevation of 1474 m. The Heihe River, Suyoukou River, Daciyao River, Shandan River, and other rivers run through the entire area, which is a typical oasis agricultural area. This area has a temperate continental climate, which is characterized by a dry climate, long sunshine time, large temperature difference between day and night, frequent sandstorms throughout the year, and southeast winds in summer and northwest winds in the other seasons. The average annual temperature of Ganzhou is 6–8 °C, the accumulated temperature of ≥0 °C is 2734 °C, and the number of sustained days is 213 days; the accumulated temperature of ≥10 °C is 2140 °C and lasts for 133 days. The average daily temperature difference from April to October is between 13.4 °C and 18.2 °C. Average annual precipitation is 113–312 mm, precipitation from June to October accounts for more than 70% of the year, and annual evaporation is 2000–2350 mm. Precipitation is 250–300 mm in shallow mountain areas and 400–450 mm in mountain areas. The annual sunshine hours are 3000–3600 h, and the frost-free period is 112–165 days [21]. An overview of the study area is shown in Figure 1. The land cover type is derived by Hu [22], and the Zhangye site is in the Chinese National Wetland Park, and the underlying surface is wetland.
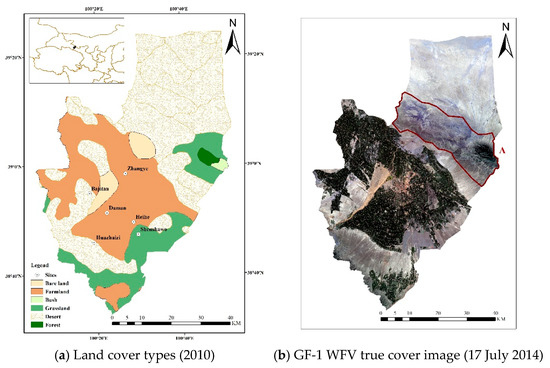
Figure 1.
Land cover types of the study area and GF-1 WFVtrue color data image.
2.2. Field Observation Data
The ground data used in this paper were from the Heihe Watershed Allied Telemetry Experimental Research (HiWATER). The HiWATER is a simultaneous airborne, satellite-borne, and ground-based remote sensing experiment aiming to improve the observability, understanding, and predictability of hydrological and related ecological processes at a catchment scale. Ground measurements were carried out at four scales, including key experimental areas, foci experimental areas, experimental sites, and elementary sampling plots, using ground-based remote sensing instruments, densified networks of automatic meteorological stations, flux towers, and hydrological stations [23]. Field albedo was observed with a CNR4 radiometer mounted on flux observation and meteorological towers. Referring to the description document of the CNR4 radiometer, its uncertainty is less than 2%, so the uncertainty of CNR4 is not considered in this study. There were six towers with radiation observations, and the land cover types included grassland, desert, farmland, and wetland. Ground observation data were downloaded from the National Tibetan Plateau Data Centre (https://data.tpdc.ac.cn/zh-hans/). The information of all sites is shown in Table 1. The CNR4 radiometers equipped on the towers had a sampling interval of 10 min, and the radiometers at different stations were set at different heights. The surface albedo was calculated by using the ratio of upward and downward radiation. To ensure time consistency between field observations and satellite data, field observations half an hour before and after satellite overpass times were averaged. The special coverage of field observations was calculated according to the height of CNR4, using Equation (1).
where R is the radius of the observation area, H is the sensor height, and θ is the effective field of view (FOV) of the sensor.

Table 1.
Information of sites.
GF-1 data were aggregated to match the field observation area and then compared with field observations.
2.3. GF-1 Data
The GF-1 satellite was the first satellite of China’s high-resolution Earth observation system. It was launched in April 2013 and carries two panchromatic/multispectral cameras (PMS) and four wide field view cameras (WFV). The WFV data have a spatial resolution of 16 m and revisit interval of approximately 2 days. The field view of each camera is 8°, and the observed field view after the combination of the four cameras is approximately 65°; the sensor has a width of 800 km when observed vertically downward and has both ±25° side-sway and emergency maximum side-sway capability of ±35° [24]. In practice, an image is scanned by a single sensor, and the observed zenith angle deviation in one image is less than 8°. The GF-1 satellite is suitable for large area and regional land surface detection because of its high revisit frequency, wide coverage, and high spatial resolution. In recent years, GF-1 remote sensing images have been used in many fields, including mine monitoring, crop identification and extraction, urban construction, and forest environmental monitoring [25,26,27,28]. Key information of the GF-1 WFV is shown in Table 2. All GF-1 WFV data used in this paper were downloaded from the China Centre for Resources Satellite Data and Application (http://www.cresda.com/CN/). High-quality data with clouds < 10% were selected, and a total of 57 L1A level (preprocessing level radiometric correction image products) images during 2014–2018 were downloaded.
Table 2.
Parameters of GF-1 WFV.
Radiometric calibration was performed on GF-1 WFV data to obtain the TOA reflectance. The accuracy of the radiometric calibration of sensor observation data is crucial [29]. The TOA reflectance of the GF-1 WFV was calculated by Equations (2) and (3).
where L is the radiance value, and Gain and Offset are the gain and offset, respectively. ρ is the TOA reflectance, D is the distance between the sun and earth, ESUN is the average solar spectral irradiance of TOA, and θ is the solar zenith angle.
Because of the geometric distortion of remote sensing images in the process of imaging for various reasons, the existence of geometric distortion of remote sensing images will seriously affect the actual use of the image. Therefore, the geometric correction of remote sensing images is the most basic and important step in all kinds of remote sensing image processing. Since Landsat 8 has been geometrically corrected, the Landsat OLI data that were close to the GF-1 remote sensing images in time and consistent with the area were used as the reference images for geometric correction. Geometric correction was based on the method of automatically finding ground control points from Landsat 8. The geometric correction accuracy was within 1 pixel in most areas.
2.4. Meteorological Dataset
Meteorological data, including air pressure, temperature, sunshine, humidity, precipitation, and wind speed, were downloaded from the China Meteorological Data Service Centre (http://data.cma.cn). We downloaded the precipitation and temperature data of three meteorological observation sites near the study area in 2014–2018. The units of precipitation and temperature are °C and mm, respectively. The distribution of precipitation and temperature in the study area was obtained by interpolating the location of observation sites and climate data. Then, the relationship between temperature, precipitation, and albedo was analyzed.
3. Method
3.1. Albedo Estimation Method
Albedo was calculated by the direct estimation method. In the estimation process, the surface directional reflection characteristics at GF-1 scale were considered. Referring to the method of Shuai et al. [30], BRDF parameters of pure pixels at MODIS scale were selected to represent the surface direction reflection characteristics at GF-1 scale. The TOA reflectance was obtained by the 6S radiative transfer model, and the surface albedo was obtained by a linear kernel-driven model. A linear regression model between TOA reflectance and surface albedo was constructed, and the model coefficients were stored in the look-up table (LUT). We used ground data to verify the albedo estimation results.
3.2. Analysis Method
3.2.1. Change Trend Analysis
The interannual variation rate of surface albedo in Ganzhou is fitted by using the method of one variable linear regression, which is the trend value b [31]. The calculation formula is as follows:
where n is the total number of years during the study period; αi is the average surface albedo value in year i; and b is the trend value, which reflects the change rate of surface albedo. If b > 0, it indicates that the surface albedo tends to increase, but for b < 0, it tends to decrease; the absolute value of B reflects the change rate of surface albedo.
3.2.2. Fluctuation Analysis
To analyze the fluctuation of surface albedo in Ganzhou, the difference between the annual average albedo of each year and the average albedo of all years was calculated with the formula:
where ∆α(y) represents the anomaly of the y-year average albedo; α(y) is the average albedo in year y; and is the average albedo for all years. The fluctuation of albedo over time is an important embodiment of human and natural activities. A large fluctuation of albedo indicates that the solar radiation reflected by the surface is unstable, and the land surface varies dramatically. The albedo standard deviation (SD) s calculated by Equation (6) depicts the fluctuation of albedo in the study area. A large value of the standard deviation s indicates a large fluctuation in the surface albedo, and vice versa.
3.2.3. Correlation Analysis
Pearson correlation analysis [31] was used to analyze the correlation between the variables. In this paper, these variables are precipitation, air temperature, and albedo. For the study variables x and y, the correlation coefficient r can be expressed as:
where n is the sample size of the variable; xi and yi are the i-th pair of samples; and and are the sample averages of the two variables. The value range of r is (−1, 1), and when 0 < r < 1, it indicates that x and y are positively correlated; when −1 < r < 0, it indicates that x and y are negatively correlated, and the larger the absolute value of r, the closer the relationship between x and y. In this study, the correlation between albedo and climatological factors was analyzed.
Bias reflects the error between the output and the real value of samples. Bias can verify the accuracy of the estimation results and the reliability of the estimation method by analyzing the deviation between the estimation results and the actual surface albedo. The formula of bias is as follows:
where n is the total number of years during the study period; αi is the average surface albedo value in year i; and b is the trend value, which reflects the change rate of surface albedo.
4. Results
4.1. GF Albedo Estimation Accuracy
All available clear sky GF-1 WFV data and ground measurement data were paired for albedo estimation accuracy validation. Figure 2 shows the scatter plot of field albedo and GF-1 estimated albedo. Figure 2 shows that the results of all stations show a high R2 of 0.849 and a small RMSE of 0.026. Since there is a clear difference in surface albedo for different land cover types, it is necessary to separately verify the albedo accuracy for different land surface types. The verification results for grassland, desert, wetland, and farmland sites are shown in Figure 2 and Figure 3. Since the field albedo was obtained by averaging data half an hour before and after the satellite observation time, the uncertainty, which is SD, is shown in Figure 3. The two outliers in Figure 3 are due to snow cover and melting. The validation results of all land cover types have high accuracy, with the highest precision for deserts and lowest precision for wetland. The RMSE and R2 values of all land cover types are shown in Table 3.
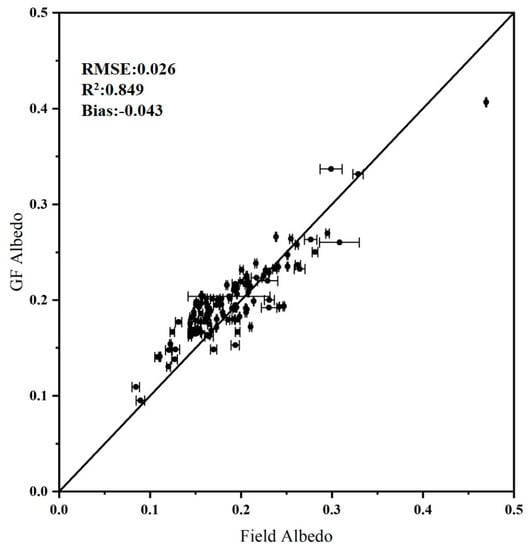
Figure 2.
Validation against ground measurements.

Figure 3.
Comparisons of GF-1 WFV albedo and surface results in the experimental area of (a) wetland sites, (b) desert sites, (c) cropland sites, and (d) grassland sites.
Table 3.
Accuracy verification results for various land cover types.
4.2. Albedo Temporal Variation Characteristics from Site Observations
The flux towers were mounted in relatively homogeneous fields; therefore, the site observations can represent a certain range of land surface. The temporal variation characteristics of different land cover types were analyzed based on site observations.
4.2.1. Interannual Variation Characteristics
Figure 4 shows the daily land surface albedo of four land cover types from 2014 to 2018 (data was missing since 2014 in the grassland site). From Figure 4, we can see that the desert sites had the highest values of annual average surface albedo of 0.2374. The low vegetation coverage of the desert leads to its high albedo. The wetland sites had the lowest values of 0.1795, which was mainly caused by the large vegetation and water background. The yearly average albedo of farmland and grassland was 0.2103 and 0.1895, respectively. The albedo value of vegetation land was between that of desert and wetland. In the annual cycle, albedo was high at the beginning/end of each year and low in the middle of the year. Albedo in winter was higher than 0.4, which was caused by the snow cover in this period. The maximum value of land surface albedo was 0.8327 in 2018 in the desert, and the minimum value was 0.0374 in 2016 in the wetland. The maximum and minimum values of albedo for each land cover type are shown in Table 4. According to the seasonal variation in albedo, the albedo changed sharply in winter, which was mainly related to snowfall and snowmelt [19].
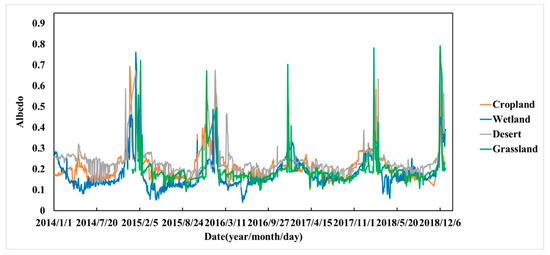
Figure 4.
Daily average albedo of four land cover types in Ganzhou.
Table 4.
Maximum and minimum values of albedo for each land cover type.
4.2.2. Annual Variation Characteristics
Figure 5 shows the monthly average albedo of different land cover types in the research area. It can be seen from Figure 5 that the annual variation in monthly average albedo of farmland, wetland, desert, and grassland had a “U”-shaped trend, which was consistent with the results of Liu [32]. The surface albedo of bare land, desert, and grassland showed a clear decreasing trend from January to August, with the lowest albedo in summer from June to September, which was due to vigorous vegetation growth, precipitation, and high soil moisture in summer. After September, when crops were harvested, the vegetation coverage gradually decreased, and albedo began to rise. From the figure, we can also find that the average monthly albedo of the wetland was lower than that of the other three land types, which may have been because the background field of the wetland was water, and the albedo of water is low. The highest albedo in January and December was in the desert, and the annual albedo of the desert was almost higher than that of the other three land types because the desert has a high albedo due to the bare soil and very low vegetation coverage. The complex and variable underlying surface caused the surface albedo of the Ganzhou area to have obvious seasonal differences. In summer, vegetation grew and precipitation increased, and the surface albedo decreased; in winter, the surface was bare, and the albedo increased.
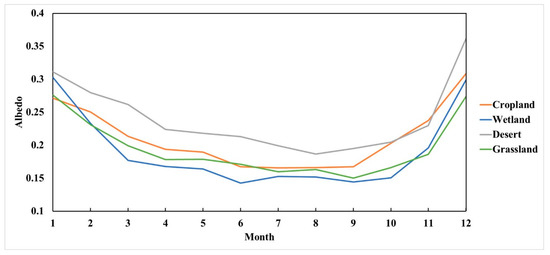
Figure 5.
Annual variation in monthly mean albedo under different land cover types.
4.3. Albedo Spatial Variation Characteristics
Albedo estimated from GF-1 WFV data was used for spatial variation pattern analysis. Due to cloud contamination and other reasons, monthly average albedo was used to depict the spatial variation characteristics.
4.3.1. Interannual Variation Characteristics
Figure 6 shows the average albedo in January and July from 2014 to 2018. Figure 6 shows that the overall albedo in the study area in January was higher than that in July, with an average value of 0.242 in January and 0.219 in July. For each period, albedo in the desert area in the north was higher than that in other areas, which was caused by the dry sand in the desert areas. The main oasis in the center area and the distributed forest in the southern and eastern areas had low albedo values due to dense vegetation cover. An obvious difference was found on the boundary of the oasis and southern desert.
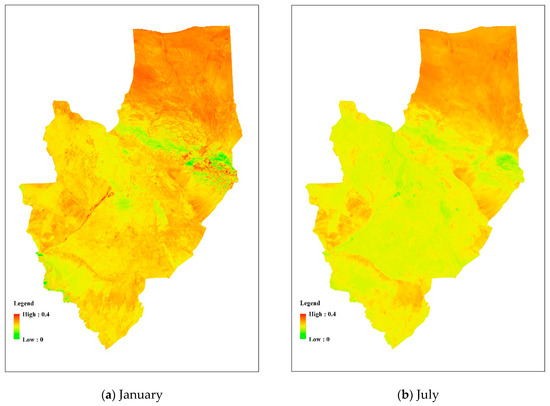
Figure 6.
Spatial distribution of average surface albedo in (a) January and (b) July.
For most areas, albedo in January was larger than that in July, which was consistent with the general seasonal trend of albedo. However, there was a certain part of the area where albedo in January was always less than that in July in research area A in Figure 1. In this area, the land surface type was desert, vegetation growth was rare here, and the main area contained dry sand. Rugged terrain in this area induced large shadows in both winter and summer. In winter, the sun elevation angle was smaller than that in summer, and a larger shadow was induced, which caused a smaller albedo value in winter. The albedo estimation accuracy was also influenced by the rugged terrain [33]. Rugged terrain albedo calibration was needed in this area.
Figure 7 is the SD of surface albedo in January and July. The average of the SD in January is 0.044 and in July is 0.021. The SD in January is higher than that in July, and the maximum standard deviation is close to 0.1. The high SD is due to the snow cover in some of the year. SD in July is very small, indicating that the change in albedo in July in these years is very stable.
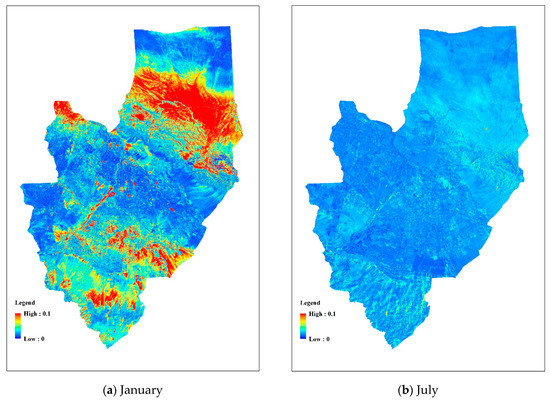
Figure 7.
Spatial distribution of SD of surface albedo in (a) January and (b) July.
Table 5 shows the average and SD of surface albedo of different land cover types in January and July. For each land cover type, albedo in January is larger than that in July, and desert has the largest albedo value in both periods. In January, the average albedo of grassland and bush is the smallest. The SD of albedo of forest is the largest, and that of cropland is the smallest. In July, the average albedo of forest is the smallest. The SD of albedo of bush is the largest, and that of cropland is the smallest. The statistics indicate that the albedo of desert is higher than that of other land cover types, and the change in albedo of farmland is the most stable.
Table 5.
Average and SD of surface albedo of different land cover types in January and July.
The interannual variation rate was fitted with a one-variable linear regression method at the pixel scale. The albedo variation rate from 2014 to 2018 is shown in Figure 8. The results indicated that there was a significant spatial variation in the albedo interannual variation pattern in this area.
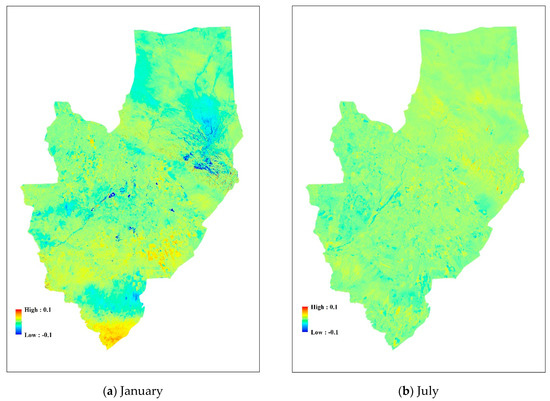
Figure 8.
Spatial distribution of annual variation rate of surface albedo in Ganzhou in (a) January and (b) July from 2014 to 2018.
The surface albedo increased in January with an average increasing rate of 1.1 × 10⁻² a−1, accounting for approximately 50.3% of the total area. The area with a large increasing rate was distributed in the southern and southeastern parts of the study area, and the land cover types were mainly grassland and farmland. The increasing rate was more than 2.0 × 10⁻² a−1. In the northeastern forest area, a decreasing trend was found, and the decreasing rate was more than −2 × 10⁻² a−1. The average reduction rate was −1.2 × 10⁻² a−1 in this area. Albedo decreased in 49.7% of the area with a decreasing rate of approximately 6.0 × 10⁻³ a−1 in January. The area with decreasing rates was located in the northern forest and grassland, southern forest, and central oasis farmland areas.
The albedo in most areas in July showed an increasing trend with an average increasing rate of approximately 6.8 × 10⁻³ a−1, accounting for approximately 66.4% of the total area. The areas where the albedo increased faster were mainly in the eastern forest area, the northern desert area, and the southern grassland area, where the increasing rate exceeded 1.0 × 10⁻² a−1. The annual average surface albedo in the riverside tended to decrease slowly, with a rate of decrease exceeding −1.5 × 10⁻² a−1.
The variation results of the growing and nongrowing seasons show that the interannual variation in albedo in the study area had an increasing trend, with the increasing part consisting mainly of agricultural land and urban construction land and the decreasing part consisting mainly of riverine and forest areas. This is consistent with the results of Li [34], who suggested an increasing trend of annual average albedo at mid-latitudes.
Table 6 shows the annual variation rate of surface albedo of different land cover types in January and July. In January, the annual variation rate of albedo of forest and desert is negative, and the annual variation rate of albedo of bush is the largest. It shows that the albedo of grassland, cropland, bush, and bare land has increased. In July, the annual variation rate of albedo of all land cover types is positive, and that of bush is the largest.
Table 6.
Annual variation rate of surface albedo of different land cover types in January and July.
4.3.2. Annual Variation Characteristics
Figure 9 shows the spatial distribution of surface albedo in Ganzhou in 2015. Due to data limitations, every two months of data are displayed. From Figure 9, it is obvious that the annual variation in albedo in Ganzhou had high albedo in winter and low albedo in summer.
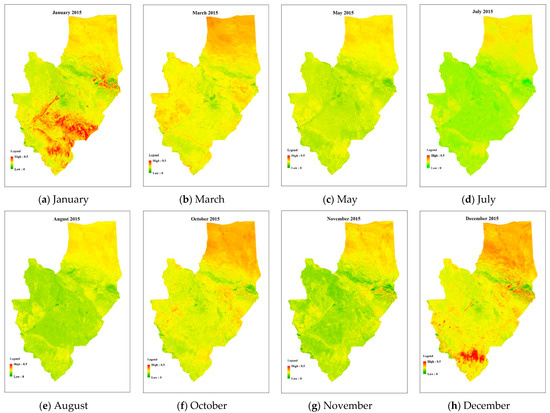
Figure 9.
Spatial distribution of surface albedo in Ganzhou in 2015.
The eastern grassland, central farmland, and southern grassland were affected by snowfall in January, with high average albedo values (>0.4). The albedo of the northern desert and the central oasis areas without snow cover was low, with average albedo values less than 0.3 and 0.2, respectively. Snow largely melted in March, reducing albedo in the eastern and southern–central areas, but the overall albedo was higher than that in January. The albedo decreased again in May compared with March, when vegetation and crops started to grow and the vegetation cover gradually increased, thus albedo decreased. The albedo reached its lowest in August in a year, where the land cover type in the central part of Ganzhou was farmland, as the crops reached their peak growth period and vegetation cover was highest in August. In October, the crops were harvested, and the ground surface became bare soil after harvesting, thus albedo increased. In December, there was snow in the northern and southern parts of Ganzhou, resulting in an albedo higher than 0.4. The central part of Ganzhou has a large area of urban land in addition to cropland. Therefore, under the influence of anthropic factors, the albedo in the central part of Ganzhou was lower than that in other areas in December.
4.4. Correlation Analysis with Climatic Factors
The spatial distribution differences of climatic factors affect the distribution and growth of vegetation, and then affect the surface albedo. Temperature and precipitation are two very important factors for climatic conditions, so it is necessary to analyze the effects of temperature and precipitation on albedo.
4.4.1. Correlation Analysis of Albedo and Precipitation
Precipitation is an important meteorological factor affecting the variation in surface albedo [35]. The surface albedo of most areas in Ganzhou District was negatively correlated with precipitation, with 97.5% of the area showing a negative correlation (Figure 10). The positive and uncorrelated areas were small and sporadically distributed in the central and southern parts of the study area. Since the cropland in the southern part of the study area was close to the mountains and the terrain fluctuated greatly, the albedo variation was uncorrelated with precipitation. The northern–central part of the study area was uncorrelated because it was a riverine area and was not significantly influenced by precipitation.
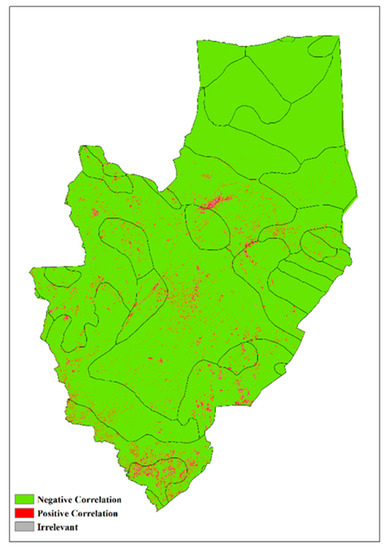
Figure 10.
Spatial distribution of Pearson correlation coefficient between annual surface albedo and precipitation.
The relationship between albedo and precipitation for different land types is shown in Figure 11. The albedos of desert, forest, grassland, cropland, bush, and bare land were all negatively correlated with precipitation. Although grassland and cropland were negatively correlated with precipitation, their albedo changed little when precipitation changed greatly. Because of the low soil moisture and low vegetation coverage of deserts, vegetation grows well, and albedo decreases when precipitation is high; when precipitation is less, desertification will be more serious, and albedo increases. When precipitation is high, there will be more water in the wetland, and albedo will decrease; when there is less precipitation, some vegetation will be exposed, and as the albedo of vegetation is slightly higher than that of water, the albedo will increase. The magnitude of albedo variation in the bush and forests was very consistent with the magnitude of precipitation variation because the vegetation cover in these two areas was high and the albedo varied significantly with precipitation.
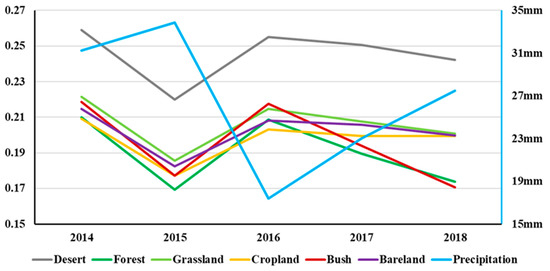
Figure 11.
Relationship between average albedo of different land cover types and precipitation.
4.4.2. Correlation Analysis of Albedo and Air Temperature
The relationship between land surface albedo and temperature is shown in Figure 12. Figure 12 shows that the surface albedo was negatively correlated with temperature in 95% of the study area. Surface albedo was positively correlated with temperature in a small area in the central, northern–central, and southwestern areas (Figure 12). There were few areas in the figure where albedo was uncorrelated to temperature.
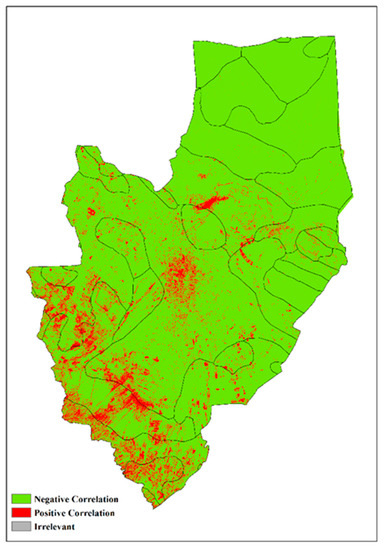
Figure 12.
Spatial distribution of Pearson correlation coefficient between annual surface albedo and temperature.
The relationship between albedo and temperature of different land types is shown in Figure 13. The temperature and albedo variations of all land types were negatively correlated in 2014–2015 and positively correlated in 2015–2018. Although albedo and temperature showed similar trends in most years for different land cover types, we cannot presume that albedo change was positively correlated with temperature. This is because albedo is affected by both temperature and precipitation. With the increase in temperature and precipitation, vegetation growth accelerates and albedo decreases. However, when temperature increases and precipitation decreases, the albedo of each land cover type changes differently; therefore, it is necessary to conduct partial correlation analysis between temperature and albedo.
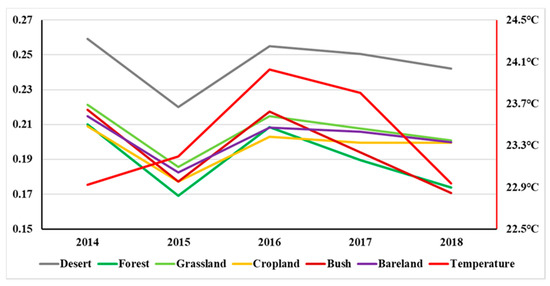
Figure 13.
Relationship between different land cover types and temperature.
A partial correlation analysis of temperature and surface albedo was conducted under the condition of precipitation as a control factor (Table 7). The results show that the negative correlation between surface albedo and temperature became stronger and the positive correlation became weaker after removing the effect of precipitation. The albedo of desert, forest, grassland, cropland, and bare land was negatively correlated with temperature, and the albedo of bush was positively correlated with temperature. When the temperature increased, the surface evaporation increased and the moisture of the bush decreased, so the albedo increased; conversely, the albedo decreased.
Table 7.
Partial correlation analysis of air temperature and albedo.
5. Discussion
5.1. Influence of Albedo Estimation Accuracy on Spatial and Temporal Characteristics Analysis
Errors of radiometric correction and band conversion may lead to errors of albedo estimation [36,37], which then affect the results of spatial and temporal analysis of the study area. The GF-1 satellite is the first satellite of the China high-resolution Earth observation system, which breaks through key technologies, such as high spatial resolution and multispectral and wide coverage combined with optical remote sensing. Accurate radiometric correction is needed before satellite observation. For consistency and calibration accuracy between cameras, Feng [38] and Li [39] found that the radiometric calibration accuracy of high-resolution satellites needs to be further improved. The accuracy of surface albedo estimation can be further improved by refining radiometric calibration.
Aerosol scattering is the main atmospheric factor affecting visible radiation. The “continental” aerosol type used in the radiation model of this study may lead to an overestimation of the albedo results. In He’s [40] study, they tried different aerosol types at the site and found a change in albedo estimation accuracy, suggesting that the accuracy of albedo estimation in non-desert areas can be improved using accurate aerosol type maps. In ground measurements, the water vapor content will also affect shortwave radiation; therefore, correction of the water vapor content may help to further improve the estimation of shortwave albedo.
5.2. Influence of Other Factors on Spatial and Temporal Characteristics Analysis
Surface albedo, as a quantitative indicator of the surface’s ability to reflect solar radiation, is influenced by various factors, such as natural and human activities, and the complex and variable Earth surface causes surface albedo to be highly variable in space and time. Climatic factors can affect surface albedo by influencing plant growth and soil moisture. The seasonal variation of land cover types also directly leads to seasonal differences in surface albedo.
An increase in snow albedo will lead to a severe loss of surface radiant energy, weaken convective exchange, and eventually lead to a reduction in precipitation. At the same time, snow albedo also affects the melting of snow, which is an important factor of seasonal snow cover change. According to the above section, the surface albedo in snow-covered areas is significantly higher than that in uncovered areas, and the average albedo in winter is higher than that in other seasons. Previous studies have also shown that snow has a very strong effect on surface albedo [34]. Cao [41] showed a good correspondence between the spatial distribution of interannual trends in mean annual snow cover and the spatial distribution of interannual trends in surface albedo, and the surface albedo also increased in the areas with increased snow cover rates; the surface albedo also decreased in the areas with decreased snow cover rates. In this study, the land surface albedo was also affected by snow cover. When the surface was covered with snow, the surface albedo increased significantly, often more than 0.5.
Land use change will significantly change the surface biophysical properties, thus changing surface albedo. Artificial land use changes, such as agricultural expansion and grassland restoration, will affect surface albedo [42,43,44]. Due to frequent human activities and the complexity of the underlying surface, it is difficult to understand and predict the variation in albedo. For example, grazing may have a significant effect on grassland albedo by reducing vegetation coverage and height [45]. In the central oasis area, a large area of cropland was included. Farming activities significantly influenced albedo.
Precipitation is an important restraining factor for plant growth in arid and semiarid areas [46]. The study in this paper shows that precipitation and albedo were mostly negatively correlated in the study area. In the study of Cao [41], precipitation affected surface albedo variability, but the extent of the effect varied by geographic location. There was a significant negative correlation between precipitation and surface albedo in spring, summer, and autumn, while there was a weak positive correlation between precipitation and albedo in winter. However, Zhai’s study suggested that although precipitation may affect albedo values in dry years, there was no significant correlation between precipitation and albedo changes [47]. In the study of He [48], with the increase in summer precipitation, the proportion of solar shortwave radiation absorbed by the surface increased, and the surface albedo decreased; precipitation decreased in spring and autumn, and surface albedo increased. Surface albedo reached a maximum in high altitude areas in winter due to heavy snow. The results of this paper are largely in agreement with those of He [48].
6. Conclusions
In this paper, we used GF-1 WFV data to calculate the surface albedo based on the direct estimation method and compared the estimation results with the observation data for verification. Then, the spatial and temporal distribution and dynamic variation characteristics of surface albedo in Ganzhou from 2014 to 2018 were analyzed in relation to land cover types and their correlation with temperature precipitation. The results show the following.
The results of estimating surface albedo based on GF-1 WFV data in Ganzhou had high accuracy, and the R2 and RMSE values were 0.849 and 0.026, respectively, when compared with field observations.
There were obvious geographic differences in the spatial distribution of surface albedo in Ganzhou, with albedo value high in the north and low in the middle area, which was influenced by surface cover and human activities. The ranked order of the surface albedo values of different land cover types was desert > farmland > grassland > wetland.
The interannual variation in the surface albedo in Ganzhou had a slowly fluctuating and gradually increasing trend, with an average variation rate of approximately 2.4 × 10⁻³ a−1 and an increasing area accounting for approximately 64.4% of the total area. The eastern forest area and southern grassland area were the areas with the fastest increase in surface albedo, with the rate of increase exceeding 1.0 × 10⁻² a−1.
The annual variation in surface albedo in Ganzhou ranged from 0.15 to 0.36 and had a “two peaks and one valley” shape. The peaks occurred in December–February at the end and beginning of the year, and the valleys occurred in June–August, indicating that the annual variation in surface albedo was closely related to the seasonal variation in surface cover type.
There was a negative correlation between surface albedo and precipitation in most areas of Ganzhou. Wetlands and deserts were positively correlated, and farmlands and grasslands were negatively correlated. Surface albedo was negatively correlated with temperature in most areas of the study area, which were mostly desert, farmland, and construction land; albedo was positively correlated with temperature in the southwestern part of the study area. Climate change is mainly manifested by changes in temperature and precipitation, and deep analysis of the relationship between surface albedo and climatic factors is of great significance for the study of regional climate change and medium- and long-term climate prediction.
The Chinese government has introduced a series of high spatial resolution satellites. GF-1 WFV has the advantages of large coverage and high spatial resolution, and has great potential in regional scale monitoring and regional change analysis. In this paper, we used GF-1 WFV data to identify the spatial and temporal variation characteristics of surface albedo in the Ganzhou area in Gansu. It is of great significance in improving the quantitative use of Chinese remote sensing data.
There are still some drawbacks in this paper. The GF-1 satellite revisit period is 2 days, and very high temporal resolution data are theoretically available, but due to the large spatial area of Ganzhou and remote sensing images, mosaics are needed to obtain the complete data of the study area. Additionally, under cloud contamination, GF-1 WFV data are less available. For accurate regional land surface monitoring, more data from different sensors should be utilized. In addition, the surface heterogeneity of the study area is strong, and the spatial and temporal variation characteristics of surface albedo under different surface types and complex terrain still need to be further studied.
Author Contributions
Conceptualization, H.Z.; methodology, Z.W.; software, Z.W. and Q.W.; validation, Z.W., W.F. and W.M.; resources, H.Z., H.W. and J.W.; writing—original draft preparation, Z.W.; writing—review and editing Z.W. and H.Z.; funding acquisition, H.Z. All authors have read and agreed to the published version of the manuscript.
Funding
This research was funded by the National Natural Science Foundation of China grant number 41801242, 42090012; the Key Research and Development Program of China under grant 2016YFB0501504.
Institutional Review Board Statement
Not applicable.
Informed Consent Statement
Not applicable.
Data Availability Statement
Not applicable.
Acknowledgments
The authors would like to thank the reviewers and editors for their valuable comments and suggestions.
Conflicts of Interest
The authors declare no conflict of interest.
References
- Dickinson, R.E. Land processes in climate models. Remote Sens. Environ. 1995, 51, 27–38. [Google Scholar] [CrossRef]
- Stroeve, J.; Box, J.E.; Gao, F.; Liang, S.; Nolin, A.; Schaaf, C. Accuracy assessment of the modis 16-day albedo product for snow: Comparisons with greenland in situ measurements. Remote Sens. Environ. 2005, 94, 46–60. [Google Scholar] [CrossRef]
- Li, Z.; Garand, L. Estimation of surface albedo from space: A parameterization for global application. J. Geophys. Res. Atmos. 1994, 99, 8335–8350. [Google Scholar] [CrossRef]
- Csiszar, I.; Gutman, G. Mapping global land surface albedo from noaa avhrr. J. Geophys. Res. Atmos. 1999, 104, 6215–6228. [Google Scholar] [CrossRef]
- Pinty, B.; Roveda, F.; Verstraete, M.M.; Gobron, N.; Govaerts, Y.; Martonchik, J.V.; Diner, D.J.; Kahn, R.A. Surface albedo retrieval from meteosat: 1. Theory. J. Geophys. Res. Atmos. 2000, 105, 18099–18112. [Google Scholar] [CrossRef]
- Schaaf, C.B.; Gao, F.; Strahler, A.H.; Lucht, W.; Li, X.; Tsang, T.; Strugnell, N.C.; Zhang, X.; Jin, Y.; Muller, J.P.; et al. First operational brdf, albedo nadir reflectance products from modis. Remote Sens. Environ. 2002, 83, 135–148. [Google Scholar] [CrossRef] [Green Version]
- He, T.; Liang, S.; Wang, D.; Shi, Q.; Tao, X. Estimation of high-resolution land surface shortwave albedo from aviris data. IEEE J. Sel. Top. Appl. Earth Obs. Remote Sens. 2015, 7, 4919–4928. [Google Scholar] [CrossRef]
- Muller, J. MERIS Global Land Surface Albedo Maps: Algorithm Theoretical Basis Document; ATBD 1.4 BRDF/Albedo Retrieval; University of the Littoral Opal Coast: Dunkerque, France, 2006. [Google Scholar]
- Wang, D.; Liang, S.; He, T.; Yu, Y. Direct estimation of land surface albedo from viirs data: Algorithm improvement and preliminary validation. J. Geophys. Res. Atmos. 2013, 118, 12577–12586. [Google Scholar] [CrossRef]
- Maignan, F.; Bréon, F.M.; Lacaze, R. Bidirectional reflectance of earth targets: Evaluation of analytical models using a large set of spaceborne measurements with emphasis on the hot spot. Remote Sens. Environ. 2004, 90, 210–220. [Google Scholar] [CrossRef]
- Mira, M.; Weiss, M.; Baret, F.; Courault, D.; Hagolle, O.; Gallego-Elvira, B.; Olioso, A. The modis (collection v006) brdf/albedo product mcd43d: Temporal course evaluated over agricultural landscape. Remote Sens. Environ. 2015, 170, 216–228. [Google Scholar] [CrossRef] [Green Version]
- Rutan, D.; Rose, F.; Roman, M.; Manalo-Smith, N.; Schaaf, C.; Charlock, T. Development and assessment of broadband surface albedo from clouds and the earth’s radiant energy system clouds and radiation swath data product. J. Geophys. Res. 2009, 114, D08125. [Google Scholar] [CrossRef] [Green Version]
- Govaerts, Y.M.; Lattanzio, A.; Taberner, M.; Pinty, B. Generating global surface albedo products from multiple geostationary satellites. Remote Sens. Environ. 2008, 112, 2804–2816. [Google Scholar] [CrossRef]
- Van Leeuwen, W.J.D.; Roujean, J.L. Land surface albedo from the synergistic use of polar (eps) and geo-stationary (msg) observing systems. Remote Sens. Environ. 2002, 81, 273–289. [Google Scholar] [CrossRef]
- Wang, G. Distribution of surface albedo in china during 1982–2000. Plateau Meteorol. 2010, 29, 146–151. [Google Scholar]
- Zhang, T.; Scambos, T.; Haran, T.; Hinzman, L.D.; Kane, D.L. Ground-based and satellite-derived measurements of surface albedo on the north slope of alaska. J. Hydrometeorol. 2003, 4, 77. [Google Scholar] [CrossRef]
- Atlaskina, K.; Berninger, F.; De Leeuw, G. Satellite observations of changes in snow-covered land surface albedo during spring in the northern hemisphere. Cryosphere Discuss. 2015, 9, 2745–2782. [Google Scholar]
- Tsvetsinskaya, E.A.; Schaaf, C.B.; Gao, F.; And, A.; Dickinson, R.E. Spatial and temporal variability in moderate resolution imaging spectroradiometer–derived surface albedo over global arid regions. J. Geophys. Res. Atmos. 2006, 111, D20106. [Google Scholar] [CrossRef] [Green Version]
- Wu, S.; Wen, J.; Liu, Q.; Dou, B.; You, D. Estimation of land surface albedo and spatio-temporal variability over heihe river basin. Adv. Earth Sci. 2015, 30, 680–690. [Google Scholar]
- Wang, J.; He, X.; Ye, B.; Yang, G. Variations of albedo on the dongkemadi glacier, tanggula range. J. Glaciol. Geocryol. 2012, 34, 21–28. [Google Scholar]
- Liang, Y.; Xu, Z.; Zhong, F. Land use scenario analyses by based on system dynamic model and clue-s model at regional scale: A case study of ganzhou district of zhangye city. Geogr. Res. 2011, 30, 564–576. [Google Scholar]
- Hu, X.L.; Lu, L.; Li, X.; Wang, J.H.; Ming, G. Land use_cover change in the middle reaches of the heihe river basin over 2000-2011 and its implications for sustainable water resource management. PLoS ONE 2015, 10, e0128960. [Google Scholar] [CrossRef]
- Li, X.; Li, X.; Li, Z.; Ma, M.; Wang, J.; Xiao, Q.; Liu, Q.; Che, T.; Chen, E.; Yan, G.; et al. Watershed allied telemetry experimental research. J. Geophys. Res. 2009, 114, D22103. [Google Scholar] [CrossRef] [Green Version]
- Zhou, H.; Ni, H.; Tao, H.; Liang, S.; Wang, J. High resolution albedo estimation with chinese gf-1 wfv data. In Proceedings of the IGARSS 2018—2018 IEEE International Geoscience and Remote Sensing Symposium, Valencia, Spain, 22–27 July 2018. [Google Scholar]
- Yu, B.; Tian, S.; Zhao, Y.; Lu, F.; Fang, Y. Application of gf-1 satellite in remote sensing monitoring on mine exploitation in beijing and tianjin. Geoscience 2017, 31, 843–850. [Google Scholar]
- Guo, Y.; Wu, X.; Cheng, Y.; Wang, L.; Liu, T. Maize recognition and accuracy evaluation based on high resolution remote sensing(gf-1)data. In Proceedings of the Remote Sensing of the Environment: 19th National Symposium on Remote Sensing of China, Xian City, China, 6 August 2015; pp. 31–36. [Google Scholar]
- Guo, Y.; Chi, T.; Peng, L.; Liu, J.; Yang, L. Classification of gf-1 remote sensing image based on random forests for urban land-use. Bull. Surv. Mapp. 2016, 5, 73–76. [Google Scholar]
- Peng, J.; Zhang, C. Remote sensing monitoring of vegetation coverage by gf-1 satellite: A case study in xiamen city. Remote Sens. Land Resour. 2019, 31, 137–142. [Google Scholar]
- Xu, N.; Wu, R.; Hu, X.; Chen, L.; Wang, L.; Sun, L. Integrated method for on-obit wide dynamic vicarious calibration of fy-3c mersi reflective solar bands. Acta Opt. Sin. 2015, 35, 1228001. [Google Scholar]
- Shuai, Y.; Masek, J.G.; Gao, F.; Schaaf, C.B. An algorithm for the retrieval of 30-m snow-free albedo from landsat surface reflectance and modis brdf. Remote Sens. Environ. 2011, 115, 2204–2216. [Google Scholar] [CrossRef]
- Wei, F. Modern Climate Statistical Diagnosis AND Prediction Technology; China Meteorological Press: Beijing, China, 1999. [Google Scholar]
- Liu, H.; Tu, G.; Wenjie, D. Surface albedo variations are different in semi arid region. Chin. Sci. Bull. 2008, 53, 1220–1227. [Google Scholar]
- Wen, J.; Zhao, X.; Liu, Q.; Tang, Y. An improved land-surface albedo algorithm with dem in rugged terrain. IEEE Geosci. Remote Sens. Lett. 2013, 11, 883–887. [Google Scholar]
- Li, Q.; Ma, M.; Wu, X.; Yang, H. Snow cover and vegetation-induced decrease in global albedo from 2002 to 2016. J. Geophys. Res. Atmos. 2018, 123, 124–138. [Google Scholar] [CrossRef] [Green Version]
- Shang, L.; Zhang, Y.; Lü, S.; Wang, S. Energy exchange of an alpine grassland on the eastern qinghai-tibetan plateau. Sci. Bull. 2015, 60, 435–446. [Google Scholar] [CrossRef] [Green Version]
- Govaerts, Y.; Pinty, B.; Taberner, M.; Lattanzio, A. Spectral conversion of surface albedo derived from meteosat first generation observations. IEEE Geosci. Remote Sens. Lett. 2006, 3, 23–27. [Google Scholar] [CrossRef]
- Alexander, L.; Yves, G. Towards multidecadal consistent meteosat surface albedo time series. Remote Sens. 2010, 2, 957–967. [Google Scholar]
- Feng, L.; Li, J.; Gong, W.; Zhao, X.; Chen, X.; Pang, X. Radiometric cross-calibration of gaofen-1 wfv cameras using landsat-8 oli images: A solution for large view angle associated problems. Remote Sens. Environ. 2016, 174, 56–68. [Google Scholar] [CrossRef]
- Li, Y.; Wang, T.; Zeng, Z.; Peng, S.; Lian, X.; Piao, S. Evaluating biases in simulated land surface albedo from cmip5 global climate models. J. Geophys. Res. Atmos. 2016, 121, 6178–6190. [Google Scholar] [CrossRef]
- He, T.; Liang, S.; Wang, D.; Cao, Y.; Gao, F.; Yu, Y.; Feng, M. Evaluating land surface albedo estimation from landsat mss, tm, etm +, and oli data based on the unified direct estimation approach. Remote Sens. Environ. 2018, 204, 181–196. [Google Scholar] [CrossRef]
- Cao, X. Spatial and Temporal Change of Surface Albedo over the Tibetan Plateau Based on Modis. Ph.D. Thesis, Nanjing University of Information Science & Technology, Nanjing, China, 2018. [Google Scholar]
- Houspanossian, J.; Giménez, R.; Jobbágy, E.; Nosetto, M. Surface albedo raise in the south american chaco: Combined effects of deforestation and agricultural changes. Agric. For. Meteorol. 2017, 232, 118–127. [Google Scholar] [CrossRef] [Green Version]
- Loranty, M.M.; Goetz, S.J.; Beck, P. Tundra vegetation effects on pan-arctic albedo. Environ. Res. Lett. 2011, 6, 024014. [Google Scholar] [CrossRef]
- Lukes, P.; Stenberg, P.; Mottus, M.; Manninen, T.; Rautiainen, M. Multidecadal analysis of forest growth and albedo in boreal finland. Int. J. Appl. Earth Obs. Geoinf. 2016, 52, 296–305. [Google Scholar] [CrossRef]
- Xue, Y. The impact of desertification in the mongolian and the inner mongolian grassland on the regional climate. J. Clim. 1996, 9, 2173–2189. [Google Scholar] [CrossRef]
- Fensholt, R.; Langanke, T.; Rasmussen, K.; Reenberg, A.; Prince, S.D.; Tucker, C.; Scholes, R.J.; Le, Q.B.; Bondeau, A.; Eastman, R. Greenness in semi-arid areas across the globe 1981–2007—An earth observing satellite based analysis of trends and drivers. Remote Sens. Environ. 2012, 121, 144–158. [Google Scholar] [CrossRef]
- Zhai, J.; Liu, R.; Liu, J.; Huang, L.; Qin, Y. Human-induced landcover changes drive a diminution of land surface albedo in the loess plateau (China). Remote Sens. 2015, 7, 2926–2941. [Google Scholar] [CrossRef] [Green Version]
- He, P.; Xu, L.; Bi, R.; Yang, F.; Zhen, Z. Spatial and temporal characteristics of surface albedo in badain jaran desert, china. Earth Sci. Inform. 2021, 14, 429–440. [Google Scholar] [CrossRef]
Publisher’s Note: MDPI stays neutral with regard to jurisdictional claims in published maps and institutional affiliations. |
© 2021 by the authors. Licensee MDPI, Basel, Switzerland. This article is an open access article distributed under the terms and conditions of the Creative Commons Attribution (CC BY) license (https://creativecommons.org/licenses/by/4.0/).