Article

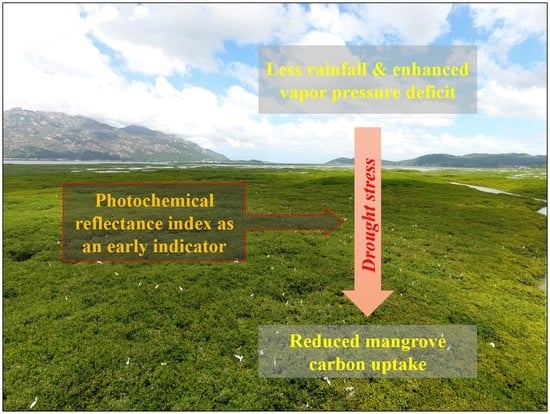
Response of Mangrove Carbon Fluxes to Drought Stress Detected by Photochemical Reflectance Index

1
State Key Laboratory of Marine Environment Science, Xiamen University, Xiamen 361102, China
2
Key Laboratory of the Coastal and Wetland Ecosystems (Ministry of Education), Xiamen University, Xiamen 361102, China
3
College of the Environment and Ecology, Xiamen University, Xiamen 361102, China
4
Coastal and Ocean Management Institute, Xiamen University, Xiamen 361102, China
5
Southern Marine Science and Engineering Guangdong Laboratory (Zhuhai), Zhuhai 519000, China
*
Author to whom correspondence should be addressed.
Remote Sens. 2021, 13(20), 4053; https://doi.org/10.3390/rs13204053
Submission received: 9 September 2021 / Revised: 5 October 2021 / Accepted: 8 October 2021 / Published: 11 October 2021

Abstract

:
The photochemical reflectance index (PRI) has been often used as a physiology-based remote sensing indicator of ecosystem carbon fluxes. However, the assessments of PRI in tracking long-term carbon fluxes with climatic anomalies in mangroves are very limited. In this study, four-year (2017–2020) continuous time series measurements from tower-based eddy covariance and spectral systems in a subtropical mangrove were used to explore the ability of PRI in tracking the response of mangrove carbon fluxes to climate fluctuations and drought stress. The results showed that the temporal dynamics of daily PRI and carbon fluxes shared similar variation patterns over the study period, experiencing simultaneously decreasing trends under drought stress. Compared with the first three years, annual mean values of NEE in 2020 decreased by 10.7% and PRI decreased by 29.0%, correspondingly. PRI and carbon fluxes were significantly correlated across diurnal, seasonal, and annual time scales with better fitness under drought stress. Dark-state PRI (PRI0), the constitutive component of PRI variation due to seasonally changing pigment pool size, showed similar temporal variation as PRI in response to drought stress, while delta PRI (ΔPRI), the facultative component of PRI variation due to diurnal xanthophyll cycle, showed no response to drought stress. This study confirms the ability of PRI to track temporal dynamics of mangrove carbon fluxes on both short-term and long-term scales, with the temporal variation of PRI largely affected by the long-term constitutive pigment pool size. This study highlights the potential of PRI to serve as an early and readily detectable indicator to track the response of the mangrove carbon cycle to climatic anomalies such as drought stress.

Graphical Abstract

1. Introduction

Mangrove wetland is one of the most important coastal ecosystems in the world, well known for its high carbon assimilation rates and strong carbon sink potential [1,2,3,4]. With high gross ecosystem production and a low respiration rate, mangrove forests can sequester more carbon than nearby terrestrial forests [5]. The net primary production of mangrove forests was conservatively estimated to be ~218 ± 72 TgC year−1 [2]. Although mangrove forests play an important role in the global carbon cycle [6], they are disappearing at a rate roughly equivalent to the declining rate of tropical rainforests [7]. The carbon sink strength of mangrove wetland could reduce in response to global warming in the future through the temperature-carbon cycle feedback [8]. Therefore, more research is needed to better understand the response of the mangrove carbon cycle to global climate change.
Mangrove forests are mainly distributed along the coast in tropical and subtropical zones [5], and they are experiencing various environmental stresses such as high salinity [9], tidal inundation [4], and drought stress [10]. Among these, drought stress is one of the major chronic environmental stresses that adversely affect mangrove growth [11]. Drought stress due to reductions in rainfall can result in a decline in mangrove productivity or even an exacerbation of mangrove loss [10,12,13,14]. The decline of freshwater inputs and increasing evapotranspiration with drought stress can pose unfavorable salinity conditions for mangroves [15,16], and thus mangrove carbon assimilation rates might decrease dramatically during dry seasons [17]. Compared with mangroves experiencing adequate rainfall, mangroves in drier areas tend to be shorter [18]. Annual rainfall has been identified as a good predictor of mangrove ecosystem carbon stocks [19]. In addition, many studies have emphasized the necessity for considering the lag or cumulative effects of environmental factors that might be more important than their direct effects on mangrove growth [20,21,22].
To track the response of mangrove forests to drought stress in the context of climate change, there is a pressing need for continuous monitoring of mangrove carbon dynamics, which are highly heterogeneous with strong temporal and spatial variations [23,24]. The Eddy covariance (EC) technique [25] is typically applied to measure ecosystem gas exchange across various ecosystems at a high temporal resolution, but spatially extensive applications of the EC technique are often limited by its high instrument and infrastructure costs. To overcome this limitation, tower-based optical remote sensing measurements within the flux tower footprint are being conducted aiming to seek the linkage between optical remote sensing and ecosystem carbon dynamics. The light use efficiency (LUE) model is one of the widely used frameworks for integrating optical sampling and flux measurements. One of the established optical sampling methods within this framework is the photochemical reflectance index (PRI), which has been proved to be able to reflect the physiological regulations of the plants [26,27]. This physiology-based vegetation index reflects the decline of reflectance at 531 nm due to the xanthophyll cycle triggered by the photo-protective mechanism of plants when receiving excessive radiation. It has been proved to be closely related to the LUE of evergreens at leaf and canopy scales [28,29,30,31]. The increasing number of applications of PRI have greatly improved the accuracy of gross primary production (GPP) estimation using remote sensing approaches [32].
The response of PRI to environmental stresses can reflect important characteristics of the status of plants. Numerous studies focus on the relationships between PRI and environmental stresses, including water stress [33] and salinity stress [34]. Over the diurnal scale, PRI variations indicate the pigment interconversion via the xanthophyll cycle in response to excessive light [26]. Over longer time scales, the variations of pigment pool size in response to various environmental stresses could be the primary causes of PRI variations [35]. Physiological mechanisms driving PRI variations are not straightforward, and it is important to disentangle the effects of diurnal variation in the xanthophyll cycle (facultative component) and seasonal variation in pigment pool size (constitutive component). To further quantify the contribution of these two components on PRI variations, many PRI-relevant formulations have been proposed. Gamon and Berry [36] proposed that the confounding contributions of these two effects (constitutive and facultative) could be isolated using dark-adapted leaves as a baseline for PRI measurements, where the dark-state PRI was defined as “PRI0”. They found that most of the PRI variations were due to the changes in constitutive pigment pool size associated with species and canopy position. Magney et al. [37] proposed a delta PRI (ΔPRI) by subtracting the midday PRI from the early morning PRI (PRI0) to represent the diurnal magnitude of xanthophyll pigment interconversion in response to changing environmental conditions. To date, the physiological controls on PRI variations in mangroves have not been well understood. Empirical studies are needed to explore the complex mechanisms underlying PRI variation across different time scales in mangrove forests.
The introduction of PRI has greatly improved the assessments of photosynthetic activity in evergreen ecosystems, while most of these ecosystems experience boreal climate conditions [38,39]. The ability of PRI to track the ecosystem carbon dynamics of mangrove forests has not been fully explored. Compared to boreal evergreen ecosystems, mangrove forests in subtropical and tropical zones experience much smaller seasonal variation in temperature, and the driving factors of PRI variations may be different. In addition, the photosynthesis rates of mangroves tend to be saturated at relatively lower light levels due to their lower stomatal conductance and intercellular CO2 concentrations [5]. Given these special characteristics, it is unclear whether PRI can track the long-term temporal variations of mangrove carbon fluxes. Although some attempts have been made to focus on this issue [40,41], most lack long-term continuous measurements that are necessary for clarifying the relationship between PRI and mangrove carbon fluxes at both seasonal and inter-annual time scales. Zhu et al. [42] explored the link between PRI and mangrove carbon dynamics at a seasonal scale but they were not able to reveal any inter-annual variation pattern. Here, based on four-years of continuous measurement of mangrove PRI and EC-based ecosystem carbon fluxes, the purposes of this study are (1) to analyze the response of mangrove carbon fluxes to climate fluctuations and drought stress, (2) to examine the ability of PRI to track the response of the mangrove carbon cycle to climatic anomalies, and (3) to explore the complex mechanisms underlying PRI variations across different time scales.

2. Materials and Methods
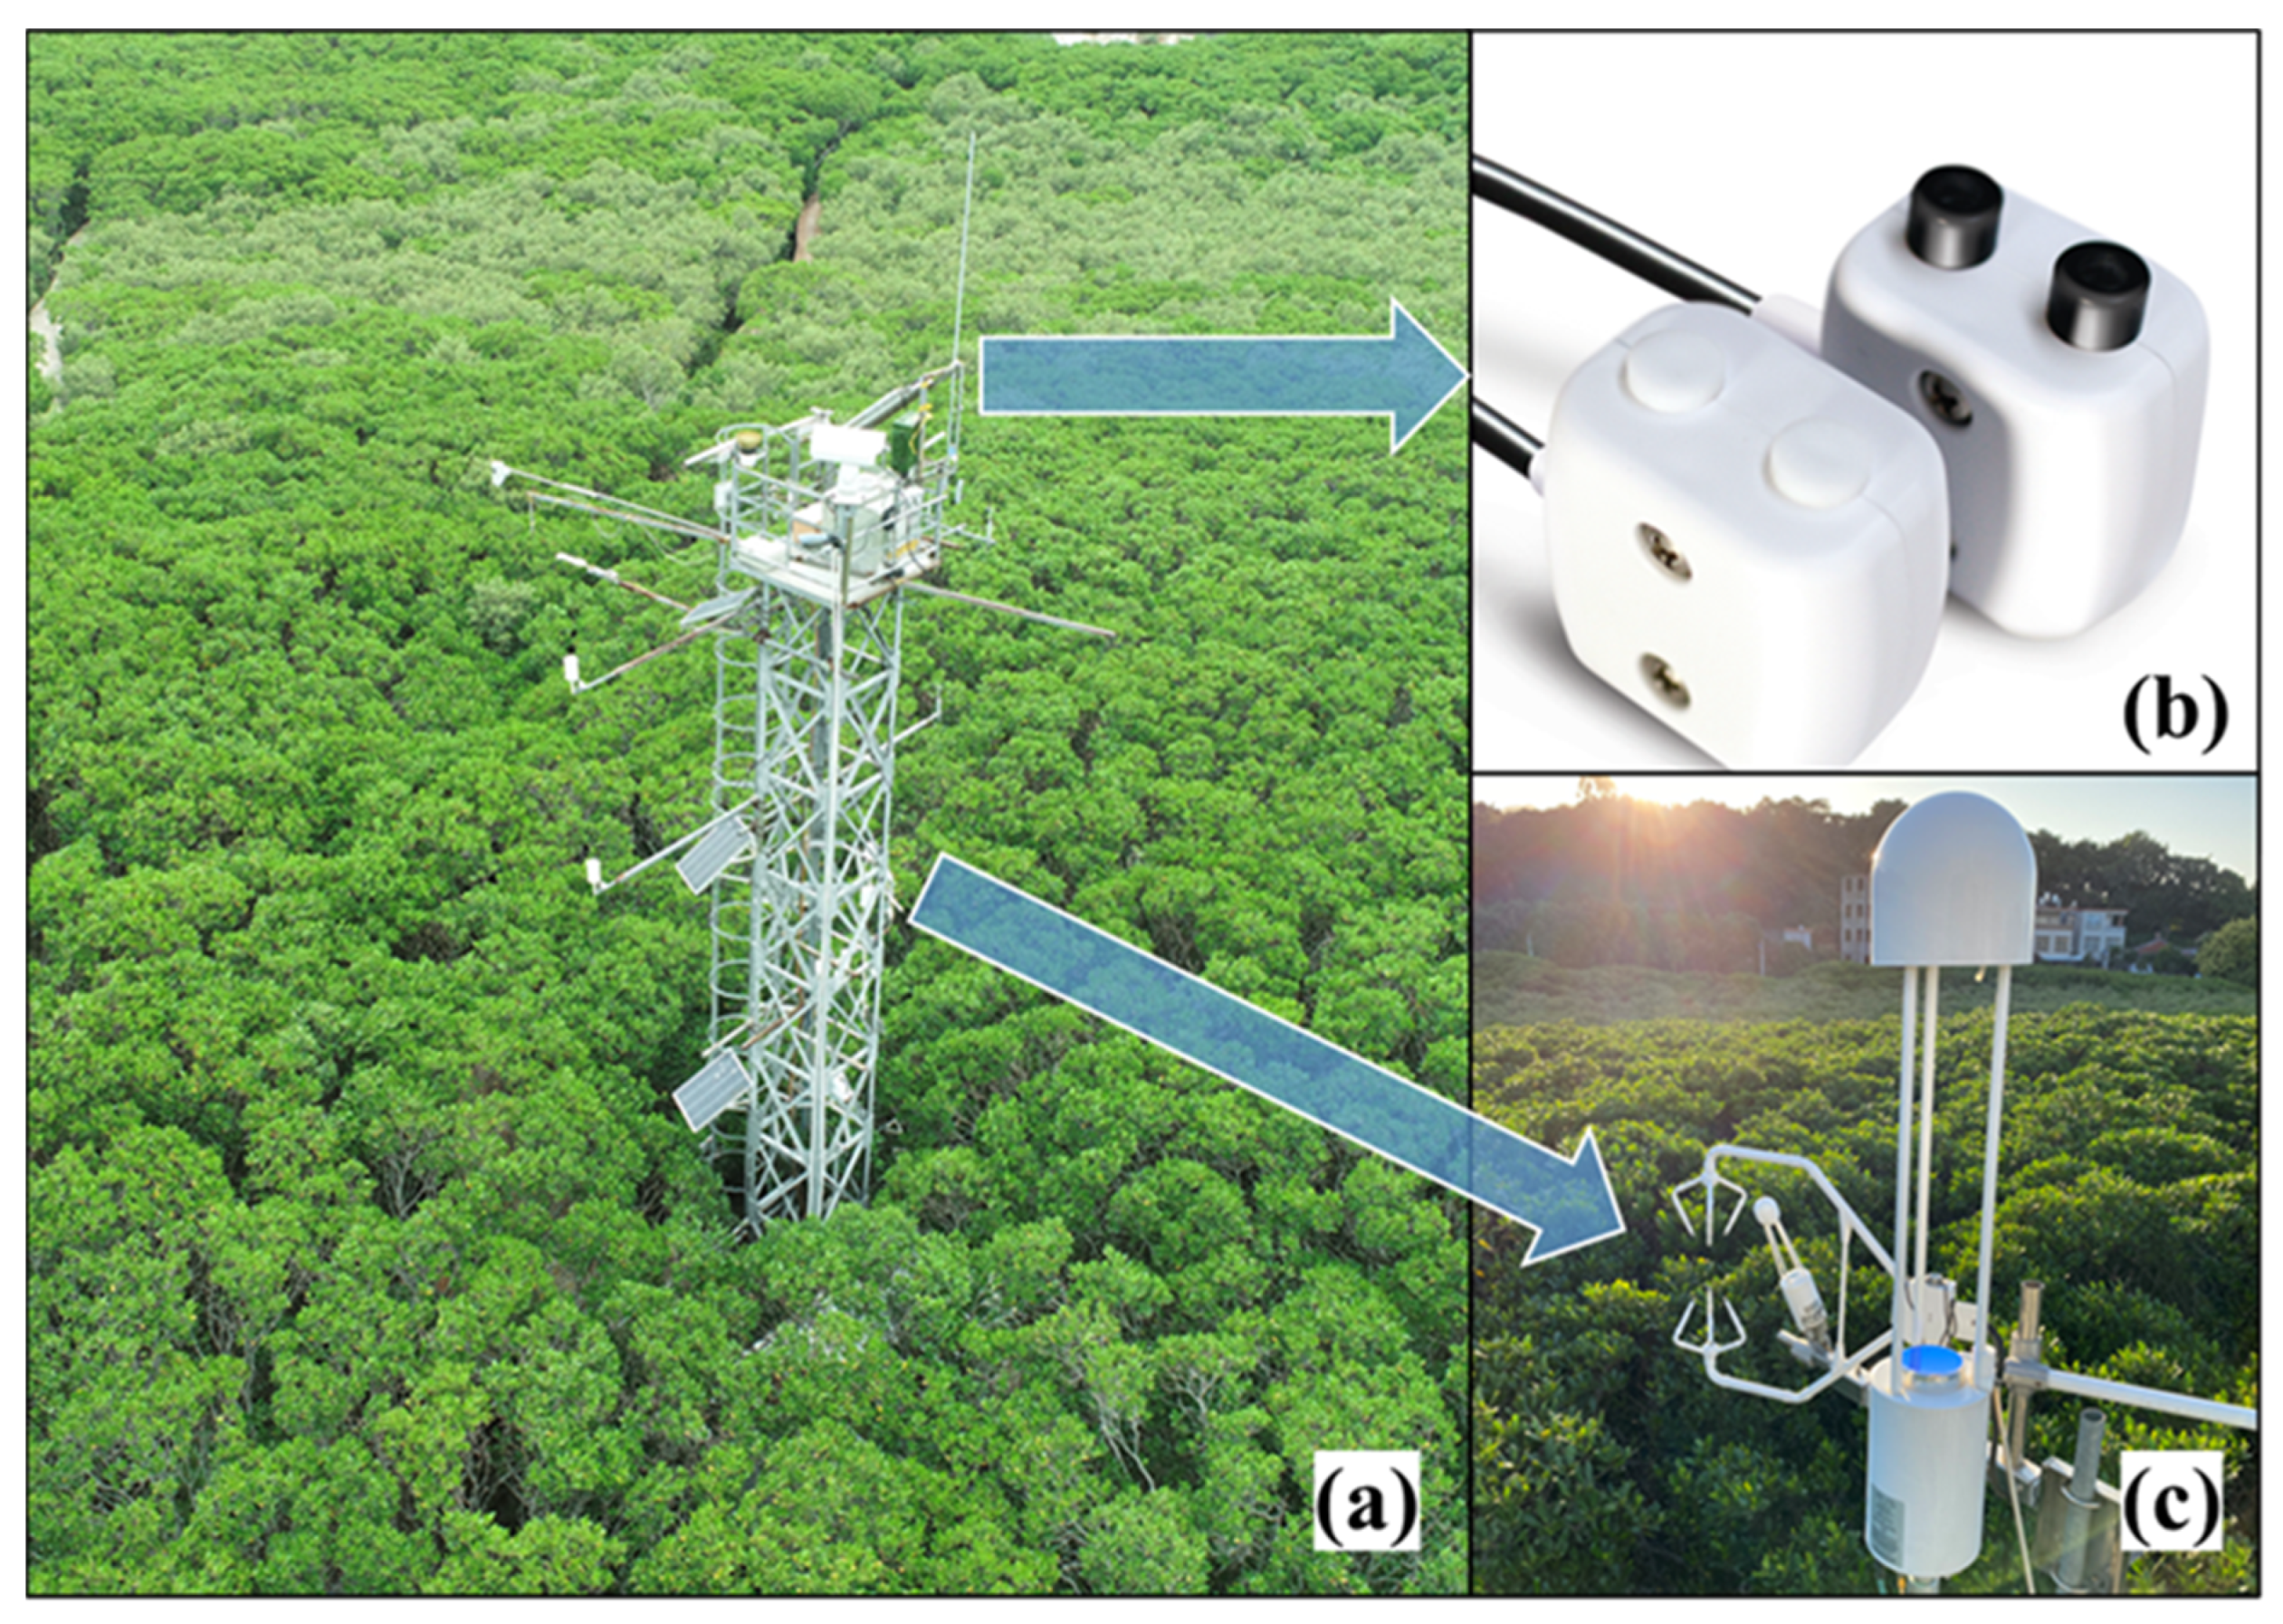
2.1. Study Area

Long-term continuous measurements from EC and spectral systems were conducted at a mangrove flux tower (23.9240°N, 117.4147°E) of ChinaFLUX and USCCC networks, located in an estuarine wetland of Southeast China (Figure 1). The study area has a subtropical monsoon climate, with an average annual temperature of 21.2 °C, and average annual precipitation of 1714.5 mm. The dominant species of the mangrove forests consist of Kandelia obovate, Avicennia marina, and Aegiceras corniculatum, with an average leaf area index of 1.7 m2/m2 and average canopy height of 4 m [43]. The wetland is inundated by irregular tides twice a day, with the salinity of tidal surface water varying from 0 to 15 PSU. All the field measurements were permitted by Zhangjiang Estuary Mangrove National Nature Reserve, China. More details on this study area can be found in our previous studies [44,45].

2.2. Environmental Measurements

All the meteorological data including photosynthetically active radiation (PAR), air temperature, vapor pressure deficit (VPD), and rainfall were recorded in a CR1000 datalogger (Campbell Scientific, Inc., Logan, UT, USA). PAR was measured using the PQS1 PAR Quantum sensor (Kipp & Zonen, Delft, The Netherlands) installed at ~12 m above the ground, where the CNR4 Net Radiometer (Kipp & Zonen, Delft, The Netherlands) was also installed to measure incoming shortwave radiation (SWin) and outcoming shortwave radiation (SWout). Air temperature and relative humidity were measured by the HMP155A sensor (Vaisala, Helsinki, Finland) mounted at ~9 m, and VPD was estimated from them [46]. Rainfall was measured using the TE525MM Rain Gage (Campbell Scientific, Inc., Logan, UT, USA) on the top of the flux tower. Tidal measurements including surface water level (HOBO U20L-04 Water Level Logger, Onset, Bourne, MA, USA) and salinity (U24-002-C Conductivity Logger, Onset, Bourne, MA, USA) were deployed above the sediment surface near the flux tower.

2.3. Flux Data and LUE Calculation

Four-year continuous 10-Hz time series raw data were measured using an EC system and recorded in a CR3000 datalogger (Campbell Scientific, Inc., Logan, UT, USA). The EC system included a three-axis sonic anemometer (CSAT-3, Campbell Scientific, Inc., Logan, UT, USA) and an open path infrared gas analyzer (LI-7500, Li-COR Inc., Lincoln, NE, USA). Net ecosystem exchange (NEE) was calculated through flux corrections and quality control procedures [44] (including axis rotation, ultrasonic correction, frequency response correction, steady-state test, turbulent conditions test, statistical test, absolute limits test, and rain test) mainly using the EddyPro6.1 software (Li-COR Inc., Lincoln, NE, USA). Daytime Re (ecosystem respiration) was estimated from daytime temperature based on the fitted nighttime temperature-respiration exponential regression model [44] and then GPP was calculated as the value of daytime Re minus NEE (Equation (1)). LUE was computed as the ratio of GPP and APAR (Equation (2)), where APAR was the product of PAR and f A P A R (fraction of absorbed PAR) (Equation (3)). f A P A R was derived from S W i n (incoming shortwave radiation) and S W o u t (outgoing shortwave radiation) (Equation (4)). The calculation of LUE was based on half-hour data of GPP and APAR and then converted to daily mean values. In this study, the downward (from the atmosphere to mangroves) and upward carbon fluxes were represented by positive and negative values, respectively.
G P P = R e N E E
L U E = G P P A P A R
A P A R = P A R × f A P A R
f A P A R = 1 S W o u t S W i n

2.4. Spectral Measurement and Processing

With spectral reflectance sensors (SRS; Decagon Devices, Pullman, WA, USA) mounted at the height of ~9 m above the canopy, canopy spectral radiance and sky irradiance were continuously measured to calculate PRI. A pair of SRS sensors were fixed at the same height with the upward-facing sensor measuring sky irradiance and the downward-facing sensor measuring canopy spectral radiance. The downward-facing sensor was affixed facing north with a 45° view zenith angle. The field of view of the upward sensor was hemispherical and the downward one was 36° with an optical footprint of ~200 m2. Spectral measurements under rainy conditions were excluded. Time series of canopy reflectance values at 531 nm ( r 531 ) and 570 nm ( r 570 ) bands were derived from corresponding canopy radiance and sky irradiance measurements, and PRI was calculated based on these two canopy reflectance values [26]:
P R I = r 531 r 570 r 531 + r 570
To distinguish the relative contribution of two components (constitutive and facultative) to the temporal variation of the PRI time series, we calculated several PRI-derived indicators for each day to explore the underlying physiological mechanisms. PRI0 was calculated as the mean value of PRI under relatively low light conditions (solar elevation angles between 35–45°) to represent a dark-state pigment content (constitutive) with minimal xanthophyll de-epoxidation. The application of this criterion of solar elevation angles excluded data of bad quality under too low light conditions [37]. Sunlit PRI was calculated as the minimum PRI around noon (between 11:30 and 13:30 local time) with the strongest illumination. Sunlit PRI was subtracted from PRI0 to calculate seasonal ΔPRI, which was then used to indicate the diurnal magnitude of xanthophyll pigment conversion (facultative).

2.5. Statistical Analyses

The relationships among PRI, carbon, and environmental variables across time scales were explored by various statistical analyses including Pearson correlation, linear regression, and random forest (RF). Pearson correlation and linear regression were applied to examine the PRI-carbon relationships using half-hourly and daily data, respectively, while the RF approach was used to disentangle the complicated and non-linear interactions among these variables based on monthly data. The RF is a non-parameter machine learning approach without statistical presumption of explanatory variables and thus less affected by the issues due to the nonlinearity and collinearity among explanatory variables [47,48]. Furthermore, the RF is an ensemble algorithm by aggregating predictions from a large number of decision trees, which reduces the possibility of the overfitting issue associated with single-tree predictors. The out-of-bag (OOB) error estimation was used here to assess the generalization ability of the RF prediction [49,50,51]. Based on the RF approach, the relative importance and affecting direction between dependent and explanatory variables were quantified to identify the dominant factors driving the variations of PRI and carbon fluxes. In this study, three sets of RF statistical analyses were conducted. The first two sets were used to analyze the influence of environmental variables on GPP and NEE. Due to the potential lag effects, advanced time series of each environmental variable (considering one and two months ahead; expressed as var(t − 1) and var(t − 2)) were also treated as an explanatory variable in addition to itself (expressed as var(t)). The third set was used to examine how PRI was correlated with environmental variables, GPP and NEE. By assuming that PRI responses to varying environmental variables faster than carbon fluxes, advanced time series of environmental variables (considering one and two months ahead) and lagged time series of GPP and NEE (considering one and two months later; expressed as var(t + 1) and var(t + 2)) were also treated as explanatory variables in addition to themselves. It is important to note that these RF applications were not to predict PRI or carbon fluxes from environmental variables but to disentangle their interactions and compare their relative importance in a quantitative manner. All data processing and statistical analyses were performed using MATLAB software (The MathWorks, Inc., Natick, MA, USA).

3. Results

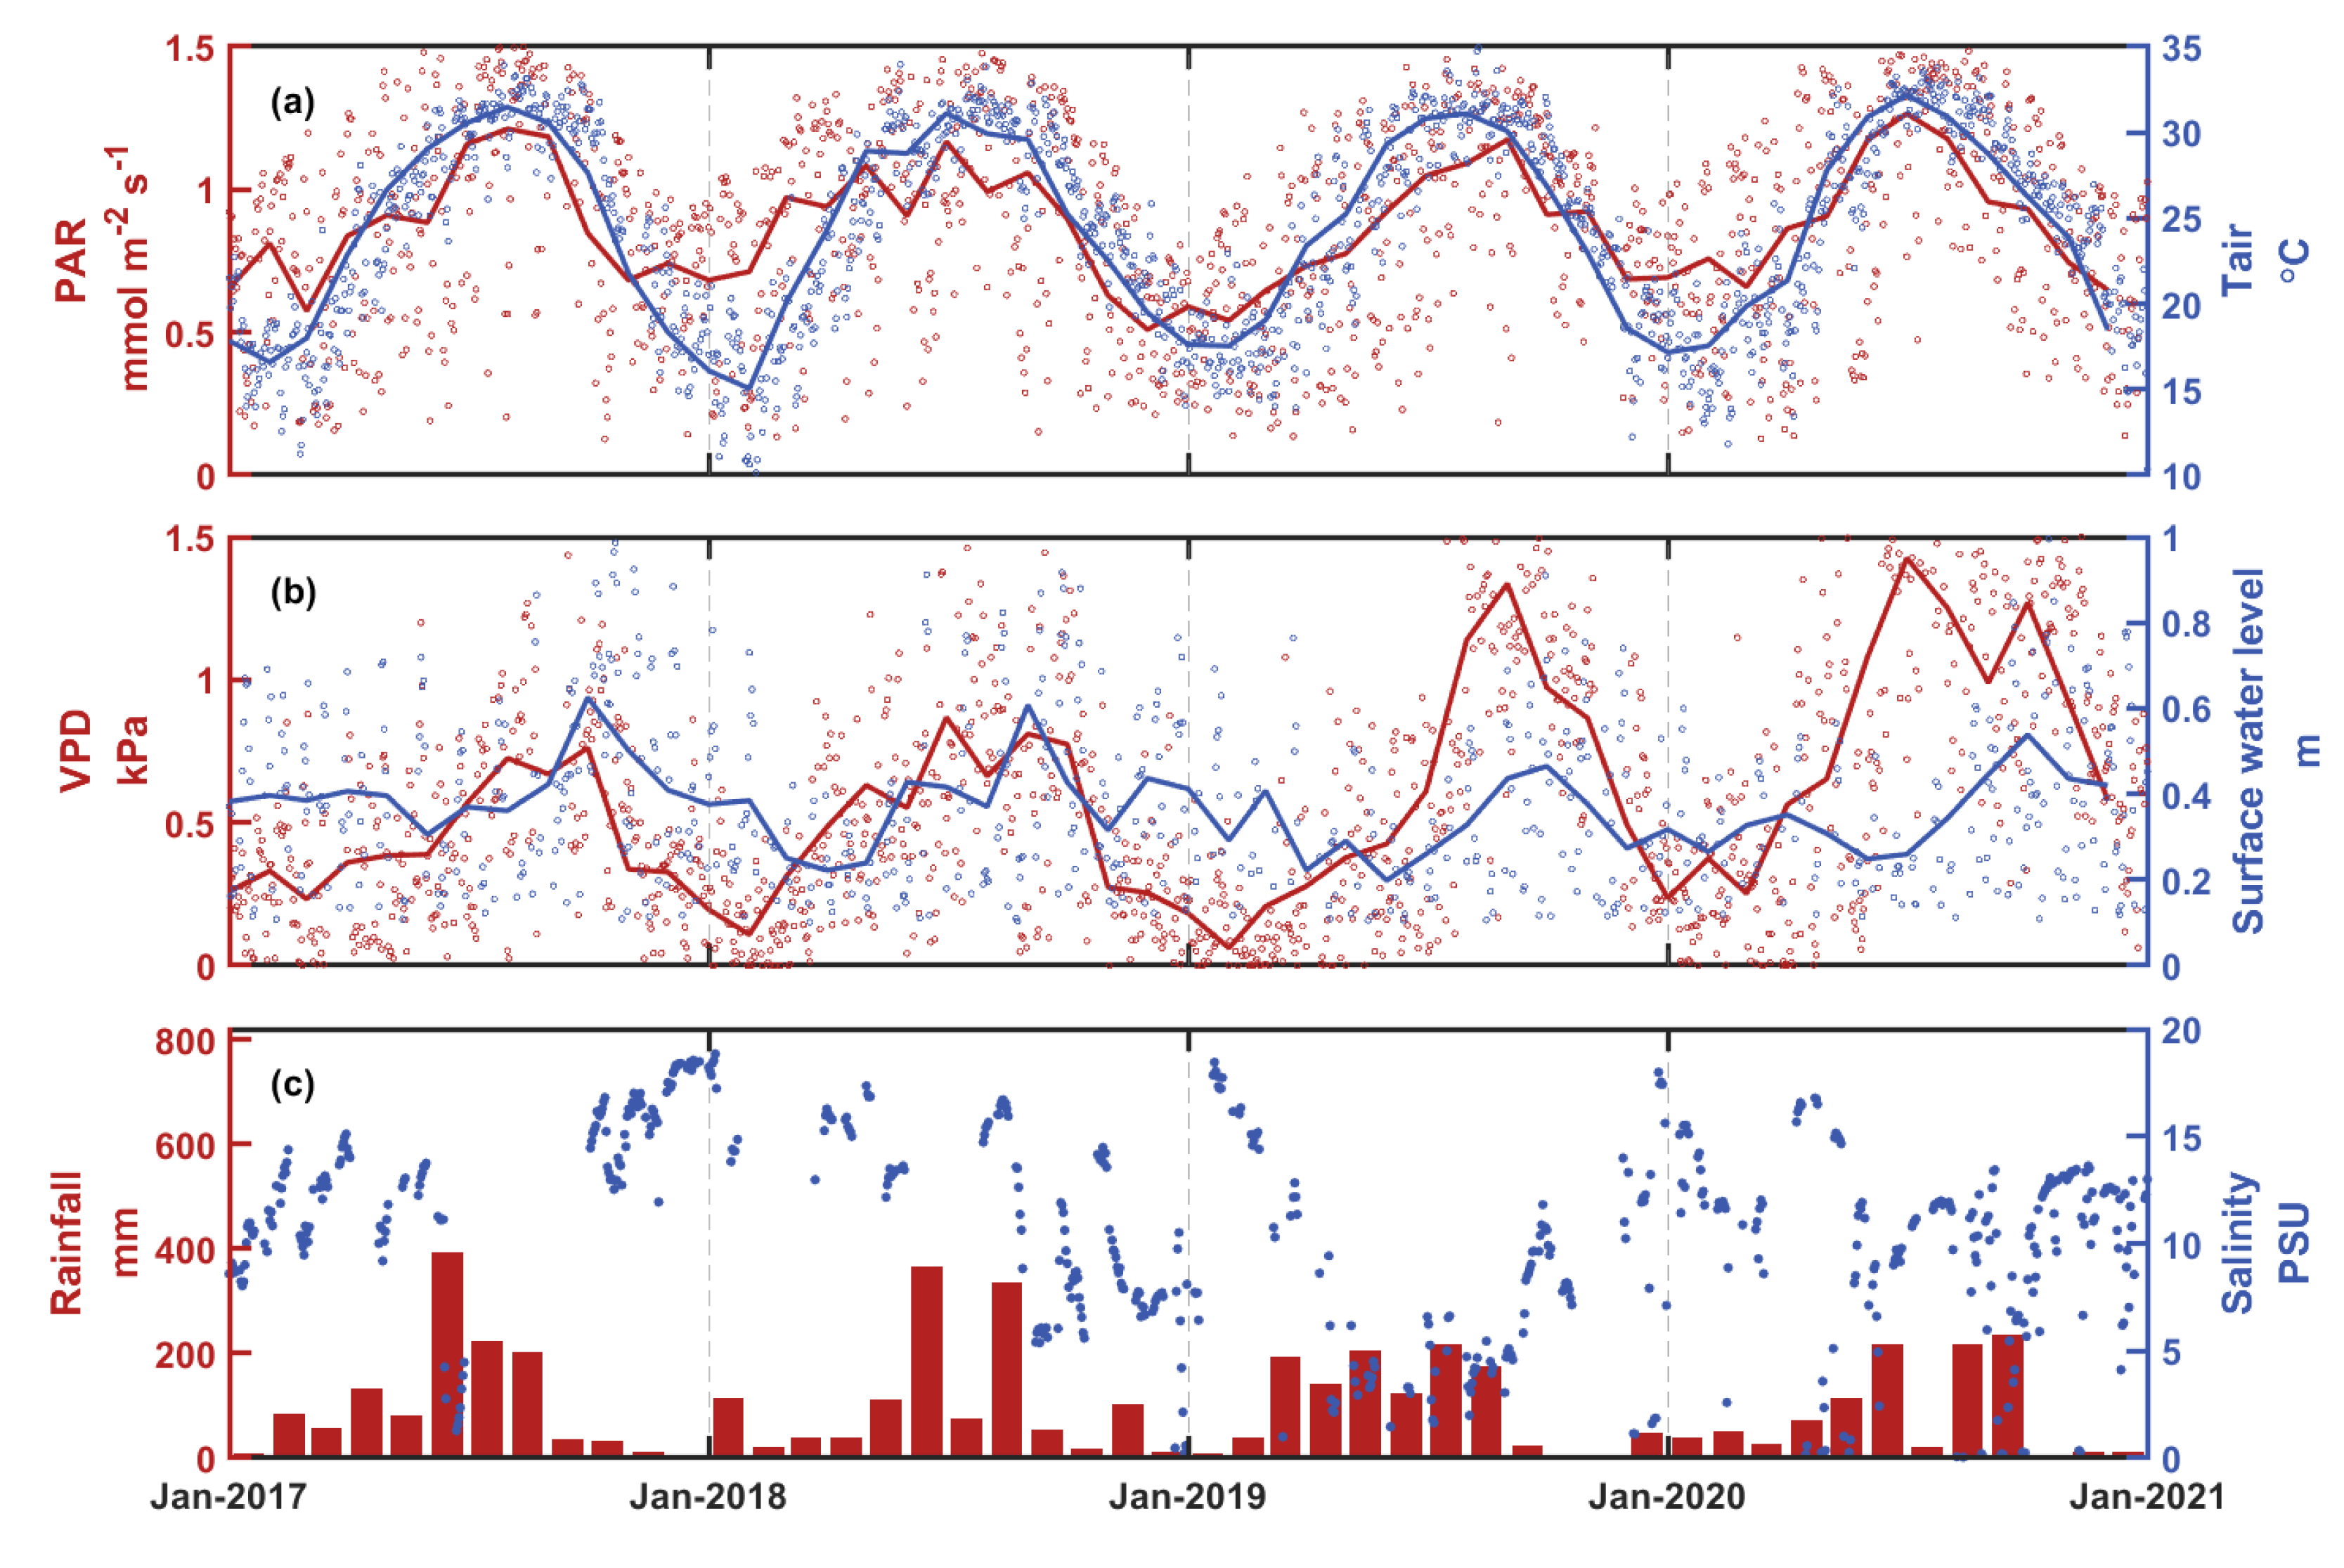
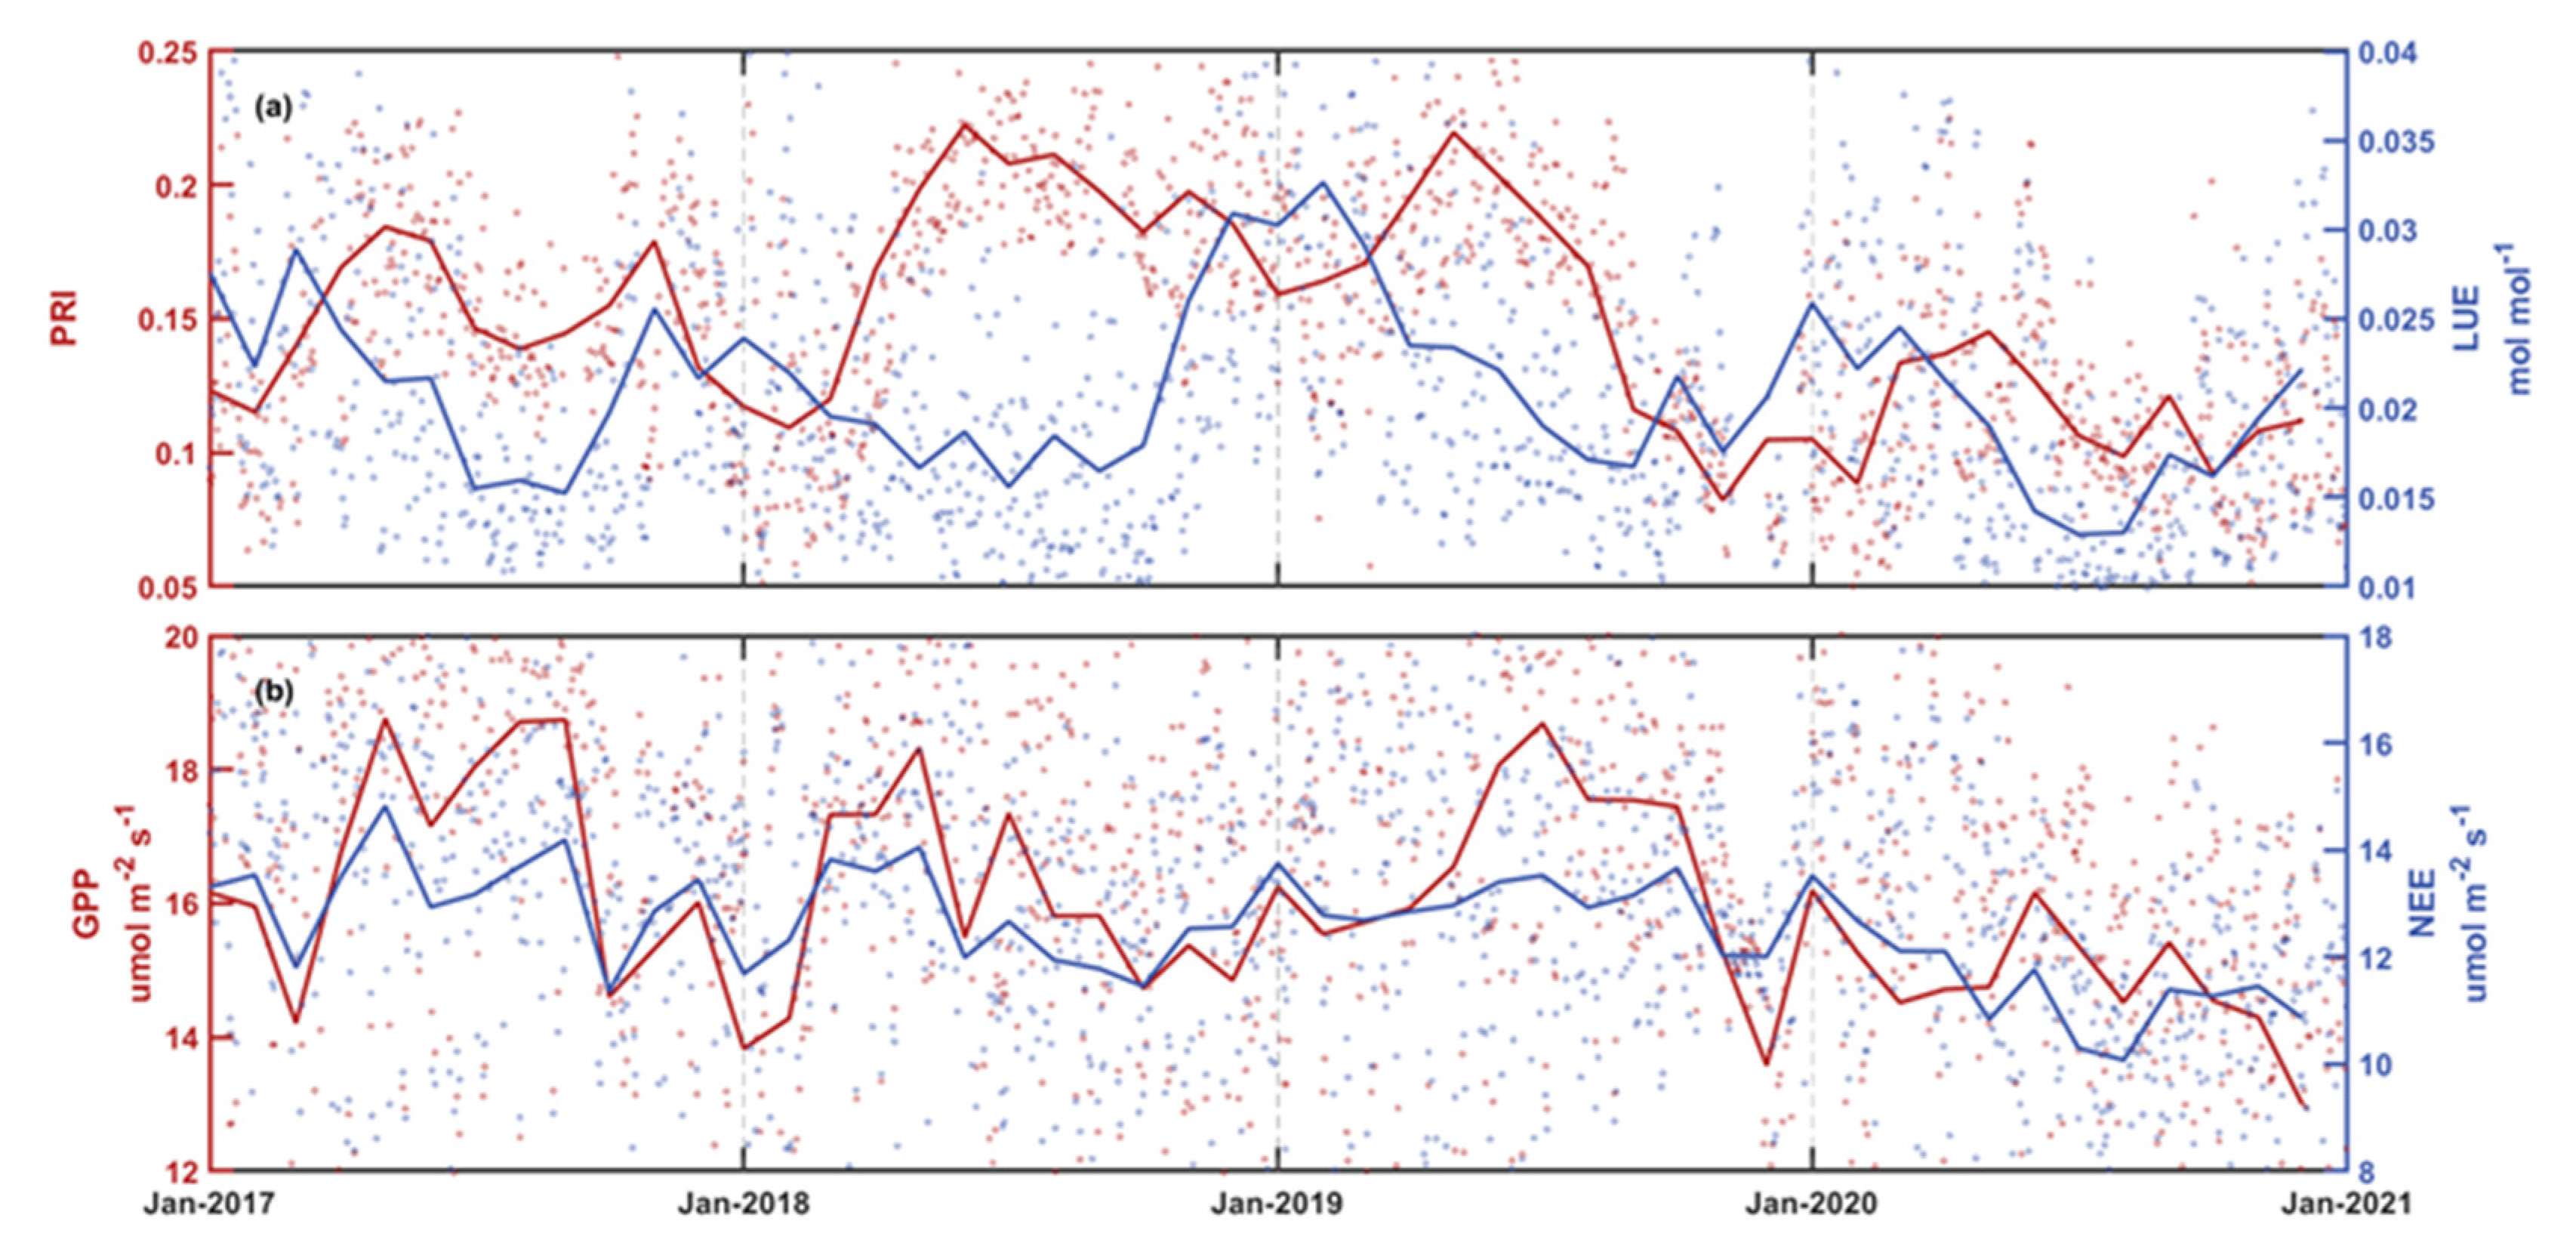
3.1. Temporal Variations of Environmental Factors and Carbon Fluxes

Significant seasonal patterns of PAR were observed with higher and lower mean values in summer and winter, respectively (Figure 2a). On an annual scale, the mean values of PAR in 2020 were higher than in previous years, especially in summer when the mean value of 2020 reached 1.21 mmol m−2 s−1 with other years only about 1.00 mmol m−2 s−1 (Table 1). The air temperature shared a similar seasonal pattern with PAR, and the seasonal mean value of summer in 2020 was 1 °C higher than previous summers. The seasonal patterns of VPD were similar with air temperature, presenting a slight difference among four years with higher VPD in summer and autumn, especially from late 2019 to late 2020 (Figure 2b, Table 1). Furthermore, the mean value of VPD for each season in 2020 was higher than in previous years, with the mean value of summer (up to 1.25 kPa) significantly higher than other seasons (Table 1). This can be explained by less rainfall from autumn in 2019 to summer in 2020, leading to drought stress over this period (Figure 2c). Over this period, the cumulative rainfall only reached 778.9 mm, roughly equivalent to the rainfall of summer (774.8 mm) in 2018 and even less than that of summer (814.1 mm) in 2017 (Table 1). We also compared the amount of rainfall over this period with the multi-year (2011–2019) rainfall measurements from a meteorological station of the China Meteorological Administration (~10 km away from the study area). The rainfall over this period only accounted for approximately half of the multi-year mean annual rainfall. The daily maximum water level tended to be higher in autumn and showed no obvious difference among years (Figure 2b). The salinity was higher in winter among seasons and the average salinity was relatively higher in 2020 than in previous years (Figure 2c).
The seasonal LUE varied from 0.013 to 0.028 mol mol−1 and tended to show a U-shaped pattern with higher LUE in spring and winter and lower LUE in summer and autumn (Figure 3a). Compared with annual mean values in previous years, the mean values in 2020 decreased by 12%. GPP and NEE shared similar seasonal patterns, showing higher values in spring and summer (Figure 3b). Compared with the annual mean values of GPP in previous years (16.71, 15.88, and 16.51 μmol m−2 s−1), the annual mean values in 2020 decreased by 9.0%. Similarly, the mean values of NEE in 2020 decreased by 10.7% in comparison with previous years (13.22, 12.53, and 12.98 μmol m−2 s−1) (Table 1). The decrease in the carbon sink appeared to lag behind the increasing VPD and decreasing rainfall (Figure 2 and Figure 3).

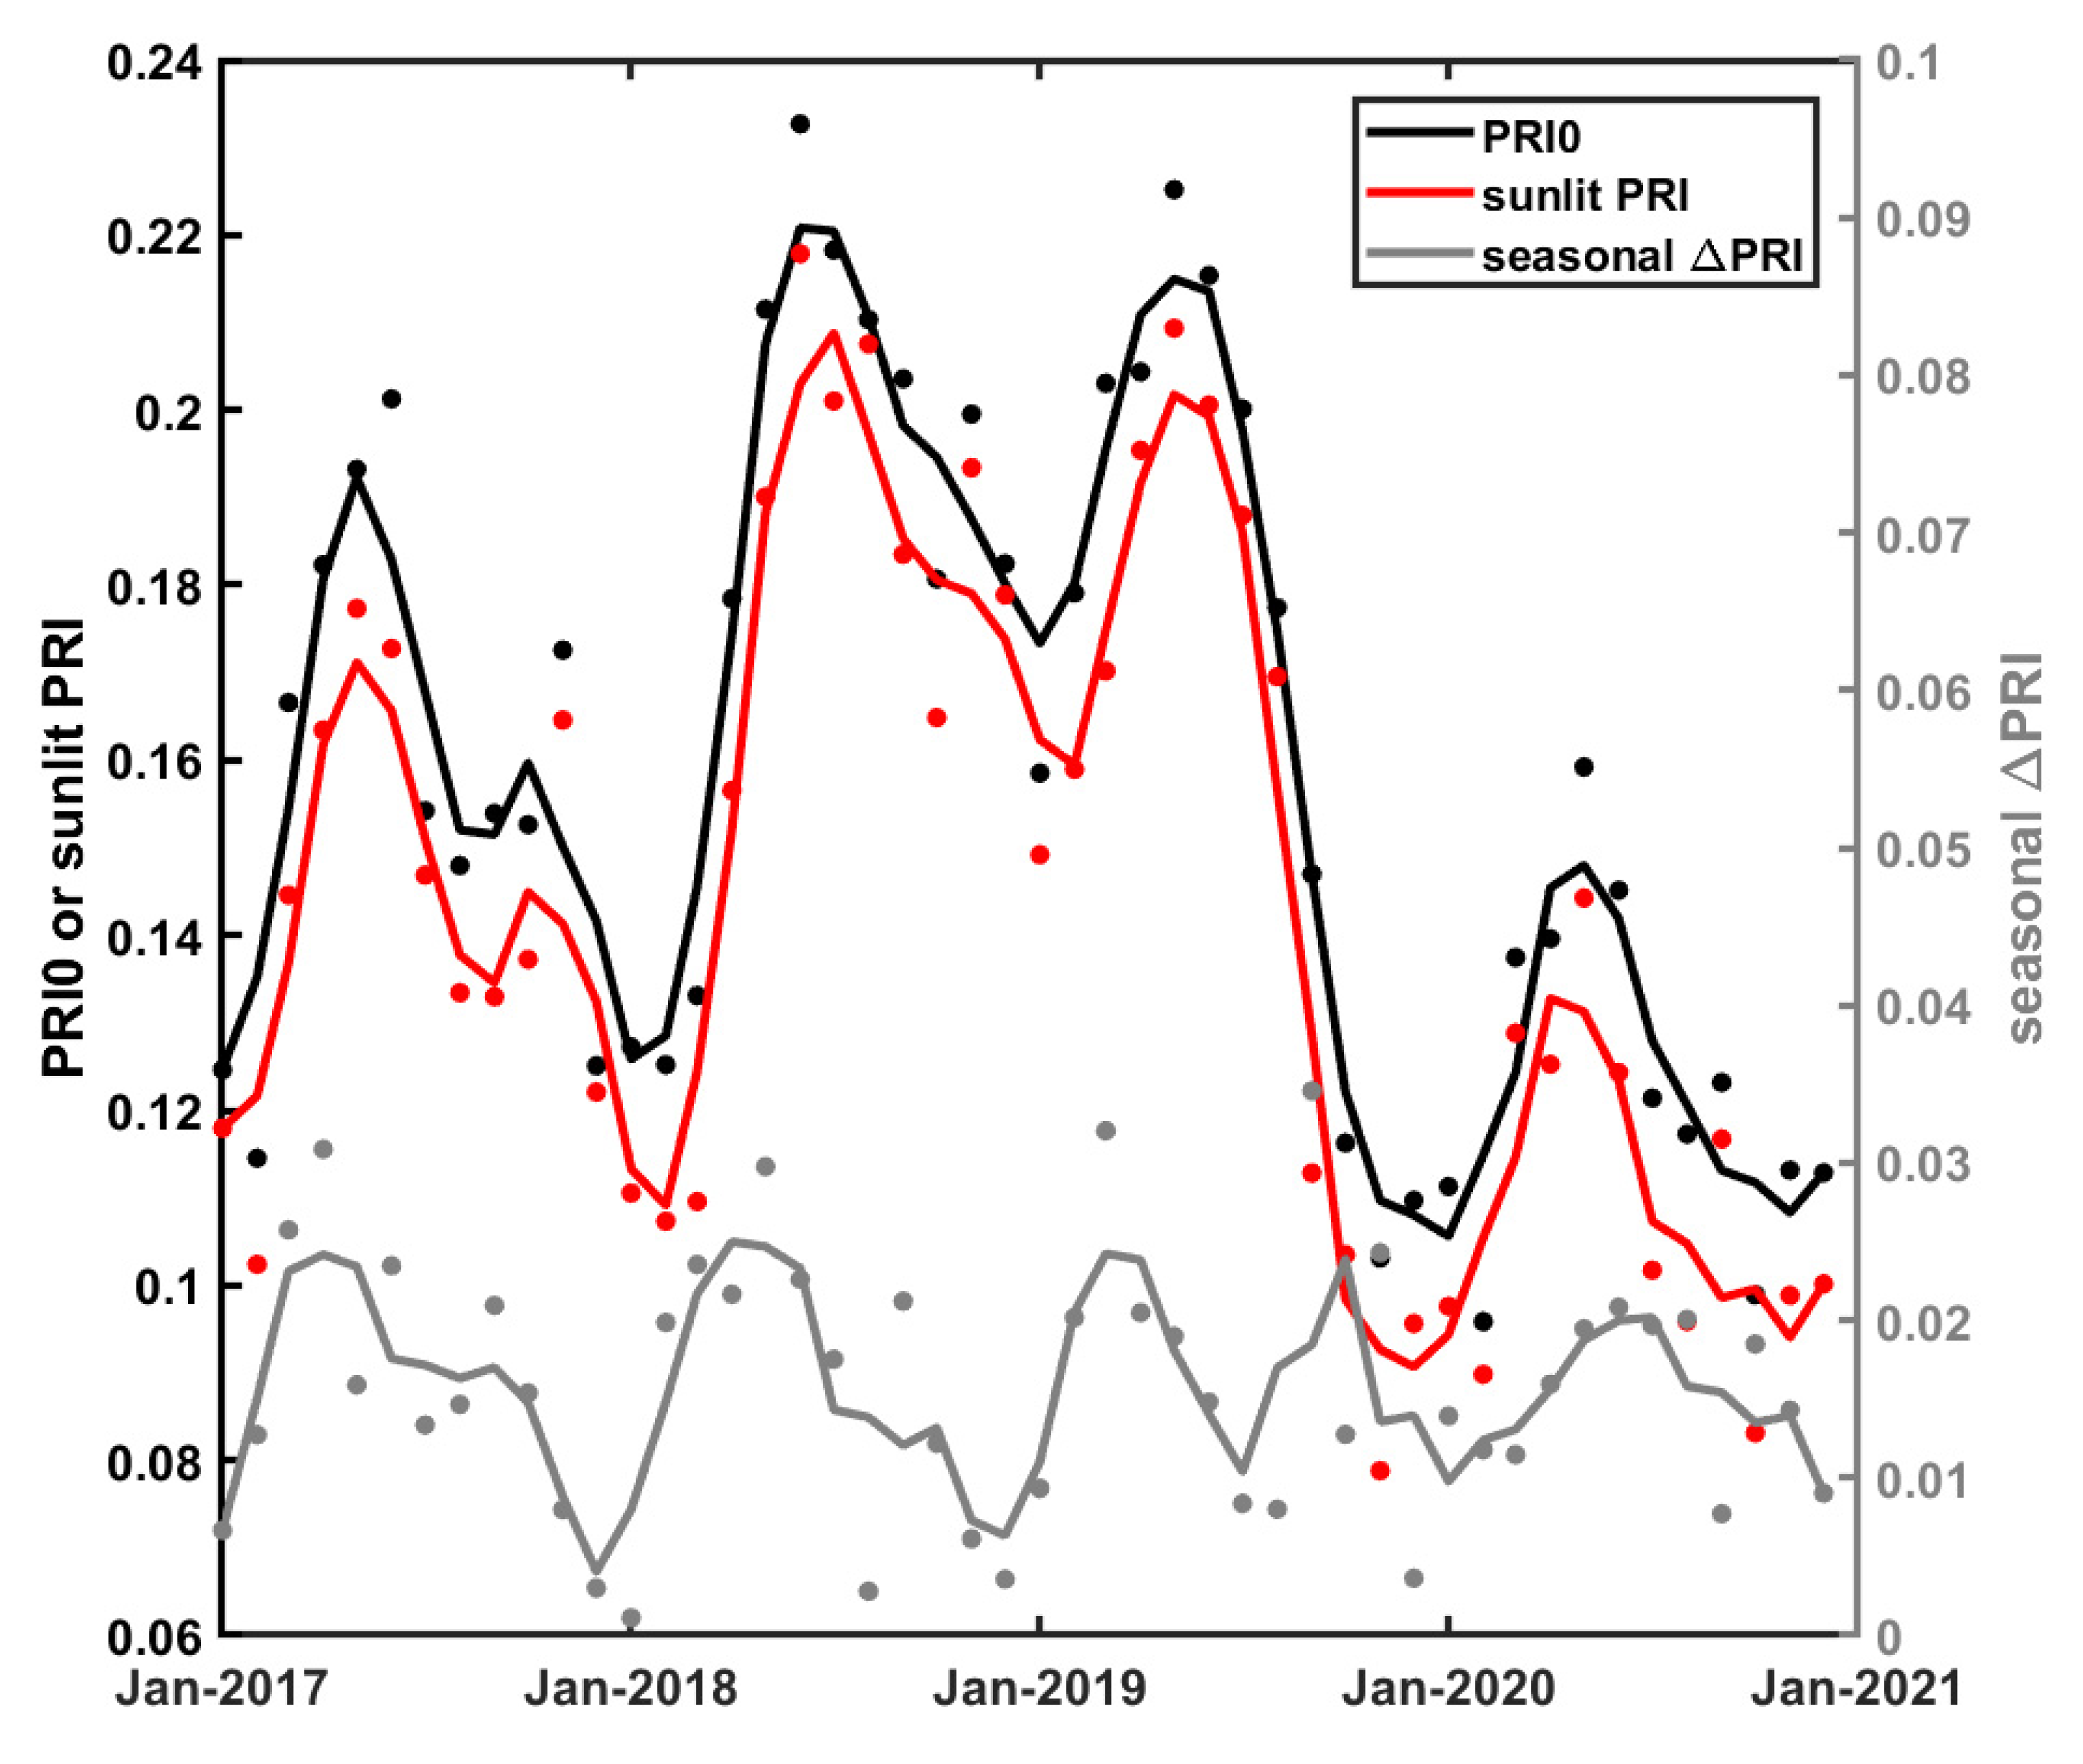
3.2. Temporal Variations of PRI and Its Components

The seasonal patterns of PRI appeared to be hump-shaped with higher values in spring and summer, which was the opposite pattern to the seasonal trend of LUE (Figure 4). The seasonal mean PRI ranged from 0.10 to 0.21 over the four years. On an annual scale, the mean values of PRI in each year reached up to 0.15, 0.18, 0.16, and 0.11. Compared to previous years, annual mean values of PRI in 2020 decreased by 29.0%, presenting an obvious decreasing trend. The decreasing trend of PRI appeared to lag behind the increasing VPD and decreasing rainfall but went ahead of the decreasing carbon sink (Figure 2 and Figure 3).
Seasonal and annual variation patterns of different components of PRI were presented to explore the underlying mechanisms driving PRI variations (Figure 4). The variation patterns of PRI0 and sunlit PRI were similar with PRI0 slightly higher than sunlit PRI. In addition, the peaks of PRI0 and sunlit PRI in 2020 were lower than in previous years. The annual mean values of PRI0 and sunlit PRI in 2020 decreased by 27.8% and 29.6%, respectively. ΔPRI tended to be hump-shaped with higher (lower) values in summer (winter) within the year but showed no obvious difference among years.

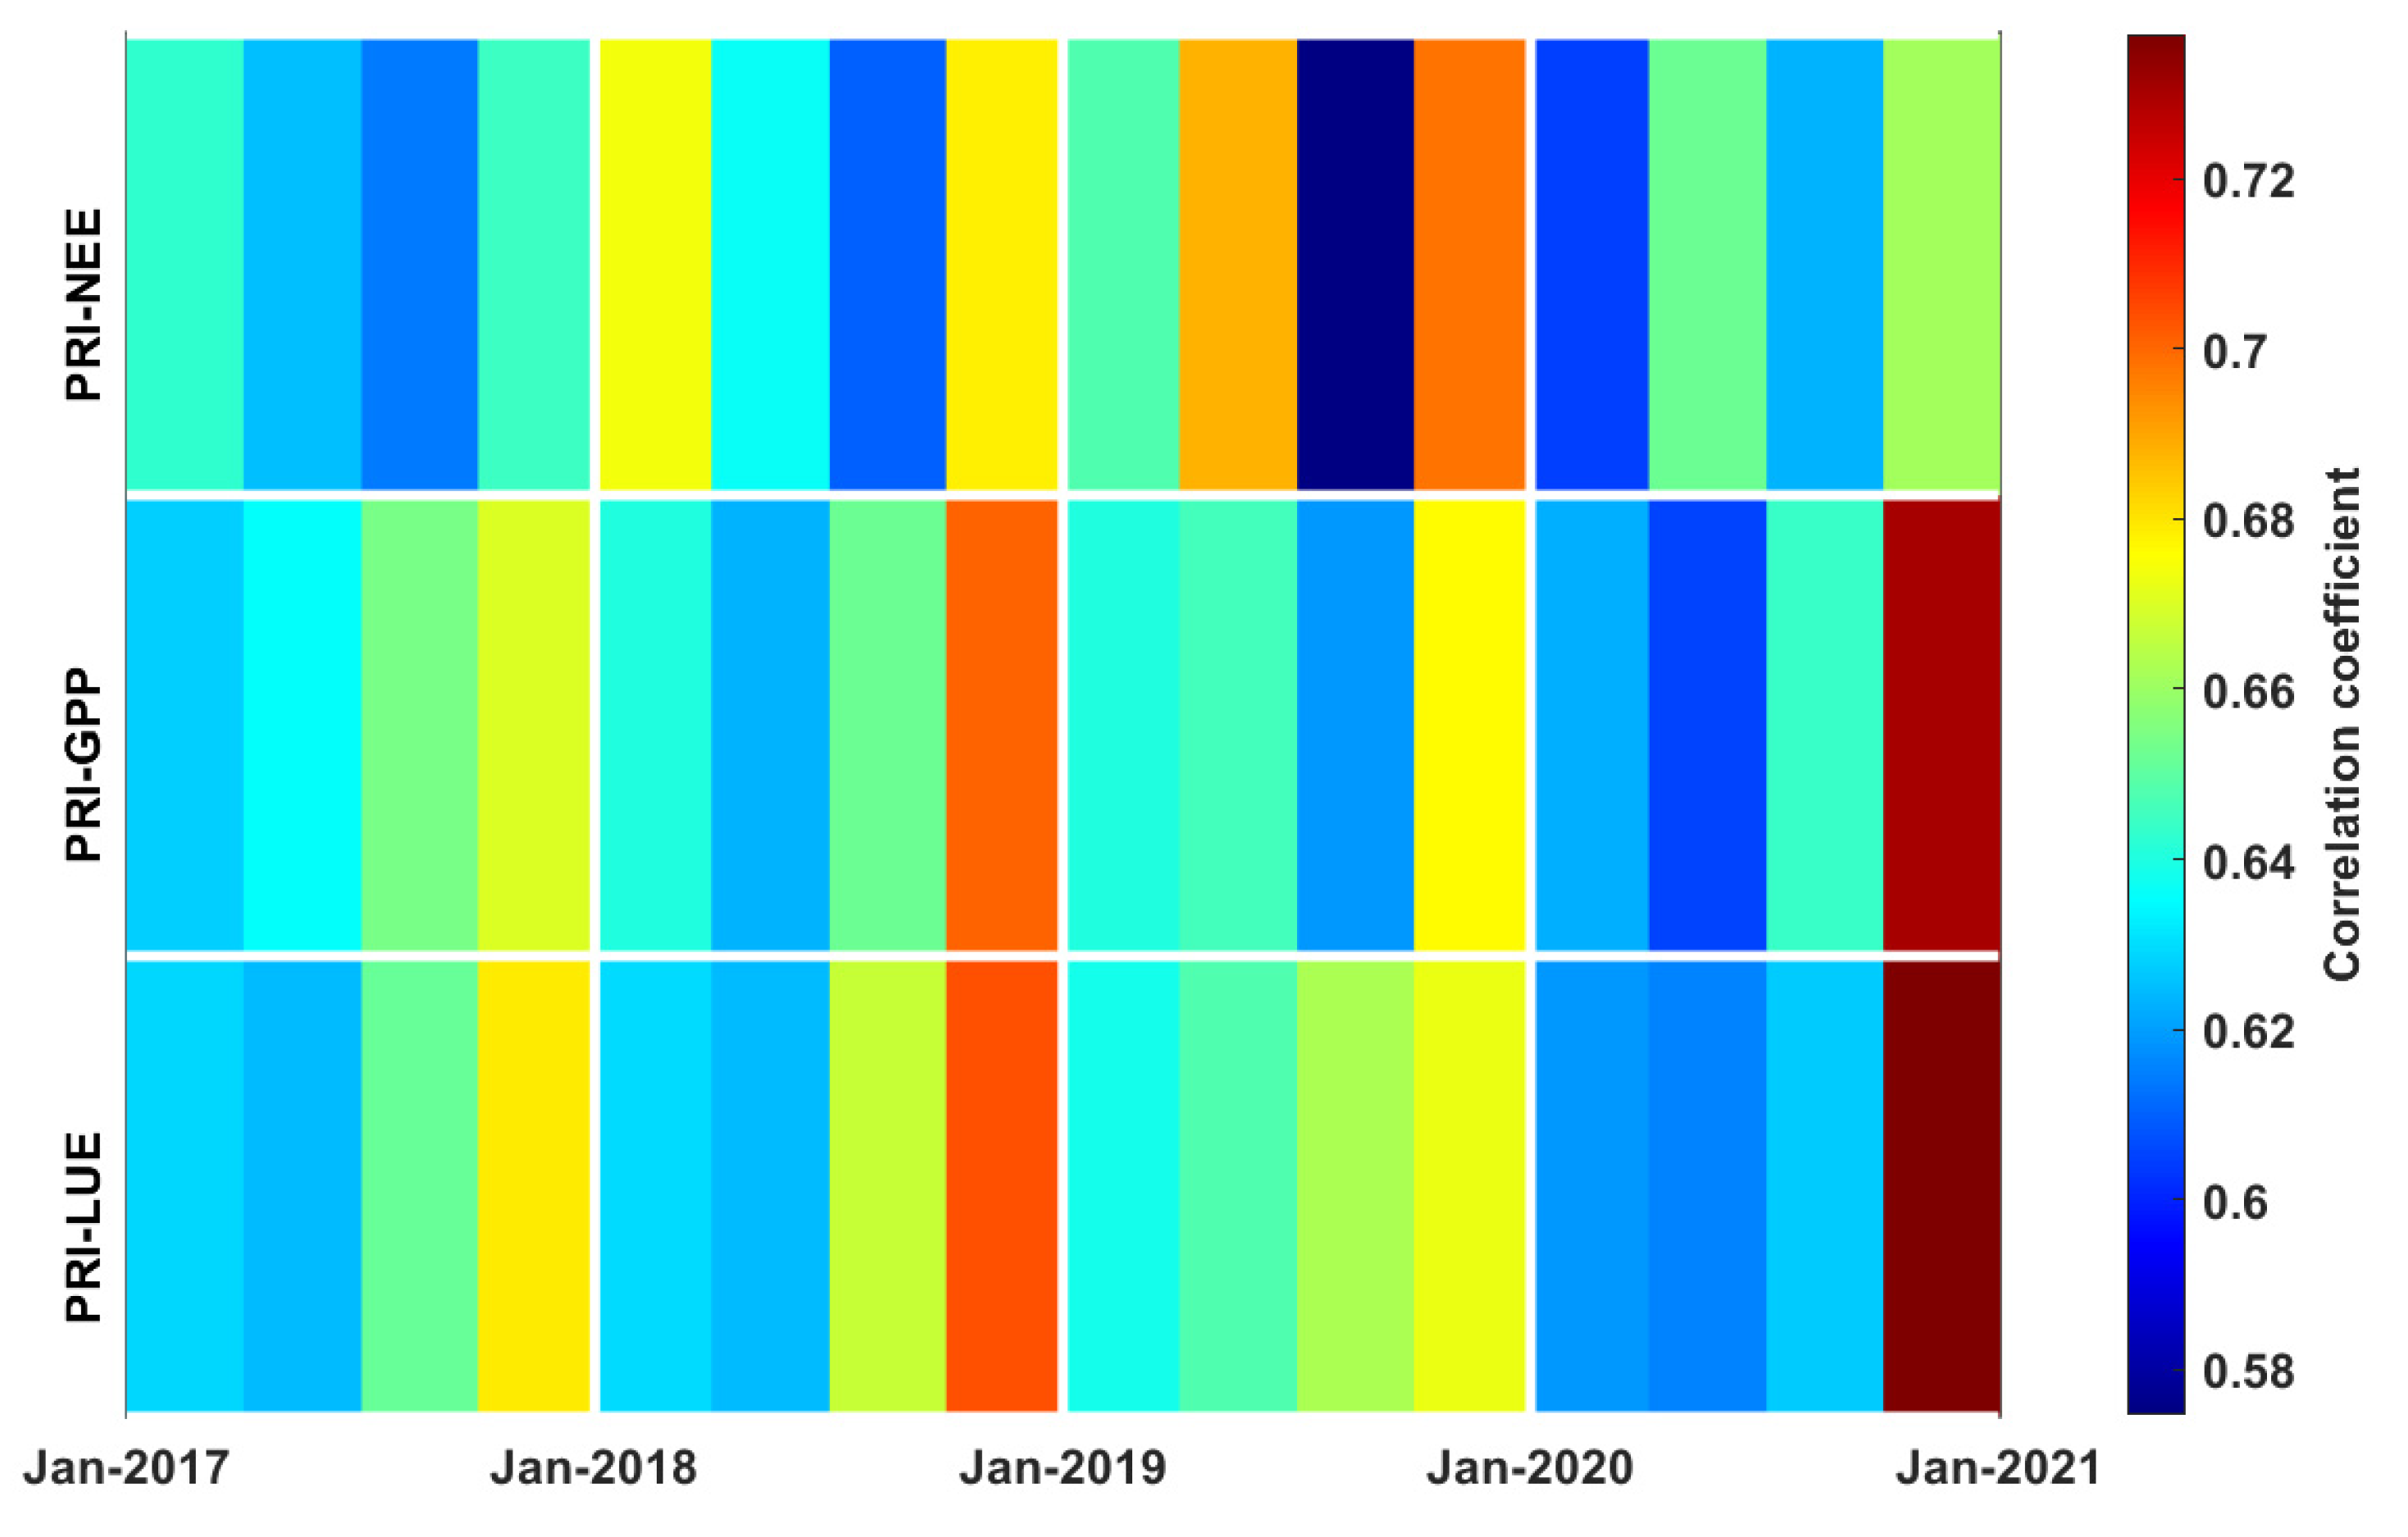
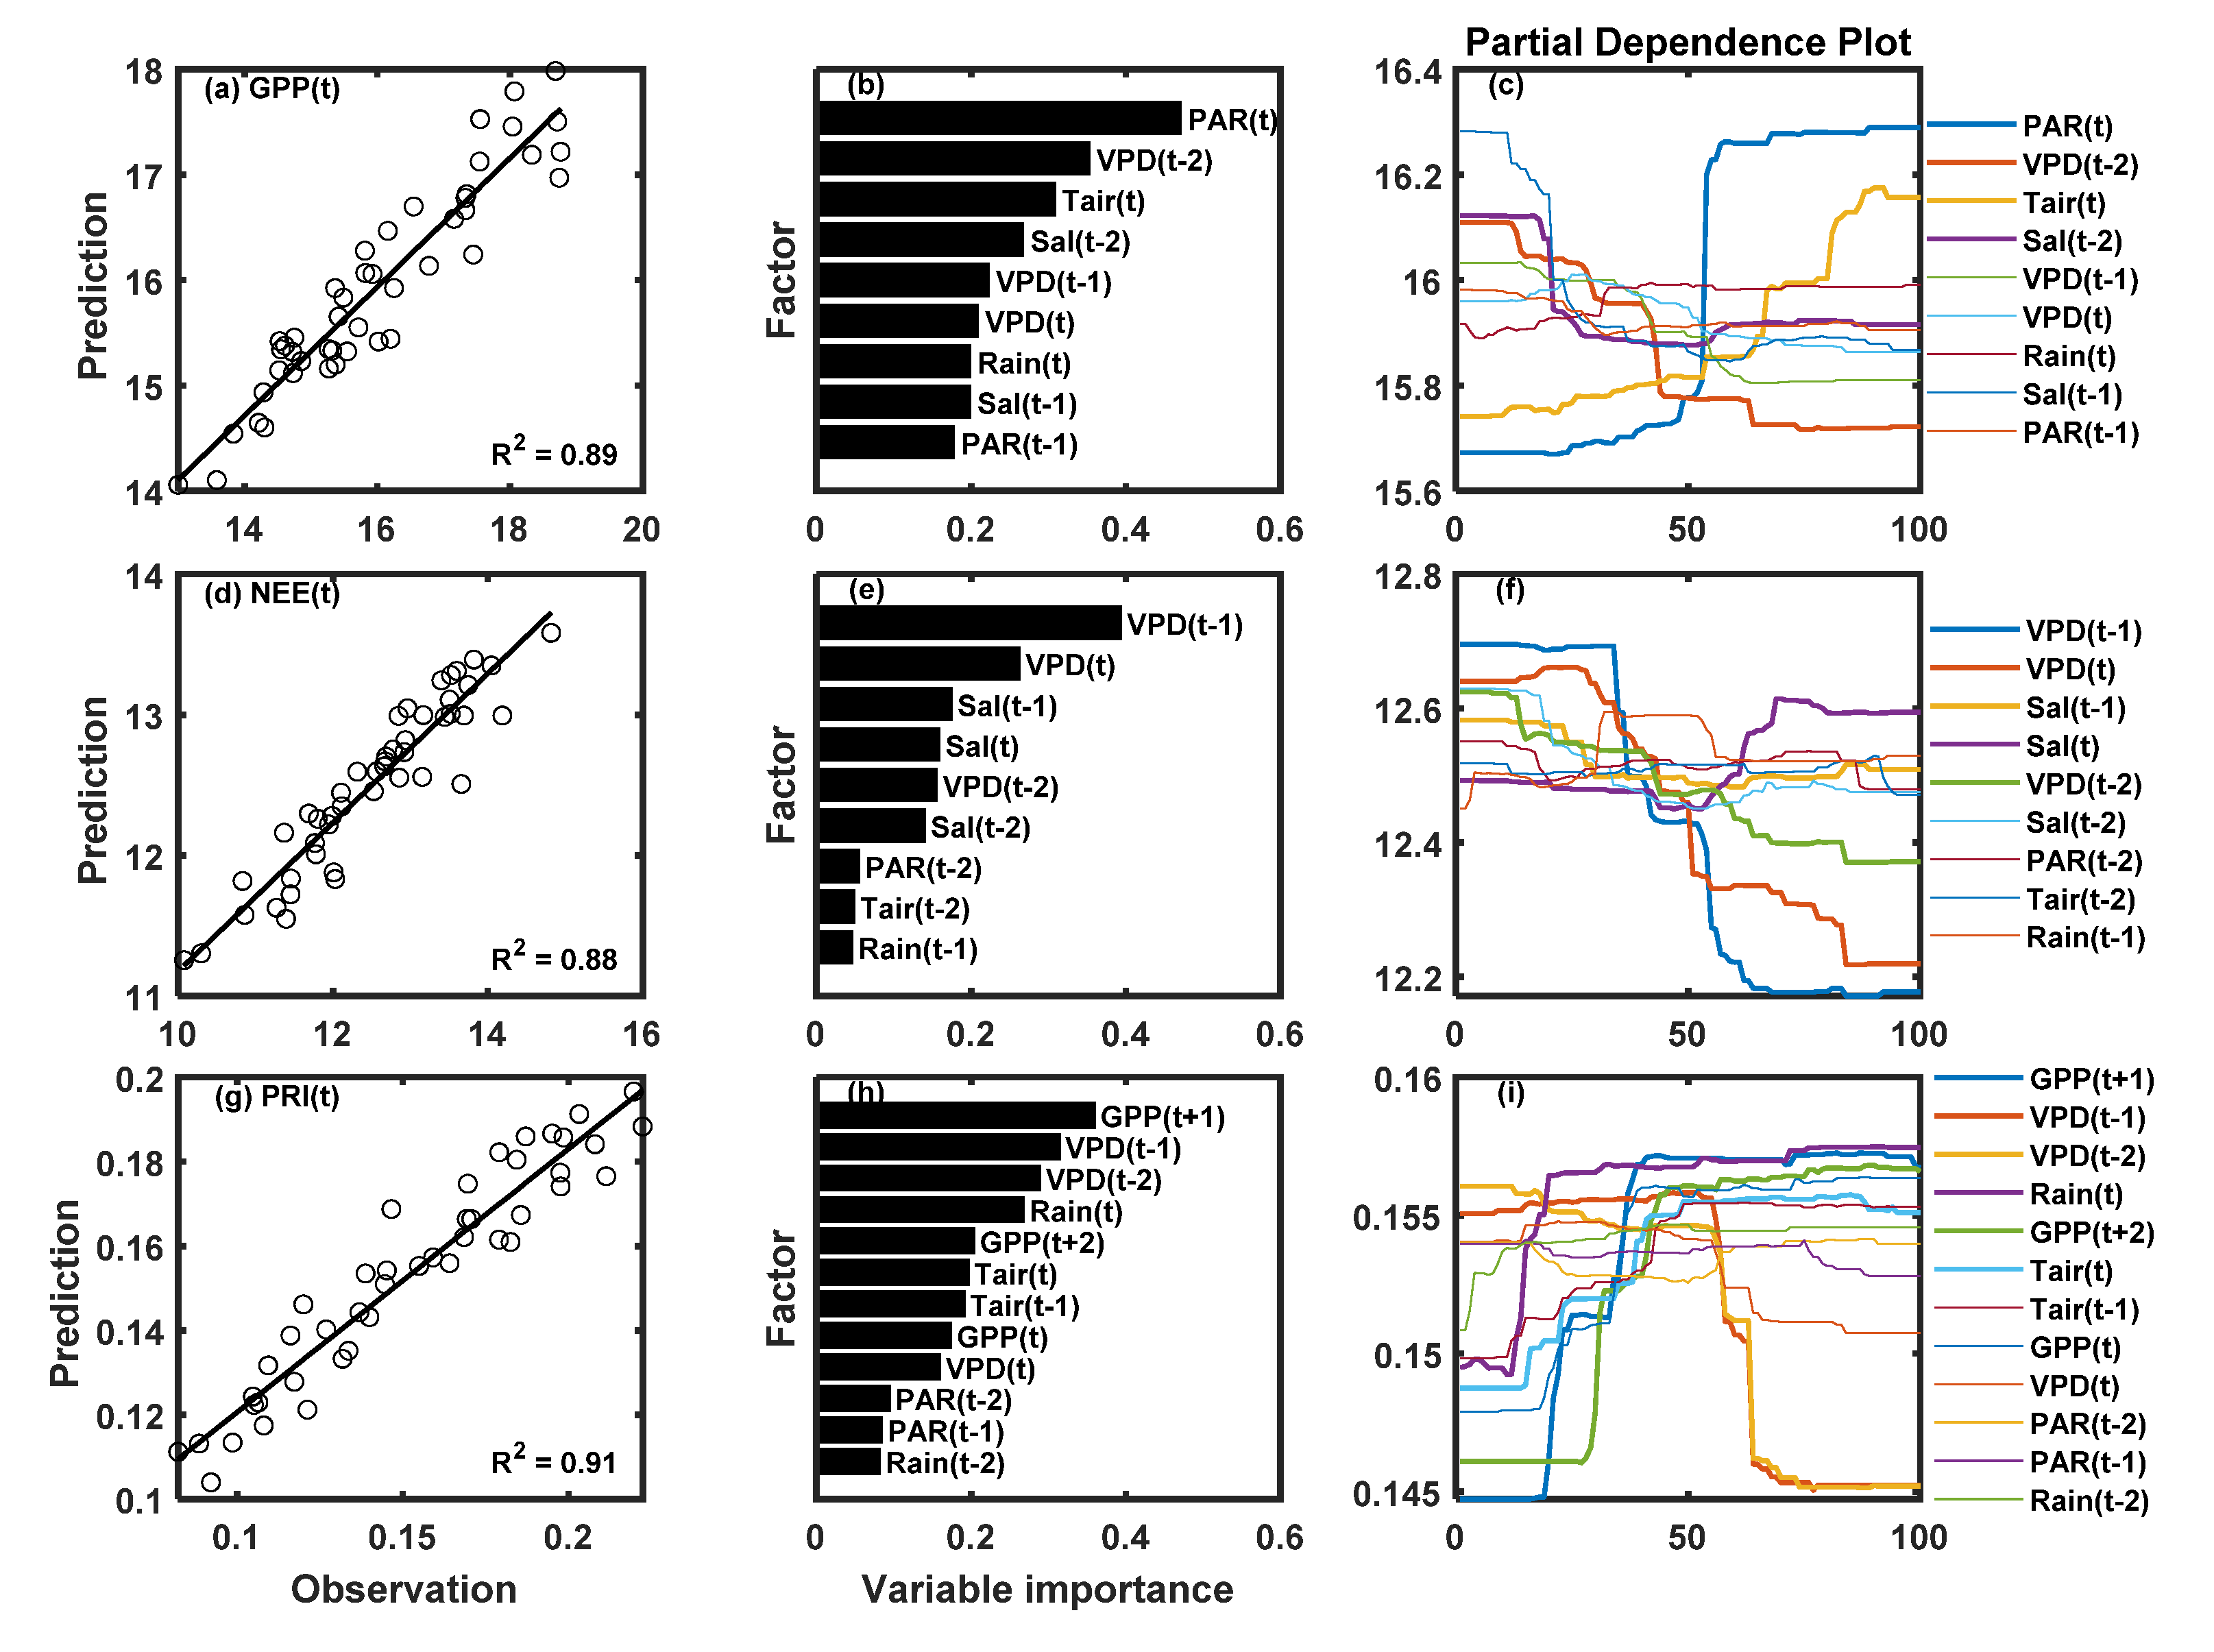
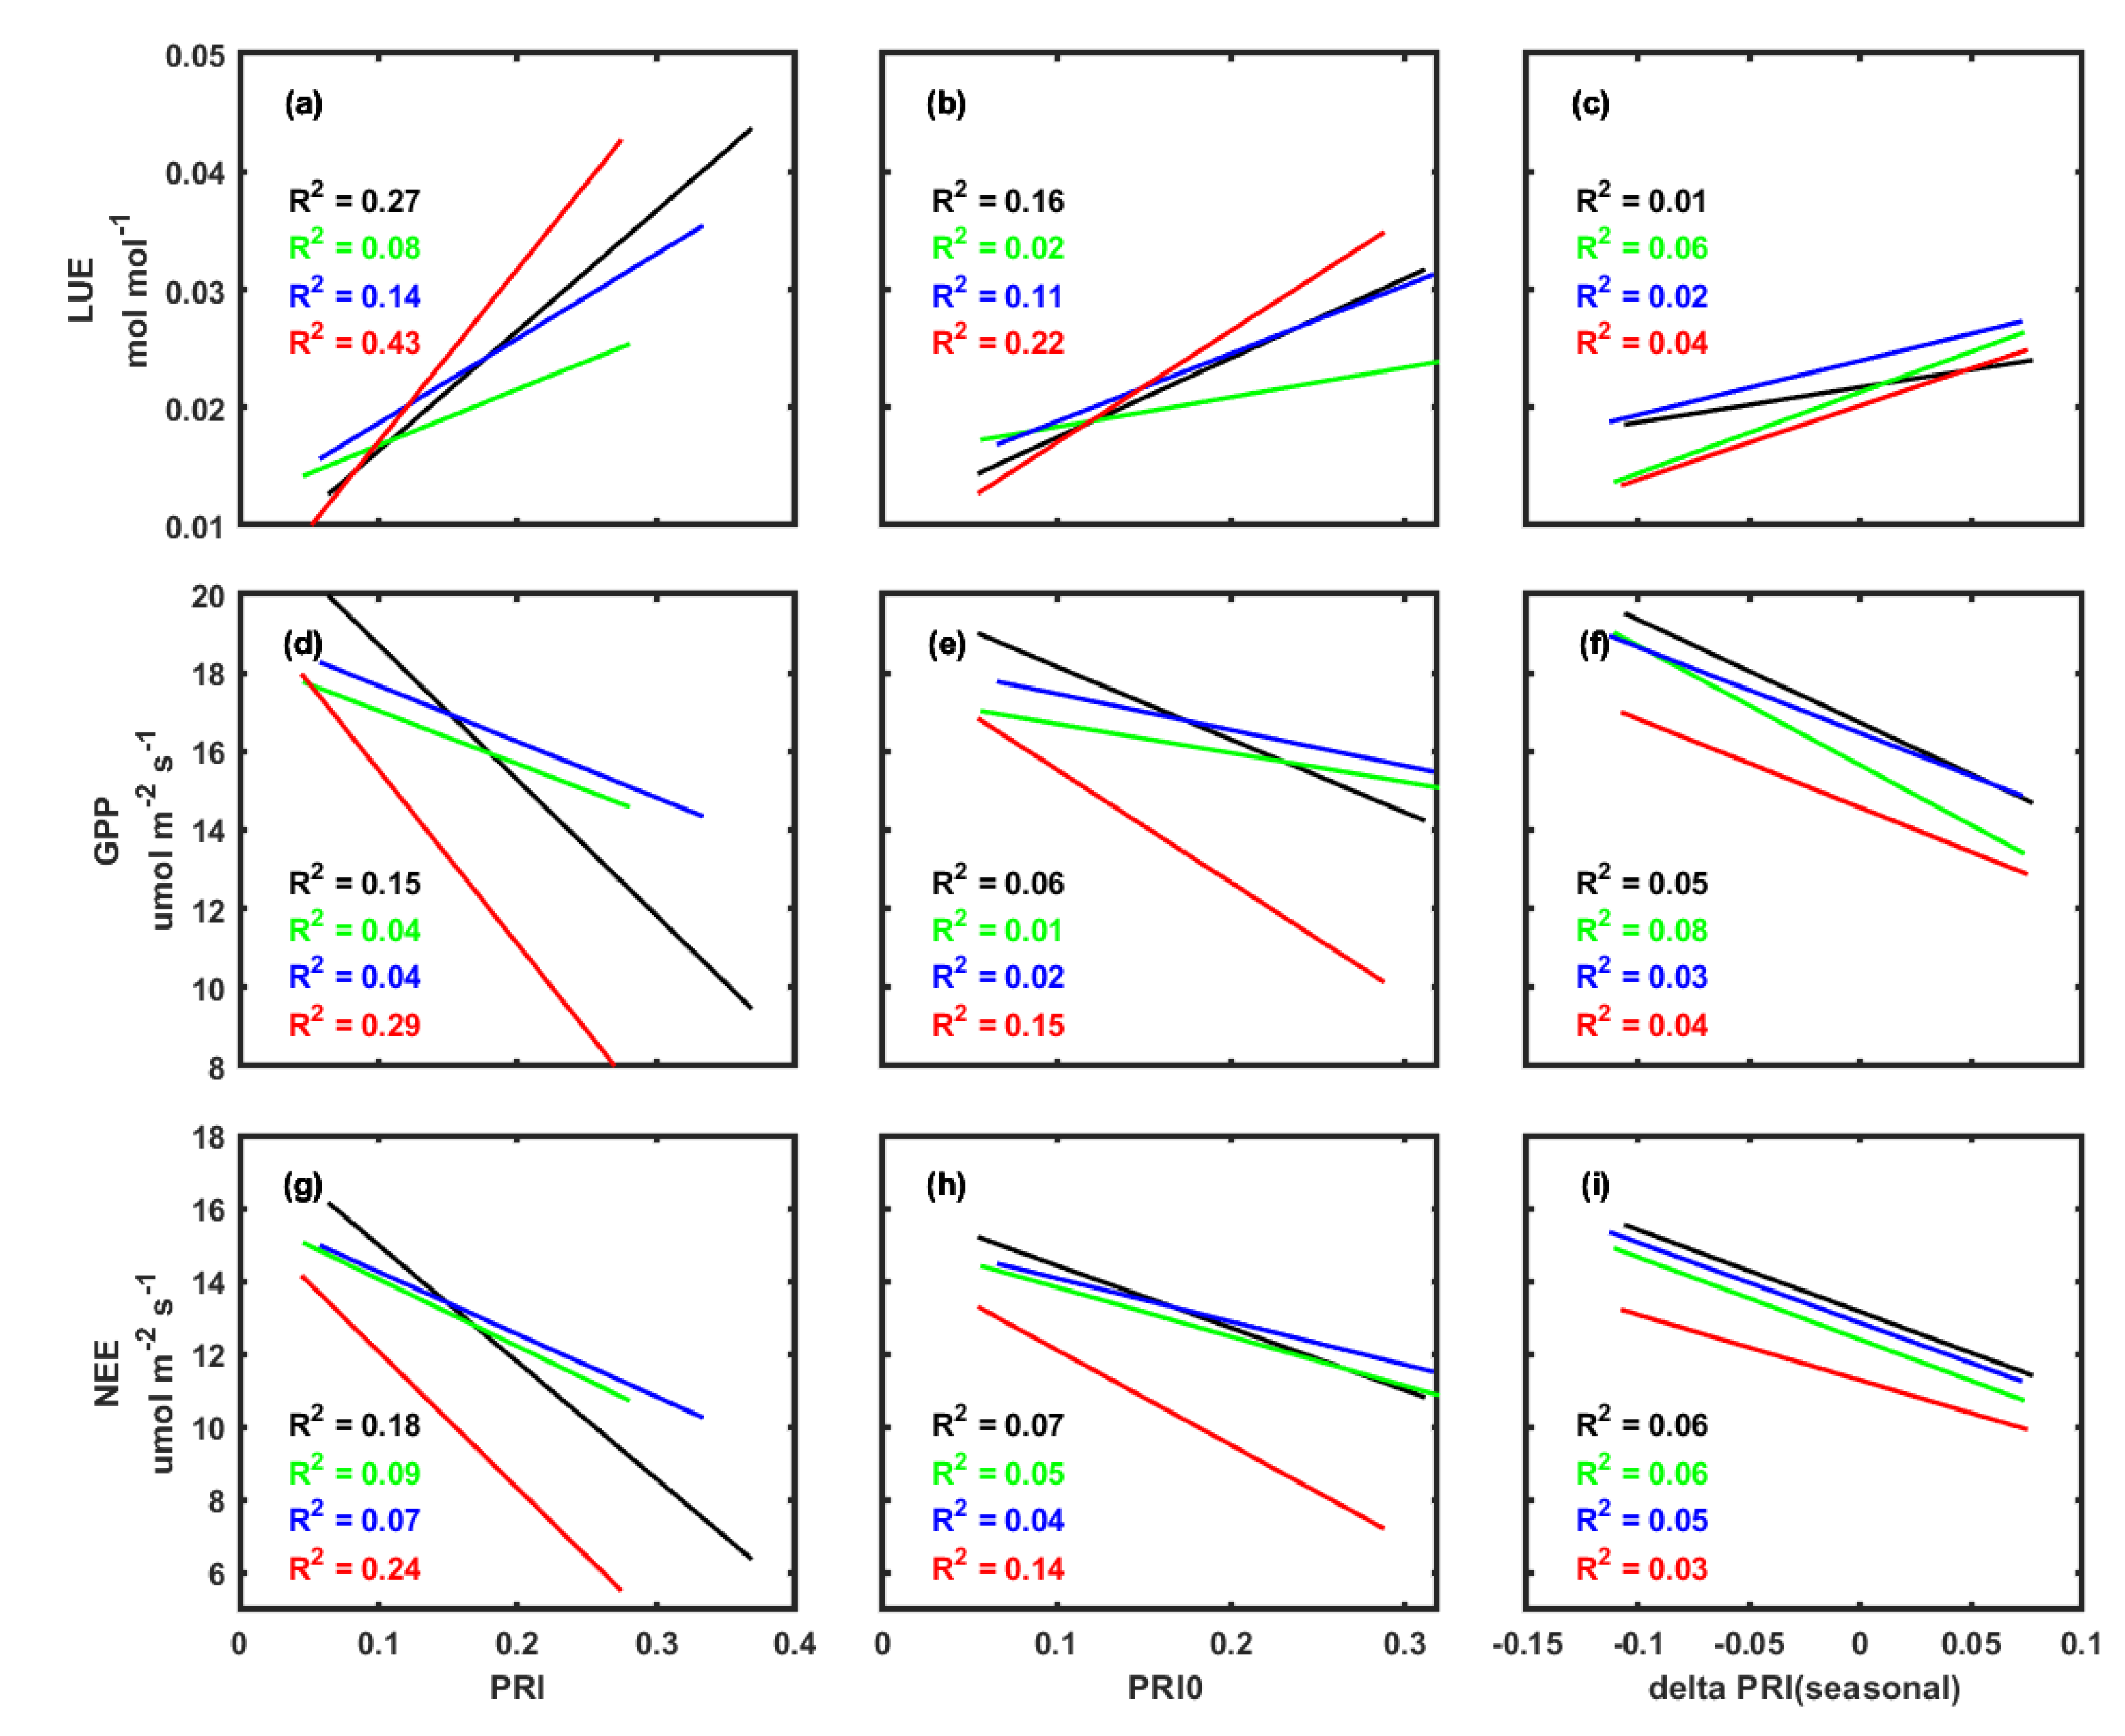
3.3. Correlations between PRI, Environmental Factors, and Carbon Fluxes

Pearson correlation analyses based on half-hour data (Figure 5) showed that PRI had good relationships with carbon dynamics at the diurnal scale over the four years, showing a positive PRI-LUE relationship and negative PRI-GPP and PRI-NEE relationships. The absolute values of seasonal mean correlation coefficients of diurnal PRI-GPP and PRI-NEE relationships were higher than 0.58. The annual mean values of correlation coefficients between PRI and the three carbon-related variables were the highest in 2020, though the differences were not obvious.
Daily mean data were grouped by different years to analyze the correlations at the seasonal scale (Figure 6). Daily mean values generally showed linear relationships between carbon fluxes and PRI (statistically significant at p < 0.05) for each year. At the seasonal scale, LUE (R2 = 0.08~0.43 for the four years) had a positive relationship with PRI while GPP (R2 = 0.04~0.29) and NEE (R2 = 0.07~0.24) had negative relationships with PRI. The slopes of the correlation between daily PRI and carbon fluxes were steeper in 2020 compared to in previous years. Moreover, the fitted relationships in 2020 were the best with obviously higher R2 than other years. In addition to the PRI-carbon relationships, the relationships between two PRI components and carbon fluxes were also analyzed. The PRI0-carbon relationships were similar to the PRI-carbon relationships, while the relationships between seasonal ΔPRI and carbon fluxes were fairly poor.
The roles of environmental factors in driving PRI variations and carbon dynamics were examined using the RF approach based on monthly mean data (Figure 7). The OOB prediction errors of the RF models of GPP, NEE, and PRI, were small (<5%). The RF-based analyses demonstrated that GPP was most correlated with PAR and VPD(t − 2) among all explanatory variables, and the partial dependence plot confirmed that GPP increased with increasing PAR but decreased with increasing VPD. NEE was most correlated with VPD(t − 1) and salinity(t − 1), with NEE decreasing with VPD and salinity. The RF analyses of PRI revealed that dominant explanatory variables included GPP(t + 1), VPD(t − 1), VPD(t − 2) and rainfall, where PRI increased with rainfall but decreased with VPD and GPP.

4. Discussion

The measurements of less rainfall and higher VPD than the multi-year average confirmed that the mangrove wetland experienced drought stress from late 2019 to late 2020 (Figure 2c). Consequently, the deficit of rainfall spanning several seasons during this period lowered the carbon sink and PRI (Figure 3). Although this effect didn’t show as soon as the rainfall decreased, it was likely that the response of mangroves to drought stress was not as rapid as other environmental factors. Moreover, the rainfall of spring and summer in 2020 only summed up to 662.9 mm, which was much less than that of previous years (Table 1). Reduction of rainfall during this period could suppress mangrove carbon uptake since mangrove forests in subtropical monsoon climates often have stronger carbon sequestration capacity in spring [8]. The RF analyses also indicated that rainfall was a main factor driving NEE and PRI variations (Figure 7). Wong and Gamon [52] proved that PRI could serve as an optical indicator of spring photosynthetic activation in evergreen conifers, which experienced a significant temperature increase from winter to summer. However, the seasonal variations of temperature in mangroves are not as significant as those in boreal evergreens. Thus, spring rainfall is more likely to be a limiting factor of carbon sink potential in subtropical mangroves. The sustained deficit of rainfall also resulted in higher VPD (Figure 1b), which further inhibited the growth of the plants [53]. The combined influence of rainfall and VPD accounted for the decline of carbon assimilation. According to the ranking of RF-based variable importance, mangrove carbon fluxes were heavily affected by VPD with obvious one- or two-month lag effects, which was similar to previous studies [20,21,22]. Another important factor affecting mangrove carbon sink is tidal salinity, which has been often reported to cause physiological drought when reaching relatively higher values [41]. The salinity started to increase in late 2019, and the annual average salinity of 2020 was relatively higher (Figure 2c), probably due to the drought stress. Therefore, we concluded that the sustained deficit of rainfall, higher VPD and salinity inhibited the carbon sequestration, consequently leading to a significant decline of mangrove carbon uptake in 2020.
The seasonal patterns of PRI were similar to previous studies showing the highest (lowest) values in summer (winter) [54]. Over the four years, the significant decline of PRI in 2020 (Figure 3) implied that drought stress could affect the canopy pigment composition. The RF analyses also indicated that rainfall and VPD were two major factors in driving PRI variations, where PRI increased with rainfall and decreased with VPD. Sims et al. [55] observed an obvious decline in PRI during the extreme drought with small diurnal change relative to seasonal changes. Magney et al. [37] also found that the PRI signal was more sensitive under water-limited conditions. To further explore the response of pigment composition to drought stress, the seasonal variations of PRI0 and sunlit PRI also provide some indications. Temporal variations of PRI are mainly controlled by two physiological processes, one of which is xanthophyll cycle activity controlling the diurnal changes of PRI, and the other is the pigment pool size dominating the seasonal variations of PRI. PRI0 and sunlit PRI in our results shared quite similar temporal variation patterns across time scales. The seasonal variation patterns of PRI0 and sunlit PRI were consistent across years (Figure 6), which implied that the size of the pigment pool was affected by seasonal variations of environmental factors [38], in particular for PAR. This is consistent with a previous study showing that PRI was radiation-dominated with additional effects from high VPD [42]. The typical seasonal variations of subtropical mangrove forests have higher and lower PAR in summer and winter, respectively [42], leading to similar seasonal variations of two components of PRI. On the annual scale, the PRI0 and sunlit PRI showed a significant decline due to drought stress but seasonal ΔPRI didn’t show any response. The seasonal ΔPRI reflected the daily maximum depression the canopy suffered from, or the maximum of the xanthophyll cycle. In comparison with the facultative component, the response of the constitutive component of PRI was more sensitive to environmental stresses such as drought stress. Therefore, we confirmed that in subtropical mangrove forests, the pigment pool size could be the primary cause of the long-term variations of PRI with additional contribution from the xanthophyll cycle, which agrees with many previous studies [36,54].
The high correlation coefficients between PRI and carbon fluxes at the diurnal scale verified the ability of PRI to track the carbon dynamics at short time scales. The slightly higher correlation coefficient between PRI and carbon fluxes in 2020 further implied that drought stress could also exert an impact on the daily short-term xanthophyll cycle, but the impact was not as significant as the long-term variations of pigment pool size. In addition, it is shown that the temporal variation patterns of PRI and carbon fluxes were very similar at both seasonal and annual time scales (Figure 3). Zhu et al. [42] reported that PRI was a good indicator of photosynthetic capacity at short time scales, showing good correlations between carbon fluxes and PRI. Our results further confirmed that at a longer time scale, PRI was also able to track the response of carbon fluxes to environmental stresses such as drought stress. On the seasonal scale, the relationship between PRI and carbon fluxes was better when mangroves experienced drought stress, which was consistent with previous findings that the PRI-carbon relationship was better under enhanced VPD or water stress [30,37,56]. Therefore, we conclude that the relationship between PRI and carbon fluxes performs better under drought stress in mangrove forests. The RF analyses indicated that PRI was mainly correlated with lagged GPP and advanced VPD. Overall, the decreasing PRI values following higher VPD and reduced rainfall did serve as an early indicator of the declines of carbon uptake. PRI variations were mainly caused by pigment pool size and the response to changing environmental factors were relatively faster than the response of carbon dynamics. The relationship between PRI0 and carbon fluxes almost mimicked the PRI-carbon relationship, indicating that constitutive pigment pool size played an important role in driving the seasonal variations of carbon fluxes, especially under drought stress. The poor relationship between seasonal ΔPRI and carbon fluxes suggested that the seasonal variations of carbon fluxes were barely relevant to the changes of the xanthophyll cycle. This contrast between PRI0 and seasonal ΔPRI indicated that the PRI0 was more representative in tracking the seasonal variations of carbon fluxes.
Our analyses of PRI and mangrove carbon dynamics suffered from several limitations and uncertainties. First, due to the lack of continuous meteorological observations over a decadal time scale, we were not able to explicitly quantify the level of the drought stress investigated in this study. Further studies might be needed to better assess the extent of this drought stress. Second, the difference in the footprint size of spectral and carbon flux measurements might affect the PRI-carbon relationship [42], but we’re not able to explicitly assess this effect with current measurements. Third, our PRI sensors were installed at a fixed position, while PRI signals could be affected by other factors such as sun-target-view geometry [56]. Fourth, there were uncertainties in NEE and GPP, which were estimated from raw EC measurements based on several hypotheses [57]. Fifth, in addition to drought stress, the decline of carbon-related variables in 2020 could also be affected by other environmental stresses [58,59]. Sixth, although the RF approach is presumably less impacted by the overfitting issue and the OOB error estimations confirmed small prediction errors of the RF models, explicit tests of model generalization capacity based on independent datasets should be conducted with more available data in the future. Lastly, although the pigment pool size, indicated by dark-state PRI (PRI0), was attributed the primary driver of seasonal variations of PRI, concurrent measurements of pigment composition along with PRI measurements [37] are highly needed in future research to further confirm the findings.

5. Conclusions

In this study, the responses of PRI and carbon fluxes to climate fluctuations and drought stress were examined in a subtropical mangrove forest with continuous high-frequency time-series measurements from 2017 to 2020. The ability of PRI to track temporal dynamics of mangrove carbon fluxes was confirmed at both short-term (diurnal) and long-term (seasonal and inter-annual) scales. The time series of daily PRI and carbon uptakes both showed decreasing trends when experiencing drought stress. Time series of monthly PRI were most correlated with advanced time series of VPD with one month ahead and lagged time series of GPP with one month later, which confirmed the ability of PRI as an early indicator of drought-induced down-regulation of carbon uptake. Compared to annual mean values in the first three years (13.22, 12.53, and 12.98 μmol m−2 s−1), the annual mean value of NEE decreased by 10.7% in 2020. Correspondingly, the annual mean value of PRI decreased by 29.0% in 2020. PRI and carbon fluxes were significantly correlated at diurnal, seasonal, and annual scales, where the relationship performed better under drought stress. Dark-state PRI, i.e., the constitutive PRI component, showed similar temporal variation as PRI in response to drought stress, while delta PRI, i.e., the facultative PRI component, did not show any response to drought stress. It implied that PRI variations in this subtropical mangrove were mainly caused by the variations in pigment pool size rather than the xanthophyll cycle. This study highlights the potential of PRI to serve as an early and readily detectable indicator to track the response of mangrove carbon cycle to climatic anomalies such as drought stress.

Author Contributions

Conceptualization, X.Z.; methodology, X.Z. and Y.L.; formal analysis, Y.L. and X.Z.; investigation, Y.L. and X.Z.; writing—original draft preparation, Y.L.; writing—review and editing, Y.L. and X.Z.; visualization, Y.L. and X.Z.; supervision, X.Z.; project administration, X.Z.; funding acquisition, X.Z. All authors have read and agreed to the published version of the manuscript.

Funding

This research was funded by the Special Project on National Science and Technology Basic Resources Investigation of China (2021FY100704), the National Natural Science Foundation of China (31600368), the National Key Research and Development Program of China (2017YFC0506102), the Natural Science Foundation of Fujian Province, China (2020J01112079), the Youth Innovation Foundation of Xiamen, China (3502Z20206038), and the Fundamental Research Funds for the Central Universities of China (20720210075).

Data Availability Statement

The data presented in this study are available on request from the corresponding author.

Acknowledgments

We are grateful to members from Coastal Ecology & Remote Sensing lab led by Xudong Zhu at Xiamen University and staff at Zhangjiang Estuary Mangrove National Nature Reserve for their help in the fieldwork.

Conflicts of Interest

The authors declare no conflict of interest. The funders had no role in the design of the study; in the collection, analyses, or interpretation of data; in the writing of the manuscript, or in the decision to publish the results.

References

  1. Alongi, D.M.; Sasekumar, A.; Chong, V.C.; Pfitzner, J.; Trott, L.A.; Tirendi, F.; Dixon, P.; Brunskill, G.J. Sediment accumulation and organic material flux in a managed mangrove ecosystem: Estimates of land–ocean–atmosphere exchange in peninsular Malaysia. Mar. Geol. 2004, 208, 383–402. [Google Scholar] [CrossRef]
  2. Bouillon, S.; Borges, A.V.; Castañeda-Moya, E.; Diele, K.; Dittmar, T.; Duke, N.C.; Kristensen, E.; Lee, S.Y.; Marchand, C.; Middelburg, J.J.; et al. Mangrove production and carbon sinks: A revision of global budget estimates. Glob. Biogeochem. Cycles 2008, 22, 22. [Google Scholar] [CrossRef] [Green Version]
  3. Chmura, G.L.; Anisfeld, S.C.; Cahoon, D.R.; Lynch, J.C. Global carbon sequestration in tidal, saline wetland soils. Glob. Biogeochem. Cycles 2003, 17. [Google Scholar] [CrossRef]
  4. Crase, B.; Liedloff, A.; Vesk, P.A.; Burgman, M.A.; Wintle, B.A. Hydroperiod is the main driver of the spatial pattern of dominance in mangrove communities. Glob. Ecol. Biogeogr. 2013, 22, 806–817. [Google Scholar] [CrossRef]
  5. Cui, X.; Liang, J.; Lu, W.; Chen, H.; Liu, F.; Lin, G.; Xu, F.; Luo, Y.; Lin, G. Stronger ecosystem carbon sequestration potential of mangrove wetlands with respect to terrestrial forests in subtropical China. Agric. For. Meteorol. 2018, 249, 71–80. [Google Scholar] [CrossRef]
  6. Leopold, A.; Marchand, C.; Renchon, A.; Deborde, J.; Quiniou, T.; Allenbach, M. Net ecosystem CO2 exchange in the “Coeur de Voh” mangrove, New Caledonia: Effects of water stress on mangrove productivity in a semi-arid climate. Agric. For. Meteorol. 2016, 223, 217–232. [Google Scholar] [CrossRef]
  7. Duke, N.C.; Meynecke, J.-O.; Dittmann, S.; Ellison, A.M.; Anger, K.; Berger, U.; Cannicci, S.; Diele, K.; Ewel, K.C.; Field, C.D.; et al. A World Without Mangroves? Science 2007, 317, 41–42. [Google Scholar] [CrossRef] [PubMed] [Green Version]
  8. Liu, J.; Lai, D.Y.F. Subtropical mangrove wetland is a stronger carbon dioxide sink in the dry than wet seasons. Agric. For. Meteorol. 2019, 278, 278. [Google Scholar] [CrossRef]
  9. Lovelock, C.E.; Krauss, K.W.; Osland, M.J.; Reef, R.; Ball, M.C. The Physiology of Mangrove Trees with Changing Climate. Tree Physiol. 2016, 149–179. [Google Scholar] [CrossRef]
  10. Mafi-Gholami, D.; Zenner, E.K.; Jaafari, A. Mangrove regional feedback to sea level rise and drought intensity at the end of the 21st century. Ecol. Indic. 2020, 110, 105972. [Google Scholar] [CrossRef]
  11. Guan, G.-F.; Wang, Y.-S.; Cheng, H.; Jiang, Z.-Y.; Fei, J. Physiological and biochemical response to drought stress in the leaves of Aegiceras corniculatum and Kandelia obovata. Ecotoxicology 2015, 24, 1668–1676. [Google Scholar] [CrossRef]
  12. Mafi-Gholami, D.; Mahmoudi, B.; Zenner, E.K. An analysis of the relationship between drought events and mangrove changes along the northern coasts of the Pe rsian Gulf and Oman Sea. Estuar. Coast. Shelf Sci. 2017, 199, 141–151. [Google Scholar] [CrossRef]
  13. Osland, M.J.; Feher, L.C.; Griffith, K.T.; Cavanaugh, K.C.; Enwright, N.M.; Day, R.H.; Stagg, C.L.; Krauss, K.W.; Howard, R.J.; Grace, J.B.; et al. Climatic controls on the global distribution, abundance, and species richness of mangrove forests. Ecol. Monogr. 2017, 87, 341–359. [Google Scholar] [CrossRef] [Green Version]
  14. Sakho, I.; Mesnage, V.; Deloffre, J.; Lafite, R.; Niang, I.; Faye, G. The influence of natural and anthropogenic factors on mangrove dynamics over 60 years: The Somone Estuary, Senegal. Estuar. Coast. Shelf Sci. 2011, 94, 93–101. [Google Scholar] [CrossRef]
  15. Dai, A. Increasing drought under global warming in observations and models. Nat. Clim. Chang. 2012, 3, 52–58. [Google Scholar] [CrossRef]
  16. MacKay, F.; Cyrus, D.; Russell, K.-L. Macrobenthic invertebrate responses to prolonged drought in South Africa’s largest estuarine lake complex. Estuar. Coast. Shelf Sci. 2010, 86, 553–567. [Google Scholar] [CrossRef]
  17. Sobrado, M.A. Drought effects on photosynthesis of the mangrove, Avicennia germinans, under contrasting salinities. Trees 1999, 13, 125–130. [Google Scholar] [CrossRef]
  18. Duke, N.C.; Ball, M.C.; Ellison, J.C. Factors Influencing Biodiversity and Distributional Gradients in Mangroves. Glob. Ecol. Biogeogr. Lett. 1998, 7, 27. [Google Scholar] [CrossRef] [Green Version]
  19. Sanders, C.J.; Maher, D.T.; Tait, D.R.; Williams, D.; Holloway, C.; Sippo, J.Z.; Santos, I.R. Are global mangrove carbon stocks driven by rainfall? J. Geophys. Res. Biogeosci. 2016, 121, 2600–2609. [Google Scholar] [CrossRef]
  20. Zhang, T.; Xu, M.; Xi, Y.; Zhu, J.; Tian, L.; Zhang, X.; Wang, Y.; Li, Y.; Shi, P.; Yu, G.; et al. Lagged climatic effects on carbon fluxes over three grassland ecosystems in China. J. Plant Ecol. 2015, 8, 291–302. [Google Scholar] [CrossRef] [Green Version]
  21. Flanagan, L.B.; Wever, L.A.; Carlson, P.J. Seasonal and interannual variation in carbon dioxide exchange and carbon balance in a northern temperate grassland. Glob. Chang. Biol. 2002, 8, 599–615. [Google Scholar] [CrossRef]
  22. Barford, C.C.; Wofsy, S.C.; Goulden, M.L.; Munger, J.W.; Pyle, E.H.; Urbanski, S.P.; Hutyra, L.; Saleska, S.R.; Fitzjarrald, D.; Moore, K. Factors Controlling Long- and Short-Term Sequestration of Atmospheric CO2 in a Mid-latitude Forest. Science 2001, 294, 1688–1691. [Google Scholar] [CrossRef] [Green Version]
  23. Alongi, D.M. Carbon sequestration in mangrove forests. Carbon Manag. 2012, 3, 313–322. [Google Scholar] [CrossRef]
  24. Alongi, D.M. Carbon Cycling and Storage in Mangrove Forests. Annu. Rev. Mar. Sci. 2014, 6, 195–219. [Google Scholar] [CrossRef]
  25. Baldocchi, D.; Falge, E.; Gu, L.; Olson, R.; Hollinger, D.; Running, S.; Anthoni, P.; Bernhofer, C.; Davis, K.; Evans, R.; et al. FLUXNET: A new tool to study the temporal and spatial variability of ecosystem-scale carbon dioxide, water vapor, and energy flux densities. Bull. Am. Meteorol. Soc. 2001, 82, 2415–2434. [Google Scholar] [CrossRef]
  26. Gamon, J.A.; Peñuelas, J.; Field, C.B. A narrow-waveband spectral index that tracks diurnal changes in photosynthetic efficiency. Remote Sens. Environ. 1992, 41, 35–44. [Google Scholar] [CrossRef]
  27. Penuelas, J.; Filella, I.; Gamon, J.A. Assessment of photosynthetic radiation-use efficiency with spectral reflectance. New Phytol. 1995, 131, 291–296. [Google Scholar] [CrossRef]
  28. Garbulsky, M.F.; Penuelas, J.; Papale, D.; Filella, I. Remote estimation of carbon dioxide uptake by a Mediterranean forest. Glob. Chang. Biol. 2008, 14, 2860–2867. [Google Scholar] [CrossRef]
  29. Hall, F.G.; Hilker, T.; Coops, N.C. PHOTOSYNSAT, photosynthesis from space: Theoretical foundations of a satellite concept and validation from tower and spaceborne data. Remote. Sens. Environ. 2011, 115, 1918–1925. [Google Scholar] [CrossRef]
  30. Soudani, K.; Hmimina, G.; Dufrêne, E.; Berveiller, D.; Delpierre, N.; Ourcival, J.-M.; Rambal, S.; Joffre, R. Relationships between photochemical reflectance index and light-use efficiency in deciduous and evergreen broadleaf forests. Remote. Sens. Environ. 2014, 144, 73–84. [Google Scholar] [CrossRef]
  31. Zhang, M.; Yu, G.-R.; Zhuang, J.; Gentry, R.; Fu, Y.-L.; Sun, X.-M.; Zhang, L.-M.; Wen, X.-F.; Wang, Q.-F.; Han, S.-J.; et al. Effects of cloudiness change on net ecosystem exchange, light use efficiency, and water use efficiency in typical ecosystems of China. Agric. For. Meteorol. 2011, 151, 803–816. [Google Scholar] [CrossRef]
  32. Peñuelas, J.; Garbulsky, M.F.; Filella, I. Photochemical reflectance index (PRI) and remote sensing of plant CO2 uptake. New Phytol. 2011, 191, 596–599. [Google Scholar] [CrossRef] [PubMed]
  33. Suarez, L.; Zarco-Tejada, P.J.; Gonzalez-Dugo, V.; Berni, J.A.J.; Fereres, E. The Photochemical Reflectance Index (PRI) as a Water Stress Indicator in Peach Orchards from Remote Sensing Imagery. Acta Hortic. 2012, 962, 363–369. [Google Scholar] [CrossRef] [Green Version]
  34. Zinnert, J.C.; Nelson, J.D.; Hoffman, A.M. Effects of salinity on physiological responses and the photochemical reflectance index in two co-occurring coastal shrubs. Plant Soil 2012, 354, 45–55. [Google Scholar] [CrossRef]
  35. Garrity, S.R.; Eitel, J.U.H.; Vierling, L.A. Disentangling the relationships between plant pigments and the photochemical reflectance index reveals a new approach for remote estimation of carotenoid content. Remote. Sens. Environ. 2011, 115, 628–635. [Google Scholar] [CrossRef]
  36. Gamon, J.A.; Berry, J.A. Facultative and constitutive pigment effects on the Photochemical Reflectance Index (PRI) in sun and shade conifer needles. Isr. J. Plant Sci. 2012, 60, 85–95. [Google Scholar] [CrossRef]
  37. Magney, T.S.; Vierling, L.A.; Eitel, J.U.H.; Huggins, D.R.; Garrity, S.R. Response of high frequency Photochemical Reflectance Index (PRI) measurements to environmental conditions in wheat. Remote. Sens. Environ. 2016, 173, 84–97. [Google Scholar] [CrossRef]
  38. Gamon, J.A. Reviews and Syntheses: Optical sampling of the flux tower footprint. Biogeosciences 2015, 12, 4509–4523. [Google Scholar] [CrossRef] [Green Version]
  39. Garbulsky, M.F.; Peñuelas, J.; Gamon, J.; Inoue, Y.; Filella, I. The photochemical reflectance index (PRI) and the remote sensing of leaf, canopy and ecosystem radiation use efficienciesA review and meta-analysis. Remote Sens. Environ. 2011, 115, 281–297. [Google Scholar] [CrossRef]
  40. Nichol, C.J.; Rascher, U.; Matsubara, S.; Osmond, B. Assessing photosynthetic efficiency in an experimental mangrove canopy using remote sensing and chlorophyll fluorescence. Trees 2005, 20, 9–15. [Google Scholar] [CrossRef]
  41. Song, C.; White, B.L.; Heumann, B.W. Hyperspectral remote sensing of salinity stress on red (Rhizophora mangle) and white (Laguncularia racemosa) mangroves on Galapagos Islands. Remote. Sens. Lett. 2011, 2, 221–230. [Google Scholar] [CrossRef]
  42. Zhu, X.; Song, L.; Weng, Q.; Huang, G. Linking In Situ Photochemical Reflectance Index Measurements With Mangrove Carbon Dynamics in a Subtropical Coastal Wetland. J. Geophys. Res. Biogeosci. 2019, 124, 1714–1730. [Google Scholar] [CrossRef]
  43. Zhu, X.; Hou, Y.; Weng, Q.; Chen, L. Integrating UAV optical imagery and LiDAR data for assessing the spatial relationship between mangrove and inundation across a subtropical estuarine wetland. ISPRS J. Photogramm. Remote. Sens. 2019, 149, 146–156. [Google Scholar] [CrossRef]
  44. Zhu, X.; Hou, Y.; Zhang, Y.; Lu, X.; Liu, Z.; Weng, Q. Potential of Sun-Induced Chlorophyll Fluorescence for Indicating Mangrove Canopy Photosynthesis. J. Geophys. Res. Biogeosci. 2021, 126. [Google Scholar] [CrossRef]
  45. Zhu, X.; Qin, Z.; Song, L. How Land-Sea Interaction of Tidal and Sea Breeze Activity Affect Mangrove Net Ecosystem Exchange? J. Geophys. Res. Atmos. 2021, 126. [Google Scholar] [CrossRef]
  46. Murray, F.W. On the Computation of Saturation Vapor Pressure.pdf. J. Appl. Meteorol. 1966, 6, 203–204. [Google Scholar] [CrossRef]
  47. Breiman, L. Random Forests. Mach. Learn. 2001, 45, 5–32. [Google Scholar] [CrossRef] [Green Version]
  48. Liu, J.; Zhou, Y.; Valach, A.; Shortt, R.; Kasak, K.; Rey-Sanchez, C.; Hemes, K.S.; Baldocchi, D.; Lai, D.Y.F. Methane emissions reduce the radiative cooling effect of a subtropical estuarine mangrove wetland by half. Glob. Chang. Biol. 2020, 26, 4998–5016. [Google Scholar] [CrossRef]
  49. Breiman, L. Bagging Predictors. Mach. Learn. 1996, 24, 123–140. [Google Scholar] [CrossRef] [Green Version]
  50. Wolpert, D.H.; Macready, W.G. An Efficient Method To Estimate Bagging’s Generalization Error. Mach. Learn. 1999, 35, 41–55. [Google Scholar] [CrossRef] [Green Version]
  51. Mitchell, M.W. Bias of the Random Forest Out-of-Bag (OOB) Error for Certain Input Parameters. Open J. Stat. 2011, 01, 205–211. [Google Scholar] [CrossRef] [Green Version]
  52. Wong, C.Y.S.; Gamon, J.A. The photochemical reflectance index provides an optical indicator of spring photosynthetic activation in evergreen conifers. New Phytol. 2015, 206, 196–208. [Google Scholar] [CrossRef]
  53. Novick, K.A.; Ficklin, D.L.; Stoy, P.C.; Williams, C.A.; Bohrer, G.; Oishi, A.C.; Papuga, S.A.; Blanken, P.D.; Noormets, A.; Sulman, B.N.; et al. The increasing importance of atmospheric demand for ecosystem water and carbon fluxes. Nat. Clim. Chang. 2016, 6, 1023–1027. [Google Scholar] [CrossRef] [Green Version]
  54. Wong, C.Y.S.; Gamon, J.A. Three causes of variation in the photochemical reflectance index (PRI) in evergreen conifers. New Phytol. 2015, 206, 187–195. [Google Scholar] [CrossRef]
  55. Sims, D.A.; Luo, H.; Hastings, S.J.; Oechel, W.; Rahman, A.F.; Gamon, J. Parallel adjustments in vegetation greenness and ecosystem CO2 exchange in response to drought in a Southern California chaparral ecosystem. Remote. Sens. Environ. 2006, 103, 289–303. [Google Scholar] [CrossRef]
  56. Zhang, Q.; Chen, J.M.; Ju, W.; Wang, H.; Qiu, F.; Yang, F.; Fan, W.; Huang, Q.; Wang, Y.; Feng, Y.; et al. Improving the ability of the photochemical reflectance index to track canopy light use efficiency through differentiating sunlit and shaded leaves. Remote. Sens. Environ. 2017, 194, 1–15. [Google Scholar] [CrossRef]
  57. Reichstein, M.; Falge, E.; Baldocchi, D.; Papale, D.; Aubinet, M.; Berbigier, P.; Bernhofer, C.; Buchmann, N.; Gilmanov, T.; Granier, A.; et al. On the separation of net ecosystem exchange into assimilation and ecosystem respiration: Review and improved algorithm. Glob. Chang. Biol. 2005, 11, 1424–1439. [Google Scholar] [CrossRef]
  58. Barr, J.G.; Engel, V.; Fuentes, J.D.; Zieman, J.C.; O’Halloran, T.L.; Smith, T.J., III; Anderson, G.H. Controls on mangrove forest-atmosphere carbon dioxide exchanges in western Everglades National Park. J. Geophys. Res. Space Phys. 2010, 115, 115. [Google Scholar] [CrossRef] [Green Version]
  59. Li, Q.; Lu, W.; Chen, H.; Luo, Y.; Lin, G. Differential Responses of Net Ecosystem Exchange of Carbon Dioxide to Light and Temperature between Spring and Neap Tides in Subtropical Mangrove Forests. Sci. World J. 2014, 2014, 1–11. [Google Scholar] [CrossRef] [Green Version]
Figure 1. The landscape around the mangrove flux tower (a) with spectral (b) and eddy covariance systems (c) deployed on the tower.
Remotesensing 13 04053 g001
Figure 2. Seasonal and annual variations in daytime mean values of environmental variables ((a): photosynthetically active radiation and air temperature, (b): vapor pressure deficit and maximum surface water level, (c): rainfall and surface water salinity) from January 2017 to December 2020. Lines and bars indicate monthly mean values. PAR = photosynthetically active radiation; Tair = air temperature; VPD = vapor pressure deficit.
Remotesensing 13 04053 g002
Figure 3. Seasonal and annual variations in daytime mean values of spectral and carbon-related variables from January 2017 to December 2020. Dots indicate daily values and lines indicate corresponding monthly mean values. PRI = photochemical reflectance index; LUE = light use efficiency; GPP = gross primary production; NEE = net ecosystem exchange.
Remotesensing 13 04053 g003
Figure 4. Seasonal and inter-annual variations in monthly (dotted) PRI0, sunlit PRI, and seasonal ΔPRI from January 2017 to December 2020. Lines indicate the 3-month moving average of monthly values. PRI = photochemical reflectance index.
Remotesensing 13 04053 g004
Figure 5. Seasonal mean values of daily Person correlation coefficients between half-hourly PRI and carbon-related variables from January 2017 to December 2020. For better comparison, absolute values of correlation coefficients were shown in the figure. PRI = photochemical reflectance index; LUE = light use efficiency; GPP = gross primary production; NEE = net ecosystem exchange.
Remotesensing 13 04053 g005
Figure 6. The relationships between daily carbon-related and PRI-related variables: (ac) LUE vs. PRI, PRI0, and ΔPRI; (df) GPP vs. PRI, PRI0, and ΔPRI; (gi) NEE vs. PRI, PRI0, and ΔPRI. Lines in black, green, blue, and red represent values in 2017, 2018, 2019, and 2020, respectively. All the fitting curves were statistically significant (p < 0.05). PRI = photochemical reflectance index; LUE = light use efficiency; GPP = gross primary production; NEE = net ecosystem exchange.
Remotesensing 13 04053 g006
Figure 7. The regression performance (a,d,g) of three sets of random forest (RF) analyses and their quantification of relative importance (b,e,h) and affecting direction (c,f,i) for explanatory variables in driving the variations of monthly GPP (μmol m−2 s−1), NEE (μmol m−2 s−1), and PRI. The RF-based variable importance and partial dependence plot are shown for each explanatory variable with its importance ranking top 50% for each set of RF analyses. The symbols of (t), (t − n), and (t + n) after explanatory variables denote time series themselves, advanced time series, and lagged time series, respectively (n = 1 or 2). GPP = gross primary production; NEE = net ecosystem exchange; PRI = photochemical reflectance index; PAR = photosynthetically active radiation; VPD = vapor pressure deficit; Tair = air temperature; Sal = surface water salinity.
Remotesensing 13 04053 g007
Table 1. Seasonal mean values of environmental, spectral, and carbon-related variables from January 2017 to December 2020, with higher VPD and lower rainfall values indicating the 2019–2020 drought stress highlighted in bold.
VariablesPAR (mmol m−2 s−1)Tair
(°C)
VPD (kPa)Surface Water Level (m)Rainfall (mm)Salinity (PSU)PRILUE (mol mol−1)GPP (μmol m−2 s−1)NEE (μmol m−2 s−1)
2017Spring0.7722.500.330.40265.212.430.160.02516.5813.38
Summer1.0930.360.560.35814.15.400.150.01817.9713.26
Autumn0.9026.670.590.5277.315.310.160.02016.2212.80
Winter0.7417.600.310.4094.913.160.120.02416.0513.43
2018Spring1.0024.430.470.24186.514.890.160.01817.6613.82
Summer1.0229.940.690.40774.814.850.210.01816.2212.20
Autumn0.8625.780.620.45173.98.650.190.02015.3011.92
Winter0.6316.880.190.40146.111.360.140.02614.3212.19
2019Spring0.7222.560.290.31536.36.360.200.02516.0612.83
Summer1.0230.410.720.26511.63.800.190.01918.1013.28
Autumn1.0026.641.060.4323.79.480.100.01916.7512.95
Winter0.6117.910.250.3392.313.270.140.02815.1212.84
2020Spring0.8123.000.490.33209.310.230.140.02214.6611.68
Summer1.2131.331.250.28453.69.370.110.01315.3510.71
Autumn0.8826.301.060.47244.09.560.110.01814.7511.37
Winter0.7017.730.400.3399.611.610.100.02314.8212.35
Publisher’s Note: MDPI stays neutral with regard to jurisdictional claims in published maps and institutional affiliations.

