Article

Wood–Leaf Classification of Tree Point Cloud Based on Intensity and Geometric Information

1
School of Science, Beijing Forestry University, No.35 Qinghua East Road, Haidian District, Beijing 100083, China
2
Research Institute of Petroleum Exploration and Development, Petrochina, Beijing 100083, China
*
Author to whom correspondence should be addressed.
Remote Sens. 2021, 13(20), 4050; https://doi.org/10.3390/rs13204050
Submission received: 26 July 2021 / Revised: 5 October 2021 / Accepted: 6 October 2021 / Published: 11 October 2021
(This article belongs to the Special Issue Advances in LiDAR Remote Sensing for Forestry and Ecology)

Abstract

:
Terrestrial laser scanning (TLS) can obtain tree point clouds with high precision and high density. The efficient classification of wood points and leaf points is essential for the study of tree structural parameters and ecological characteristics. Using both intensity and geometric information, we present an automated wood–leaf classification with a three-step classification and wood point verification. The tree point cloud was classified into wood points and leaf points using intensity threshold, neighborhood density and voxelization successively, and was then verified. Twenty-four willow trees were scanned using the RIEGL VZ-400 scanner. Our results were compared with the manual classification results. To evaluate the classification accuracy, three indicators were introduced into the experiment: overall accuracy (OA), Kappa coefficient (Kappa), and Matthews correlation coefficient (MCC). The ranges of OA, Kappa, and MCC of our results were from 0.9167 to 0.9872, 0.7276 to 0.9191, and 0.7544 to 0.9211, respectively. The average values of OA, Kappa, and MCC were 0.9550, 0.8547, and 0.8627, respectively. The time costs of our method and another were also recorded to evaluate the efficiency. The average processing time was 1.4 s per million points for our method. The results show that our method represents a potential wood–leaf classification technique with the characteristics of automation, high speed, and good accuracy.

1. Introduction

Trees are very ecologically important to the environment [1]. Living trees and plants in terrestrial ecosystems store approximately one trillion tons of carbon dioxide [2]. Therefore, forests play an important role in mitigating global climate change due to their ability to sequester carbon [3,4]. Above-ground biomass (AGB) is the main form of tree carbon stocks, comprising trunks, branches, and leaves [5]. Leaves are associated with photosynthesis, respiration, transpiration, and carbon sequestration, whereas trunks, composed of xylem and conduits, are mainly used to transport water and nutrients. Due to the different physiological functions of leaves and woody parts, separating leaves and woody parts is the basis for many studies, such as leaf area index (LAI) estimation, tree crown volume estimation, and diameter at breast height (DBH) estimation.
Laser scanning technology can be divided into three categories according to the platform utilized, and these are spaceborne laser scanning, airborne laser scanning, and terrestrial laser scanning (TLS) [6]. In forestry inventory, spaceborne and airborne laser scanning are mainly used to obtain the information of large-scale forests to achieve the biomass estimation [7], species classification [8,9], tree height estimation [10], basal area estimation [11], carbon mapping [12], and estimated forest structure [13]. Compared to spaceborne and airborne laser scanning, TLS has the advantage of obtaining trunk and branch information in detail from a viewpoint below the canopy with high leaf density. Therefore, tree point clouds can reflect the structural characteristics of trees better with less occlusion, and this is a good complementary measure to other large-scale inventory methods [6].
In recent years, TLS has been widely used to obtain tree point cloud data that includes the woody part and the leaf part. Leaf point clouds are usually used to estimate leaf area index (LAI) [14,15,16], leaf area density [17,18], and tree crown volume [19,20]. Similarly, wood point clouds are often used to calculate parameters such as tree position, diameter at breast height (DBH) [21], tree branch and stem biomass [22,23], tree volume [24,25], and stem curve [26,27]. They can also be used together to calculate gap fractions, effective plant area index values [28,29], and tree biomass estimation [30,31]. Wood–leaf classification forms the basis of many forests inventory studies. Furthermore, to some extent, the accuracy of wood–leaf classification affects the accuracy of estimating the above-mentioned parameters.
The intensity information obtained in laser scanning is different for wood and leaves. Béland et al. performed wood–leaf classification using distance-based intensity normalization [32]. Some researchers used dual-wavelength LiDAR systems to realize wood–leaf classification based on the difference between the intensities of wood points and leaf points [33,34,35]. Zhao et al. used intensity information of the multi-wavelength fluorescence LiDAR (MWFL) system to determine the separation of vegetation stems and leaves [36]. However, random and variable leaf positions and postures result in a wide distribution of leaf point intensity, which overlaps with the distribution of wood point intensity. Therefore, it is hard to separate wood points and leaf points only using an intensity threshold. Dual-wavelength systems and multi-wavelength systems can improve the classification accuracy by using different thresholds or different wavelengths, respectively.
The geometric information and density information of tree point cloud data were also used to realize the wood–leaf classification. Skeleton points and k-dimensional tree (KD-tree), based on the geometric information of point clouds, can be used to classify wood points and leaf points [37]. Ma et al. also proposed a geometric method to separate photosynthetic and non-photosynthetic substances [38]. Ferrara et al. proposed a method to classify wood points and leaf points by using the density-based spatial clustering of applications with noise (DBSCAN) algorithm [39]. Xiang et al. adopted skeleton points to classify plant stems and leaves [40]. Wang et al. utilized the recursive point cloud segmentation and regularization process to classify wood points and leaf points automatically based on the geometric information [41].
Some machine learning algorithms have also been proposed to perform wood–leaf classification. Yun et al. used the semi-supervised support vector machine (SVM) to classify wood and leaves by extracting multiple features from point cloud data [42]. Zhu et al. classified wood and leaves using a random forest (RF) algorithm [43]. Vicari et al. presented a method combining the unsupervised classification of geometric features and the shortest path analysis to classify wood and leaf points [44]. Liu et al. proposed different automated SVM classification methods for stem–leaf and wood–leaf classifications for potted plant point clouds [45] and tree point clouds [46]. Krishna Moorthy et al. realized wood–leaf classification using radially bounded nearest neighbors on multiple spatial scales in a machine learning model [47]. Morel et al. classified wood points and leaf points based on deep learning and a class decision process [48]. The automation and the efficiency of machine learning methods decreases due to the laborious and time-consuming manual selection of training data for the classifier.
This paper proposes an automated and rapid wood–leaf classification method. A three-step classification was constructed to classify the points into leaf points and wood points. Additionally, wood point verification was fulfilled to correct some misclassified wood points to improve the classification accuracy. The paper is organized as follows. Section 2 describes the experimental dataset and explains our method in detail. Section 3 demonstrates the separation results of tree point clouds. Section 4 analyzes and discusses the results from different viewpoints. Section 5 summarizes the characteristics of our method and suggests directions for future research.

2. Materials and Methods

2.1. Experimental Data

The experiment data were collected in Haidian Park, Haidian District, Beijing, China, in June 2016. Three single scans were conducted using the RIEGL VZ-400 TLS scanner, which was manufactured by the RIEGL company (RIEGL Laser Measurement Systems GmbH, 3580 Horn, Austria). The characteristics of the RIEGL VZ-400 scanner are listed in Table 1.
Some leaf-on plantation trees were scanned, and the obtained point cloud data contained the 3D data and intensity data. Twenty-four willow trees (Salix babylonica Linn and Salix matsudana Koidz) were manually extracted from three single-scan scene point clouds by using the RISCAN PRO software. The 24 tree point clouds were numbered and are presented in Figure 1. As shown in Table 2, the total tree heights (TTHs) of these trees ranged from 8.82 m to 15.18 m, their DBHs ranged from 14.2 cm to 29.3 cm, and the distances between the TLS scanner and each tree ranged from 3.74 m to 36.99 m.
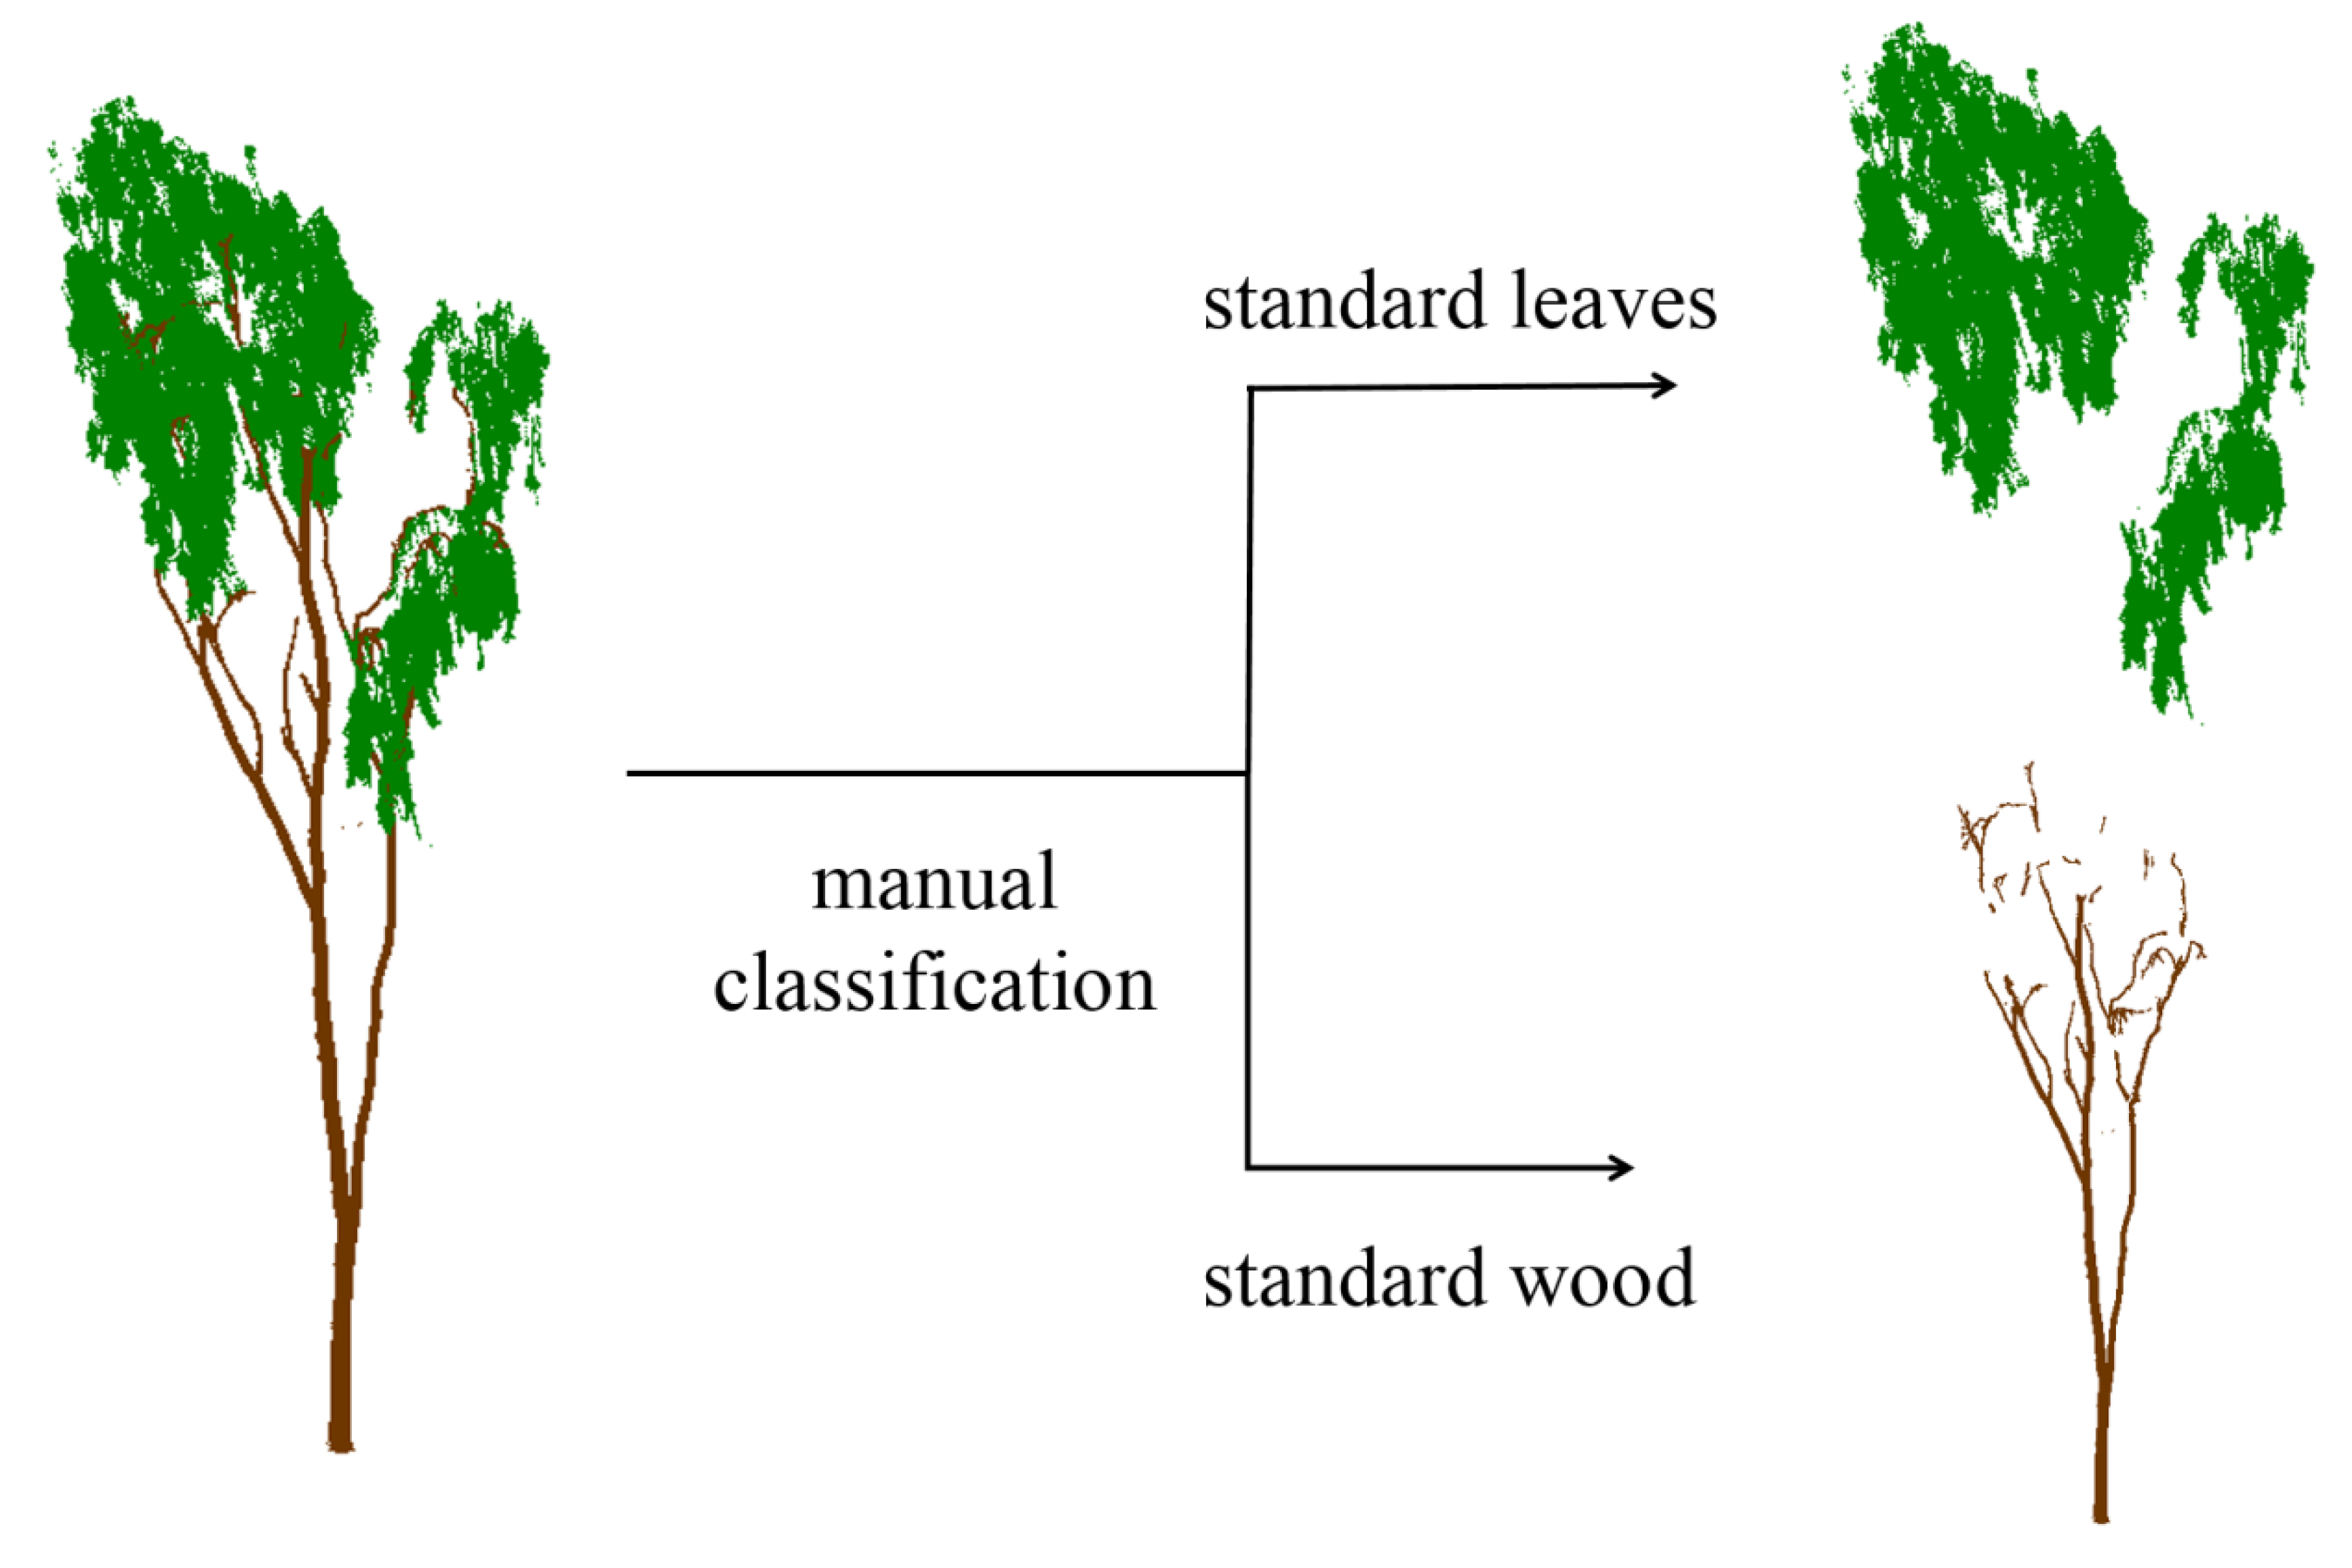
To analyze the classification results and to evaluate our method, manual classification was performed on each extracted tree point cloud in the CloudCompare software (an open-source project as defined by the GNU General Public License (GPL)). The wood points and leaf points of each tree were manually classified, and the processing time for each tree was about 3–5 h. The manual classification results were regarded as the standard classification results. Tree 5 was selected to demonstrate the typical manual classification results (Figure 2). The wood points are shown in brown, and leaf points are shown in green.

2.2. Method

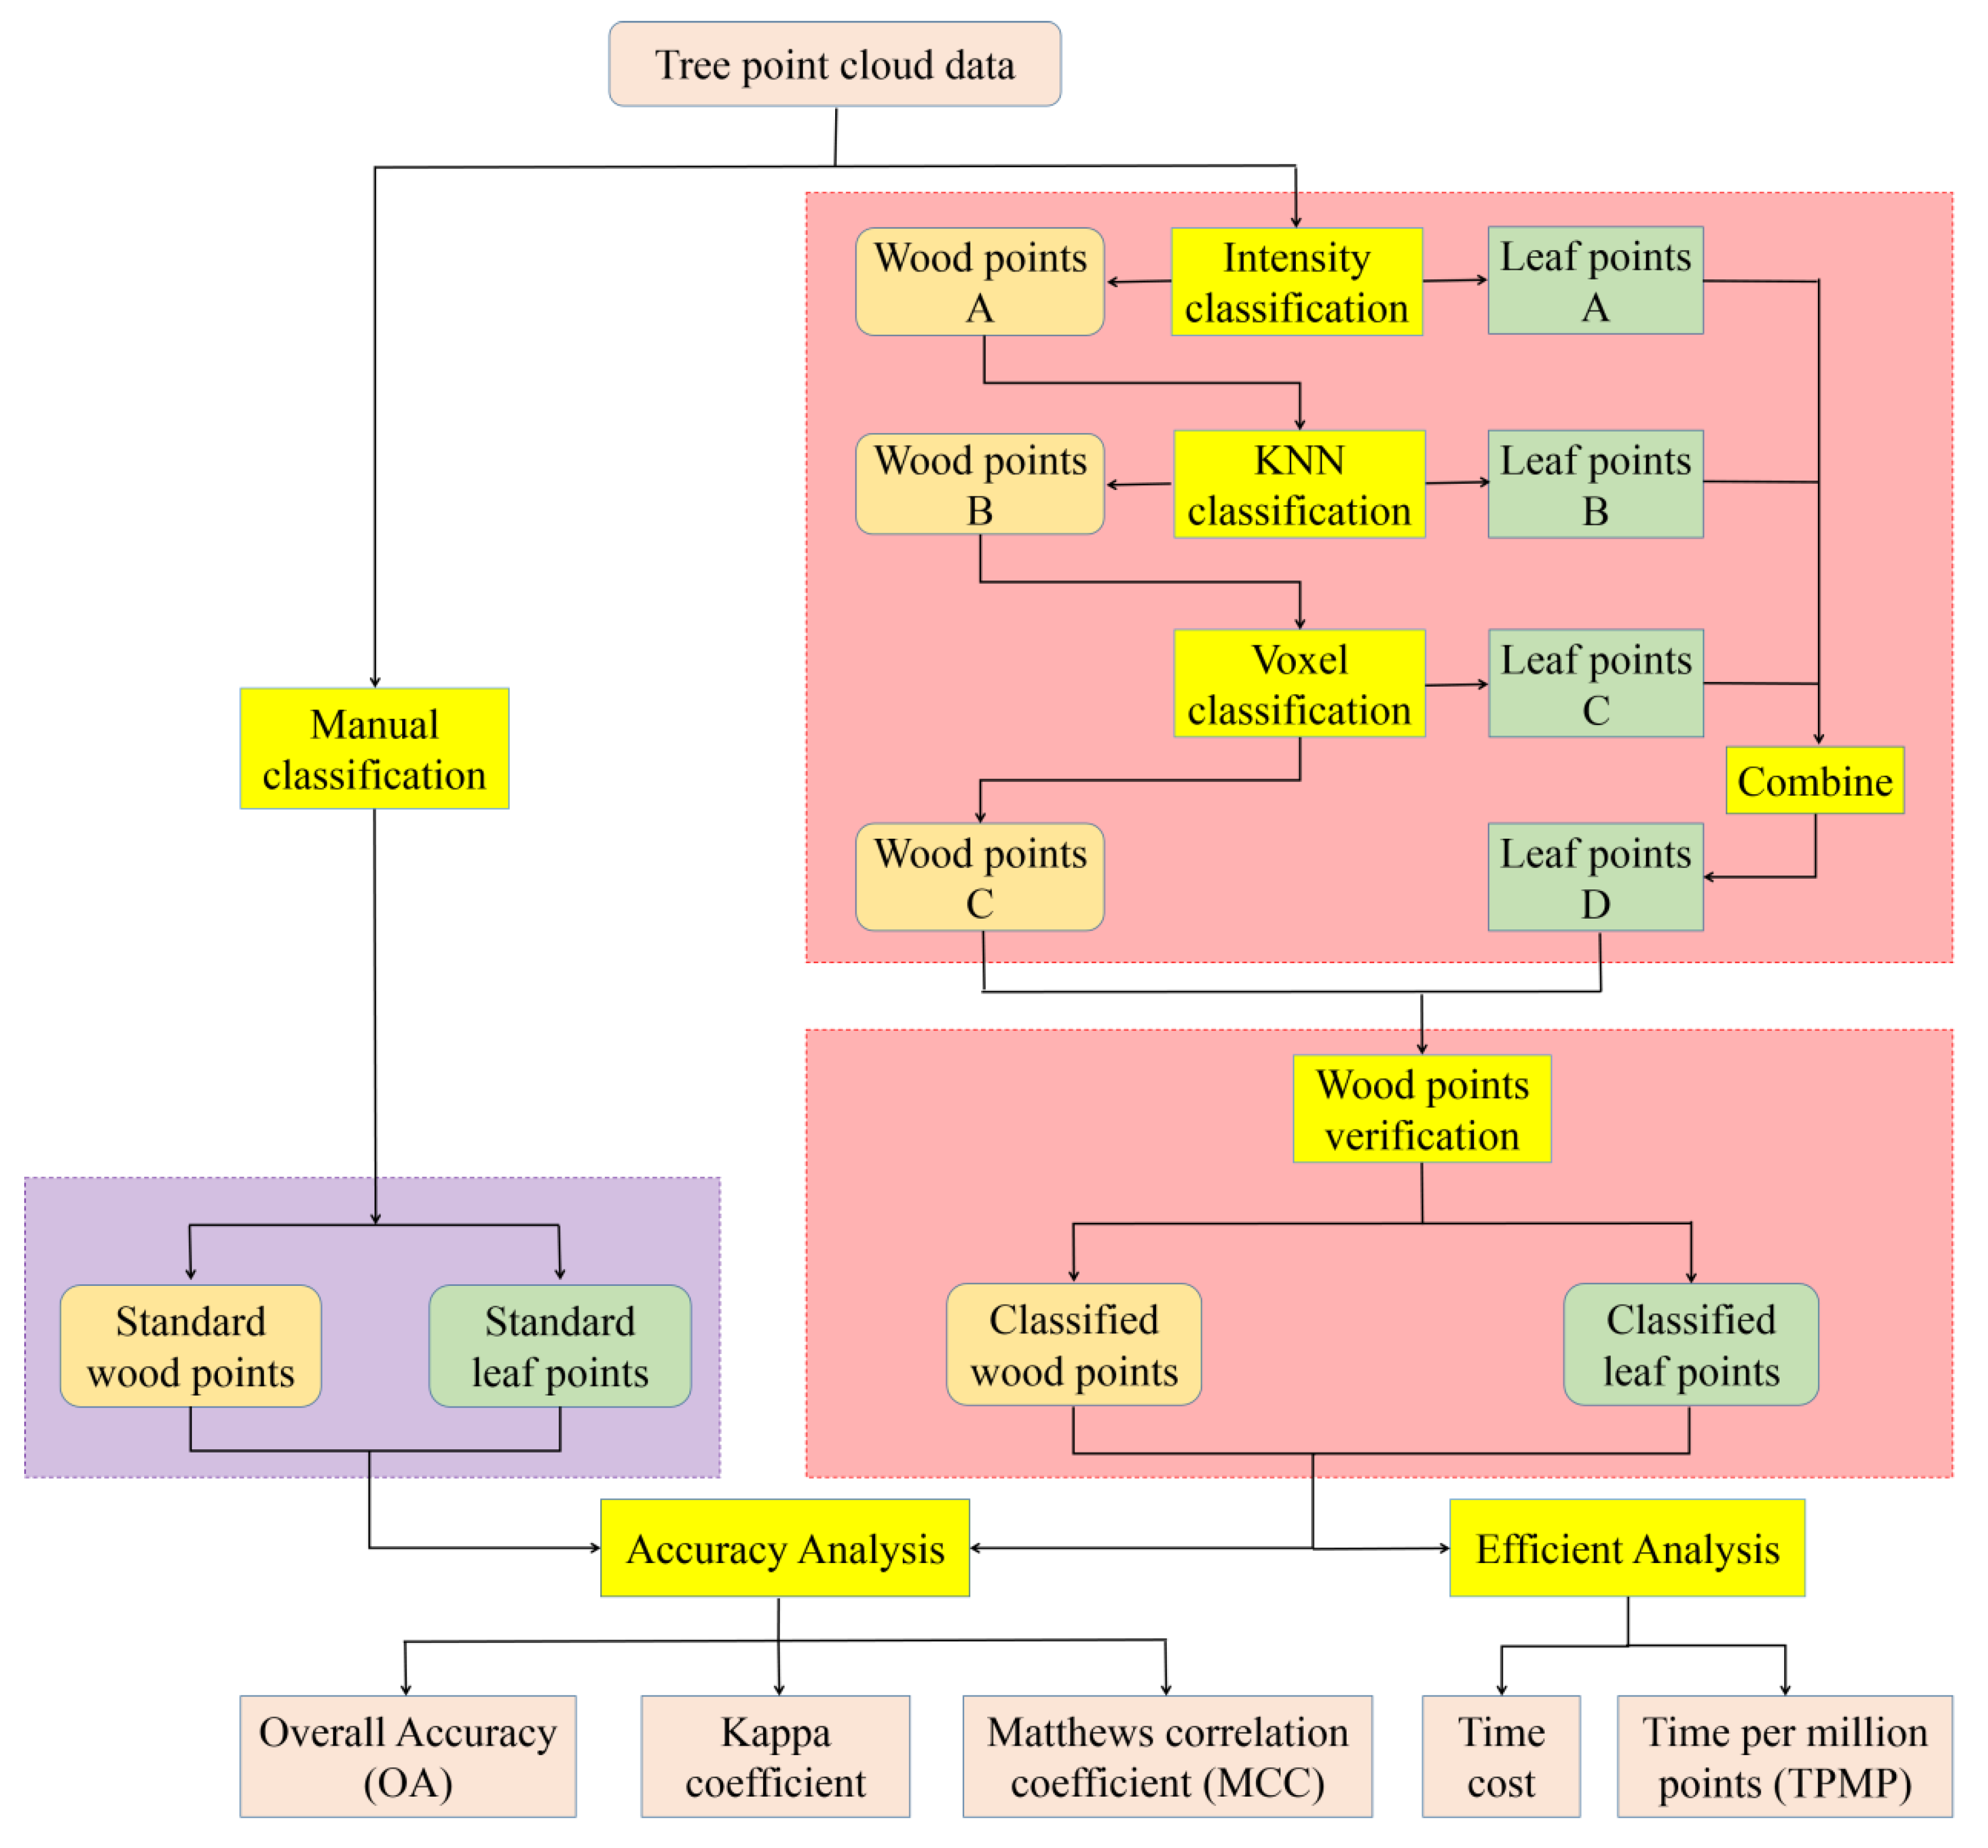
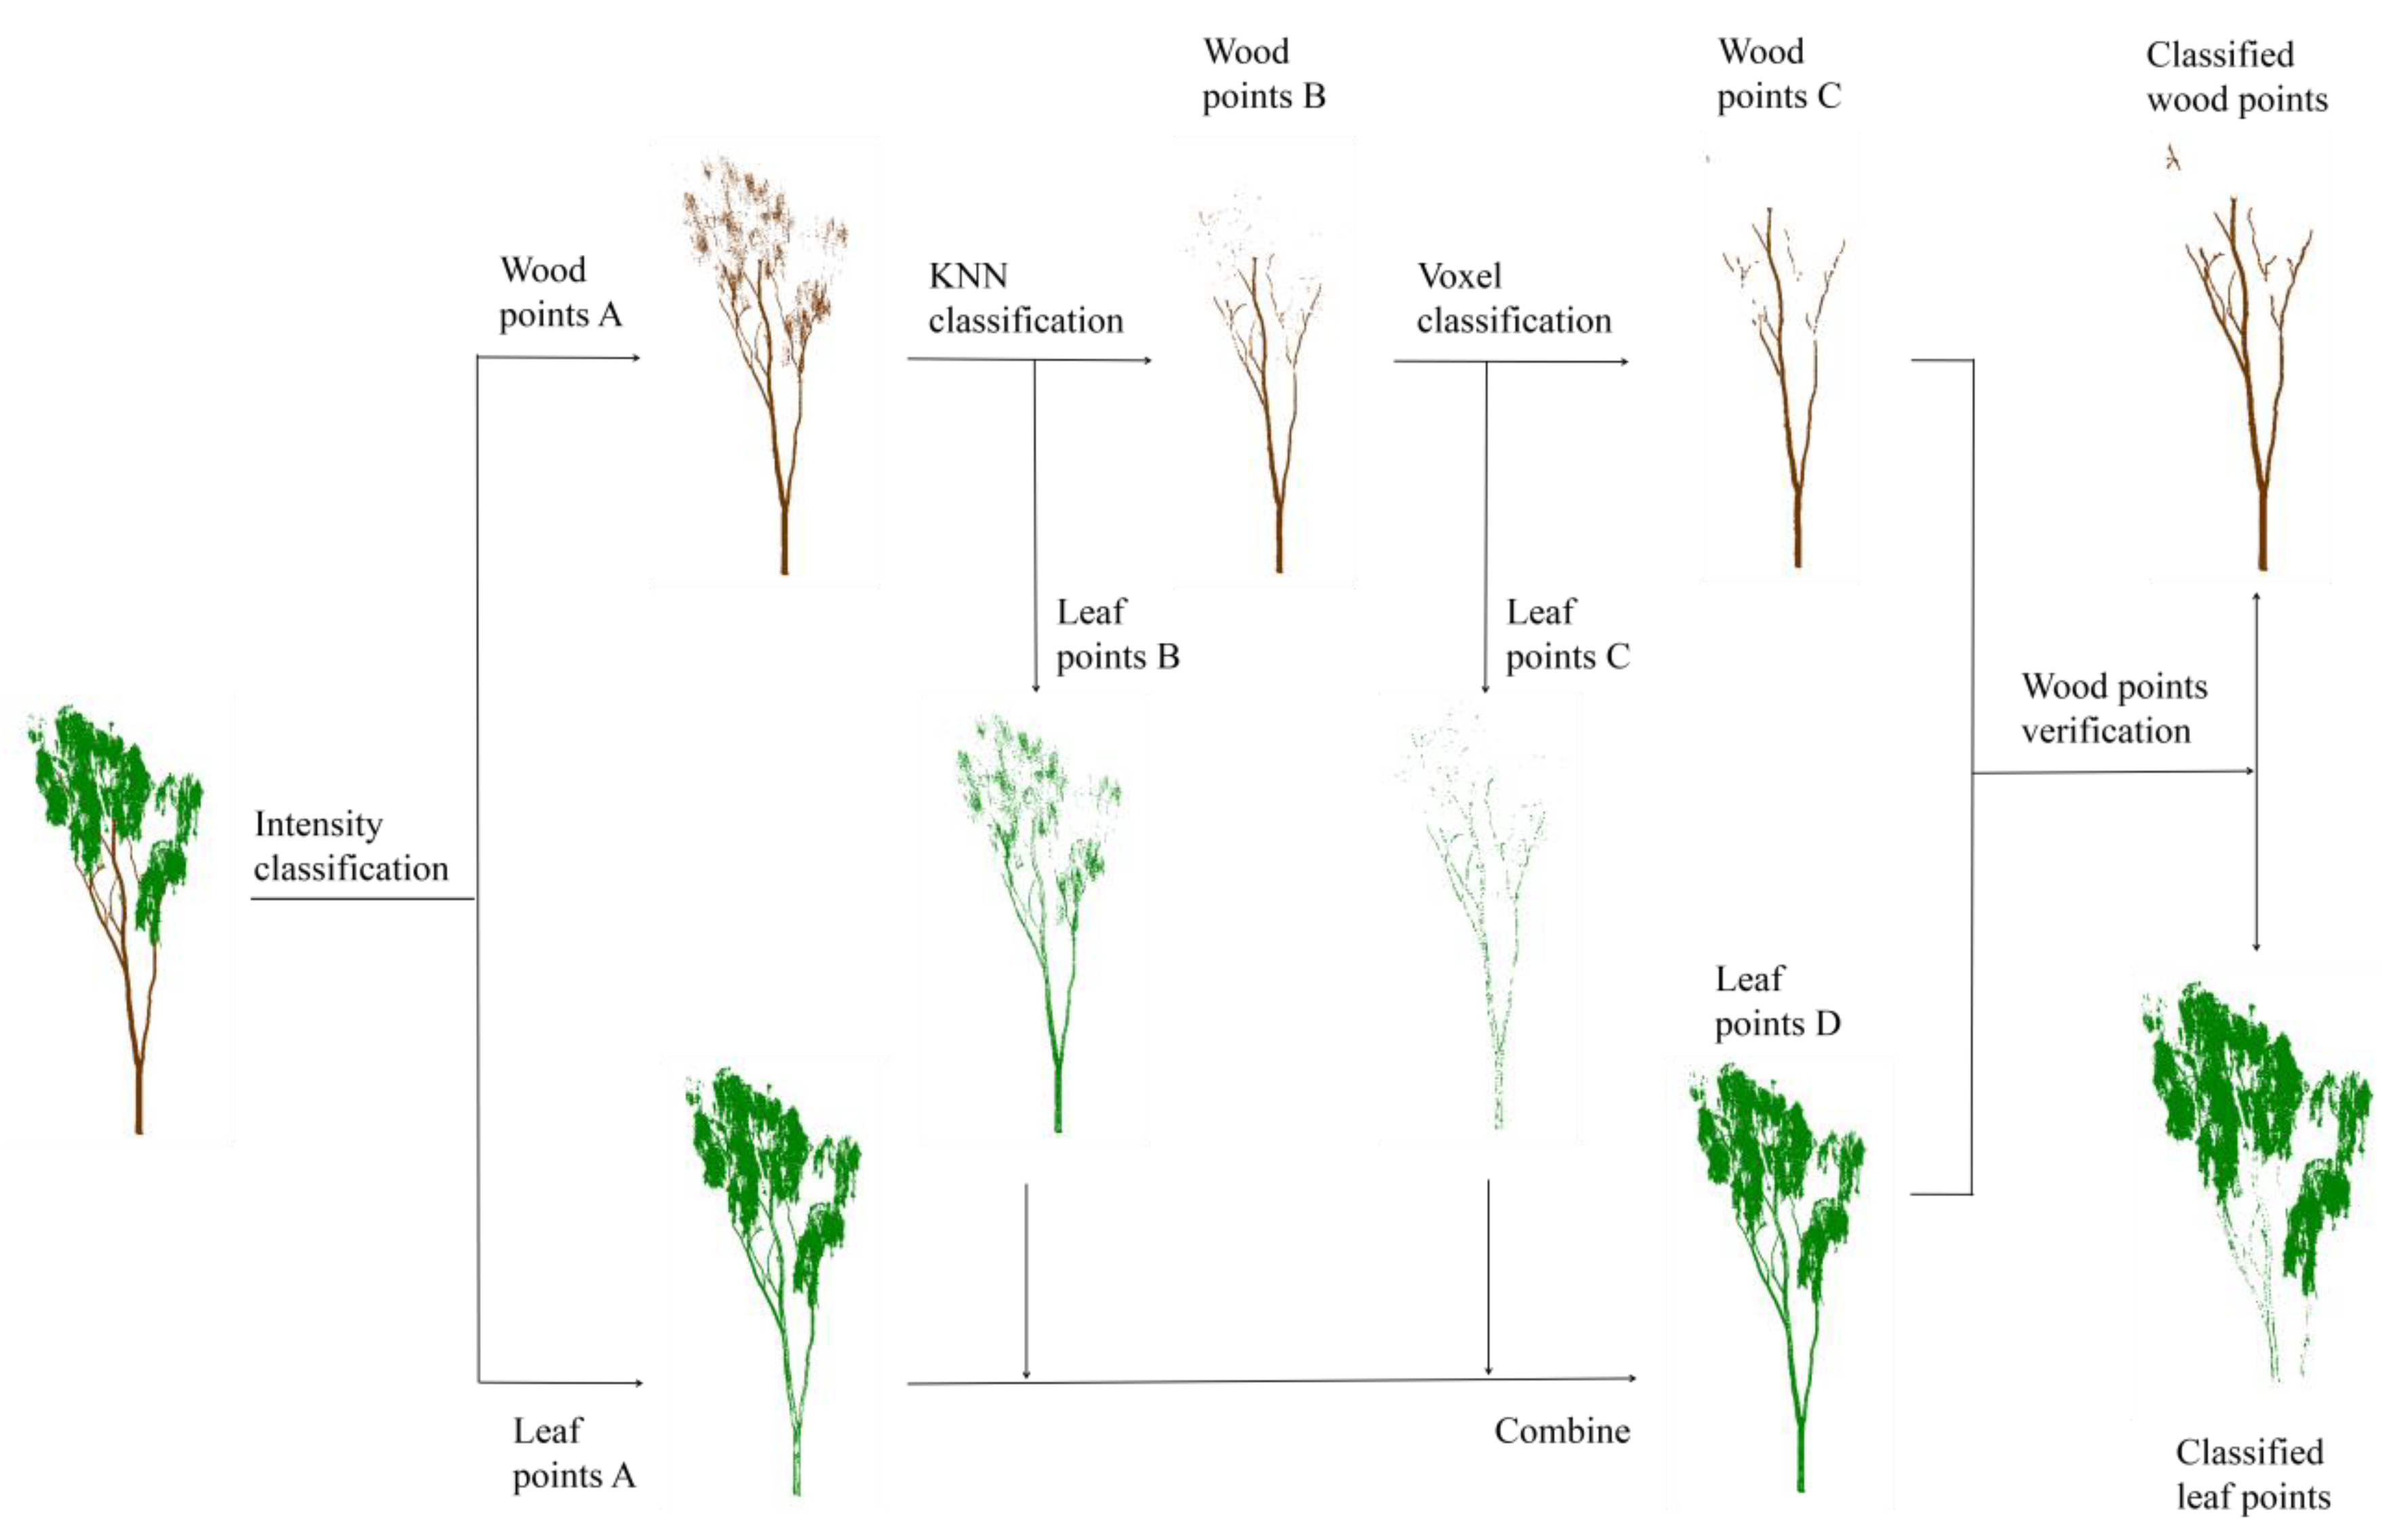
Our method aimed for automated and detailed wood–leaf classification, as shown in Figure 3. There are two main parts: first is the three-step classification based on the intensity information, K-nearest neighbors, point density in the voxel, and voxel neighbors; second is the wood point verification, which could correct some of the misclassified points.
The above-mentioned three-step classification mainly focused on determining as much as possible about the leaf points.
First, intensity information was used to classify the tree points into wood points and leaf points. Trunk and branches are woody materials, and leaves are non-wood materials, which exhibit different physical characteristics. Additionally, trunks and branches are hard and stable, whereas leaves are soft, with variable postures. Moreover, VZ series TLS scanners use a near-infrared laser with a frequency of greater than 1 μm, which is in the region of the electromagnetic spectrum absorbed by water. Therefore, the intensity values of trunk and branch points are generally greater than leaf points; however, the intensity values of twig points have almost the similar magnitudes as leaves. A suitable intensity threshold can help to classify raw tree points into wood points A and leaf points A, as shown in Figure 3.
Second, after the intensity classification, some leaf points were still classified as wood points A because of their intensity values. These leaf points are generally sparsely distributed in 3D space, which results in longer distances between the nearest neighbors than wood points. However, real wood points mostly have shorter distances from their neighbor points than leaf points, as shown in Figure 4. Therefore, the K-nearest neighbors were used to further determine these sparsely distributed leaf points B in wood points A. The remaining parts of wood points A are wood points B.
Next, voxelization was used to evaluate the point density on a larger scale. Considering the homogeneity and connectivity of trunks and branches, generally, the points belonging to the same voxel are most likely to exhibit the same properties. The whole point cloud space was divided into many voxels, and wood points B were classified as wood points C and leaf points C, according to voxel features and neighbor relationships.
After the above three-step classification process, most leaf points were extracted from the total points. Additionally, the three leaf point components, leaf points A, leaf points B and leaf points C, were combined into leaf points D. However, some wood points were still misclassified as leaf points, which are usually further away from their neighboring wood points, and they cannot meet the previous classification requirements of wood points. Therefore, voxel and intensity information were both used to conduct comprehensive verification to modify the categories of these points. At this phase, the number of wood points increased whereas the number of leaf points decreased.
Finally, the classified wood and leaf points were ready to be evaluated using three indicators of accuracy and two indicators of efficiency.

2.2.1. Intensity Classification

As the first stage of the three-step classification, the intensity classification was employed to complete a rough wood–leaf classification. The generation of intensity information is complicated, which is related to the material, surface roughness, incident angle, measurement distance, object shape, etc. [49]. Generally, as mentioned above, the wood points probably have greater intensity values than the leaf points under the same circumstances. However, there are some reasons that would decrease the intensity values of wood points or increase the intensity values of leaf points. For example, the surface of wood is rougher than the surface of leaves; some leaves may also face the scanner directly. Therefore, the intensity value distributions of wood and leaf points would partially overlap. Generally, most points could be classified into wood and leaf points using the simple threshold of intensity value. A small portion of points were misclassified because of their overlapped intensity values.
The intensity threshold I t used in our method was adaptively generated for different tree point clouds. First, based on the principle of random sample consensus (RANSAC), n points in the tree point cloud were randomly selected as seed points. Second, the tree point cloud data were sampled spherically using the automatic random sampling method [45]. The spherical sampling took the seed points as the centers of the spheres and γ as the radius. Then, the sampling points in each sphere were projected onto a horizontal plane, and the projection density was calculated. The distribution of wood points was more concentrated than leaf points. Due to the difference between the spatial distributions of wood points and leaf points, their projection density was significantly different. The projection density of wood points was larger than leaf points. Therefore, wood points and leaf points could be distinguished based on the projection density. After the experimental tests, n was selected as 1000, and γ was selected as 0.03 m.
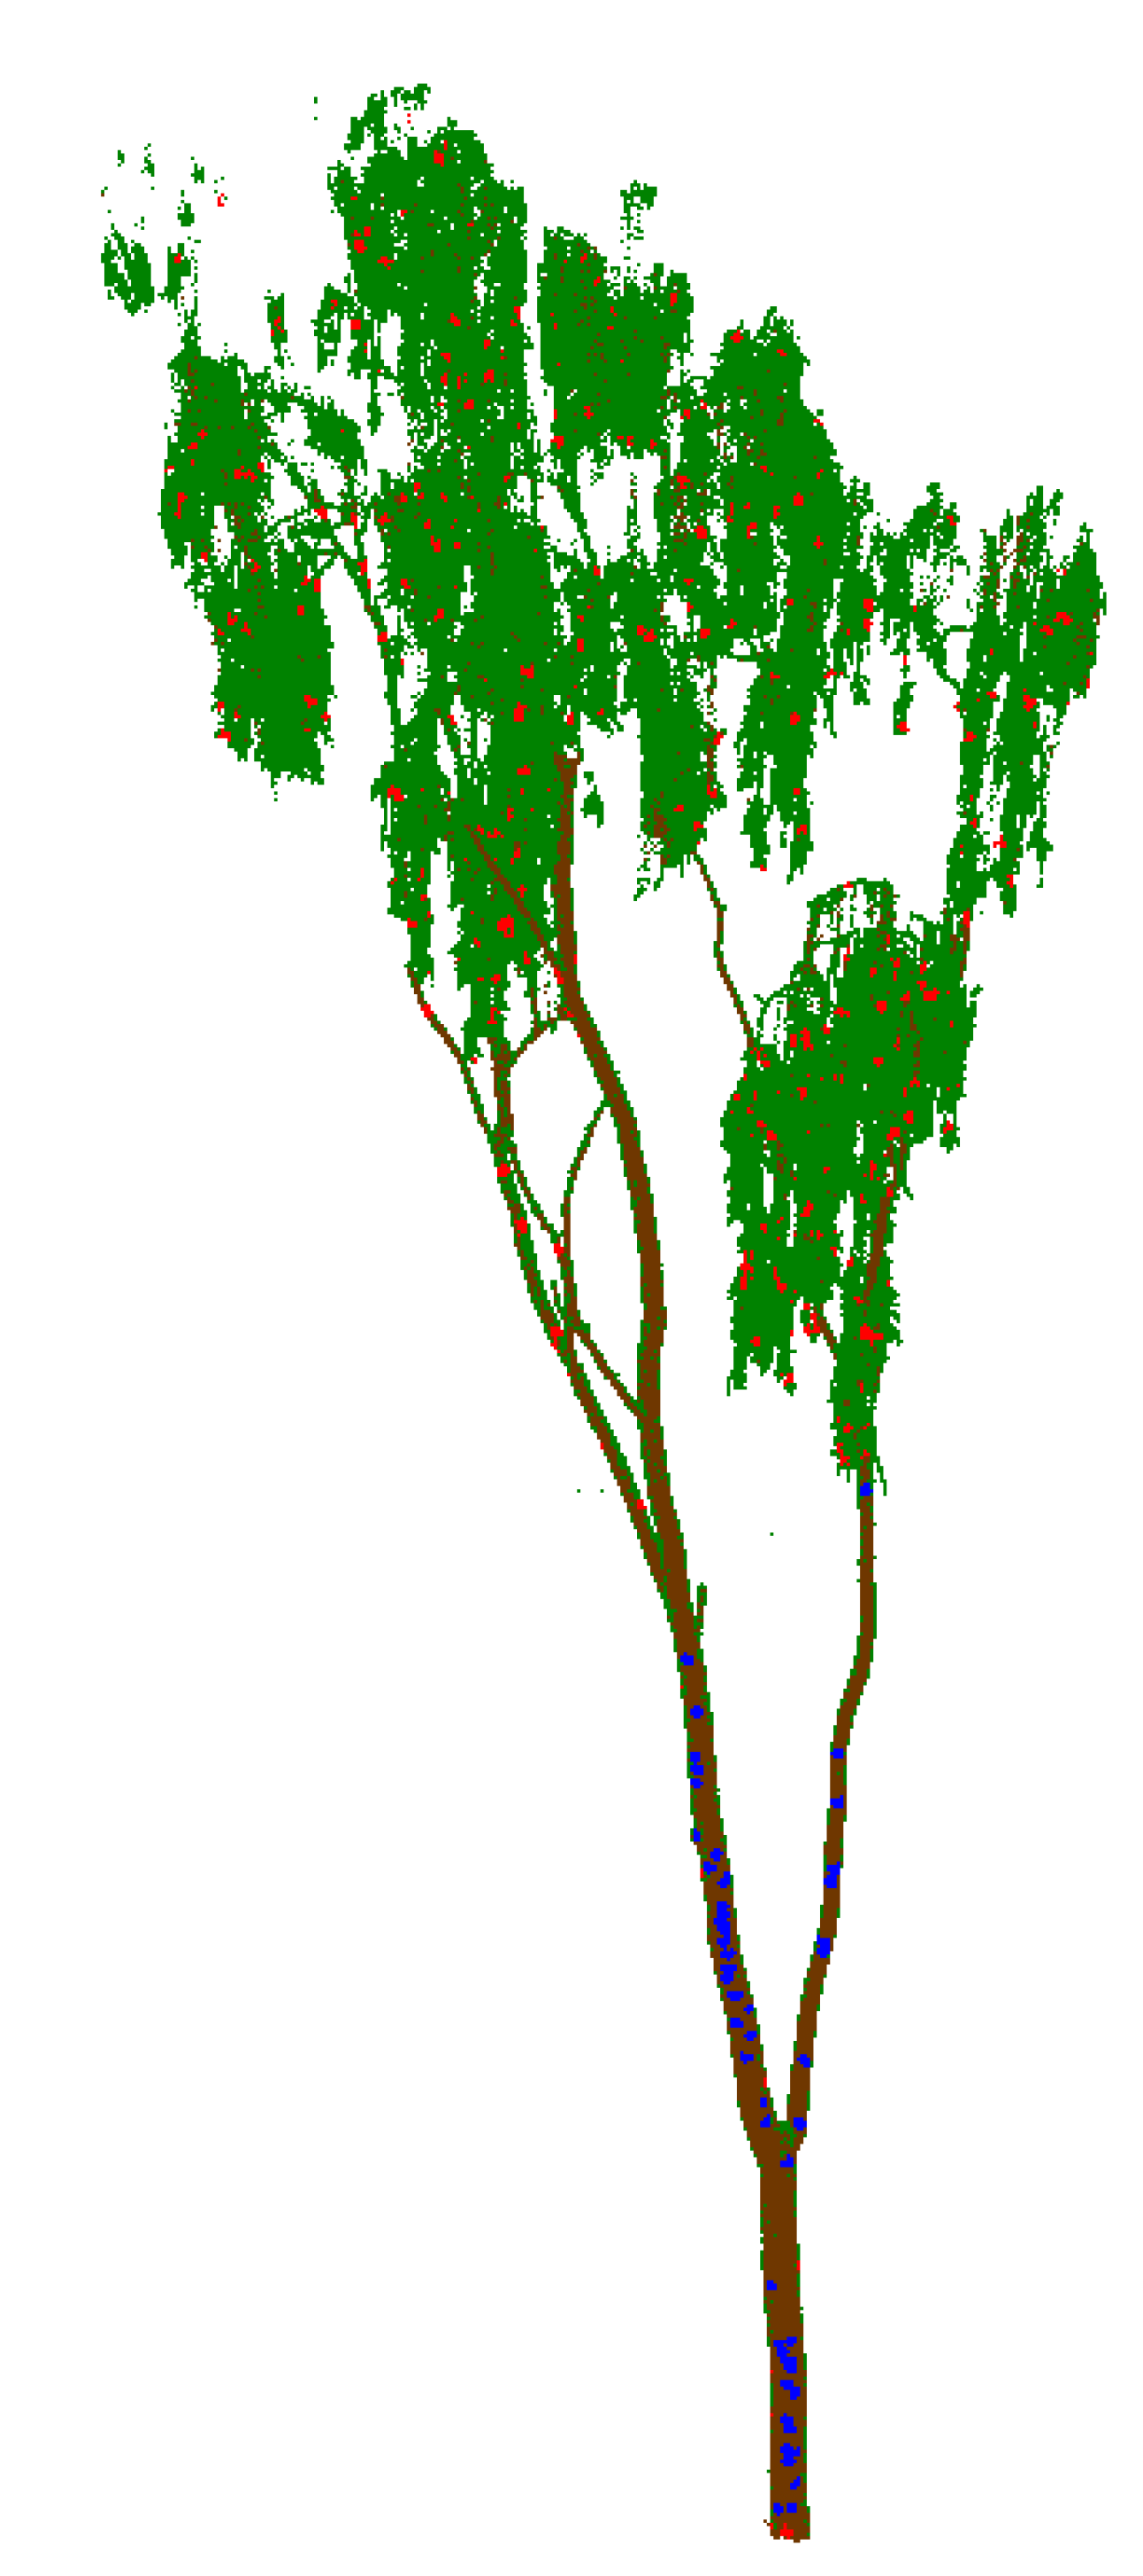
As shown in Figure 5, the point cloud of tree 5 was sampled by 1000 spheres, and the histograms of the projection density distributions of these spheres are plotted. According to previous assumptions, most spheres with high projection densities are more likely to contain wood points, whereas most spheres with low projection densities are more likely to contain leaf points. Therefore, the entire density interval [ ρ m i n , ρ m a x ] was quartered. The calculation of ρ 1 4 and ρ 3 4 is shown in Equation (1). Additionally, the red and blue vertical lines in Figure 5 represent ρ 1 4 and ρ 3 4 , respectively. The points contained in the sample spheres with densities greater than ρ 3 4 are defined as wood points A in Figure 3; the points contained in the sample spheres with densities less than ρ 1 4 are defined as leaf points A. As shown in Figure 6, the red points are the leaf sampling points, and the blue points are the wood sampling points.
{ ρ 1 4 = ρ m i n + ρ m a x ρ m i n 4 ρ 3 4 = ρ m a x ρ m a x ρ m i n 4
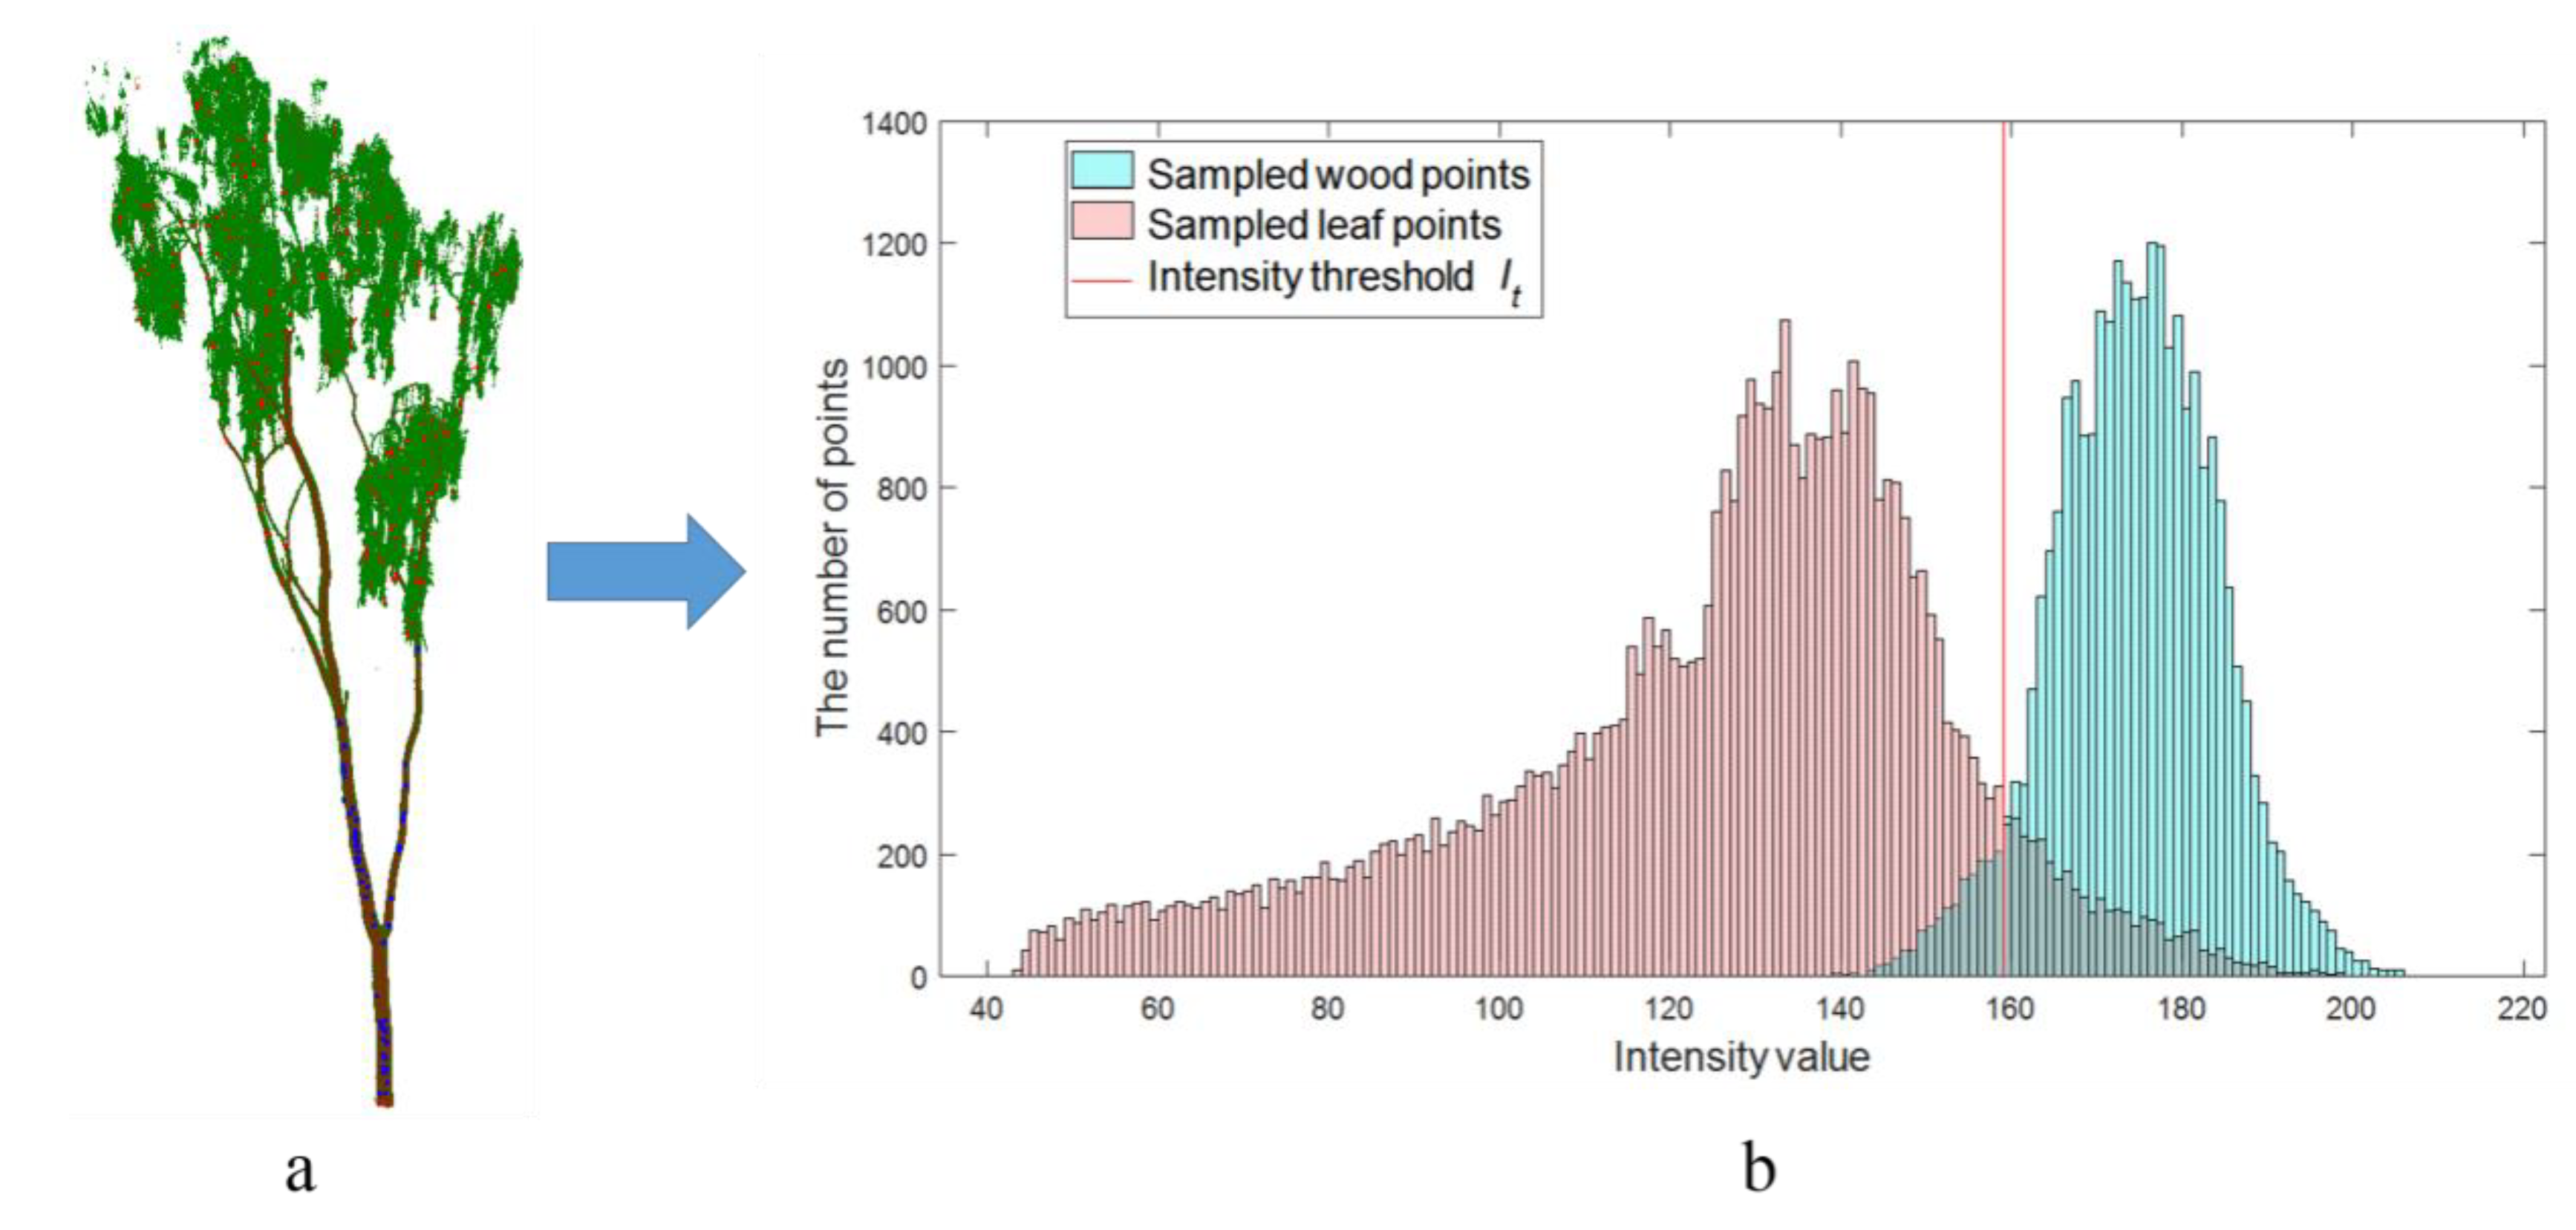
Due to the RANSAC theory, the sampled points can approximately express the intensity distribution of the original point cloud. Based on the wood–leaf classification results of the sampled points, the intensity was analyzed. Although the intensity values of the two parts displayed a relatively concentrated distribution, there was still a high probability of overlapping areas. As shown in Figure 7, the intersection point of wood and leaf point intensity distributions was used to separate the two parts. Most points could be classified correctly, although some points were classified incorrectly.
The sampled and classified wood points and leaf points were used to fit the curves of their intensity distributions. Additionally, the intersection point of these two fitted curves was calculated and used as the separation threshold, I t which is plotted in Figure 7b in red. The separation threshold, I t is adaptive for each tree point cloud in our method.

2.2.2. Neighborhood Classification

Further classification was needed to improve the above coarse intensity classification. As shown in Figure 7, the overlapping of the intensity resulted in some points being classified into incorrect categories. The classified wood points A and leaf points A were both composed of two elements. One is the correctly classified points, and the other is the incorrectly classified points. The neighborhood classification was used to find the leaf points that were the wrong classified points in the wood points A.
The wood points were more regularly distributed compared with the leaf points, which were scattered in 3D space with different leaf positions. In a local area, wood points are arranged closer to a plane, whereas leaf points are more discrete than wood points. This is because the shape of the woody part of a tree is relatively stable in space, whereas the leaves themselves exhibit a more chaotic distribution and may be affected by wind during the data collection, which can cause jitters and further increases the dispersion of leaf points. Therefore, it can be inferred that the spatial distribution of real wood points in wood points A were also compact and dense, and misclassified leaf points were sparse and discrete. The degree of dispersion of leaf points would even increase after intensity classification because of the correct classification of most leaf points. Therefore, the KNN algorithm was considered to further identify some leaf points now categorized as wood points. In this study, the eight nearest neighbors were used to separate the wood and leaf points.
We proposed to establish a KD-tree and calculate the average distance, d a   between the target point and its eight nearest neighbors. If the target point was on the woody part, the local area of the eight nearest neighbors could be hypothesized as a small plane with a high probability, as shown in Figure 8a.
First, the spacing value, S s of the target point was calculated at the range ρ with the angular step width θ s .
S s = ρ × sin ( θ s ) ρ × θ s
where ρ is the distance value between the target point and the scanner, and the spacing value, S s is the distance between two adjacent laser beams at a specific distance, ρ Then, the d a on the plane can be calculated as follows:
d a = n = 1 8 d n 8
where d n represents the distances from the target point to its eight nearest neighbors.
As shown in Figure 8a, the red point represents the target point, the d n value of the four yellow points is S s and the d n value of the four green points is 2 S s . Then, the average distance d a can be calculated as 1 + 2 2 S s . Considering that the trunks and branches may be inclined sometimes (Figure 8b), we assumed the angle of inclination, α to be no more than 45°. Therefore, the maximum value of S s (L in Figure 8b) was 2 S s . Thus, the maximum value of d a was about 1.71 S s .
The d a value of each point may be different because of their different range values ρ . Therefore, a ratio threshold, t h r for d a could be used to classify the points into wood and leaf categories, for which t h r was 1.71. If the ratio of the target point was smaller than t h r , the point was classified as wood; otherwise, the point was classified as a leaf.

2.2.3. Voxel Classification

By using the intensity information and neighbor information, most points were classified correctly. In this phase, more leaf points could be identified by using voxel classification, which is described as follows.
The wood points B were measured in three dimensions (x, y, and z). Each dimension was divided into 100 equal parts according to the specific dimensional information of points. Thus, a total 1,000,000 voxels covered the whole space containing the wood points B. Considering the homogeneity and connectivity of trunks and branches, generally, the points belonging to the same voxel are most likely to have the same properties.
However, there were still a few leaf points in the classified wood points B, and the remaining leaf points were equally sparse and discrete. This led us to hypothesize that some voxels contained a small amount of leaf points, resulting in smaller point densities. Therefore, the point density could be considered to determine the leaf points classified in wood points B.
However, the number of points, N u m s   which should be contained in a voxel is affected by the distance and the angular step width. To simplify the determination, a ratio value, R was proposed to simplify the calculation.
First, N u m s was calculated according to the distance, d v and the angular step width, θ s .
N u m s = Z s i z e d v × θ s × X s i z e 2 + Y s i z e 2 d v × θ s
where X s i z e , Y s i z e , Z s i z e are the voxel sizes in three dimensions, and d v is the distance between the center of the voxel and the scanner.
Second, based on the actual number of points in the voxel, N u m r the ratio, R could be calculated as follows:
R = N u m r N u m s
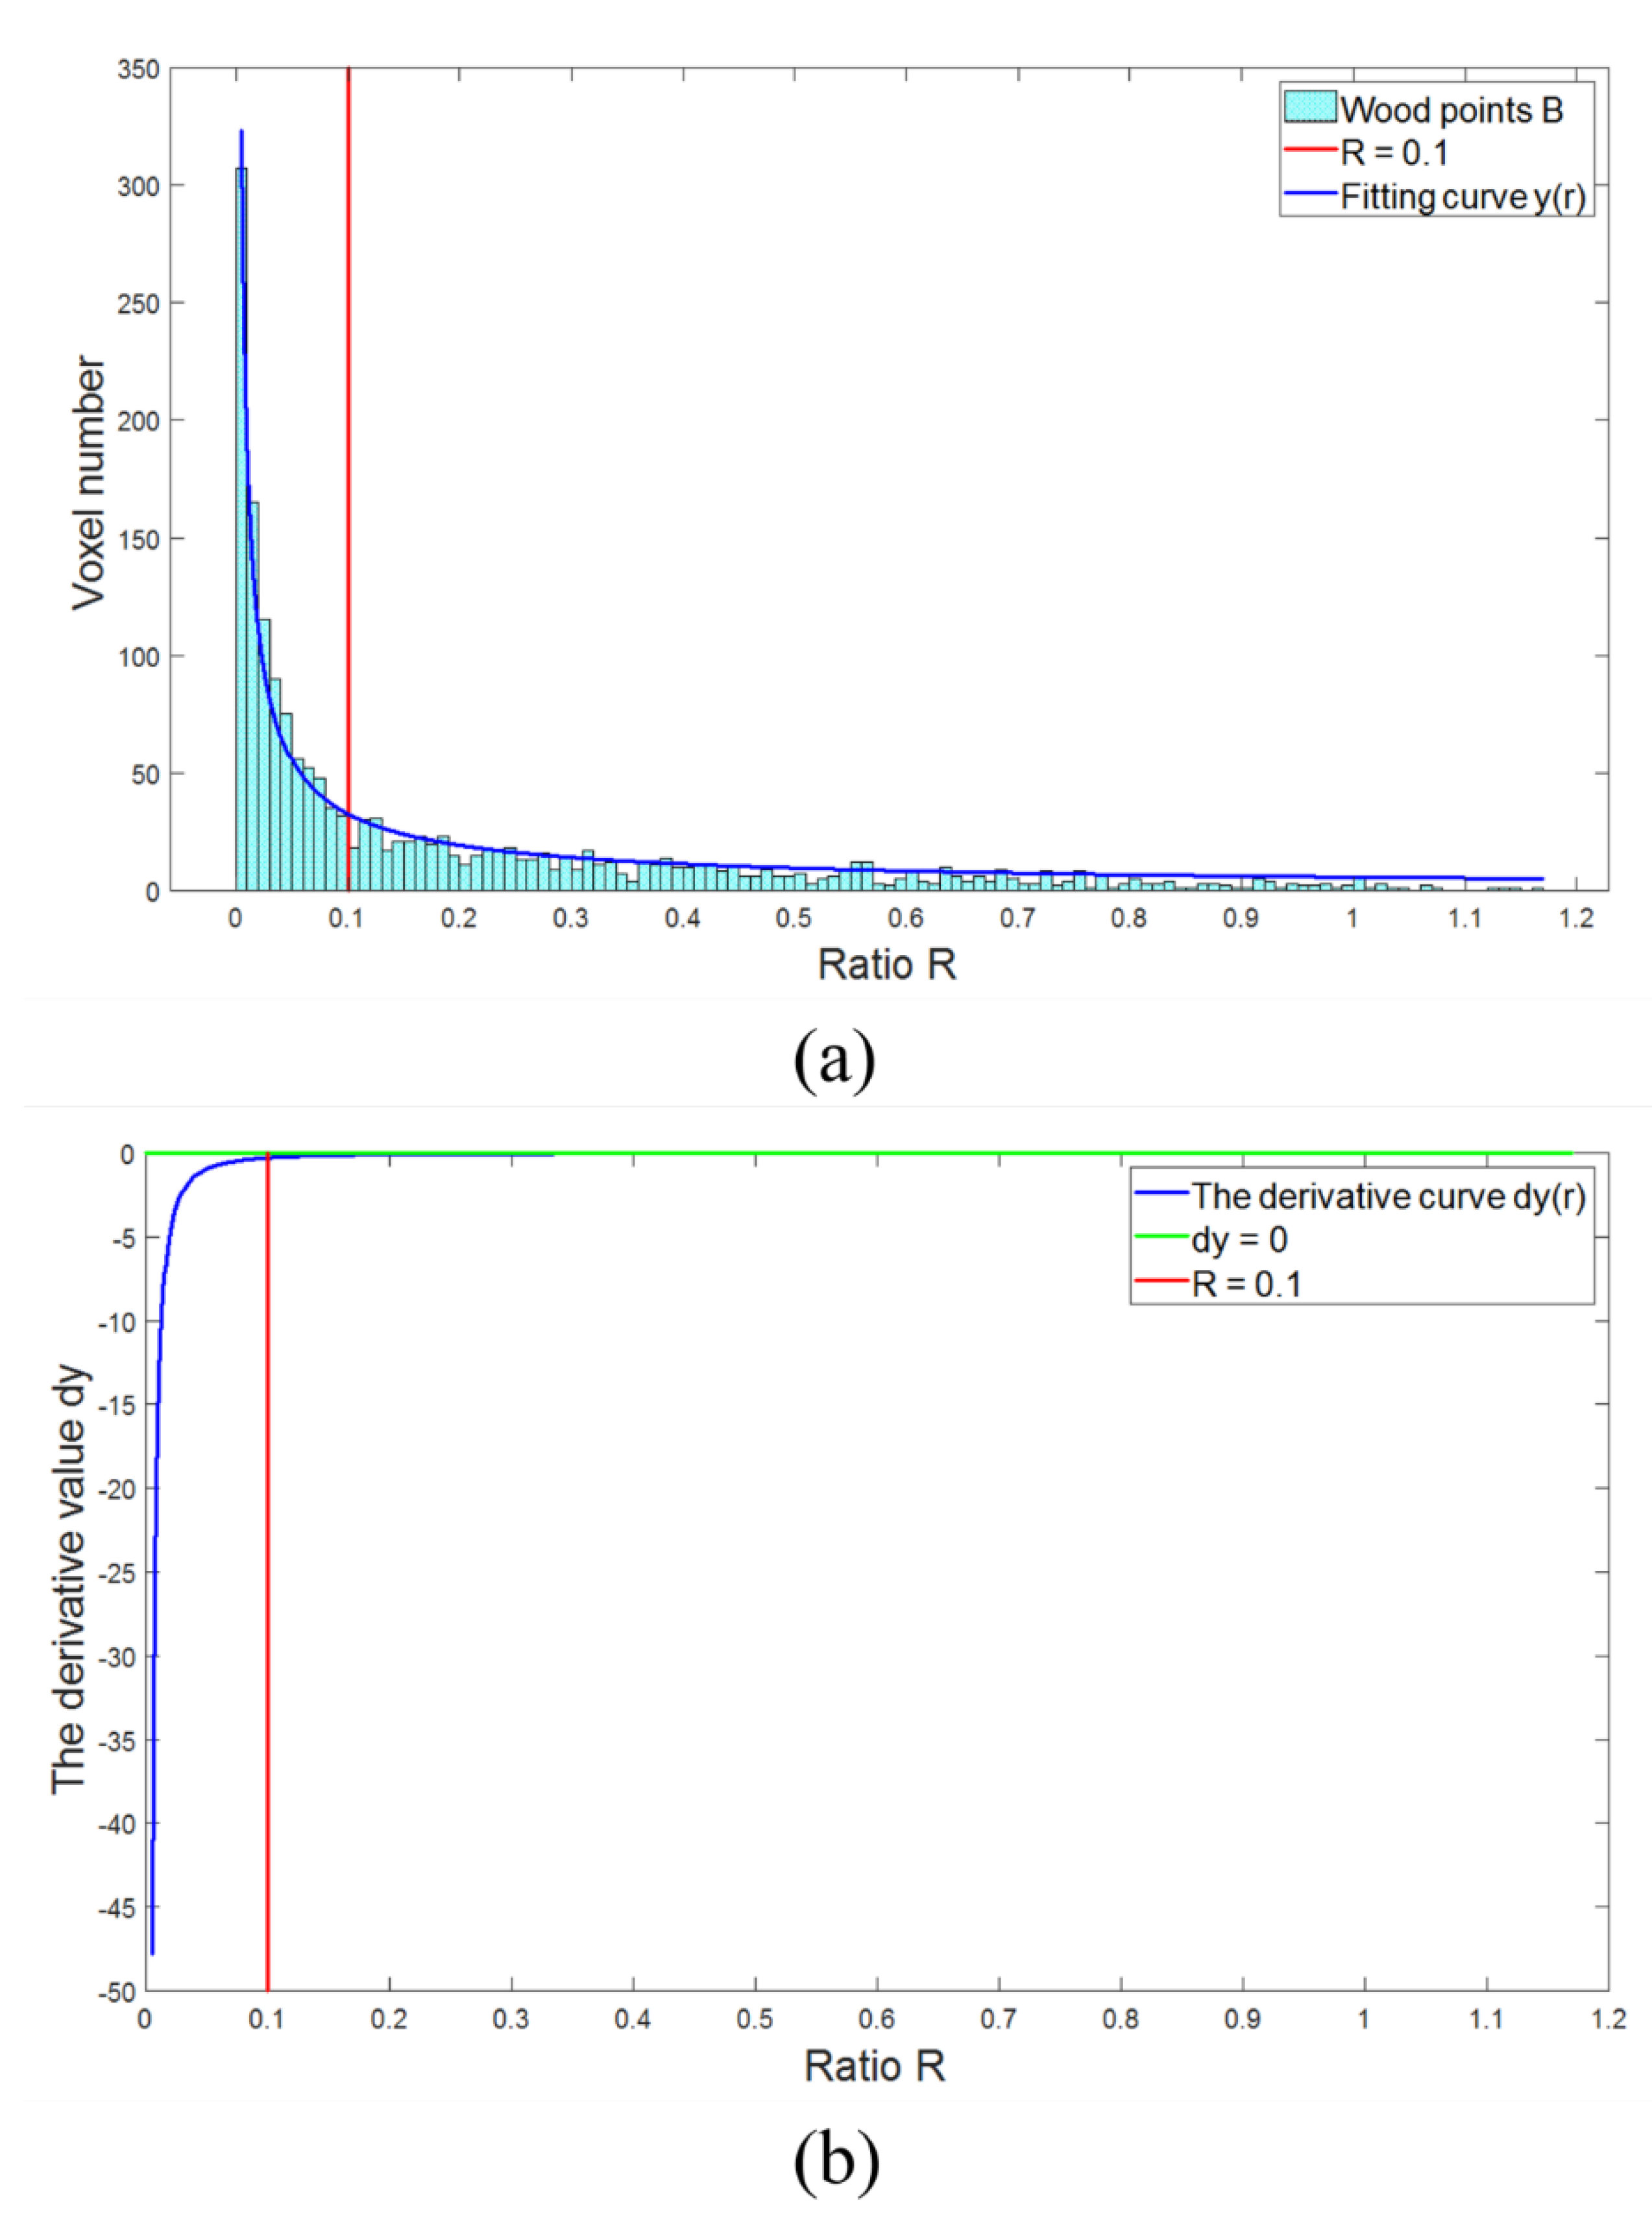
The ratio was smaller for the voxel mainly containing the leaf points, and it was larger for the voxel mainly containing the wood points. Taking tree 5 as an example (Figure 9), when the ratios of all voxels in wood points B were calculated, the histogram fitting curve (blue line in Figure 9a) and the derivative curve (blue line in Figure 9b) of the fitting curve were calculated. As shown in Figure 9a, the fitting curve exhibited a decreasing trend. The location where the curve changing trend declined significantly was selected as the ratio threshold, which was 0.1 (a red vertical line). As shown in Figure 9b, in this case, the derivative value was almost zero at R = 0.1. Therefore, in our method, it was hypothesized that a voxel is determined as a leaf voxel when the voxel ratio is smaller than 0.1; otherwise, the voxel is still determined as a wood voxel.
Additionally, considering the connectivity of trunks and branches, an isolated voxel would be determined as a leaf voxel even if it has a ratio greater than 0.1. Additionally, all points in the leaf voxel were classified into leaf points. Next, the wood points C and the leaf points C were obtained.

2.2.4. Wood Point Verification

After the above-mentioned three-step classification operation, as many leaf points as possible had been found. The leaf points D category was now composed of leaf points A, leaf points B, and leaf points C. However, a few wood points had been misclassified in the process.
To further improve the classification accuracy, the voxel space constructed in the previous section was also used to verify the misclassified wood points. For most experimental tree point clouds, there are generally fewer leaves in the lower part of the tree, and more in the upper part, which generally clustered close around the trunk. Therefore, different processing procedures were used for the two parts.
First, below one-third of the total tree height, the 3 × 3 voxel neighbors surrounding a wood voxel in the same voxel layer were checked. The neighbor voxel was determined as a new wood voxel if there were some points in it. The same process was repeated for new wood voxels until no more could be found.
Second, above one-third of the total tree height, another procedure was followed to process the points. The 3 × 3 × 3 neighbor voxels of a wood voxel were checked.
There were two different cases of misclassified wood points. First, some wood points were misclassified because their intensity values were smaller than the intensity threshold, I t . Second, some points were far away from real wood points, even though their intensity values were larger than I t . To improve the two above cases, two variables, s d 1 and s d 2 , were introduced as the distance ratios. Among them, s d 1 was used to process the first case, and s d 2 was used to process the second case. In our method, s d 1 was 2 and s d 2 was 6.
(1)
The S s value of each wood point in the voxels was calculated according to Equation (2);
(2)
The distance d u between each wood point and leaf point in the voxels was calculated;
(3)
Then, the new wood point was determined according to the following formula:
{ d u s d 1 S s                                 ( a ) d u s d 2   S s     &    P i   I t             ( b )
where P i is the intensity value of each leaf point. If a leaf point meets condition (a) or condition (b), the leaf point will be determined as a new wood point.
(4)
Check each leaf point in the neighbor voxels to complete the new wood point verification;
(5)
These new wood points were subjected to the above process until no more new wood points were found.

3. Results

3.1. Classification Results

Taking tree 5 as an example, the total process of wood–leaf classification is demonstrated in Figure 10, and the point count of each stage is recorded in Table 3, corresponding to the outline shown in Figure 3. It is clear that the points were gradually classified into wood points and leaf points by using the three-step classification method, and they were improved by using the wood point verification technique.
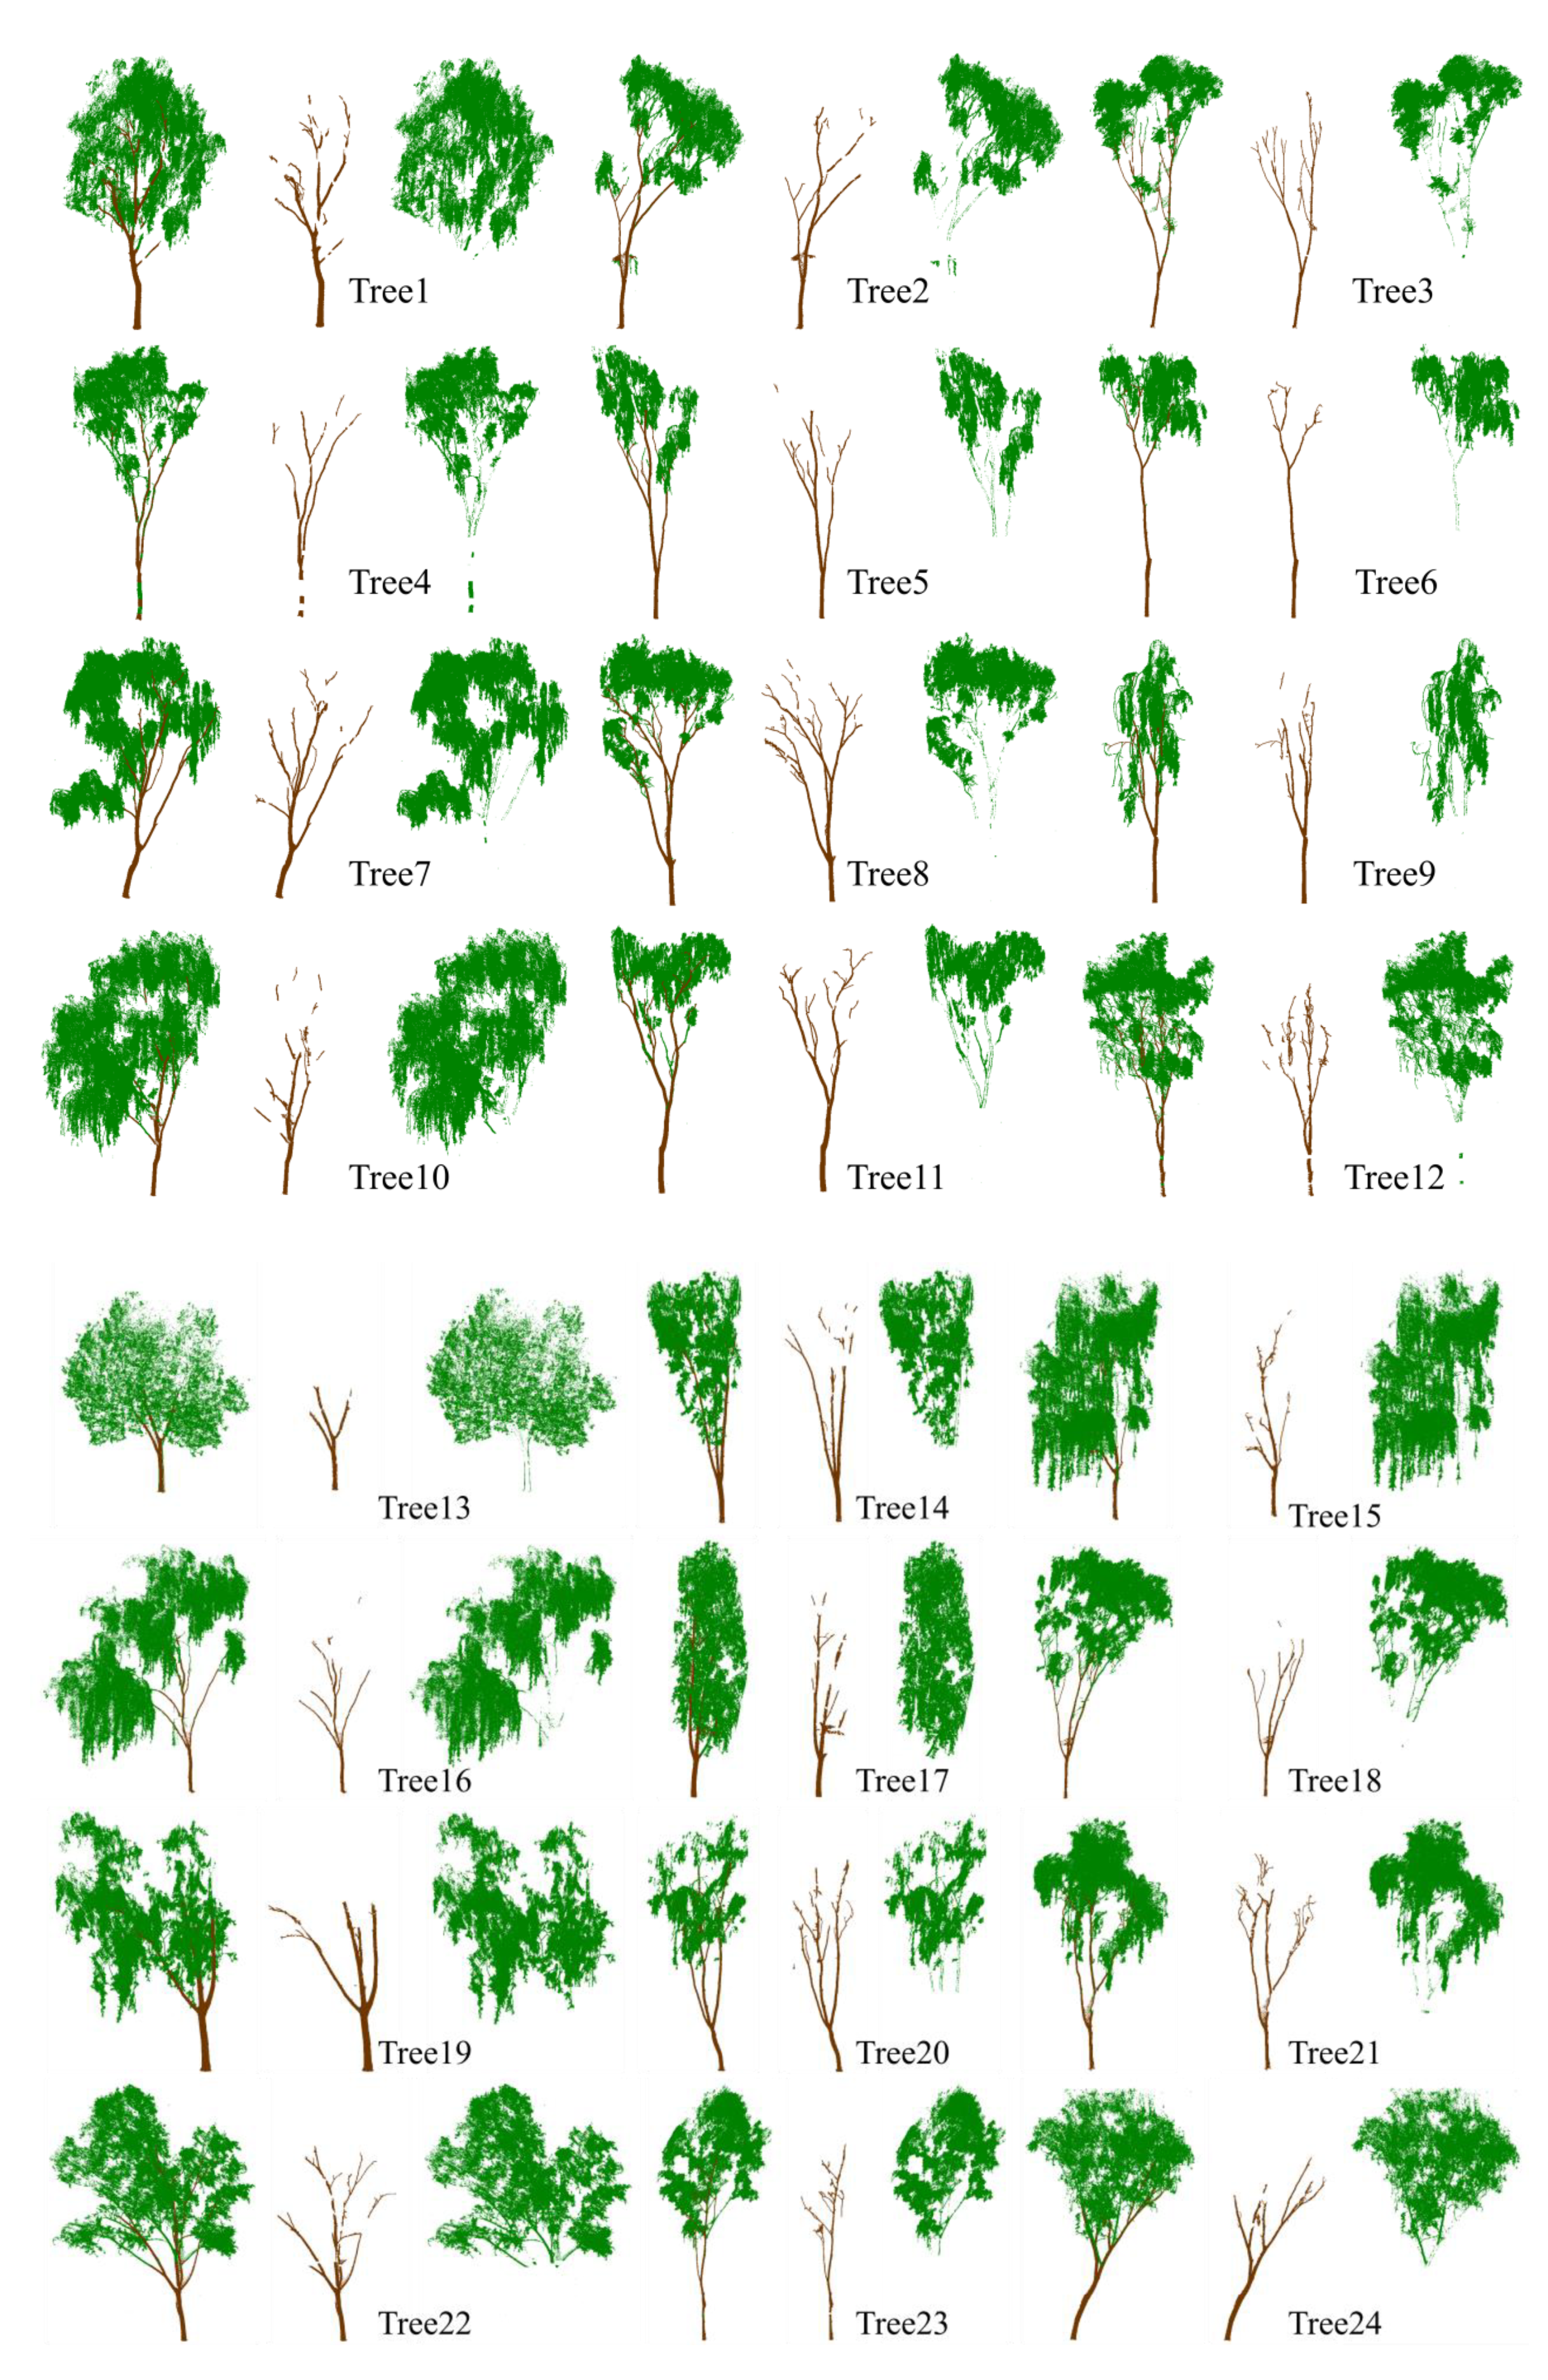
All 24 tree point clouds were processed in the experiment. The classified wood points and leaf points of each tree are displayed in Figure 11. The wood points are colored in brown, and the leaf points are colored in green. Demonstrably, the classification process performed well on most of the tree point cloud.
The total points of each tree are listed in Table 4. As mentioned in the experimental data section, the manual classification results of all the trees were used as the standards. Additionally, the numbers of wood points and leaf points in the standard results are listed in Table 4. Furthermore, the numbers of classified wood points and leaf points are also provided, including the number of true points and false points of each category.

3.2. Accuracy and Efficiency Analysis

Based on the results listed above, three indicators were used to assess the classification accuracy by comparing them with the standard results. N is the total number of tree points, as follows:
N = T P + F P + T N + F N
Among them, TP indicates the number of correctly classified leaf points, TN indicates the number of successfully marked wood points, FP means the number of wood points that were incorrectly classified as leaf points, and FN describes the number of leaf points that were incorrectly recognized as wood points.
The first indicator was OA, which ranged from 0 to 1 and represented the probability that the overall classification was correct. It was calculated using Equation (8). However, OA did not perform very well when the dataset was unbalanced.
O A = T P + T N N
The second indicator was Kappa, which is often used for consistency testing and can also be used to assess the effect of classification. For better performance in evaluating the classification of unbalanced datasets, the Kappa coefficient is widely used for the evaluation of classification accuracy. The calculation result of the Kappa coefficient ranges from -1 to 1, but usually it falls between 0 and 1. Additionally, the Kappa coefficient can be given by:
K a p p a = P o P e 1 P o  
where   P o = T P + T N N and P e = ( T P + F P ) × ( T P + F N ) + ( T N + F N ) × ( T N + F P ) N × N
The third indicator was MCC [50], which is similar to the Kappa coefficient and is also often used to measure the classification accuracy. MCC values range from -1 to 1, where 1 means perfect prediction, 0 means no better than a random prediction, and -1 means complete inconsistency between the prediction and observation. MCC can be calculated as follows:
M C C = T P × T N F P × F N ( T P + F P ) × ( T P + F N ) × ( T N + F N ) × ( T N + F P )
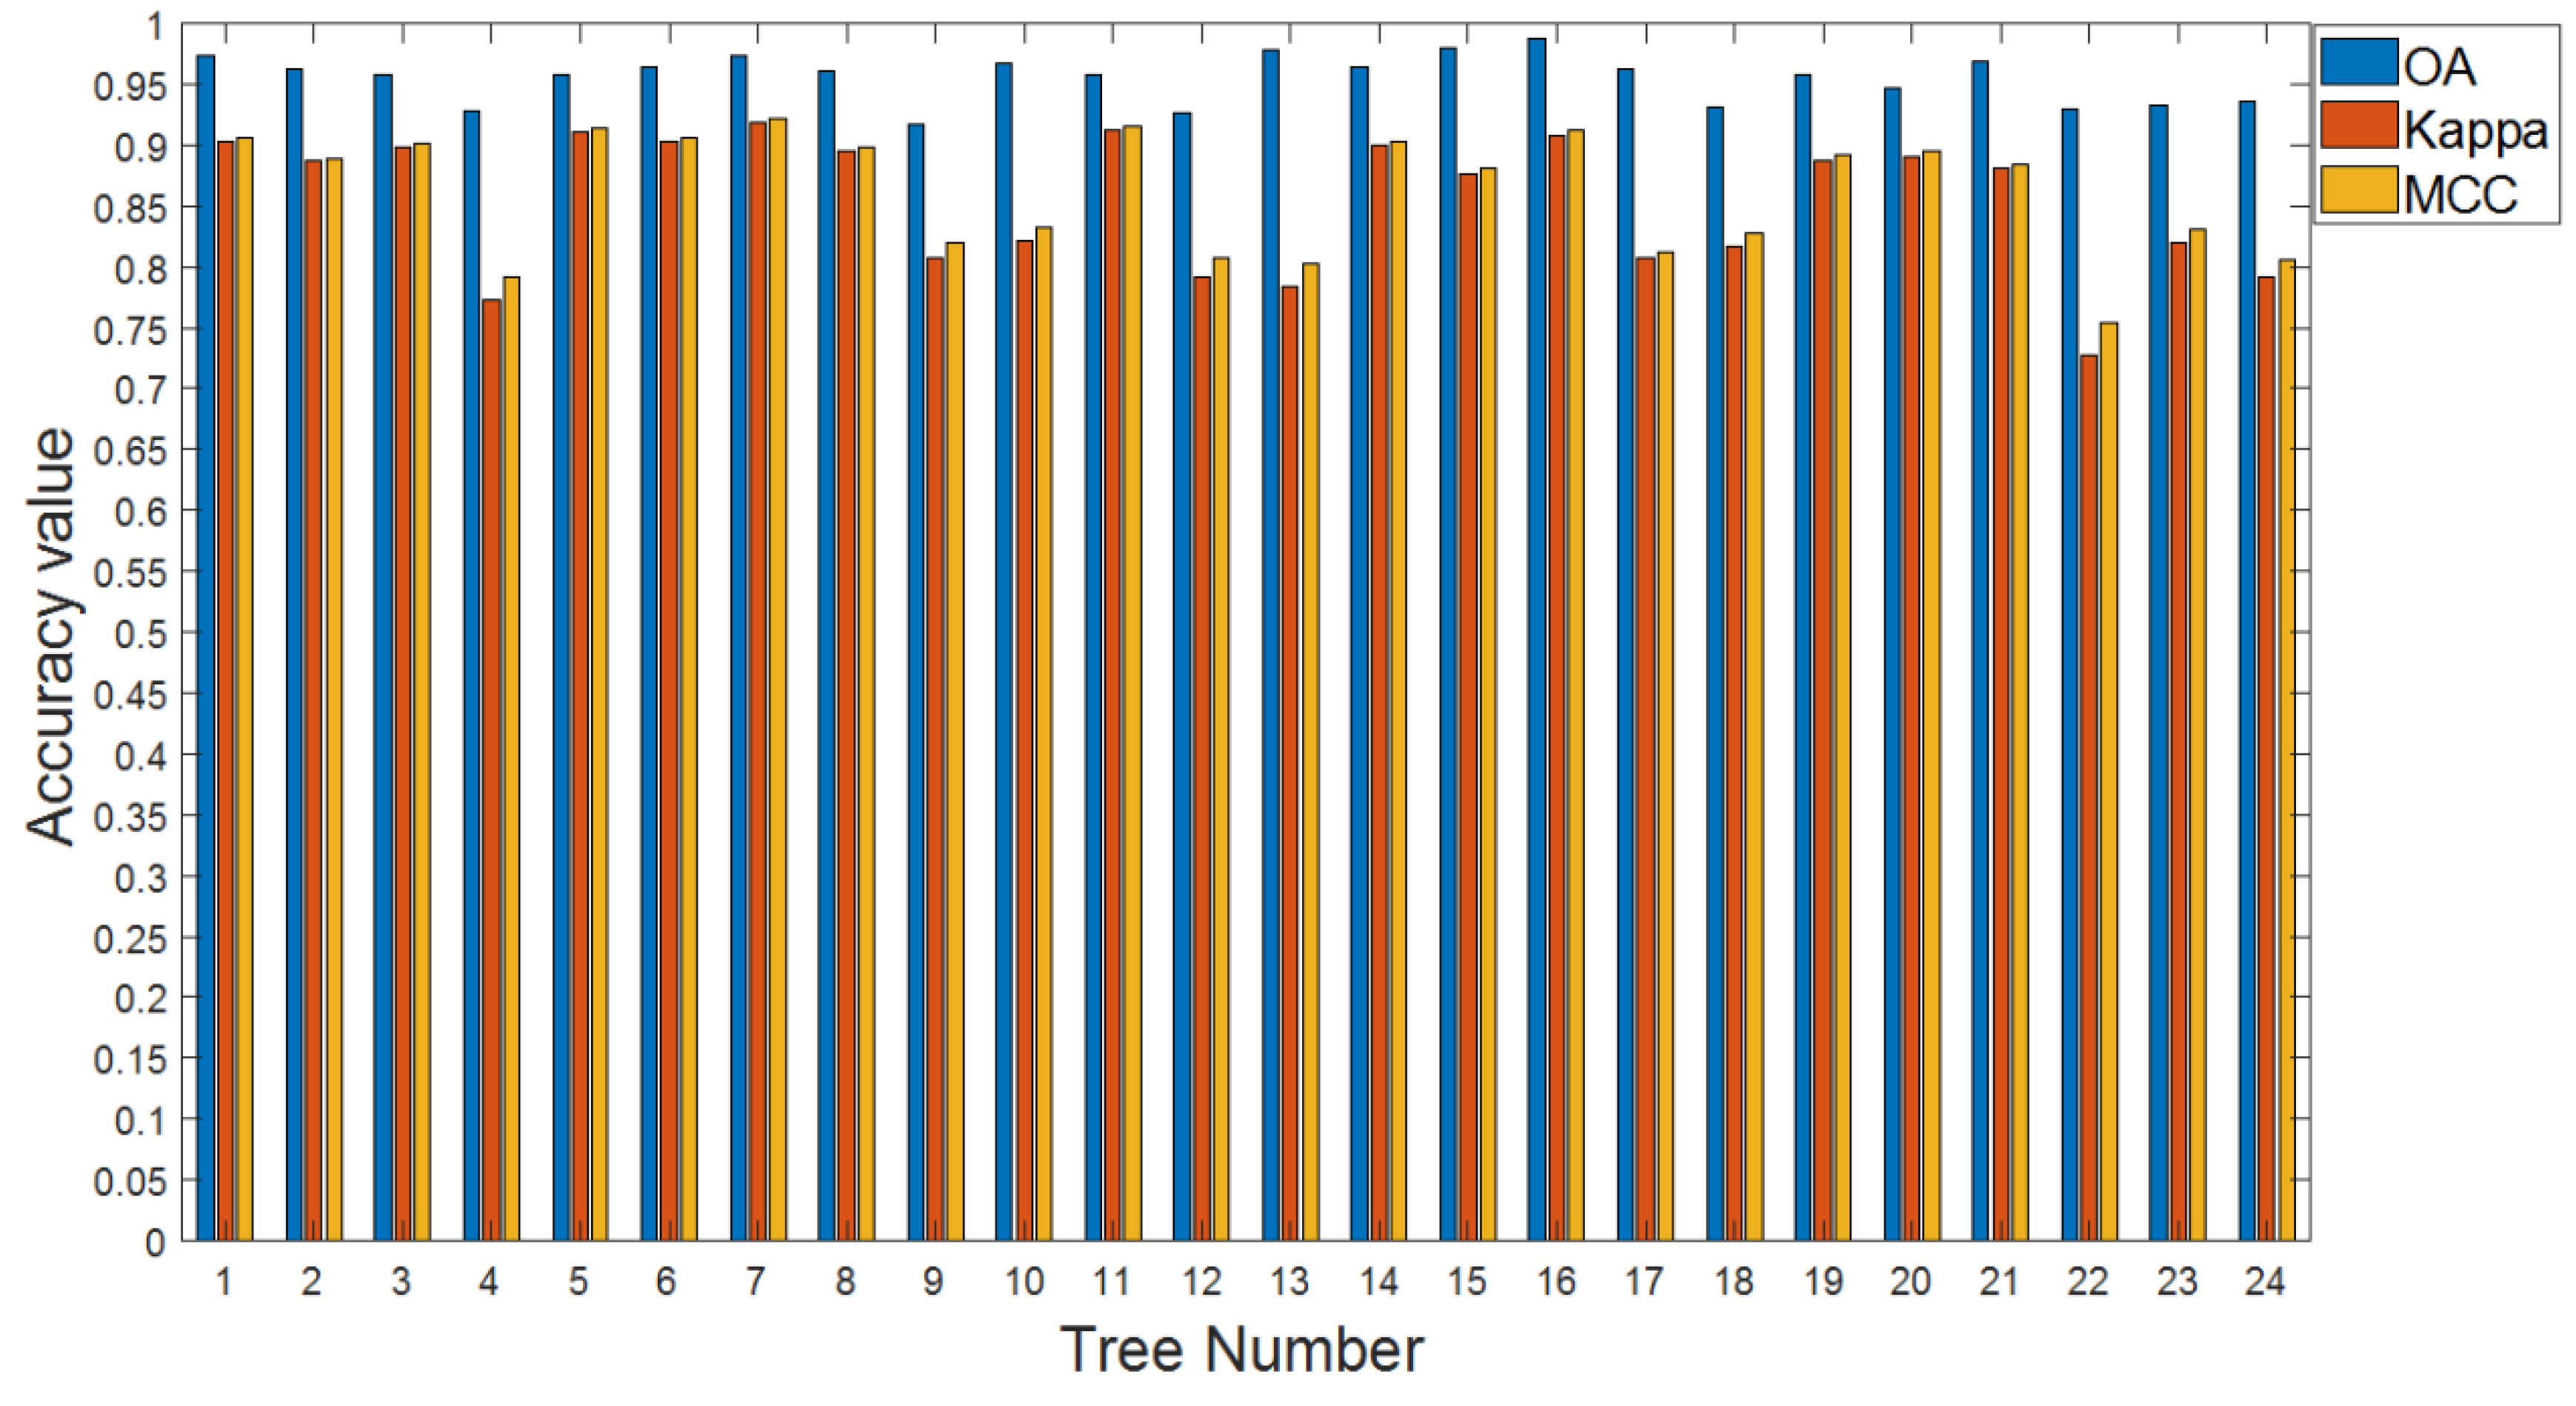
Both MCC and Kappa can be used to evaluate the classification accuracy of unbalanced datasets, although some researchers believe that MCC is better than the Kappa coefficient [51]. Therefore, both indicators were used to analyze the results. All three indicators of each tree were calculated and are listed in Table 5. As shown, the OA values of all 24 trees are very high, ranging from 0.9167 to 0.9872, and the average OA value was 0.9550; the Kappa coefficients ranged from 0.7276 to 0.9191, and the average value was 0.8547; the MCC values ranged from 0.7544 to 0.9211, and the average value was 0.8627. In Table 5, there is almost no difference between Kappa and MCC values.
The OA, Kappa, and MCC values of each tree are also plotted in Figure 12. Clearly, the overall classification accuracy evaluation given by OA is higher than that given by Kappa and MCC. The plotted Kappa and MCC values are almost the same. The OA values of trees 4, 12, 13, 22, and 24 are larger than 0.9, although their Kappa values are smaller than 0.8.
In terms of processing speed analysis, the time cost of each tree is reported in Table 5. Due to the different numbers of tree points, the time costs per million points were also calculated and are detailed in Table 5. Generally, the more points that exist, the more time the processing takes. As shown, most tree point clouds with fewer than two million points can be classified in 2 s. Some trees take slightly longer to calculate, considering the number of points. The time costs of each tree are shown in Figure 13; a curve has been fitted based on the number of tree points.

4. Discussion

In terms of classification accuracy, as mentioned above, our method exhibited a good accuracy performance on the experimental dataset. Some reported classification results also performed well on their experimental dataset. Tao et al. processed three trees, including two real trees and one simulation tree, and the corresponding Kappa coefficients were 0.79, 0.80, and 0.89, respectively [37]. Yun et al. treated five trees, and the OA values ranged from 0.8913 to 0.9349 [42]. Zhu et al. processed ten trees and achieved an average OA value of 0.844 and an average Kappa value of 0.75 [43]. Ferrara et al. processed seven cork oak trees; the OA values varied from 0.95 to 0.98, the MCC values ranged from 0.76 to 0.88, and the Kappa coefficients ranged from 0.75 to 0.88 [39]. Vicari et al. processed a total of ten filed tree point clouds, with OA values ranging from 0.85 to 0.93 and Kappa coefficients ranging from 0.48 to 0.81 [44]. Krishna Moorthy et al. processed nine filed tree data, with classification accuracy ranging from 0.79 to 0.92 and an average accuracy of 0.876 [47]. Liu et al. processed ten trees, and the OA values ranged from 0.8961 to 0.9590, the Kappa coefficients varied from 0.7381 to 0.8755, and the average OA value and Kappa coefficient were 0.9305 and 0.7904, respectively [46]. Wang et al. processed 61 tropical trees, and the overall classification accuracy was 0.91±0.03 on average [41]. Using the same dataset as the reference article [41], Morel et al. processed 35 trees and used another indicator, IoU (Intersection over Union), to evaluate the classification accuracy, which ranged from 0.85 to 0.97 [48]. Morel et al. believed that manual classification results should not be used as standard results due to the lack of precise ground truth. Most of the methods reported above cannot be compared directly because of the use of different experimental datasets. Therefore, the reported classification accuracies can only be used as references.
In terms of efficiency, our method reduced the time cost due to automated processing; the classification efficiency was reported in references [41,44]. As reported, an average of 90 s was needed to process each million points by using Di Wang’s method. Additionally, Vicari established that the average processing time of each tree was 10 minutes, without mentioning the number of points. As shown in Table 5, we calculated the time cost of each tree in the experiment. The time cost of 24 trees ranged from 0.506 s to 12.753 s, and the average processing time was 1.4 s per million points. The efficiency of our method was better than the two other reported methods.
As shown in Figure 11 and Table 5, some trees exhibited good OA, Kappa, and MCC values, such as tree 3, tree 5, tree 11, and tree 16. However, some small twigs were classified as leaves. Even if there are misclassified twigs, the reduction in classification accuracy is small because of the small number of points. According to the proposed rules of our method, these twigs are closer to the leaf points in terms of intensity value and spatial distribution. This would be the goal of future work for improving our method, although it may only make a small contribution to enhance the classification accuracy.
Some trees, such as tree 4, tree 12, tree 13, tree 22, and tree 24, had OA values larger than 0.9, but the Kappa values were smaller than 0.8. To analyze the reasons, the intensity distributions of manual classified wood points and leaf points of each tree were plotted, as shown in Figure 14, in which the red line represents the adaptive threshold. Clearly, the number of leaf points is much greater than the number of wood points. Additionally, some threshold values are accurate and some are not, which means that a random sampling strategy cannot accurately reflect the intensity distribution when the numbers of leaf points and wood points differ greatly. Meanwhile, overlapping areas account for a large proportion of wood points, and the threshold is close to the peak intensity distribution of wood points. We believe that disparities in the numbers of wood and leaf points, as well as the threshold of deviation, lead to worse intensity classifications, which are initially used to separate most points. Thus, our method did not exhibit a good performance in categorizing these tree point clouds.
In terms of the robustness of different tree species, to better evaluate the performance of the proposed method, we also carried out an additional experiment using two Fraxinus pennsylvanica trees located on the campus of Beijing Forestry University. The distances between the scanner and the two trees were 18.65 m and 22.24 m. The classification results of the two Fraxinus pennsylvanica trees are shown in Figure 15, Table 6 and Table 7. The Kappa values of the two Fraxinus pennsylvanica trees were 0.7529 and 0.8725. The time costs of the two trees were about 3.4 s and 2.2 s. The results for these two trees were generally consistent with the performance of the previous 24 trees.
Whether willow trees (Salix babylonica Linn and Salix matsudana Koidz) or Fraxinus pennsylvanica trees, they are all deciduous trees. Considering coniferous trees, wood–leaf classification based on tree point clouds is very challenging [41,52]. The needle leaves and branches of coniferous trees are often smaller and denser than those of deciduous trees, which results in closer spatial distances and similar point densities for coniferous tree leaves and branches. This situation absolutely increases the difficulty of wood–leaf classification. Therefore, more observations, analyses, and discussions need to be carried out to improve our understanding of coniferous tree wood–leaf classification, especially concerning some key related issues, such as the impacts of leaf style, beam width, and point density.
In terms of intensity, thresholds may differ due to different types of scanners that perform differently in the adaptive process on threshold selection. The points of first return are the most numerous, and the points of other returns are only a small proportion that are mostly distributed at the edges of leaves and trunk; therefore, our method is not sensitive to the multi-return characteristic of RIEGL VZ-400. Meanwhile, the near-infrared laser used by RIEGL VZ-400 performs differently due to the different water contents of leaves and woody parts, which help to make the intensities of leaf points and wood points different and separable.
Overall, although automation, high accuracy, and high speed have been shown in our study, more tree species and more types of scanners should be studied and validated to improve our method in the future.

5. Conclusions

This paper has proposed an automated wood–leaf classification method for tree point clouds using intensity information and geometric spatial information. The experiment showed that our method is automated, accurate, and high-speed. Even though the accuracy will decrease when classifying some tree point clouds with special characteristics as analyzed in the discussion, the classification accuracy is still acceptable. The proposed method has good practical value and prospects in many forest inventory applications. In future work, more tree species should be tested to improve the procedure and robustness of the method.

Author Contributions

Conceptualization, J.S. and P.W.; Data curation, Z.G., Z.L. (Zichu Liu), Y.L., X.G. and Z.L. (Zhongnan Liu); Investigation, J.S. and P.W.; Methodology, J.S. and P.W.; Software, J.S.; Supervision, P.W.; Validation, J.S.; Writing—original draft, J.S.; Writing—review & editing, P.W. All authors have read and agreed to the published version of the manuscript.

Funding

This research was funded by the Fundamental Research Funds for the Central Universities (No.2021ZY92).

Data Availability Statement

The data presented in this study are available on request from the corresponding author. The data are not publicly available due to privacy restrictions.

Acknowledgments

The authors thank the editors and reviewers for their beneficial comments and suggestions.

Conflicts of Interest

The authors declare no conflict of interest.

References

  1. Lindenmayer, D.B.; Laurance, W.F.; Franklin, J.F.; Likens, G.E.; Banks, S.C.; Blanchard, W.; Gibbons, P.; Ikin, K.; Blair, D.; McBurney, L.; et al. New Policies for Old Trees: Averting a Global Crisis in a Keystone Ecological Structure: Rapid Loss of Large Old Trees. Conserv. Lett. 2014, 7, 61–69. [Google Scholar] [CrossRef]
  2. Food and Agriculture Organization of the United Nations. Global Forest Resources Assessment 2005: Progress towards Sustainable Forest Management; FAO forestry paper 147; Food and Agriculture Organization of the United Nations: Rome, Italy, 2006; ISBN 978-92-5-105481-9. [Google Scholar]
  3. Sohngen, B. An Analysis of Forestry Carbon Sequestration as a Response to Climate Change; Copenhagen Consensus Center: Frederiksberg, Denmark, 2009. [Google Scholar]
  4. Mizanur Rahman, M.; Nabiul Islam Khan, M.; Fazlul Hoque, A.K.; Ahmed, I. Carbon stock in the Sundarbans mangrove forest: Spatial variations in vegetation types and salinity zones. Wetl. Ecol. Manag. 2015, 23, 269–283. [Google Scholar] [CrossRef]
  5. Ross, M.S.; Ruiz, P.L.; Telesnicki, G.J.; Meeder, J.F. Estimating Above-Ground Biomass and Production in Mangrove Communities of Biscayne National Park, Florida (USA). Wetl. Ecol. Manag. 2001, 9, 27–37. [Google Scholar] [CrossRef]
  6. van Leeuwen, M.; Nieuwenhuis, M. Retrieval of Forest Structural Parameters Using LiDAR Remote Sensing. Eur. J. Forest Res. 2010, 129, 749–770. [Google Scholar] [CrossRef]
  7. Popescu, S.C. Estimating Biomass of Individual Pine Trees Using Airborne Lidar. Biomass Bioenergy 2007, 31, 646–655. [Google Scholar] [CrossRef]
  8. Lin, Y.; Herold, M. Tree Species Classification Based on Explicit Tree Structure Feature Parameters Derived from Static Terrestrial Laser Scanning Data. Agric. For. Meteorol. 2016, 216, 105–114. [Google Scholar] [CrossRef]
  9. Terryn, L.; Calders, K.; Disney, M.; Origo, N.; Malhi, Y.; Newnham, G.; Raumonen, P.; Å kerblom, M.; Verbeeck, H. Tree Species Classification Using Structural Features Derived from Terrestrial Laser Scanning. ISPRS J. Photogramm. Remote. Sens. 2020, 168, 170–181. [Google Scholar] [CrossRef]
  10. Calders, K.; Newnham, G.; Burt, A.; Murphy, S.; Raumonen, P.; Herold, M.; Culvenor, D.; Avitabile, V.; Disney, M.; Armston, J.; et al. Nondestructive Estimates of Above-ground Biomass Using Terrestrial Laser Scanning. Methods Ecol. Evol. 2015, 6, 198–208. [Google Scholar] [CrossRef]
  11. Means, J.E.; Acker, S.A.; Renslow, M.; Emerson, L.; Hendrix, C.J. Predicting Forest Stand Characteristics with Airborne Scanning Lidar. Photogramm. Eng. Remote Sens. 2000, 66, 1367–1372. [Google Scholar]
  12. Asner, G.P.; Powell, G.V.N.; Mascaro, J.; Knapp, D.E.; Clark, J.K.; Jacobson, J.; Kennedy-Bowdoin, T.; Balaji, A.; Paez-Acosta, G.; Victoria, E.; et al. High-Resolution Forest Carbon Stocks and Emissions in the Amazon. Proc. Natl. Acad. Sci. USA 2010, 107, 16738–16742. [Google Scholar] [CrossRef] [Green Version]
  13. Palace, M.; Sullivan, F.B.; Ducey, M.; Herrick, C. Estimating Tropical Forest Structure Using a Terrestrial Lidar. PLoS ONE 2016, 11, e0154115. [Google Scholar] [CrossRef] [PubMed]
  14. Hosoi, F.; Nakai, Y.; Omasa, K. Estimation and Error Analysis of Woody Canopy Leaf Area Density Profiles Using 3-D Airborne and Ground-Based Scanning Lidar Remote-Sensing Techniques. IEEE Trans. Geosci. Remote Sens. 2010, 48, 9. [Google Scholar] [CrossRef]
  15. Zheng, G.; Moskal, L.M.; Kim, S.-H. Retrieval of Effective Leaf Area Index in Heterogeneous Forests with Terrestrial Laser Scanning. IEEE Trans. Geosci. Remote Sens. 2013, 51, 777–786. [Google Scholar] [CrossRef]
  16. Olsoy, P.J.; Mitchell, J.J.; Levia, D.F.; Clark, P.E.; Glenn, N.F. Estimation of Big Sagebrush Leaf Area Index with Terrestrial Laser Scanning. Ecol. Indic. 2016, 61, 815–821. [Google Scholar] [CrossRef]
  17. Béland, M.; Widlowski, J.-L.; Fournier, R.A. A Model for Deriving Voxel-Level Tree Leaf Area Density Estimates from Ground-Based LiDAR. Environ. Model Softw. 2014, 51, 184–189. [Google Scholar] [CrossRef]
  18. Béland, M.; Baldocchi, D.D.; Widlowski, J.-L.; Fournier, R.A.; Verstraete, M.M. On Seeing the Wood from the Leaves and the Role of Voxel Size in Determining Leaf Area Distribution of Forests with Terrestrial LiDAR. Agric. For. Meteorol. 2014, 184, 82–97. [Google Scholar] [CrossRef]
  19. Kong, F.; Yan, W.; Zheng, G.; Yin, H.; Cavan, G.; Zhan, W.; Zhang, N.; Cheng, L. Retrieval of Three-Dimensional Tree Canopy and Shade Using Terrestrial Laser Scanning (TLS) Data to Analyze the Cooling Effect of Vegetation. Agric. For. Meteorol. 2016, 217, 22–34. [Google Scholar] [CrossRef]
  20. Xu, W.; Su, Z.; Feng, Z.; Xu, H.; Jiao, Y.; Yan, F. Comparison of Conventional Measurement and LiDAR-Based Measurement for Crown Structures. Comput. Electron. Agric. 2013, 98, 242–251. [Google Scholar] [CrossRef]
  21. Oveland, I.; Hauglin, M.; Gobakken, T.; Næsset, E.; Maalen-Johansen, I. Automatic Estimation of Tree Position and Stem Diameter Using a Moving Terrestrial Laser Scanner. Remote Sens. 2017, 9, 350. [Google Scholar] [CrossRef] [Green Version]
  22. Hauglin, M.; Astrup, R.; Gobakken, T.; Næsset, E. Estimating Single-Tree Branch Biomass of Norway Spruce with Terrestrial Laser Scanning Using Voxel-Based and Crown Dimension Features. Scand. J. For. Res. 2013, 28, 456–469. [Google Scholar] [CrossRef]
  23. Yu, X.; Liang, X.; Hyyppä, J.; Kankare, V.; Vastaranta, M.; Holopainen, M. Stem Biomass Estimation Based on Stem Reconstruction from Terrestrial Laser Scanning Point Clouds. Remote Sens. Lett. 2013, 4, 344–353. [Google Scholar] [CrossRef]
  24. McHale, M.R. Volume Estimates of Trees with Complex Architecture from Terrestrial Laser Scanning. J. Appl. Remote Sens. 2008, 2, 023521. [Google Scholar] [CrossRef]
  25. Saarinen, N.; Kankare, V.; Vastaranta, M.; Luoma, V.; Pyörälä, J.; Tanhuanpää, T.; Liang, X.; Kaartinen, H.; Kukko, A.; Jaakkola, A.; et al. Feasibility of Terrestrial Laser Scanning for Collecting Stem Volume Information from Single Trees. ISPRS J. Photogramm. Remote Sens. 2017, 123, 140–158. [Google Scholar] [CrossRef]
  26. Liang, X.; Kankare, V.; Yu, X.; Hyyppa, J.; Holopainen, M. Automated Stem Curve Measurement Using Terrestrial Laser Scanning. IEEE Trans. Geosci. Remote Sens. 2014, 52, 1739–1748. [Google Scholar] [CrossRef]
  27. Kelbe, D.; van Aardt, J.; Romanczyk, P.; van Leeuwen, M.; Cawse-Nicholson, K. Single-Scan Stem Reconstruction Using Low-Resolution Terrestrial Laser Scanner Data. IEEE J. Sel. Top. Appl. Earth Obs. Remote Sens. 2015, 8, 3414–3427. [Google Scholar] [CrossRef]
  28. Pueschel, P.; Newnham, G.; Hill, J. Retrieval of Gap Fraction and Effective Plant Area Index from Phase-Shift Terrestrial Laser Scans. Remote Sens. 2014, 6, 2601–2627. [Google Scholar] [CrossRef] [Green Version]
  29. Zheng, G.; Ma, L.; He, W.; Eitel, J.U.H.; Moskal, L.M.; Zhang, Z. Assessing the Contribution of Woody Materials to Forest Angular Gap Fraction and Effective Leaf Area Index Using Terrestrial Laser Scanning Data. IEEE Trans. Geosci. Remote Sens. 2016, 54, 1475–1487. [Google Scholar] [CrossRef]
  30. Ku, N.-W.; Popescu, S.C.; Ansley, R.J.; Perotto-Baldivieso, H.L.; Filippi, A.M. Assessment of Available Rangeland Woody Plant Biomass with a Terrestrial Lidar System. Photogramm. Eng. Remote Sens. 2012, 78, 349–361. [Google Scholar] [CrossRef]
  31. Kankare, V. Individual Tree Biomass Estimation Using Terrestrial Laser Scanning. ISPRS J. Photogramm. Remote Sens. 2013, 75, 64–75. [Google Scholar] [CrossRef]
  32. Béland, M.; Widlowski, J.-L.; Fournier, R.A.; Côté, J.-F.; Verstraete, M.M. Estimating Leaf Area Distribution in Savanna Trees from Terrestrial LiDAR Measurements. Agric. For. Meteorol. 2011, 151, 1252–1266. [Google Scholar] [CrossRef]
  33. Yao, T.; Yang, X.; Zhao, F.; Wang, Z.; Zhang, Q.; Jupp, D.; Lovell, J.; Culvenor, D.; Newnham, G.; Ni-Meister, W.; et al. Measuring Forest Structure and Biomass in New England Forest Stands Using Echidna Ground-Based Lidar. Remote Sens. Environ. 2011, 115, 2965–2974. [Google Scholar] [CrossRef]
  34. Yang, X.; Strahler, A.H.; Schaaf, C.B.; Jupp, D.L.B.; Yao, T.; Zhao, F.; Wang, Z.; Culvenor, D.S.; Newnham, G.J.; Lovell, J.L.; et al. Three-Dimensional Forest Reconstruction and Structural Parameter Retrievals Using a Terrestrial Full-Waveform Lidar Instrument (Echidna ®). Remote Sens. Environ. 2013, 135, 36–51. [Google Scholar] [CrossRef]
  35. Douglas, E.S.; Martel, J.; Li, Z.; Howe, G.; Hewawasam, K.; Marshall, R.A.; Schaaf, C.L.; Cook, T.A.; Newnham, G.J.; Strahler, A.; et al. Finding Leaves in the Forest: The Dual-Wavelength Echidna Lidar. IEEE Geosci. Remote Sens. Lett. 2015, 12, 776–780. [Google Scholar] [CrossRef]
  36. Zhao, X.; Shi, S.; Yang, J.; Gong, W.; Sun, J.; Chen, B.; Guo, K.; Chen, B. Active 3D Imaging of Vegetation Based on Multi-Wavelength Fluorescence LiDAR. Sensors 2020, 20, 935. [Google Scholar] [CrossRef] [Green Version]
  37. Tao, S.; Guo, Q.; Xu, S.; Su, Y.; Li, Y.; Wu, F. A Geometric Method for Wood-Leaf Separation Using Terrestrial and Simulated Lidar Data. Photogram. Eng. Rem. Sens. 2015, 81, 767–776. [Google Scholar] [CrossRef]
  38. Ma, L.; Zheng, G.; Eitel, J.U.H.; Moskal, L.M.; He, W.; Huang, H. Improved Salient Feature-Based Approach for Automatically Separating Photosynthetic and Nonphotosynthetic Components Within Terrestrial Lidar Point Cloud Data of Forest Canopies. IEEE Trans. Geosci. Remote Sens. 2016, 54, 679–696. [Google Scholar] [CrossRef]
  39. Ferrara, R.; Virdis, S.G.P.; Ventura, A.; Ghisu, T.; Duce, P.; Pellizzaro, G. An Automated Approach for Wood-Leaf Separation from Terrestrial LIDAR Point Clouds Using the Density Based Clustering Algorithm DBSCAN. Agric. For. Meteorol. 2018, 262, 434–444. [Google Scholar] [CrossRef]
  40. Xiang, L.; Bao, Y.; Tang, L.; Ortiz, D.; Salas-Fernandez, M.G. Automated Morphological Traits Extraction for Sorghum Plants via 3D Point Cloud Data Analysis. Comput. Electron. Agric. 2019, 162, 951–961. [Google Scholar] [CrossRef]
  41. Wang, D.; Momo Takoudjou, S.; Casella, E. LeWoS: A Universal Leaf-wood Classification Method to Facilitate the 3D Modelling of Large Tropical Trees Using Terrestrial LiDAR. Methods Ecol. Evol. 2020, 11, 376–389. [Google Scholar] [CrossRef]
  42. Yun, T.; An, F.; Li, W.; Sun, Y.; Cao, L.; Xue, L. A Novel Approach for Retrieving Tree Leaf Area from Ground-Based LiDAR. Remote Sens. 2016, 8, 942. [Google Scholar] [CrossRef] [Green Version]
  43. Zhu, X.; Skidmore, A.K.; Darvishzadeh, R.; Niemann, K.O.; Liu, J.; Shi, Y.; Wang, T. Foliar and Woody Materials Discriminated Using Terrestrial LiDAR in a Mixed Natural Forest. Int. J. Appl. Earth Obs. Geoinf. 2018, 64, 43–50. [Google Scholar] [CrossRef]
  44. Vicari, M.B.; Disney, M.; Wilkes, P.; Burt, A.; Calders, K.; Woodgate, W. Leaf and Wood Classification Framework for Terrestrial LiDAR Point Clouds. Methods Ecol. Evol. 2019, 10, 680–694. [Google Scholar] [CrossRef] [Green Version]
  45. Liu, Z.; Zhang, Q.; Wang, P.; Li, Z.; Wang, H. Automated Classification of Stems and Leaves of Potted Plants Based on Point Cloud Data. Biosyst. Eng. 2020, 200, 215–230. [Google Scholar] [CrossRef]
  46. Liu, Z.; Zhang, Q.; Wang, P.; Li, Y.; Sun, J. Automatic Sampling and Training Method for Wood-Leaf Classification Based on Tree Terrestrial Point Cloud. arXiv 2020, arXiv:2012.03152 [cs]. [Google Scholar]
  47. Krishna Moorthy, S.M.; Calders, K.; Vicari, M.B.; Verbeeck, H. Improved Supervised Learning-Based Approach for Leaf and Wood Classification from LiDAR Point Clouds of Forests. IEEE Trans. Geosci. Remote Sens. 2020, 58, 3057–3070. [Google Scholar] [CrossRef] [Green Version]
  48. Morel, J.; Bac, A.; Kanai, T. Segmentation of Unbalanced and In-Homogeneous Point Clouds and Its Application to 3D Scanned Trees. Vis. Comput. 2020, 36, 2419–2431. [Google Scholar] [CrossRef]
  49. Soudarissanane, S.; Lindenbergh, R.; Menenti, M.; Teunissen, P. Scanning Geometry: Influencing Factor on the Quality of Terrestrial Laser Scanning Points. ISPRS J. Photogramm. Remote Sens. 2011, 66, 389–399. [Google Scholar] [CrossRef]
  50. Matthews, B.W. Comparison of the Predicted and Observed Secondary Structure of T4 Phage Lysozyme. Biochim. Biophys. Acta (BBA) -Protein Struct. 1975, 405, 442–451. [Google Scholar] [CrossRef]
  51. Delgado, R.; Tibau, X.-A. Why Cohen’s Kappa Should Be Avoided as Performance Measure in Classification. PLoS ONE 2019, 14, e0222916. [Google Scholar] [CrossRef] [Green Version]
  52. Pfeifer, N.; Gorte, B.; Winterhalder, D. Automatic reconstruction of single trees from terrestrial laser scanner data. In Proceedings of the 20th ISPRS Congress, Istanbul, Turkey, 12–23 July 2004; Volume 35, pp. 114–119. [Google Scholar]
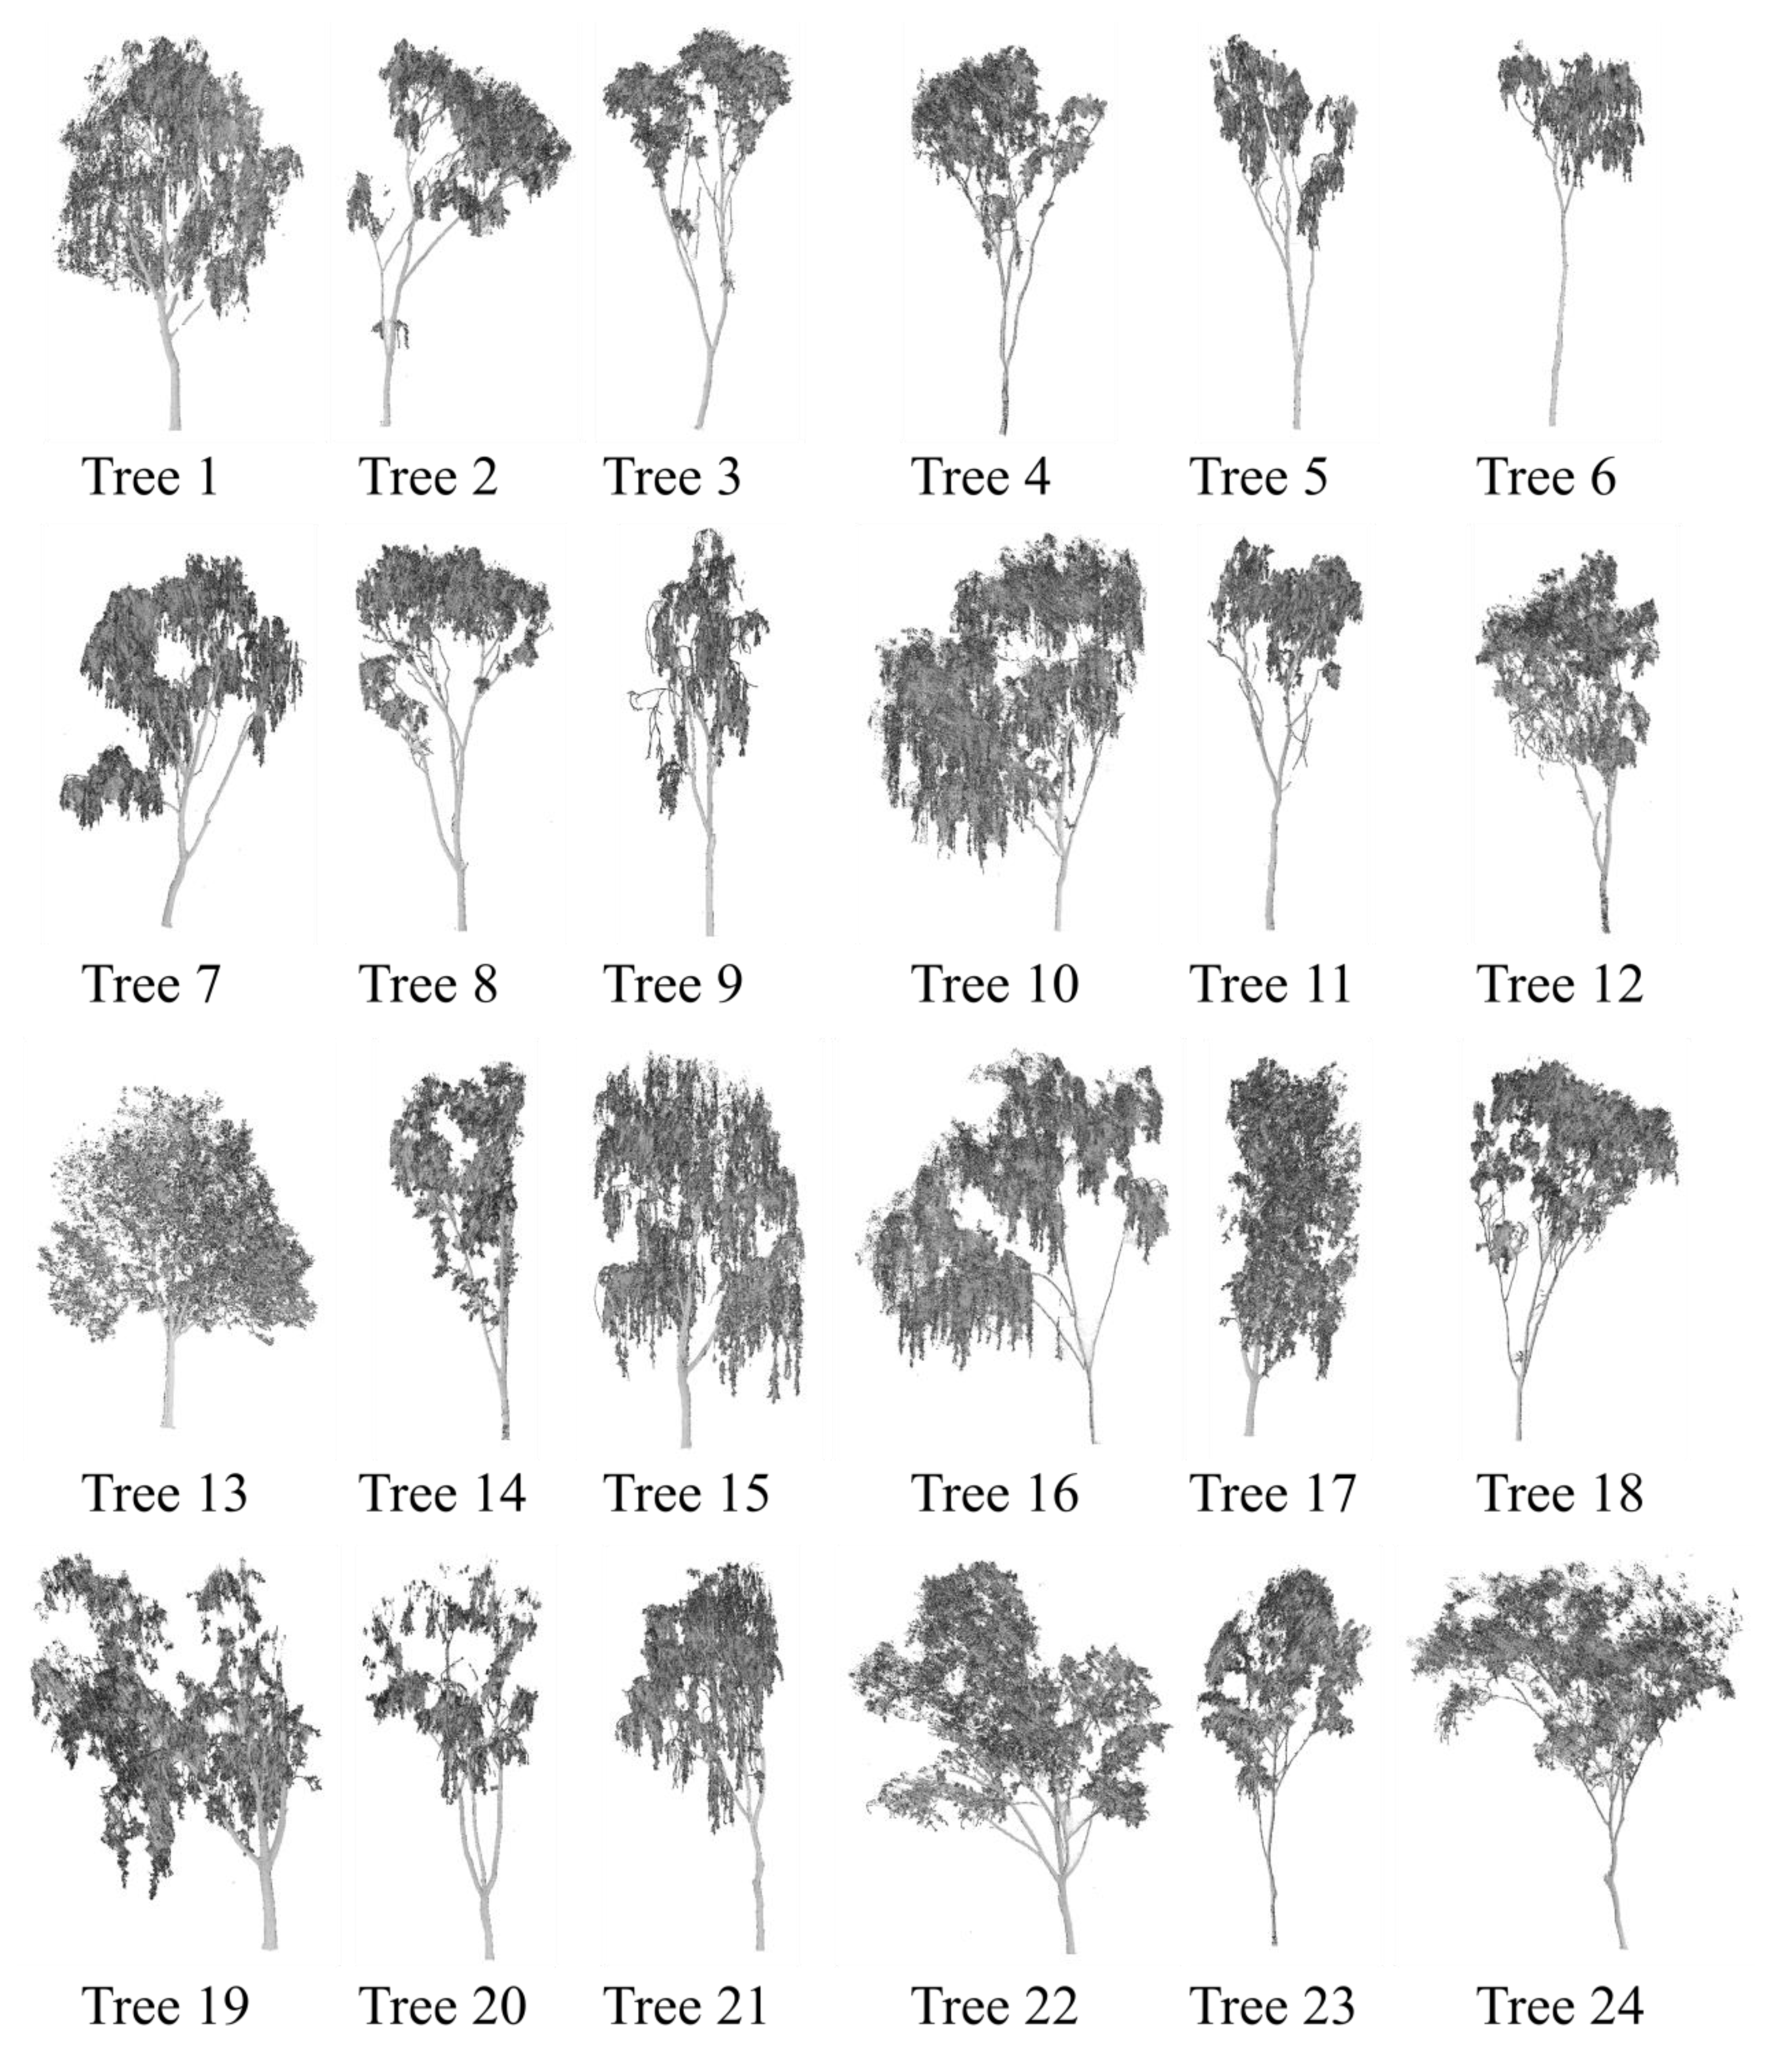
Figure 1. Extracted 24 tree point clouds.
Remotesensing 13 04050 g001
Figure 2. The manual standard classification result of tree 5. Brown: wood points; green: leaf points.
Remotesensing 13 04050 g002
Figure 3. Flowchart of the proposed method.
Remotesensing 13 04050 g003
Figure 4. The spatial details of wood points and leaf points in wood points A. Brown: wood points; green: leaf points.
Remotesensing 13 04050 g004
Figure 5. Histogram of the projection density distribution of randomly sampling spheres based on tree 5. The red line represents ρ 1 4 , and the blue line represents ρ 3 4 .
Remotesensing 13 04050 g005
Figure 6. Display diagram of sampling results of tree 5. Brown: wood points; green: leaf points; blue point: sampled wood points; red point: sampled leaf points.
Remotesensing 13 04050 g006
Figure 7. Demonstration of sampling results and intensity threshold based on tree 5. (a) The sampling results of tree 5. (b) Intensity histograms of the sampling results. Cyan areas and pink areas represent the intensity histograms of the sampled wood and leaf points, respectively. The red line represents the selected adaptive intensity threshold.
Remotesensing 13 04050 g007
Figure 8. The demonstration of the eight nearest neighbors in the neighborhood classification. (a) Red point: target point; yellow point: the point where the d n value is S s ; green point: the point where the d n value is 2 S s . (b) The black point SP represents the position of scanner.
Remotesensing 13 04050 g008
Figure 9. Demonstration of the threshold of voxel ratios. (a) Cyan areas represent the ratio histogram of all voxels of wood points B, the blue line is the fitting curve of histogram, and the red line is ratio R = 1. (b) The blue line is the derivative curve of the fitting curve, the green line means the derivative is 0, and the red line is ratio R = 1.
Remotesensing 13 04050 g009
Figure 10. Schematic diagram of classification process of tree 5.
Remotesensing 13 04050 g010
Figure 11. The demonstration of 24 tree classification results. The wood–leaf classification result of each tree contains three sub-graphs (left: all tree points; middle: classified wood points; right: classified leaf points). Brown: wood points; green: leaf points.
Remotesensing 13 04050 g011
Figure 12. The histogram of OA, Kappa, and MCC of 24 trees’ classification results.
Remotesensing 13 04050 g012
Figure 13. The relationship between the time cost and the number of tree points. The red line is the fitting curve based on the cerulean circles that represent the time cost of each tree.
Remotesensing 13 04050 g013
Figure 14. Display of intensity distributions for manual separation results of five trees and their adaptive intensity thresholds. Cyan areas and pink areas represent the intensity histograms of the sampled wood and leaf points, respectively. The red line represents the selected adaptive intensity threshold.
Remotesensing 13 04050 g014
Figure 15. The wood–leaf classification results of two Fraxinus pennsylvanica trees. The wood–leaf classification result of each tree contains three sub-graphs (left: all tree points; middle: classified wood points; right: classified leaf points). Brown: wood points; green: leaf points.
Remotesensing 13 04050 g015
Table 1. The characteristics of RIEGL VZ-400 scanner.
Technical Parameters
The farthest distance measurement600 m
(Natural object reflectivity ≥ 90%)
The scanning rate (points/second)300000 (emission),
125000 (reception)
The vertical scanning range−40°–60°
The horizontal scanning range0°–360°
Laser divergence0.3 mrad
The scanning accuracy3 mm (single measurement),
2 mm (multiple measurements)
The angular resolutionBetter than 0.0005°
(in both vertical and horizontal directions)
Table 2. The comprehensive information of 24 trees.
Tree/NumberTotal PointsTTH (m)DBH (m)Distance (m)
187665713.90 0.29 14.63
271670113.33 0.20 10.26
362925013.75 0.24 12.26
473323315.12 0.26 13.03
5106454613.08 0.18 6.07
697191511.88 0.15 6.56
7339885913.30 0.26 6.39
8116212313.61 0.23 10.86
910686449.87 0.14 5.21
10121068514.40 0.29 15.23
11131870013.96 0.26 5.93
1274228014.87 0.27 14.22
1320330310.02 0.26 36.99
14189661913.71 0.25 6.83
15108039713.27 0.28 14.85
1698077612.41 0.20 14.25
1784157515.18 0.28 17.11
18135719613.33 0.21 7.06
1949252308.82 0.28 3.74
20171648814.30 0.25 5.94
21127562013.63 0.21 11.45
22130110011.73 0.24 10.68
23131591414.65 0.23 7.69
2477139511.05 0.23 11.45
Table 3. The number of wood points and leaf points in the classification process of tree 5.
Intensity
Classification
KNN
Classification
Voxel
Classification
CombineWood Point
Verification
wood points Awood points Bwood points C/classified wood points
301392261408242513/393211
leaf points Aleaf points Bleaf points Cleaf points Dclassified leaf points
7631543998418895822033671335
Table 4. The point statistics information of 24 trees classification results.
Tree/NumberTotal PointsStandard ResultsClassification Results
Wood PointsLeaf PointsWood PointsLeaf Points
True False True False
1876657150479726178128879121572496321600
2716701154548562153133791564755650620757
3629250190793438457166616208043637724177
473323316907156416211688065156351152191
51064546427139637407384086159263581543053
6971915246251725664213843189972376532408
7339885971957326792866386557436267185080918
81162123312819849304271612492484438041207
91068644374865693779289835392668985385030
10121068514353210671531051301653106550038402
111318700562884755816508514106575475154370
12742280193707548573140832149154708252875
13203303133011900028801371899654500
14189661948253214140874200637086140700162469
15108039710926997112888755196296916620514
16980776792249015526694418490136812280
1784157510011874145776668818273327523450
181357196375669981527286918403497749388751
19492523013290623596168112884787313587437200215
201716488727900988588644566671898187083334
21127562021576110598591799624550105530935799
22130110024068410604161504581391105902590226
231315914364161951753279447356094819384714
24771395165762605623118643180560382847119
Table 5. The accuracy and efficiency analysis of 24 trees classification results.
Tree/NumberAccuracy AnalysisTime Analysis
OAKappaMCCTime Cost (ms)TPMP (ms)
10.97390.90320.90669351067
20.96310.88700.88899301298
30.95820.89790.90128701383
40.92790.77260.79239121244
50.95800.91130.914419011786
60.96470.90270.906113501390
70.97400.91910.921155471633
80.96030.89520.898315651347
90.91670.80760.820316251521
100.96690.82190.83311103912
110.95790.91300.916224561863
120.92670.79230.80809171236
130.97760.78370.80215062489
140.96330.89950.902429811572
150.97920.87620.8808990917
160.98720.90800.9116880898
170.96240.80800.8115791940
180.93160.81640.828117891319
190.95750.88720.8919127532590
200.94750.89100.894935172049
210.96830.88050.884313341046
220.92950.72760.754413921070
230.93290.82000.831517781352
240.93650.79130.80659381216
Mean0.95500.85470.8627/1423
Table 6. The point statistics information of two Fraxinus pennsylvanica trees classification results.
Tree/NumberTotal PointsStandard ResultsClassification Results
Wood PointsLeaf PointsWood PointsLeaf Points
True False True False
Fraxinus pennsylvanica 13523822350208317361422568883443165270124520
Fraxinus pennsylvanica 1216452018208119824391466123661197877835469
Table 7. The accuracy and efficiency analysis of two Fraxinus pennsylvanica trees classification results.
Tree/NumberAccuracy AnalysisTime Analysis
OAKappaMCCTime Cost (ms)TPMP (ms)
Fraxinus
pennsylvanica 1
0.96220.75290.77113369957
Fraxinus
pennsylvanica 2
0.98190.87250.877222001017
Publisher’s Note: MDPI stays neutral with regard to jurisdictional claims in published maps and institutional affiliations.