Technical Note

Comparison of Hydrological Patterns between Glacier-Fed and Non-Glacier-Fed Lakes on the Southeastern Tibetan Plateau

1
School of Geography and Remote Sensing, Guangzhou University, Guangzhou 510006, China
2
Guangdong Key Laboratory of Integrated Agro-Environmental Pollution Control and Management, Institute of Eco-Environmental and Soil Sciences, Guangdong Academy of Sciences, Guangzhou 510650, China
3
National-Regional Joint Engineering Research Center for Soil Pollution Control and Remediation in South China, Guangzhou 510650, China
4
State Key Laboratory of Remote Sensing Science, Aerospace Information Research Institute, Chinese Academy of Sciences, Beijing 100101, China
*
Author to whom correspondence should be addressed.
Remote Sens. 2021, 13(20), 4024; https://doi.org/10.3390/rs13204024
Submission received: 30 August 2021 / Revised: 5 October 2021 / Accepted: 6 October 2021 / Published: 9 October 2021
(This article belongs to the Special Issue Remote Sensing in Natural Resource and Water Environment)

Abstract

:
Lakes on the Tibetan Plateau have experienced variations over the last several decades, and the delineation of lake dynamics is favorable for the regional water cycle and can serve as important information for plateau environmental research. This study focused on 57 lakes near the Tanggula Mountains on the southeastern Tibetan Plateau. Yearly inundations of the lakes in 1989–2019 and altimeter data available for 2003–2020 were integrated to illustrate the changing patterns of glacier-fed and non-glacier-fed lakes. These two groups of lakes presented very similar evolution stages. They both increased in 1989–1992, decreased in 1992–1996, increased rapidly in 1998–2005, and had batch-wise fluctuations since 2005, with respective areas of around 5305.28 and 1636.79 km2 in the last decade. The non-glacier-fed lakes were more sensitive to precipitation variation, and glacier-fed lakes were more sensitive to temperature changes. Based on lakes with obvious changes in water level, the whole water storage variations of the studied lakes were 1.90 Gt/y in 2003–2009, including 1.80 Gt/y for glacier-fed lakes and 0.10 Gt/y for non-glacier-fed lakes. The contribution from glacier melting in 2003–2009 amounted to 16.11% of the whole lake volume increase. In 2010–2020, water mass changes were 0.42 Gt/y for glacier-fed lakes and −0.14 Gt/y for non-glacier-fed lakes, respectively. The volume increase of glacier-fed lakes in 2010–2020 was mainly due to the expansion of Selin Co. Selin Co experienced a water increase of about 0.46 Gt/y, and the other glacier-fed lakes experienced a decreasing volume of −0.04 Gt/y. In 2010–2020, 99.43% of the glacier contribution supplied Selin Co.

1. Introduction

The Tibetan Plateau (TP) is famously named “The third pole” and the “Water tower of Asia” [1]. This plateau covers an area of approximately 2,500,000 km2, with an average altitude of more than 4000 m. The TP is the third-largest area of frozen water: around 46,000 glaciers with an area of 100,000 km2. The total area of lakes (>1 km2) is greater than 45,000 km2 [2]. Due to the large glaciated area, the TP is the source of several famous rivers—the Yellow River, Yangtze River, Ganges River, India River, Brahmaputra River, and so on—and thus provides water for the whole of Southeast Asia [3]. Glaciers influence the water resources of lakes on the TP [4]. The glacier area in west China has retreated by 18% since 2000 due to climate warming [5]. The illustration of how the Tibetan lakes have responded to climate change over the past few decades is a key scientific issue.
Due to its high altitude and complex terrain, the TP has a harsh environment, with strong solar radiation, low temperatures, and thin air [3]. Therefore, the intensity of human activity in the TP is low and the dynamics of the lakes are sensitive to climate variability. As direct measurements on the plateau are limited [6,7,8], many researchers have used remote sensing techniques to account for the hydrologic changes of lakes in this remote region [9,10]. Lakes on the TP have shown large variability, with most lakes undergoing expansion since the late 1990s [11].
In the last decade, the total area of lakes greater than 10 km2 on the TP increased from 37,111 km2 to 40,015 km2 [12], and the two largest lakes, Nam Co and Selin Co on the TP, raised in level by 4.37 m and 2.03 m, respectively [13]. In 2003–2009, with the aid of precipitation and glacier meltwater, the lake volume in the Inner Basin on the TP increased at a rate of 7.72 Gt/y [14]. ICESat and CryoSat-2 data were used in conjunction to study the water level changes of Nam Co and the results showed that Nam Co’s level increased at a rate of 24 cm/y in 2003–2008, then dropped at a rate of −9 cm/y in 2009–2013 [15]. Area-level curves were constructed based on ICESat data and Landsat images for 30 lakes on the TP, and the results indicated that the lake volume increased by 92.43 km3 from the 1970s to 2011 [16]. Zhang used ICESat data to monitor the water level changes of 62 lakes on the TP and found that the average annual raise was 23 cm/y, and the results illustrated that the lake level rise was consistent with glaciers melting [17]. Sun found that seven out of 10 lakes in Inner Bain presented increasing trends and that ground runoff was the major contributor [3]. Meng established a water balance equation to quantify the contribution of glaciers to lake volume dynamics [18].
The driving forces for expansion were precipitation increases or permafrost/glacier meltwater induced by rising temperatures [11]. Lei et al. studied the lake growth in the interior TP since the 1970s and increasing precipitation since the late 1990s was revealed as the main driving factor [19]. Moreover, Tibetan lake expansions were highly related to permafrost degradation caused by warming [19]. Song investigated the water levels of Tibetan lakes based on multiple satellite altimeters, and attributed the lake evolution to changing precipitation and evaporation [15,20]. The percentage contributions of precipitation to lake volume dynamics are also indicated according to some modeling methods [6,21,22,23].
Although the reasons were indicated according to the aforementioned research, the proportional contributions from of factors are not clear. It is also a challenge to carry out quantitative estimations due to insufficient field observations and uncertainties about modeling methods [14]. This research used multisource remotely sensed data to illustrate the changing patterns (area, level, and volume) of 57 lakes (greater than 1 km2) located near Tanggula and the Nianqing Tanggula Mountains. The 57 lakes studied were separated into two types according to whether they were dependent on meltwater from surrounding mountain glaciers. Twenty-three lakes in glacier-fed basins were named glacier-fed lakes, while the rest were named non-glacier-fed lakes. Our assumption is that the glacier-fed and non-glacier-fed lakes had similar climatic conditions, with similar influences from climatic factors, so the different evolutionary patterns between glacier-fed and non-glacier-fed lakes can be attributed to the contribution from surrounding mountain glaciers. The delineation of lake dynamics can reflect hydrological responses to climate change [24] and the results are favorable for plateau environmental research [3,25].

2. Study Area

The studied area is bordered to the northeast by the Tanggula Mountains, and to the south by the Nianqing Tanggula range on the southeastern TP, where several large glaciers distribute (Figure 1). The studied region has a semi-arid climate. The annual temperature is about −5–7 °C. The annual precipitation is 300–600 mm, and more than 80% of the rainfall occurs in May–October. All 57 lakes researched are greater than 1 km2 and are located in 21 sub-basins, as Figure 1 shows. Four of the 21 basins are glacier-fed type, including 23 glacier-fed lakes. Selin Co and Nam Co, named “Holy lakes,” are the two largest lakes on the TP with respective areas of 2447.74 km2 and 2027.91 km2 in 2019 [3]. Nam Co was about 139.51 km2 larger than Selin Co in the 1990s, while Selin Co expanded by about 481.06 km2 over the last two decades. The expansion of Nam Co was constrained by the surrounding ridges—the Nianqing Tanggula Mountains, where mountain glaciers are widely distributed—and Selin Co became the largest lake on the TP in the 2000s. The third-largest lake studied is Tso Ngön, which is around 286 km2. Tso Ngön is adjacent to Selin Co and the two lakes are sometimes interlinked through the northern end of Tso Ngön. The fourth-largest lake studied is Bamu Co at around 232 km2, located 30 km north of Nam Co; this lake mainly depends on land surface runoff in the basin. Twenty-eight lakes had their altimeter-derived water level and they occupied around 98.64% of the 57 studied lakes. The spatial distribution of the studied lakes is shown in Figure 1 and the characteristics of the 28 lakes are listed in Table 1.

3. Data and Methods

3.1. Yearly Data for Lake Inundation

The Global Surface Water Dataset (GSWD) was created by the European Commission’s Joint Research Center based on more than 30 million scenes of Landsat series images from 1984 to 2019 [26]. Expert systems, visual analysis, and reasoning techniques were integrated to extract water surfaces on a global scale. Detailed information on this program is given in the research of Pekel et al. [26]. Monthly and yearly inundation, occurrence change intensity, seasonality, and transition products are also presented in the dataset. According to an accuracy assessment with the aid of 40,124 test points distributed both temporally (spanning 32 years) and spatially, the omission errors were less than 5% and the commission errors were less than 1% for GSWD [27]. Yearly data mapped the union of seasonality and permanent water distribution, depicting the largest state in a year. Since the yearly inundations of the studied lakes in 1984–1988 were missing, a series of data from 1989–2019 was chosen in this research. The annual products were visually checked based on Google Earth high-resolution images and a series of 30 m interpretation results. If obvious errors existed in the extracted inundation of a particular lake in a particular year, such as a large area of a lake being missed due to cloud coverage, then for that lake, the record for that year was removed. If there was some salt-and-pepper noise in the lake surface extraction, then these errors were manually corrected. To check the accuracy of the GSWD yearly data of the studied lakes, six series of 30 m interpreted results based on Landsat series images acquired in wet seasons in the years 1990, 2000, 2005, 2010, 2013, and 2014 were collected. We compared the areas of the studied lakes between GSWD and the interpretation results. The correlations of the six pairs of data were around 0.99–1. This demonstrated that the GSWD yearly data were able to accurately map the inundation dynamics of the studied lakes.

3.2. Altimeter Data for Measuring Lake Levels

CryoSat-2 and ICESat data were used in this research to detect lake level fluctuations in 2003–2020. CryoSat-2 was launched in April 2010 by the European Space Agency, with an orbit height of 717 km and an inclination of 92°. The frequency of CryoSat data monitoring is every 369 days. The time interval of adjacent cycles is 30 days, and the space of adjacent ground tracks is around 1.5–10 km. CryoSat-2 operates in three modes: Low-Resolution Mode (LRM), Synthetic Aperture Radar (SAR) mode, and SAR Interferometric (SARIn or SIN) mode. The SARIn mode was employed on the TP [15]. The Ice, Cloud, and Land Elevation Satellite (ICESat) was launched in January 2003 and stopped working in 2009. The ICESat sent laser pulses, which were easily interfered with by clouds. The ICESat revisited the same cycle every 3–4 months, covering the latitude of ±86°, with a footprint of 70 m in diameter. The resolution in the along-track direction was 175 m. ICESat data were suitable for monitoring small lakes and the estimation accuracy for inland lakes was around 3–10 cm [28,29]. The ICESat product Global Land Surface Altimetry Data (GLA14) were also used in this research. Eight lakes were covered by the ICESat data and 28 lakes were covered by the CryoSat data, as indicated in Figure 1 by the red and yellow points, respectively.
The following formulas indicate how to derive the surface level from altimeter data. In Formula (1), surface level relative to the referenced ellipsoid is equal to altitude minus range. Altitude is the orbit altitude of the altimeter. Range is the distance between an altimeter and lake surface derived from the time taken for a radio signal to be reflected back [30]. As they are influenced by the solid earth tide and the pole tide, the two items need to be subtracted. In Formula (2), the range needs to have interferences from the environmental and geophysical corrections removed.
Surface Level = Altitude − Corrected Range − Solid earth tide − Pole tide
Corrected Range = Range + Wet troposphere correction + Dry troposphere
correction + Ionosphere correction + Electromagnetic bias
The measurements from ICESat and CryoSat-2 data followed the above procedure. In this study, eight lakes, including the two glacier-fed lakes Selin Co and Nam Co, were covered by the ICESat data, as shown in Table 1, and the process of ICESat data was that in Zhang et al. [31]. ICESat were reported to have performed well on detecting Tibetan lake levels, about several to ten centimeters [28,29,32]. The level-2 SIRAL SARIn product of CryoSat-2 data was used in this research, and the processing was similar to that applied by Song et al. [15], who has used this product to detect the level changes of Nam Co and Selin Co, with the level bias of less than 0.1 m [15].
After obtaining altimetry measurements, several procedures need to be performed to refine the results. First, due to the variation in lake inundation, altimeter footprints sometimes fell on the lakeside. Thus, the internal buffered lake boundaries were applied as filters to remove footprints that fell outside the boundaries, avoiding the contamination of land signals. Second, the 3-sigma rule was applied to remove noise from the filtered results, and the mean value of the test results indicated the daily lake surface altitude. Then the daily results were assembled to create a time series of lake levels. Finally, as ICESat data used Topex/Poseidon reference ellipsoid, while CryoSat-2 used the World Geodetic System 84 (WGS84) as a reference [3], we converted the ICESat data into the WGS84 reference to maintain consistency.

3.3. Meteorological Data

Daily gauged climate factors from five meteorological stations in the study area from 1966 to 2019 were obtained from the China Meteorological Data Sharing Service System (http://cdc.cma.gov.cn/). To compare with the studied results, daily measured records were accumulated on a monthly and yearly scale. The lake surface evaporation was estimated based on the Penman–Monteith equation, according to the measurements from the nearest gauged station. A detailed introduction of the Penman–Monteith equation is given in the research of Allen et al. [33].

4. Results

4.1. Accuracy Assessment of Lake Level

To evaluate the accuracy of altimeter-derived results, gauged measurements of water level for Selin Co in 2000–2020 were obtained. Figure 2 displays comparisons between altimetry results and in situ records for the lake.
For Selin Co, the ICESat- and CryoSat-derived results were about 3 m higher than the gauged data due to the in situ measurements being based on the local reference, which showed a large bias with WGS reference. The fluctuations in the altimetry measurements agreed well with the in situ records, as shown in Figure 2a. Selin Co had 23 ICESat results and 50 CryoSat records. We selected the altimeter-derived results and in-situ results on the same dates to check the consistency. Correlations between altimeter results and gauged data were high, with R2 values of 0.99 for ICESat levels and 0.90 for CryoSat results, indicating that the derived altimetry results had high accuracy when capturing lake fluctuations. However, Figure 2b,c suggests that the accuracy of the CryoSat results was lower than that of the ICESat results. In addition, some researchers have used several kinds of altimeter data with overlapping periods to study water level changes. In fact, for different altimeters, system differences exist in terms of orbit height, inclination, and revisit period. To remove the differences and integrate the data, correlations between different kinds of results were constructed during overlapping periods, and then the altimeter results were transformed based on relationship equations to make the level series dense. However, the ICESat data and CryoSat-2 data used in this research covered the time periods 2003–2009 and 2010–2020, respectively. There was no overlap period between them. Therefore, the lake level dynamics of the two time intervals were analyzed separately.

4.2. Interannual Lake Areal Variations

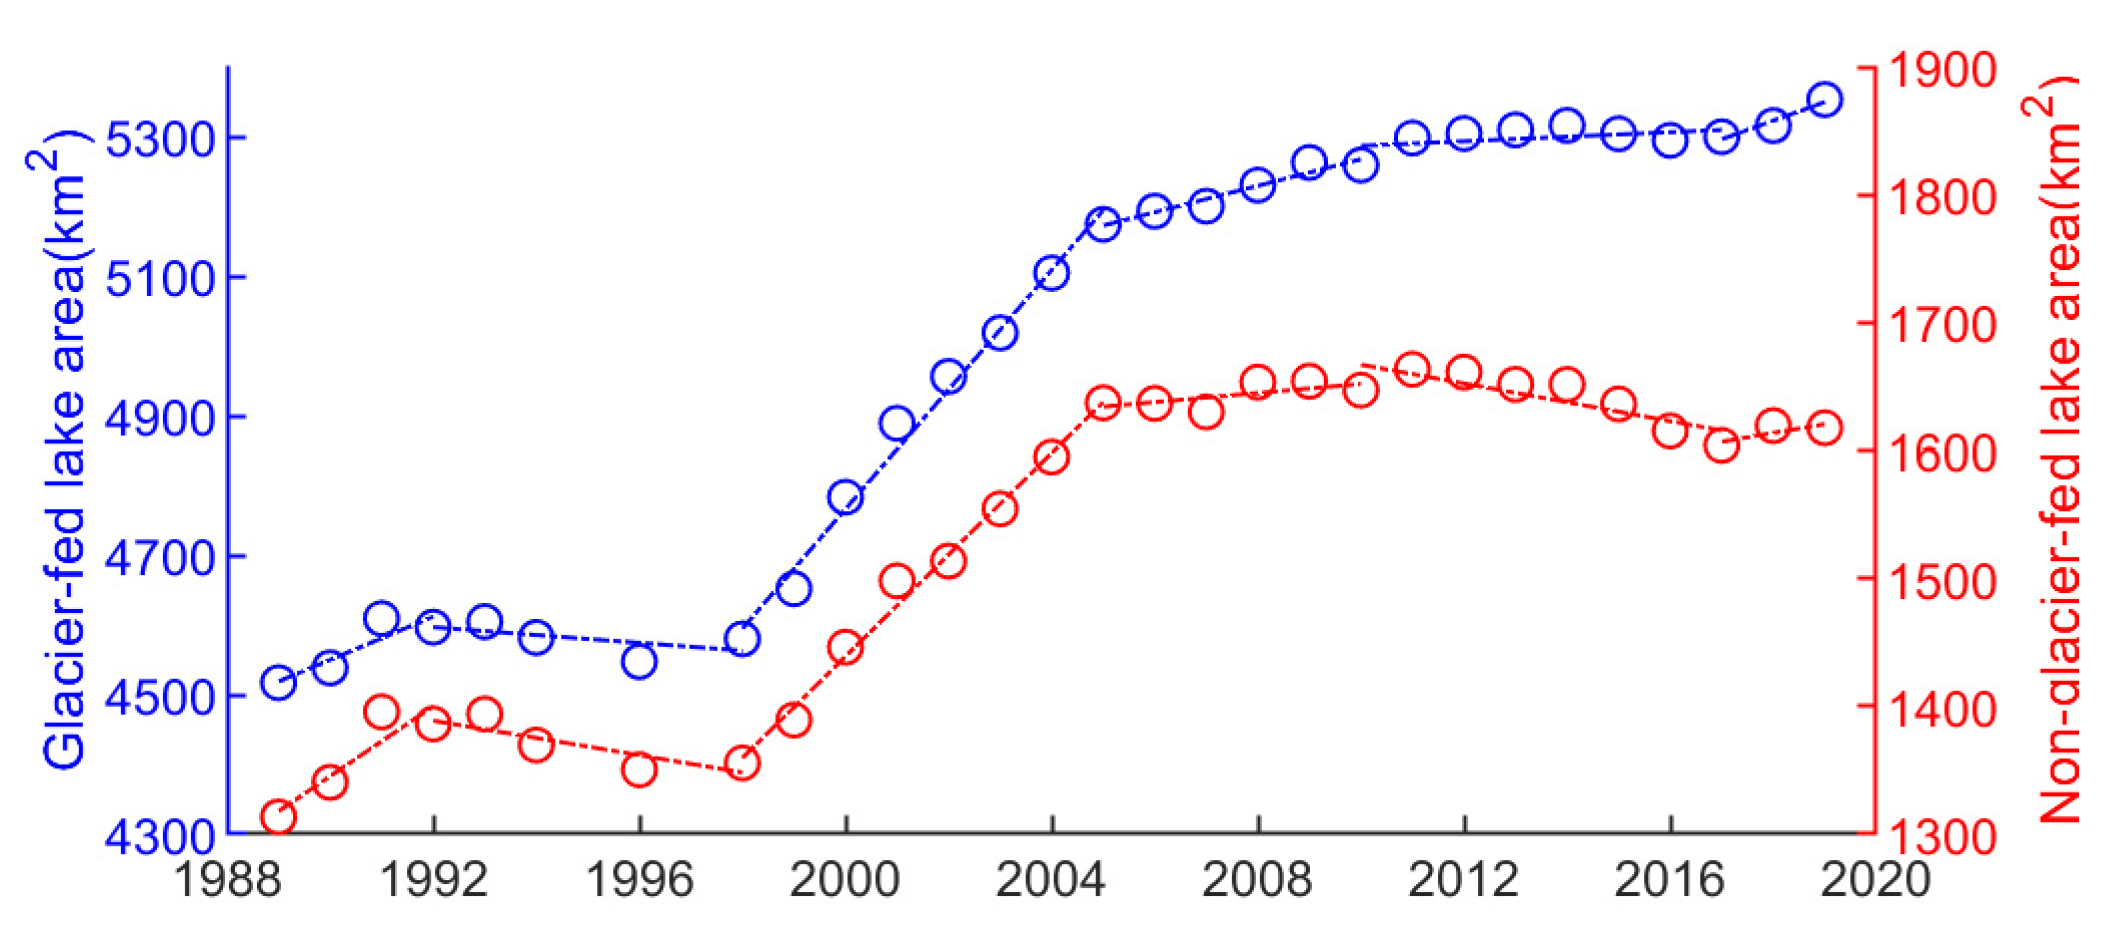
The studied lakes include 23 glacier-fed lakes and 34 non-glacier-fed lakes. Both groups showed expansion, and the total area increased from 5825.81 km2 in 1989 to 6965.74 km2 in 2019. The non-glacier-fed lakes had an area of around 1313.49–1617.76 km2, and the glacier-fed lakes had an area of around 4517.14–5352.88 km2 during the studied period. The glacier-fed lakes occupied about 76.56% of the total area. Glacier-fed and non-glacier-fed lakes presented very similar evolutionary patterns, accompanying several batch-wise increases (Figure 3). These two groups of lakes presented very similar evolutionary stages. In the 1990s, both glacier-fed and non-glacier-fed lakes endured fluctuations. In the 2000s, the two groups showed rapid growth of 5262.70 and 1654.13 km2, respectively. In the 2010s, glacier-fed and non-glacier-fed lakes experienced small fluctuations, with respective areas of around 5305.28 and 1636.79 km2 over the last decade. This finding coincided with the results of Zhang et al. [14], who studied the lake volume changes of the whole inner TP and found that the lakes experienced a slight decrease before 1995, followed by a rapid increase in the 2000s, and then a recent deceleration in the 2010s.
We divided the study period into six intervals and the change patterns of each interval for the two groups are shown in Table 2. They both increased in 1989–1992, decreased in 1992–1998, increased rapidly in 1998–2005, and had batch-wise fluctuations since 2005. In the two intervals 1989–1992 and 1998–2005, both glacier-fed and non-glacier-fed lakes showed obvious increases (p-value < 0.05), while glacier-fed lakes had greater expansion intensities, with more rapid increase rates. Glacier-fed and non-glacier-fed lakes had respective rapid expansion rates of 85.65 km2/y and 39.75 km2/y in 1998–2005. Non-glacier-fed lakes fluctuated with an average area of 1643.13 km2 in 2005–2010, presented retreating patterns in the two intervals 1992–1998 and 2010–2017, and rebounded in 2017–2019, while glacier-fed lakes retreated by 49.39 km2 in 1992–1998 and showed constant growth in 2005–2019 with various increasing intensities.
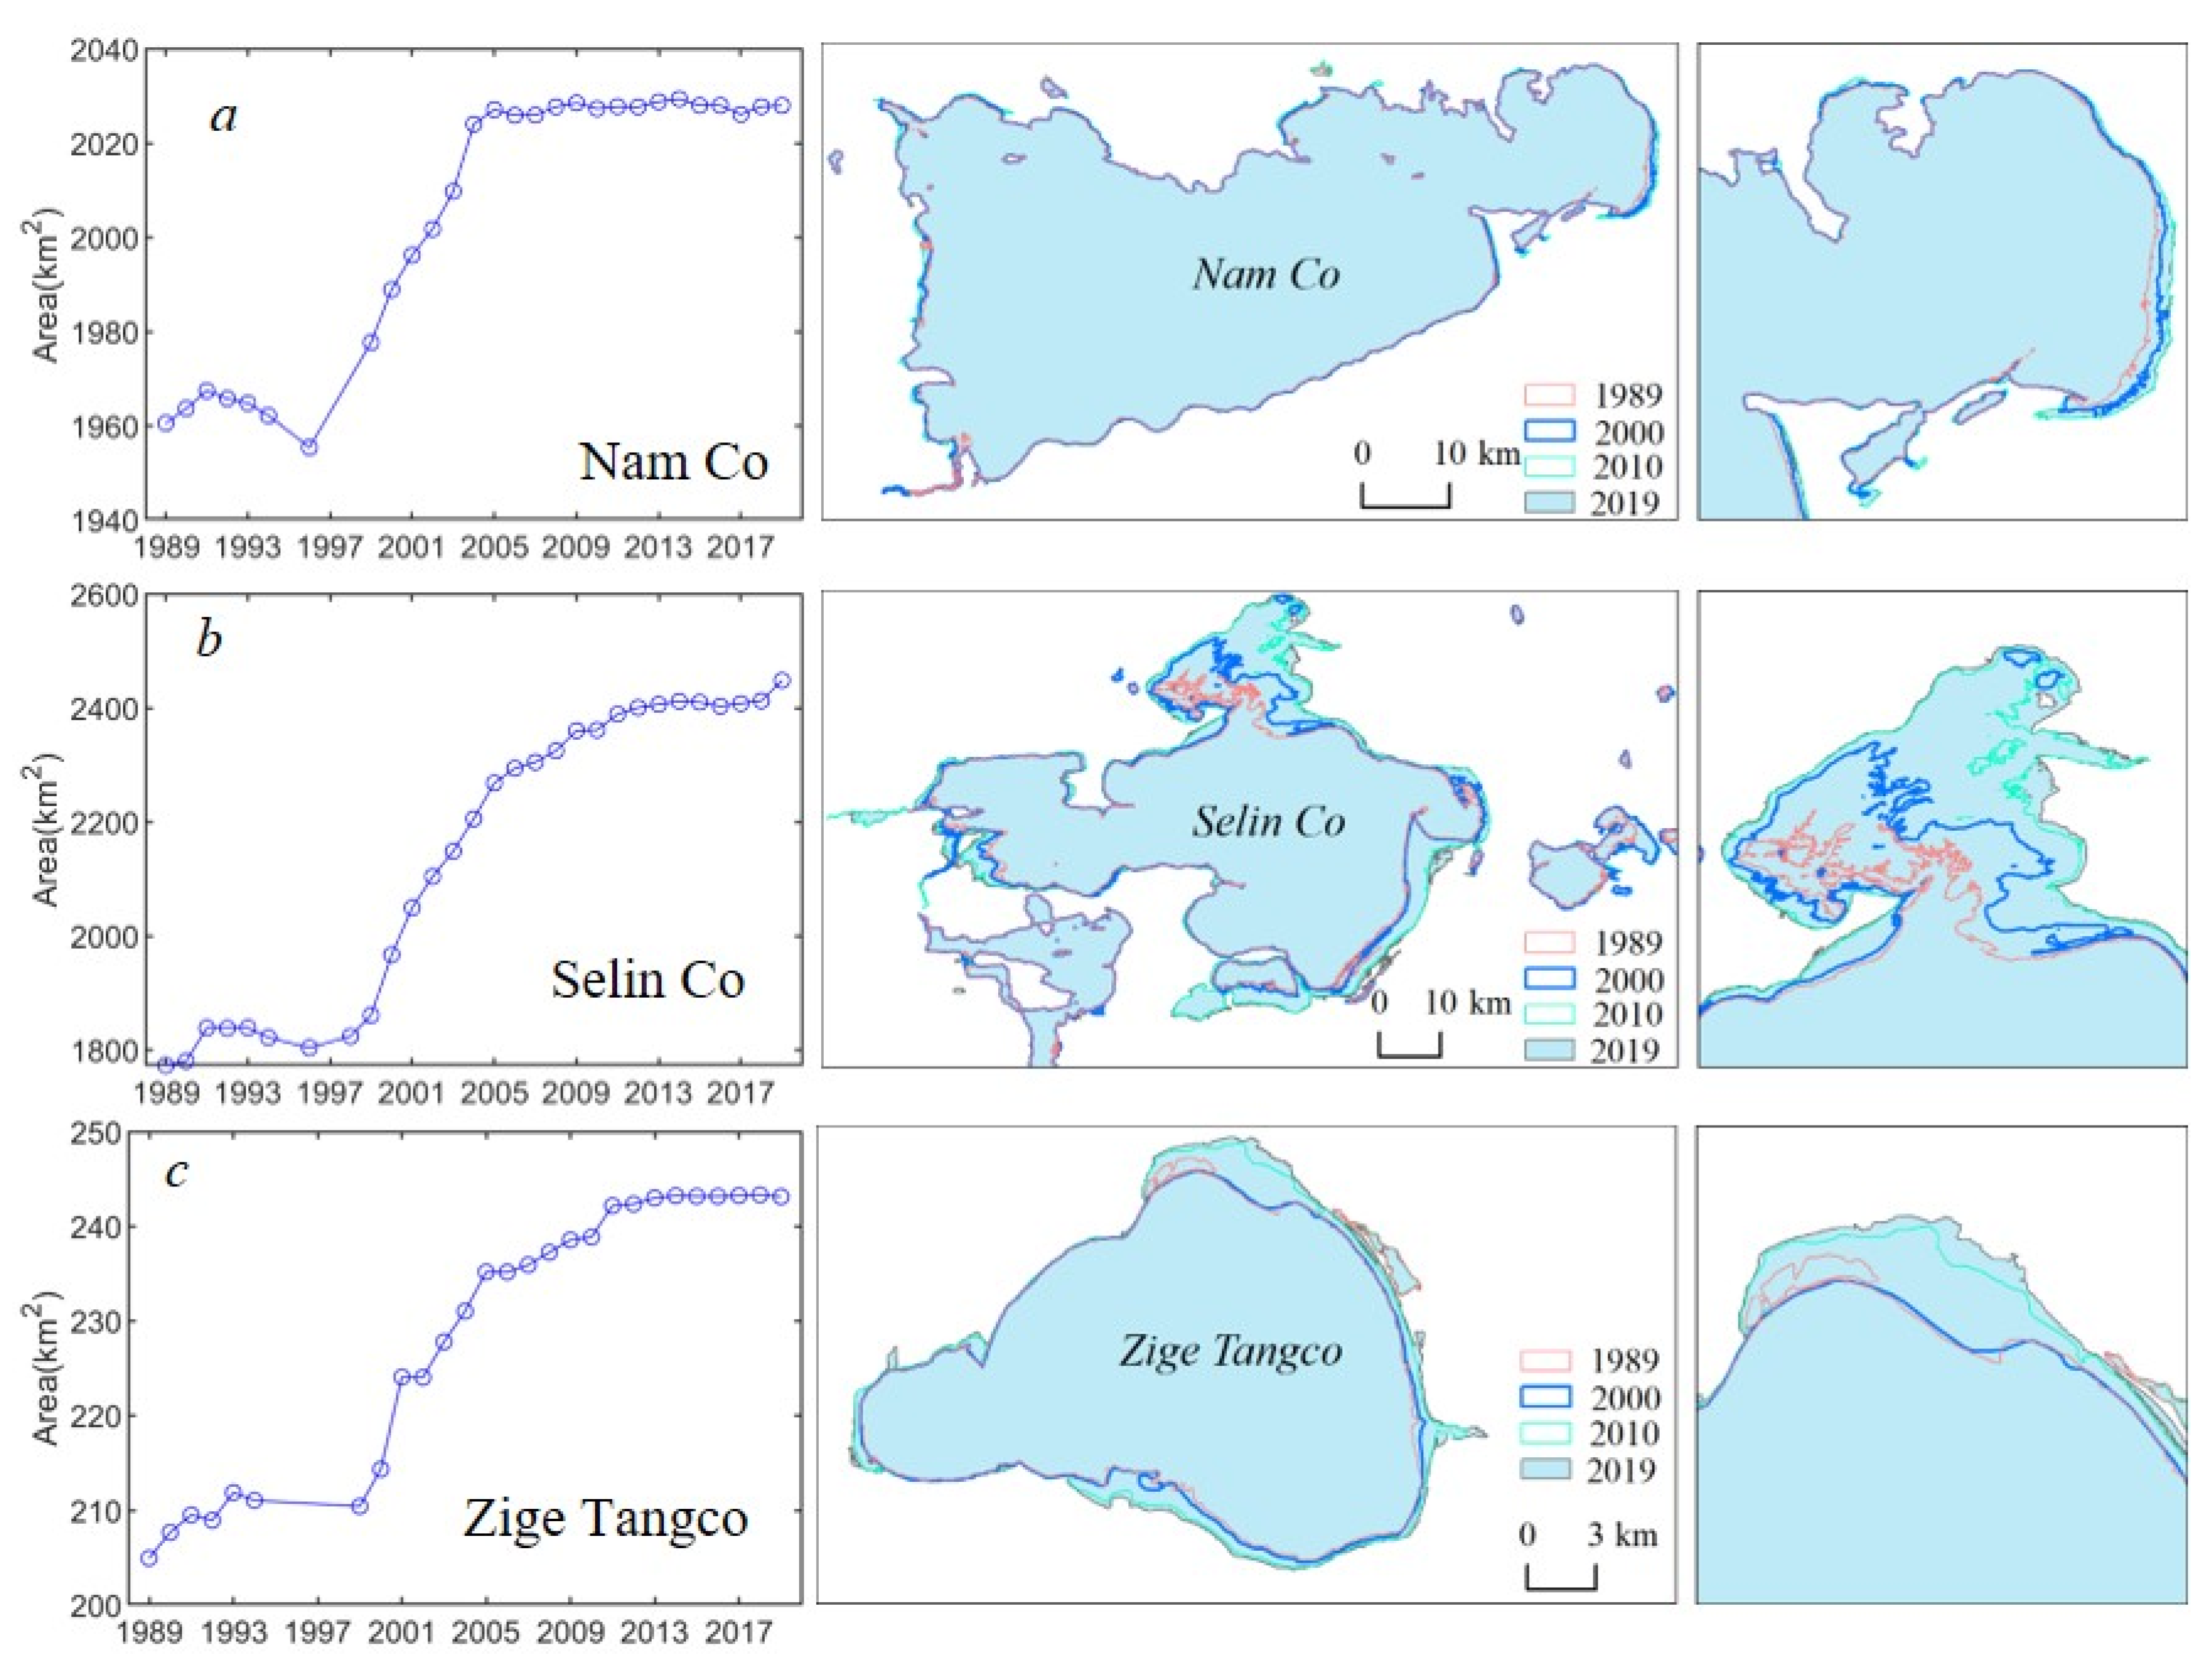
Figure 4 shows three lakes with obvious expansions during the studied period. Nam Co and Selin Co are two representative glacier-fed lakes, and Zige Tangco is a non-glacier-fed lake. Nam Co showed overall expansion over the past three decades. It experienced a fluctuation before 1996. Nam Co increased from 1960.45 km2 in 1989 to 1967.36 km2 in 1991, and then dropped to a minimum of 1955.33 km2 in 1996. The lake rapidly increased at a rate of 8.16 km2/y in 1996–2005 and presented stability (around 2027.56 km2) in the following years. Figure 4a shows expansion the most in the west and east due to the restriction of range in the southeast. Selin Co also underwent a fluctuation before 1996 with a mean value of 1813.37 km2. Since 1996, it experienced a fast expansion at a rate of 57.14 km2/y in 1996–2005, and then the increase rate dropped to 16.64 km2/y in 2005–2014. The annual area increased from 1803.59 km2 in 1996 to 2411.30 km2 in 2014. Then the lake was in a comparatively stable state in the following years. From the two curves in Figure 4a and b, we found that, before 2001, Selin Co was smaller than Nam Co, while after 2001, Selin Co presented continuous expansion and became the largest lake on the TP. The expansion of Selin Co mainly occurred in the north and southeast due to the flat and open terrain, as Figure 4b shows. Zige Tangco increased by 6.12 km2 during the 1990s, with a rate of 1.22 km2/y, and then expanded at a rapid rate of 2.18 km2/y in 2001–2010. The expansion of Zige Tangco mainly occurred in the north part (Figure 4c) and in the last decade, it maintained an area of 242.94 km2.

4.3. Fluctuations of the Lake Level

Twenty-eight lakes had altimeter-derived water level results and eight lakes had both ICESat and CryoSat-2 altimetry-derived measurements in 2003–2020. Those eight lakes accounted for about 70% of the total lake area, including three glacier-fed lakes, Selin Co, Nam Co, and Tso Ngön. The number of available ICESat-derived records for the eight lakes ranged from 2 to 23, spanning 1–7 years. Selin Co had the most ICESat results, with 23 records for 2003/3–2009/3. Nam Co had 18 ICESat-derived results over 2003/2–2009/10. Shen Co had the fewest ICESat-derived records (two) in two years, 2006 and 2007. Dongqia Co had four records for 2003, from April to September.
If the p-value of a level curve was less than 0.05, then the lake was considered to have experienced clear variations, while, if the opposite was true, it was concluded that there was no obvious change in the lake. As Figure 5 shows, the changing patterns of lake level coincided with that of inundated area. Two glacier-fed lakes, Nam Co and Selin Co, and two non-glacier-fed lakes, Xuguo Co and Zige Tangco, presented obvious increasing trends of around 0.22–0.63 m/y during their own available periods of ICESat data, as Figure 5 shows. Because CryoSat-2 had dense ground paths, more results were available for the eight lakes. The number of CryoSat-derived results was 6–50, spanning the last decade. CryoSat results showed that three lakes Namka Co, Dongqia Co, and Selin Co had obvious change trends, including three lakes that dropped at a rate of −0.18 m/y to −0.14 m/y, while Selin Co rose at a rate of 0.19 m/y in 2010–2020.
Selin Co had 77 level records from the last two decades, recorded on a monthly scale. It gradually rose by around 4.15 m in 2003–2009 with a change rate of 0.63 m/y, and rose by around 3.35 m in 2010–2020 with a change rate of 0.19 m/y. The highest level was 4550.11 m in October 2020 and the lowest level, 4542.84 m, occurred in March 2003. Nam Co had 71 altimeter-derived records from 2003–2020. It rose by 1.89 m in 2003–2005 and then fluctuated with a mean level of 4726.74 m until 2018. The lowest water level of 4725.67 m occurred in June 2018. Then the level rose in 2019–2020. Zige Tangco had 29 level records and the level gradually increased from 4570.49 to 4573.71 m in 2003–2014 at a rate of 0.25 m/y. Then the lake dropped to the lowest level, 4572.81 m, in July 2017 and rebounded in the following years, with a mean level of around 4573.35 m in 2018–2020.
The other 20 lakes, including six glacier-fed lakes, only had CryoSat-2 results for the last decade. Seven of the 20 lakes presented decreasing trends with rates of −0.24 to −0.11 m/y, and the other 13 lakes showed no obvious changes. The water level fluctuations of Puga Co and Ringco Ogma with the largest decrease rates agreed well with the areal variations, as Figure 6 shows.
In general, 4 lakes obviously rose in 2003–2009 and 11 lakes had clear change trends in 2010–2020, as shown in Table 3. Based on the lakes that had obvious level changes, we calculated the average level variation rates for glacier-fed and non-glacier-fed lakes during two separate periods, 2003–2009 and 2010–2020. We compared the difference between glacier-fed and non-glacier-fed lakes by area-weighted averaging of the change rates to calculate the average growth rate, which was the growth rate of water level in per square kilometer. In respect of average rate, glacier-fed lakes showed a greater rise (0.43 m/y) than non-glacier-fed lakes (0.36 m/y) in 2003–2009, while non-glacier-fed lakes retreated more (−0.17 m/y) than glacier-fed lakes (0.15 m/y) in 2010–2020. The glacier-fed lakes had a growth state overall during the last decade, mainly due to the constant expansion of Selin Co, and the other glacier-fed lakes showed a declining rate (−0.15 m/y) in 2010–2020. The lakes involved in the two separate study periods are shown in Table 3.

5. Discussion

5.1. Driving Forces

The water balance of the studied lakes in the enclosed basins was mainly influenced by several input and output factors. The input variables were precipitation, ground runoff, and glacier/snow/permafrost meltwater. The ground runoff is the accumulated water, determined by the precipitation and evaporation over the land of the basin. The output variables include lake surface evaporation, water exchange between adjacent lakes, some groundwater outflow and infiltration. Of these driving variables, precipitation, evaporation, and temperature were the dominant factors. We analyzed the relationship between climate factors and lake area changes during the studied period to illustrate the influences of climate on lake dynamics. Daily gauged climate variables from 1966–2020 were obtained and the data were processed to be in the annual frequency to match the areal series. Figure 7 presents the areal changes of glacier-fed and non-glacier-fed lakes against yearly precipitation, temperature and lake surface evaporation based on gauged measurements from the five nearby meteorological stations.
The annual precipitation at the five stations presented no obvious change trends in 1966–2020 and some wet and dry years appeared alternately, as Figure 7a shows. The red line in Figure 7a is the mean value of the five stations and indicates that the average precipitation in 1974 (563.49 mm), 1980 (626.67 mm), and 2008 (627.72 mm) was higher than that of the surrounding years, while the precipitation in 1972 (339.30 mm), 1994 (346.03 mm), and 2015 (281.34 mm) was lower than that of the surrounding years. Annual gauged rainfall from the meteorological station near Nam Co was around 372.58–794.81 mm, as the cyan line shows in Figure 7a—about 178.89 mm/y higher than the measurements near Selin Co, indicated by the orange line in Figure 7a. The annual precipitation and lake area had different fluctuations in 1989–1994 and the relationship between these two factors was not clear. In 1994–2003, the rainfall dynamically increased by 19.17 mm/y, and the glacier-fed and non-glacier-fed lakes constantly expanded at high rates of 55.80 km2/y and 23.28 km2/y, respectively. The precipitation decreased in 2008–2015 and then got better. The yearly non-glacier-fed lake area was comparatively stable in 2005–2010 and then had a slight decrease after 2011, while glacier-fed lakes showed an obvious expansion trend in 2005–2013, at a rate of 18.32 km2/y, indicating that the glacier-fed lakes were not very sensitive to the precipitation as non-glacier-fed lakes. Non-glacier-fed lakes showed a higher decrease rate than glacier-fed lakes in 2013–2017, and both rebounded in 2017–2019. The statistics on lake areas indicate that precipitation was an important driving factor, and non-glacier-fed lakes had more dependence on this climate element.
The annual lake surface evaporation fluctuated and did not present any obvious change trend (Figure 7b), ranging from 91.49 to 131.52 mm. The mean value after 2000 was a little lower than before 2000. The lowest value was 91.50 mm in 1997, when the mean temperature was very low. There was no close correlation between lake surface evaporation and batch-wise patterns of lake area.
The temperature steadily increased during the study period (Figure 7c). The mean value of the five annual temperature records in the study area showed an increase since 1966. It rose from –1.09 °C in 1966 to 1.80 °C in 2020, at a rate of 0.05 °C/y. The annual temperature had the lowest value of −1.96 °C in 1997, when both glacier-fed and non-glacier-fed lakes had their smallest area. In terms of the expansion intensity, non-glacier-fed lakes were not as sensitive to temperature increases as glacier-fed lakes. With an increase in temperature, melting and retreating glaciers became an important water supply to glacier-fed basins [14], while the lake area did not maintain constant expansion and grew slowly after 2005. This phenomenon may be related to decreasing precipitation in 2005–2015.
On the whole, lake area change patterns are a complicated effect of temperature, lake surface evaporation, and precipitation. The area of non-glacier-fed lakes is more sensitive to precipitation and glacier-fed lakes are more sensitive to temperature, which regulates meltwater from glaciers or snow.

5.2. Lake Volume Changes and Glacier Contributions

According to Table 3, two glacier-fed and two non-glacier-fed lakes rose obviously in 2003–2009, two glacier-fed and eight non-glacier-fed lakes dropped, and Selin Co showed constant growth in 2010–2020. We determined the lake water budget changes in the two separate study periods according to the average annual area and average growth rate in Table 3. In 2003–2009, the average area of glacier-fed and non-glacier-fed lakes was 4158.80 km2 and 264.14 km2, respectively, and the average growth rates for these two kinds of lakes were 0.43 m/y and 0.36 m/y, respectively. If the water density was assumed to be 103 kg/m3, then the whole water storage changes were derived according to Formula (3).
Changed volume = Average growth rate × Whole area × Water density
where Changed volume means the average changed water storage in one year, Average growth rate is the rate of level changes in per square kilometers, and the Whole area is the sum of average annual area for glacier-fed or non-glacier-fed lakes.
The volume changes of these two groups were 1.90 Gt/y, including 1.80 Gt/y for glacier-fed types and 0.10 Gt/y for non-glacier-fed lakes. In 2010–2019, glacier-fed and non-glacier-fed groups had respective average areas of 2675.80 km2 and 816.71 km2. As the level change rates for the two groups were 0.16 m/y and −0.17 m/y, respectively, we obtained water mass changes of 0.42 Gt/y for glacier-fed lakes and −0.14 Gt/y for non-glacier-fed lakes, as Table 3 shows. In addition, in 2010–2020, Selin Co maintained constant expansion at a rate of 0.19 m/y, and the other glacier-fed lakes experienced a retreat at a rate of −0.15 m/y. Therefore, Selin Co experienced a water increase of about 0.46 Gt/y, while the other glacier-fed lakes retreated at a rate of −0.04 Gt/y. The glacier-fed and non-glacier-fed lakes had the same geographic environments and so experienced similar climatic influences. If we assume that the climate has comparable effects on the two groups of lakes, and causes similar infiltration and permafrost contribution, then the difference in the change rates between glacier-fed and non-glacier-fed lakes must be caused by the supply from glacier meltwater. Therefore, the glacier-fed lakes had the same change rates as non-glacier-fed lakes due to climate: 0.36 m/y in 2003–2009 and −0.17 m/y in 2010–2020 as Table 3 shows. It can be seen that, for glacier-fed lakes, the average growth rate of 0.07 m/y (0.43 m/y–0.36 m/y) for glacier-fed lakes in 2003–2009 was attributed to glacier meltwater, which provided about 0.29 Gt/y water supply in 2003–2009, and this occupied 16.11% of the whole lake storage change (1.80 Gt/y). Zhang et al. (2017) has studied the complex pattern of lake volume changes on the TP and found that glacier mass loss contributed 13% water supply for lake volume increase [14]. This quantitative estimation was comparable with that in this research. In 2010–2020, the growth rate of 0.33 m/y (0.16 m/y–0.17 m/y) for glacier-fed lakes was due to glacier contribution, which supplied water of 0.87 Gt/y and 99.43% of it supplied Selin Co.

6. Conclusions

Yearly lake inundation data from 1966–2019 were used in this research to depict the area changes of 23 glacier-fed and 34 non-glacier-fed lakes. We found that, since 1989, these two kinds of lakes endured expansions, with variations, and increased greatly in 1998–2005. Glacier-fed lakes have kept growing since 2005, while non-glacier-fed lakes experienced a decrease in 2010–2017 but rebounded later on. The area in the 2010s was about 980.60 km2 higher than in the 1990s. Selin Co maintained a constant expansion and has been the largest lake on the TP since 2001. Two kinds of altimetry data, ICESat (2003–2009) and CryoSat (2010–2020), were combined to delineate the level changes of 28 lakes. ICESat-derived level records had higher accuracy than CryoSat results when evaluated by in situ measurements. Four lakes presented obvious changes, with an increase rate of 0.22–0.63 m/y. Ten lakes showed an obvious retreat, while Selin Co maintained clear growth in 2010–2020.
Due to the remoteness of the TP, the evolutionary patterns of lakes are highly influenced by climate change. The lake area variations reflected the complex effect of climate factors. The qualitative analyses between lake area and precipitation, and lake surface evaporation and temperature were carried out to depict the correlations. We found that non-glacier-fed lakes were more influenced by precipitation and glacier-fed lakes were more influenced by the rising temperature. Therefore, glacier meltwater was an important water supply to glacier-fed lakes. Based on the lakes showing obvious level changes in 2003–2020, several conclusions can be made. In 2003–2009, the lake volume increase of four studied lakes with obvious level changes was 1.90 Gt/y and glacier-fed lakes accounted for 94.74% (1.80 Gt/y). In 2010–2020, the glacier-fed lakes experienced a volume increase of 0.42 Gt/y, while non-glacier-fed lakes retreated by −0.14 Gt/y. As the glacier-fed and non-glacier-fed lakes were in the same geographic environment, we assumed that there would be comparable effects of climate exerted on the two groups of lakes and calculated the contributions from glaciers. The water supply from glacier melting accounted for 16.11% of the lake volume increase in 2003–2009, and 99.43% of that supplied Selin Co in 2010–2020.
There were some internal differences between ICESat- and CryoSat-derived results due to the different altimeters. As there was no overlap period between the two datasets, we have illustrated the lake hydrologic dynamics of the two time ranges separately. Due to the limited availability of altimeter data, only 28 lakes had level records, so we just used lakes with obvious level changes to analyze the lake volume changes and contrasted the changing patterns between glacier-fed and non-glacier-fed lakes. Though this conclusion cannot reflect the whole state of the study area, it may serve as an important reference to study plateau environments.
This research explored the evolutionary difference between glacier-fed and non-glacier-fed lakes, and some key findings were obtained. The results can reflect the effect of climate change and glacier retreat on the TP, and supply scientific data for the land surface processes modeling of the TP. The procedure and research program employed in this research can be expanded in other enclosed basins, and, in future research, the quantitative contributions of several driving forces, such as ground runoff, precipitation, and lake surface evaporation, can be derived based on the water balance equation and lake volume changes.

Author Contributions

Writing—original draft, F.S.; writing—review and editing, F.S.; supervision, B.H.; validation, C.L. and Y.Z. All authors have read and agreed to the published version of the manuscript.

Funding

This work was supported by the National Natural Science Foundation of China (42001353 and 41476152), the Scientific Program of Guangzhou University (YG2020019 and SJ201911), the training program of innovation and entrepreneurship for undergraduates from Guangzhou University (XJ202111078241), the Project of Science and Technology Development of Guangdong Academy of Sciences (2020GDASYL-20200102013), and Guangdong Foundation for Program of Science and Technology Research (2019QN01L682).

Conflicts of Interest

The authors declare that they have no known competing financial interests or personal relationships that could have appeared to influence the work reported in this paper.

References

  1. Qiu, J. China: The third pole. Nat. News 2008, 454, 393–396. [Google Scholar] [CrossRef] [PubMed] [Green Version]
  2. Wang, S.; Dou, H. China Lake Catalogue; Science Press: Beijing, China, 1998. (In Chinese) [Google Scholar]
  3. Sun, F.; Ma, R.; He, B.; Zhao, X.; Zeng, Y.; Zhang, S.; Tang, S. Changing Patterns of Lakes on The Southern Tibetan Plateau Based on Multi-Source Satellite Data. Remote Sens. 2020, 12, 3450. [Google Scholar] [CrossRef]
  4. Yao, T.; Thompson, L.; Yang, W.; Yu, W.; Gao, Y.; Guo, X.; Yang, X.; Duan, K.; Zhao, H.; Xu, B. Different glacier status with atmospheric circulations in Tibetan Plateau and surroundings. Nat. Clim. Chang. 2012, 2, 663–667. [Google Scholar] [CrossRef]
  5. Guo, W.; Xu, J.; Liu, S.; Shangguan, D.; Wu, L.; Yao, X.; Zhao, J.; Liu, Q.; Jiang, Z.; Li, P. The Second Glacier Inventory Dataset of China (Version 1.0); Cold and Arid Regions Science Data Center at Lanzhou: Lanzhou, China, 2014. [Google Scholar]
  6. Biskop, S.; Maussion, F.; Krause, P.; Fink, M. What are the key drivers of regional differences in the water balance on the Tibetan Plateau? Hydrol. Earth Syst. Sci. Discuss. 2015, 12, 4271–4314. [Google Scholar]
  7. Li, B.; Zhang, J.; Yu, Z.; Liang, Z.; Chen, L.; Acharya, K. Climate change driven water budget dynamics of a Tibetan inland lake. Glob. Planet. Chang. 2017, 150, 70–80. [Google Scholar] [CrossRef]
  8. Tong, K.; Su, F.; Xu, B. Quantifying the contribution of glacier meltwater in the expansion of the largest lake in Tibet. J. Geophys. Res. Atmos. 2016, 121, 11158–11173. [Google Scholar] [CrossRef]
  9. Wang, X.; Gong, P.; Zhao, Y.; Xu, Y.; Cheng, X.; Niu, Z.; Luo, Z.; Huang, H.; Sun, F.; Li, X. Water-level changes in China’s large lakes determined from ICESat/GLAS data. Remote Sens. Environ. 2013, 132, 131–144. [Google Scholar] [CrossRef]
  10. Cai, X.; Feng, L.; Hou, X.; Chen, X. Remote sensing of the water storage dynamics of large lakes and reservoirs in the Yangtze River Basin from 2000 to 2014. Sci. Rep. 2016, 6, 1–9. [Google Scholar] [CrossRef] [Green Version]
  11. Zhang, X. Dynamic Changes of Typical Inland Lakes on Tibetan Plateau Using Multi-Sensor Remote Sensing Data. Master’s Thesis, Northwest A&F University, Xianyang, China, 2015. (In Chinese). [Google Scholar]
  12. Sun, F.; Zhao, Y.; Gong, P.; Ma, R.; Dai, Y. Monitoring dynamic changes of global land cover types: Fluctuations of major lakes in China every 8 days during 2000–2010. Chin. Sci. Bull. 2014, 59, 171–189. [Google Scholar] [CrossRef]
  13. Zhang, G.; Xie, H.; Yao, T.; Kang, S. Water balance estimates of ten greatest lakes in China using ICESat and Landsat data. Chin. Sci. Bull. 2013, 58, 3815–3829. [Google Scholar] [CrossRef] [Green Version]
  14. Zhang, G.; Yao, T.; Shum, C.; Yi, S.; Yang, K.; Xie, H.; Feng, W.; Bolch, T.; Wang, L.; Behrangi, A. Lake volume and groundwater storage variations in Tibetan Plateau’s endorheic basin. Geophys. Res. Lett. 2017, 44, 5550–5560. [Google Scholar] [CrossRef]
  15. Song, C.; Ye, Q.; Sheng, Y.; Gong, T. Combined ICESat and CryoSat-2 altimetry for accessing water level dynamics of Tibetan lakes over 2003–2014. Water 2015, 7, 4685–4700. [Google Scholar] [CrossRef] [Green Version]
  16. Song, C.; Huang, B.; Ke, L. Modeling and analysis of lake water storage changes on the Tibetan Plateau using multi-mission satellite data. Remote Sens. Environ. 2013, 135, 25–35. [Google Scholar] [CrossRef]
  17. Zhang, G.; Xie, H.; Kang, S.; Yi, D.; Ackley, S.F. Monitoring lake level changes on the Tibetan Plateau using ICESat altimetry data (2003–2009). Remote Sens. Environ. 2011, 115, 1733–1742. [Google Scholar] [CrossRef]
  18. Meng, K.; Shi, X.; Wang, E.; Liu, F. High-altitude salt lake elevation changes and glacial ablation in Central Tibet, 2000–2010. Chin. Sci. Bull. 2012, 57, 525–534. [Google Scholar] [CrossRef] [Green Version]
  19. Lei, Y.; Yang, K.; Wang, B.; Sheng, Y.; Bird, B.W.; Zhang, G.; Tian, L. Response of inland lake dynamics over the Tibetan Plateau to climate change. Clim. Chang. 2014, 125, 281–290. [Google Scholar] [CrossRef]
  20. Song, C.; Huang, B.; Richards, K.; Ke, L.; Hien Phan, V. Accelerated lake expansion on the Tibetan Plateau in the 2000s: Induced by glacial melting or other processes? Water Resour. Res. 2014, 50, 3170–3186. [Google Scholar] [CrossRef] [Green Version]
  21. Zhou, J.; Wang, L.; Zhang, Y.; Guo, Y.; Li, X.; Liu, W. Exploring the water storage changes in the largest lake (Selin Co) over the Tibetan Plateau during 2003–2012 from a basin-wide hydrological modeling. Water Resour. Res. 2015, 51, 8060–8086. [Google Scholar] [CrossRef] [Green Version]
  22. Zhu, L.; Xie, M.; Wu, Y. Quantitative analysis of lake area variations and the influence factors from 1971 to 2004 in the Nam Co basin of the Tibetan Plateau. Chin. Sci. Bull. 2010, 55, 1294–1303. [Google Scholar] [CrossRef]
  23. Luo, P.; Mu, D.; Xue, H.; Ngo-Duc, T.; Dang-Dinh, K.; Takara, K.; Nover, D.; Schladow, G. Flood inundation assessment for the Hanoi Central Area, Vietnam under historical and extreme rainfall conditions. Sci. Rep. 2018, 8, 1–11. [Google Scholar] [CrossRef]
  24. Lyu, J.; Mo, S.; Luo, P.; Zhou, M.; Shen, B.; Nover, D. A quantitative assessment of hydrological responses to climate change and human activities at spatiotemporal within a typical catchment on the Loess Plateau, China. Quat. Int. 2019, 527, 1–11. [Google Scholar] [CrossRef]
  25. Huo, A.; Peng, J.; Cheng, Y.; Luo, P.; Zhao, Z.; Zheng, C. Hydrological Analysis of Loess Plateau Highland Control Schemes in Dongzhi Plateau. Front. Earth Sci. 2020, 8, 637. [Google Scholar] [CrossRef]
  26. Pekel, J.-F.; Cottam, A.; Gorelick, N.; Belward, A.S. High-resolution mapping of global surface water and its long-term changes. Nature 2016, 540, 418–422. [Google Scholar] [CrossRef] [PubMed]
  27. Feng, S.; Liu, S.; Huang, Z.; Jing, L.; Zhao, M.; Peng, X.; Yan, W.; Wu, Y.; Lv, Y.; Smith, A.R. Inland water bodies in China: Features discovered in the long-term satellite data. Proc. Natl. Acad. Sci. USA 2019, 116, 25491–25496. [Google Scholar] [CrossRef] [PubMed] [Green Version]
  28. Urban, T.J.; Schutz, B.E.; Neuenschwander, A.L. A survey of ICESat coastal altimetry applications: Continental coast, open ocean island, and inland river. TAO Terr. Atmos. Ocean. Sci. 2008, 19, 1. [Google Scholar] [CrossRef] [Green Version]
  29. Song, C.; Sheng, Y. Contrasting evolution patterns between glacier-fed and non-glacier-fed lakes in the Tanggula Mountains and climate cause analysis. Clim. Chang. 2016, 135, 493–507. [Google Scholar] [CrossRef]
  30. Birkett, C. The contribution of TOPEX/POSEIDON to the global monitoring of climatically sensitive lakes. J. Geophys. Res. Ocean. 1995, 100, 25179–25204. [Google Scholar] [CrossRef]
  31. Zhang, B.; Wu, Y.; Zhu, L.; Wang, J.; Li, J.; Chen, D. Estimation and trend detection of water storage at Nam Co Lake, central Tibetan Plateau. J. Hydrol. 2011, 405, 161–170. [Google Scholar] [CrossRef]
  32. Zwally, H.J.; Schutz, B.; Abdalati, W.; Abshire, J.; Bentley, C.; Brenner, A.; Bufton, J.; Dezio, J.; Hancock, D.; Harding, D. ICESat’s laser measurements of polar ice, atmosphere, ocean, and land. J. Geodyn. 2002, 34, 405–445. [Google Scholar] [CrossRef] [Green Version]
  33. Allen, R.; Pereira, L.; Raes, D.; Smith, M. Crop Evapotranspiration—Guidelines for Computing Crop Water Requirements—FAO Irrigation and Drainage Paper 56, 2004th ed.; Food and Agriculture Organization of the United Nations: Rome, Italy, 1998. [Google Scholar]
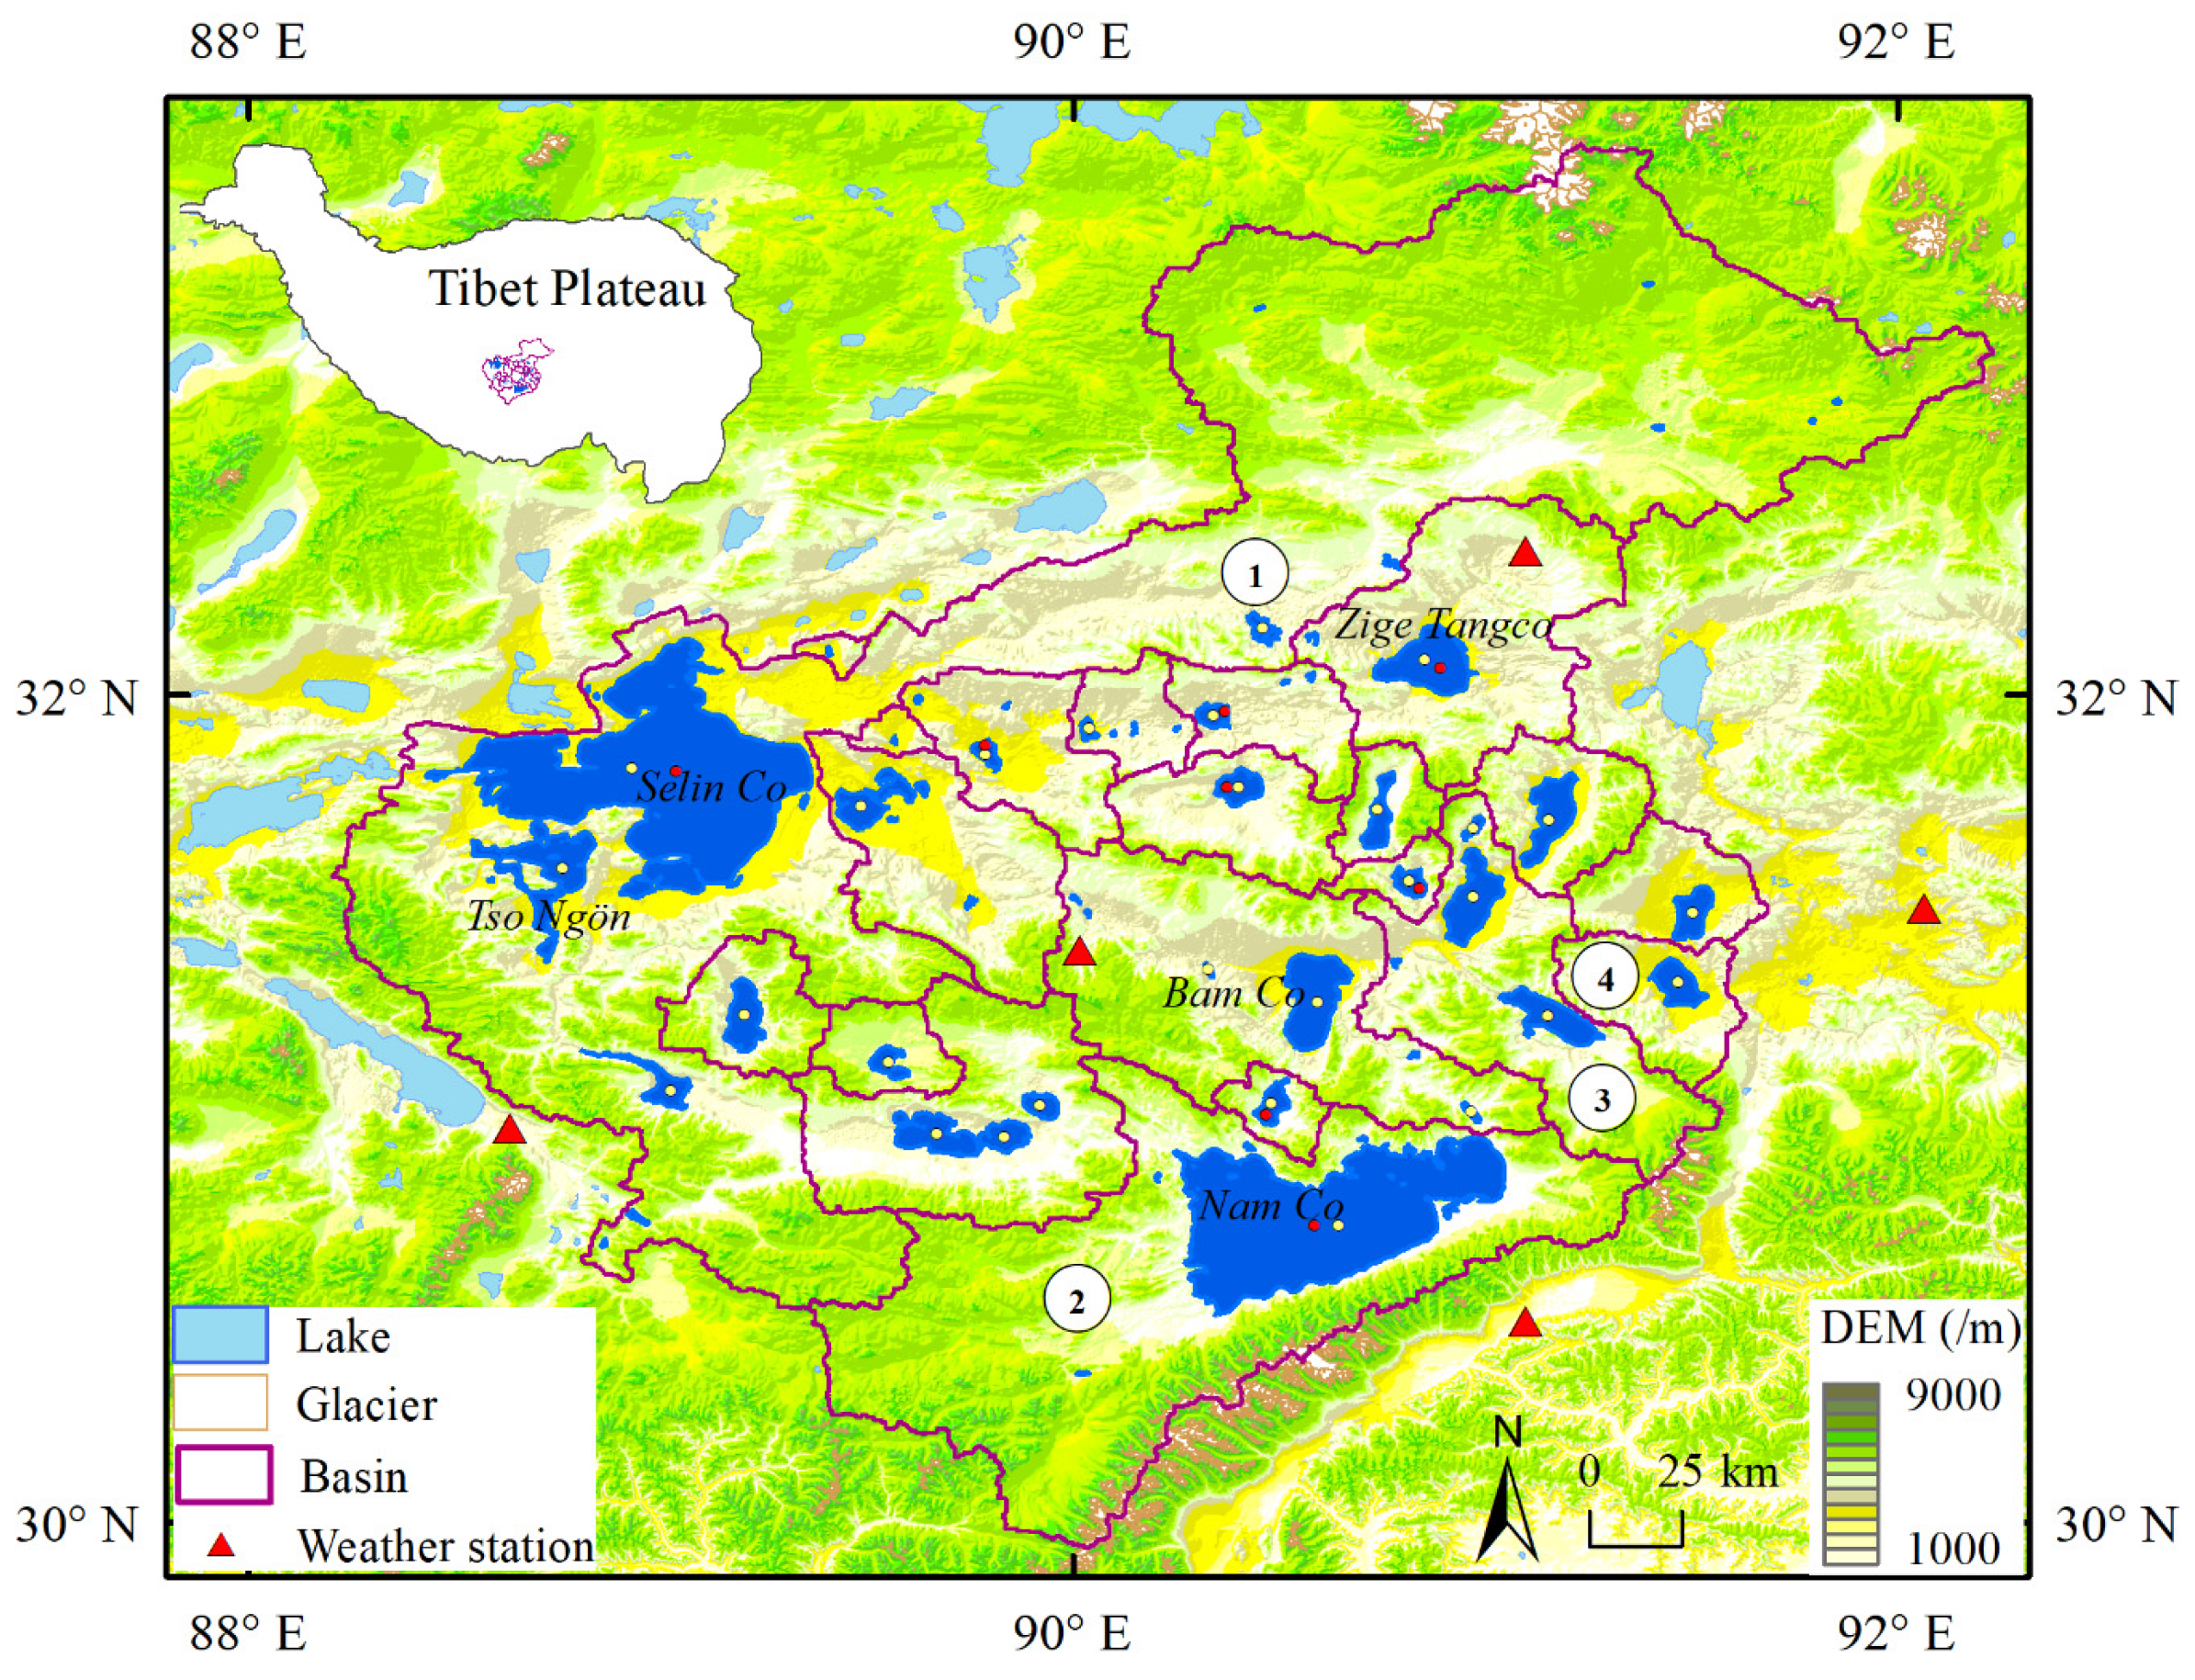
Figure 1. Spatial distribution of the studied lakes, watersheds, and meteorological stations on the southeastern TP. Red points on the lake indicate that CryoSat data are available for the lake and yellow points indicate that ICESat data are available. The Arabic numbers in black circles indicate the glacier-fed basins.
Remotesensing 13 04024 g001
Figure 2. Comparisons between ICESat and CryoSat data and gauged measurements of Selin Co in 2000–2020 (ac) indicate correlations between the two kinds of altimeter results and in-situ results, respectively.
Remotesensing 13 04024 g002
Figure 3. Comparison of areal variations for glacier-fed and non-glacier-fed lakes in 1989–2019.
Remotesensing 13 04024 g003
Figure 4. The obvious expansions of three representative lakes Nam Co (a), Selin Co (b), and Zige Tangco (c) in 1989–2019. The right two columns indicate lake boundaries of the three lakes in four years 1989, 2000, 2010, and 2019.
Remotesensing 13 04024 g004
Figure 5. (ah) Time series of lake area and altimeter-derived water level of eight lakes in 2000–2020.
Remotesensing 13 04024 g005
Figure 6. Comparison of lake area and water level changes of Puga Co (a) and Ringco Ogma (b) in 2010–2020.
Remotesensing 13 04024 g006
Figure 7. Annual precipitation (a), lake surface evaporation (b), and mean temperature (c) in 1966–2020, derived from five meteorological stations in the study area. The five thin and dashed lines of different colors in each chart represent variables of different stations, and the solid, red and thick line is the mean value of the five color curves. “G” and “NG” in the legends indicate the area of glacier-fed and non-glacier-fed lakes, respectively.
Remotesensing 13 04024 g007
Table 1. Characteristics of the 28 lakes with altimetry data on the southeastern TP.
NameLongitude
(°)
Latitude
(°)
Area
(km2)
Level
(m)
Glacier-Fed TypeAltimeter Data(Time Range)/Number of Datasets
/90.33 31.33 3.16 NCryoSat (January 2011–Feburary 2020)/3
Bamu Co90.59 31.26 232.38 4568.12 NCryoSat (January 2011–Feburary 2020)/21
Jiangchai Co90.46 32.16 30.69 4660.59 YCryoSat (January 2011–Feburary 2020)/13
Xuguo Co90.34 31.95 34.79 4609.97 NCryoSat (May 2011–Feburary 2020)/6
ICESat (Feburary 2004–October 2009)/12
Zige Tangco90.86 32.08 229.35 4573.20 NCryoSat (November 2010–November 2020)/23
ICESat (November 2003–March 2008)/6
Daru Co90.74 31.72 66.21 4688.78 NCryoSat (October 2011–November 2020)/4
90.97 31.68 12.21 4680.16 YCryoSat (April 2011–September 2020)/4
Dung Co91.15 31.70 144.74 4554.79 NCryoSat (October 2011–March 2017)/4
Jang Co90.82 31.55 39.32 4602.60 NCryoSat (January 2011–April 2020)/9
ICESat (November 2003–March 2008)/4
Pung Co90.97 31.51 165.47 4537.96 YCryoSat (January 2011–May 2020)/17
Ngoin Co91.50 31.47 80.07 4526.05 NCryoSat (December 2010–December 2020)/29
Bong Co91.15 31.22 145.94 4666.82 YCryoSat (March 2011–September 2020)/14
Neri Punco91.47 31.30 86.98 4529.05 YCryoSat (December 2010–January 2020)/22
Shen Co90.48 31.01 49.75 4734.94 NCryoSat (September 2013–September 2018)/4
ICESat (November 2006–April 2007)/2
Jiuru Co89.92 31.00 41.28 4687.27 NCryoSat (October 2011–November 2019)/11
/90.97 30.99 6.25 NCryoSat (March 2011–April 2018)/4
Nam Co90.65 30.71 2005.36 4726.54 YCryoSat (November 2010–December 2020)/53
ICESat (Feburary 2003–October 2009)/18
Namka Co89.79 31.85 26.81 4538.85 NCryoSat (December 2010–November 2020)/12
ICESat (October 2004–March 2008)/6
Dongqia Co90.40 31.78 65.16 4624.30 NCryoSat (January 2011–April 2020)/27
ICESat (Feburary 2003–September 2003)/4
Selin Co88.93 31.82 2153.44 4548.00 YCryoSat (July 2010–October 2020)/50
ICESat (March 2003–March 2009)/23
Pacuo90.04 31.92 12.25 4589.00 NCryoSat (Jun 2012–November 2016)/5
Tso Ngön88.76 31.58 286.09 4565.53 YCryoSat (November 2010–November 2020)/21
Bangkog Co89.49 31.73 122.80 4526.54 NCryoSat (January 2011–December 2020)/20
Mugqu Co89.03 31.04 81.65 4675.04 YCryoSat (Aug 2012–October 2013)/3
Gomang Co89.20 31.22 110.10 4634.29 NCryoSat (April 2012–Feburary 2019)/9
Puga Co89.55 31.11 40.88 4794.84 NCryoSat (May 2011–Jun 2019)/10
Ringco Kongma89.67 30.94 126.84 4661.45 NCryoSat (September 2010–October 2020)/23
Ringco Ogma89.83 30.93 63.25 4661.47 NCryoSat (April 2011–May 2020)/8
Table 2. Change rates and corresponding p-values in six intervals of the studied period for glacier-fed and non-glacier-fed lakes.
Glacier-Fed LakesNon-Glacier-Fed Lakes
V (km2/y)p-Value < 0.05V (km2/y)p-Value < 0.05
1989–199230.98Y27.34Y
1992–1998−5.61N−6.75Y
1998–200585.65Y39.75Y
2005–201018.98Y3.57N
2010–20173.25N−7.35Y
2017–201926.65N6.88N
Table 3. Comparison between glacier-fed and non-glacier-fed lakes in terms of water level change rate, area, and lake volume changes in 2003–2020.
AltimetryICESat (2003–2009)CryoSat (2010–2020)
Lake typeGlacier-fedNon-glacier-fedGlacier-fedNon-glacier-fed
NameNam CoSelin CoXuguo CoZige TangcoNeri PuncoPung CoSelin CoPuga CoRingco OgmaBamu CoBangkog CoNgoin CoNamka CoDongqia CoRingco Kongma
Level rate (m/y)0.220.630.240.38−0.16−0.150.19−0.22−0.24−0.17−0.11−0.11−0.14−0.18−0.22
Average annual area (km2)2005.362153.4434.79229.3593.31177.822404.6840.8867.43253.32126.9685.4029.5372.51138.16
Average growth rate 1 (m/y)0.430.360.16−0.17
Whole area 2 (km2)4158.80264.142675.80814.18
Changed volume 3 (Gt/y)1.800.100.42−0.14
1 The average growth rate means the growth rate of water level in per square kilometer. 2 The whole area is the sum of average annual area for glacier-fed or non-glacier-fed lakes during the two separate periods. 3 Changed volume = Average growth rate × Whole area × Water density (103 kg/m3).
Publisher’s Note: MDPI stays neutral with regard to jurisdictional claims in published maps and institutional affiliations.