Abstract
In this paper, we propose a deep neural network-based method for estimating speed of vehicles on roads automatically from videos recorded using unmanned aerial vehicle (UAV). The proposed method includes the following; (1) detecting and tracking vehicles by analyzing the videos, (2) calculating the image scales using the distances between lanes on the roads, and (3) estimating the speeds of vehicles on the roads. Our method can automatically measure the speed of the vehicles from the only videos recorded using UAV without additional information in both directions on the roads simultaneously. In our experiments, we evaluate the performance of the proposed method with the visual data at four different locations. The proposed method shows 97.6% recall rate and 94.7% precision rate in detecting vehicles, and it shows error (root mean squared error) of 5.27 km/h in estimating the speeds of vehicles.
1. Introduction
As urbanization has accelerated, traffic in urban areas has increased significantly, and the similar phenomenon has been appeared in freeways connected to the urban areas as well. The real-time monitoring of traffic on freeways could provide sophisticated traffic information to drivers, so the drivers could choose alternative routes to avoid heavy traffic [1]. Furthermore, long-term records of traffic monitoring will be helpful for developing efficient transportation policies and strategies across urban and suburban areas. Currently, the typical means of monitoring traffic information use closed circuit television (CCTV) or detection equipment. The detection equipment includes loop detectors [2], image detectors [3], dedicated short range communication (DSRC) [4], and radar detectors [5]. In general, CCTVs are installed at fixed locations, and they can monitor the area on the freeway 24 hours a day. CCTV can monitor only limited areas; therefore, multiple CCTV circuits are necessary to monitor a wide range of freeways. However, the installation and maintenance of the multiple CCTV circuits is costly. In addition, it is difficult to detect vehicles in CCTV videos automatically due to the overlapping between vehicles because CCTV usually captures freeways in an oblique direction.
Recently, to overcome the limitations of collecting traffic information through CCTV, video collection methods employing unmanned aerial vehicles (UAVs) are being used [6]. Unlike CCTV, a UAV can monitor a wide range of freeways by elevating its altitude or moving its location, and it can travel to a specific location to observe unexpected situations, such as traffic accidents. Furthermore, a UAV views the freeways in a perpendicular direction, so the vehicles in the recorded videos do not overlap. Currently, however, videos from installed CCTV or operated UAVs are monitored by humans. Therefore, as the number of CCTV circuits and UAVs increases, more human resources are required. Moreover, we can not avoid human error; it is highly demanding to analyze real-time videos to effectively monitor traffic information.
A number of methods have been developed to automatically analyze traffic conditions on freeways using videos from CCTV or dash cam. In [7], the vehicle was detected using Mask RCNN [3] from the surveillance video taken with a fixed camera, and the vehicle speed was calculated. In [8], a vehicle was detected in the image using Ada-Boost, which uses multiple weak classifiers to construct a strong classifier. Recently, as artificial intelligence technology has rapidly advanced, road image analysis methods using deep learning are also being proposed. A deep learning-based object detection method, Faster R-CNN [9], was used to detect vehicles in images [10].
There have also been various attempts to automatically measure traffic from road videos taken by UAVs [11,12,13,14]. Most of these methods consist of object detection techniques [15] for capturing vehicles in images and object tracking techniques for identifying the movements of detected vehicles, and the speed of vehicles are calculated at the end. In [16], various types of vehicles were detected from UAV video using Yolo v3 [17]. In [18], the vehicle speed was calculated from the results of tracking the vehicle using the moving average of the previous frame and the Kalman filter [19]. A Haar-like feature-based cascade structure [11] is used to detect the location and size of a vehicle in the image with a bounding box, and the convolutional neural network (CNN) method [20,21] was applied to the detection results to improve the final classification performance. Traffic volume was also calculated by tracking the movement of the vehicle using the KLT-optical flow [22].
In contrast to CCTV videos taken at a fixed height, the altitude of UAV varies at every time the video is recorded, and sometimes the altitude of UAV changes during recording. If the image scales are not fixed, we are not able to estimate the vehicle’s traveling distance on the actual road by simply measuring moving distance of the vehicle in sequential images. Therefore, to determine the exact speed of a vehicle by tracking the vehicle in sequential images, the image scale of each image should be estimated and the changes in the image scale should be taken into account. For example, the scale of the image was obtained by comparing a pre-defined structure on an actual road with its corresponding object in the first frame of a video [23]. This approach requires a pre-definition of a structure for each location; therefore, images without known structures cannot be utilized. Later, the image scale is calculated by comparing the average sizes of vehicles in the images and pre-measured and averaged actual vehicle size in [12,20]. Although these methods have somewhat resolved the restrictions associated with a UAV’s flight area, the calculated image scale is not accurate because the size of vehicle varies depend on the types of the vehicles. For instance, a detected vehicle can include sedans, vans, buses, of trucks.
In this paper, we propose a method for quantitatively measuring traffic flow in real-time by automatically estimating the vehicle’s speed from the only videos recorded via UAV without any external information. First, we distinguish road areas using a deep learning-based segmentation technique [9] in UAV images and detect lanes using a detection technique [12]. Then, we calculate the scale of each image, based on the number of pixels between the lanes in the image and the lane width, defined by the road laws in the country in which the images were taken. We detected vehicles in UAV images using a deep learning-based object detection technique [7], calculated vehicle speed in pixels from pixel travel distance per unit second of vehicles using a tracker [20], and then estimated the actual driving speed of vehicles based on the previously calculated image scale information. Since the proposed method tracks the movement of the vehicle, we measure the flow of the vehicle separately in terms of both directions on each road. To this end, as a reference value for the scale calculation of drone images, we used lane widths with constant size information depending on the type of road in each country. Based on the tracking results on the direction of vehicle movement, the proposed method measures traffic flow by separating the roads into two different directions.
The main contributions of this paper are as follows.
- (1)
- The proposed method automatically estimates vehicle speeds on roads from the videos recorded via UAV. In most other related research using the deep learning approach, however, they only detect and track vehicles in the recorded videos.
- (2)
- In other research work, the authors use prior knowledge, such as the image scale, the size of the structure, or the size of the vehicles. On the contrary, the proposed method does not require additional information other than the video data to estimate the speeds. We utilize the distance between the lane markings on roads to estimate the speeds of vehicles. Those distances are regulated in most countries.
- (3)
- Based on the analysis of the vehicle’s motion on the road, the proposed method measures the speed of the vehicle in each direction of the road.
- (4)
- The proposed method detects the vehicle from the UAV image and calculates the speed in real time.
The rest of this paper is organized as follows: Section 2 describes the studies related to image analysis using deep learning, and Section 3 presents the proposed UAV image analysis method for traffic flow analysis. Section 4 presents the experimental results of the proposed method, followed by discussions and conclusions in Section 5 and Section 6, respectively.
2. Preliminaries in Image Analysis Using Deep Learning
With the recent advances that have been achieved in deep learning techniques, various methods for object detection in images have been proposed. For example, Faster R-CNN [9], using feature pyramid network (FPN) structures, has been shown to have the ability to effectively detect objects of various sizes; it does this by generating feature maps whenever images pass through layers of CNNs, then combining them in a top-down manner. EfficientDet [24] adopts a Bi-directed FPN (BiFPN) structure that improves FPN structure for object detection. The architecture of BiFPN performs both top-down and bottom-up combinations of feature maps created in the upper layers of the lower layers, and it applies ‘Cross-Scale Connection’, where connections exist between layers with different scales. It also extracted fused features more effectively by learning different weights on input features from levels with different resolutions.
Image segmentation techniques can be used to segment road regions from UAV images taken from above. U-net [25] is a representative deep learning-based image segmentation technique that distinguishes the boundaries of objects on a pixel-wise basis. U-net is a fully convolution network (FCN) based method for accurate segmentation that requires less data; it is represented by a ‘U’-shaped network consisting of a contracting path and an expansion path: the contracting path, which consists of a general CNN structure, captures the context of the image. Meanwhile, the expansive path performs accurate localization by upsampling the feature maps and combining them with the context information captured by the contracting path. The pixel information disappears as the reduced-size image grows again through upsampling in the expansion path through the convolution layer. U-net performs more sophisticated segmentation by adding a skip connection that delivers information directly from the contracting path to the expansion path.
There are some segmentation techniques that can also be used to detect lanes in road areas. For example, Lane-Net [26] is an ‘end-to-end’ deep learning based segmentation technique that is specialized for lane detection in road areas; it contains a shared encoder and two decoders, both of which are configured based on ENet [27]: One of the two decoders is for segmentation while the other is for instance embedding. The technique [11] used in Lane-Net clusters each lane during the learning process, rather than doing so in post-processing. Lane-Net performs binary segmentation on pixels that correspond to lanes and non-lane pixels in the image, then separates the segmented pixels by each lane.
Visual tracking techniques [20,23] are used to analyze vehicle movements. The simple online and real-time tracking (SORT) method can be used in conjunction with deep learning based object detection algorithms, which take detected bounding boxes as input and which track objects using the Kalman filter [19,20] and the Hungarian algorithms [24,28]. The displacement between frames for each object is approximated by a linear constant velocity model that is independent of the motion of other objects and cameras, and if detection is related to the target, the model updates the state of the target with the detected bounding box. Based on the object detection results for each frame in the video, SORT tracks multiple objects at high speed by determining that if a large portion of the bounding boxes overlap between frames, then they all correspond to the same object. Deep SORT [28], which additionally uses deep learning features with the Kalman filter, has been proven to have robust tracking performance for occlusion.
3. Proposed Method
The proposed method for analyzing traffic from UAV images consists of three modules: First, deep learning technologies are used to detect and track vehicles on the road to calculate the distance that pixels corresponding to vehicles have traveled. We also extract road information, such as the location of the road in the image and lane detection, the calculate the scale of the image. At this point the actual speed of the vehicle is calculated based on the distance traveled by the vehicle in pixels while considering the scale information of the image. The overall flow of the proposed method is depicted in Figure 1.

Figure 1.
Overall flow of the proposed method.
The video data used in this study consists of videos taken from UAV (drone) on roads in four sections of Republic of Korea (Namsa, Seohae Bridge, Noji, and Seonsan). The image size is , and the images were recorded at 30 frames per second (FPS) for eight to nine minutes (14,000 to 16,000 frames in total). Since UAV images are taken at high altitudes, about 80% of the original images contain surrounding structures or terrain, which are irrelevant to this study as they are not roads. Therefore, in this paper, we cropped the images to sizes of around the road area, as illustrated in Figure 2.
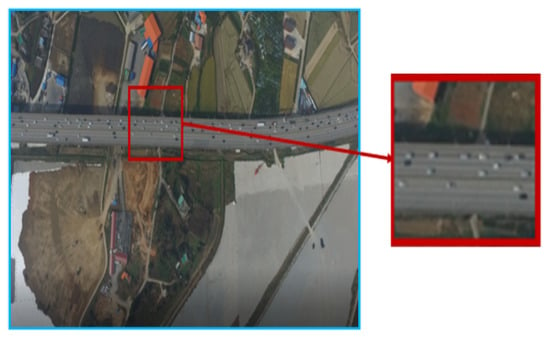
Figure 2.
Example of UAV image used in the experiment.
3.1. Measuring the Moving Distance of Pixels Corresponding to Vehicles
To analyze the movement of vehicles in the video, it is first necessary to identify how many vehicles are on the road. Among several deep learning-based detectors for vehicle detection, the proposed method utilizes EfficientDet [24] to accurately detect vehicles in real time in every frame of drone images. EfficientDet, which uses EfficientNet [29] as a backbone, is a network that quickly and effectively detects objects by optimizing the size of the model using BiFPN and compound scaling. As the confidence score threshold is set lower, the detection rate (recall) of the detector increase. Lowering the threshold increases the number of false positive samples, which result in lower precision. In this experiment, we set the threshold of the detector such that the detection rate is greater than 95%.
Figure 3 shows the results of detecting vehicles using EfficientDet in UAV images. As shown in Figure 3, EfficientDet has successfully detected all vehicles in the image. In the figure, the blue box shows a mis-detected result (wherein a non-vehicle object was incorrectly determined to be a vehicle). However, these mis-detection results are almost fully eliminated in the subsequent tracking of vehicles.
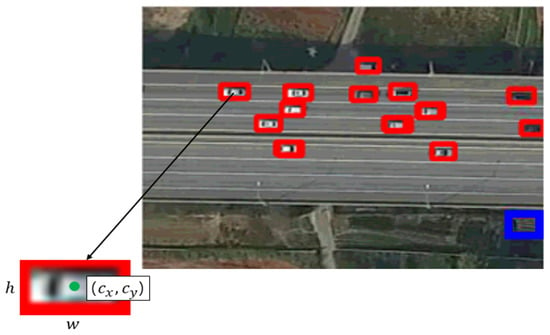
Figure 3.
Vehicle detection results using EfficientDet.
Based on the vehicle detection results for individual UAV image frames, we track the movements of each vehicle using SORT [30] Existing tracking methods, such as KLT-Feature Tracker [22], track objects by connecting identical pixel values between frames, which involves a relatively high computational cost because all pixels in the image must be compared; further, the performance is degraded when the pixel values of the same object change due to changes in lighting. By contrast, since SORT tracks the movement of an object using a bounding box that is a result of a vehicle (object) detector, the tracking speed is fast, and good object detection performance improves tracking performance. In Figure 4, the bounding box is represented in the form of , and represent the center coordinates of the object in the horizontal and vertical directions, respectively, and w and h represent the width and height of the bounding box, respectively. is the confidence score, which refers to the probability that the object being detected will be located within the bounding box. In Figure 5a,b, there is a time difference of 20 s, and the same colored bounding box in both figures means the exact vehicle.
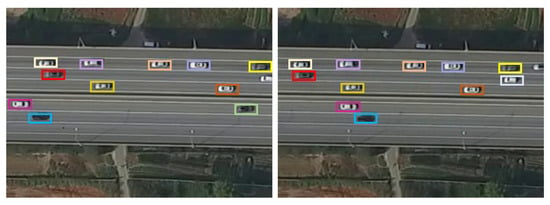
Figure 4.
Result of tracking the identical vehicles at 20 s intervals using SORT.
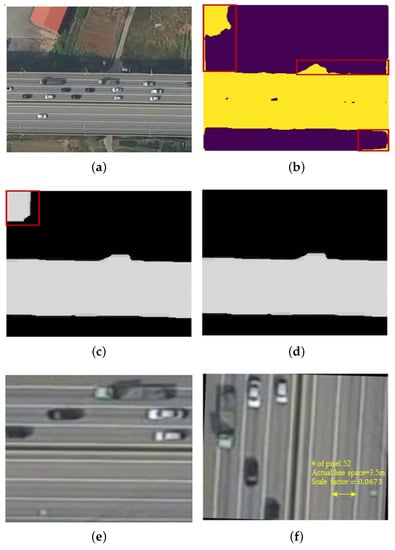
Figure 5.
Segmentation result pre-processing. (a) road area; (b) U-net segmentation; (c) image morphology; (d) calibrated image; (e) resizing image; (f) rotated image.
SORT uses the object detection results in the frame at time t and the frame at time , and it tracks the object motion by considering an object to be the same object in instances when the bounding box overlaps by a certain area. The object tracking results are represented in the form of , is the frame index for the current time point t, so the first frame of the video is automatically excluded. i is the identity for each vehicle (object) detected in the image. i is sequentially assigned to each frame for the entire video (i.e., the largest i in the last frame of the video is the number of vehicles detected throughout the video).
The pixel-wise moving distance of a vehicle in images was calculated using the locations of the same object (vehicle) in two frames, and the time interval at which the two frames were taken was taken from the FPS information of the video and the vehicle tracking results. To reduce the effects of errors in vehicle detection bounding box coordinates and efficiently handle any errors that do arise, we measure the vehicle’s moving distance at intervals of one second (30 frames) instead of doing so every frame. We calculate the pixel-wise moving distance of the i-th vehicle in the m-th frame and the n-th frame as follows.
Here, is the center point of the x-axis of the i-th vehicle in the frame.
3.2. Estimating the Scale of an Image
Since the scale of UAV images varies with flight altitude, the scale of the images must be estimated before the number of pixels traveled by the vehicle in the image can be converted to the distance traveled by the vehicle on the real road. Since, in most countries, lane width is prescribed by regulations on the structure and facility standards of roads, the proposed method used the distance between lanes as a reference to estimate the scale information of images. The process used to estimate the scale of the proposed image is illustrated in Figure 5.
To calculate the distance between lanes, we first detect the lanes in the image. Among the various techniques for automatic lane detection in road images, Lane-Net [26] is a deep learning-based method that can simultaneously detect multiple lanes, and it performs well in detecting various forms of lanes. However, most lane detection techniques, including Lane-Net, aim to be applied to autonomous vehicles, and therefore use models trained with road images taken using cameras mounted on vehicles such as dash cam. By contrast, in UAV images, direction of the road in the image may vary depending on the UAV’s flight direction. In addition, lanes appear thinner in UAV images taken at a distance than they do in images taken from vehicles. Therefore, to apply Lane-Net to UAV images, we first pre-processed the lane region of UAV images to look similar to black-box images.
Figure 5 shows example images at each step of the pre-processing for lane detection. First, we segment the road area shown in Figure 5a using U-net [25] which is widely used as an image-segmentation network from UAV images containing surrounding areas other than roads. For the learning of U-net, we construct a training dataset for road segmentation by labeling only road areas (except for vehicles) on the whole road. The segmentation results by U-net were partially calibrated in pixels using image morphology [25] operations in Figure 5b. In the example sample in Figure 5c, two pixel clusters were created by U-net, in which case we remove a small pixel cluster based on prior knowledge about for road images. Figure 5d is a cropping of parts corresponding to the road area (large pixel cluster in Figure 5e and resizing it to a size of for Lane-Net use. Then, based on the vehicle movement direction obtained from the vehicle tracking results in Section 3.1, the image was rotated so that the lane in the image was in the longitudinal direction in Figure 5f.
Figure 6 illustrates the lane detection results obtained using Lane-Net for pre-processed images. Some noise and mis-detection from the results by Lane-Net are calibrated using image morphologic operations as well as Hough transform [31]. Figure 6a shows lane detection results using Lane-Net for pre-processed images. Figure 6b shows the image morphology operations used to calibrate some noise and miss detection results based on Lane-Net’s lane detection results. If both edges of the lane were detected as separate straight lines by the Hough transformation, as shown in Figure 6c, then the mean of the coordinates of both edges was set to the position of the corresponding lane. When N lanes were detected in the image, lane spacing was calculated. The median strip of the road may be mis-detected as lanes or some lanes may be undetected, so we set the median of the lane interval calculations as lane spacing in the corresponding road image to avoid the occurrence of any lane spacing estimation errors caused by such detection errors. If the estimated number of pixels between lanes in a UAV image is E, then the scale factor (s) of the corresponding image is set as based on the lane spacing (W) prescribed by the road laws in each country (Korean, road traffic regulations stipulate that lane widths 3.5 m on highways and 3.0 m on national roads).
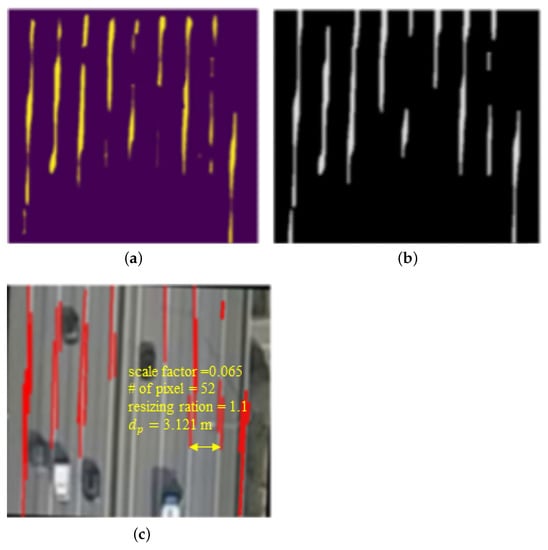
Figure 6.
Lane detection process in three steps. (a) Lane-Net for pre-processed image; (b) image morphology operations; (c) detection of straight lines by the Hough transform.
3.3. Measuring Actual Vehicle Speed from UAV Images
Since the altitude of a drone can change according to variations in air that occur during filming, such as wind, the scale factor can even change from frame to frame within the same video. In response to this phenomenon, the proposed method updated the scale factor of the images at intervals of around 20 s. Moreover, since lanes are often obscured by vehicles, we used the frame with the smallest number of detected vehicles in the image to update the scale factor among image frames with intervals of approximately 20 s.
The actual speed of the i-th vehicle in the image can be calculated from the number of pixels the vehicle has moved, the measurement of which is described in Section 3.1, as well as the scale factor of the UAV image, the estimation of which is described in Section 3.2. The actual distance corresponding to n pixels in the image is m, where r is the resizing ratio in pre-processing for lane detection (see Figure 6c). If the time interval between the two frames and is T, then the vehicle’s actual speed is m/s, which converted to speed per hour is 3.6 km/h (in this experiment T = 1). From a given UAV road image, a vehicle speed indicator for traffic situation analysis for that road was represented as the average of speed , of vehicles present on the road.
4. Experimental Results
4.1. Data Set
A drone video for the road sections of four regions (Namsa, Seohaegyo bridge, Noji, and Seonsan) in Korea was used for experiments (Figure 7). Images from each section were taken for nine minutes at 30 FPS (frames per second), meaning that frames sampled at 1 s intervals were ultimately used in this experiment. The images of three out of the four sections were used to learn networks (EfficientDet, U-net, and Lane-Net), while the images of the remaining section were used for testing purposes. This process was repeated four times in the alternating test section, and the results were averaged and reported as the final performance. Table 1 list the regions used for training and testing of the sets.

Figure 7.
Configuration of experimental data set. (a) Namsa; (b) Seosan; (c) Noji; (d) Seoheagyo Bridge.

Table 1.
Configuration of the experimental data.
4.2. Experiment Setting
The experiment was performed on Linux Ubuntu 16.04.4 LTS with 16GB of memory and a GPU with GTX Titan X, and pytorch Build was used by installing stable(1.2) CUDA 9.2. User parameters considered when designing a deep learning network are the learning rate, batch size, and network size. Since there is no general rule for determining the batch size, we empirically set the batch size. To effectively train a deep neural network, the learning rate should be set to a high value if the batch size is large. In contrast, when the batch size is small, a low learning rate should be set to mitigate the influence of defective data in each batch. Therefore, we set the learning rate to using the linear scaling learning rate method [32] to determine the learning rate for each deep learning network (EfficientDet, Lane-Net, U-net). We experimented with the batch sizes of 32 for all networks.
4.3. Performance Evaluation
The performance of the proposed method can based on evaluated by the vehicle detection performance, the accuracy of estimating the scale factor of the UAV image, and the accuracy of the average speed measurement of vehicles based on these results. The vehicle detection performance using EfficientDet was evaluated according to the receiver operating characteristic (ROC) curve along with true positive rate and false positive rate, which are widely used in detection methods. For the predictive value and ground truth value of the detection, true positive (TP) and true negative (TN) are defined for cases in which the predictions and ground truth values are the same, and false positive (FP) and false negative (FN) are defined for cases in which the predictions and true values differ. The main metrics used for the performance evaluation are as follows: (1) accuracy : the ratio of the number of correctly predicted observations to the total number of observations; (2) recall (): the ratio of the number of correctly predicted positive observations to the total number of observations actually belonging to the positive class; (3) precision (): the ratio of the number of correctly predicted positive observations to the total number of predicted positive observations; and (4) F1-score: the weighted average of precision and recall, i.e., .
Efficient-Det has eight types of networks, which range from EfficientDet-D0 to EfficientDet-D7 according to the depth of the network [24]. To find a suitable network for the data used in this experiment, we conduct comparative experiments of EfficientDet-D2 and EfficientDet-D3; Table 2 presents the recall, precision, and F1-score for Efficient-Det D2 and EfficientDet-D3. The values listed in Table 2 are the averages of the results for the four fold sets. The confidence score threshold, a parameter for EfficientDet, is set to have a recall of more than 95%. As shown in Table 2, there was no significant difference in detection performance between EfficientDet-D2 and EfficientDet-D3, and we used the low computational EfficientDet-D2 in our experiments to measure the speed of the vehicle. Figure 8 depicts the ROC of the vehicle detection results using EfficientDet-D2 for fold set 1.

Table 2.
Performance comparison of EfficientDet-D2 and EfficientDet-D3.
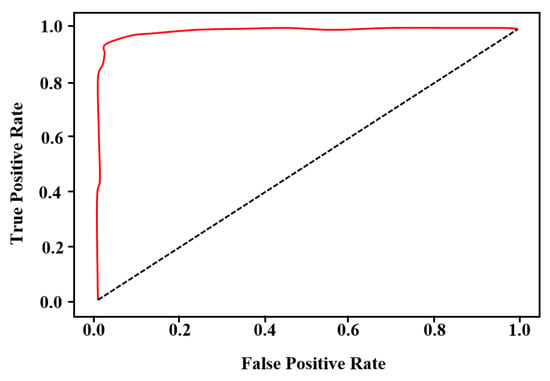
Figure 8.
ROC curve of vehicle detection results using EfficientDet-D2 for fold set 1 (AUC = 0.989).
Figure 9 illustrates the result of calculating the scale factor of the image at 20-s intervals from a drone video of about 10 min of the ‘Seohae Bridge’ section. The horizontal axis in Figure 9 is an index of images sampled at intervals of 20 s, while the longitudinal axis is a scale factor estimated using the proposed method. As shown in Figure 9, the scale factor fluctuates between 0.06 and 0.075, depending on the frame; this is because the altitude of the drone changes due to the influence of wind or other factors during flight. We can see that the proposed method properly estimates the scale factor from the image based on the result, wherein the scale factor is large when the actual image is zoomed out and wherein the scale factor becomes small when zoomed in.
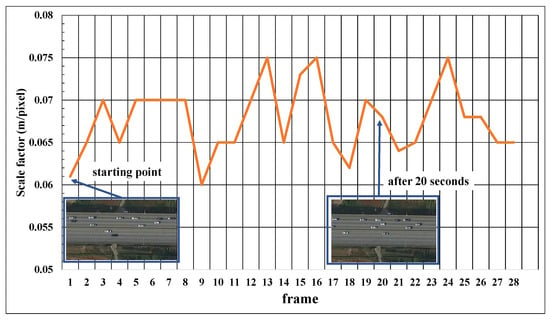
Figure 9.
Scale factor (s) calculation result.
Figure 10 shows the average vehicle speed, which is automatically measured from drone images using the proposed method. The vehicle speeds of were measured in both directions of the road. As show in Figure 10, there is a slight change in the speed of the vehicle on the upper and lower roads over time. The difference in vehicle speed on the lower road is large compared to that on the upper road, because the speed result for the road is the average value of the speed of multiple vehicles on the road. In other words, the speeds of some vehicles significantly affect the overall measurement results on the lower road with fewer vehicles than the speeds of the same number of vehicles would on the upper road with many vehicles. Indeed, on a road with few vehicles, there is a relatively large speed difference between the passing lane.
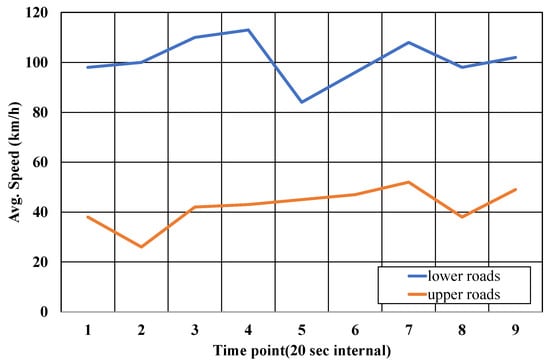
Figure 10.
Speed estimation result.
As shown in the figures depicting the results of upper roads with a large number of vehicles, the speed of vehicles on such roads is measured to be less than that on lower roads, indicating that the proposed method is accurately measuring vehicle speed. On the other hand, since the results of vehicle speed measurements are directly affected by errors in each step (vehicle tracking, lane detection, and scale factor estimation of images) of the proposed method, the measured speed experiences slight changes even in frames at 1 s intervals. Therefore, we calculated the final speed measurement value for the road as the average value of the measurement over a period of 20 s. In the case of the lower road with low traffic in Figure 10, showing results for the lower road, considering that the prescribed speed limit of the corresponding road is 100 km/h, the speed of 90–120 km/h automatically measured by the proposed method can be regarded as a reasonable result. Table 3 shows the root mean squared error for the lane detection, vehicle detection, and vehicle speed measurement modules. In Table 3, the proposed method showed excellent performance for each module.

Table 3.
Root-mean-square error (RMSE).
5. Discussion
Unlike conventional detection equipment and CCTV images for road traffic information collection, traffic analysis using UAVs has the advantage of being able to simultaneously collect a wide range of traffic information without having any spatial constraints on the installation location of the camera. However, smaller UAVs, such as drones, are easily influenced by airflow, which can lead to camera shaking; further, the flight path of UAVs varies from time to time, even within the same region, which therefore changes the background contained in UAV images. In addition, since the entire scene rotates or the image scale changes with the flight direction and altitude of the UAV during shooting, it is very challenging to automatically identify the movement of the vehicle and analyze the flow of traffic from UAV images.
Some methods of estimating the vehicle speed from the UAV image have been proposed. Still, they use prior knowledge such as the image scale, the size of the structure, or the size of the vehicles to estimate the actual vehicle’s speed. On the contrary, the proposed method automatically calculates vehicle speeds on roads from the only videos recorded via UAV without additional information.
This study aims to estimate the speeds of vehicles on roads using videos recorded by UAVs in high altitudes. Therefore, it is very difficult to obtain the ground truth about the actual vehicle speed in the UAV images. In estimating the speeds from the videos recorded using CCTV, there are previous research works that evaluate the performance using the actual speed. However, to our best knowledge, no research work evaluates its performance using the ground truth in estimating the speeds using UAV. In most of the related work, including this study, the performance of the method is evaluated in terms of qualitative way (Table 4). Instead, we performed the quantitative evaluation for each module, i.e., detecting lane markings, recognizing vehicles, and estimating the speeds. As a result, it showed an error (root mean squared error) of 0.8831 (pixel), 0.8849 (pixel), and 5.27 (km/h) for each.

Table 4.
Summary of the characteristics of several approaches for traffic analysis from road images.
As shown in Figure 1, the proposed method measures the speeds of vehicles automatically from visual data recorded by the UAV. However, when a UAV image is taken at a high altitude, the surrounding terrain and structures other than the road occupy most of the image, and the resolution of the road area is decreased. Therefore, as shown in Figure 2, we manually cropped raw images to fit the size of . In order to analyze road conditions regardless of the UAV shooting conditions, we need a module that can more effectively distinguish between road and off-road areas and a module for detecting and tracking objects in low-resolution images. These objectives are future works, and we plan to build a fully automated system that includes the preprocessing step. In addition, to estimate the speeds of vehicles in videos recorded when UAVs are moving, we will consider the relative speeds between the vehicles and also the structures on roads in future work.
6. Conclusions
In this paper, we propose a method for grasping the flow of traffic from UAV images using various deep learning techniques developed for image analysis. The proposed method consists largely of a module that analyzes the motion of the vehicle based on an EfficientDet-based vehicle detection and SORT tracking results, a module that computes the scale of the image through road area segmentation and lane detection in UAV images using U-net and Lane-Net, and a module that calculates the actual speed of the vehicle based on vehicle tracking results and image scale information. Existing traffic analysis methods based on UAV images mainly utilize prior information about road structures or the actual size of the vehicle to obtain scale information of the images. However, information about road structures varies from region to region, and there are limitations in measuring the exact size of the vehicle due to the large variations in the size of the actual vehicle depending on the type of vehicle. By contrast, the proposed method utilizes lane information extracted from the analysis of UAV images, so scale information can be obtained without requiring any separate prior information about roads in the region. Further, while other methods analyze the traffic volume for the entire road in the image, the proposed method enables effective road traffic analysis by calculating the speed of each vehicle in both directions of the road based on the moving direction of the vehicle.
We evaluated the performance of the proposed method through experiments on nine-minute videos recorded by drones for nine minutes for four regions. Since there is no actual data on the altitude of the drone in flight or the actual speed of the vehicles in the drone image, the measurement result of the image scale was qualitatively evaluated based on the change in the size of the structure and the road area in the image for the same background. The vehicle speed was also qualitatively evaluated based on the speed limit of the road in that particular area. The experimental results confirmed that the proposed method accurately tracks vehicle movement well in real time and effectively calculates the vehicle speed by reflecting the change in image scale change according to the change in the drone’s flight altitude.
Author Contributions
Conceptualization, methodology: S.B. and S.-I.C.; funding acquisition: J.M. and S.-I.C.; writing—review and editing: S.B., I.-K.S., J.M., J.K. and S.-I.C.; Software: S.B., I.-K.S. and S.-I.C.; formal analysis investigation: J.K. and S.-I.C., data curation and validation; S.B., I.-K.S., J.K., and S.-I.C.; visualization: S.B. and I.-K.S.; writing—original draft preparation: S.B. and S.-I.C.; project administration: S.-I.C. All authors have read and agreed to the published version of the manuscript.
Funding
This work was supported in part by the National Research Foundation of Korea through the Korean Government (MSIT) under 2021R1A2B5B01001412 and the Republic of Korea’s MSIT (Ministry of Science and ICT), under the High-Potential Individuals Global Training Program) (No. 2020-0-01463) supervised by the IITP (Institute of Information and Communications Technology Planning & Evaluation).
Institutional Review Board Statement
Not applicable.
Informed Consent Statement
Not applicable.
Conflicts of Interest
The authors declare no conflict of interest.
References
- Irvine, S.; McCasland, W. Monitoring freeway traffic conditions with automatic vehicle identification systems. ITE J. 1994, 64, 23–28. [Google Scholar]
- Coifman, B. Vehicle level evaluation of loop detectors and the remote traffic microwave sensor. J. Transp. Eng. 2006, 132, 213–226. [Google Scholar] [CrossRef] [Green Version]
- He, K.; Gkioxari, G.; Dollar, P.; Girshick, R. Mask R-CNN. IEEE Trans. Pattern Anal. Mach. Intell. 2020, 42, 386–397. [Google Scholar] [CrossRef] [PubMed]
- Kenney, J.B. Dedicated short-range communications (DSRC) standards in the United States. Proc. IEEE 2011, 99, 1162–1182. [Google Scholar] [CrossRef]
- Anitori, L.; Maleki, A.; Otten, M.; Baraniuk, R.G.; Hoogeboom, P. Design and analysis of compressed sensing radar detectors. IEEE Trans. Signal Process. 2012, 61, 813–827. [Google Scholar] [CrossRef]
- Seo, S.H.; Lee, S.B. A study on traffic data collection and analysis for uninterrupted flow using drones. J. Korea Inst. Intell. Transp. Syst. 2018, 17, 144–152. [Google Scholar] [CrossRef]
- Zhang, H.; Liptrott, M.; Bessis, N.; Cheng, J. Real-time traffic analysis using deep learning techniques and UAV based video. In Proceedings of the 2019 16th IEEE International Conference on Advanced Video and Signal Based Surveillance (AVSS), Taipei, Taiwan, 18–21 September 2019; pp. 1–5. [Google Scholar]
- Chang, W.C.; Cho, C.W. Online boosting for vehicle detection. IEEE Trans. Syst. Man Cybern. Part B 2009, 40, 892–902. [Google Scholar] [CrossRef]
- Ren, S.; He, K.; Girshick, R.; Sun, J. Faster R-CNN: Towards real-time object detection with region proposal networks. Adv. Neural Inf. Process. Syst. 2015, 28, 91–99. [Google Scholar] [CrossRef] [Green Version]
- Fan, Q.; Brown, L.; Smith, J. A closer look at Faster R-CNN for vehicle detection. In Proceedings of the 2016 IEEE Intelligent Vehicles Symposium (IV), Gothenburg, Sweden, 19–22 June 2016; pp. 124–129. [Google Scholar]
- Ke, R.; Li, Z.; Tang, J.; Pan, Z.; Wang, Y. Real-time traffic flow parameter estimation from UAV video based on ensemble classifier and optical flow. IEEE Trans. Intell. Transp. Syst. 2018, 20, 54–64. [Google Scholar] [CrossRef]
- Biswas, D.; Su, H.; Wang, C.; Stevanovic, A. Speed estimation of multiple moving objects from a moving UAV platform. ISPRS Int. J. Geo-Inf. 2019, 8, 259. [Google Scholar] [CrossRef] [Green Version]
- Li, J.; Chen, S.; Zhang, F.; Li, E.; Yang, T.; Lu, Z. An adaptive framework for multi-vehicle ground speed estimation in airborne videos. Remote Sens. 2019, 11, 1241. [Google Scholar] [CrossRef] [Green Version]
- Khan, N.A.; Jhanjhi, N.; Brohi, S.N.; Usmani, R.S.A.; Nayyar, A. Smart traffic monitoring system using unmanned aerial vehicles (UAVs). Comput. Commun. 2020, 157, 434–443. [Google Scholar] [CrossRef]
- Mittal, P.; Singh, R.; Sharma, A. Deep learning-based object detection in low-altitude UAV datasets: A sruvey. Image Vis. Comput. 2020, 104, 1–13. [Google Scholar] [CrossRef]
- Park, H.; Byun, S.; Lee, H. Application of deep learning method for real-time traffic analysis using UAV. J. Korean Soc. Surv. Geod. Photogramm. Cartogr. 2020, 38, 353–361. [Google Scholar]
- Redmon, J.; Farhadi, A. YOLO v3: An incremental improvement. arXiv 2018, arXiv:1804.02767v1. [Google Scholar]
- Lee, M.H.; Toem, S. Position and velocity estimation of moving vehicles with a drone. J. Korean Inst. Intell. Syst. 2019, 29, 83–89. [Google Scholar] [CrossRef]
- Hamid, K.R.; Talukder, A.; Islam, A.E. Implementation of fuzzy aided kalman filter for tracking a moving object in two-dimensional space. Int. J. Fuzzy Log. Intell. Syst. 2018, 18, 85–96. [Google Scholar] [CrossRef] [Green Version]
- Krizhevsky, A.; Sutskever, I.; Hinton, G.E. ImageNet classification with deep convolutional neural networks. Adv. Neural Inf. Process. Syst. 2012, 25, 1097–1105. [Google Scholar] [CrossRef]
- Simonyan, K.; Zisserman, A. Very deep convolutional networks for large-scale image recognition. arXiv 2014, arXiv:1409.1556. [Google Scholar]
- Lucas, B.D.; Kanade, T. An iterative image registration technique with an application to stereo vision. In Proceedings of the 1981 International Joint Conference on Artificial Intelligence, Vancouver BC, Canada, 24–28 August 1981; pp. 674–679. [Google Scholar]
- Viola, P.; Jones, M. Rapid object detection using a boosted cascade of simple features. In Proceedings of the 2001 IEEE Computer Society Conference on Computer Vision and Pattern Recognition, CVPR 2001, Kauai, HI, USA, 8–14 December 2001; Volume 1, pp. 511–518. [Google Scholar]
- Tan, M.; Pang, R.; Le, Q.V. EfficientDet: Scalable and efficient object detection. In Proceedings of the IEEE/CVF Conference on Computer Vision and Pattern Recognition, Seattle, WA, USA, 13–19 June 2020; pp. 10781–10790. [Google Scholar]
- Ronneberger, O.; Fischer, P.; Brox, T. U-net: Convolutional networks for biomedical image segmentation. In Proceedings of the International Conference on Medical Image Computing and Computer-Assisted Intervention, Munich, Germany, 5–9 October 2015; pp. 234–241. [Google Scholar]
- Neven, D.; De Brabandere, B.; Georgoulis, S.; Proesmans, M.; Van Gool, L. Towards end-to-end lane detection: An instance segmentation approach. In Proceedings of the 2018 IEEE Intelligent Vehicles Symposium (IV), Changshu, China, 26–30 June 2018; pp. 286–291. [Google Scholar]
- Paszke, A.; Chaurasia, A.; Kim, S.; Culurciello, E. Enet: A deep neural network architecture for real-time semantic segmentation. arXiv 2016, arXiv:1606.02147. [Google Scholar]
- Wojke, N.; Bewley, A.; Paulus, D. Simple online and realtime tracking with a deep association metric. In Proceedings of the 2017 IEEE International Conference on Image Processing (ICIP), Beijing, China, 17–20 September 2017; pp. 3645–3649. [Google Scholar]
- Tan, M.; Le, Q. EfficientNet: Rethinking model scaling for convolutional neural networks. In Proceedings of the International Conference on Machine Learning, PMLR, Long Beach, CA, USA, 9–15 June 2019; pp. 6105–6114. [Google Scholar]
- Bewley, A.; Ge, Z.; Ott, L.; Ramos, F.; Upcroft, B. Simple online and realtime tracking. In Proceedings of the 2016 IEEE International Conference on Image Processing (ICIP), Phoenix, AZ, USA, 25–28 September 2016; pp. 3464–3468. [Google Scholar]
- Illingworth, J.; Kittler, J. A survey of the Hough transform. Comput. Vis. Graph. Image Process. 1988, 44, 87–116. [Google Scholar] [CrossRef]
- He, T.; Zhang, Z.; Zhang, H.; Zhang, Z.; Xie, J.; Li, M. Bag of tricks for image classification with convolutional neural networks. In Proceedings of the IEEE Conference on Computer Vision and Pattern Recognition, Long Beach, CA, USA, 15–20 June 2019; pp. 558–567. [Google Scholar]
Publisher’s Note: MDPI stays neutral with regard to jurisdictional claims in published maps and institutional affiliations. |
© 2021 by the authors. Licensee MDPI, Basel, Switzerland. This article is an open access article distributed under the terms and conditions of the Creative Commons Attribution (CC BY) license (https://creativecommons.org/licenses/by/4.0/).