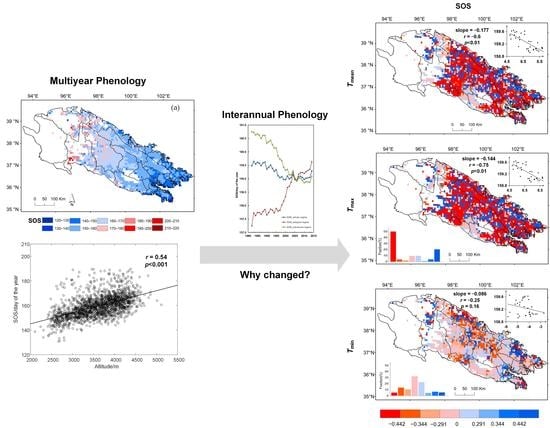
Vegetation Phenology in the Qilian Mountains and Its Response to Temperature from 1982 to 2014
Abstract
1. Introduction
2. Materials and Methods
2.1. Data Source and Pretreatment
2.2. Extraction of Phenology
2.3. Trend Analysis and Correlation Analysis
3. Results
3.1. Spatial Variation in the Multiyear Mean Phenology in the Qilian Mountains
3.2. Spatial Variation of the Phenological Trend from 1982 to 2014 in the Qilian Mountains
3.3. Phenology Dynamics of the SOS, EOS, and LGS from 1982 to 2014 in the Qilian Mountains
3.3.1. Dynamics of the SOS in Different Regions
3.3.2. Dynamics of the EOS in Different Regions
3.3.3. Dynamics of the LGS in Different Regions
3.4. Relationship Between Phenology and Temperature
3.4.1. The Relationship Between the SOS and Temperature
3.4.2. The Relationship Between the EOS and Temperature
3.4.3. The Relationship Between the LGS and Annual Mean Temperature
4. Discussion
4.1. The Spatial Heterogeneity of Phenology in the Qilian Mountains
4.1.1. The Altitude Dependence of Phenology
4.1.2. Phenology of Different Vegetation Types
4.2. Dynamics of the SOS, EOS, and LGS
4.2.1. The Turning Point of SOS Dynamics During the Study Period
4.2.2. Significantly Delayed Trend of the EOS in the Qilian Mountains
4.3. Different Responses of the SOS and EOS to Tmax and Tmin in the Qilian Mountains
4.4. Future Research
5. Conclusions
- (1)
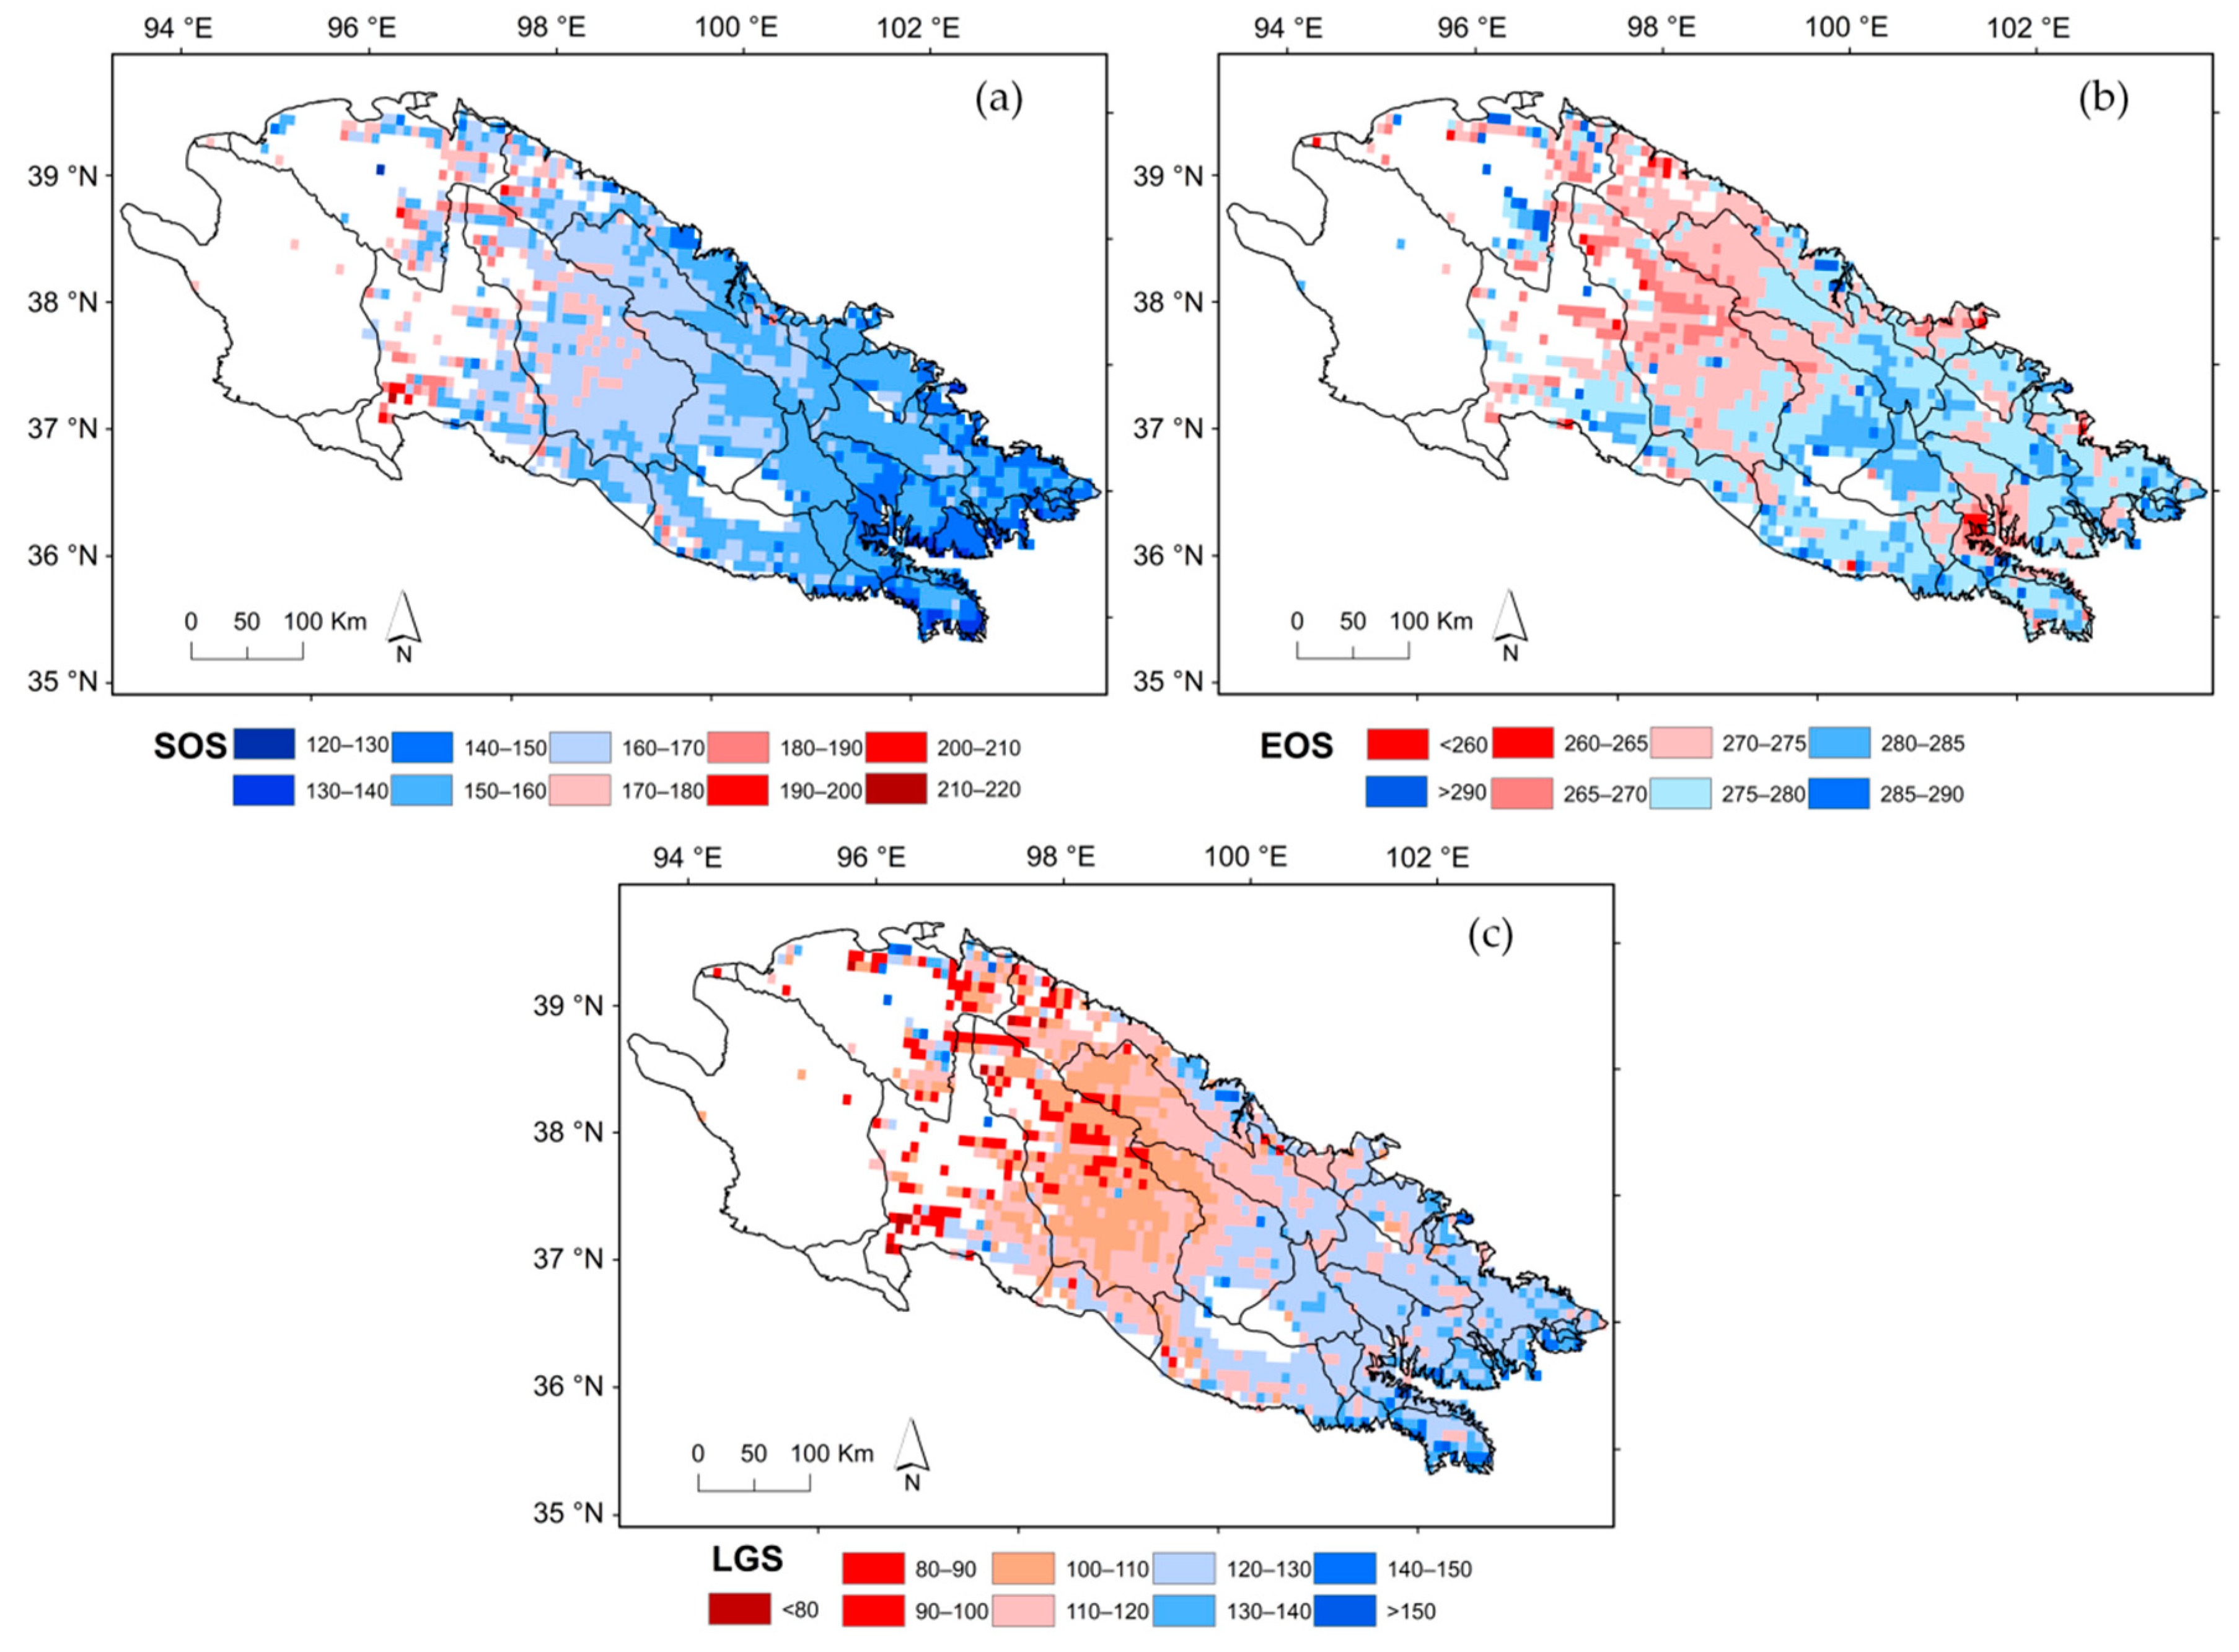
- The spatial distribution of plant phenology in the Qilian Mountains showed significant spatial heterogeneity and altitude dependence. From the northwestern high mountains to the lower elevation of the southeastern region, the multiyear mean SOS gradually advanced, the multiyear mean LGS gradually extended, and the multiyear mean EOS was delayed as a whole. In particular, the multiyear mean EOS was delayed in northern Qinghai Lake and was advanced around eastern Huangzhong County, an agricultural planting area.
- (2)
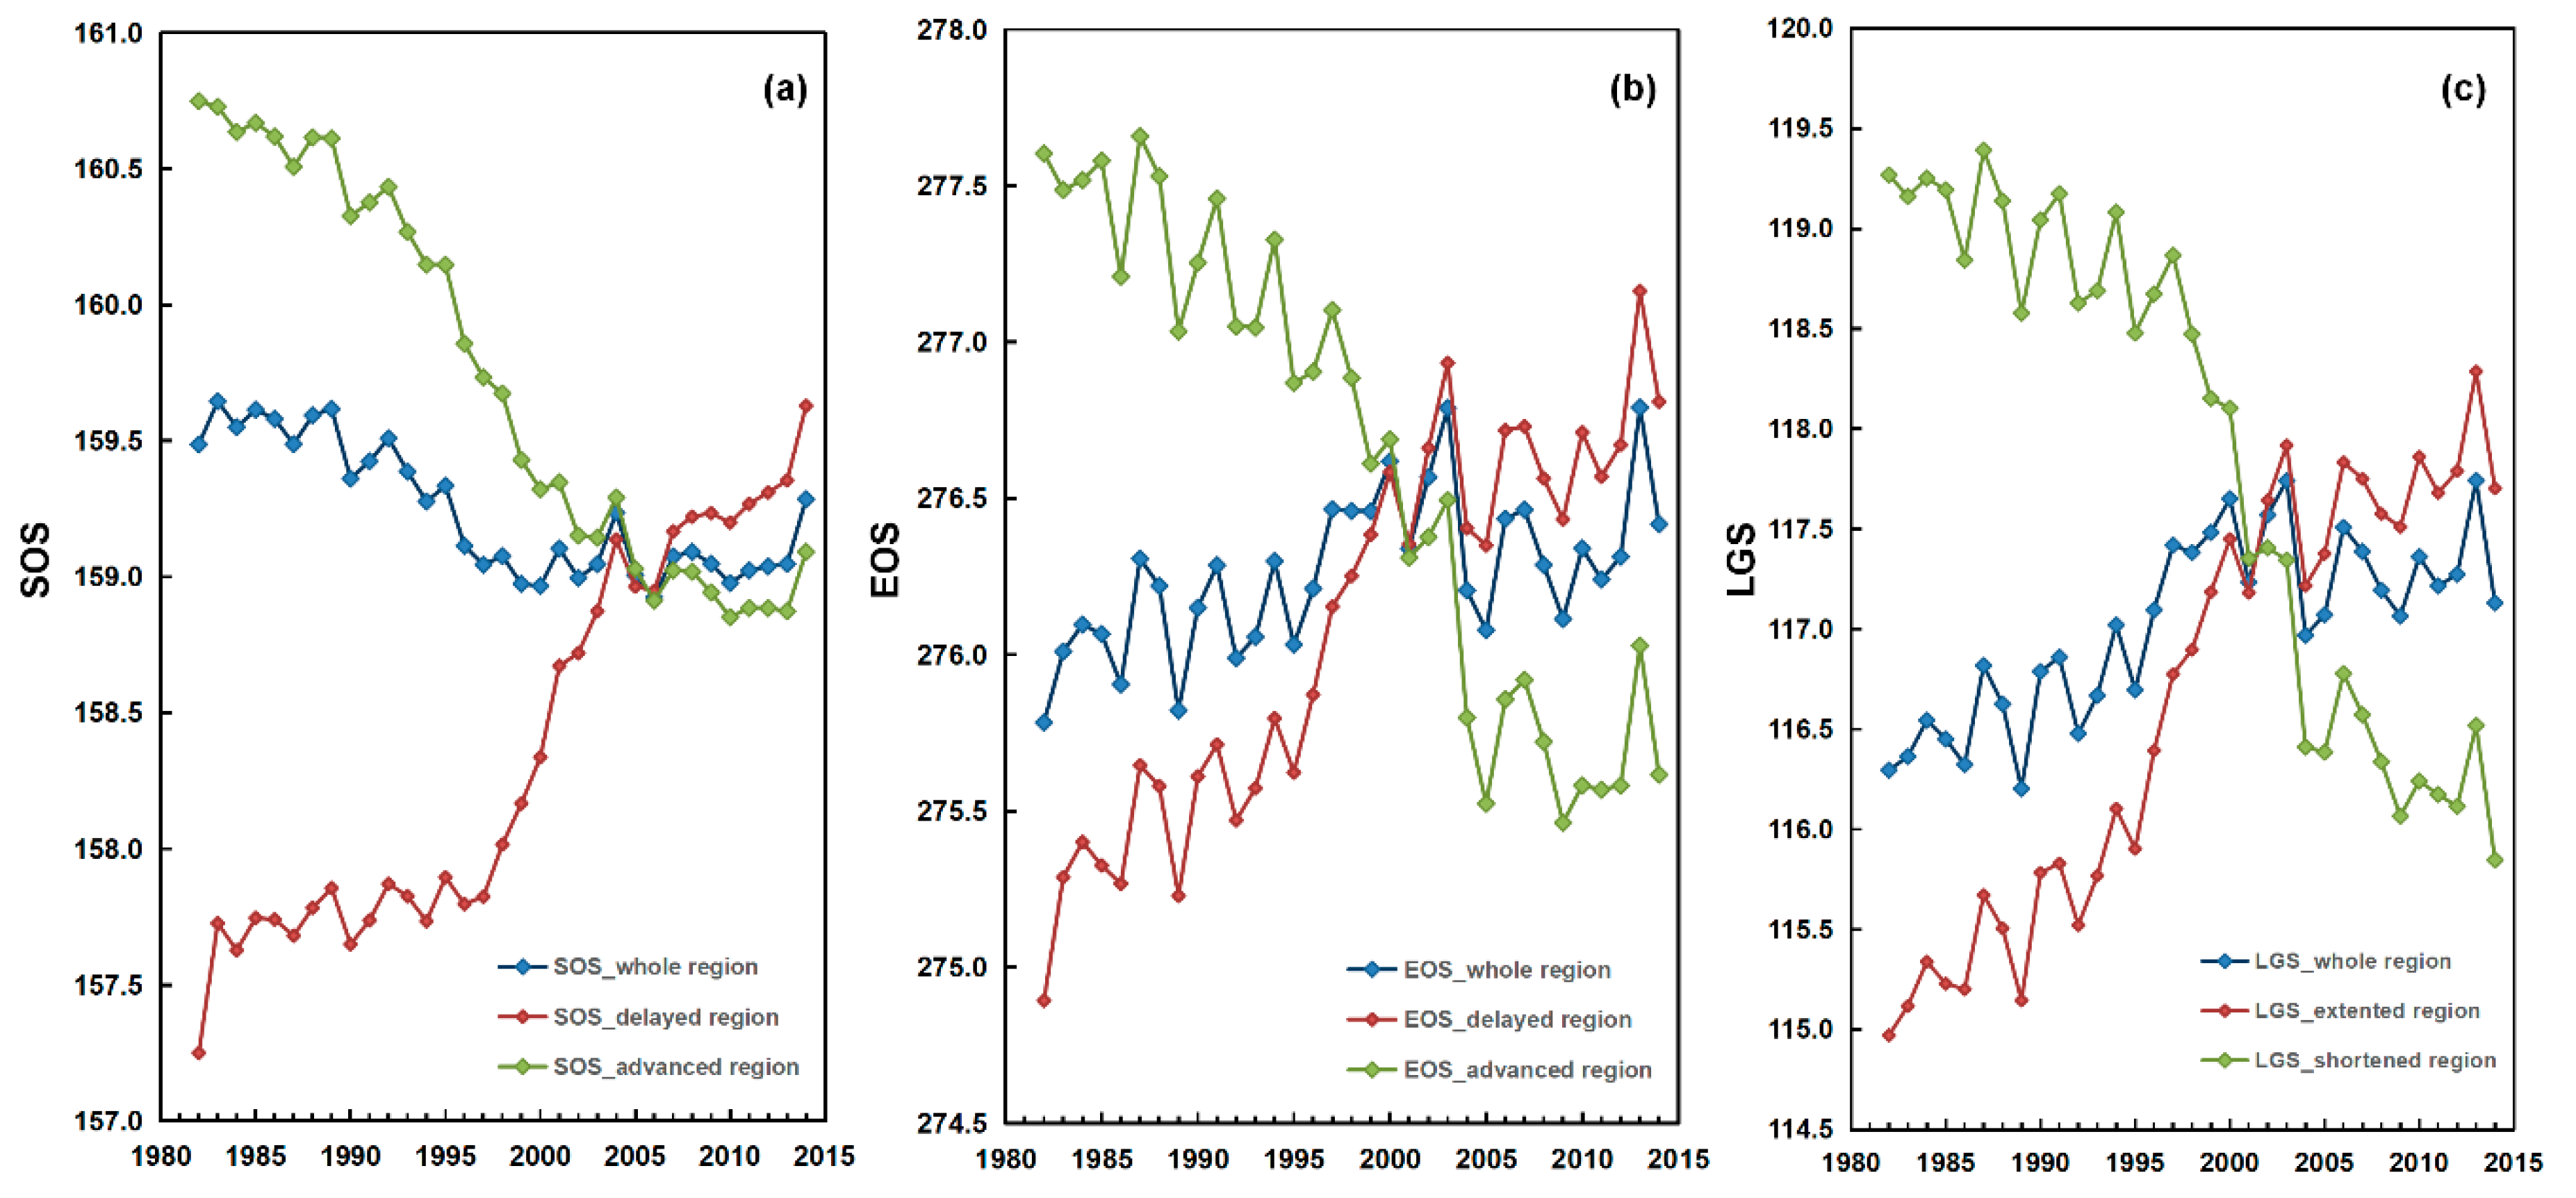
- At the regional scale in the Qilian Mountains, significant trends (p < 0.01) were detected in three phenology parameters over the study period: an earlier SOS (0.2 days per decade), a later EOS (0.15 days per decade), and a longer LGS (0.36 days per decade). There was a turning point at approximately 2000 for the SOS. The SOS was significantly advanced before 2000 in the Qilian Mountains, while there were no significant SOS trend in recent years with weakened climate change. Similarly, the EOS and LGS fluctuated and showed no significant trend after 2003.
- (3)
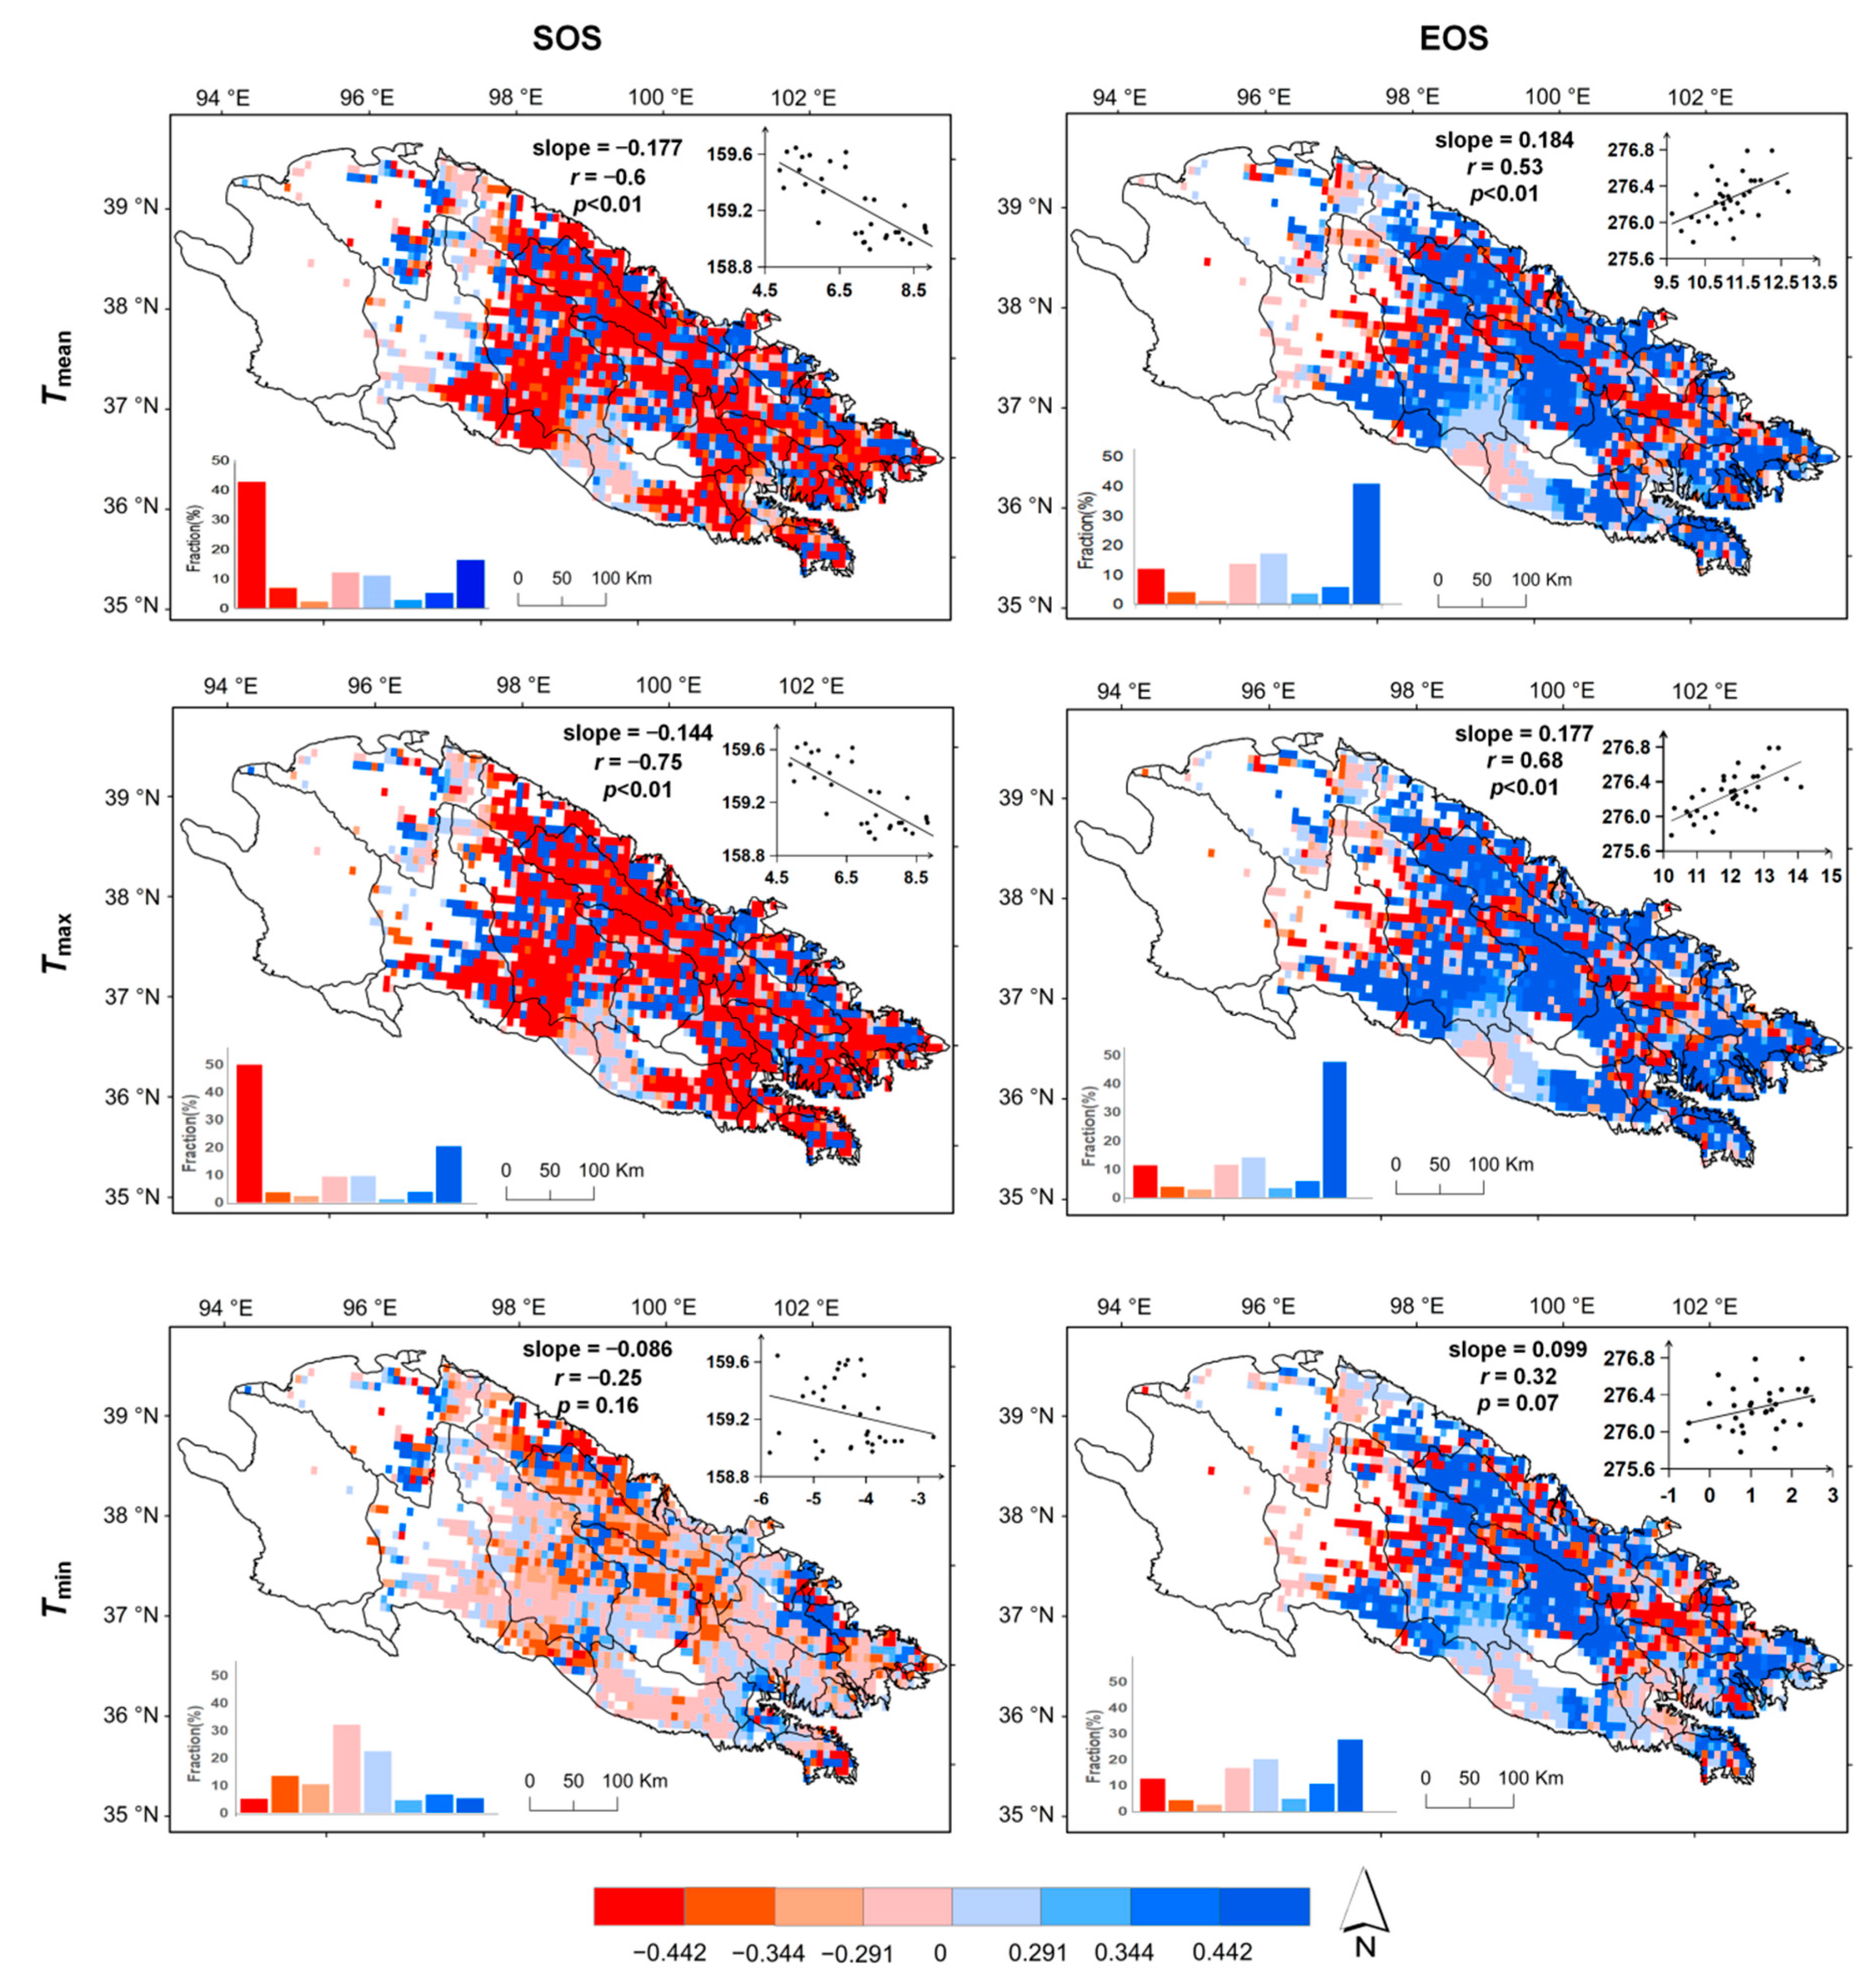
- The phenology of the Qilian Mountains was significantly correlated with temperature over the study period at the regional scale. With the increase in the annual mean temperature, the LGS was significantly extended. Moreover, a higher preseason temperature led to an earlier SOS and a later EOS in most study areas. A more significant correlation between the SOS, EOS, and Tmax than between Tmin and Tmean was found at the regional scale. Therefore, our results suggest that Tmax must be considered in the current phenology and ecosystem models.
Author Contributions
Funding
Institutional Review Board Statement
Informed Consent Statement
Data Availability Statement
Conflicts of Interest
Appendix A
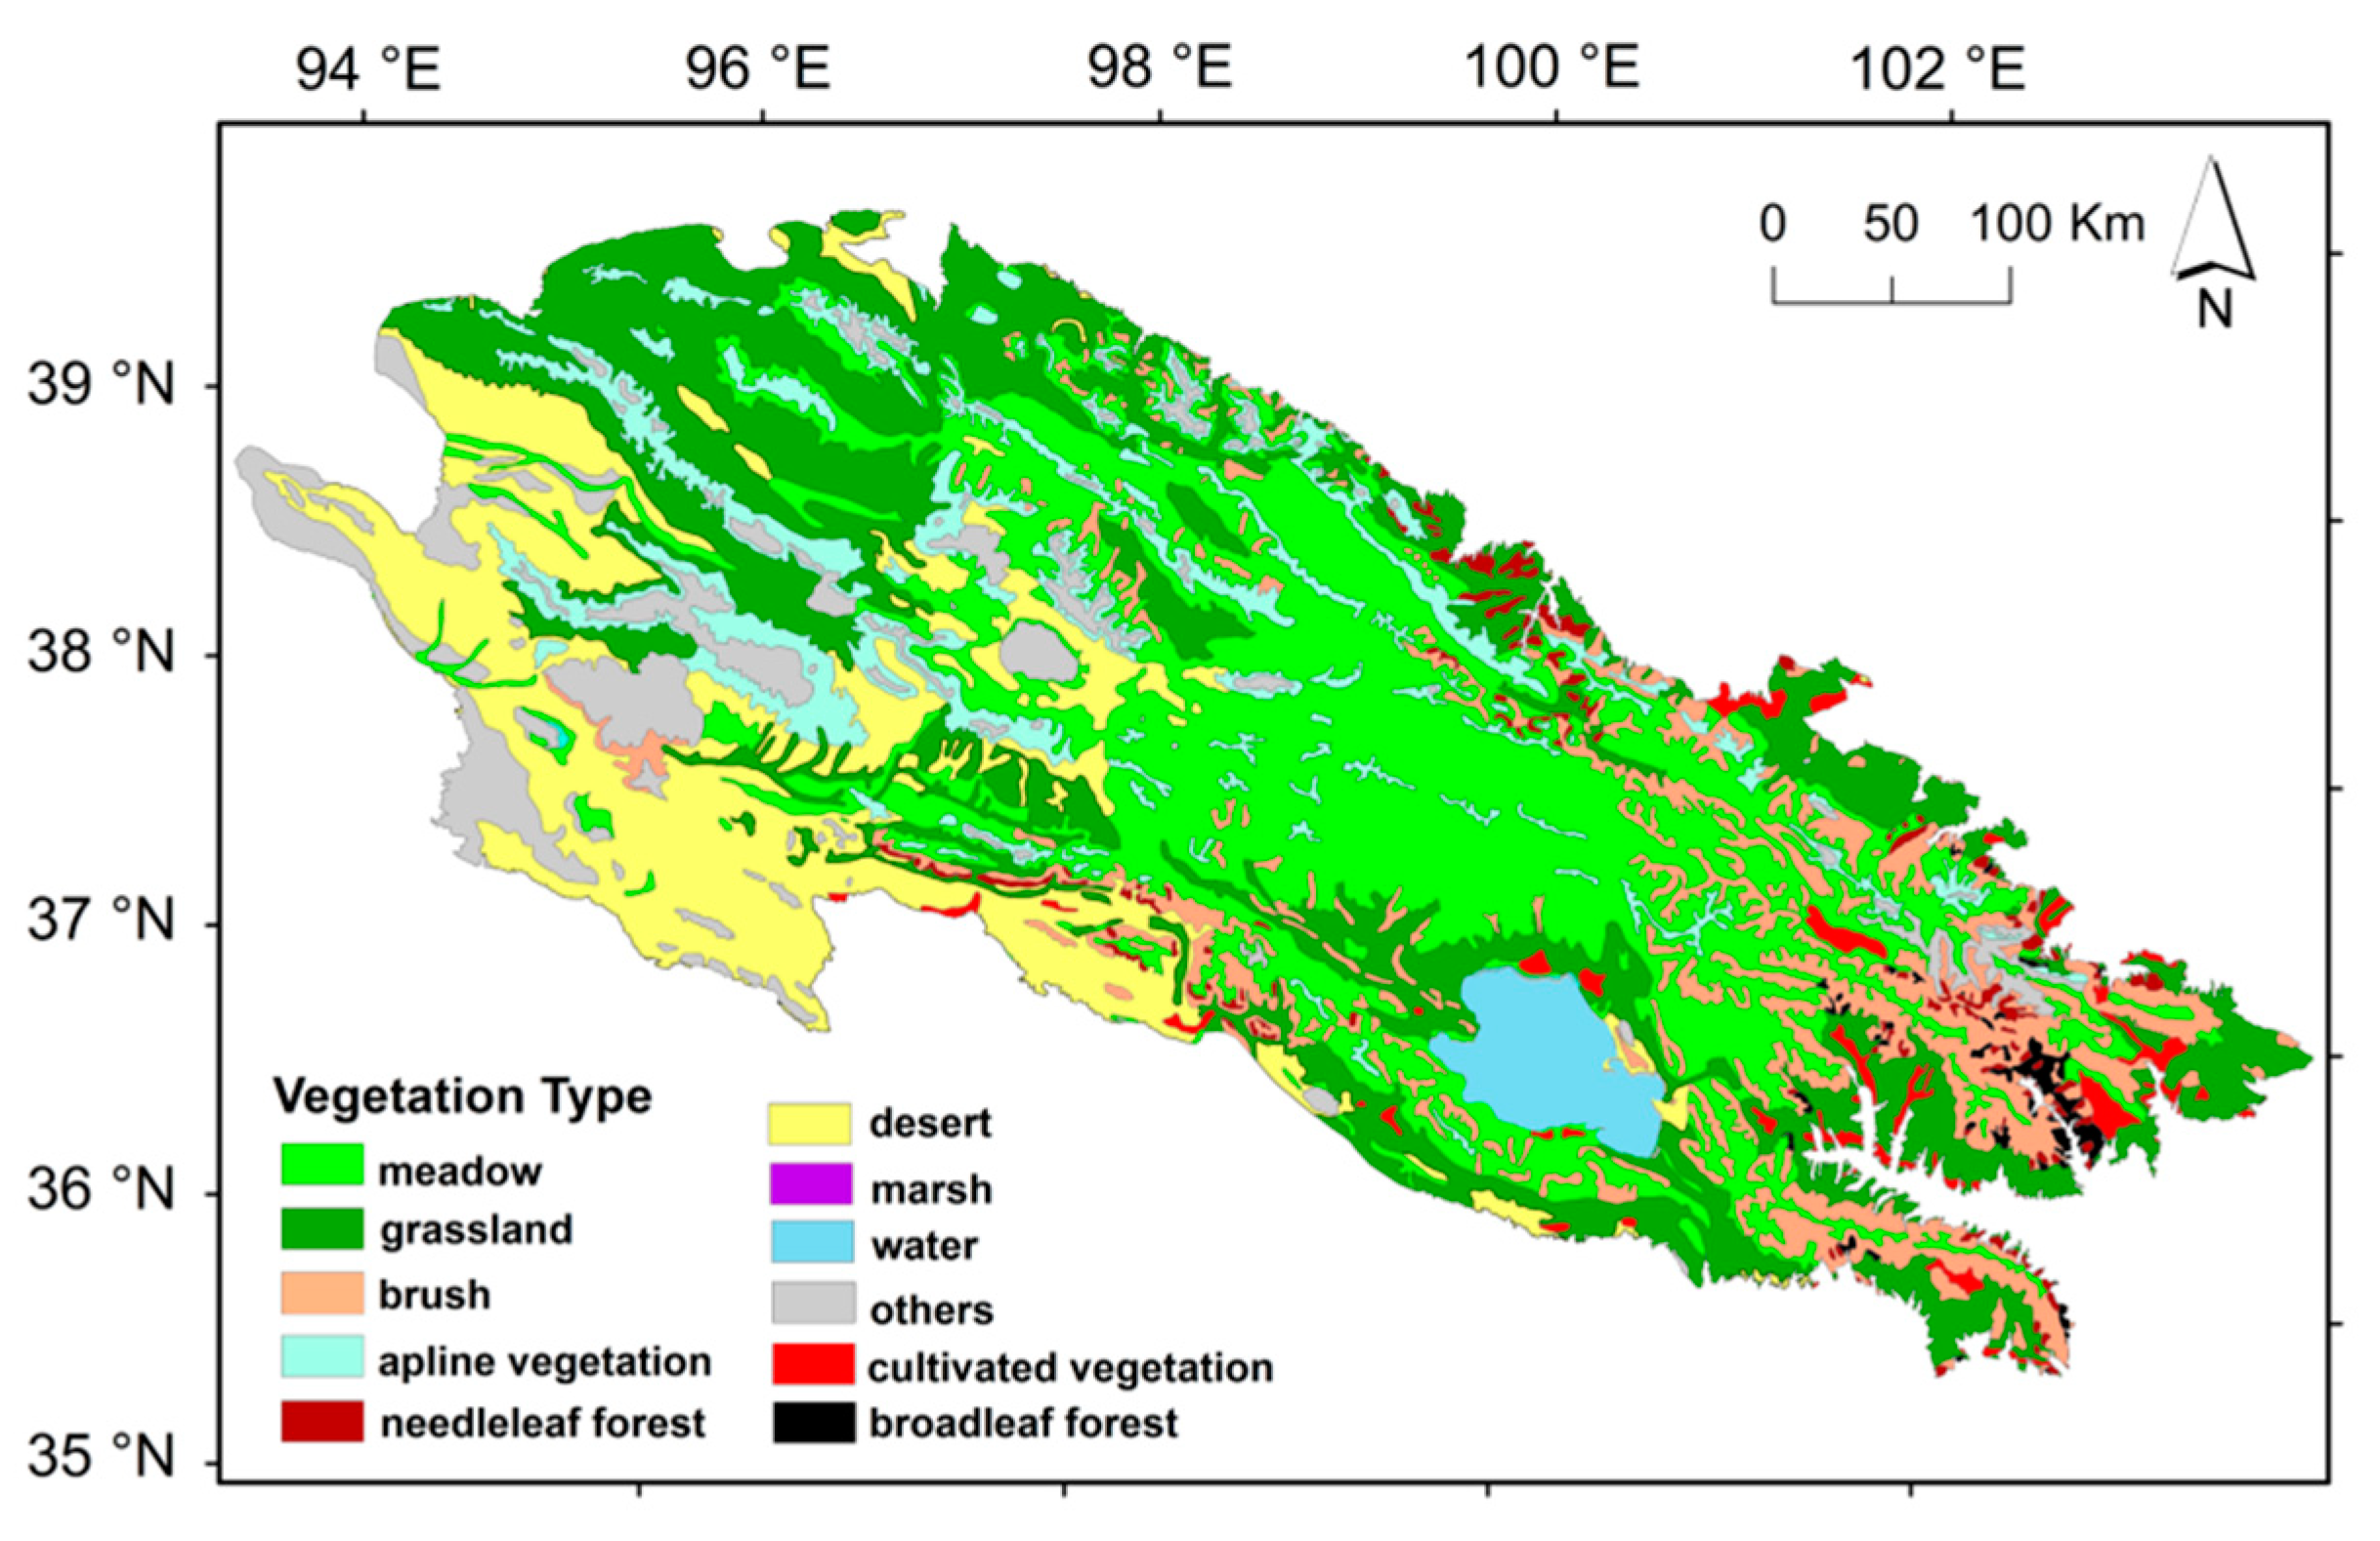
| Percentage of Area | Multiyear Mean SOS | Multiyear Mean EOS | Multiyear Mean LGS | |
|---|---|---|---|---|
| Brush | 11.89 | 156.00 | 277.20 | 121.20 |
| Meadow | 44.70 | 161.06 | 275.66 | 114.60 |
| Grassland | 25.91 | 157.54 | 277.33 | 119.79 |
| Alpine vegetation | 7.94 | 164.03 | 273.82 | 109.79 |
| Trend of SOS | Trend of EOS | Trend of LGS | |
|---|---|---|---|
| Brush | −0.025 ** | 0.021 ** | 0.046 ** |
| Meadow | −0.019 ** | 0.020 ** | 0.039 ** |
| Grassland | −0.019 ** | 0.003 | 0.022 ** |
| Alpine vegetation | −0.024 ** | −0.016 * | 0.008 |
| Regional trend | −0.020 ** | 0.015 ** | 0.036 ** |
References
- Schwartz, M.D.; Chen, X. Examining the onset of spring in China. Clim. Res. 2002, 21, 157–164. [Google Scholar] [CrossRef]
- Fang, X.; Chen, F. Plant phenology and climate change. Sci. China Earth Sci. 2015, 58, 1043–1044. [Google Scholar] [CrossRef]
- Peñuelas, J.; Rutishauser, T.; Filella, I. Ecology. Phenology feedbacks on climate change. Science 2009, 324, 887–888. [Google Scholar] [CrossRef] [PubMed]
- Piao, S.; Tan, J.; Chen, A.; Fu, Y.H.; Ciais, P.; Liu, Q.; Janssens, I.A.; Vicca, S.; Zeng, Z.; Jeong, S.J.; et al. Leaf onset in the northern hemisphere triggered by daytime temperature. Nat. Commun. 2015, 6, 6911. [Google Scholar] [CrossRef] [PubMed]
- Morisette, J.T.; Richardson, A.D.; Knapp, A.K.; Fisher, J.I.; Graham, E.A.; Abatzoglou, J.; Wilson, B.E.; Breshears, D.D.; Henebry, G.M.; Hanes, J.M.; et al. Tracking the rhythm of the seasons in the face of global change: Phenological research in the 21st century. Front. Ecol. Environ. 2009, 7, 253–260. [Google Scholar] [CrossRef]
- Yao, Y.; Lei, X.; Zhang, L.; Zhang, B.; Peng, H.; Zhang, J. Analysis of precipitable water vapor and surface temperature variationover Qinghai-Tibetan Plateau from 1979 to 2014. Chin. Sci. Bull. 2016, 61, 1462–1477. [Google Scholar] [CrossRef]
- Li, X.; Yao, Z.; Xiao, J.; Wang, H. Analysis of the spatial-temporal variation characteristics of precipitation over the Tibetan Plateau from 1961 through 2010. J. Glaciol. Geocryol. 2016, 38, 1233–1240. [Google Scholar] [CrossRef]
- Shen, M.; Zhang, G.; Cong, N.; Wang, S.; Kong, W.; Piao, S. Increasing altitudinal gradient of spring vegetation phenology during the last decade on the Qinghai–Tibetan Plateau. Agric. For. Meteorol. 2014, 189–190, 71–80. [Google Scholar] [CrossRef]
- Cong, N.; Shen, M.; Piao, S. Spatial variations in responses of vegetation autumn phenology to climate change on the Tibetan Plateau. J. Plant Ecol. 2017, 10, 744–752. [Google Scholar] [CrossRef]
- Zhang, Q.; Kong, D.; Shi, P.; Singh, V.; Peng, S. Vegetation phenology on the Qinghai-Tibetan Plateau and its response to climate change (1982–2013). Agric. For. Meteorol. 2017, 248, 408–417. [Google Scholar] [CrossRef]
- Li, H.; Ma, Y.; Wang, Y. Influences of Climate Warming on Plant Phenology in Qinghai Plateau. J. Appl. Meteorol. Sci. 2010, 21, 500–505. (In Chinese) [Google Scholar]
- Zhou, J.; Cai, W.; Qin, Y.; Lai, L.; Guan, T.; Zhang, X.; Jiang, L.; Du, H.; Yang, D.; Cong, Z.; et al. Alpine vegetation phenology dynamic over 16years and its covariation with climate in a semi-arid region of China. Sci. Total Environ. 2016, 572, 119–128. [Google Scholar] [CrossRef] [PubMed]
- Piao, S.; Friedlingstein, P.; Ciais, P.; Viovy, N.; Demarty, J. Growing season extension and its impact on terrestrial carbon cycle in the Northern Hemisphere over the past 2 decades. Glob. Biogeochem. Cycles 2007, 21. [Google Scholar] [CrossRef]
- White, M.A.; Hoffman, F.; Hargrove, W.W.; Nemani, R.R. A global framework for monitoring phenological responses to climate change. Geophys. Res. Lett. 2005, 32, L04705. [Google Scholar] [CrossRef]
- Studer, S.; Stöckli, R.; Appenzeller, C.; Vidale, P.L. A comparative study of satellite and ground-based phenology. Int. J. Biometeorol. 2007, 51, 405–414. [Google Scholar] [CrossRef] [PubMed]
- Fu, Y.; Zhang, H.; Dong, W.; Yuan, W. Comparison of phenology models for predicting the onset of growing season over the Northern Hemisphere. PLoS ONE 2014, 9, e109544. [Google Scholar] [CrossRef]
- Liu, H.; Bao, Y. Overview on the research of vegetation phenological model. J. Hohai Univ. 2018, 46, 23–29. (In Chinese) [Google Scholar] [CrossRef]
- Zhao, X.; Zhou, D.; Fang, J. Satellite-based Studies on Large-Scale Vegetation Changes in China. J. Integr. Plant Biol. 2012, 54, 713–728. [Google Scholar] [CrossRef]
- Richardson, A.D.; Keenan, T.F.; Migliavacca, M.; Ryu, Y.; Sonnentag, O.; Toomey, M. Climate change, phenology, and phenological control of vegetation feedbacks to the climate system. Agric. For. Meteorol. 2013, 169, 156–173. [Google Scholar] [CrossRef]
- Yu, H.; Luedeling, E.; Xu, J. Winter and spring warming result in delayed spring phenology on the Tibetan Plateau. Proc. Natl. Acad. Sci. USA 2010, 107, 22151–22156. [Google Scholar] [CrossRef]
- Butt, B.; Turner, M.D.; Singh, A.; Brottem, L. Use of MODIS NDVI to evaluate changing latitudinal gradients of rangeland phenology in Sudano-Sahelian West Africa. Remote Sens. Environ. 2011, 115, 3367–3376. [Google Scholar] [CrossRef]
- Chen, X.; Wang, W.; Chen, J.; Zhu, X.; Shen, M.; Gan, L.; Cao, X. Does any phenological event defined by remote sensing deserve particular attention? An examination of spring phenology of winter wheat in Northern China. Ecol. Indic. 2020, 116, 106456. [Google Scholar] [CrossRef]
- Ge, Q.; Dai, J.; Cui, H.; Wang, H. Spatiotemporal variability in start and end of growing season in China related to climate variability. Remote Sens. 2016, 8, 433. [Google Scholar] [CrossRef]
- Ma, T.; Zhou, C. Climate-associated changes in spring plant phenology in China. Int. J. Biometeorol. 2012, 56, 269–275. [Google Scholar] [CrossRef]
- Shen, M.; Piao, S.; Chen, X.; An, S.; Fu, Y.H.; Wang, S.; Cong, N.; Janssens, N.A. Strong impacts of daily minimum temperature on the green-up date and summer greenness of the Tibetan Plateau. Glob. Chang. Biol. 2016, 22, 3057–3066. [Google Scholar] [CrossRef]
- Ding, M.; Chen, Q.; Li, L.; Zhang, Y.; Wang, Z.; Liu, L.; Sun, X. Temperature dependence of variations in the end of the growing season from 1982 to 2012 on the Qinghai–Tibetan Plateau. GISci. Remote Sens. 2016, 53, 147–163. [Google Scholar] [CrossRef]
- Zhao, Y. Principles and Methods of Remote Sensing Applications and Analysis; Science Press: Beijing, China, 2003. [Google Scholar]
- Bian, J.; Li, A.; Song, M.; Ma, L.; Jiang, J. Reconstruction of NDVI time-series datasets of MODIS based on Savitzky-Golay filter (In Chinese). J. Remote Sens. 2010, 14, 725–741. [Google Scholar] [CrossRef]
- Buitenwerf, R.; Rose, L.; Higgins, S.I. Three decades of multi- dimensional change in global leaf phenology. Nat. Clim. Chang. 2015, 5, 364–368. [Google Scholar] [CrossRef]
- Zheng, Z.; Zhu, W.; Chen, G.; Jiang, N.; Fan, D.; Zhang, D. Continuous but diverse advancement of spring-summer phenology in response to climate warming across the Qinghai-Tibetan Plateau. Agric. For. Meteorol. 2016, 223, 194–202. [Google Scholar] [CrossRef]
- Chen, Y.; Yang, K.; He, J.; Qin, J.; Shi, J.; Du, J.; He, Q. Improving land surface temperature modeling for dry land of China. J. Geophys. Res. Atmos. 2011, 116. [Google Scholar] [CrossRef]
- Jonsson, P.; Eklundh, L. Seasonality extraction by function fitting to time-series of satellite sensor data. IEEE Trans. Geosci. Remote Sens. 2002, 40, 1824–1832. [Google Scholar] [CrossRef]
- Chen, J.; Jönsson, P.; Tamura, M.; Gu, Z.; Matsushita, B.; Eklundh, L. A simple method for reconstructing a high-quality NDVI time-series data set based on the Savitzky-Golay Filter. Remote Sens. Environ. 2004, 91, 332–344. [Google Scholar] [CrossRef]
- Fisher, J.I.; Mustard, J.F.; Vadeboncoeur, M.A. Green leaf phenology at Landsat resolution: Scaling from the field to the satellite. Remote Sens. Environ. 2006, 100, 265–279. [Google Scholar] [CrossRef]
- Zeng, L.; Wardlow, B.D.; Xiang, D.; Hu, S.; Li, D. A review of vegetation phenological metrics extraction using time-series, multispectral satellite data. Remote Sens. Environ. 2020, 237, 111511. [Google Scholar] [CrossRef]
- Piao, S.; Cui, M.; Chen, A.; Wang, X.; Ciais, P.; Liu, J.; Tang, Y. Altitude and temperature dependence of change in the spring vegetation green-up date from 1982 to 2006 in the Qinghai-Xizang Plateau. Agric. For. Meteorol. 2011, 151, 1599–1608. [Google Scholar] [CrossRef]
- Che, M.; Chen, B.; Innes, J.L.; Wang, G.; Dou, X.; Zhou, T.; Zhang, H.; Yan, J.; Xu, G.; Zhao, H. Spatial and temporal variations in the end date of the vegetation growing season throughout the Qinghai—Tibetan Plateau from 1982 to 2011. Agric. For. Meteorol. 2014, 189, 81–90. [Google Scholar] [CrossRef]
- Chuine, I. A unified model for budburst of trees. J. Theor. Biol. 2000, 207, 337–347. [Google Scholar] [CrossRef]
- Jeong, S.-J.; Ho, C.-H.; Gim, H.-J.; Brown, M.E. Phenology shifts at start vs. end of growing season in temperate vegetation over the Northern Hemisphere for the period 1982–2008. Global Chang. Biol. 2011, 17, 2385–2399. [Google Scholar] [CrossRef]
- Yang, Z.; Shen, M.; Jia, S.; Guo, L.; Yang, W.; Wang, C.; Chen, X.; Chen, J. Asymmetric responses of the end of growing season to daily maximum and minimum temperatures on the Tibetan Plateau. J. Geophys. Res. Atmos. 2017, 122, 13278–13287. [Google Scholar] [CrossRef]
- Shen, M.; Piao, S.; Cong, N.; Zhang, G.; Jassens, I.A. Precipitation impacts on vegetation spring phenology on the Tibetan Plateau. Glob. Chang. Biol. 2015, 21, 3647–3656. [Google Scholar] [CrossRef]
- Qiang, F.; Zhang, M.; Wang, S.; Liu, Y.; Ren, Z.; Zhu, X. Changes of areal precipitation based on gridded dataset in Qilian Mountains during 1961–2012. Acta Geogr. Sin. 2015, 70, 1125–1136. [Google Scholar] [CrossRef]


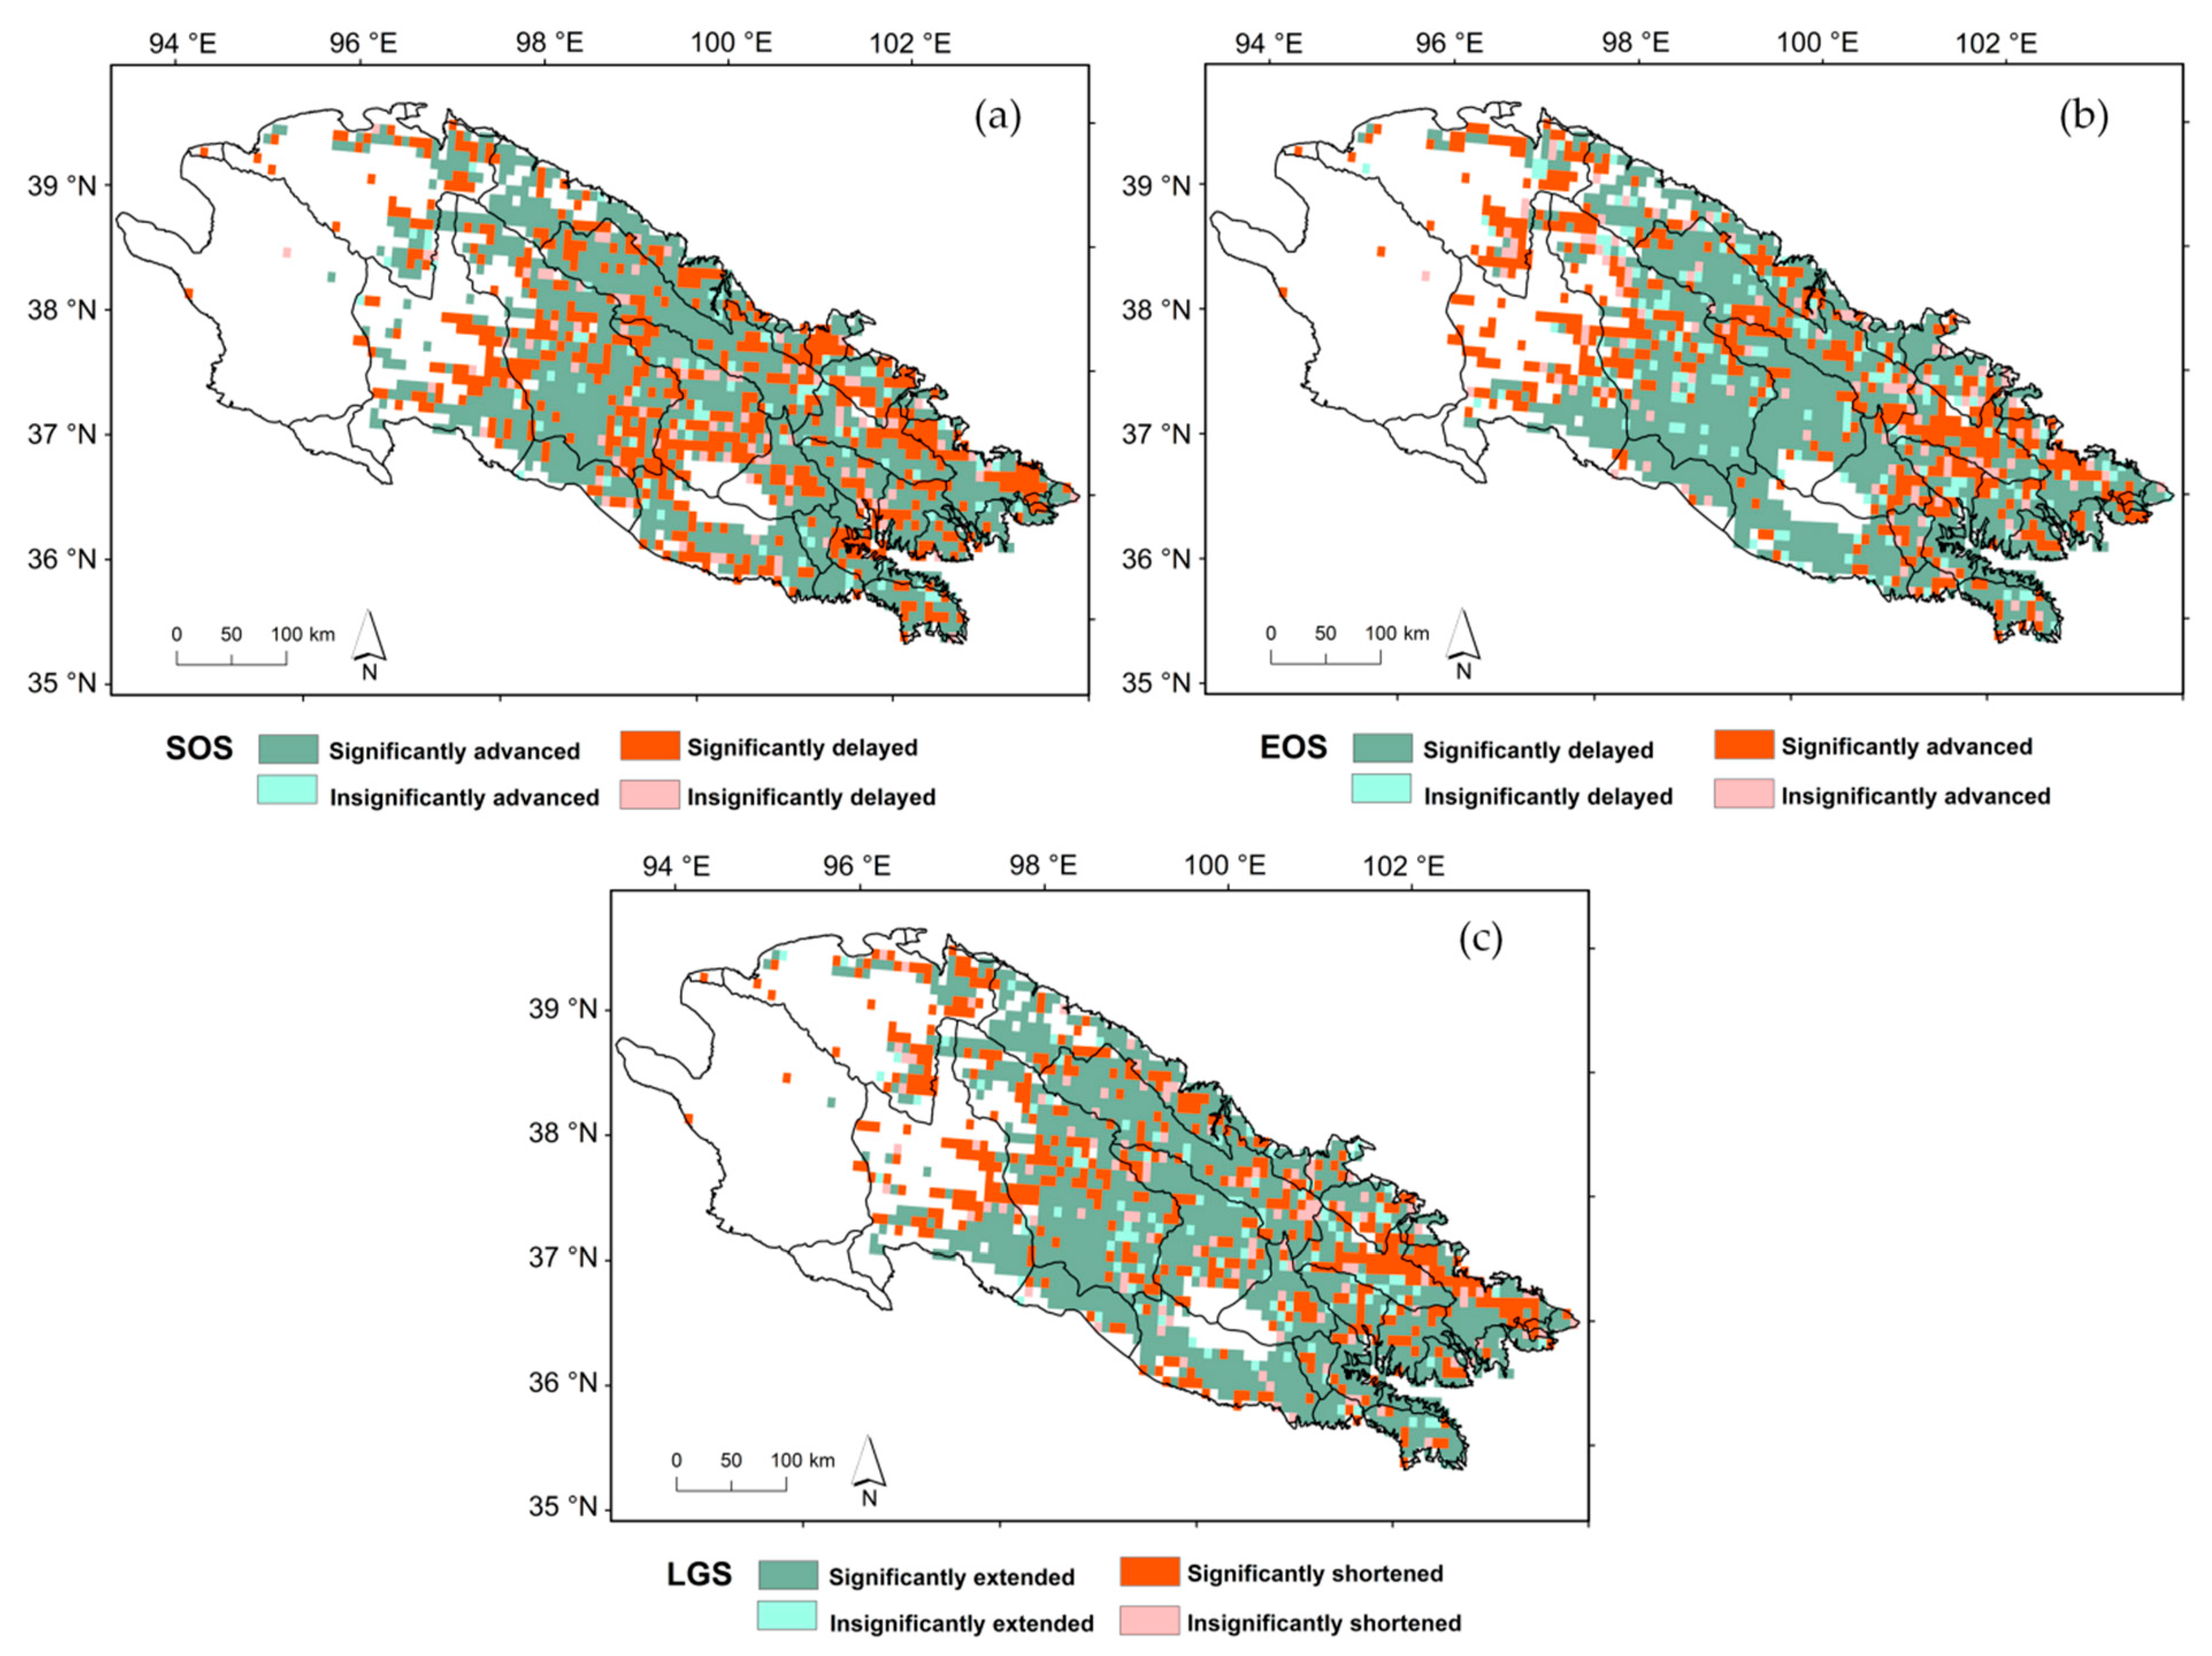


| Significantly Advanced/Shortened Pixels (%) | Insignificantly Advanced/Shortened Pixels (%) | Significantly Delayed/Lengthened Pixels (%) | Insignificantly Delayed/Lengthened Pixels (%) | Regional Trend in the Qilian Mountains (Days/Year) | |
|---|---|---|---|---|---|
| SOS | 59.51 * | 4.45 | 31.05 * | 4.99 | slope b = −0.020 ** |
| EOS | 26.66 * | 6.41 | 58.74 * | 8.19 | slope b = 0.015 ** |
| LGS | 25.19 * | 5.81 | 63.14 * | 5.86 | slope b = 0.036 ** |
| Correlation Coefficient | Regional Trend | ||||||||
|---|---|---|---|---|---|---|---|---|---|
| <−0.442 | −0.442–−0.344 | −0.344–−0.291 | −0.291–0 | 0–0.291 | 0.291–0.344 | 0.344–0.442 | 0.442< | ||
| SOS and Tmean | 42.76 ** | 6.98 * | 2.35 | 12.19 | 11.16 | 2.92 | 5.27 * | 16.37 ** | r = −0.60 ** |
| SOS and Tmax | 49.86 ** | 3.61 * | 2.29 | 9.39 | 9.62 | 1.09 | 3.78 * | 20.38 ** | r = −0.75 ** |
| SOS and Tmin | 5.09 ** | 13.39 * | 10.36 | 32.11 | 22.44 | 4.58 | 6.64 * | 5.38 ** | r = −0.25 |
| EOS and Tmean | 12.14 ** | 4.29 * | 1.37 | 13.97 | 17.34 | 3.89 | 6.07 * | 40.93 ** | r = 0.53 ** |
| EOS and Tmax | 11.28 ** | 3.78 * | 2.80 | 11.51 | 14.02 | 3.26 | 5.67 * | 47.68 ** | r = 0.68 ** |
| EOS and Tmin | 12.65 ** | 4.35 * | 2.63 | 16.83 | 20.15 | 4.92 | 10.70 * | 27.76 ** | r = 0.32 |
Publisher’s Note: MDPI stays neutral with regard to jurisdictional claims in published maps and institutional affiliations. |
© 2021 by the authors. Licensee MDPI, Basel, Switzerland. This article is an open access article distributed under the terms and conditions of the Creative Commons Attribution (CC BY) license (http://creativecommons.org/licenses/by/4.0/).
Share and Cite
Qiao, C.; Shen, S.; Cheng, C.; Wu, J.; Jia, D.; Song, C. Vegetation Phenology in the Qilian Mountains and Its Response to Temperature from 1982 to 2014. Remote Sens. 2021, 13, 286. https://doi.org/10.3390/rs13020286
Qiao C, Shen S, Cheng C, Wu J, Jia D, Song C. Vegetation Phenology in the Qilian Mountains and Its Response to Temperature from 1982 to 2014. Remote Sensing. 2021; 13(2):286. https://doi.org/10.3390/rs13020286
Chicago/Turabian StyleQiao, Cancan, Shi Shen, Changxiu Cheng, Junxu Wu, Duo Jia, and Changqing Song. 2021. "Vegetation Phenology in the Qilian Mountains and Its Response to Temperature from 1982 to 2014" Remote Sensing 13, no. 2: 286. https://doi.org/10.3390/rs13020286
APA StyleQiao, C., Shen, S., Cheng, C., Wu, J., Jia, D., & Song, C. (2021). Vegetation Phenology in the Qilian Mountains and Its Response to Temperature from 1982 to 2014. Remote Sensing, 13(2), 286. https://doi.org/10.3390/rs13020286


