Abstract
Smoke from fires significantly influences climate, weather, and human health. Fire smoke is traditionally detected using an aerosol index calculated from spectral contrast changes. However, such methods usually miss thin smoke plumes. It also remains challenging to accurately separate smoke plumes from dust, clouds, and bright surfaces. To improve smoke plume detections, this paper presents a new scattering-based smoke detection algorithm (SSDA) depending mainly on visible and infrared imaging radiometer suite (VIIRS) blue and green bands. The SSDA is established based on the theory of Mie scattering that occurs when the diameter of an atmospheric particulate is similar to the wavelength of the scattered light. Thus, smoke commonly causes Mie scattering in VIIRS blue and green bands because of the close correspondence between smoke particulate diameters and the blue/green band wavelengths. For developing the SSDA, training samples were selected from global fire-prone regions in North America, South America, Africa, Indonesia, Siberia, and Australia. The SSDA performance was evaluated against the VIIRS aerosol detection product and smoke detections from the ultraviolet aerosol index using manually labeled fire smoke plumes as a benchmark. Results show that the SSDA smoke detections are superior to existing products due chiefly to the improved ability of the algorithm to detect thin smoke and separate fire smoke from other surface types. Moreover, the SSDA smoke distribution pattern exhibits a high spatial correlation with the global fire density map, suggesting that SSDA is capable of detecting smoke plumes of fires in near real-time across the globe.
1. Introduction
A large amount of smoke from wildfires and prescribed fires is released into the atmosphere every year. Smoke aerosols severely affect climate, weather, and human environments [1,2]. Specifically, smoke plumes from biomass burning are dominated by black carbon and organic aerosols that affect climate through changes to the radiation budget. Direct radiative effects include (1) climate warming due to strong absorption of heat radiation emitted from the ground by black carbon [3] that also can lower snow and ice albedo in the Arctic [4], and (2) climate cooling due to the scattering activities of organic aerosols [3]. Further, smoke influences weather conditions by suppressing or energizing cloud formation [5,6]. Particulate matter from smoke plumes can suppress cloud formation and growth by narrowing the temperature gap between the ground and the atmosphere [5] or facilitate the formation and growth of clouds by adding more particles to the atmosphere for water vapor condensation [6]. Moreover, smoke from fires severely affects the human living environment by degrading air quality and reducing visibility. Smoke-polluted air can have aerosols with relatively small particulate sizes that can be easily breathed in, often leading to respiratory infection, asthma, lung cancer, and cardiovascular disease among other human health impacts [7]. Smoke aerosols also influence near-ground visibility as reported in the comparison between satellite-detected smoke and the visibilities recorded by meteorological observers [8,9]. Thus, fire smoke detection is necessary for multiple applications including improving climate change simulations [10], weather prediction [11,12], and human-environment monitoring [8,13]. To fully understand the local, regional, and global effects of smoke, methods and products for accurate, near real-time smoke plume detections are urgently needed on regional and global scales.
A few methods have been developed to detect fire smoke plumes regionally or globally during recent decades [8,14,15,16]. First, manually drawing smoke plumes has been a commonly used technique for small spatial areas and coarse temporal scales. This is labor- and time-consuming, subjective, and the accuracy of delineated smoke plumes depends on expert knowledge [14,17,18,19,20]. It is also challenging for this method to visually distinguish smoke from clouds, dust, and other aerosols based only on composited imagery, which is a known issue in the analyst labeled hazard mapping system (HMS) smoke product [21]. Second, multiple frames of satellite images, acquired before and after fire events, have been used to find smoke cores using image differences and then expanded to whole smoke plumes by identifying neighborhood pixels with similar spatial-and-spectral characteristics (Chrysoulakis et al., 2007). Although this method offers a novel way to detect smoke plumes under specific conditions, there are some disadvantages: (1) smoke cores can hardly be extracted when either the pre-fire or post-fire images are contaminated by smoke, clouds, or bright surfaces; (2) expanding smoke cores recursively is very time-consuming; (3) it is challenging to apply such algorithms to large scales; and (4) false positive/negative smoke cores could result in much larger commission/omission errors after regional expanding. Third, machine learning techniques for smoke detection are recently emerging, like convolutional neural networks [16,22,23] and maximum likelihood [8], but depend heavily on the quality of training samples from different cover types (e.g., smoke, cloud, dust, and bright surface), choice of model/algorithm, and model hyper-parameter configuration.
Finally, the most well-established smoke detection method is based on the aerosol index (AI) which has been calculated for several different satellite sensors spanning a period of more than 30 years [24,25,26]. Generally, the positive AI value indicates the presence of absorptive aerosols (i.e., plumes of dust, volcanic ashes, and smoke from fires) [27]. The most commonly used AI is computed from two ultraviolet bands (0.34 and 0.38 µm) based on the spectral contrast due to differences in smoke aerosol absorption, which also removes ozone’s impact because of the very limited ozone absorption at these two bands. Although using ultraviolet bands could minimize impacts from interfering absorbers (i.e., ozone), AI products derived from ultraviolet bands usually have a quite coarse spatial resolution. Recently, an aerosol detection product (ADP) has been developed for the visible infrared imaging radiometer suite (VIIRS) based on AI calculated from the 0.412 and 0.445 µm bands. The VIIRS AI has a spatial resolution as high as 750 m although the band pair choice for AI calculation is not optimal [28]. However, both the ultraviolet bands-based AI and VIIRS AI tend to miss thin smoke plumes when smoke conditions are characterized by small aerosol optical depth, low aerosol layer height, and low single scattering albedo since absorption AI has been shown to be less sensitive to these three smoke conditions [29]. The AI-based method also tends to confuse smoke with bright surfaces (e.g., desert) due to the strong wavelength-dependent albedo of bright surfaces, which could lead to a similar spectral contrast as smoke absorption and then high AI values [30]. In addition, the AI-based method is hardly able to distinguish smoke from high clouds with an effective cloud fraction close to one because these clouds often present positive AI values. Therefore, the development of novel methods for detecting fire smoke plumes is still needed.
Considering the strong Mie scattering at blue and green bands caused by smoke aerosols due to the similarity of smoke particulate diameters to these wavelengths, in this study, we developed a new scattering-based smoke detection algorithm (SSDA) to detect fire smoke plumes using daily VIIRS 750-m reflectance and brightness temperature data. The goals of this study were: (1) to design a new smoke detection algorithm (SSDA) capable of detecting smoke emitted by both large and small fires and separating smoke plumes from clouds and bright surfaces; (2) to validate the SSDA using manually delineated smoke reference data and compare its performance with existing smoke-related products; and (3) to test the SSDA potential for global application.
2. Data
2.1. Study Area
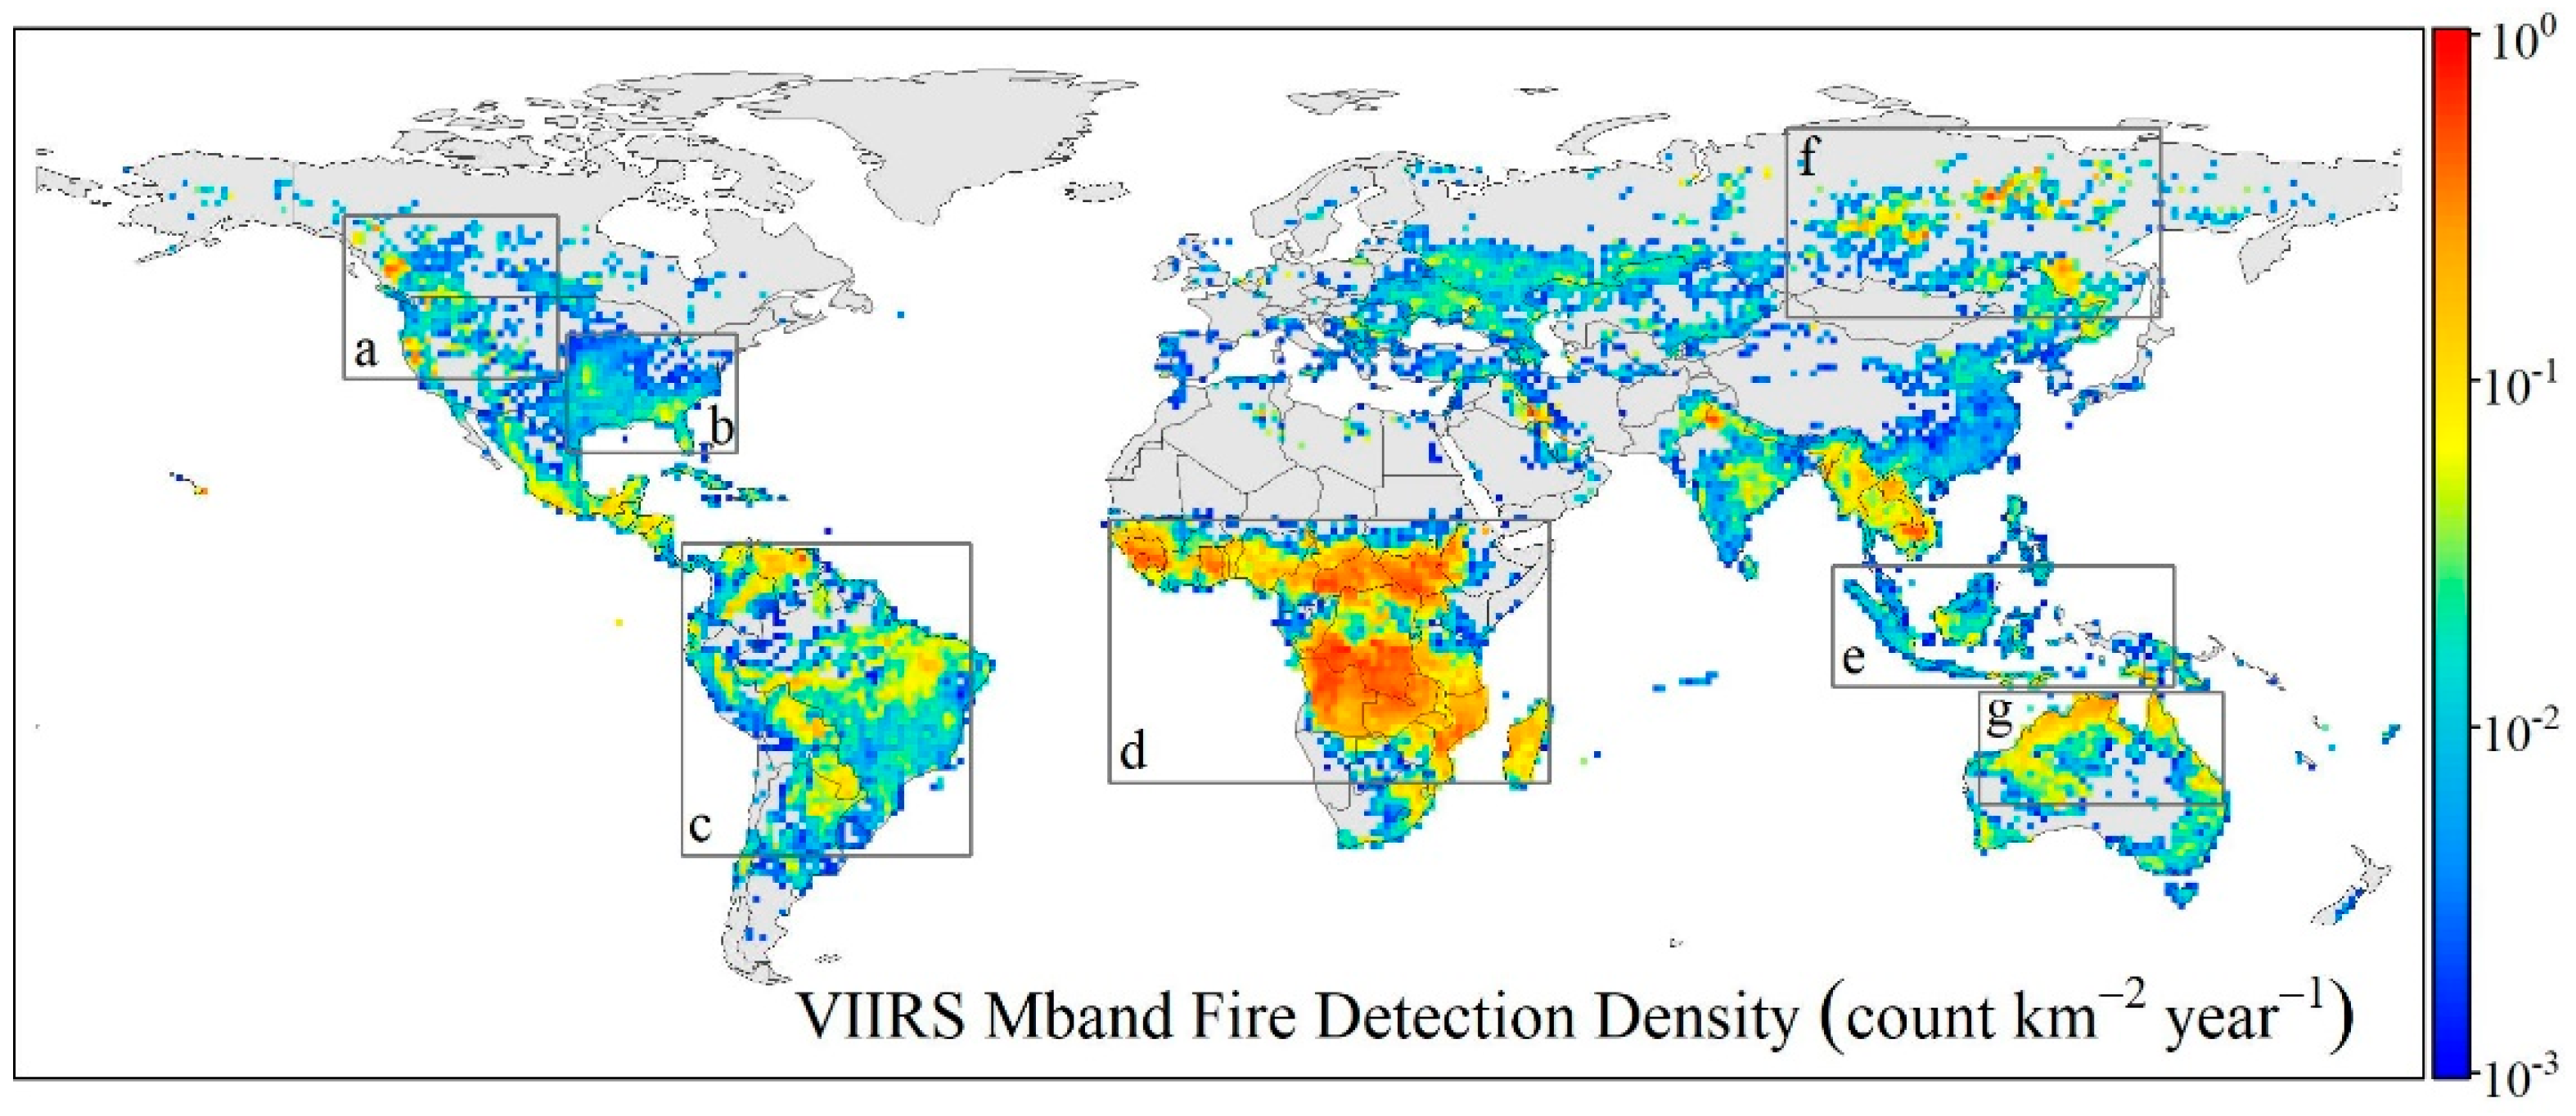
We selected several fire-prone regions at a global scale as our study area. The fire-prone regions are characterized by very frequent fire activities [31,32]. In this study, a total of six fire prone regions (i.e., North America, South America, Africa, Indonesia, Siberia, and Australia as shown in Figure 1) were chosen based on active fire detection density that was calculated using global VIIRS 750 m daily active fire observations in 2018. Although all these regions are affected frequently by fires every year, they have very different fuel types, fire intensities, smoke plume sizes, smoke aerosol densities, and smoke aerosol size distributions [33,34]. Specifically, North America and Siberia are dominated by forest fires with large smoke plumes, while Africa, South America, and Australia are affected mostly by savanna fires or grass fires with relatively small smoke plumes [35,36]. In general, forest fires emit smoke with coarse particulates while the fires from grasses and/or savannas usually release smoke with fine particulates [37]. Particle size in smoke aerosols is also impacted significantly by combustion phases with different particulate size distributions for smoldering and flaming combustion. For example, smoke particles are usually coarser in Indonesia than other regions due to a higher proportion of smoldering from peatland fires [33]. Particulate sizes in smoke aerosols affect scattering from incident radiation [34]. Hence, the smoke plume samples selected from these fire-prone regions should represent well the typical spectral characteristics of global fire smoke. Crop fires in Mainland Southeast Asia (such as Thailand) were not selected in the algorithm development because most of the smoke plumes there are so thin that they are easily affected by other cover types (i.e., mixed pixels).
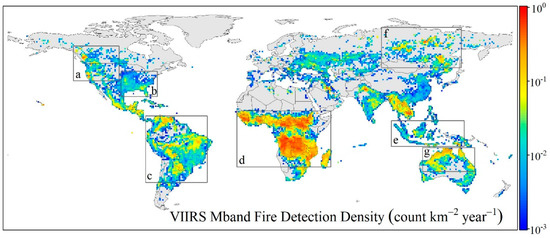
Figure 1.
The fire-prone regions (gray box) for selecting smoke plume samples in (a,b) North America, (c) South America, (d) Africa, (e) Indonesia, (f) Siberia, and (g) Australia. The base map is 1° × 1° global fire detection density derived from 2018 VIIRS 750 m active fire observations in geographic projection.
2.2. VIIRS Sensor Data Record
The VIIRS sensor data record (SDR) has 22 channels that span the visible and infrared wavelengths ranging from 0.41 µm to 12.01 µm. Among these channels, five are high-resolution bands (I-bands); sixteen serve as moderate-resolution bands (M-bands); and another is a unique panchromatic Day/Night band (DNB). In this study, we used seven moderate-resolution reflectance bands (i.e., M3, M4, M5, M7, M8, M10, and M11) and one thermal band (i.e., M16) at a 750 m resolution (Table 1) to get the spectral signatures of smoke, cloud, bright surface, dust, and other surface types. These SDR datasets were downloaded from the National Oceanic and Atmospheric Administration (NOAA) Comprehensive Large Array-data Stewardship System (CLASS) (https://www.avl.class.noaa.gov/saa/products/).

Table 1.
The S-NPP VIIRS bands (750 m) used in the SSDA.
To enhance the contrast between smoke aerosols and non-smoke areas, we used the corrected reflectance, rather than top-of-atmosphere (TOA) reflectance, for the blue band (M3). The corrected reflectance is derived from the TOA reflectance by performing a simple atmosphere Rayleigh scattering correction [38] without any adjustments for aerosol scattering [39]. In addition, we calculated the spatial standard deviation of the blue band corrected reflectance for a better separation of smoke from clouds. However, for bands of longer wavelengths, we used TOA reflectance directly (without any corrections) due to the negligible impacts from Rayleigh scattering on fine particle-dominated smoke aerosols at longer wavelengths.
2.3. VIIRS True-Color Imagery
The VIIRS true-color imagery is composited from the corrected reflectance of bands I1 (red), M4 (green), and M3 (blue), which is freely available on the NASA Worldview website (https://worldview.earthdata.nasa.gov/). Since the Rayleigh scattering effects have been removed for corrected reflectance at these bands, smoke plume aerosols are more clearly visible in the composited imagery from corrected reflectance than TOA reflectance due to the more prominent Mie scattering contrast of smoke and non-smoke areas. It is worth mentioning that the true-color imagery is developed specifically to address the needs of the fire monitoring community to visualize smoke [39].
To visually identify smoke samples for the development of SSDA algorithm, we downloaded the Suomi National Polar-orbiting Partnership (S-NPP) VIIRS 375 m true-color imagery from NASA Worldview. Specifically, to select training samples of different cover types, we downloaded true-color images containing large smoke extents from different fire-prone regions and years (Table 2). Validation samples were selected from another 109 true-color image subsets that we downloaded across the fire-prone regions (Figure 1) during August 2018 (see detail in Section 2.6.3). Corresponding VIIRS SDR data were also downloaded for the same locations and times as the true-color imagery.

Table 2.
The acquisition locations and times of VIIRS imagery for selecting training samples.
2.4. VIIRS Active Fire
The VIIRS 750 m daily level 2 active fire product (https://www.avl.class.noaa.gov/saa/products/) provides fire detection time, fire location (longitude, latitude, sample, and line), detection confidence, fire radiative power, view zenith angle, and the logical criteria used for fire selection in each fire pixel [40]. The product also includes a fire mask (FM) containing nine different pixel classes: not processed, bowtie detection, sun glint, water, cloud, land, unclassified, and three fire-affected classes along with their detection confidence [41]. We used the locations of actively burning fires to get the fire density map [42]. We also used the water class from VIIRS fire mask to identify ocean areas because sun glints over oceans and green waves along ocean coasts are easily confused with smoke.
2.5. VIIRS Enterprise Cloud Mask
VIIRS Enterprise Cloud Mask (CM) provides a 4-level cloud mask including cloudy, probably cloudy, clear, and probably clear [43]. However, this product has a high false detection rate (commission error), which means that smoke areas could be misclassified as clouds [44]. Therefore, instead of using the final 4 level cloud mask, we used the intermediate cloud mask tests and flags (including cloud shadow, oceanic glint, snow, and cirrus), which are used to compute the final cloud mask available from the CM product, as additional datasets to reduce noise in smoke detection [43]. The CM cloud shadow is detected using a geometry-based cloud shadow detection procedure based on the satellite viewing geometry, solar azimuth and zenith angles, cloud edge distribution, and cloud altitude. The ocean glint mask is defined based upon the glint zenith angle which is also a geometry-based algorithm using viewing and illuminating geometry information. Snow is determined mainly based on a Normalized Difference Snow Index (NDSI) calculated from the reflectance at 0.64 µm and 1.6 µm wavelengths. And thin cirrus cloud cover is detected using reflectance at 1.38 µm wavelength, which resides in a strong water vapor absorption band that could mask the surface under most conditions.
2.6. Datasets for Evaluating Smoke Detection
2.6.1. VIIRS Aerosol Products
The NOAA S-NPP Data Exploration (NDE) version of VIIRS level 2 aerosol products, including aerosol optical depth (AOD) and aerosol detection products (ADP) (https://www.avl.class.noaa.gov/saa/products/), were used to evaluate the SSDA smoke detection results. The VIIRS AOD product provides aerosol optical depth at 0.55 µm, defined as the vertically-integrated column total extinction at the wavelength of 0.55 µm [45]. This product is derived based on the Second Simulation of the Satellite Signal in the Solar Spectrum (6S) radiative transfer model [45].
The VIIRS ADP product identifies VIIRS pixels as clear, smoke, or dust categories during daytime [28]. Two algorithms, including deep-blue based algorithm and IR-visible based algorithm, have been developed for operational smoke detection in the ADP product [28]. Specifically, the deep blue algorithm detects smoke by using the absorbing AI and a dust smoke discrimination index (DSDI) derived from three TOA reflectance bands: 0.41, 0.44, and 2.2 µm. AI generally increases as absorbing aerosol loadings (including smoke and dust) increase. The DSDI value of dust is typically greater than that of smoke since the 2.2 µm band is sensitive to the existence of dust but not smoke. Therefore, the combined use of absorption AI and DSDI can help distinguish smoke from dust and also clear land. Since the deep blue algorithm does not work well in some surface reflectance combinations, smoke detections from the IR-visible based algorithm are also provided in the ADP product.
2.6.2. TROPOMI Smoke
The TROPOMI smoke was obtained by combining the positive TROPOMI ultraviolet aerosol index (UVAI) value with the VIIRS DSDI value of smoke based on the deep-blue algorithm that is applied to the VIIRS ADP (Section 2.6.1). The TROPOMI UVAI was used because the TROPOMI sensor provides the UVAI calculated from reflectance at the 0.34 and 0.38 µm wavelengths at the finest spatial resolution (3.5 × 7 km2) to date [46]. As one of the evaluation datasets, the TROPOMI level 2 UVAI product was downloaded over areas corresponding to the 109 true-color August 2018 image subsets from the Sentinel 5P Pre-Operations Data Hub (https://s5phub.copernicus.eu/dhus/#/home). Then, the UVAI was resized using bilinear interpolation to the same spatial resolution as the DSDI data which were available from the VIIRS ADP product.
2.6.3. Manually-Delineated Smoke Plumes
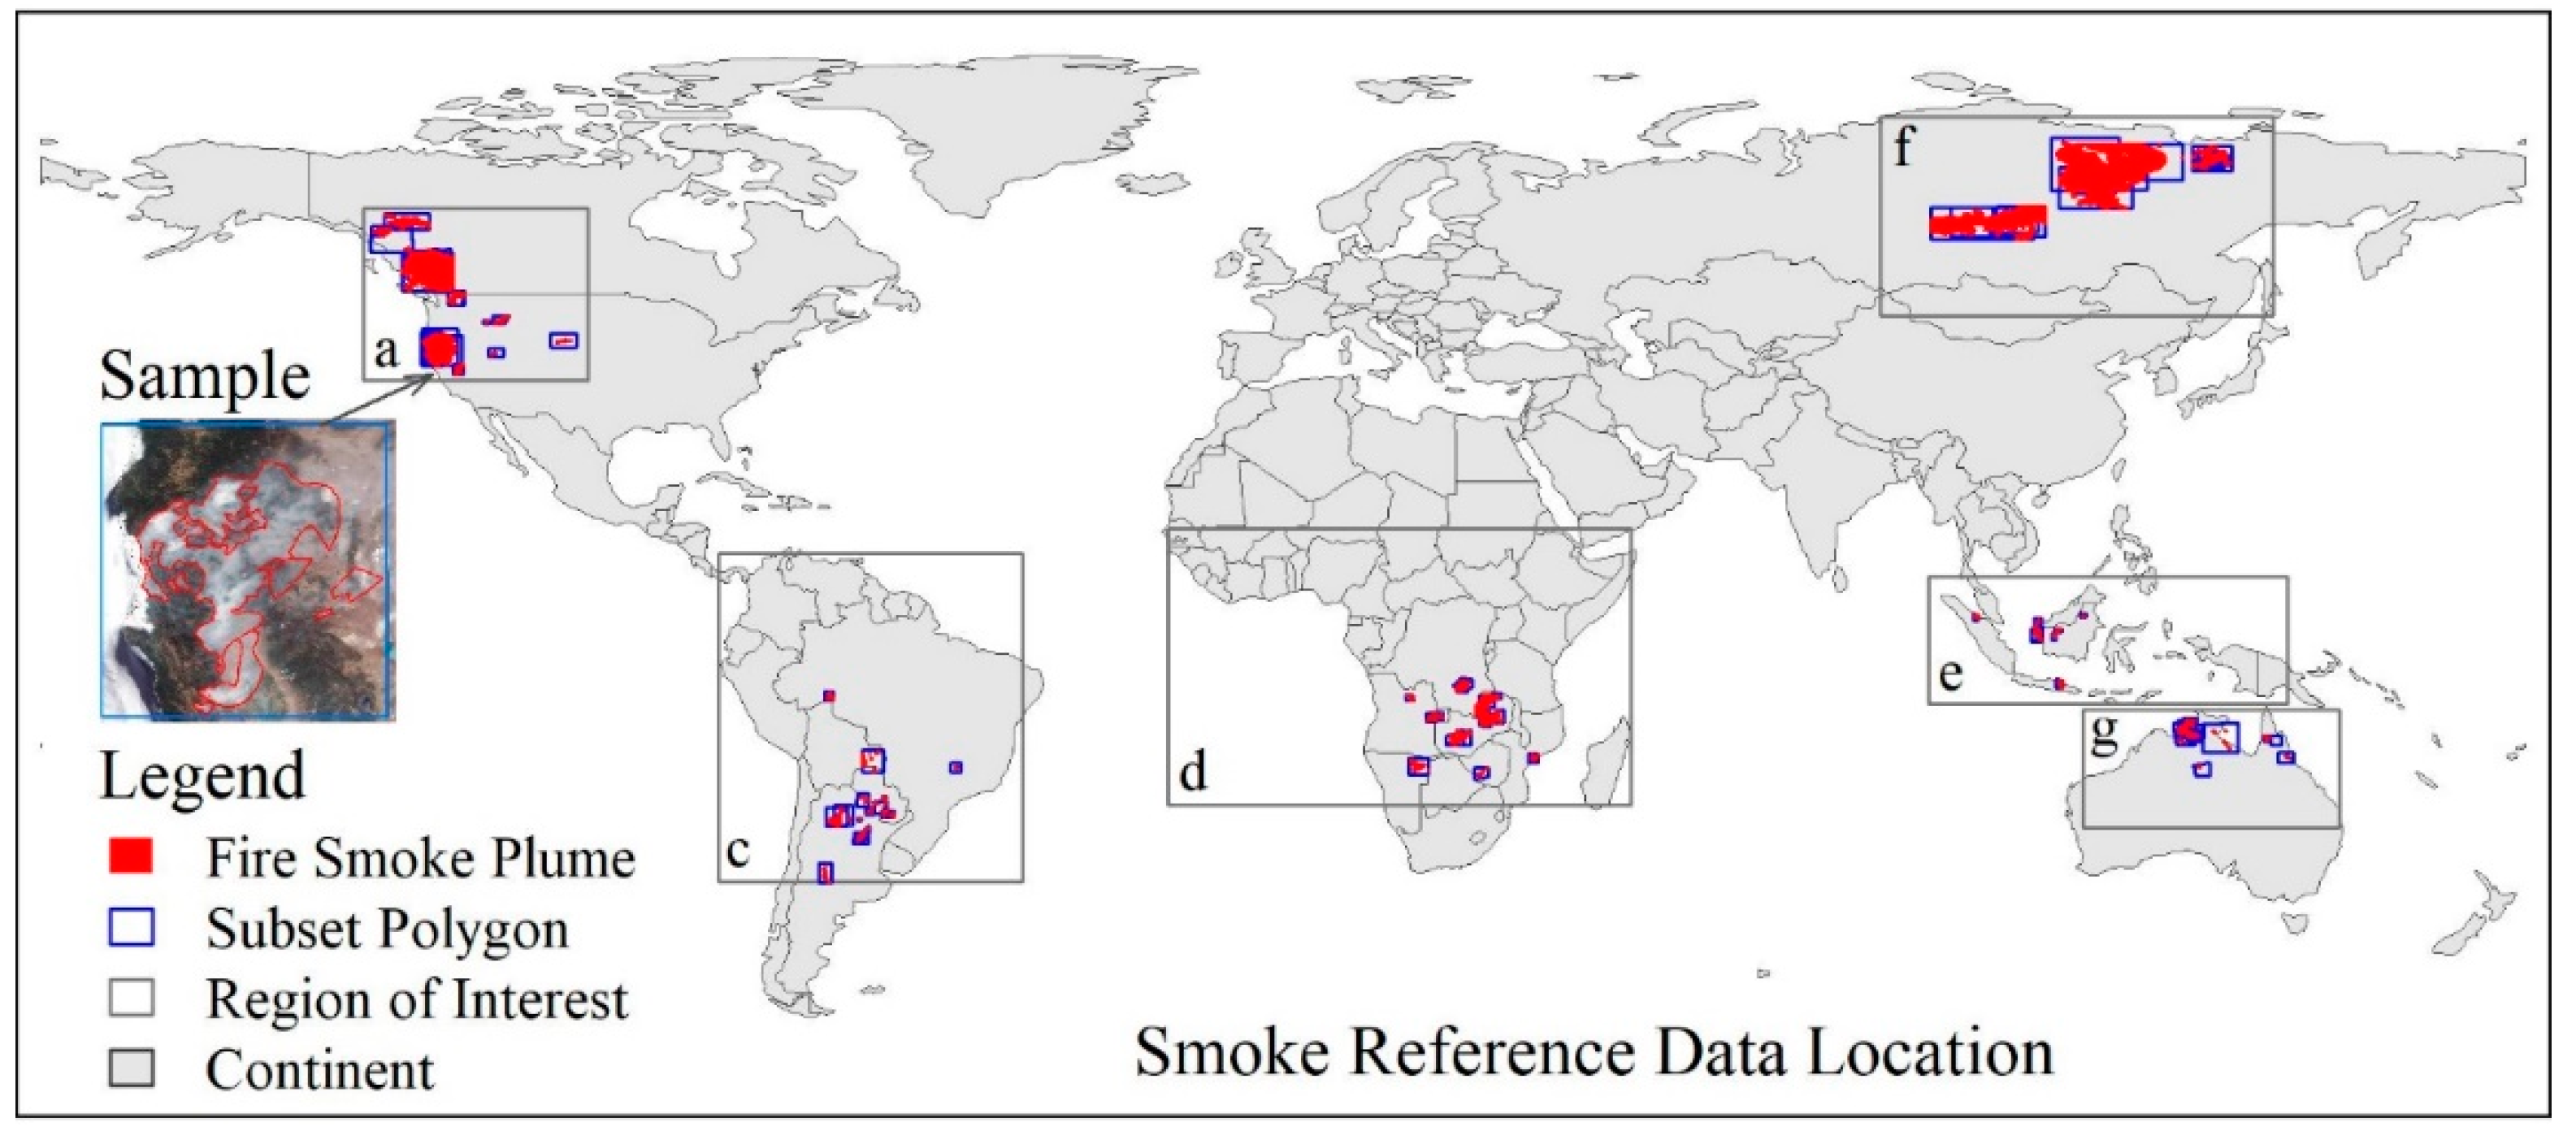
We also manually delineated smoke plumes, based on VIIRS true-color images, to create smoke reference data for validation of the SSDA smoke detection results. To obtain high-quality smoke reference data, image subsets, instead of whole VIIRS granules, were used to select smoke plumes with relatively clear boundaries that could be clearly distinguished from clouds, bright surfaces, and dust. This subset process also confined our attention to small areas containing smoke plumes (subset areas) without considering large areas devoid of smoke (outside of the image subsets) because smoke area takes up only an extremely small portion of global area. The month of August was selected as the validation period because fire activity generally peaks in August across most of the selected fire-prone regions [47,48], which provides more opportunities than other periods to choose smoke samples for evaluating the new SSDA algorithm. A total of 109 qualified image subsets, distributed uniformly over the fire-prone regions (Figure 2), were selected during August 2018. The delineated smoke plume extents were assigned as the smoke class while other areas inside the image subsets were assigned as the non-smoke class. Since the spatial pattern of the smoke plume shows a discontinuity in some areas due to interference from clouds or bare lands inside the plume boundary, we conservatively refined the smoke reference data by grouping these cloud or bare land pixels into the non-smoke class. For quantitative evaluation, we did not select validation samples from southeastern North America (Figure 1b) because August was not part of the typical fire season (i.e., November–April) in this region and we were not able to select enough samples. Instead, we selected two evaluation samples from this region in March, accompanied by another two big fire events in Australia and California, to qualitatively evaluate the performance of the new algorithm (see Section 4.1).
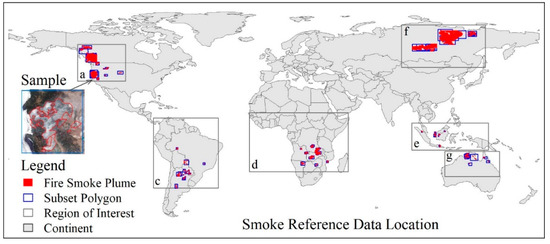
Figure 2.
Locations of the manually-delineated fire smoke plumes (red polygon) within subset regions (blue polygon) used in the reference dataset. The numbers of fire smoke plume reference data are 22, 12, 9, 29, 17, and 20 in the fire-prone regions (gray box) of Africa, Australia, Indonesia, North America, South America, and Siberia, respectively.
3. Methodology
We selected training and validation smoke samples over fire-prone regions for the development of the new SSDA algorithm and tested the algorithm at a global scale. The training samples were selected visually and manually based on true-color images listed in Table 2, which had 47,363, 8871, 44,933, and 84,184 pixels for clouds, bare soil, smoke, and dust, respectively. The spectral and spatial information of the training samples were then applied to design multi-criteria for the SSDA. By combining the multi-criteria with additional datasets from VIIRS active fire and cloud mask products, we firstly eliminated non-smoke classes and then determined the smoke class. The SSDA smoke was evaluated both qualitatively and quantitatively using VIIRS true-color image, VIIRS ADP, TROPOMI smoke, previously published smoke results, and manually-delineated smoke (see detail in Section 2.6).
3.1. Design of Detection Criteria
The multiple criteria for the SSDA development were designed based on the spectral and spatial features of training samples. Firstly, we identified various cover types based on their spectral reflectance characteristics. Because the blue reflectance (M3) of clouds, bare soil, dust, and smoke aerosols are all greater than 0.1 (Figure 3), we defined all other cover types with a low reflectance in the blue band as dark surfaces that were eliminated first. Among the classes in Figure 3, clouds have the unique spectral characteristic of lower M10 reflectance than the M11 band (Figure 3a). This signature may be due to the high microscopic liquid water content in clouds that is not present in bright surface, smoke, or dust samples. In addition, reflectance values of the first four bands (M3–M7) in cloud spectrums are much higher than other cover types (Figure 3a). For both bare soil and dust classes, their common spectral signature is the significantly increasing reflectance values, ramping with increasing wavelengths of the first six bands (M3–M10) (Figure 3b). This feature is relatively stable for many bright soil types and consistent with previous reports [49] (Figure 3b). We grouped bare soil and dust classes into the bright surface category. For smoke, the unique spectral feature is the slightly higher reflectance of blue and green bands than the red band (Figure 3c). This phenomenon is mainly caused by Mie scattering dominating among the smoke aerosols. Mie scattering reaches peak efficiency for particles with diameters similar to wavelengths of the incident light and it is much stronger than Rayleigh scattering [50]. Since reported smoke particle sizes [33] are much closer to the wavelengths at shorter optical bands, Mie scattering leads to relatively high reflectance values in green and blue bands for the smoke spectrum. This feature could also help distinguish smoke aerosols from other aerosols with much coarser particle sizes, such as dust aerosols.

Figure 3.
The spectral signatures of (a) cloud, (b) bare soil, (c) smoke, and (d) dust derived from training samples. The horizontal axis labels of M3, M4, M5, M7, M8, M10, and M11 represent VIIRS moderate-resolution bands (Mband) centered at 0.488 µm (blue band), 0.555 µm (green band), 0.672 µm (red band), 0.865 µm, 1.24 µm, 1.61 µm, 2.25 µm (near-infrared bands) (Table 1), respectively. N is the pixel number of training samples from each cover type.
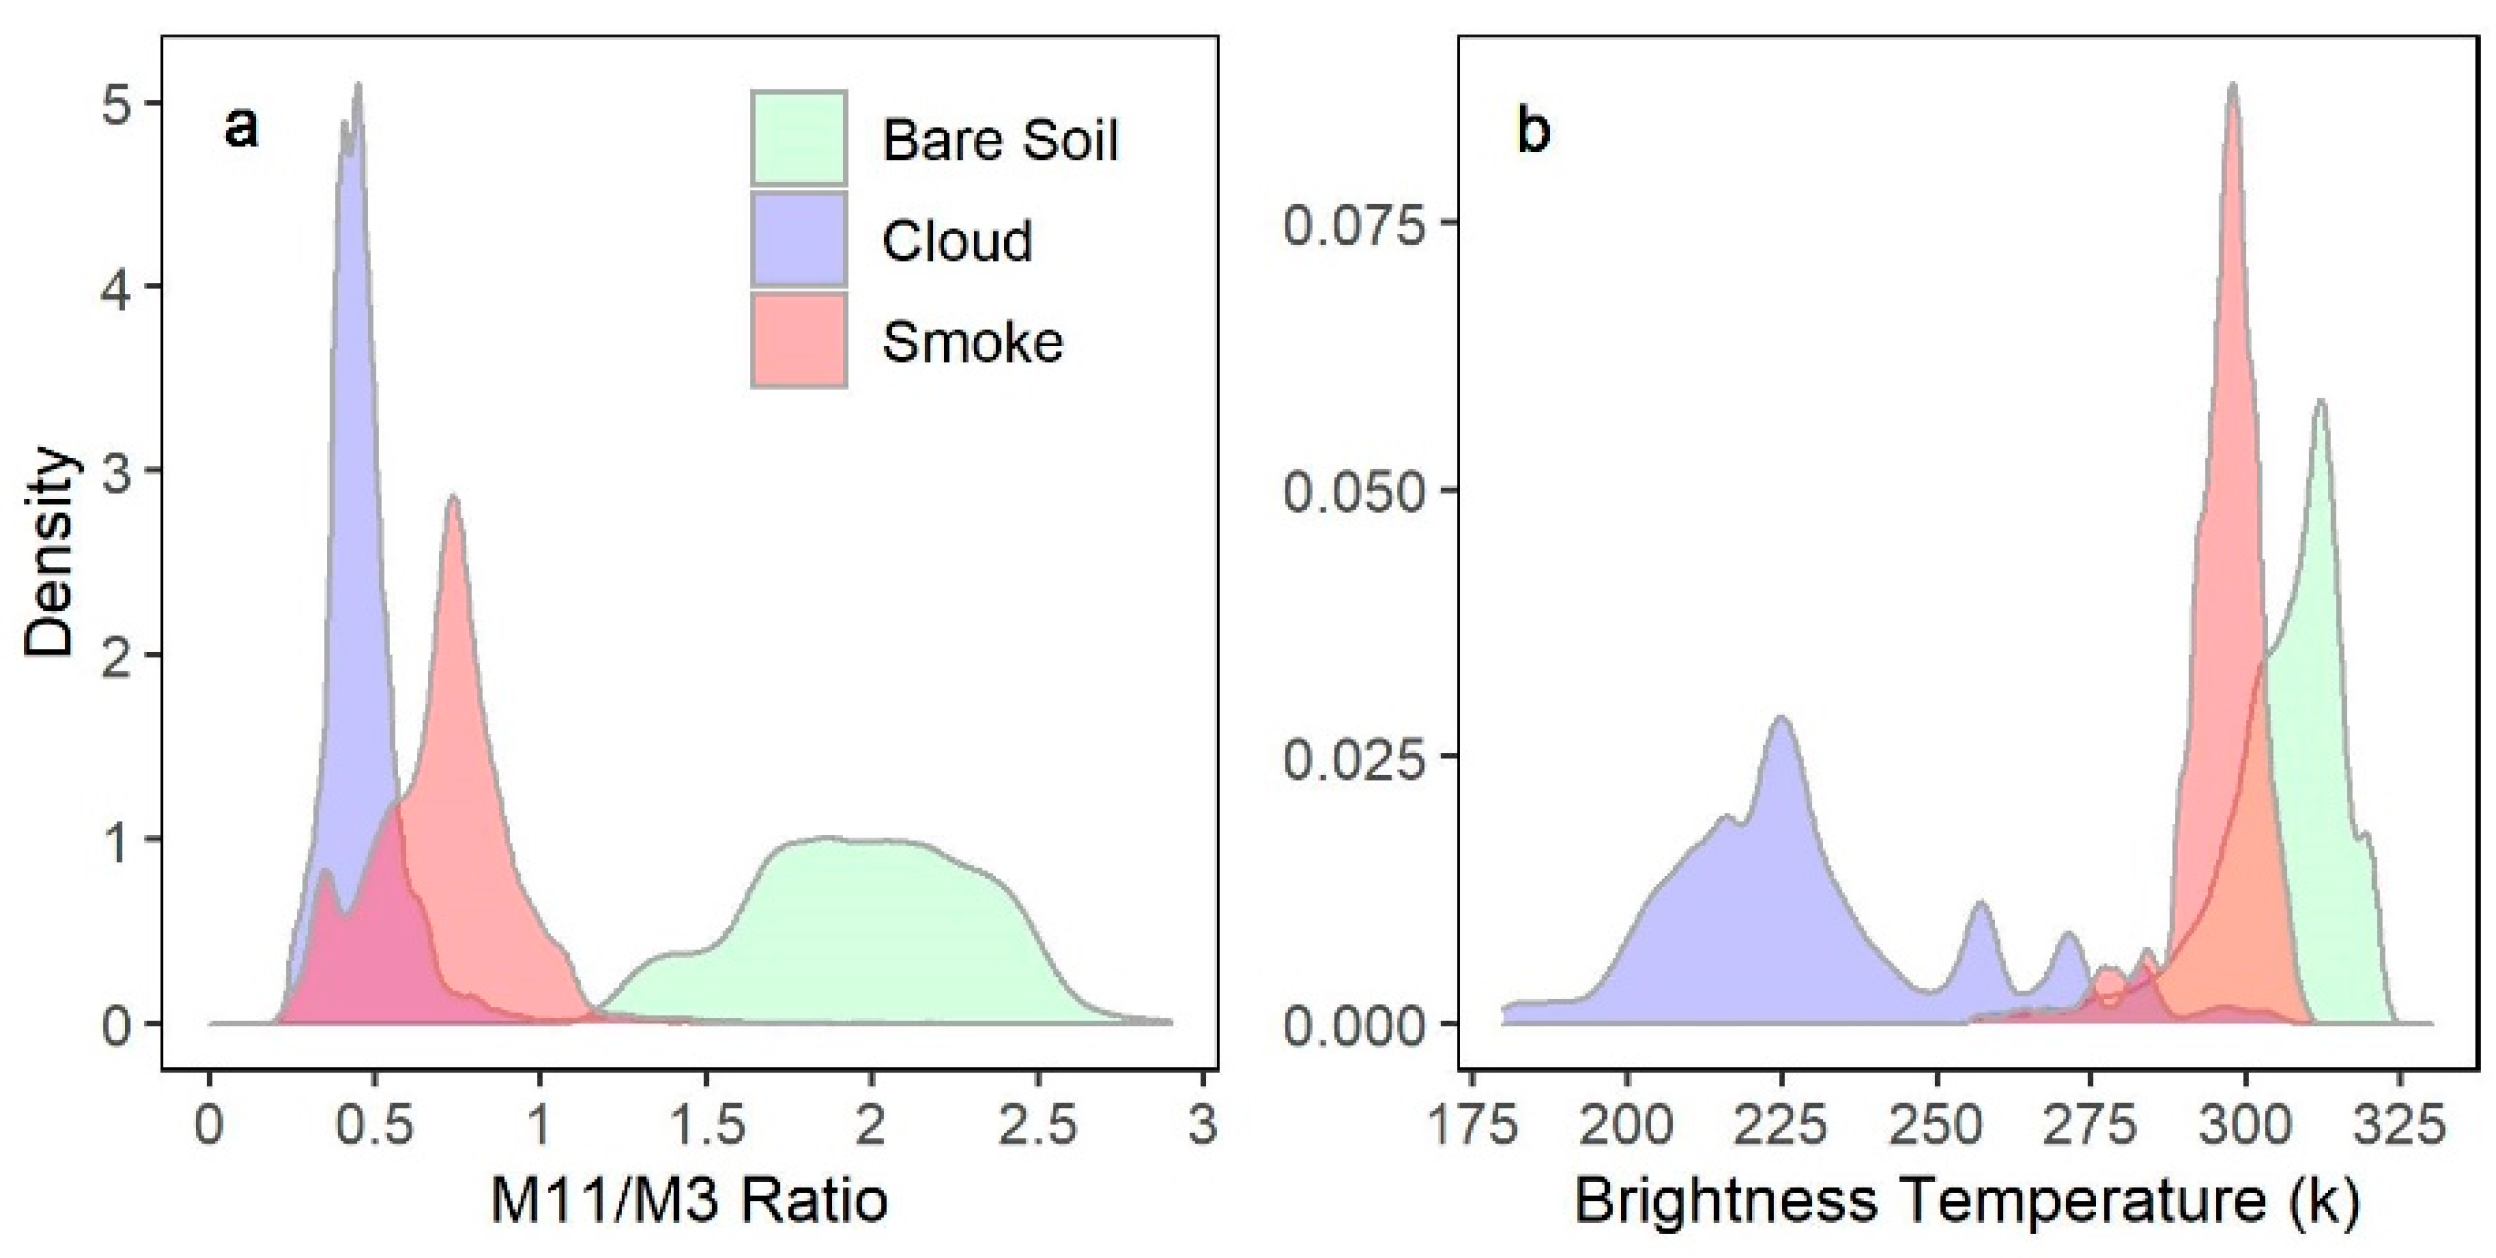
Second, the cover types were further separated based on a combination of the reflectance ratio M11/M3 and the brightness temperature (BT) at the M16 band (Figure 4). Theoretically, the M11/M3 ratio should be low for clouds and smoke plumes because of their relatively high reflectance at M3 and low reflectance at M11. The low reflectance at M11 for these two cover types is caused by less Mie and selective scattering by particles if the particle size is far smaller than the wavelength at longer bands, such as M11 at 2.25 µm [27]. Further, the brightness temperature of smoke is significantly higher than clouds and marginally lower than bare soil. Therefore, besides using spectral reflectance characteristics, smoke was also detected based on M11/M3 ratio and brightness temperature values: clouds were distinguished using very low brightness temperatures, and bright bare soil surfaces were separated using significantly higher M11/M3 ratios.
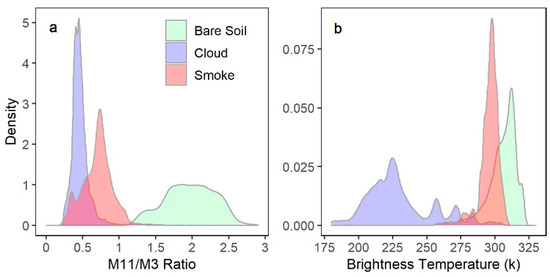
Figure 4.
The density distributions of (a) M11/M3 ratio and (b) brightness temperature at the M16 band for cover types of bright bare soil, cloud, and smoke. The training samples are the same as those of Figure 3.
Finally, the normalized difference vegetation index (NDVI) and spatial standard deviation of blue band reflectance (StdM03) were also used as additional criteria in the detection procedure. The NDVI helps separate smoke from dense vegetation due to the lower NDVI value of smoke [51,52]. The spatial standard deviation helps to further distinguish smoke from clouds because clouds always have a significantly high spatial standard deviation [28,53].
3.2. Smoke Detection Procedure
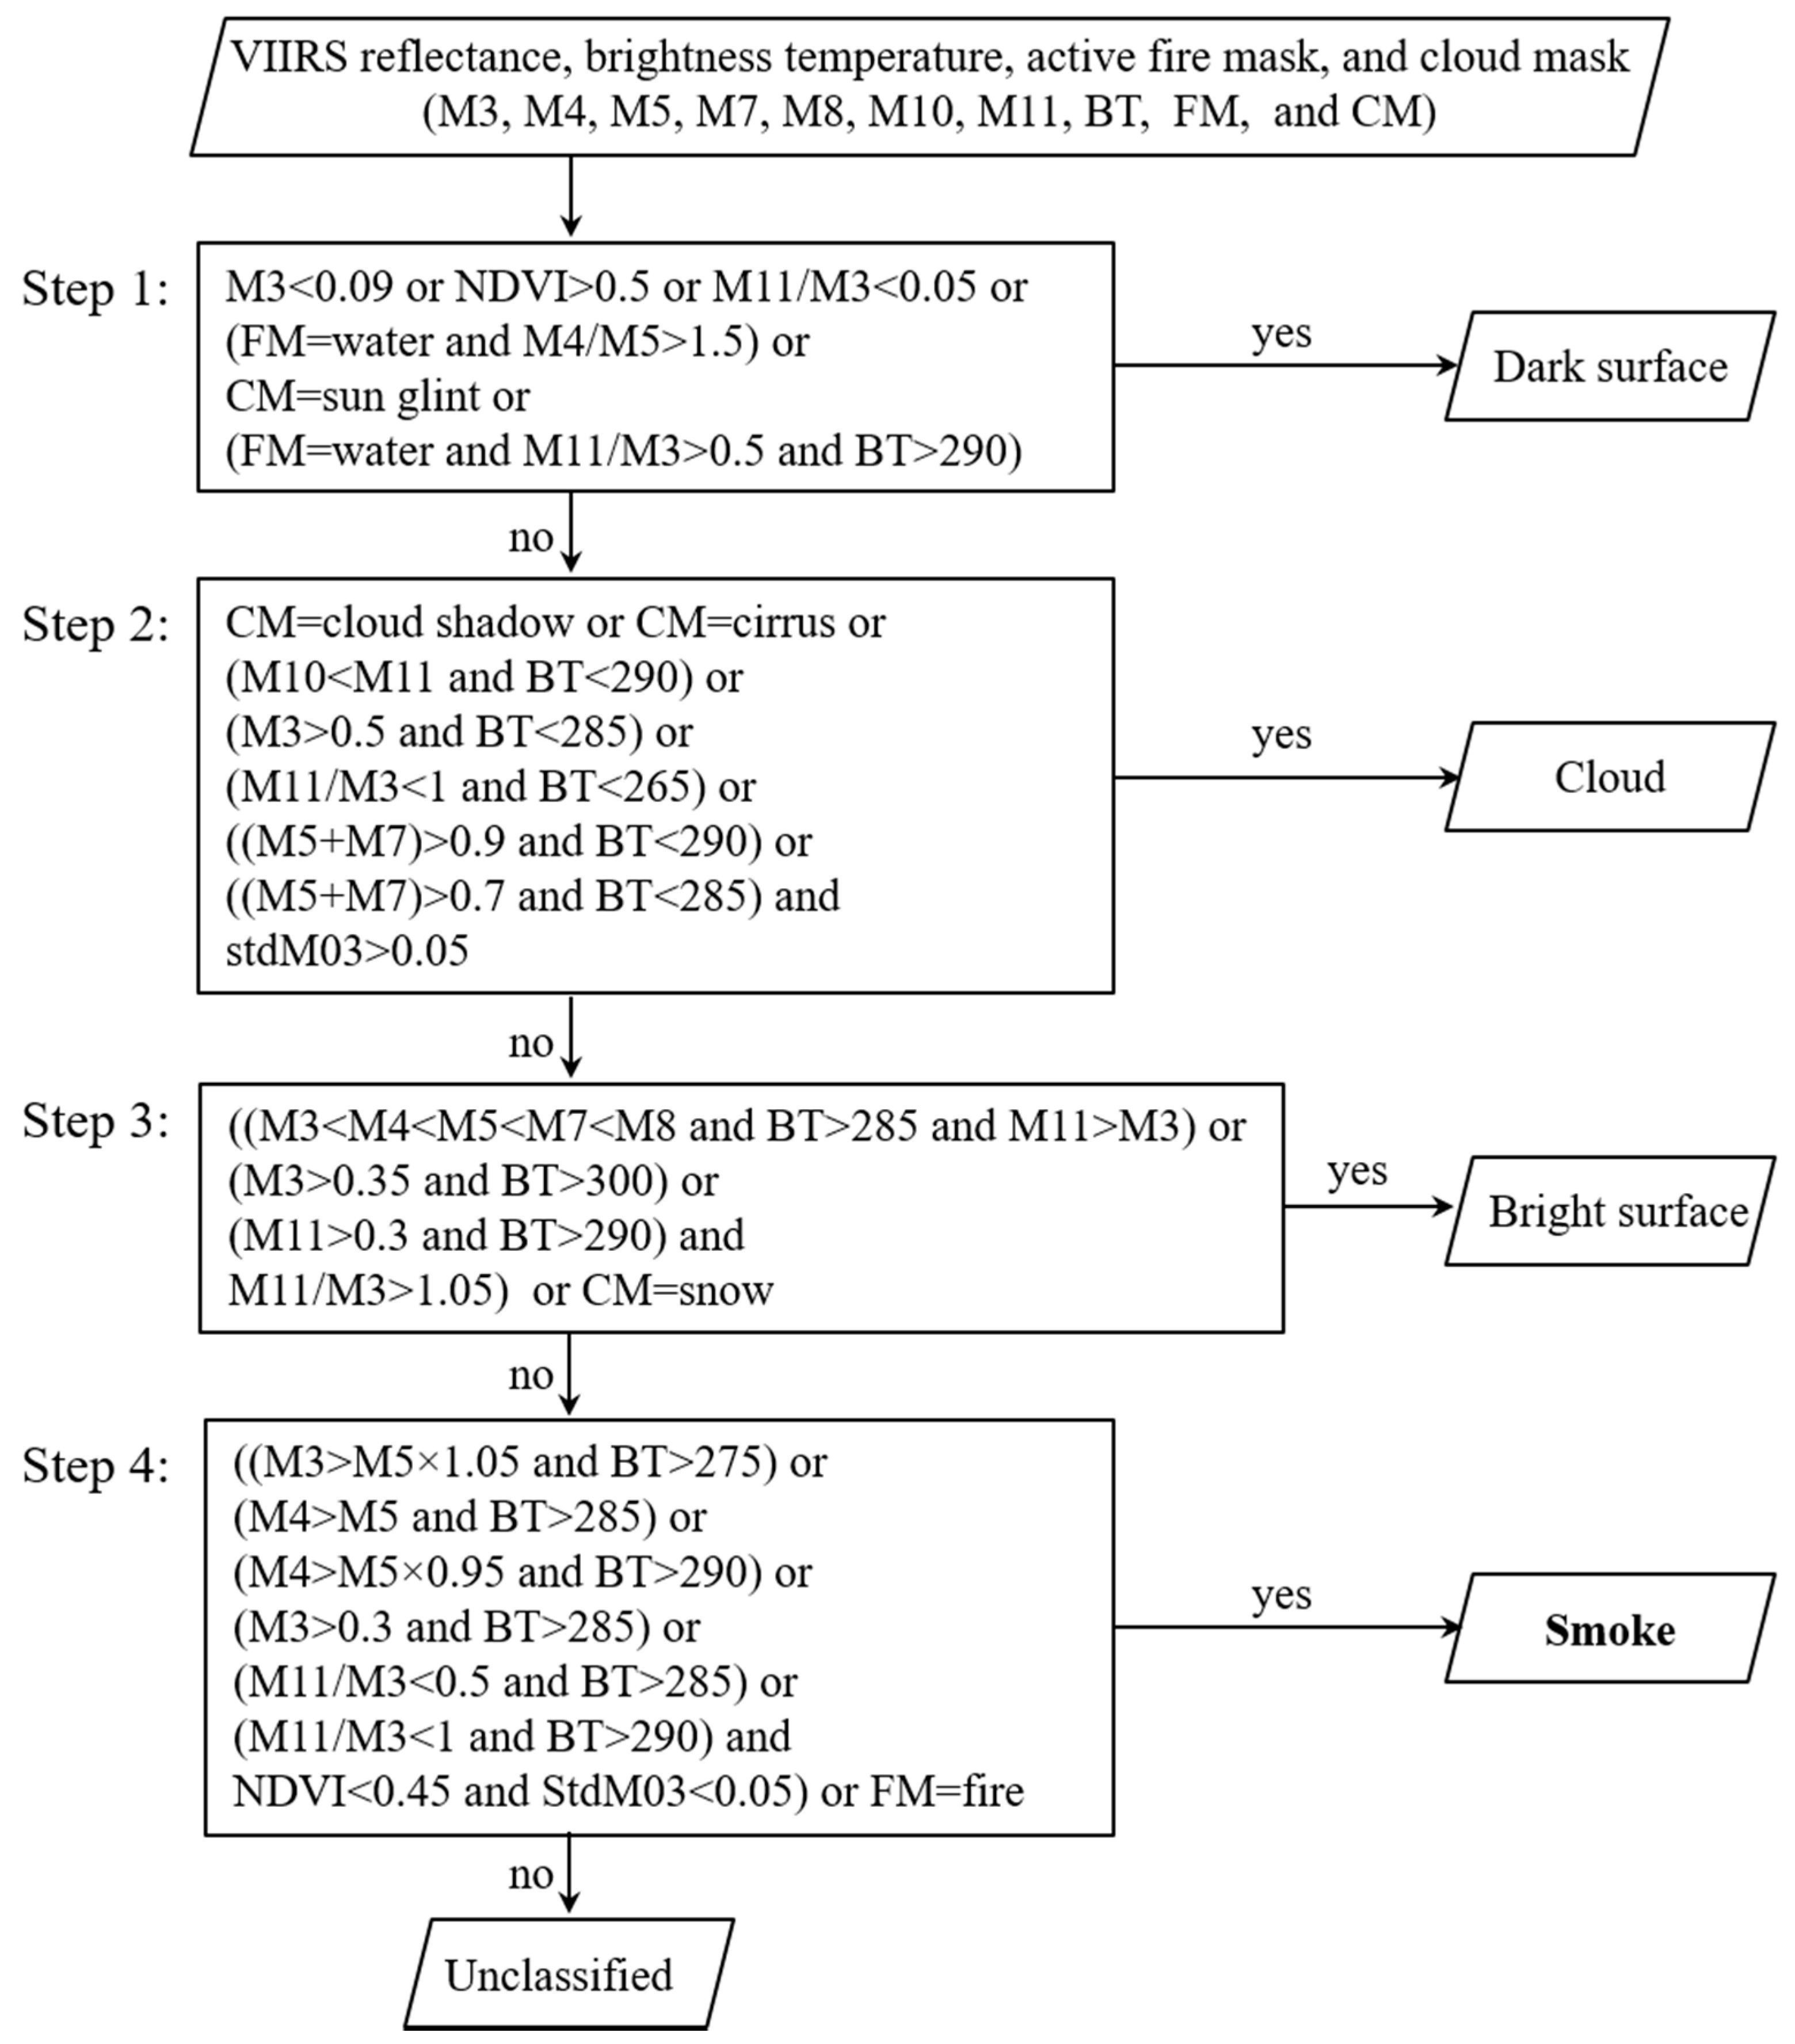
The procedure for smoke detection followed the steps listed in Figure 5. Thresholds were initially derived based on both literature [15,51,54,55,56] and spectral and spatial features of training samples, as described in Section 3.1. We used relatively strict thresholds for dark surface, cloud, and bright surface detection, but relatively loose thresholds for smoke to detect as many potential smoke plumes as possible. The optimal thresholds were finally determined when we got the best overall accuracy through multiple sensitivity analyses.
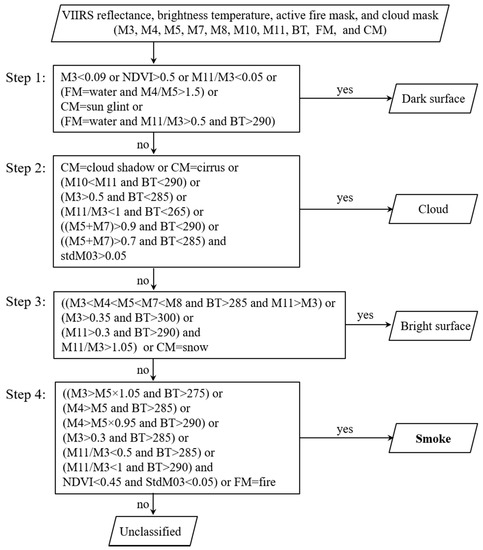
Figure 5.
Flow chart of the SSDA for smoke detection. FM refers to the VIIRS fire mask. CM represents the VIIRS enterprise cloud mask.
Step 1: Dark surface detection. The cover types with low blue reflectance values (M3 < 0.09) were classified as dark surfaces at the beginning since smoke, clouds, and bright surfaces all have relatively high blue reflectance (Figure 3). We also categorized vegetation, water, green coastal waves, and oceanic sun glint as dark surfaces (Figure 5). Specifically, pixels with NDVI greater than 0.5 and an M11/M3 ratio less than 0.05 were grouped into vegetation and water classes, respectively. Because green waves along coasts and sun glints over the ocean are easily confused with smoke, the green waves were separated using the high reflectance at the green band (FM = water and M4/M5 > 1.5). Oceanic sun glint was initially designated based on the oceanic glint from VIIRS CM and then further refined based on its spectral characteristics (FM = water and M11/M3 > 0.5 and BT > 290).
Step 2: Cloud detection. We did not use the VIIRS cloud mask (CM) product directly here because of its very high commission error. Similarly, we also did not use the cloud class from the VIIRS fire mask due to its relatively high omission error for thin clouds and cloud edges. Alternatively, we used two intermediate datasets of the VIIRS CM, cloud shadow and cirrus, as the cloud class for this study. Remaining cloud pixels were detected based on characteristically low reflectance at M10 compared with other bands, very high reflectance at short bands (M3–M7), a combination of low M11/M3 ratio, low brightness temperature, and high spatial standard deviation. Further, the cloud detection criteria developed in a contextual fire detection algorithm [54,55] was also used in this study, but have been modified slightly by adding a brightness temperature threshold.
Step 3: Bright surface detection. We identified bright surfaces (bare soil and dust) based on near-constant increasing spectral reflectance of the first several bands (Figure 3b), as well as the combination of high brightness temperature and high M11/M3 ratio. For the bright surfaces of white sands and badlands, such as in southwestern North America, spectrums may be slightly different with bright bare soils. Therefore, we classified these areas as bright surfaces based on their own specific spectral features. Finally, we also grouped the snow class from VIIRS CM into the bright surface class.
Step 4: Smoke detection. Smoke was detected at the end to reduce interference from other cover types using its slightly higher or similar reflectance of blue or green bands relative to the red band, as well as the combination of relatively low M11/M3 ratio, relatively high brightness temperature, and low spatial standard deviation. Because of the complexity of smoke, with different aerosol size distributions, we also slightly adjusted the criteria of the smoke detection step to identify any potential smoke plumes using a slightly looser threshold for one criterion but stricter thresholds for the other criteria. In addition, we grouped fire hotspots from VIIRS fire mask into the smoke class.
3.3. Accuracy Assessment
Smoke detection performance of the SSDA was evaluated both qualitatively and quantitatively. First, smoke detection results were evaluated qualitatively using VIIRS true-color images over two recent big fire events in Australia and California. Australia’s 2019–2020 bushfire event lasted several months, from October 2019 to February 2020. It resulted in more than six million hectares of land burned, several people died, and billions of animals exterminated [57]. The 2020 fire season in the western United States of America (USA), mainly California, was the most active of the last few years. From mid-August to October, intense fires in the western USA produced large amounts of smoke aerosols that drifted north and east. At present (mid-October 2020), the fires are still burning. In addition, the SSDA smoke detections were also visually compared with other smoke-related datasets, including aerosol detection product (ADP), TROPOMI smoke, and two published smoke results [15,58] for several other small fire events.
Second, the SSDA smoke detection was quantitatively evaluated over the selected 109 image subsets from August 2018, as described in Section 2.6.3. The evaluations included: (1) AOD values of smoke and non-smoke pixels from the SSDA were compared with those from VIIRS ADP and TROPOMI smoke; (2) the SSDA smoke detection was statistically assessed using the manually delineated smoke reference data, VIIRS ADP, and TROPOMI smoke based on several indexes including smoke percentage, overall accuracy, commission error, and omission error. The smoke percentage is the ratio of smoke pixels to the total pixels within each subset image Equations (1) and (2). The overall accuracy is the probability that a smoke or non-smoke pixel is correctly classified Equation (3). The commission error of smoke refers to the fraction of non-smoke pixels that are classified as the smoke class Equation (4). In contrast, the omission error of smoke represents the fraction of smoke pixels that are misclassified as the non-smoke class Equation (5). The commission error and omission error are the complements of the producer’s accuracy and the user’s accuracy, respectively. These indexes were calculated as follows:
where is the smoke percentage reference; is the smoke percentage of smoke detection from different products; is overall accuracy; is commission error; is omission error; and are the total number of pixels inside and outside of the delineated smoke polygons, separately; and are the number of smoke pixels inside and outside of the referenced smoke plume, respectively; and is the number of non-smoke pixels inside the referenced smoke plume.
Finally, we tested the global application of the SSDA algorithm by calculating one-month smoke occurrence frequency based on daily smoke detection during August 2018 and analyzed its spatial distribution pattern by comparing it with a fire density map derived from VIIRS 750 m active fire observations collected in August 2018.
4. Results
4.1. Qualitative Evaluation of the SSDA Smoke Detections
4.1.1. Qualitative Evaluation Using True-Color Images
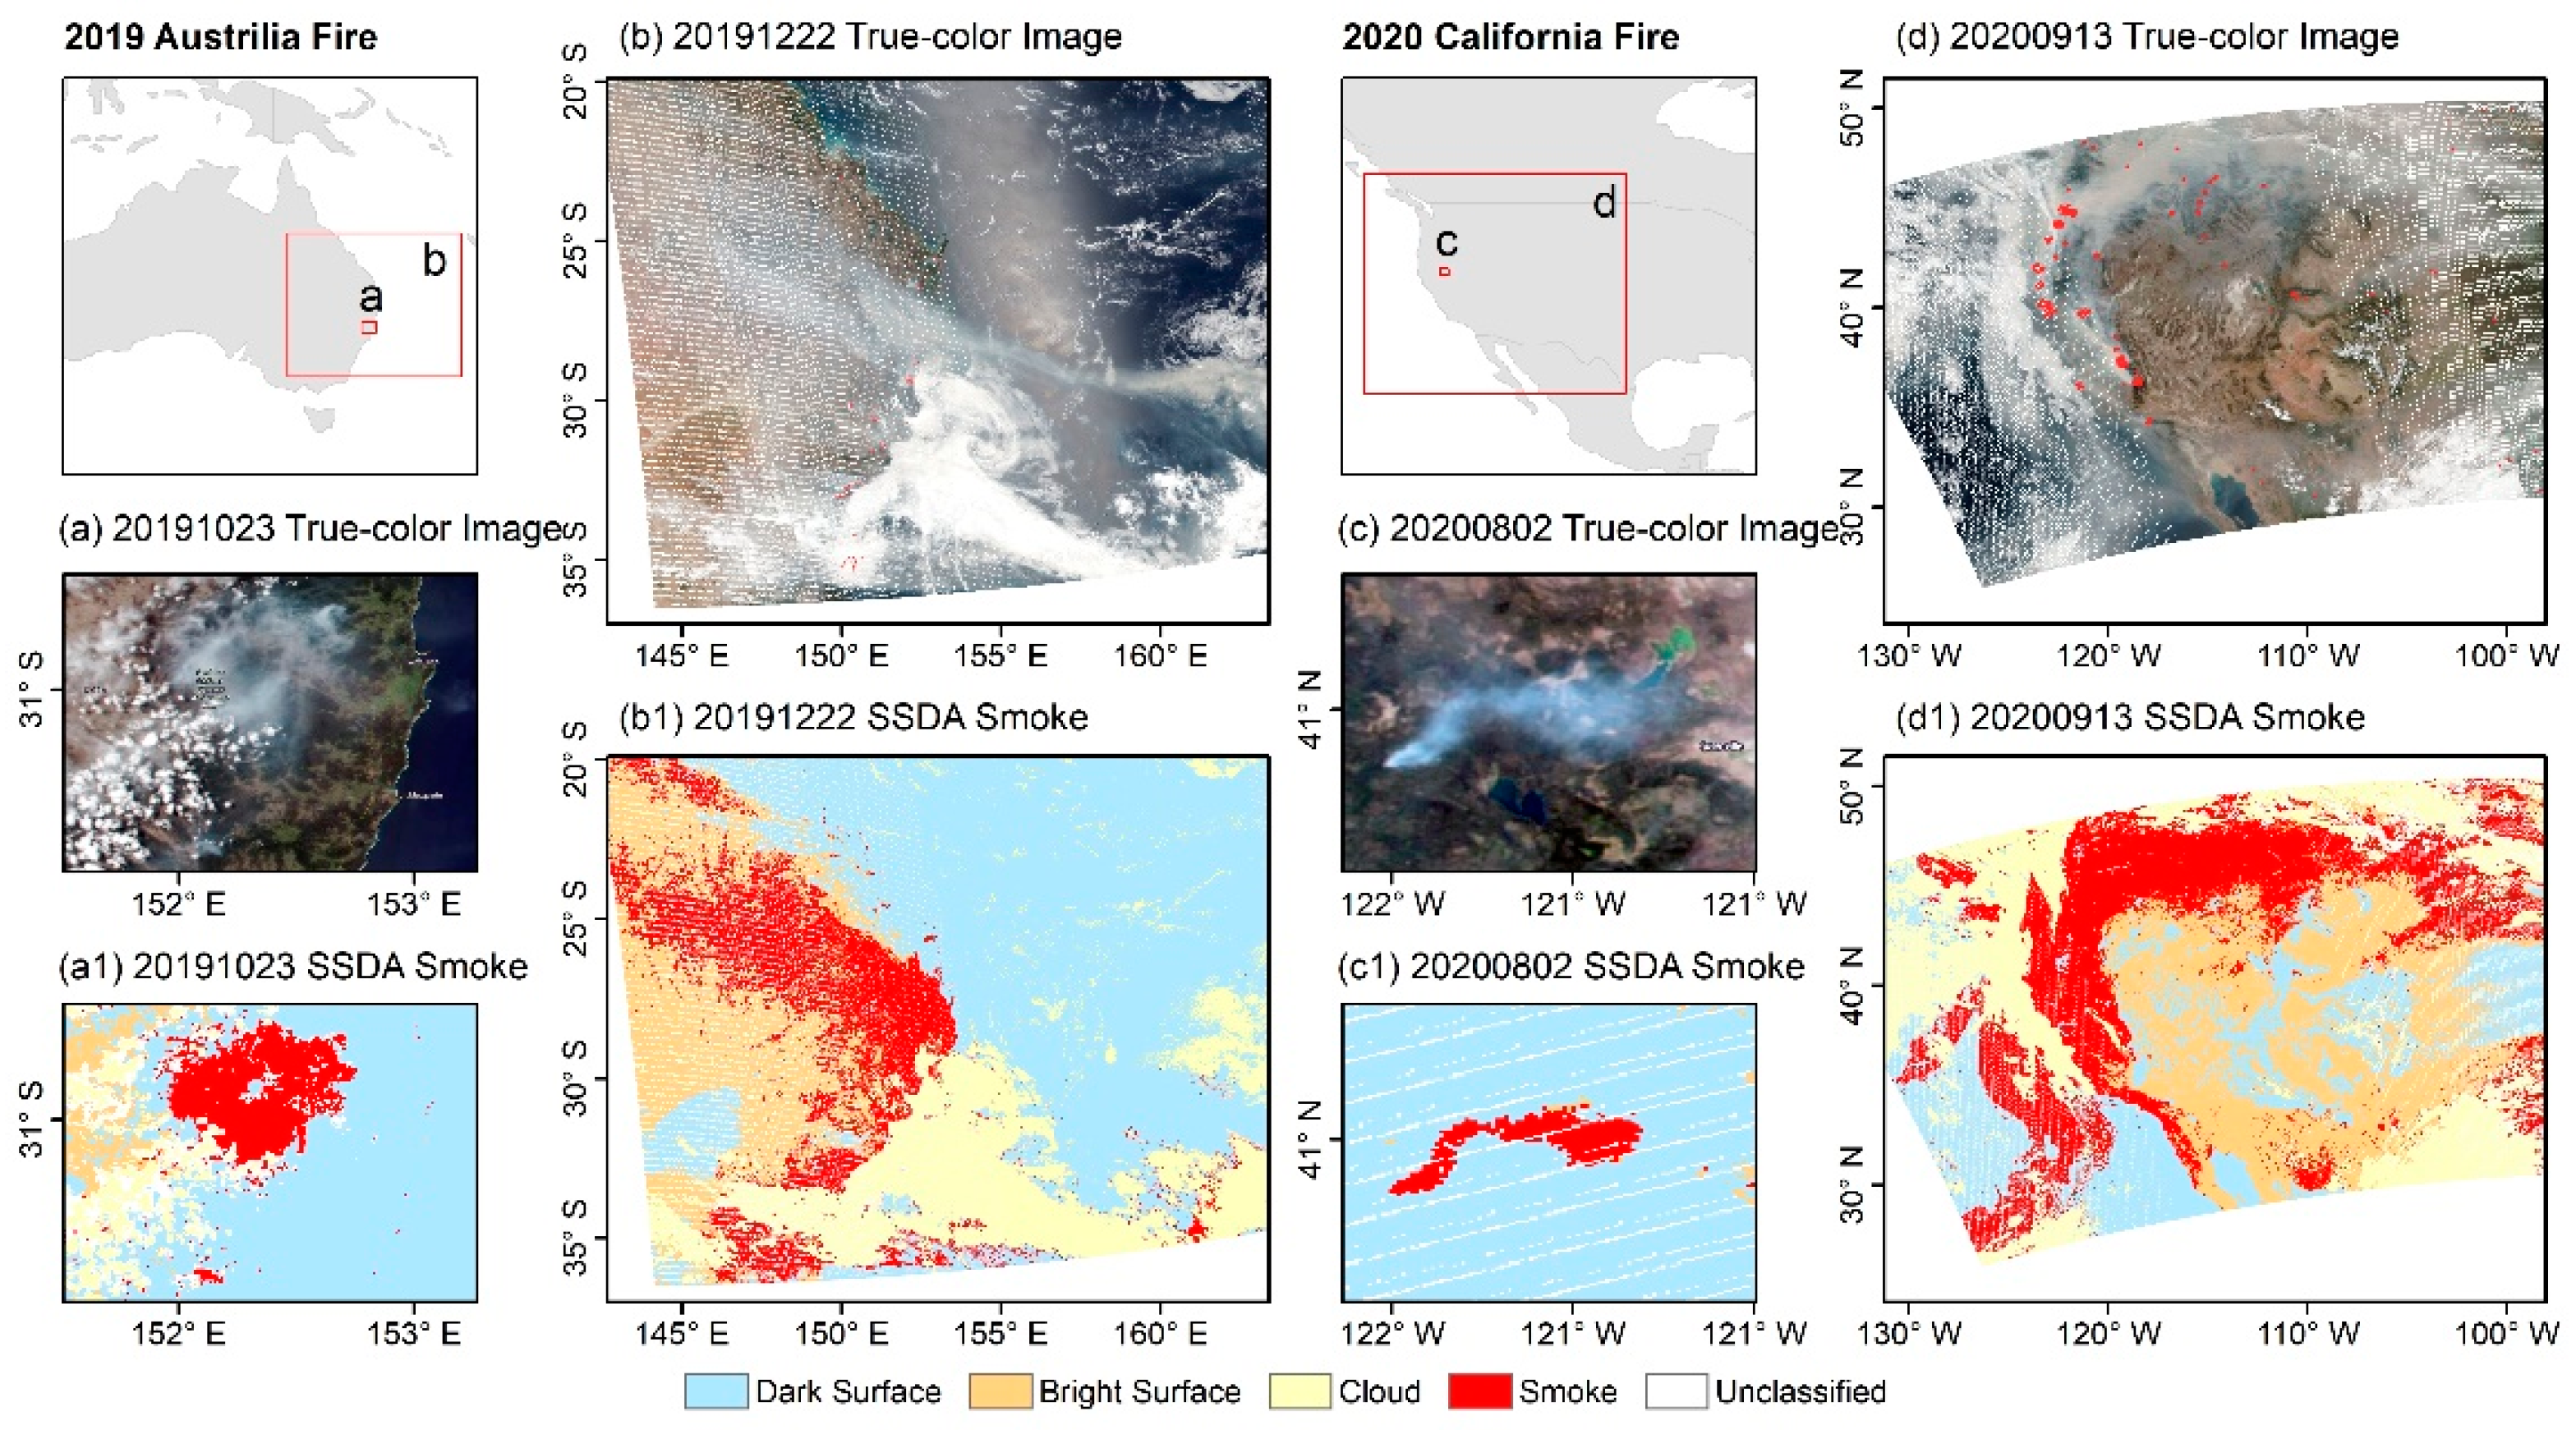
We evaluated our SSDA performance qualitatively by comparing the smoke detection patterns with the corresponding true-color imagery over two big fire events in Australia and California during 2019 and 2020. The early stage of these two fire events burned in small areas with thin plumes (Figure 6a,c). Figure 6a1,c1 illustrate that the SSDA detected the majority pixels within these fire plumes successfully, even for one extremely small smoke plume in the south of Figure 6a. Additionally, the spatial extents of these smoke plumes could be separated well from other surface types, except for the extremely thin smoke pixels at plume edges that were too thin to be detected.
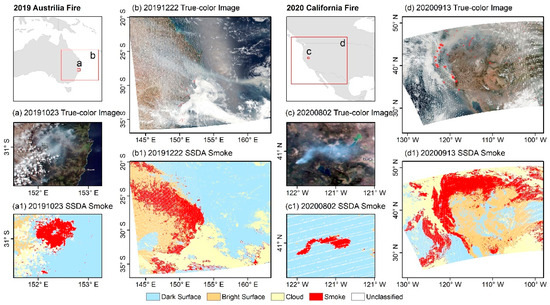
Figure 6.
Comparison of the SSDA smoke detection results (a1–d1) with true-color images (a–d) for big fire events in Australia and California. Small red dots on the true-color images are S-NPP VIIRS daytime fire hotspots. The locations of these four true-color images are shown as red squares on the top row insets. (a,b) are the early and late stages of the Australian fire event in 2019, respectively. (c,d) are the early and late stages of Californian 2020 fire event, respectively.
Figure 6b,d shows the late stage of the Australia and California fire events, respectively. Bushfires dominated in Australia. In Figure 6b1, the SSDA smoke detections match quite well with the spatial pattern of smoke plumes on the true-color images over land, even for the relatively thin plumes in the north of Figure 6b. Some smoke aerosols over oceans were not detected successfully by SSDA due to interferences from oceanic glints, which were grouped into dark surfaces and removed prior to evaluation for the presence of smoke (Figure 5 step1). Californian smoke plumes have primarily been from large forest fires that spread for several thousand kilometers, with a high density in the center and a low density toward the edges. Despite the heterogeneous spatial pattern, Figure 6d1 shows that the SSDA still detected the overall pattern of Californian fire smoke over both land and ocean very well with a clear separation from clouds and bright surfaces, although a very few thin smoke pixels at smoke boundaries were missed (Figure 6d).
Overall, evaluation of SSDA performance showed that spatial patterns of smoke plumes matched quite well with true-color images for both low-density fire plumes in the early stage and high-density fire plumes in later stages of fire events, even under some unfavorable heterogeneous conditions.
4.1.2. Qualitative Evaluation Using VIIRS ADP and TROPOMI Smoke
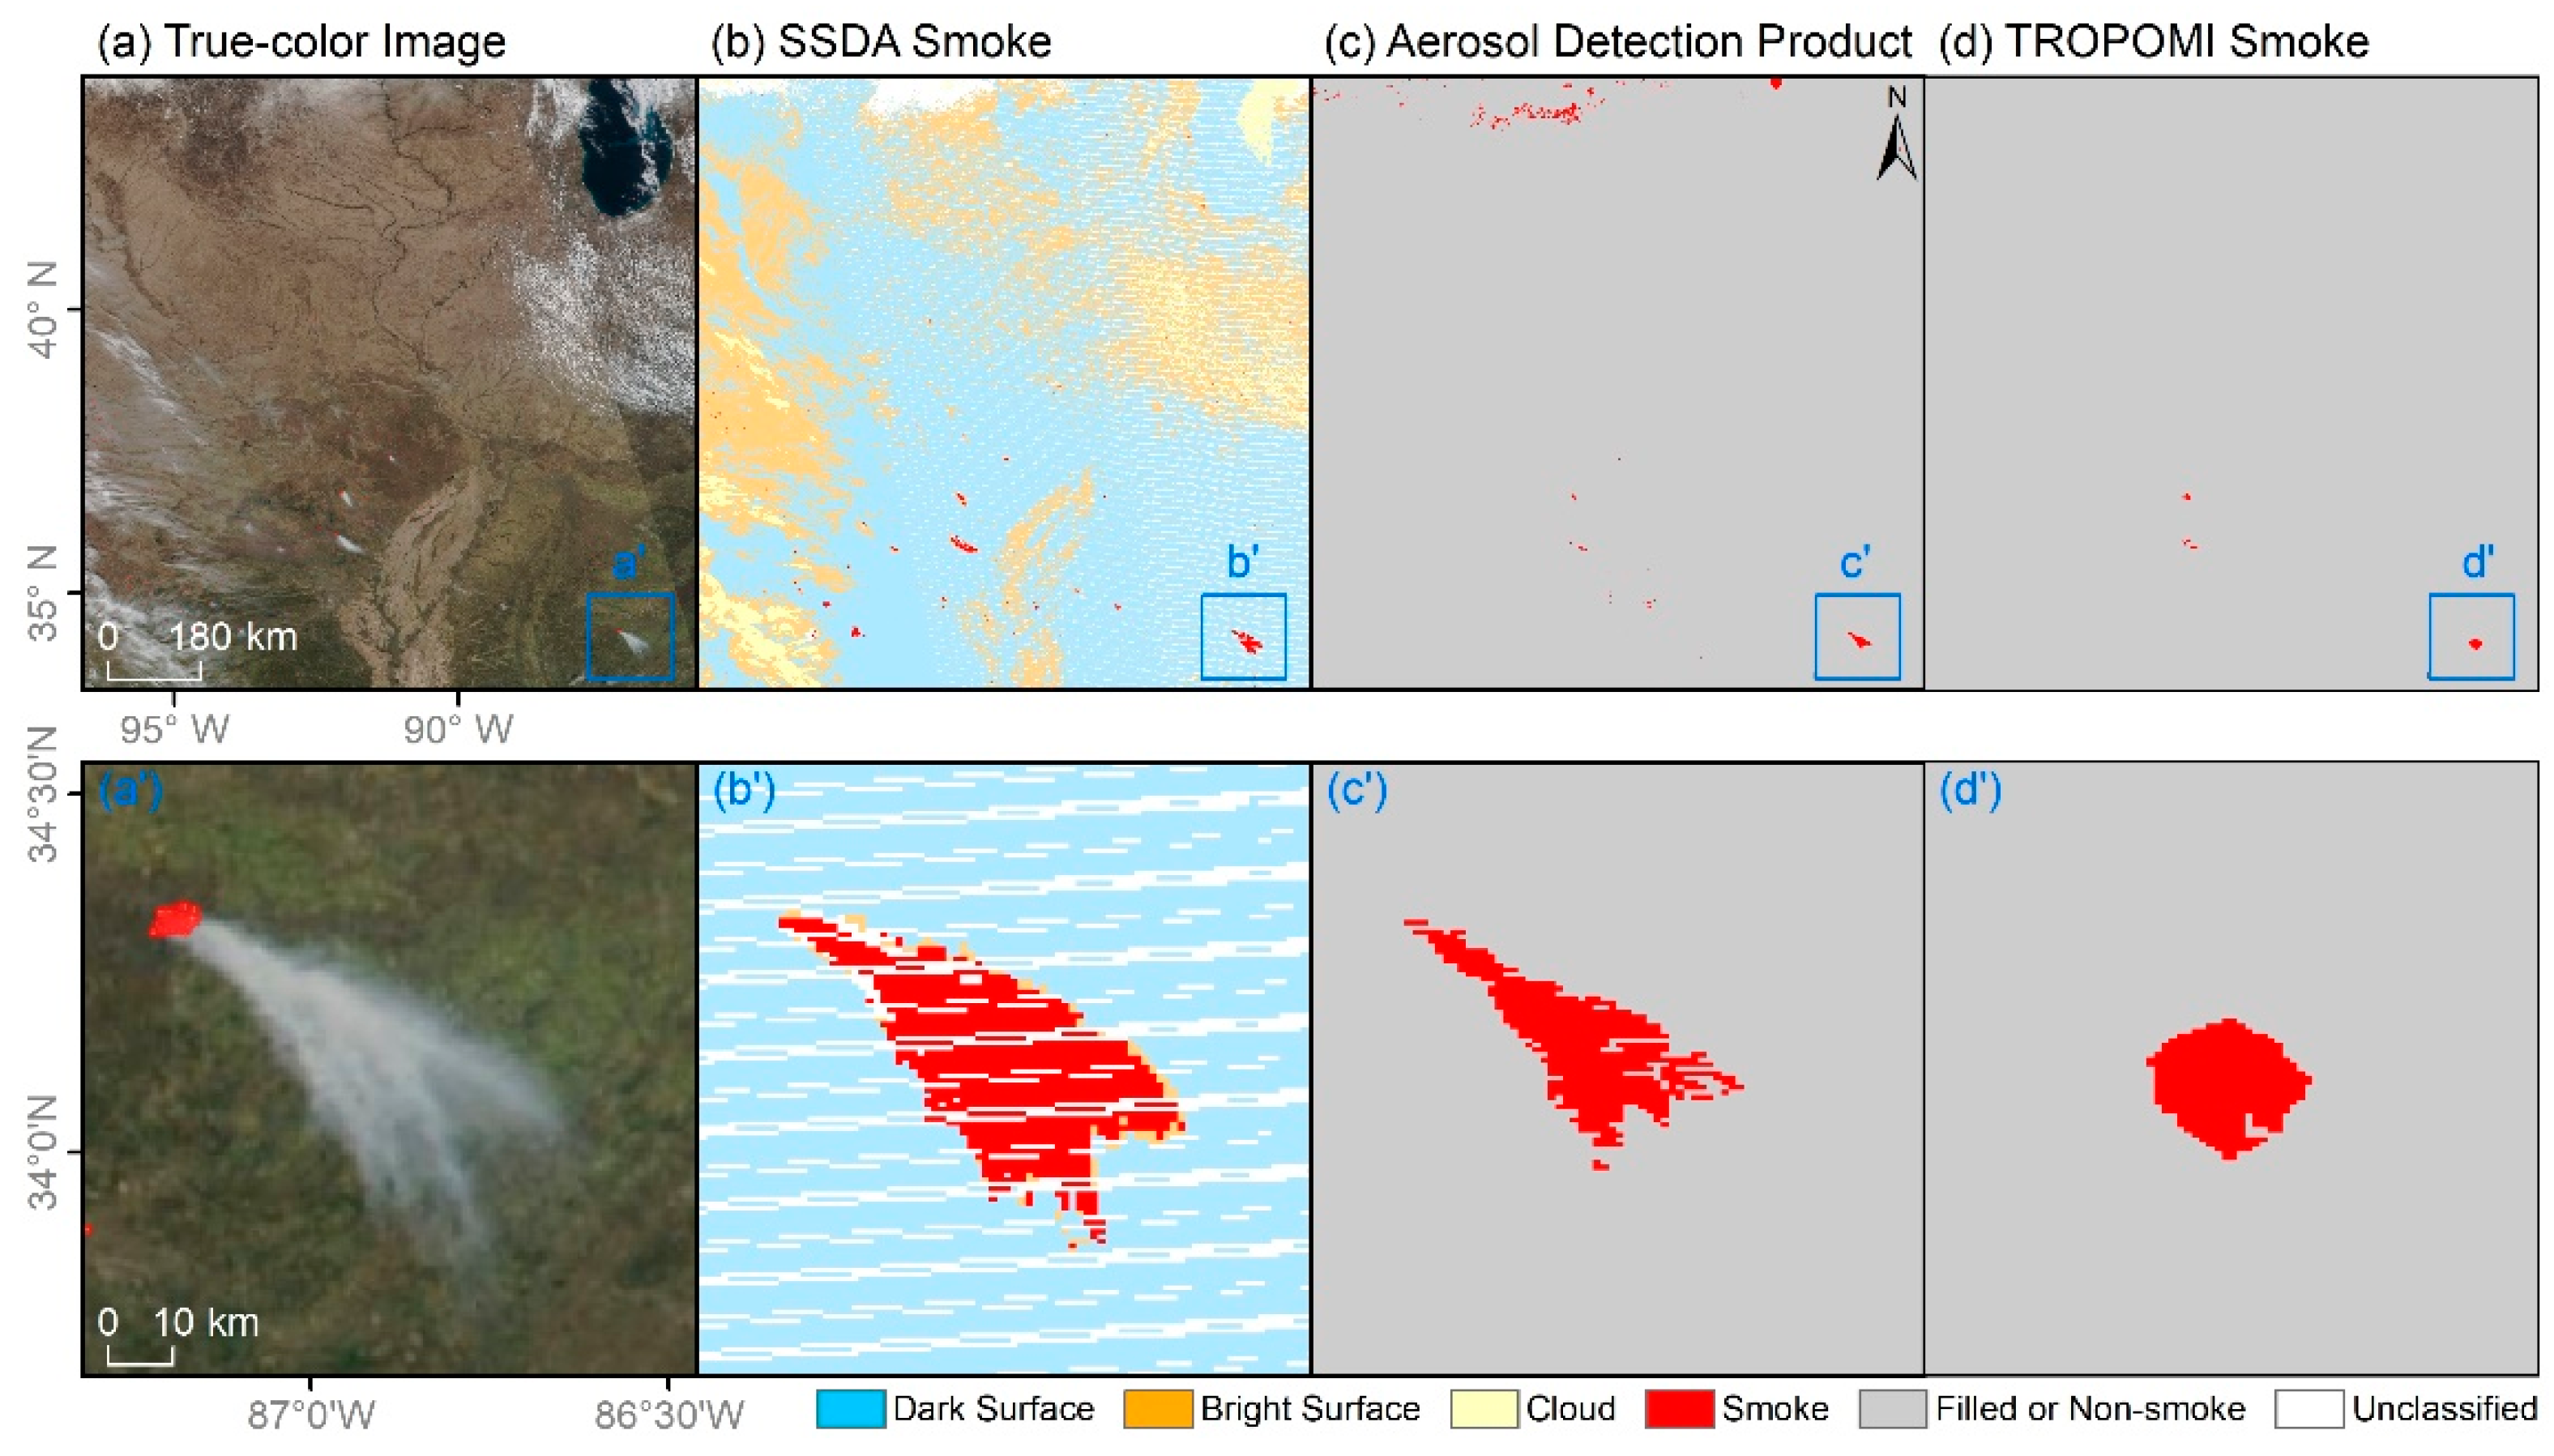
Figure 7 shows the spatial comparison of the SSDA smoke detection results with the VIIRS ADP product and TROPOMI smoke over southeastern North America. Visually, the SSDA detection map matches well with the true-color image, but differs largely from the VIIRS ADP product and TROPOMI smoke, for both the location and amount of fire smoke plumes (Figure 7). The VIIRS ADP product misclassified considerable amounts of snow/ice and cloud pixels as smoke in the north of the image, but it also missed many small smoke plumes and smoke pixels at plume edges (Figure 7c). TROPOMI smoke also greatly underestimated smoke cover (Figure 7d). The differences are more apparent in the three zoom-in images (Figure 7a’–c’). Compared with corresponding true-color imagery, the SSDA detected smoke plume extent well, although stripes resulted from VIIRS aggregation process at large view zenith angles [59] were unclassified because filling stripe was not a focus in this study. However, both the VIIRS ADP product and TROPOMI smoke missed a lot of smoke pixels at plume boundaries since the absorption aerosol index is not sensitive to thin smoke, composed of weakly absorbing aerosols, especially for absorption aerosols near the Earth’s surface (1.5 km or less) [60].
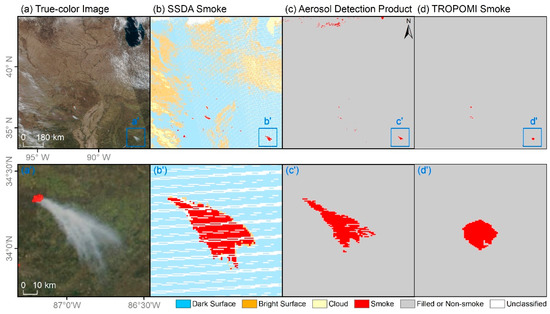
Figure 7.
Comparison of (b) the SSDA detection result with (c) VIIRS aerosol detection product (ADP) and (d) TROPOMI smoke over the southeastern North America (−99.15° E–−84.95° E and 30.45° N–44.75° N) on 22 March 2019. Insets (a’–d’) are zoom-in images of the blue square area in (a–d), respectively.
4.1.3. Qualitative Evaluation Using Published Results
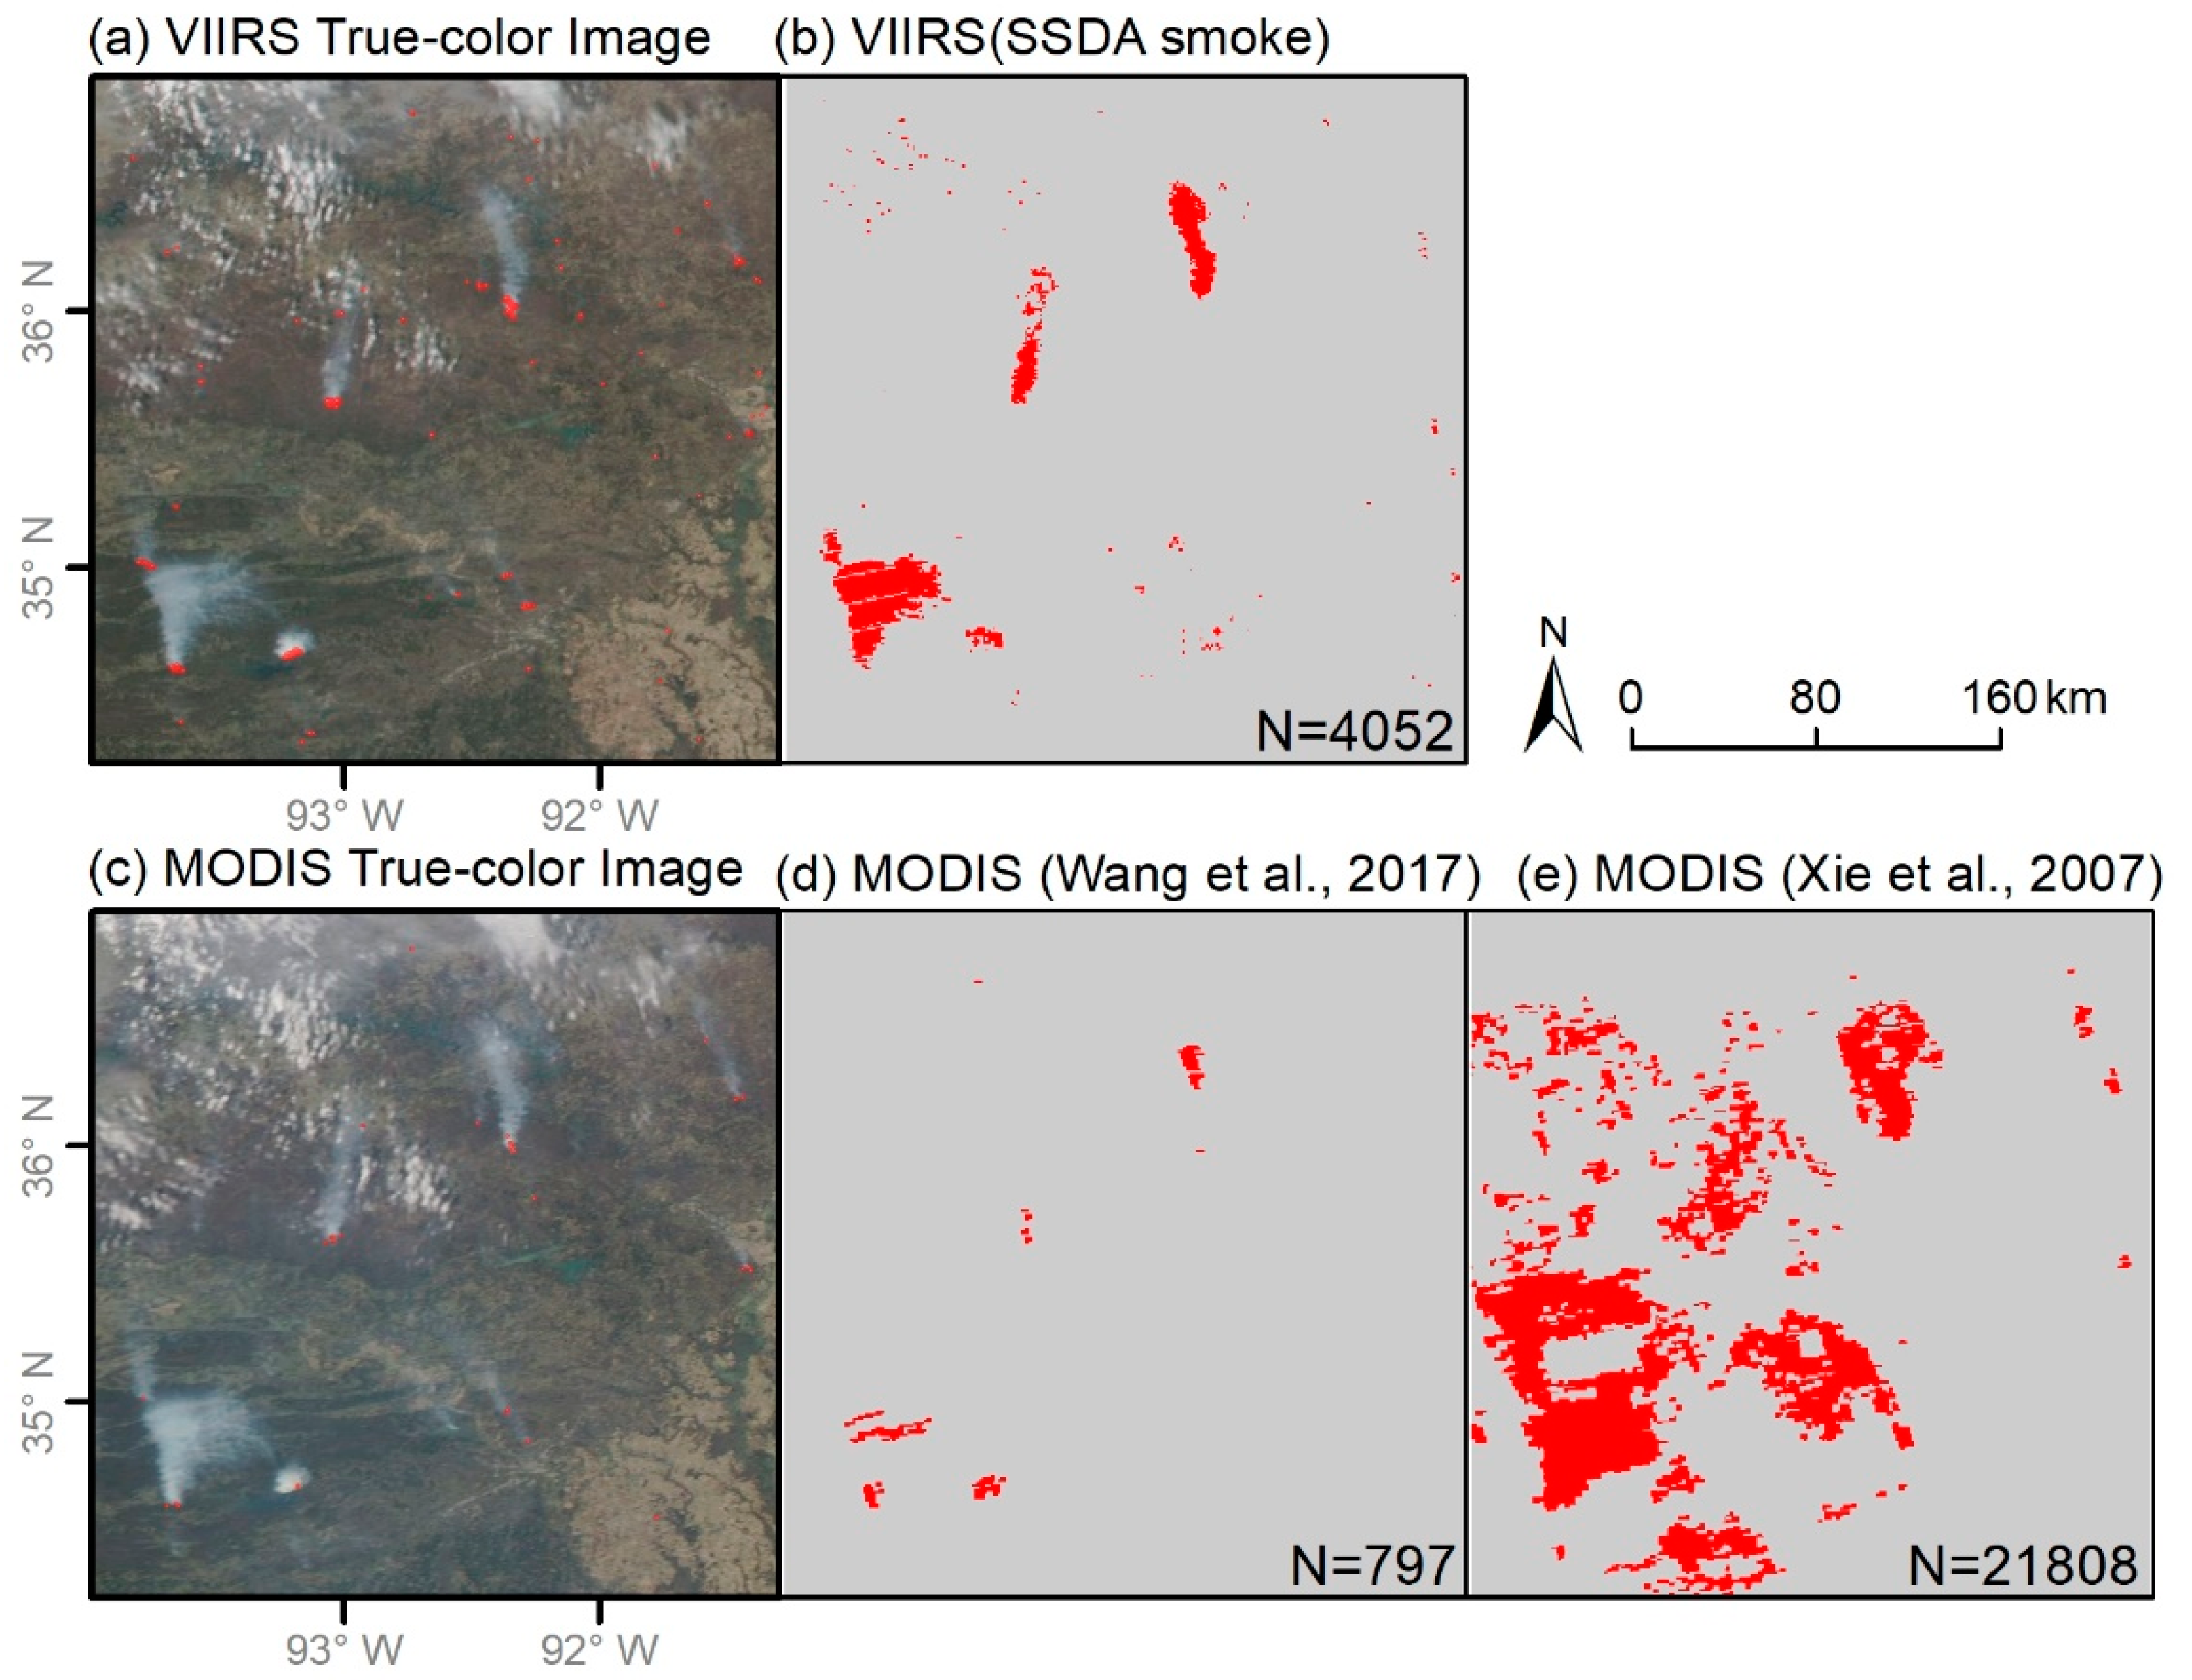
Through comparison with published smoke detection results, we further evaluated the performance of the SSDA. Figure 8 shows the comparison of the SSDA smoke detection results with two smoke datasets derived from Aqua MODIS TOA reflectance based on existing algorithms [15,58] over southeastern North America. These datasets were selected because both papers [15,58] focused on smoke detection over southeastern North America and were supposed to perform better than the results from other regional smoke detections. A comparison with smoke on the MODIS true-color image (Figure 8c) shows substantially higher omission errors for smoke detection results from Wang et al. (2007) (Figure 8d) and correspondingly higher commission error from Xie et al. (2007) (Figure 8e). In contrast, the smoke detected from the SSDA (Figure 8b) matches well with smoke plume extents on the VIIRS true-color image (Figure 8a). The number of smoke pixels detected by the SSDA is about five times (4052/797) of that from Wang et al. (2007) but only about one fifth (4052/21808) of that from Xie et al. (2007). Comparison with smoke plumes visible in true color imagery shows that the SSDA algorithm’s smoke detections better represent the smoke conditions than methods used in the two references.
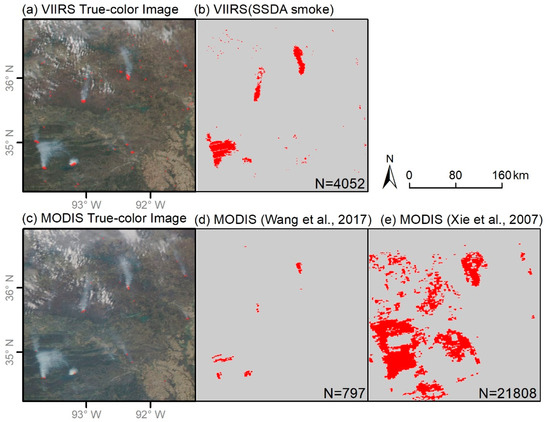
Figure 8.
Comparison of (b) the SSDA smoke with the smoke detections using algorithms developed by (d) Wang et al. (2007) and (e) Xie et al. (2007) from MODIS TOA reflectance over the southeastern North America (−93.96° E–91.31° E and 34.24° N–36.93° N) on 19 March 2019. (a) is the true-color image obtained from S-NPP VIIRS overpassing at 18:50 (UTC) while (c) is the true-color image obtained from Aqua MODIS overpassing at 18:44 (UTC). N is the number of detected smoke pixels of each algorithm.
4.2. Quantitative Evaluation of the SSDA Smoke Detections
4.2.1. Comparison of AOD Values between Smoke and Non-smoke Pixels
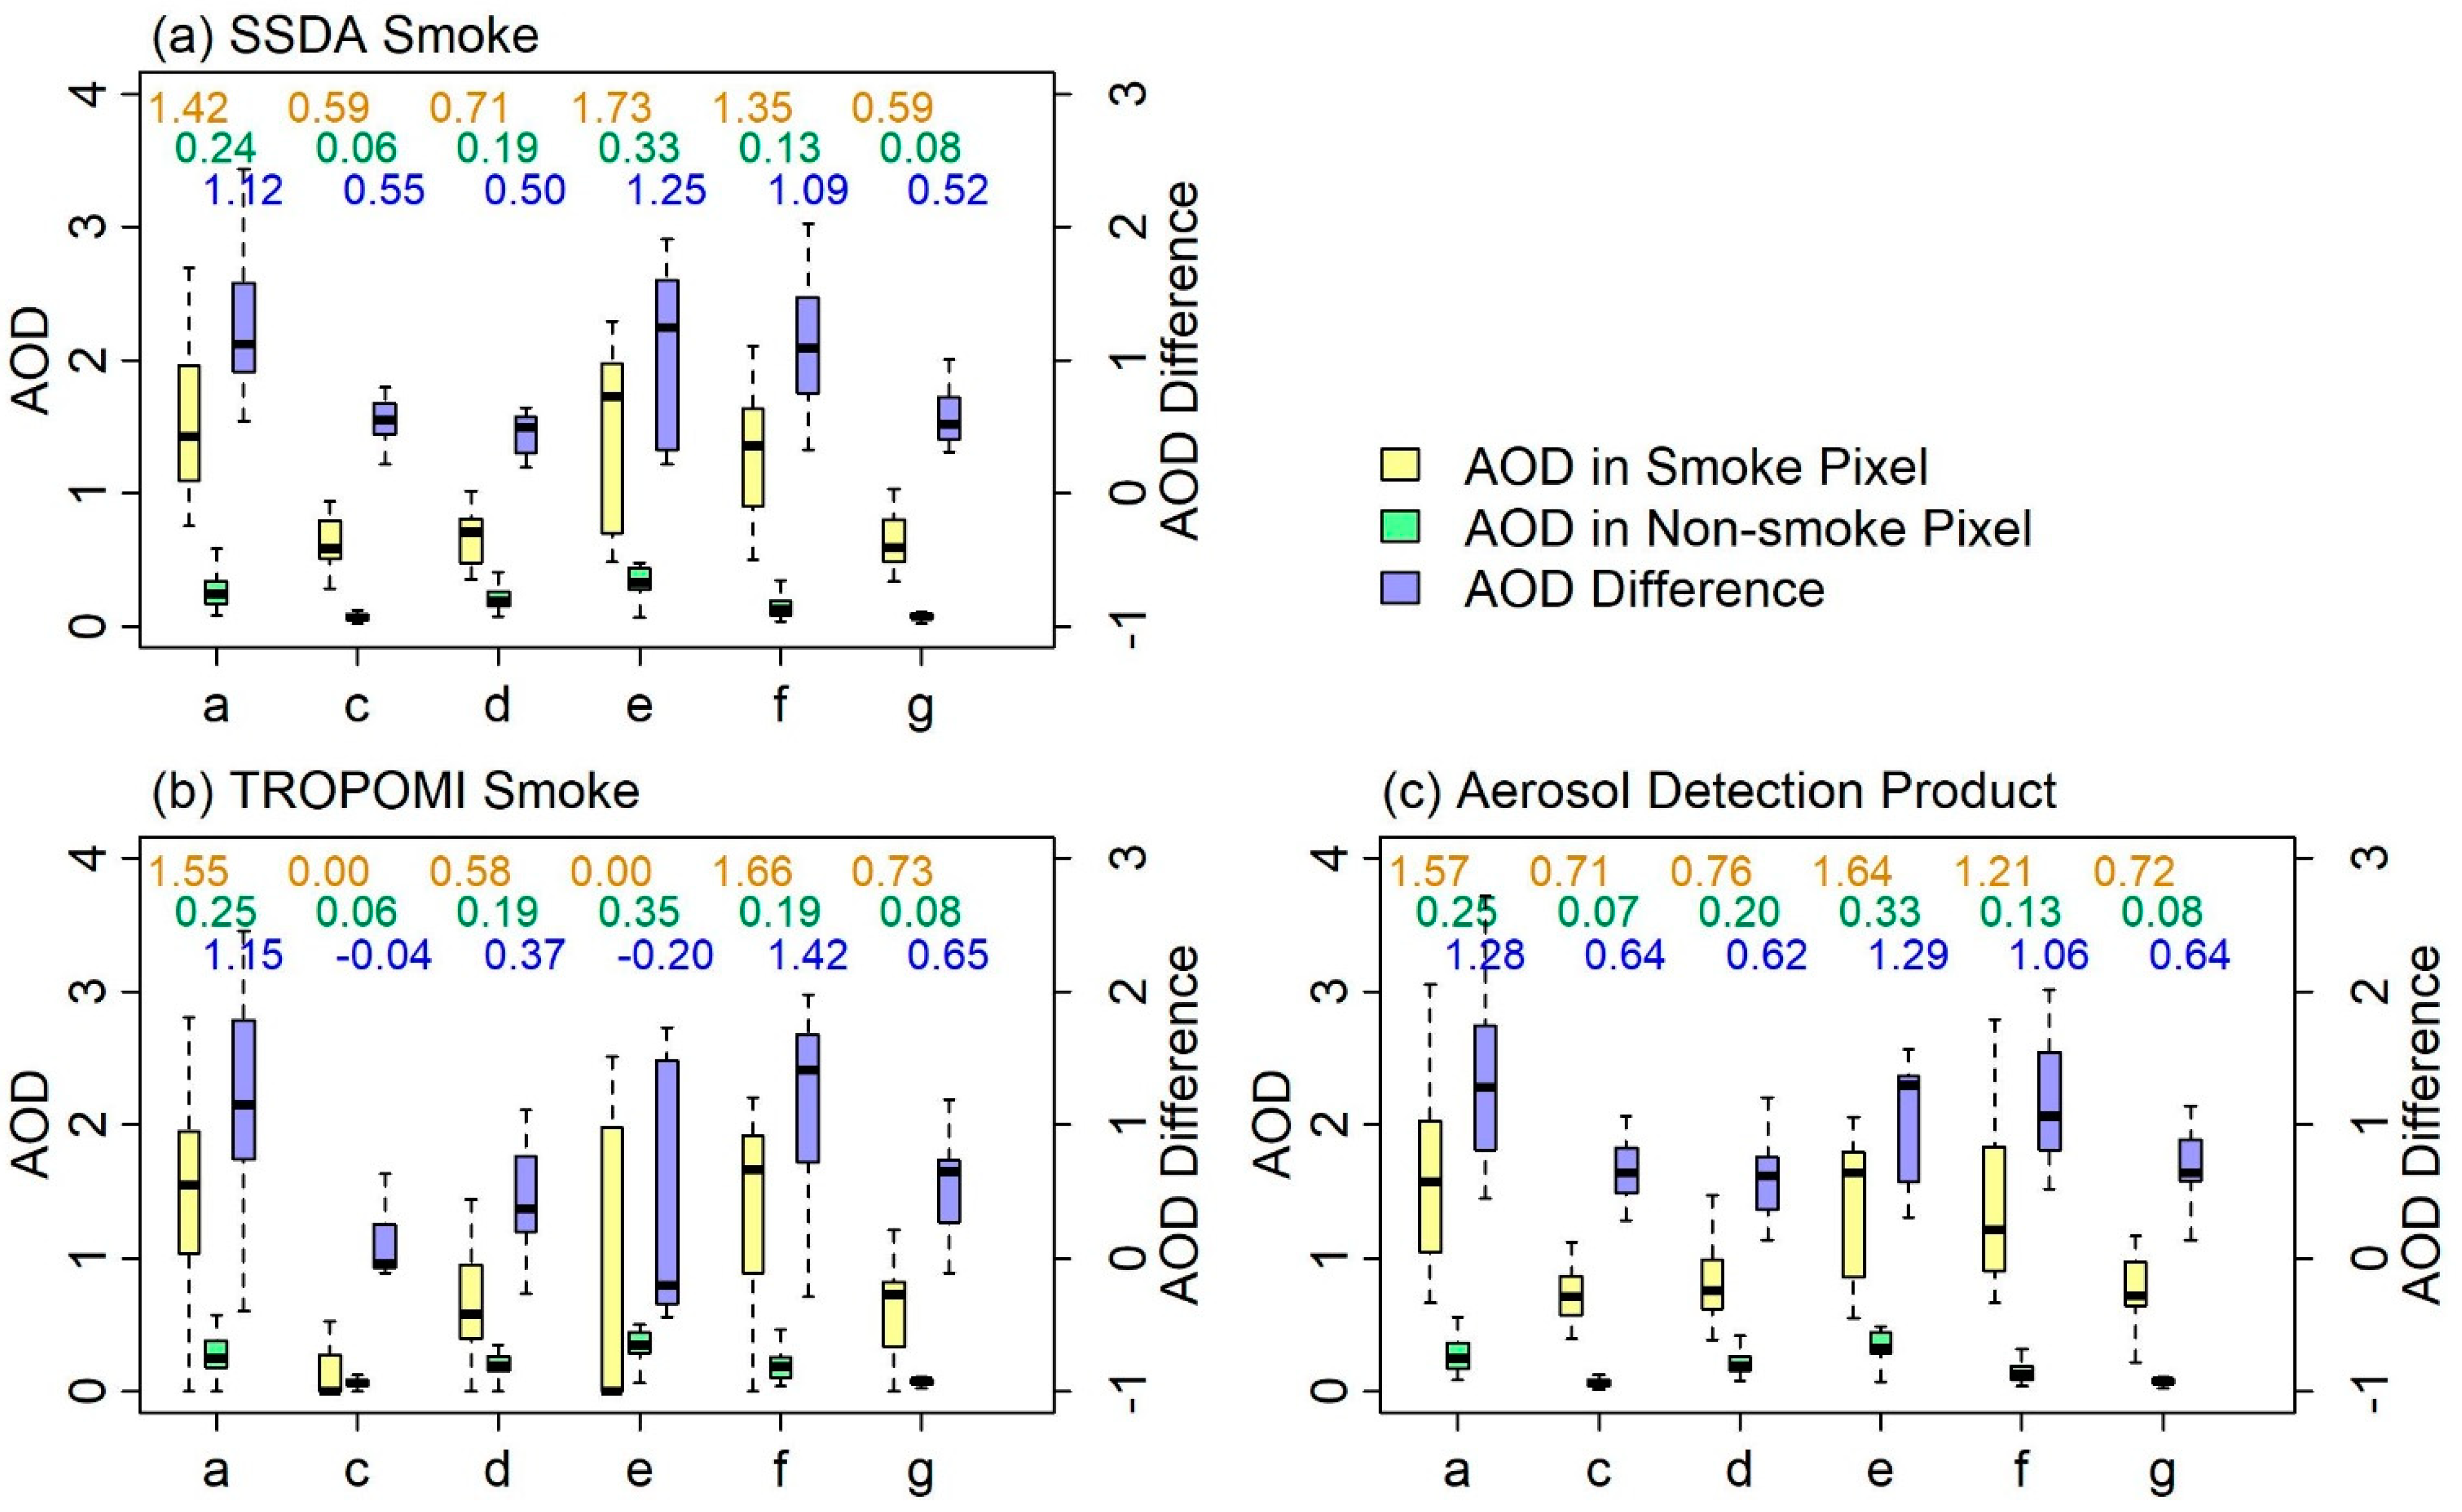
Figure 9 shows the median AOD values at 0.55 µm in smoke and non-smoke pixels from the SSDA detection, TROPOMI smoke, and VIIRS ADP. The SSDA detection indicates higher AOD values in smoke pixels than in non-smoke pixels (Figure 9a). In the regions of North America (a) and Siberia (f) where large and dense smoke plumes were mainly emitted from forest fires during August, the AOD values were 1.42 (a) and 1.35 (f) in SSDA detected smoke pixels while they were only 0.24 (a) and 0.13 (f) in the background non-smoke pixels. In Indonesia (e) where the smoke plumes were generally associated with smoldering forest or peatland fires and tended to produce large amounts of coarse smoke particulate matter [19], the SSDA smoke AOD value (1.73) was also much larger than the non-smoke AOD value (0.33). In contrast, in the regions of South America (c), Africa (d), and Australia (g) where thin smoke plumes were mainly released from small flaming savanna or grassland fires during August, the difference of AOD values (c: 0.55, d: 0.50, and g: 0.52) between smoke and non-smoke pixels were much smaller.
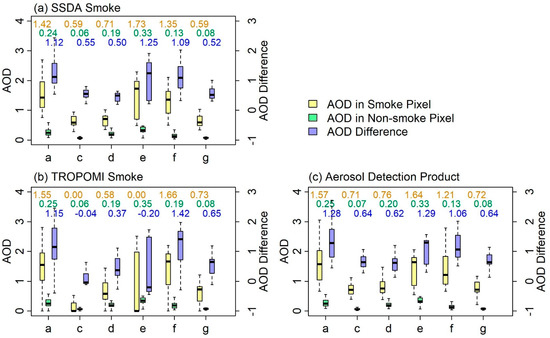
Figure 9.
Comparison of AOD median values between smoke and non-smoke pixels of (a) the SSDA result with (b) TROPOMI smoke and (c) VIIRS aerosol detection product (ADP). The samples are from 109 image subsets at the global scale (see Section 2.6.3). The numbers above the boxplot are AOD median values in smoke pixels (orange), non-smoke pixels (green), and their differences (blue). The letters below the boxplot are consistent with those in Figure 1, namely, North America (a), South America (c), Africa (d), Indonesia (e), Siberia (f), and Australia (g), respectively. Region b in eastern South America is not shown because of the limited number of fire events during August.
For the TROPOMI smoke detections, the AOD differences were also highest in regions of North America (a) and Siberia (f) which were similar to SSDA smoke detection results. However, in regions of South America (c) and Indonesia (e), the AOD difference values from TROPOMI smoke were negative with a lower AOD value in smoke than non-smoke pixel. The AOD in smoke pixel were zero in these two regions (c & e) because no smoke was detected in some evaluation polygons due to the high omission error of TROPOMI smoke in these two regions (Figure 9b). As for the VIIRS ADP product in Figure 9c, the AOD difference between smoke and non-smoke pixels was much larger than that of SSDA detections, which implies that VIIRS ADP primarily detects dense smoke at the center of smoke plumes with high AOD values, therefore missing the majority of pixels at plume edges or from thin plumes with low AOD values.
4.2.2. Validation of SSDA Smoke Detections Using Manually-Delineated Smoke Reference Data
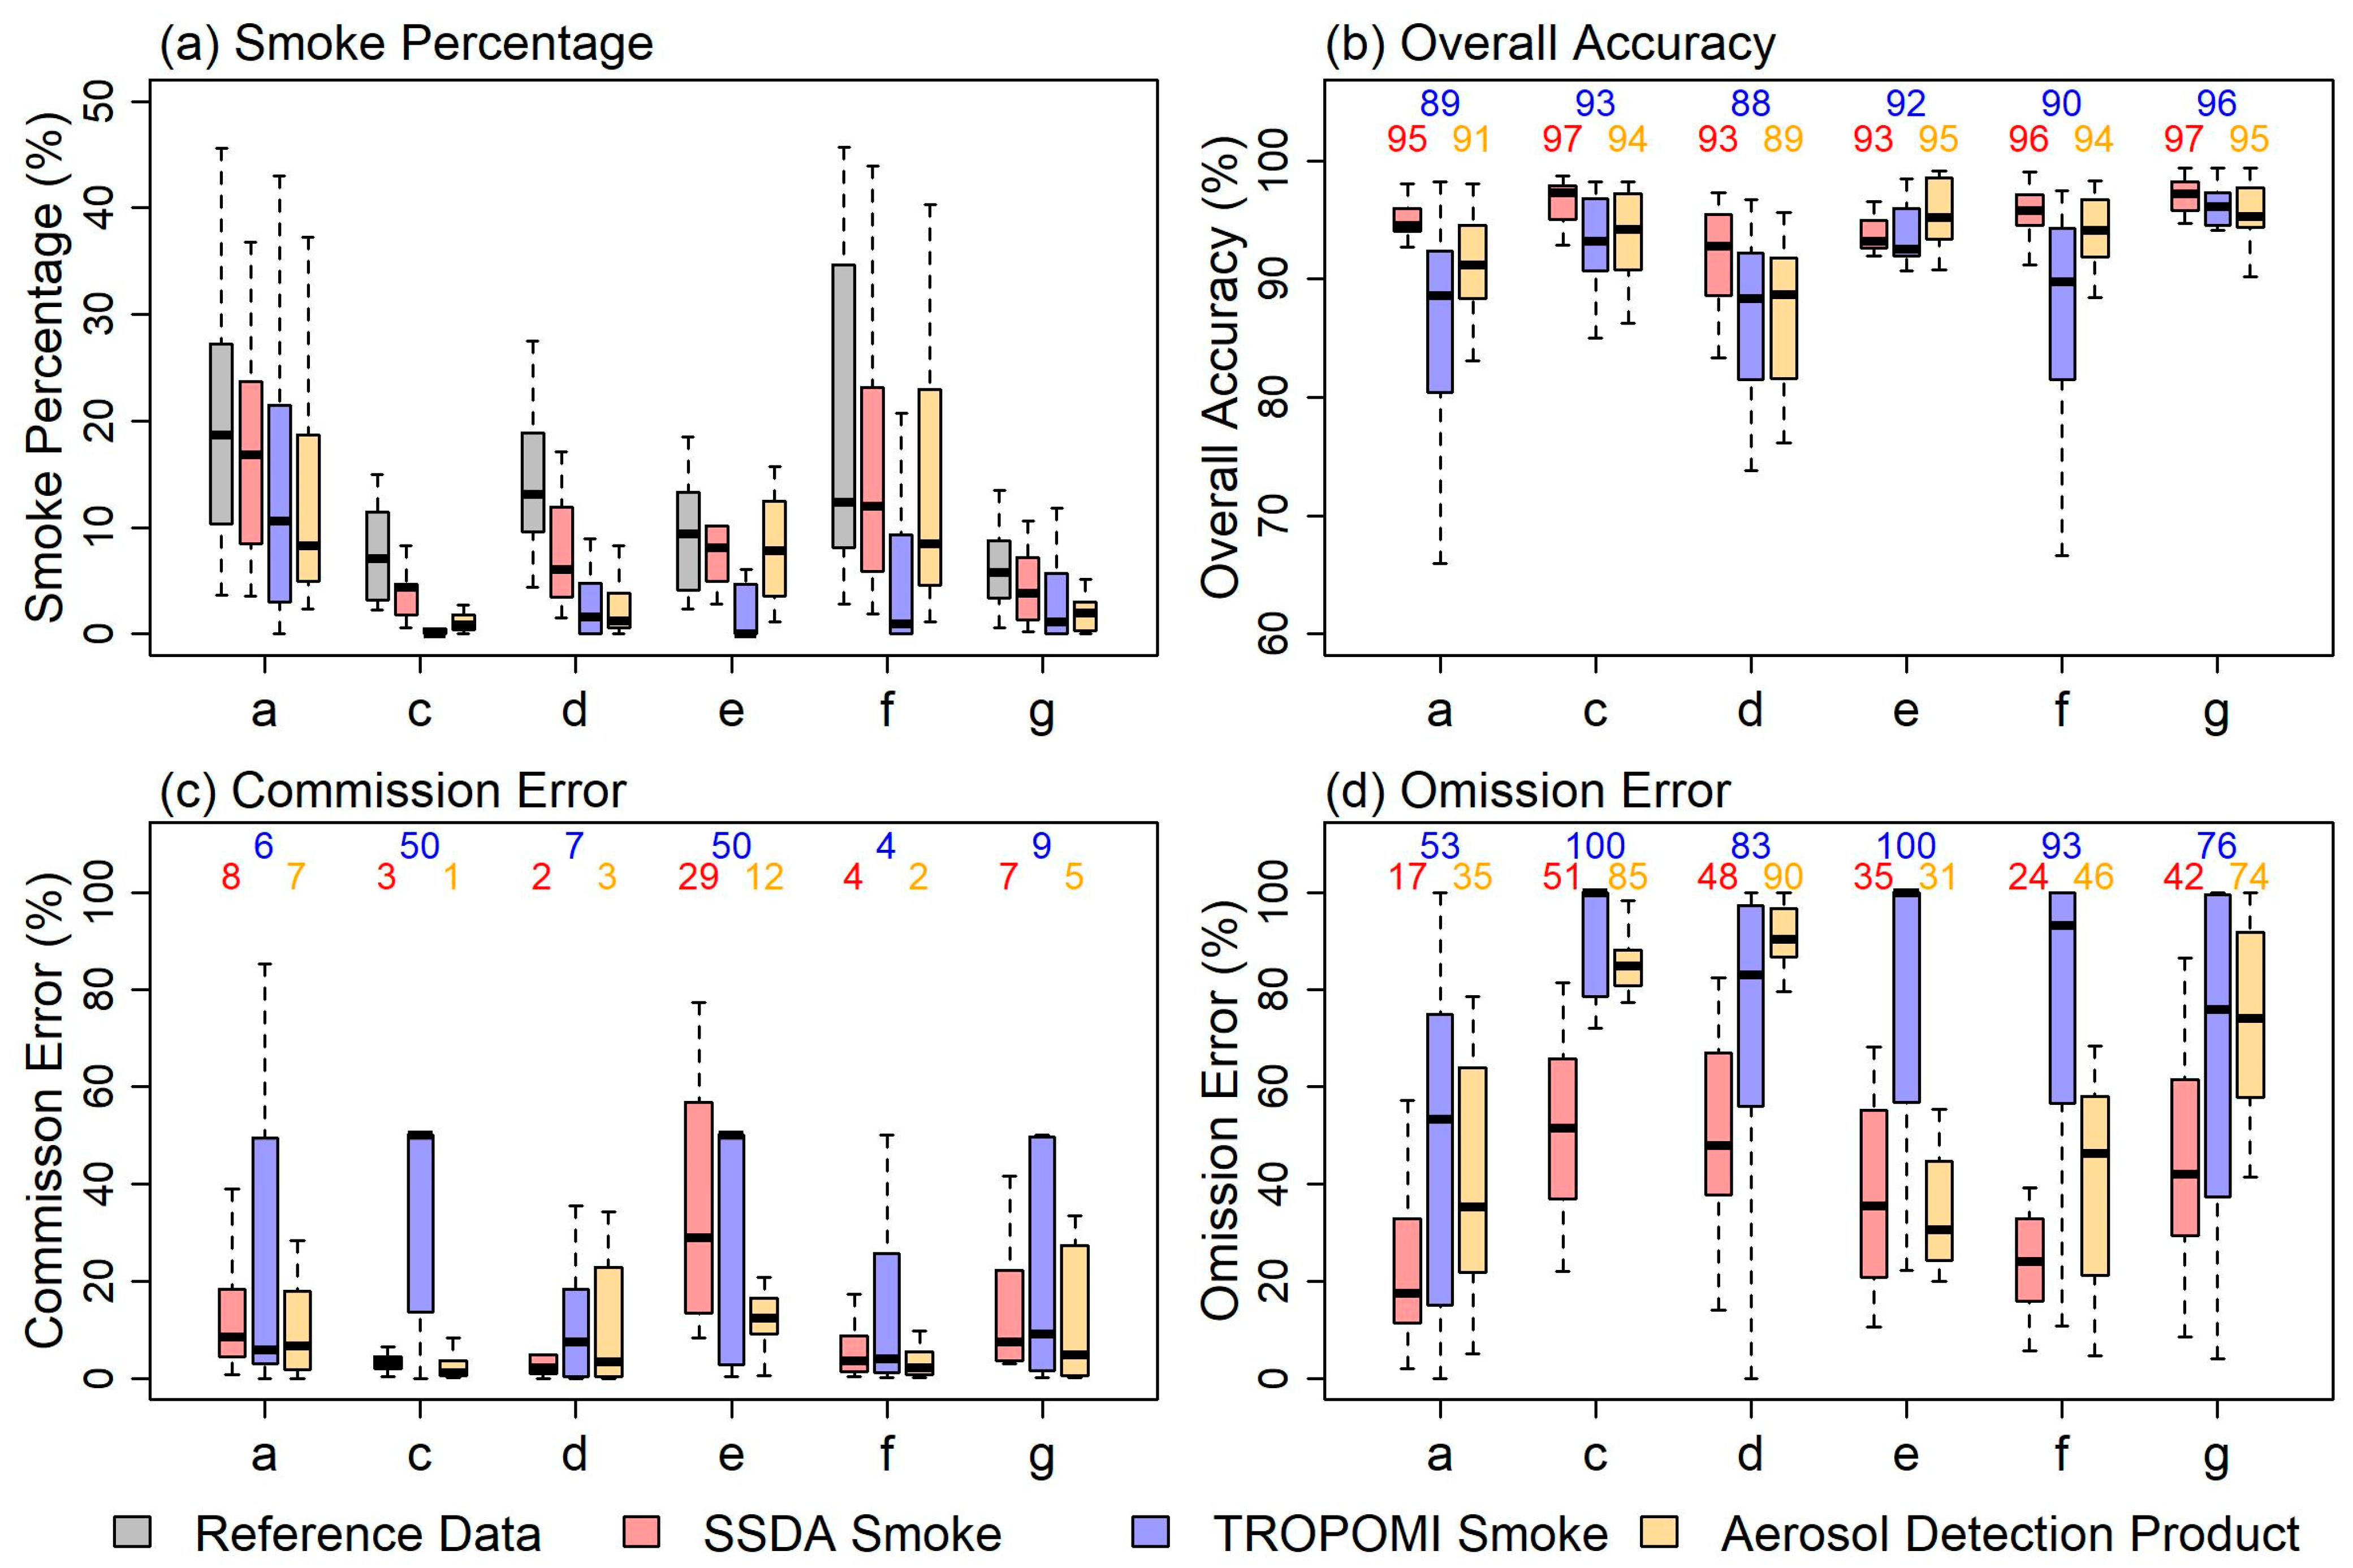
The SSDA smoke detections were validated using manually delineated smoke reference data based on true-color images, and further compared with the results of other smoke-related datasets, namely TROPOMI smoke and VIIRS ADP (Figure 10). The median smoke percentages of the SSDA smoke detections are much closer to the reference data than that of TROPOMI smoke and VIIRS ADP in all six examined regions (Figure 10a). Overall accuracy of SSDA smoke detection is the highest among these three smoke detection datasets in all regions with the exception of Indonesia (Figure 10b). Commission errors of SSDA smoke detections are 8%, 3%, 2%, 29%, 4%, and 7% in North America, South America, Africa, Indonesia, Siberia, and Australia, respectively (Figure 10b). Commission errors are largest in Indonesia where clouds occur frequently and always mix with smoke plumes. Correspondingly, the omission errors of smoke pixels are 17%, 51%, 48%, 35%, 24%, and 42% in the six regions, respectively (Figure 10c), which are smaller in North America and Siberia that had large and dense smoke plumes than in regions (South America, Africa, Indonesia, and Australia) characterized by small and thin smoke plumes. Relative to TROPOMI smoke, SSDA smoke detections generally produce both smaller commission errors and omission errors. Moreover, validation shows that the SSDA provides much smaller omission errors and similar, though slightly greater, commission errors relative to VIIRS ADP smoke detections in all the six regions (Figure 10b,c).
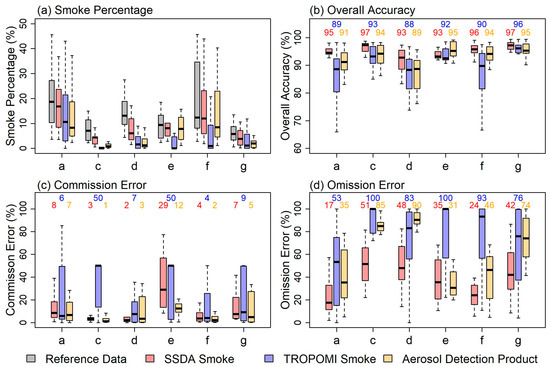
Figure 10.
Comparisons of manually delineated smoke reference data (gray) with the SSDA smoke detection (red), the TROPOMI smoke (blue), and aerosol detection product (ADP) (orange). (a,c,d–g) represent North America, South America, Africa, Indonesia, Siberia, and Australia, respectively.
4.3. Global Smoke Map
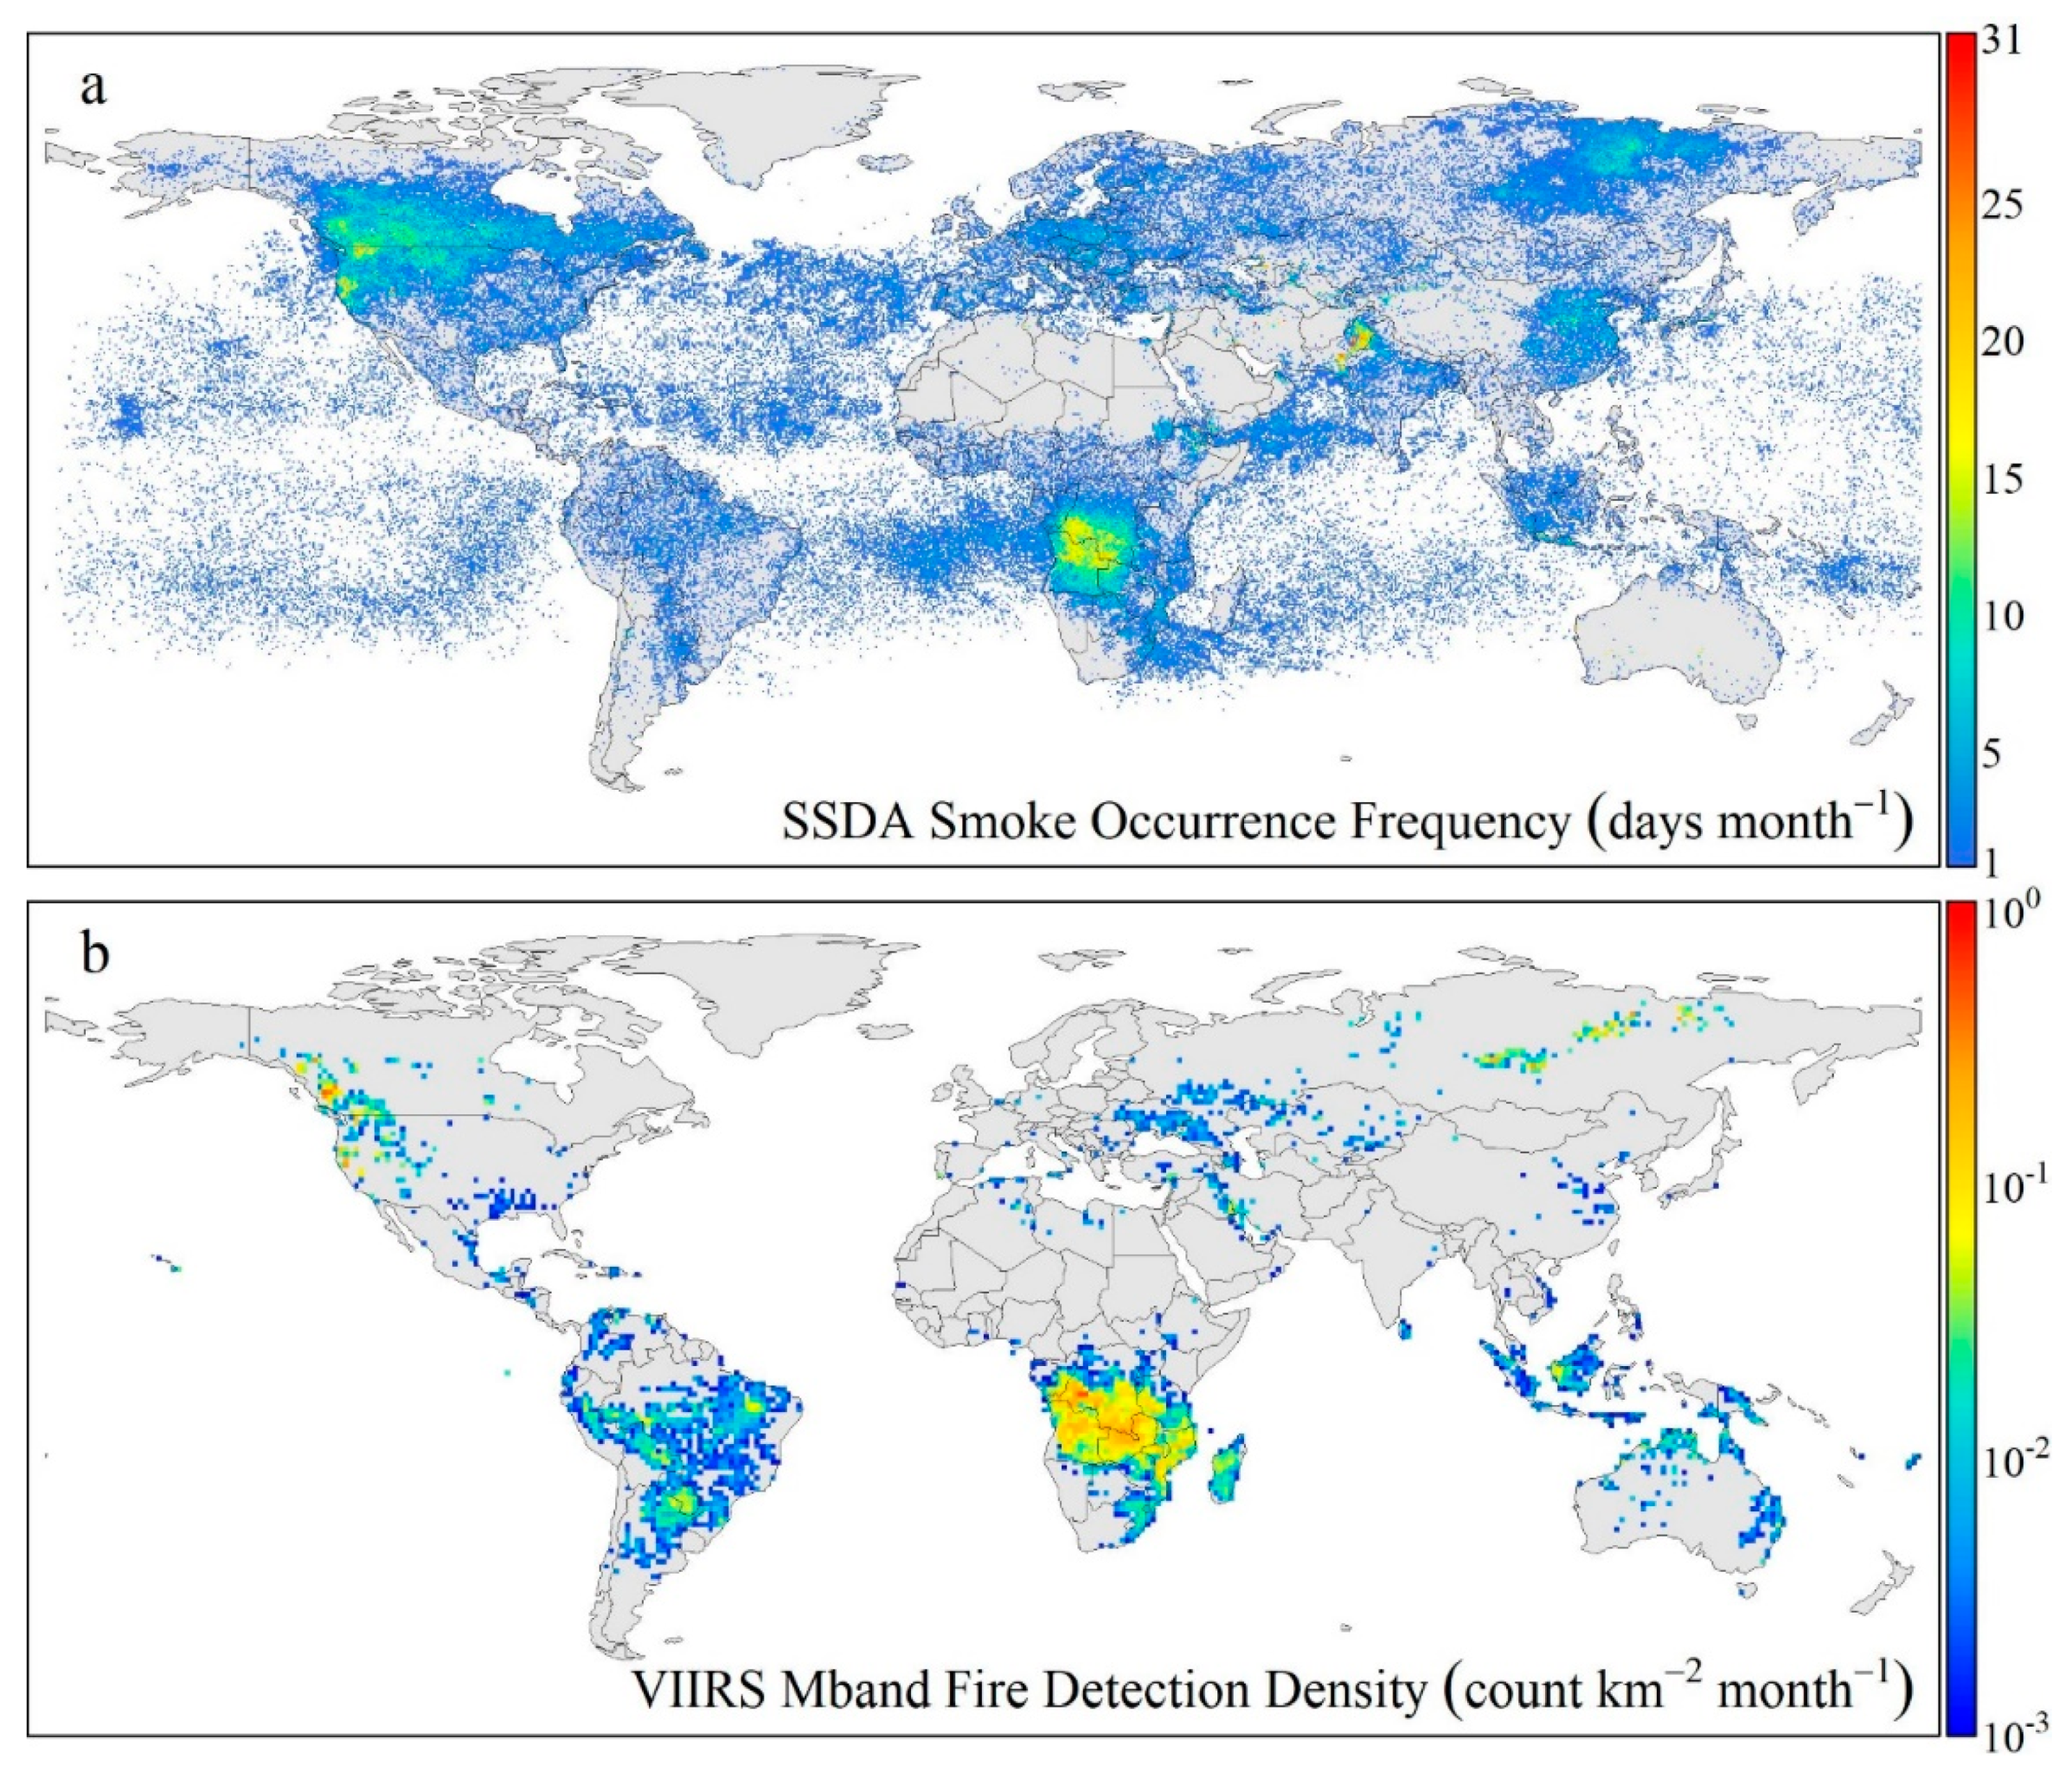
Figure 11 shows the frequency of global smoke occurrences accumulated from daily SSDA smoke detections during August 2018. Smoke occurred most frequently in the western North America, southern Africa, and northeastern Pakistan, with smoke cover of as many as 20 days during August 2018. The frequency of smoke occurrence was between 5 days and 15 days over a large part of South Africa, India, Indonesia, China, and Siberia. It was very low in other regions where fires were not prevalent, or the fire season was not in August. The frequency of smoke occurrence matched well spatially with the VIIRS fire density in August 2018, particularly in the fire-prone regions of North America, northern South America, Africa, Indonesia, and Siberia, although spatial patterns of smoke were also influenced by wind directions, smoke aerosol emission coefficients [19,20], and other parameters. In the regions where forest fires were dominated, such as Siberia, fuels were very large and fire smoke emissions were correspondingly large. This means each fire hotspot could release a large amount of smoke, result in large spatial extent of smoke plumes, and cause high smoke frequency in surround areas. However, the frequency of smoke occurrence seemed to be underestimated in fire-prone regions of South America and Australia when compared to the fire detection density map and true-color imagery on NASA worldview (https://worldview.earthdata.nasa.gov/). This phenomenon was consistent with the results (Section 4.2.2) that omission errors were highest in these two regions (Figure 10). In eastern Amazon (in South America), fire smoke detections are strongly obstructed by cloud contaminations, which results in the discrepancy between smoke occurrence frequency and fire density. In contrast, frequency seemed overestimated in regions of Pakistan and northern India, as the spatial pattern of fire detection density did not show any signal for the source of smoke in these two regions. This discrepancy could be attributed to fires that were not fully detected, such as crop fires in India [61], or heavy particulate pollution over these regions [62]. For the smoke detections over oceans, the frequency was generally low because of the disperse characteristic of smoke after being transported far from their source fires and the high omission error of smoke over oceans caused by oceanic glint impacts on smoke detection from the SSDA. The discontinuousness of smoke from inland fire source regions to the deep ocean is mainly caused by cloud and sun glint interference in the smoky days and the occurrence of higher smoke frequency in the ocean is likely associated with the influence of wind conditions.
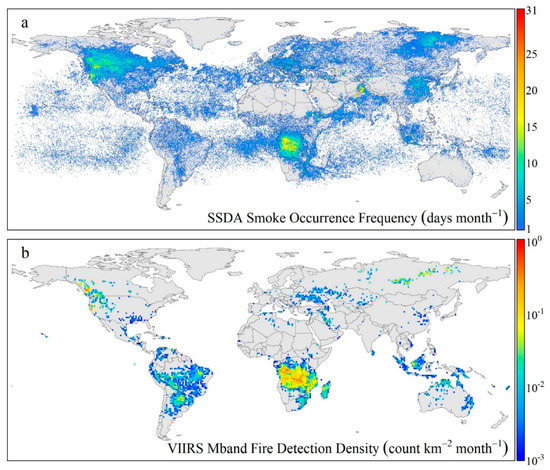
Figure 11.
(a) SSDA smoke occurrence frequency map obtained from daily SSDA smoke detections during August 2018; and (b) The 1° × 1° global fire detection density derived from VIIRS 750 m active fire observations during August 2018.
5. Discussion
This study develops a new algorithm (SSDA) for automated daily detection of fire smoke plumes using 750 m VIIRS data. It provides a complementary biomass burning dataset for fire-related products, including active fire [41,63], burned area [64,65], biomass burning emissions [48,66], and aerosol data [67]. This newly developed algorithm has several advantages:
- The theoretical basis is the strong Mie scattering at blue and green bands caused by smoke aerosols. These two bands are more commonly available on satellite sensors than ultraviolet bands.
- The corrected reflectance, instead of TOA reflectance, of the blue band is used, which enhances potential contrast between smoke and non-smoke areas because it reduces considerable impacts from Rayleigh scattering but keeps important information from aerosol scattering for the wavelength spectrum corresponding to smoke aerosol particulate sizes.
- Using multiple criteria (spectral and spatial) in a stepwise way (4 steps) in the SSDA reduces potential commission errors and large uncertainties (see following paragraphs) as much as possible, since no unique features allow separation of smoke from other surface types.
- The detection of thin smoke released from small fires is greatly improved, which could help people monitor fire development at early stages, and then take relevant actions to prevent major fire events from developing.
- Detection of dense smoke emitted from large fires is also greatly enhanced with lower commission and omission errors in North America and Siberia, which could improve the accuracy of biomass burning emissions estimates by combining it with AOD or carbon monoxide observations using chemistry-transport models.
- The method of smoke detection can be applied efficiently at a global scale.
Potential uncertainties remain for SSDA smoke detection under such unfavorable conditions as extremely thin smoke, smoke-cloud mixtures, smoke-haze mixtures, or coarse particulate dominated smoke. Identification of extremely thin (semitransparent) smoke is difficult as the spectral signal becomes a variable mixture from both the smoke and the underlying Earth surface background. Semitransparent smoke plumes from diffuse, small grassland and savanna fires and around the edges of denser smoke plumes are consistently contaminated by background spectral signals, especially bright surfaces. Smoke is, therefore, likely to be misclassified as the bright surface if the optical spectral contribution from the bright surface is higher in the pixel. This is the main factor behind high omission errors for smoke detections of small plumes, as shown in southern South America and Australia (Figure 6a1,c1, and Figure 10d). In addition, detection of extremely thin smoke from crop fires is also challenging because the extent of such smoke is generally less than one VIIRS pixel size (750 × 750 m2 at nadir) and the returned optical signal is from a pixel mixed smokes and other cover types. Detection of smoke in pixels mixed with clouds is another challenge, which is a common phenomenon in tropical regions. Although smoke from fires passing above clouds is detectable, it is hard to separate them when plumes are below or mixed with clouds that contribute significantly to the spectral feature. This is a major reason for large omission errors in the tropics (Figure 10d). Moreover, differentiating haze, such as in Pakistan, northern India, and eastern China, from smoke (Figure 11) is also challenging because they both contain high concentrations of fine-size particles, which may lead to similar scattering effects in VIIRS blue and green bands [27]. Finally, for smoke with pretty coarse particulates, such as part of the smoke released from Indonesia smoldering fires, the strongest Mie scattering may occur at red or longer bands, rather than blue or green band, which is likely to cause omission errors of smoke detection.
The SSDA accuracy assessment (Figure 10) may have also been affected through uncertainties induced by evaluation datasets. First, the manually-delineating smoke reference data may propagate some uncertainties because boundaries of some fire smoke plumes are not easily identifiable, even visually, from true-color images. Similarly, mixtures or misidentification of smoke and cirrocumulus clouds in selected reference smoke samples could have occurred, predominately in tropical regions. Although subset regions, instead of whole granules are used to produce smoke reference data (Figure 2), the accuracy assessment could potentially be affected by the difference in sample numbers for smoke and non-smoke classes, especially if the number of smoke pixels is much smaller than that of the non-smoke pixels. Second, TROPOMI smoke is not a mature operational product but produced by ourselves through combing positive UVAI values with smoke DSDI. The UVAI value may bias systematically due to calibration issues [68]. Additionally, we did not use quality control for TROPOMI UVAI to keep more values match with SSDA results. Third, global fire density is not an ideal dataset to evaluate SSDA smoke occurrence frequency because these two variables are impacted by different factors. Specifically, fire density is impacted by satellite detectability, where small and weak fires, understory fires, as well as cloud/smoke contaminated fires are not detectable, whereas, smoke frequency is influenced by smoke emission coefficients, wind conditions, and cloud contaminations. However, fire density is the most relevant variable associated with fire smoke occurrences. Moreover, it is near-impossible to evaluate smoke plumes under all conditions due to the challenges in obtaining high-quality smoke reference data. For example, smoke plumes over the ocean were not quantitatively evaluated due to the challenge of obtaining good reference data over ocean area pixels. However, SSDA smoke detections over water are visually comparable with true-color images (Figure 6h). Finally, the lack of a high-spatial-resolution smoke evaluation dataset is an additional challenge that compounds the complexity of smoke detection evaluation.
Although many factors could lead to uncertainties in smoke detection, the improvements of SSDA detection have various implications. First, SSDA smoke detections could improve AOD retrieval accuracy and efficiency by using the SSDA detected smoke extent directly over the smoke area instead of looking for the ”optimal” aerosol model by looping over five candidate aerosol models [69]. The SSDA smoke detections could also increase effective AOD pixel numbers because currently smoke pixels, close to or mixed with clouds and/or thick smoke, often have no AOD retrieval due to being misclassified as clouds [70]. Second, the SSDA smoke detection information could improve estimates of biomass burning emissions, especially over regions dominated by small and cool fires. Traditionally, biomass burning emissions are calculated based on fire detections, such as fire radiative power [71,72,73]. However, small and cool fires are easily missed by sensors due to the weak radiation energy or interceptions from the smoke plume, forest canopy, and clouds. In contrast, smoke plumes from such fires tend to stay near the ground in high concentrations [15,74] that are observable by existing sensors. Therefore, combining the smoke plume extent and corresponding AOD retrieval may provide a novel way to estimate smoke aerosol emissions from biomass burning [19,20,26].
6. Conclusions
Accurate smoke detection maps would undoubtedly be quite useful in scientific research related to climate change simulation, weather prediction, and human environment monitoring. In this study, we propose a new stepwise smoke detection algorithm, called SSDA, based on the strong Mie scattering of smoke aerosols at blue and green bands in the VIIRS sensor data record. Visually compared with smoke-related data, including VIIRS true-color images, TROPOMI smoke, VIIRS ADP, and previously published results, the SSDA smoke detection shows more robust results in separating smoke from clouds and bright surfaces and a stronger capability of detecting smoke plumes released from both large and small fires. Using manually delineated smoke reference data as a benchmark, we also quantitatively validated SSDA smoke detection results for fire-prone regions globally. Statistical analysis shows that the commission errors of the SSDA smoke detections are 8%, 3%, 2%, 29%, 4%, and 7%, whereas the omission errors are 17%, 51%, 48%, 35%, 24%, and 42% in North America, South America, Africa, Indonesia, Siberia, and Australia, respectively. Commission errors of SSDA are much lower than TROPOMI smoke and comparable with ADP product, while omission errors of SSDA are significantly lower than both these two datasets. Commission errors were most prevalent under conditions of haze pollution, whereas omission errors generally corresponded to areas of extremely thin smoke plumes, especially when above bright surfaces or mixed with clouds. Further, comparison with smoke reference data indicates that the SSDA smoke detection approach works very well over regions associated with dense smoke plumes but also improves smoke plume detection over regions characterized by thin smoke plumes. Finally, the SSDA algorithm shows powerful capabilities for calculating smoke occurrence across the globe with comparable spatial patterns to fire density derived from VIIRS active fire product. More importantly, this new smoke detection algorithm provides an improved tool for fire monitoring communities for global smoke-related applications. Although the SSDA was developed using VIIRS data aboard S-NPP, this algorithm can be readily adapted to other sensors due to the common availability of blue or green channels as compared to smoke detection methods that are reliant on ultraviolet channels.
Author Contributions
Conceptualization and methodology, X.L. and X.Z.; validation and formal analysis, X.L.; writing—original draft preparation, X.L.; writing—review and editing, X.L., X.Z., F.L., M.A.C., and P.C. All authors have read and agreed to the published version of the manuscript.
Funding
This work is funded by the NASA projects of MRV and REDD+, grant number 80NSSC18K0235 and 80NSSC20K0408.
Institutional Review Board Statement
Not applicable.
Informed Consent Statement
Not applicable.
Data Availability Statement
The data presented in this study are available on request from the corresponding author.
Acknowledgments
The manuscript contents are solely the opinions of the authors and do not constitute a statement of policy, decision, or position on behalf of NASA or the U.S. Government. The authors thank the NOAA CLASS for providing the datasets publicly including VIIRS SDR, VIIRS Cloud Mask EDR, and VIIRS Aerosol Optical Depth and Aerosol Particle Size EDRs; thank the European Space Agency (ESA) Copernicus for providing the Sentinel-5P TROPOMI aerosol index data freely; thank the NASA Direct Readout Laboratory (DRL) for providing the VIIRS corrected reflectance code publicly; thank the NASA Worldview website for enabling us to interactively browse the true-color images freely; and thank three anonymous reviewers’ comments that improved this paper.
Conflicts of Interest
The authors declare no conflict of interest.
References
- Price, O.F.; Purdam, P.J.; Williamson, G.J.; Bowman, D.M. Comparing the height and area of wild and prescribed fire particle plumes in south-east Australia using weather radar. Int. J. Wildland Fire 2018, 27, 525–537. [Google Scholar] [CrossRef]
- Marlier, M.E.; DeFries, R.S.; Kim, P.S.; Koplitz, S.N.; Jacob, D.J.; Mickley, L.J.; Myers, S.S. Fire emissions and regional air quality impacts from fires in oil palm, timber, and logging concessions in Indonesia. Environ. Res. Lett. 2015, 10, 085005. [Google Scholar] [CrossRef]
- Bond, T.C.; Doherty, S.J.; Fahey, D.W.; Forster, P.M.; Berntsen, T.; DeAngelo, B.J.; Flanner, M.G.; Ghan, S.; Kärcher, B.; Koch, D. Bounding the role of black carbon in the climate system: A scientific assessment. J. Geophys. Res. Atmos. 2013, 118, 5380–5552. [Google Scholar] [CrossRef]
- Stohl, A.; Klimont, Z.; Eckhardt, S.; Kupiainen, K.; Shevchenko, V.P.; Kopeikin, V.; Novigatsky, A. Black carbon in the Arctic: The underestimated role of gas flaring and residential combustion emissions. Atmos. Chem. Phys. 2013, 13, 8833–8855. [Google Scholar] [CrossRef]
- Koren, I.; Kaufman, Y.J.; Remer, L.A.; Martins, J.V. Measurement of the effect of Amazon smoke on inhibition of cloud formation. Science 2004, 303, 1342–1345. [Google Scholar] [CrossRef]
- Spracklen, D.V.; Carslaw, K.S.; Kulmala, M.; Kerminen, V.M.; Sihto, S.L.; Riipinen, I.; Merikanto, J.; Mann, G.W.; Chipperfield, M.P.; Wiedensohler, A. Contribution of particle formation to global cloud condensation nuclei concentrations. Geophys. Res. Lett. 2008, 35. [Google Scholar] [CrossRef]
- Brook, R.D.; Rajagopalan, S.; Pope, C.A., III; Brook, J.R.; Bhatnagar, A.; Diez-Roux, A.V.; Holguin, F.; Hong, Y.; Luepker, R.V.; Mittleman, M.A. Particulate matter air pollution and cardiovascular disease: An update to the scientific statement from the American Heart Association. Circulation 2010, 121, 2331–2378. [Google Scholar] [CrossRef]
- Ismanto, H.; Hartono, H.; Marfai, M.A. Smoke detections and visibility estimation using Himawari_8 satellite data over Sumatera and Borneo Island Indonesia. Spat. Inf. Res. 2019, 27, 205–216. [Google Scholar] [CrossRef]
- Ghirardelli, J.E.; Glahn, B. The Meteorological Development Laboratory’s aviation weather prediction system. Weather Forecast. 2010, 25, 1027–1051. [Google Scholar] [CrossRef]
- Brey, S.J.; Ruminski, M.; Atwood, S.A.; Fischer, E.V. Connecting smoke plumes to sources using Hazard Mapping System (HMS) smoke and fire location data over North America. Atmos. Chem. Phys. 2018, 18, 1745–1761. [Google Scholar] [CrossRef]
- Hsu, N.; Herman, J.; Bhartia, P.; Seftor, C.; Torres, O.; Thompson, A.; Gleason, J.; Eck, T.; Holben, B. Detection of biomass burning smoke from TOMS measurements. Geophys. Res. Lett. 1996, 23, 745–748. [Google Scholar] [CrossRef]
- Leroy-Cancellieri, V.; Augustin, P.; Filippi, J.-B.; Mari, C.; Fourmentin, M.; Bosseur, F.; Morandini, F.; Delbarre, H. Evaluation of wildland fire smoke plume dynamics and aerosol load using UV scanning lidar and fire-atmosphere modelling during the Mediterranean Letia 2010 experiment. Nat. Hazards Earth Syst. Sci. 2014, 14, 509–523. [Google Scholar] [CrossRef]
- Akimoto, H. Global air quality and pollution. Science 2003, 302, 1716–1719. [Google Scholar] [CrossRef] [PubMed]
- Tosca, M.G.; Randerson, J.T.; Zender, C.S.; Nelson, D.L.; Diner, D.J.; Logan, J.A. Dynamics of fire plumes and smoke clouds associated with peat and deforestation fires in Indonesia. J. Geophys. Res. 2011, 116, 1–14. [Google Scholar] [CrossRef]
- Wang, W.; Qu, J.J.; Hao, X.; Liu, Y.; Sommers, W.T. An improved algorithm for small and cool fire detection using MODIS data: A preliminary study in the southeastern United States. Remote Sens. Environ. 2007, 108, 163–170. [Google Scholar] [CrossRef]
- Li, Z.; Khananian, A.; Fraser, R.H.; Cihlar, J. Automatic detection of fire smoke using artificial neural networks and threshold approaches applied to AVHRR imagery. Ieee Trans. Geosci. Remote Sens. 2001, 39, 1859–1870. [Google Scholar]
- Nelson, D.L.; Garay, M.J.; Kahn, R.A.; Dunst, B.A. Stereoscopic height and wind retrievals for aerosol plumes with the MISR INteractive eXplorer (MINX). Remote Sens. 2013, 5, 4593–4628. [Google Scholar] [CrossRef]
- Williamson, G.J.; Price, O.F.; Henderson, S.B.; Bowman, D.M. Satellite-based comparison of fire intensity and smoke plumes from prescribed fires and wildfires in south-eastern Australia. Int. J. Wildland Fire 2013, 22, 121–129. [Google Scholar] [CrossRef]
- Lu, X.; Zhang, X.; Li, F.; Cochrane, M.A. Investigating Smoke Aerosol Emission Coefficients using MODIS Active Fire and Aerosol Products—A Case Study in the CONUS and Indonesia. J. Geophys. Res. Biogeosciences 2019, 124, 1413–1429. [Google Scholar] [CrossRef]
- Mota, B.; Wooster, M.J. A new top-down approach for directly estimating biomass burning emissions and fuel consumption rates and totals from geostationary satellite fire radiative power (FRP). Remote Sens. Environ. 2018, 206, 45–62. [Google Scholar] [CrossRef]
- Schroeder, W.; Ruminski, M.; Csiszar, I.; Giglio, L.; Prins, E.; Schmidt, C.; Morisette, J. Validation analyses of an operational fire monitoring product: The Hazard Mapping System. Int. J. Remote Sens. 2008, 29, 6059–6066. [Google Scholar] [CrossRef]
- Li, X.; Song, W.; Lian, L.; Wei, X. Forest fire smoke detection using back-propagation neural network based on MODIS data. Remote Sens. 2015, 7, 4473–4498. [Google Scholar] [CrossRef]
- Ba, R.; Chen, C.; Yuan, J.; Song, W.; Lo, S. SmokeNet: Satellite smoke scene detection using convolutional neural network with spatial and channel-wise attention. Remote Sens. 2019, 11, 1702. [Google Scholar] [CrossRef]
- Herman, J.; Bhartia, P.; Torres, O.; Hsu, C.; Seftor, C.; Celarier, E. Global distribution of UV-absorbing aerosols from Nimbus 7/TOMS data. J. Geophys. Res. Atmos. 1997, 102, 16911–16922. [Google Scholar] [CrossRef]
- Buchard, V.; Da Silva, A.; Colarco, P.; Darmenov, A.; Randles, C.; Govindaraju, R.; Torres, O.; Campbell, J.; Spurr, R. Using the OMI aerosol index and absorption aerosol optical depth to evaluate the NASA MERRA Aerosol Reanalysis. Atmos. Chem. Phys. 2015, 15, 5743. [Google Scholar] [CrossRef]
- Li, F.; Zhang, X.; Kondragunta, S.; Lu, X. An evaluation of Advanced Baseline Imager fire radiative power based wildfire emissions using carbon monoxide observed by the Tropospheric Monitoring Instrument across the Conterminous United States. Environ. Res. Lett. 2020, 15, 094049. [Google Scholar] [CrossRef]
- Kaufman, Y.J.; Tanré, D.; Boucher, O. A satellite view of aerosols in the climate system. Nature 2002, 419, 215. [Google Scholar] [CrossRef]
- NOAA/NESDIS/STAR. JPSS Aerosol Detection (Suspended Matter) Product Algorithm Theoretical Basis Document. Noaa Nesdis Cent. Satell. Appl. Res. 2016. Available online: https://www.ospo.noaa.gov/Products/Suites/files/atbd/JPSS_RR_ADP_ATBD_version1_updated.pdf (accessed on 7 January 2021).
- De Graaf, M.; Stammes, P.; Torres, O.; Koelemeijer, R. Absorbing Aerosol Index: Sensitivity analysis, application to GOME and comparison with TOMS. J. Geophys. Res. Atmos. 2005, 110, D01201. [Google Scholar] [CrossRef]
- De Vries, M.; Beirle, S.; Wagner, T. UV Aerosol Indices from SCIAMACHY: Introducing the SCattering Index (SCI). Atmos. Chem. Phys. 2009, 9, 9555–9567. [Google Scholar] [CrossRef]
- Giglio, L.; Van der Werf, G.; Randerson, J.; Collatz, G.; Kasibhatla, P. Global estimation of burned area using MODIS active fire observations. Atmos. Chem. Phys. 2006, 6, 957–974. [Google Scholar] [CrossRef]
- Van Der Werf, G.R.; Randerson, J.T.; Giglio, L.; Collatz, G.J.; Kasibhatla, P.S.; Arellano Jr, A.F. Interannual variability in global biomass burning emissions from 1997 to 2004. Atmos. Chem. Phys. 2006, 6, 3423–3441. [Google Scholar] [CrossRef]
- Reid, J.; Koppmann, R.; Eck, T.; Eleuterio, D. A review of biomass burning emissions part II: Intensive physical properties of biomass burning particles. Atmos. Chem. Phys. 2005, 5, 799–825. [Google Scholar] [CrossRef]
- Reid, J.S.; Eck, T.F.; Christopher, S.A.; Koppmann, R.; Dubovik, O.; Eleuterio, D.; Holben, B.N.; Reid, E.A.; Zhang, J. A review of biomass burning emissions part III: Intensive optical properties of biomass burning particles. Atmos. Chem. Phys. 2005, 5, 827–849. [Google Scholar] [CrossRef]
- Archibald, S.; Lehmann, C.E.; Gómez-Dans, J.L.; Bradstock, R.A. Defining pyromes and global syndromes of fire regimes. Proc. Natl. Acad. Sci. USA 2013, 110, 6442–6447. [Google Scholar] [CrossRef] [PubMed]
- Liu, T.; Mickley, L.J.; Marlier, M.E.; DeFries, R.S.; Khan, M.F.; Latif, M.T.; Karambelas, A. Diagnosing spatial biases and uncertainties in global fire emissions inventories: Indonesia as regional case study. Remote Sens. Environ. 2020, 237, 111557. [Google Scholar] [CrossRef]
- Heil, A.; Goldammer, J. Smoke-haze pollution: A review of the 1997 episode in Southeast Asia. Reg. Environ. Chang. 2001, 2, 24–37. [Google Scholar] [CrossRef]
- Rayleigh, L. On the transmission of light through an atmosphere containing small particles in suspension, and on the origin of the blue of the sky. Lond. Edinb. Dublin Philos. Mag. J. Sci. 1899, 47, 375–384. [Google Scholar] [CrossRef]
- Laboratory, D.R. Creating Reprojected True Color VIIRS Images: A Tutorial. 2016. Available online: https://directreadout.sci.gsfc.nasa.gov/links/rsd_eosdb/PDF/VIIRS_True_Color_Tutorial_v1.0.pdf (accessed on 7 January 2021).
- Schroeder, W.; Giglio, L. Visible Infrared Imaging Radiometer Suite (VIIRS) 750 m Active Fire Detection and Characterization Algorithm Theoretical Basis Document 1.0. 2017. Available online: https://lpdaac.usgs.gov/documents/133/VNP14_ATBD.pdf (accessed on 7 January 2021).
- Giglio, L.; Schroeder, W.; Csiszar, I.; Tsidulko, M. Algorithm Theoretical Basis Document for NOAA NDE VIIRS Active Fire. 2016. Available online: https://www.star.nesdis.noaa.gov/jpss/documents/ATBD/ATBD_NDE_AF_v2.6.pdf (accessed on 6 January 2021).
- Li, F.; Zhang, X.; Kondragunta, S.; Csiszar, I. Comparison of fire radiative power estimates from VIIRS and MODIS observations. J. Geophys. Res. Atmos. 2018, 123, 4545–4563. [Google Scholar] [CrossRef]
- Heidinger, A.; Botambekov, D.; Walther, A. A Naïve Bayesian Cloud Mask Delivered to NOAA Enterprise. Version 1.2; 2016. Available online: https://www.star.nesdis.noaa.gov/goesr/documents/ATBDs/Enterprise/ATBD_Enterprise_Cloud_Mask_v1.2_Oct2016.pdf (accessed on 7 January 2021).
- White, C.H.; Heidinger, A.K.; Ackerman, S.A. Evaluation of VIIRS Neural Network Cloud Detection against Current Operational Cloud Masks. Atmos. Meas. Tech. Discuss. 2020, 1–34. [Google Scholar] [CrossRef]
- Laszlo, I.; Liu, H. EPS Aerosol Optical Depth (AOD) Algorithm Theoretical Basis Document. Noaa Nesdis Cent. Satell. Appl. Res. 2016. Available online: https://www.star.nesdis.noaa.gov/jpss/documents/ATBD/ATBD_EPS_Aerosol_AOD_v3.0.1.pdf (accessed on 7 January 2021).
- Zweers, S.D. TROPOMI ATBD of the UV Aerosol Index. 2018. Available online: http://www.tropomi.eu/sites/default/files/files/S5P-KNMI-L2-0008-RP-TROPOMI_ATBD_UVAI-1.1.0-20180615_signed.pdf (accessed on 7 January 2021).
- Giglio, L.; Randerson, J.T.; Werf, G.R. Analysis of daily, monthly, and annual burned area using the fourth-generation global fire emissions database (GFED4). J. Geophys. Res. Biogeosciences 2013, 118, 317–328. [Google Scholar] [CrossRef]
- Zhang, X.; Kondragunta, S.; Ram, J.; Schmidt, C.; Huang, H.-C. Near-real-time global biomass burning emissions product from geostationary satellite constellation. J. Geophys. Res. Atmos. 2012, 117, D14201. [Google Scholar] [CrossRef]
- Shi, Z.; Wang, Q.; Peng, J.; Ji, W.; Liu, H.; Li, X.; Rossel, R.A.V. Development of a national VNIR soil-spectral library for soil classification and prediction of organic matter concentrations. Sci. China Earth Sci. 2014, 57, 1671–1680. [Google Scholar] [CrossRef]
- Hinds, W.C. Aerosol Technology Properties, Behavior, and Measurement of Airborne Particles; Wiley lnterscience: New York, NY, USA, 1982. [Google Scholar] [CrossRef]
- Chrysoulakis, N.; Cartalis, C. A new algorithm for the detection of plumes caused by industrial accidents, based on NOAA/AVHRR imagery. Int. J. Remote Sens. 2003, 24, 3353–3368. [Google Scholar] [CrossRef]
- Chrysoulakis, N.; Herlin, I.; Prastacos, P.; Yahia, H.; Grazzini, J.; Cartalis, C. An improved algorithm for the detection of plumes caused by natural or technological hazards using AVHRR imagery. Remote Sens. Environ. 2007, 108, 393–406. [Google Scholar] [CrossRef]
- Zhao, T.X.-P.; Ackerman, S.; Guo, W. Dust and smoke detection for multi-channel imagers. Remote Sens. 2010, 2, 2347–2368. [Google Scholar] [CrossRef]
- Stroppiana, D.; Pinnock, S.; Gregoire, J.-M. The global fire product: Daily fire occurrence from April 1992 to December 1993 derived from NOAA AVHRR data. Int. J. Remote Sens. 2000, 21, 1279–1288. [Google Scholar] [CrossRef]
- Giglio, L.; Descloitres, J.; Justice, C.O.; Kaufman, Y.J. An enhanced contextual fire detection algorithm for MODIS. Remote Sens. Environ. 2003, 87, 273–282. [Google Scholar] [CrossRef]
- Buiteveld, H.; Hakvoort, J.; Donze, M. Optical properties of pure water. Ocean Optics XII. 1994, 2258, 174–183. [Google Scholar] [CrossRef]
- News, S. The numbers behind Australia’s catastropic bushfire season. Sbs News 2020. Available online: https://www.sbs.com.au/news/the-numbers-behind-australia-s-catastrophic-bushfire-season (accessed on 7 January 2021).
- Xie, Y.; Qu, J.; Xiong, X.; Hao, X.; Che, N.; Sommers, W. Smoke plume detection in the eastern United States using MODIS. Int. J. Remote Sens. 2007, 28, 2367–2374. [Google Scholar] [CrossRef]
- Schueler, C.F. Dual Use Sensor Design for Enhanced Spatioradiometric Performance. U.S. Patent No. 5,682,034., 28 October 1997. [Google Scholar]
- Hsu, N.C.; Herman, J.; Torres, O.; Holben, B.; Tanre, D.; Eck, T.; Smirnov, A.; Chatenet, B.; Lavenu, F. Comparisons of the TOMS aerosol index with Sun-photometer aerosol optical thickness: Results and applications. J. Geophys. Res. Atmos. 1999, 104, 6269–6279. [Google Scholar] [CrossRef]
- Shyamsundar, P.; Springer, N.; Tallis, H.; Polasky, S.; Jat, M.; Sidhu, H.; Krishnapriya, P.; Skiba, N.; Ginn, W.; Ahuja, V. Fields on fire: Alternatives to crop residue burning in India. Science 2019, 365, 536–538. [Google Scholar] [CrossRef] [PubMed]
- Landrigan, P.J.; Fuller, R.; Acosta, N.J.; Adeyi, O.; Arnold, R.; Baldé, A.B.; Bertollini, R.; Bose-O’Reilly, S.; Boufford, J.I.; Breysse, P.N. The Lancet Commission on pollution and health. Lancet 2018, 391, 462–512. [Google Scholar] [CrossRef]
- Wooster, M.; Zhukov, B.; Oertel, D. Fire radiative energy for quantitative study of biomass burning: Derivation from the BIRD experimental satellite and comparison to MODIS fire products. Remote Sens. Environ. 2003, 86, 83–107. [Google Scholar] [CrossRef]
- Giglio, L.; Boschetti, L.; Roy, D.P.; Humber, M.L.; Justice, C.O. The Collection 6 MODIS burned area mapping algorithm and product. Remote Sens. Environ. 2018, 217, 72–85. [Google Scholar] [CrossRef] [PubMed]
- Chuvieco, E.; Mouillot, F.; van der Werf, G.R.; San Miguel, J.; Tanasse, M.; Koutsias, N.; García, M.; Yebra, M.; Padilla, M.; Gitas, I. Historical background and current developments for mapping burned area from satellite Earth observation. Remote Sens. Environ. 2019, 225, 45–64. [Google Scholar] [CrossRef]
- Van Der Werf, G.R.; Randerson, J.T.; Giglio, L.; Van Leeuwen, T.T.; Chen, Y.; Rogers, B.M.; Mu, M.; Van Marle, M.J.; Morton, D.C.; Collatz, G.J. Global fire emissions estimates during 1997–2016. Earth Syst. Sci. Data 2017, 9, 697–720. [Google Scholar] [CrossRef]
- Jackson, J.M.; Liu, H.; Laszlo, I.; Kondragunta, S.; Remer, L.A.; Huang, J.; Huang, H.-C. Suomi-NPP VIIRS aerosol algorithms and data products. J. Geophys. Res. Atmos. 2013, 118, 12673–12689. [Google Scholar] [CrossRef]
- De Graaf, M.; Stammes, P. SCIAMACHY Absorbing Aerosol Index—Calibration issues and global results from 2002–2004. Atmos. Chem. Phys. 2005, 5, 2385–2394. [Google Scholar] [CrossRef]
- Vermote, E.; Tanré, D.; Deuzé, J.; Herman, M.; Morcrette, J.; Kotchenova, S. Second Simulation of a Satellite Signal in the Solar Spectrum—Vector (6SV); 6S User Guide Version 3. Nasa Goddard Space Flight Cent. Greenbeltmdusa 2006. Available online: https://www.researchgate.net/publication/247461276_Second_simulation_of_a_satellite_signal_in_the_solar_spectrum-vector_6SV (accessed on 7 January 2021).
- Kondragunta, S.; Laszlo, I.; Ma, L.; Office, J.P. NOAA JPSS Visible Infrared Imaging Radiometer Suite (VIIRS) Aerosol Optical Depth and Aerosol Particle Size Distribution Environmental Data Record (EDR) from NDE. Noaa Natl. Cent. Environ. Inf. 2017. [Google Scholar] [CrossRef]
- Zhang, X.; Kondragunta, S.; Roy, D.P. Interannual variation in biomass burning and fire seasonality derived from Geostationary satellite data across the contiguous United States from 1995 to 2011. J. Geophys. Res. Biogeosciences 2014, 119, 1147–1162. [Google Scholar] [CrossRef]
- Kaiser, J.; Heil, A.; Andreae, M.; Benedetti, A.; Chubarova, N.; Jones, L.; Morcrette, J.-J.; Razinger, M.; Schultz, M.; Suttie, M. Biomass burning emissions estimated with a global fire assimilation system based on observed fire radiative power. Biogeosciences 2012, 9, 527–554. [Google Scholar] [CrossRef]
- Darmenov, A.; da Silva, A. The quick fire emissions dataset (QFED)–documentation of versions 2.1, 2.2 and 2.4. Nasa Tech. Rep. Ser. Glob. Modeling Data Assim. 2015, 38. Available online: https://ntrs.nasa.gov/api/citations/20180005253/downloads/20180005253.pdf (accessed on 6 January 2021).
- McMahon, C.K. Characteristics of forest fuels, fire and emissions. In Proceedings of the 76th Annual Meeting of Air Pollution Control Association, Atlanta, GA, USA, 19–24 June 1983; 24p. [Google Scholar]
Publisher’s Note: MDPI stays neutral with regard to jurisdictional claims in published maps and institutional affiliations. |
© 2021 by the authors. Licensee MDPI, Basel, Switzerland. This article is an open access article distributed under the terms and conditions of the Creative Commons Attribution (CC BY) license (http://creativecommons.org/licenses/by/4.0/).

