Article

Climate Dynamics of the Spatiotemporal Changes of Vegetation NDVI in Northern China from 1982 to 2015

1
Key Laboratory of Water Cycle and Related Land Surface Processes, Institute of Geographic Sciences and Natural Resources Research, Chinese Academy of Sciences, Beijing 100101, China
2
College of Resources and Environment, University of Chinese Academy of Sciences, Beijing 100049, China
3
Department of Civil, Environmental and Geomatics Engineering, Florida Atlantic University, Boca Raton, FL 33431, USA
*
Author to whom correspondence should be addressed.
Remote Sens. 2021, 13(2), 187; https://doi.org/10.3390/rs13020187
Submission received: 5 November 2020 / Revised: 3 January 2021 / Accepted: 5 January 2021 / Published: 7 January 2021

Abstract

:
As an important part of a terrestrial ecosystem, vegetation plays an important role in the global carbon-water cycle and energy flow. Based on the Global Inventory Monitoring and Modeling System (GIMMS) third generation of Normalized Difference Vegetation Index (NDVI3g), meteorological station data, climate reanalysis data, and land cover data, this study analyzed the climate dynamics of the spatiotemporal variations of vegetation NDVI in northern China from 1982 to 2015. The results showed that growth season NDVI (NDVIgs) increased significantly at 0.006/10a (p < 0.01) in 1982–2015 on the regional scale. The period from 1982 to 2015 was divided into three periods: the NDVIgs increased by 0.026/10a (p < 0.01) in 1982–1990, decreased by −0.002/10a (p > 0.1) in 1990–2006, and then increased by 0.021/10a (p < 0.01) during 2006–2015. On the pixel scale, the increases in NDVIgs during 1982–2015, 1982–1990, 1990–2006, and 2006–2015 accounted for 74.64%, 85.34%, 48.14%, and 68.78% of the total area, respectively. In general, the dominant climate drivers of vegetation growth had gradually switched from solar radiation, temperature, and precipitation (1982–1990) to precipitation and temperature (1990–2015). For woodland, high coverage grassland, medium coverage grassland, low coverage grassland, the dominant climate drivers had changed from temperature and solar radiation, solar radiation and precipitation, precipitation and solar radiation, solar radiation to precipitation and solar radiation, precipitation, precipitation and temperature, temperature and precipitation. The areas controlled by precipitation increased significantly, mainly distributed in arid, sub-arid, and sub-humid areas. The dominant climate drivers for vegetation growth in the plateau climate zone or high-altitude area changed from solar radiation to temperature and precipitation, and then to temperature, while in cold temperate zone, changed from temperature to solar radiation. These results are helpful to understand the climate dynamics of vegetation growth, and have important guiding significance for vegetation protection and restoration in the context of global climate change.

Graphical Abstract

1. Introduction

Climate change has a significant impact on the structure and function of global ecosystem [1,2]. The increase in temperature and the decrease in precipitation lead to serious drought, which will be more serious and frequent in the 21st century [3], especially in the middle latitude and arid areas [4].
As an important component of a terrestrial ecosystem [5], the dynamic changes of vegetation can reshape the global carbon and water cycle and energy flow [6]. The climate dynamics of vegetation change has become a hot topic in the field of ecology, geography, and climatology [4,7]. It is also helpful to reveal the response of vegetation biophysics to climate change [1].
The rapid development of remote sensing technology provides massive data freely available for studying global long-term vegetation change [8],vegetation dynamic monitoring [9], ecological environment assessment [10], and land cover classification [11]. The Normalized Difference Vegetation Index (NDVI) is usually used as the evaluation index in monitoring vegetation growth using remote sensing satellite data [12], because NDVI is closely related to the photosynthetic active radiation absorbed by photosynthesizing tissues [13], and it is a good representative of photosynthetic capacity [14]. Generally, the increase or decrease in NDVI indicates the enhancement or weakening of vegetation growth activity [14]. Therefore, NDVI can be used as an effective index to study the response of vegetation to climate change [9,15].
Temperature and precipitation are closely related to vegetation growth [16], and are usually selected as the dominating climate factors to analyze the response of vegetation to climate change [17]. Generally, solar radiation is also an important climate factor, because it can also control vegetation growth through spectral composition, light intensity, sunshine time, etc. [18,19]; however, related studies are mainly focused on some small-scale areas [20,21] or global scale [22]. Many studies on vegetation dynamic changes only consider the monotonic trend, assuming that the vegetation change trend remains unchanged throughout the study period [14], and the typical simple linear regression method is used to obtain the linear trend [23], which may lead to a wrong interpretation of the vegetation growth. As a common nonlinear analysis method, piecewise linear regression can better explain the changing process of vegetation growth [24]. The correlation coefficient or partial correlation coefficient is usually used to determine the degree of influence for climate factors on vegetation growth over the study period. However, the complex response of vegetation growth to the change of climate factors in different spatiotemporal scales [25] may lead to change different dominant climatic factors to vegetation growth. Moreover relevant researches are mainly concentrated on the Qinghai Tibet Plateau [26], the Loess Plateau [27], or the global scale [14].
Northern China covers a complex ecological environment composed of four climatic regions and five temperature zones, which is the key gathering place of soil and water conservation, vegetation protection, and restoration [28]. Therefore, many ecological projects have been implemented to improve vegetation coverage in China [29], such as “Grain-for-Green Project” [30], “Natural Forest Protection Project”, “Three North Shelter Forest Region” [17], etc. Climate dynamics of vegetation change in northern China are mainly concentrated in Inner Mongolia [31], Loess Plateau [32], Northwestern China [33,34] and Qinghai Plateau [35,36]. There are few reports about the effect of solar radiation on vegetation growth in northern China, and it is not clear whether the relationship between vegetation dynamics and climate change has changed. Therefore, it is necessary to analyze the dominant climate factors of vegetation growth in different geographical regions, and investigate whether the dominant climate factors have changed from 1982 to 2015, and, finally, obtain the spatial pattern of dominant climate factors.
Some prior studies chose the land cover data in a certain period to analyze the relationship between vegetation and climate change in the whole period [37,38,39,40]. However, this ignores the possibility that land cover types may have changed during the study period. Some studies have shown that with the implementation of ecological engineering, the spatiotemporal characteristics of land cover have changed significantly [41,42]. Constant land cover data in the whole period will bring uncertainty to the study of the relationship between vegetation and climate change. Therefore, it is necessary to obtain unchanged land cover types from 1982 to 2015. Compared with grassland and woodland, cropland is more actively affected by human activities, which cannot reflect the response of natural vegetation to climate change. Therefore, the purpose of this study is to: (1) characterize the temporal trends and spatial patterns of climate factors and vegetation (especially grassland and woodland) in different periods of northern China from 1982 to 2015; (2) identify the dominant climatic factors causing vegetation change in different periods; (3) investigate whether the dominant climate factors of different vegetation over different regions have changed from 1982 to 2015.

2. Materials and Methods
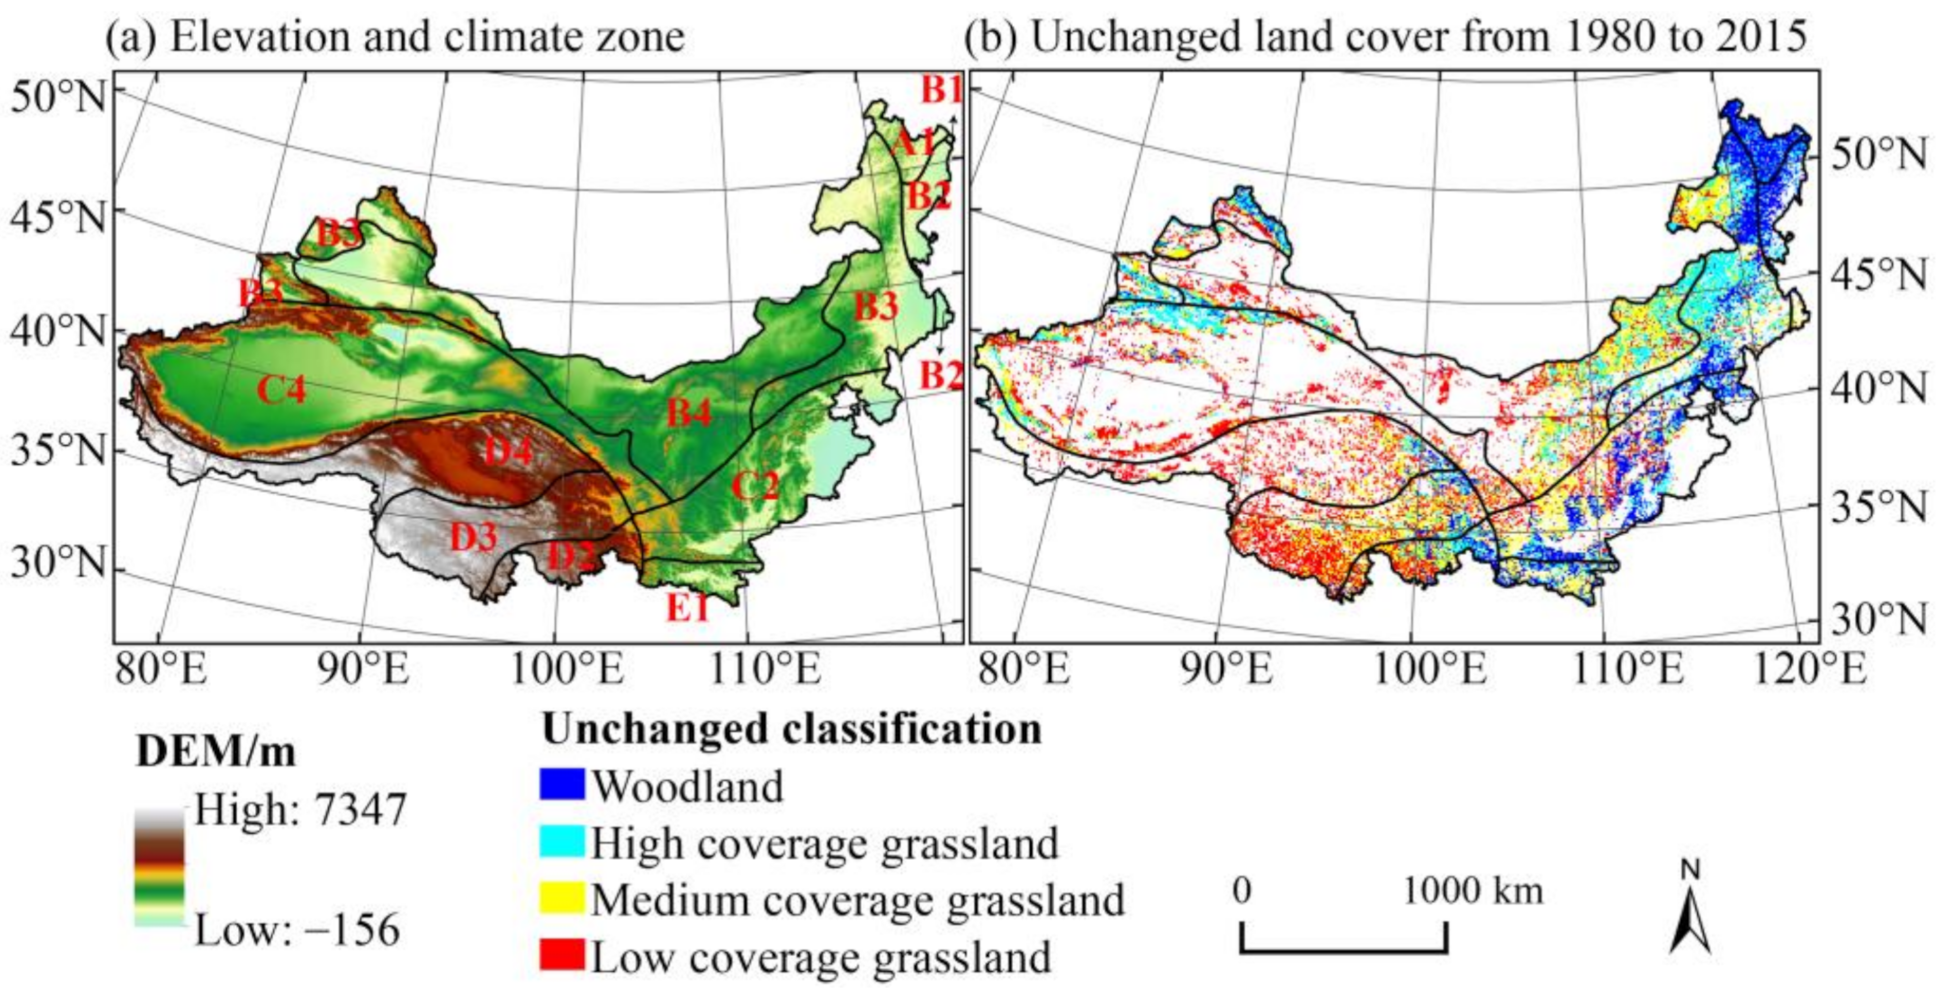
2.1. Study Area

The study area (73°37′–125°57′ E and 31°41′–53°18′ N) is located in north China, including the administrative provinces of Shanxi, Hebei, Inner Mongolia, Gansu, Shaanxi, Qinghai, Ningxia, and Xinjiang. The altitude range of the study area is −156 to 7347 m (Figure 1a), and the total area is about 4,497,787 km2. The complex climate conditions can be divided into humid, sub-humid, sub-arid, and arid regions according to precipitation. According to the latitudes of the earth, it can be divided into subtropical, warm temperate, middle temperate, cold temperate, and plateau climate zones [43]. So, the study area is summarized as 11 different climate zones (Figure 1a and Table 1). Based on multiphase land cover data, the spatial distribution of grassland and woodland unchanged in 1980–2015 was obtained (in Section 2.2.3) (Figure 1b).

2.2. Data and Preprocessing

2.2.1. GIMMS NDVI3g

The third generation of NDVI product created by the Global Inventory Monitoring and Modeling System (GIMMS NDVI3g) is the latest version of the long-time series NDVI data set (https://ecocast.arc.nasa.gov/data/pub/gimms/3g.v1/). It covers the period from 1982 to 2015, with 8 km spatial resolution and 15 days temporal resolution, and is widely used to monitor vegetation changes at global or regional scales [44]. The 15-day temporal resolution GIMMS NDVI3g were aggregated into monthly NDVI data by Maximum Value Composite (MVC) [45]. Finally, the NDVI in growing season (NDVIgs) was obtained by averaging the monthly NDVI values from April to October [46,47].

2.2.2. Meteorological Datasets

The daily 829 climate station data provided by China Meteorological Data Service Center (http://data.cma.cn/) was used. Combined with the values of several days before and after, linear interpolation was used to fill in the missing or outlier values. If there were too many consecutive blank values, the station would be removed. Finally, daily data from each station was merged into monthly data. Among the stations, 38 meteorological stations were randomly selected to verify the accuracy. The monthly raster data at a 8 km spatial resolution was obtained by interpolating the data from neighboring weather stations with ANUSPLIN 4.2 software [48]. The accuracy evaluation showed that the monthly raster data was significantly correlated with the corresponding validating weather data (p < 0.01). We choose it for interpolation because this method has good performance and has been widely used [32,49].
Monthly solar radiation data with a spatial resolution of 0.25 degrees were obtained from the European Centre for Medium-Range Weather Forecasts (ECMWF) (https://www.ecmwf.int/) ERA5. ERA5 was the fifth generation ECMWF reanalysis data for the global climate and weather covering the past 4 to 7 decades, which replaces the ERA-Interim reanalysis. To match the spatial resolution of NDVI, the thin-plate spline method was used to interpolate solar radiation data into the 8 km spatial resolution with Digital Elevation Model(DEM), which was collected from the NASA Shuttle Radar Topographic Mission, as the concomitant variation [50].
Finally, we obtained the temperature (refers to mean temperature), precipitation (refers to cumulative precipitation) and solar radiation (refers to mean solar radiation) in the growing season of vegetation.

2.2.3. Other Geospatial Ancillary Data

The land cover data with a 1 km spatial resolution in 1980, 1990, 1995, 2000, 2005, 2010, and 2015 were provided by Data Center for Resources and Environmental Sciences, Chinese Academy of Sciences (RESDC, http://www.resdc.cn), which were widely used in regional scale related research [20,51]. Based on remote sensing images (e.g., Landsat and HJ-charge coupled device (CCD)) and ground survey data, the land cover data of China were generated by visual interpretation. The data includes six first-class classification and 25 s-class classification, and the classification accuracy was above 94.3% and 91.2%, respectively [51]. Using the nearest neighbor resampling method, the spatial resolution of seven phases of land cover data was resampled to 8 km to match that of GIMMS NDVI3g. The types of land cover mainly include woodland, cropland, grassland, water, built-up land, and unused land. The description of the land cover classification system can be found on the website mentioned above. The sub-classification of woodland (WL) includes forestland, shrubbery, sparse woodland, and other woodland, and grassland is composed of high coverage grassland (HCG), medium coverage grassland (MCG), and low coverage grassland (LCG). Using seven phases of land cover data, we derived the spatial distribution of unchanged grassland and woodland areas during 1980–2015 (Figure 1b), in order to minimize the potential impact of land cover change on the relationship between NDVI and climate factors. The WL only accounted for 19.30% of the study area (referring to the total area of woodland and grassland), the sub-classification of WL was merged into a single land cover type. HCG, MCG, and LCG accounted for 21.98%, 26.82%, and 31.90% of the total area respectively. Finally, four land cover types were used to study the response of vegetation to climate change.
Climate zone data was derived from RESDC, which was based on the division of temperature zone and precipitation.

2.3. Method

2.3.1. Sen Median Trend Analysis and Mann–Kendall Test

Sen [52] median trend analysis and the Mann–Kendall test [53,54] were widely used in meteorological and hydrological research [55,56]. Sen median trend analysis has good ability to avoid outliers or measurement errors, and is not interfered by outliers [57,58]. Meanwhile, it is more suitable than the linear regression method for studying the trend of vegetation change [59]. The calculation formula is as follows:
ρ = m e d i a n x j x i j i , 1 < i < j < n
where ρ is the slope of time series data; when ρ > 0, it reflects that NDVI shows an increasing trend; otherwise, a decreasing trend occurs. xi and xj are the time series data.
The Mann–Kendall test was used to determine the significance of the NDVI trend [30]. When |Z| > Z1−a/2 it indicates that the trend of NDVI changes significantly. Z1−a/2 is the corresponding value of the standard normal distribution function at the level of α . The trend of NDVI was divided into six levels according to ρ and |Z|: very significant increase (ρ ≥ 0, |Z| > 2.58, p < 0.01), very significant decrease (ρ < 0, |Z| > 2.58, p < 0.01); significant increase (ρ ≥ 0, |Z| > 1.96, p < 0.05), significant decrease (ρ < 0, |Z| > 1.96, p < 0.05), non-significant increase (ρ ≥ 0, |Z| ≤ 1.96, p > 0.05), and non-significant decrease (ρ < 0, |Z| ≤ 1.96, p > 0.05).

2.3.2. Piecewise Linear Regression Analysis

Due to the influence of climate change and human activities, the trend of NDVI usually has obvious stage (i.e., turning point) [60]. The overall change trend of vegetation in the study period cannot truly reflect the changing characteristics of NDVI in different stages. Piecewise linear regression model is very powerful in extracting the turning point (TP) of NDVI time series, and has been widely used to evaluate the change trend of hydrology [61], NDVI, and climate over time [31,62]. In a single TP case, the calculation formula is as follows:
y = β 0 + β 1 × t + ε ,        ( t α ) β 0 + β 1 × t + β 2 ( t α ) + ε , ( t > α )
When long time series data contain more than one TP [63]. The formula is as follows:
y n = β 0 + i = 0 n β i + 1 ( t α i ) + ε , α 0 = 0
where y is the dependent variable; t is the independent variable; β0 is the intercept; β0 and β1 + β2 are the slopes of before and after the TP, respectively; αi are the estimated ith TPs of time series data, and ε is the residual random error; n is the number of TP in the time series data. Least squares linear regression was used to estimate the above parameters to minimize the sum of squares of fitting residuals, and p-value < 0.05 was considered significant.

2.3.3. Partial Correlation Analysis and Coefficient of Variation

Precipitation, temperature and solar radiation are the main climate factors that directly affect vegetation growth [19]; however, the three climatic factors interact each other. Through the second-order partial correlation coefficient [64,65,66], the influence of single climate factor on vegetation growth was calculated, and the other two climate factors were used as control variables. The formula is as follows:
R 12 , 34 = R 12 , 3 R 14 , 3 × R 24 , 3 ( 1 R 14 , 3 2 ) × ( 1 R 24 , 3 2 )
R 12 , 3 = R 12 R 13 × R 23 ( 1 R 13 2 ) × ( 1 R 23 2 )
where R 12 , 34 refers to the partial correlation coefficient (PCC) of variables 1 and 2, and variables 3 and 4 are the control variables;   R 12 , 3 refers to the partial correlation coefficient of variables 1 and 2, and variable 3 is the control variable;   R 12 refers to the correlation coefficient of variables 1 and 2. Similarly, other variables have similar meanings. Variable 1 refers to NDVI, and variables 2, 3, and 4 represent three climatic factors, respectively. The PCC between NDVI and each climatic factor is calculated by the above formula. The t-test was used to estimate the significance of the calculated partial correlation coefficient in the case of p < 0.05 or 0.01.
The coefficient of variation (CV) can reflect the low or high stability of vegetation NDVI time series with higher or lower CV value [67]. The formula is:
C V = σ N D V I ¯
where CV, σ, N D V I ¯ refer to the coefficient of variation, the standard deviation, the mean value of NDVI time series. According to previous studies [33,68,69,70], the stability of vegetation was divided into three levels: high stability (CV ≤ 0.08), medium stability (0.08 < CV ≤ 0.12), and low stability (CV > 0.12).
To better explain the overall process of this study, the flow chart is shown in Figure 2.

3. Result

3.1. Spatial Patterns and CV of NDVIgs

Figure 3 shows the spatial distribution of the multi-year mean NDVIgs and CV of NDVIgs from 1982 to 2015. The NDVIgs of the study area ranged from 0.01 to 0.86 with a spatial average of 0.37. Overall, the spatial pattern of NDVIgs is that it gradually decreased from southeast to northwest, and had obvious spatial heterogeneity, which was basically consistent with the spatial distribution of land cover types (Figure 1b). The NDVIgs of WL distributed in the southeast of the study area was the largest with a spatial average of 0.59. The coverage area of grassland was the largest, and the NDVIgs average values of HCG, MCG, and LCG were 0.42, 0.34, and 0.22, respectively. Overall, the NDVIgs of vegetation had good stability, indicated by the spatial average of CV being 0.07. According to the corresponding percentages of different CV grades in Figure 3b, high stability region accounted for 63.94%, medium stability region accounted for 26.26%, low stability region accounted for 9.80%, especially in the central (e.g., the Loess plateau) and western parts of the study area. According to Figure 1b and Figure 3b, the inter-annual stability of WL was the best, with the average CV of 0.05, followed by HCG (CV = 0.07). The CVs of MCG and LCG were similar, slightly higher than 0.08.

3.2. Temporal Variations of NDVIgs and Climatic Factors in Different Periods

At the regional scale, the TPs of NDVIgs in the study area from 1982 to 2015 were identified by piecewise linear regression, which occurred in 1990 and 2006 (Figure 4). From 1982 to 2015, NDVIgs showed an obviously significant increasing trend, with a slope of 0.006/10a (p < 0.01), indicating that the vegetation in the past 34 years was constantly improving. During 1982–2015, the temperature also showed a very significant increasing trend, while the precipitation and solar radiation showed a non-significant increasing trend, indicating that the climate conditions were gradually warm and humid. According to the two TPs of 1990 and 2006, the NDVIgs change in 1982–2015 could be divided into three periods: 1982–1990, 1990–2006, and 2006–2015 (Figure 4a). In 1982–1990, the slope of NDVIgs was 0.026/10a (p < 0.01), which was higher than that of NDVIgs in 1982–2015; temperature and precipitation showed an increasing trend. However, solar radiation showed a decreasing trend. In 1990–2006, the slope of NDVIgs suddenly decreased with a non-significant decreasing trend of −0.002/10a (p > 0.1). The temperature trend was higher than that in 1982–1990; precipitation had a decreasing trend, with a slope of −12.199 mm/10a (p > 0.1); the slope of solar radiation was 0.467 MJ/m2·10a (p < 0.1). In 2006–2015, the slope of NDVIgs became positive, indicating that the vegetation growth began to improve. At the same time, the slope of precipitation also changed to positive, showing a significant increase trend. On the contrary, the slopes of temperature and solar radiation changed from positive to negative, showing a decreasing trend. From Figure 4, the NDVIgs slope is consistent with that of precipitation, positive–negative–positive change, which is opposite to that of the solar radiation slope. From 1982 to 1990, with the increase of temperature and precipitation, climate conditions become warm and humid, which was conducive to vegetation growth, and then NDVIgs increased accordingly. In 1990–2006, with the increase of temperature and solar radiation, precipitation decreased, resulting in dry climate, which was not conducive to vegetation growth, so NDVIgs decreased accordingly. In 2006–2015, with the decrease of temperature and solar radiation and the increase of precipitation, the climate tends to be cold and humid, and NDVIgs increased rapidly.

3.3. Spatial Pattern and Trend of NDVIgs and Climatic Factors in Different Periods

Sen median trend analysis and Mann–Kendall tests were used to analyze the trends and significance levels of vegetation and climate factors in different periods on the pixel scale. Figure 5 and Figure 6, respectively, show the slope and significance level for NDVIgs and climatic factors in 1982–2015. Table 2 shows the area statistics of NDVIgs and climate factors at different significance levels. From 1982 to 2015, the trends of NDVIgs, temperature, precipitation and solar radiation were mainly positive (Figure 5 and Figure 6, Table 2). The area with extremely significant increase of NDVIgs (p < 0.01) was close to that with non-significant increase (p > 0.05), while the decreasing trend was mainly non-significant (p > 0.05). According to the area statistics of NDVIgs of different land covers at different significance levels (Table S1), from 1982 to 2015, there was obvious improvement in vegetation; LCG had the largest area improvement percentage of 78.08%, followed by MCG (76.28%) and WL (73.45%), and HCG (68.66%). The area of WL, MCG or LCG NDVIgs with significant increase (including p < 0.05 and p < 0.01), which was much larger than that with non-significant increase (p > 0.05), while HCG NDVIgs was opposite. The increase of temperature, precipitation, and solar radiation in the middle of the study area was good for vegetation growth. On the contrary, the decrease of precipitation and the increase of temperature and solar radiation led to the decrease of NDVIgs in the northeast of the study area, which indicated that precipitation might play a decisive role in the dynamic change of vegetation.
The spatial patterns of NDVIgs and climatic factors were significantly different in different periods (Table 2). During 1982–1990, NDVIgs, temperature and precipitation showed an increasing trend, which was mainly composed of non-significant increase (p > 0.05). However, the slope of solar radiation was mainly negative, and the area of decreasing trend accounted for 76.12% of the total area (Table 2, Figures S1 and S2). The area with increasing trend of WL, HCG, MCG, and LCG NDVIgs was much higher than that with decreasing trend (Table S1). The area with an increasing trend of WL NDVIgs was the highest (21.39%, including p < 0.05 and 0.01), while that of LCG NDVIgs was the lowest (11.30%) (Table S1). From 1982 to 1990, 85.34% of the regions showed an increasing trend of NDVIgs, indicating that vegetation growth continued to improve, and vegetation degradation were mainly distributed in arid and sub-arid regions. The decrease of temperature was mainly located in the southeastern and western parts of the study area. The decrease of precipitation was mainly distributed in the western, southwestern, and southeastern parts of the study area. The increase of solar radiation was mainly concentrated in the northeastern B4 and the southwestern B3, while the other areas showed a decreasing trend.
From 1990 to 2006, the results clearly showed that more than half of the vegetation had been degraded (Table 2, Figures S3 and S4). The area of NDVIgs increase decreased from 85.34% in 1982–1990 to 48.14% in 1990–2006. Over 84% of the study area, the temperature and solar radiation showed an increasing trend, and the area with increasing or decreasing precipitation was basically the same. (Table 2, Figures S3 and S4). Compared with 1982–1990, the NDVIgs changes of WL, HCG, MCG, and LCG were significantly different, and the area with increasing trend decreased sharply. The area with increasing trend of WL and HCG NDVIgs decreased from 93.24% and 86.20% in 1982–1990 to 41.05% and 40.85% in 1990–2006, both of which decreased by more than 45%. The area with increasing trend of MCG and LCG NDVIgs was slightly higher than that with decreasing trend (Table S1). Vegetation degradation was serious in the northeastern, southwestern, and northwestern parts of the study area. The temperature in most of the study area showed an increasing trend. The precipitation increased in the southwestern, western, and southern parts of the study area, and decreased in the northeastern part of the study area. Except for the plateau climate zone, solar radiation was increasing, especially in the northeast of the study area (Figures S3 and S4).
In 2006–2015, NDVIgs and precipitation increased in more than 68% of the regions, while temperature and solar radiation decreased in more than 71% of the region, and the significant level was mainly non-significant (Table 2, Figures S5 and S6). Compared with 1990–2006, the area proportion of the NDVIgs and precipitation with positive trends increased, while that of temperature and solar radiation decreased sharply. Compared with 1990–2006, WL, HCG, MCG, and LCG had significantly improved, and the area with an increasing trend had increased to some extent, but was still less than that in 1982–1990 (Table S1). Compared with 1990–2006, vegetation growth in the northeastern, central parts of the study area had improved. The area with increasing temperature and solar radiation decreased from 97.9% and 84.09% in 1990–2006 to 10.42% and 28.34% in 2006–2015, respectively (Table 2).
The trend of NDVI was not a simple linearity, and had obvious differences before and after the TP. During 1982–1990, 1990–2006, and 2006–2015, the area with NDVI increase decreased from 85.34% to 48.14%, and then recovered to 68.78%. Compared with Figures S2a, S4a and S6a, about 25.90% of the area showed an increasing trend in the three periods, mainly distributed in the central, southern, and western parts of the study area. About 33.02% of the area, vegetation increased in 1982–1990 and 2006–2015, but decreased in 1990–2006, mainly distributed in the northeast of the study area, plateau climate zone, and central C2.

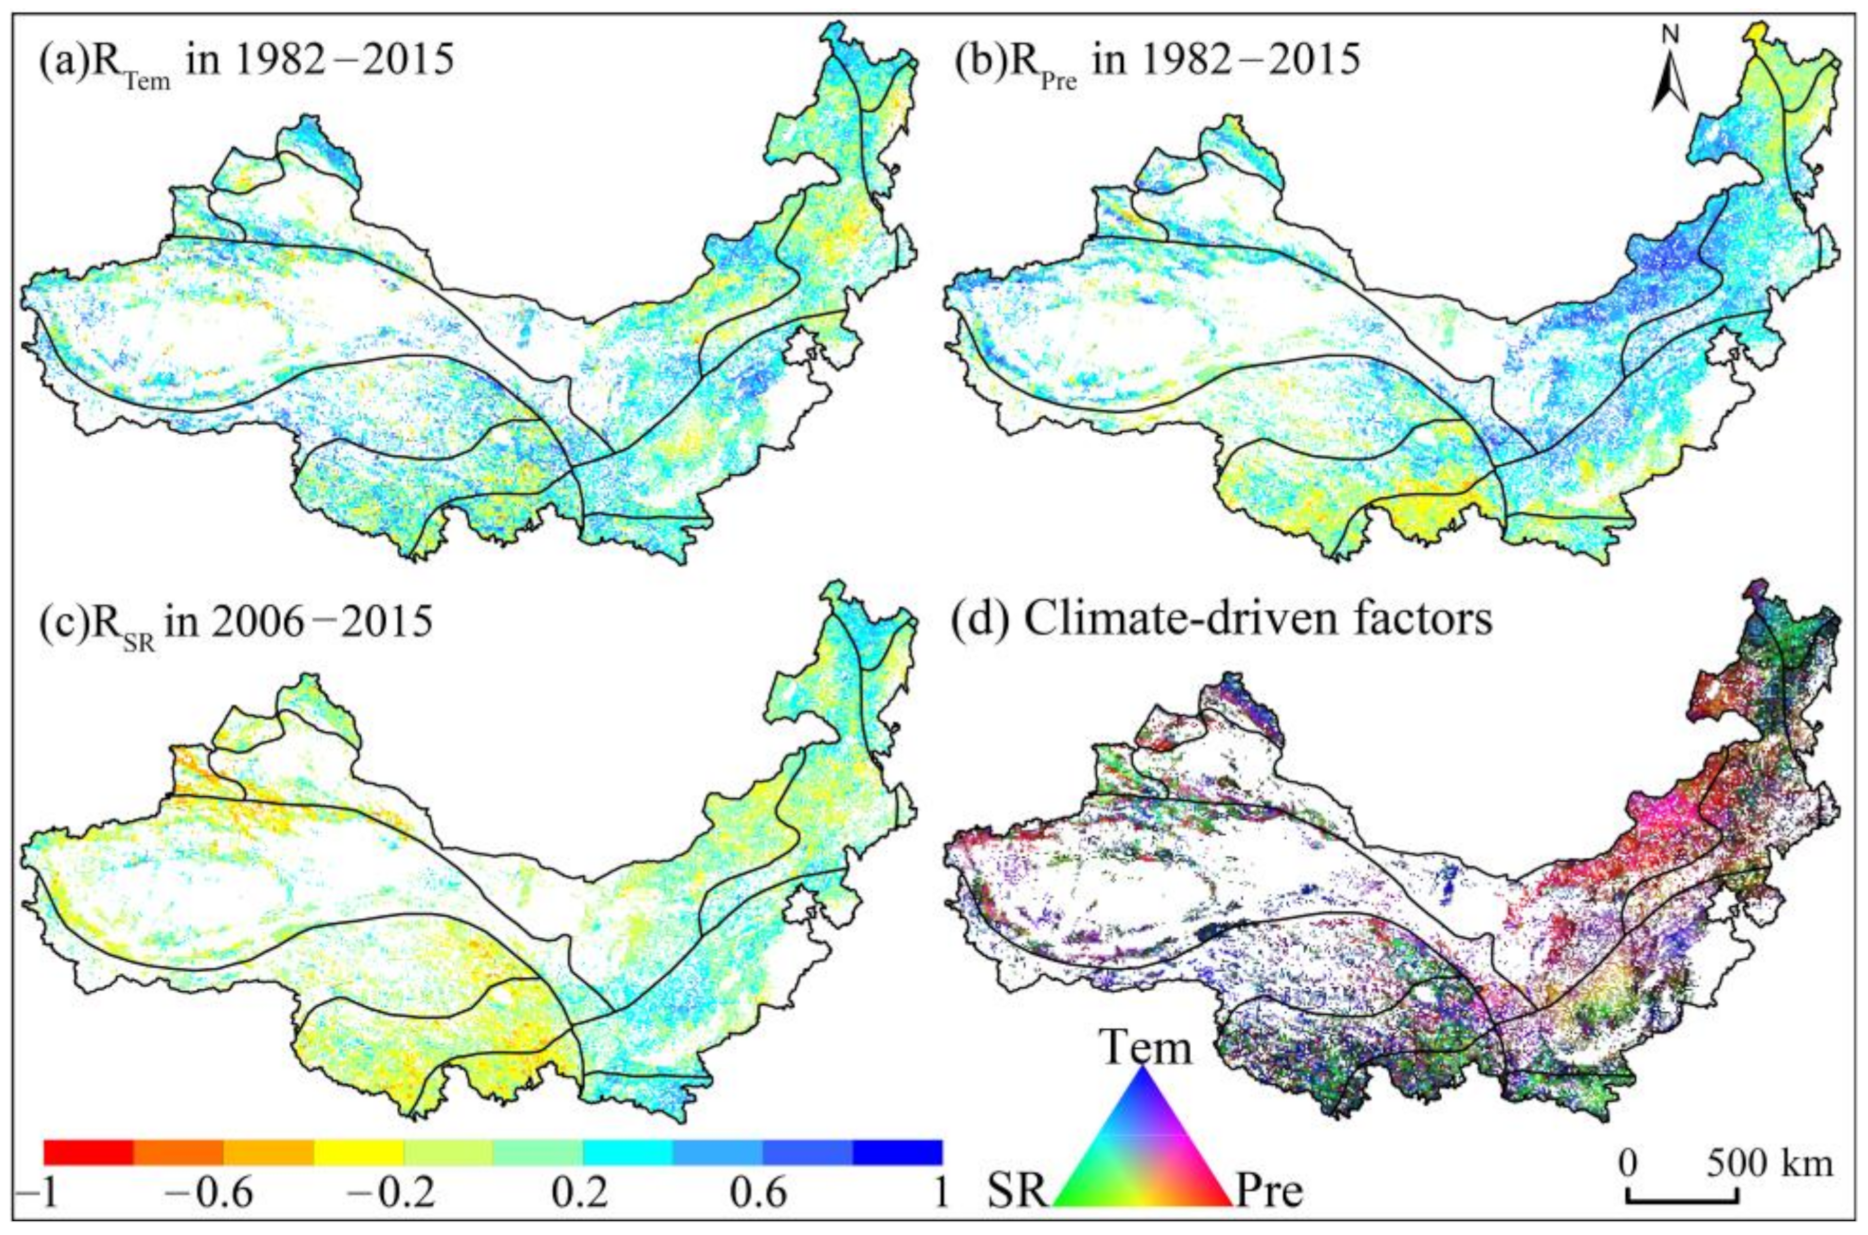
3.4. Spatial Pattern of the Dominant Climate Factors of NDVIgs

The PCC of NDVIgs with temperature, precipitation, and solar radiation were denoted by RTem, RPre and RSR, respectively. The impact of the three climate driving factors was obtained by linearly stretching of the absolute values of RTem, RPre and RSR to 0–255, and then by RGB synthesis (Figure 7, Figures S7–S9). Table 3 shows the statistics result of PCC between NDVIgs and climatic factors in different periods. According to the square of the PCC, the spatial distribution of the dominant climate factors was divided (Figure S10). Table S2 shows the statistics results of climatic factors for different vegetation in different climatic zones.
From 1982 to 2015, the average PCC between vegetation and precipitation was the largest, followed by temperature, both were much higher than solar radiation, which was the same as the area ranking through significance level test, but the area with positive correlation between vegetation and temperature was larger than that with precipitation (Figure 7, Table 3). The regions with RTem less than 0 were mainly distributed in sub-humid regions, sub-arid regions, and parts of arid regions. The values of RPre in the western B3, the northeastern B4, the northern C2 and the parts of C4 were higher (RPre > 0.4), while regions with RPre less than 0 were mainly distributed in A1, D2, and D3. RSR was mainly negative in plateau climatic zones, arid regions and some sub-arid regions, while was mainly positive in the humid zones, sub-humid areas. Figure 7d shows the spatial distribution of dominant climate drivers. The vegetation growth in the humid areas, plateau climate zones, and high-altitude areas were mainly affected by temperature and solar radiation. The vegetation growth was primarily affected by precipitation in arid region, sub-arid region, and part of sub-humid region (Figure 7d and Figure S10a, Table S2).
However, the dominant climate factors of vegetation growth changed significantly in different periods. From 1982 to 1990, NDVIgs was positively correlated with temperature and precipitation, with an area of more than 55%, but negatively correlated with solar radiation, with an area of more than 60%, with spatial average values of 0.098, 0.061, and −0.148, respectively (Figure S7, Table 3). The regions with RTem less than 0 were mainly concentrated in the eastern plateau climatic zone, B4, northwestern C2 and southern B3. The negative PCC in the central B4 was lower than −0.4, while the positive PCC in the northeast of the study area was higher (RTem > 0.6). RPre was mainly negative in the southern and western of the plateau climate zone, the humid and sub-humid zones. The area with RSR less than 0 was widely distributed, and the area with RSR larger than 0 was mainly distributed in the northeast of the study area. The vegetation growth in the eastern of the plateau climate zone, the sub-humid zone, and the high-altitude area was mainly affected by solar radiation. In the northeastern part of the study area, vegetation growth was mainly affected by temperature. The vegetation growth affected by precipitation was mainly distributed in the northeastern B4 and the northwestern B3, while the remaining area was affected by two or three climatic factors (Figures S7d and S10b, Table S2).
Compared with 1982–1990, the correlation between vegetation and temperature and solar radiation decreased significantly, but increased with precipitation during 1990–2006. The area with RTem larger than 0 was basically the same, and the area with of RPre and RSR larger than 0 significantly increased (Figure S8, Table 3). The regions with RTem < 0 were mainly distributed in the plateau climate zone, some arid, sub-arid, and sub-humid zones. RPre was mainly negative in the northeast of the study area, southeast and northwest of the plateau climate zone. RSR was mainly positive in E1, the southwestern C2. The growth of vegetation in the eastern of the plateau climate zone and E1 was mainly affected by solar radiation. The vegetation growth was mainly affected by temperature in the northern part of the study area and the southern of the plateau climate zone. The vegetation growth affected by precipitation was mainly distributed in the northeastern B4 and the southwestern B3 (Figure S8 and S10c).
Compared with 1982–1990 and 1990–2006, the average value of RTem continued to decrease, and the sign of RSR changed from negative to positive, and RPre continued to increase. The areas with RPre > 0 and RSR > 0 increased gradually, while RTem continued to decrease (Figure S9, Table 3). RTem was mainly positive in the plateau climate area and the northeast of the study area. The areas with RPre < 0 were mainly distributed in the southeastern of the plateau climate zone, southeast, and northeast of the study area. The areas with RSR > 0 were mainly distributed in the northeast of the study area, southwestern of the plateau climate area. Vegetation growth was mainly controlled by temperature in the southern of the plateau climate area, some high-altitude areas, while in the northern parts of the study area, central B3, vegetation growth was mainly limited by solar radiation. The spatial distribution of vegetation growth affected by precipitation was widespread, mainly in the eastern B2-4 and C2. Other regions were mostly affected by two or three climatic factors.
According to the Figures S7–S9, the positive and negative response of vegetation to climate factors in the same region had changed significantly with time. From 1982–1990 to 1990–2006 and then to 2006–2015, the area with RTem > 0 in the northeast of the study area gradually decreased, while in the plateau climate zone, it first decreased and then increased. The area with RSR > 0 increased gradually, especially in the plateau climate zone. The effects of temperature on vegetation growth in plateau climate zone were gradually intensified, and the dominant climate factor change from solar radiation to temperature. In arid, sub-arid, and sub-humid zones, the area with RPre > 0 gradually increased, and the impact of precipitation on vegetation growth gradually strengthened (Figures S7–S10, Table S2).
Table 4 shows the area percentage of vegetation growth controlled by the three climate factors in different land cover types. Overall, vegetation growth was mainly controlled by precipitation, followed by temperature in the study area during 1982 to 2015. However, the dominant climate factors of vegetation growth also changed in different periods. During 1982–1990, solar radiation was the main climate factor, and the influence of temperature and precipitation was similar. In 1990–2006 and 2006–2015, the impact of precipitation and temperature on vegetation growth increased and the impact of solar radiation weakened, precipitation became the main influencing factor, followed by temperature. Different type vegetation had different responses to climate factors. From 1982 to 2015, HCG and MCG were firstly affected by precipitation, followed by temperature, while WL and LCG were mainly affected by temperature, followed by precipitation, and the solar radiation had the lowest impact on the growth of four vegetation. The dominant climate factors affecting the growth of four vegetation had difference in 1982–1990, 1990–2006, 2006–2015: the main climate factors were temperature and solar radiation, precipitation and temperature, precipitation and solar radiation (by the magnitude of the impact) for WL; and were solar radiation and precipitation, precipitation and temperature, precipitation and solar radiation for HCG. For MCG, they were precipitation and solar radiation, precipitation and temperature, precipitation and temperature. For LCG, they were solar radiation and temperature, precipitation and temperature, temperature and precipitation.

4. Discussion

Using GIMMS NDVI3g, meteorological station and climate reanalysis data, we evaluated vegetation changes in the northern China in recent 34 years, and analyzed the impact of climate factors on vegetation NDVI before and after the TP. Generally, the driving factors affecting vegetation growth include climate and non-climate factors, which are mainly human activities and natural disturbances [22], such as agricultural irrigation, afforestation, urbanization, pests and human disturbances [71,72,73,74]. Climate factors can provide necessary growth conditions for vegetation [22], and dominate vegetation change in large-scale areas, and restrict the geographical distribution of vegetation in a terrestrial ecosystems [32]. However, human activities can change vegetation growth in small areas in a short time, which has a significant impact on regional ecosystem functions [75,76]. At present, we only pay attention to the effects of three climatic factors on the growth of vegetation, and do not quantitatively evaluate the potential effects of human activities or natural disturbances on vegetation growth in different periods before and after the TP.
It is generally believed that climate warming has a positive impact on vegetation growth in high latitude areas of northern hemisphere, which is conducive to improving photosynthesis of vegetation and prolonging the length of growth season [77]. Similarly, Peng [78] also considered that temperature rise was the main reason for the increase of vegetation in northern China. However, the results of Wu [22] indicated that the vegetation growth at high northern latitudes were mainly affected by temperature and solar radiation from 1982 to 2008, which further confirmed the reliability of our results. On the long time series scale (1982–2015), the increase of vegetation greenness in high-latitude areas of northern China was mainly affected by temperature and solar radiation. However, the dominant climate factors that affect vegetation growth usually change over time, and this fact will be ignored in the overall analysis during the study period. The results show that the influence of solar radiation on vegetation growth increases gradually in the northern high latitude region, while the effect of temperature decreases gradually, which is opposite in plateau climate region.
Climate factors can promote or limit vegetation growth. In the plateau climate zone and humid area, excessive precipitation is not conducive to vegetation growth, because it caused lower temperature and insufficient sunshine time to inhibit vegetation photosynthesis [79]. When solar radiation exceeds the optimal amount for vegetation growth, the extra amount of solar radiation leads to a decrease of evapotranspiration, which has a negative impact on the growth of vegetation. In the northeastern part of the study area, temperature rise and precipitation increase triggered the significantly increase of NDVI in the growing season before the 1990s. However, after the 1990s, the increase of temperature and solar radiation, and the decrease of precipitation, matched the decrease of NDVI, which is consistent with the studies of Peng [78]. After 2006, with the sufficient precipitation and decrease of temperature and solar radiation, vegetation growth has been effectively improved, because precipitation can regulate soil moisture, thus affecting the root activity and water status of vegetation [78]. In addition, when the temperature is lower than the optimum temperature of photosynthesis, temperature rise will promote vegetation growth, but when the temperature is higher than the optimum temperature, vegetation photosynthesis will be inhibited, and the consumption of respiration and nutrients will be accelerated to limit vegetation growth [80]. From 1982 to 1990, the temperature increased and the solar radiation decreased in the plateau climate zone promoted vegetation growth (Figures S2 and S7), while the continuous increase of temperature in 1990–2006 exceeded the optimum temperature of photosynthesis and then restricted vegetation growth. The excessive temperature accelerated vegetation transpiration and the loss of soil water, partly offset the effect of precipitation increase in promoting vegetation growth. Many studies have shown that the solar radiation decreased obviously after the 1960s, and began to increase in the 1990s [81,82,83,84]. During 1982–1990, the possible reason why the decrease of solar radiation promoted the more active growth of vegetation may be that the solar radiation is higher than what is needed to support the growth of vegetation. There is a physiological reason for such a phenomenon. With the decrease of solar radiation, the stomatal conductance and photosynthesis rate of leaves continued to increase, and NDVI would increase accordingly [85]. This negative correlation between solar radiation and vegetation growth has also been found in other studies [21,86,87].
The response of vegetation growth to climate factors shows obvious geographical heterogeneity. The response of the same vegetation to climate factors will also change in different geographical locations. During 1982–2015, the woodland growth was mainly controlled by temperature, followed by precipitation in the study area (Table 4), but those in humid areas were more affected by temperature and solar radiation. The woodland in the sub-humid zone or sub-arid was mainly controlled by temperature and precipitation, but the difference of temperature or humidity zones can change the order of the dominant climate factors (Table S2). Generally, precipitation may play a dominant role in controlling the growth of grassland vegetation [75]. The response of grassland to climate factors was slightly different in different climatic zones. Grassland in B3-4 accounted for 38.32% of the total grassland area including HCG, MCG, and LCG, and its growth was mainly controlled by precipitation. The grassland in the plateau climate zones (D2-4) accounts for 30.02% of the total grassland area, and the dominant climate factor for its growth was temperature. However, the grassland in the warm temperate zone (C2, C4) accounted for 27.77% of the total grassland area, and its growth was mainly limited by temperature and precipitation (Table S2). These results describe the spatial pattern of climate driving factors of vegetation growth in northern China, and provide a reference for understanding the response of vegetation change to climate change.
In this study, we only used the single NDVIgs as the evaluation index, and did not analyze the response of vegetation to climate factors on annual average or seasonal average NDVI. In addition, the lag effect of vegetation response to climate change was not considered. In the study, the land cover data of multiple periods are used to obtain the unchanged land cover area in the study period, which can avoid the uncertainty of the relationship between vegetation and climate change caused by a single period land cover data. We focused on the change of vegetation growth in WL, HCG, MCG, and LCG, and did not analyze the transfer of four vegetation types in different periods. The unchanged land cover data reduced the spatial distribution of grassland and woodland to a certain extent, which may cover the fact that the LCG was transferred to the MCG and HCG, or the MCG and HCG degenerated into the LCG. In the future, we will focus on the first level land cover data to avoid this situation.

5. Conclusions

This study revealed the response of vegetation growth to dominant climate factors in northern China from 1982 to 2015, divided into three different periods formed by turning points, and ranked the importance of three climate factors to vegetation growth. From 1982 to 2015, vegetation growth was significantly improved, accounting for 74.64% of the total area, and 85.34%, 48.14%, and 68.78% of the total area in 1982–1990, 1990–2006 and 2006–2015, respectively.
The results show that the dominant climate factors of different vegetation or regions have changed over the past few decades. Overall, the climate driving factors of vegetation growth in the study area had gradually switched from solar radiation, temperature, and precipitation (1982–1990) to precipitation and temperature (1990–2015). For WL, HCG, MCG, LCG the dominant climate factors had changed from temperature and solar radiation to precipitation and solar radiation, from solar radiation and precipitation to precipitation, from precipitation and solar radiation to precipitation and temperature, from solar radiation to temperature and precipitation, respectively. The areas controlled by precipitation increased significantly, mainly distributed in arid, sub-arid, and sub-humid areas. The dominant climate factors of vegetation growth in the plateau climate zone or high-altitude area changed from solar radiation (1982–1990) to temperature and precipitation (1990–2006), and finally to temperature (2006–2015), while in cold temperate zone, it changed from temperature (1982–1990) to solar radiation (2006–2015). Piecewise linear regression can better describe the temporal process and explore the climate reasons of vegetation change. The results are helpful to understand the impact of climate factors on vegetation change in northern China, and have important guiding significance for vegetation protection and restoration under the background of global climate change.
In the future, we will consider the impact of terrain factors (such as altitude and slope) on the relationship between vegetation and climate change, and quantitatively evaluate the relative impact of human activities on vegetation change. At the same time, more climate data (such as soil moisture, evapotranspiration, and drought index) will be used to analyze the relationship between vegetation and climate change.

Supplementary Materials

The following are available online at https://www.mdpi.com/2072-4292/13/2/187/s1, Figure S1: Spatial distribution of the slopes of NDVIgs (a), temperature (b), precipitation (c), and solar radiation (d) in the growing season of the study area during 1982–1990. Figure S2. Spatial distribution of the significant levels of NDVIgs (a), temperature (b), precipitation (c), and solar radiation (d) in the growing season of the study area during 1982–1990. Figure S3. Spatial distribution of the slopes of NDVIgs (a), temperature (b), precipitation (c), and solar radiation (d) in the growing season of the study area during 1990–2006. Figure S4. Spatial distribution of the significant levels of NDVIgs (a), temperature (b), precipitation (c), and solar radiation (d) in the growing season of the study area during 1990–2006. Figure S5. Spatial distribution of the slopes of NDVIgs (a), temperature (b), precipitation (c), and solar radiation (d) in the growing season of the study area during 2006–2015. Figure S6. Spatial distribution of the significant levels of NDVIgs (a), temperature (b), precipitation (c), and solar radiation (d) in the growing season of the study area during 2006–2015. Figure S7. Spatial distributions of the PCCs between NDVIgs and temperature (a), precipitation (b) and solar radiation (c) and spatial pattern of dominant climate factors (d) in the study area from 1982 to 1990. Figure S8. Spatial distributions of the PCCs between NDVIgs and temperature (a), precipitation (b) and solar radiation (c) and spatial pattern of dominant climate factors (d) in the study area from 1990 to 2006. Figure S9. Spatial distributions of the PCCs between NDVIgs and temperature (a), precipitation (b) and solar radiation (c) and spatial pattern of dominant climate factors (d) in the study area from 2006 to 2015. Figure S10. The spatial distribution of the main control areas of three climate factors in different periods. Table S1. Statistical results of NDVIgs significance level of different land cover in different periods (%). Table S2. Statistics results of climatic factors for different vegetation in different climatic zones (%).

Author Contributions

R.S. processed the data, analyzed the results, and wrote the manuscript. R.S., S.C. and H.S. revised the manuscript. All authors have read and agreed to the published version of the manuscript.

Funding

This study was jointly supported by the National Natural Science Foundation of China (U2003105, 41671368), Open Research Fund of National Earth Observation Data Center (NODAOP2020003), National Key Research and Development Program of China (2017YFB0203101), Second Tibetan Plateau Scientific Expedition, and Research Program (2019QZKK1003), and Strategic Priority Research Program A of the Chinese Academy of Sciences (XDA20010301).

Institutional Review Board Statement

Not applicable.

Informed Consent Statement

Not applicable.

Data Availability Statement

Not applicable.

Acknowledgments

The authors thank the GIMMS group for providing the GIMMS NDVI3g data, the China Meteorological Data Service Center for providing the climate station data, the European Centre for Medium-Range Weather Forecasts for providing the Monthly solar radiation data, the Data Center for Resources and Environmental Sciences, Chinese Academy of Sciences for providing the land cover and Climate zone data.

Conflicts of Interest

The authors declare no conflict of interest.

References

  1. Hermance, J.F.; Augustine, D.J.; Derner, J.D. Quantifying characteristic growth dynamics in a semi-arid grassland ecosystem by predicting short-term NDVI phenology from daily rainfall: A simple four parameter coupled-reservoir model. Int. J. Remote Sens. 2015, 36, 5637–5663. [Google Scholar] [CrossRef]
  2. Best, R.J.; Stone, M.N.; Stachowicz, J.J. Predicting consequences of climate change for ecosystem functioning: Variation across trophic levels, species and individuals. Divers. Distrib. 2015, 21, 1364–1374. [Google Scholar] [CrossRef]
  3. Dai, A. Drought under global warming: A review. Wiley Interdiscip. Rev. Clim. Chang. 2011, 2, 45–65. [Google Scholar] [CrossRef] [Green Version]
  4. Jiang, L.; Jiapaer, G.; Bao, A.; Guo, H.; Ndayisaba, F. Vegetation dynamics and responses to climate change and human activities in Central Asia. Sci. Total Environ. 2017, 599, 967–980. [Google Scholar] [CrossRef] [PubMed]
  5. Liu, X.; Pan, Y.; Zhu, X.; Li, S. Spatiotemporal variation of vegetation coverage in Qinling-Daba Mountains in relation to environmental factors. Acta Geogr. Sin. 2015, 70, 705–716. [Google Scholar]
  6. Fu, B.; Wang, S.; Liu, Y.; Liu, J.; Liang, W.; Miao, C. Hydrogeomorphic Ecosystem Responses to Natural and Anthropogenic Changes in the Loess Plateau of China. Annu. Rev. Earth Planet. Sci. 2017, 45, 223–243. [Google Scholar] [CrossRef]
  7. Qu, S.; Wang, L.; Lin, A.; Zhu, H.; Yuan, M. What drives the vegetation restoration in Yangtze River basin, China: Climate change or anthropogenic factors? Ecol. Indic. 2018, 90, 438–450. [Google Scholar] [CrossRef]
  8. Huete, A. ECOLOGY Vegetation’s responses to climate variability. Nature 2016, 531, 181–182. [Google Scholar] [CrossRef]
  9. Li, J.; Peng, S.; Li, Z. Detecting and attributing vegetation changes on China’s Loess Plateau. Agric. For. Meteorol. 2017, 247, 260–270. [Google Scholar] [CrossRef]
  10. Cai, H.; Yang, X.; Xu, X. Human-induced grassland degradation/restoration in the central Tibetan Plateau: The effects of ecological protection and restoration projects. Ecol. Eng. 2015, 83, 112–119. [Google Scholar] [CrossRef]
  11. Aredehey, G.; Mezgebu, A.; Girma, A. Land-use land-cover classification analysis of Giba catchment using hyper temporal MODIS NDVI satellite images. Int. J. Remote Sens. 2018, 39, 810–821. [Google Scholar] [CrossRef]
  12. Sun, W.; Wang, Y.; Fu, Y.H.; Xue, B.; Wang, G.; Yu, J.; Zuo, D.; Xu, Z. Spatial heterogeneity of changes in vegetation growth and their driving forces based on satellite observations of the Yarlung Zangbo River Basin in the Tibetan Plateau. J. Hydrol. 2019, 574, 324–332. [Google Scholar] [CrossRef]
  13. Myneni, R.B.; Keeling, C.D.; Tucker, C.J.; Asrar, G.; Nemani, R.R. Increased plant growth in the northern high latitudes from 1981 to 1991. Nature 1997, 386, 698–702. [Google Scholar] [CrossRef]
  14. Pan, N.; Feng, X.; Fu, B.; Wang, S.; Ji, F.; Pan, S. Increasing global vegetation browning hidden in overall vegetation greening: Insights from time-varying trends. Remote Sens. Environ. 2018, 214, 59–72. [Google Scholar] [CrossRef]
  15. Zhang, Z.; Chang, J.; Xu, C.-Y.; Zhou, Y.; Wu, Y.; Chen, X.; Jiang, S.; Duan, Z. The response of lake area and vegetation cover variations to climate change over the Qinghai-Tibetan Plateau during the past 30 years. Sci. Total Environ. 2018, 635, 443–451. [Google Scholar] [CrossRef] [PubMed]
  16. Kong, D.; Zhang, Q.; Singh, V.P.; Shi, P. Seasonal vegetation response to climate change in the Northern Hemisphere (1982-2013). Glob. Planet. Chang. 2017, 148, 1–8. [Google Scholar] [CrossRef] [Green Version]
  17. He, B.; Chen, A.; Wang, H.; Wang, Q. Dynamic Response of Satellite-Derived Vegetation Growth to Climate Change in the Three North Shelter Forest Region in China. Remote Sens. 2015, 7, 9998–10016. [Google Scholar] [CrossRef] [Green Version]
  18. Wang, H.; Liu, D.; Lin, H.; Montenegro, A.; Zhu, X. NDVI and vegetation phenology dynamics under the influence of sunshine duration on the Tibetan plateau. Int. J. Climatol. 2015, 35, 687–698. [Google Scholar] [CrossRef]
  19. Craine, J.M.; Nippert, J.B.; Elmore, A.J.; Skibbe, A.M.; Hutchinson, S.L.; Brunsell, N.A. Timing of climate variability and grassland productivity. Proc. Natl. Acad. Sci. USA 2012, 109, 3401–3405. [Google Scholar] [CrossRef] [Green Version]
  20. Xue, Y.; Zhang, B.; He, C.; Shao, R. Detecting Vegetation Variations and Main Drivers over the Agropastoral Ecotone of Northern China through the Ensemble Empirical Mode Decomposition Method. Remote Sens. 2019, 11, 1860. [Google Scholar] [CrossRef] [Green Version]
  21. Qu, S.; Wang, L.; Lin, A.; Yu, D.; Yuan, M. Distinguishing the impacts of climate change and anthropogenic factors on vegetation dynamics in the Yangtze River Basin, China. Ecol. Indic. 2020, 108, 105724. [Google Scholar] [CrossRef]
  22. Wu, D.; Zhao, X.; Liang, S.; Zhou, T.; Huang, K.; Tang, B.; Zhao, W. Time-lag effects of global vegetation responses to climate change. Glob. Chang. Biol. 2015, 21, 3520–3531. [Google Scholar] [CrossRef] [PubMed]
  23. Li, L.; Zhang, Y.; Liu, L.; Wu, J.; Wang, Z.; Li, S.; Zhang, H.; Zu, J.; Ding, M.; Paudel, B. Spatiotemporal Patterns of Vegetation Greenness Change and Associated Climatic and Anthropogenic Drivers on the Tibetan Plateau during 2000–2015. Remote Sens. 2018, 10, 1525. [Google Scholar] [CrossRef] [Green Version]
  24. Wang, X.; Piao, S.; Ciais, P.; Li, J.; Friedlingstein, P.; Koven, C.; Chen, A. Spring temperature change and its implication in the change of vegetation growth in North America from 1982 to 2006. Proc. Natl. Acad. Sci. USA 2011, 108, 1240–1245. [Google Scholar] [CrossRef] [PubMed] [Green Version]
  25. Cong, N.; Shen, M.; Yang, W.; Yang, Z.; Zhang, G.; Piao, S. Varying responses of vegetation activity to climate changes on the Tibetan Plateau grassland. Int. J. Biometeorol. 2017, 61, 1433–1444. [Google Scholar] [CrossRef] [PubMed]
  26. Hua, T.; Wang, X. Temporal and Spatial Variations in the Climate Controls of Vegetation Dynamics on the Tibetan Plateau during 1982–2011. Adv. Atmos. Sci. 2018, 35, 1337–1346. [Google Scholar] [CrossRef]
  27. Sun, R.; Chen, S.; Su, H.; Hao, G. Spatiotemporal variation of vegetation coverage and its response to climate change before and after implementation of Grain for Green Project in the Loess Plateau. In Proceedings of the 2019 Ieee International Geoscience and Remote Sensing Symposium, Yokohama, Japan, 28 July–2 August 2019; pp. 9546–9549. [Google Scholar]
  28. Liu, Z.; Qiu, B.; Wang, Z.; Qi, W. Temporal and spatial variation analysis of vegetation cover in the Loess Plateau from 2001 to 2014. Remote Sens. Land Resour. 2017, 29, 192–198. [Google Scholar]
  29. Xu, G.; Zhang, J.; Li, P.; Li, Z.; Lu, K.; Wang, X.; Wang, F.; Cheng, Y.; Wang, B. Vegetation restoration projects and their influence on runoff and sediment in China. Ecol. Indic. 2018, 95, 233–241. [Google Scholar] [CrossRef]
  30. Li, G.; Sun, S.; Han, J.; Yan, J.; Liu, W.; Wei, Y.; Lu, N.; Sun, Y. Impacts of Chinese Grain for Green program and climate change on vegetation in the Loess Plateau during 1982–2015. Sci. Total Environ. 2019, 660, 177–187. [Google Scholar] [CrossRef] [PubMed]
  31. Liu, X.; Tian, Z.; Zhang, A.; Zhao, A.; Liu, H. Impacts of Climate on Spatiotemporal Variations in Vegetation NDVI from 1982–2015 in Inner Mongolia, China. Sustainability 2019, 11, 768. [Google Scholar] [CrossRef] [Green Version]
  32. Hu, Y.; Dao, R.; Hu, Y. Vegetation Change and Driving Factors: Contribution Analysis in the Loess Plateau of China during 2000–2015. Sustainability 2019, 11, 1320. [Google Scholar] [CrossRef] [Green Version]
  33. Liu, Y.; Li, L.; Chen, X.; Zhang, R.; Yang, J. Temporal-spatial variations and influencing factors of vegetation cover in Xinjiang from 1982 to 2013 based on GIMMS-NDVI3g. Glob. Planet. Chang. 2018, 169, 145–155. [Google Scholar] [CrossRef]
  34. Xu, Y.; Yang, J.; Chen, Y. NDVI-based vegetation responses to climate change in an arid area of China. Theor. Appl. Climatol. 2016, 126, 213–222. [Google Scholar] [CrossRef]
  35. Yu, X.; Yan, Q.; Liu, Z.; Xi, L.; Wang, Y. Quantitative Estimation and Dynamic Changes of Vegetation Fractional Coverage in The Sanjiangyuan Region. Resour. Environ. Yangtze Basin 2013, 22, 66–74. [Google Scholar]
  36. Fassnacht, F.E.; Schiller, C.; Qu, J.; Kattenborn, T.; Zhao, X. Modis-based Grassland Trends within and Around the Kekexili Core Protection Zone of the Sanjiangyuan Nature Reserve. In Proceedings of the Igarss 2018-2018 IEEE International Geoscience and Remote Sensing Symposium, Valencia, Spain, 22–27 July 2018; pp. 2880–2882. [Google Scholar]
  37. Luo, N.; Mao, D.; Wen, B.; Liu, X. Climate Change Affected Vegetation Dynamics in the Northern Xinjiang of China: Evaluation by SPEI and NDVI. Land 2020, 9, 90. [Google Scholar] [CrossRef] [Green Version]
  38. Jiang, H.; Xu, X.; Guan, M.; Wang, L.; Huang, Y.; Jiang, Y. Determining the contributions of climate change and human activities to vegetation dynamics in agro-pastural transitional zone of northern China from 2000 to 2015. Sci. Total Environ. 2020, 718, 134871. [Google Scholar] [CrossRef]
  39. Li, K.; Tong, Z.; Liu, X.; Zhang, J.; Tong, S. Quantitative assessment and driving force analysis of vegetation drought risk to climate change:Methodology and application in Northeast China. Agric. For. Meteorol. 2020, 282, 107865. [Google Scholar] [CrossRef]
  40. Liang, C.; Chen, T.; Dolman, H.; Shi, T.; Wei, X.; Xu, J.; Hagan, D.F.T. Drying and Wetting Trends and Vegetation Covariations in the Drylands of China. Water 2020, 12, 933. [Google Scholar] [CrossRef] [Green Version]
  41. Li, J.; Li, Z.; Lu, Z. Analysis of spatiotemporal variations in land use on the Loess Plateau of China during 1986–2010. Environ. Earth Sci. 2016, 75, 997. [Google Scholar] [CrossRef]
  42. Sun, W.; Song, X.; Mu, X.; Gao, P.; Wang, F.; Zhao, G. Spatiotemporal vegetation cover variations associated with climate change and ecological restoration in the Loess Plateau. Agric. For. Meteorol. 2015, 209, 87–99. [Google Scholar] [CrossRef]
  43. Zheng, J.; Yin, Y.; Li, B. A New Scheme for Climate Regionalization in China. Acta Geogr. Sin. 2010, 65, 3–12. [Google Scholar]
  44. Wang, S.; Mo, X.; Liu, Z.; Baig, M.H.A.; Chi, W. Understanding long-term (1982–2013) patterns and trends in winter wheat spring green-up date over the North China Plain. Int. J. Appl. Earth Obs. Geoinf. 2017, 57, 235–244. [Google Scholar] [CrossRef]
  45. Holben, B.N. Characteristics of Maximum-value Composite Images from Temporal Avhrr Data. Int. J. Remote Sens. 1986, 7, 1417–1434. [Google Scholar] [CrossRef]
  46. Zhou, L.M.; Tucker, C.J.; Kaufmann, R.K.; Slayback, D.; Shabanov, N.V.; Myneni, R.B. Variations in northern vegetation activity inferred from satellite data of vegetation index during 1981 to 1999. J. Geophys. Res. Atmos. 2001, 106, 20069–20083. [Google Scholar] [CrossRef]
  47. Du, Z.; Zhao, J.; Liu, X.; Wu, Z.; Zhang, H. Recent asymmetric warming trends of daytime versus nighttime and their linkages with vegetation greenness in temperate China. Environ. Sci. Pollut. Res. 2019, 26, 35717–35727. [Google Scholar] [CrossRef]
  48. Hutchinson, M.F. Interpolating mean rainfall using thin plate smoothing splines. Int. J. Geogr. Inf. Syst. 1995, 9, 385–403. [Google Scholar] [CrossRef]
  49. Liu, H.; Zhang, M.; Lin, Z.; Xu, X. Spatial heterogeneity of the relationship between vegetation dynamics and climate change and their driving forces at multiple time scales in Southwest China. Agric. For. Meteorol. 2018, 256, 10–21. [Google Scholar] [CrossRef]
  50. Liu, Z.; Liu, Y. Does Anthropogenic Land Use Change Play a Role in Changes of Precipitation Frequency and Intensity over the Loess Plateau of China? Remote Sens. 2018, 10, 1818. [Google Scholar] [CrossRef] [Green Version]
  51. Liu, J.; Kuang, W.; Zhang, Z.; Xu, X.; Qin, Y.; Ning, J.; Zhou, W.; Zhang, S.; Li, R.; Yan, C.; et al. Spatiotemporal characteristics, patterns and causes of land use changes in China since the late 1980s. Acta Geogr. Sin. 2014, 69, 3–14. [Google Scholar] [CrossRef]
  52. Sen, P.K. Estimates of Regression Coefficient Based on Kendall’s Tau. J. Am. Stat. Assoc. 1968, 63, 1379–1389. [Google Scholar] [CrossRef]
  53. Mann, H.B. Nonparametric tests against trend. Econometrica 1945, 13, 245–259. [Google Scholar] [CrossRef]
  54. Kendall, M.G. Rank Correlation Methods; Griffin: London, UK, 1957; p. 298. [Google Scholar]
  55. Fathian, F.; Dehghan, Z.; Bazrkar, M.H.; Eslamian, S. Trends in hydrological and climatic variables affected by four variations of the Mann-Kendall approach in Urmia Lake basin, Iran. Hydrol. Sci. J. J. Des Sci. Hydrol. 2016, 61, 892–904. [Google Scholar] [CrossRef] [Green Version]
  56. Gocic, M.; Trajkovic, S. Analysis of changes in meteorological variables using Mann-Kendall and Sen’s slope estimator statistical tests in Serbia. Glob. Planet. Chang. 2013, 100, 172–182. [Google Scholar] [CrossRef]
  57. Zhao, A.; Zhang, A.; Liu, H.; Liu, Y.; Wang, H.; Wang, D. Spatiotemporal Variation of Vegetation Coverage before and after Implementation of Grain for Green Project in the Loess Plateau. J. Nat. Resour. 2017, 32, 449–460. [Google Scholar]
  58. Yi, L.; Ren, Z.; Zhang, C.; Liu, W. Vegetation Cover, Climate and Human Activities on the Loess Plateau. Resour. Sci. 2014, 36, 166–174. [Google Scholar]
  59. Fensholt, R.; Langanke, T.; Rasmussen, K.; Reenberg, A.; Prince, S.D.; Tucker, C.; Scholes, R.J.; Le, Q.B.; Bondeau, A.; Eastman, R.; et al. Greenness in semi-arid areas across the globe 1981–2007—An Earth Observing Satellite based analysis of trends and drivers. Remote Sens. Environ. 2012, 121, 144–158. [Google Scholar] [CrossRef]
  60. Wang, M.; Li, G.; Wang, J.; Sun, X.; Guo, Z. Spatio-Temporal Variation of the Net Primary Production in Indian and Their Relationships to Climate Factors. J. Geo-Inf. Sci. 2015, 17, 1355–1361. [Google Scholar]
  61. Hao, Y.H.; Cao, B.B.; Chen, X.; Yin, J.; Sun, R.L.; Yeh, T.C.J. A Piecewise Grey System Model for Study the Effects of Anthropogenic Activities on Karst Hydrological Processes. Water Resour. Manag. 2013, 27, 1207–1220. [Google Scholar] [CrossRef]
  62. Wang, S.; Lei, H.; Duan, L.; Liu, T.; Yang, D. Attribution of the vegetation trends in a typical desertified watershed of northeast China over the past three decades. Ecohydrology 2016, 9, 1566–1579. [Google Scholar] [CrossRef]
  63. Zhang, Y.; Gao, J.; Liu, L.; Wang, Z.; Ding, M.; Yang, X. NDVI-based vegetation changes and their responses to climate change from 1982 to 2011: A case study in the Koshi River Basin in the middle Himalayas. Glob. Planet. Chang. 2013, 108, 139–148. [Google Scholar] [CrossRef]
  64. Sun, L.; Li, Q.; Chen, J.; Niu, J. Seasonal changes in vegetation response to precipitation across eco-regions over Eurasia. Acta Ecol. Sin. 2018, 38, 8051–8059. [Google Scholar]
  65. Ma, L.; Qin, F.; Sun, J.; Wang, H.; Xia, H. Diurnal asymmetry of temperature and its effect on NDVI in Loess Plateau. Resour. Sci. 2018, 40, 1684–1692. [Google Scholar]
  66. Wu, L.; Wang, S.; Bai, X.; Tian, Y.; Luo, G.; Wang, J.; Li, Q.; Chen, F.; Deng, Y.; Yang, Y.; et al. Climate change weakens the positive effect of human activities on karst vegetation productivity restoration in southern China. Ecol. Indic. 2020, 115, 106392. [Google Scholar] [CrossRef]
  67. Sun, R.; Chen, S.; Su, H. Spatiotemporal variations of NDVI of different land cover types on the Loess Plateau from 2000 to 2016. Prog. Geogr. 2019, 38, 1248–1258. [Google Scholar] [CrossRef] [Green Version]
  68. Liu, Y.; Li, C.; Liu, Z.; Deng, X. Assessment of spatio-temporal variations in vegetation cover in Xinjiang from 1982 to 2013 based on GIMMS-NDVI. Acta Ecol. Sin. 2016, 36, 6198–6208. [Google Scholar]
  69. Deng, X.; Yao, J.; Liu, Z. Spatiotemporal Dynamic Change of Vegetation Coverage in Arid Regions in Central Asia Based on GIMMS NDVI. Arid Zone Res. 2017, 34, 10–19. [Google Scholar]
  70. Cao, R.; Jiang, W.; Yuan, L.; Wang, W.; Lv, Z.; Chen, Z. Inter-annual variations in vegetation and their response to climatic factors in the upper catchments of the Yellow River from 2000 to 2010. J. Geogr. Sci. 2014, 24, 963–979. [Google Scholar] [CrossRef] [Green Version]
  71. Li, D.; Luo, H.; Hu, T.; Shao, D.; Cui, Y.; Khan, S.; Luo, Y. Identification of the Roles of Climate Factors, Engineering Construction, and Agricultural Practices in Vegetation Dynamics in the Lhasa River Basin, Tibetan Plateau. Remote Sens. 2020, 12, 1883. [Google Scholar] [CrossRef]
  72. Zhao, H.; Tan, J.; Ren, Z.; Wang, Z. Spatiotemporal Characteristics of Urban Surface Temperature and Its Relationship with Landscape Metrics and Vegetation Cover in Rapid Urbanization Region. Complexity 2020, 2020. [Google Scholar] [CrossRef]
  73. Hu, T.; Li, X.; Gong, P.; Yu, W.; Huang, X. Evaluating the effect of plain afforestation project and future spatial suitability in Beijing. Sci. China-Earth Sci. 2020. [Google Scholar] [CrossRef]
  74. Vedrova, E.F.; Mukhortova, L.V.; Ivanov, V.V.; Krivobokov, L.V.; Boloneva, M.V. Post-logging organic matter recovery in forest ecosystems of eastern Baikal region. Biol. Bull. 2010, 37, 69–79. [Google Scholar] [CrossRef]
  75. Wang, H.; Yao, F.; Zhu, H.; Zhao, Y. Spatiotemporal Variation of Vegetation Coverage and Its Response to Climate Factors and Human Activities in Arid and Semi-Arid Areas: Case Study of the Otindag Sandy Land in China. Sustainability 2020, 12, 5214. [Google Scholar] [CrossRef]
  76. Batunacun; Nendel, C.; Hu, Y.; Lakes, T. Land-use change and land degradation on the Mongolian Plateau from 1975 to 2015-A case study from Xilingol, China. Land Degrad. Dev. 2018, 29, 1595–1606. [Google Scholar] [CrossRef]
  77. Jeong, S.-J.; Ho, C.-H.; Gim, H.-J.; Brown, M.E. Phenology shifts at start vs. end of growing season in temperate vegetation over the Northern Hemisphere for the period 1982–2008. Glob. Chang. Biol. 2011, 17, 2385–2399. [Google Scholar] [CrossRef]
  78. Peng, S.; Chen, A.; Xu, L.; Cao, C.; Fang, J.; Myneni, R.B.; Pinzon, J.E.; Tucker, C.J.; Piao, S. Recent change of vegetation growth trend in China. Environ. Res. Lett. 2011, 6. [Google Scholar] [CrossRef]
  79. Sun, R.; Chen, S.; Su, H. Spatiotemporal variation of NDVI in different ecotypes on the Loess Plateau and its response to climate change. Geogr. Res. 2020, 39, 1200–1214. [Google Scholar]
  80. Jiao, K.; Gao, J.; Wu, S. Climatic determinants impacting the distribution of greenness in China: Regional differentiation and spatial variability. Int. J. Biometeorol. 2019, 63, 523–533. [Google Scholar] [CrossRef]
  81. Wild, M.; Gilgen, H.; Roesch, A.; Ohmura, A.; Long, C.N.; Dutton, E.G.; Forgan, B.; Kallis, A.; Russak, V.; Tsvetkov, A. From dimming to brightening: Decadal changes in solar radiation at Earth’s surface. Science 2005, 308, 847–850. [Google Scholar] [CrossRef] [Green Version]
  82. Sanchez-Lorenzo, A.; Enriquez-Alonso, A.; Wild, M.; Trentmann, J.; Vicente-Serrano, S.M.; Sanchez-Romero, A.; Posselt, R.; Hakuba, M.Z. Trends in downward surface solar radiation from satellites and ground observations over Europe during 1983–2010. Remote Sens. Environ. 2017, 189, 108–117. [Google Scholar] [CrossRef] [Green Version]
  83. Qi, Y.; Fang, S.-B.; Zhou, W.-Z. Correlative analysis between the changes of surface solar radiation and its relationship with air pollution, as well as meteorological factor in East and West China in recent 50 years. Acta Phys. Sin. 2015, 64. [Google Scholar] [CrossRef]
  84. Qi, Y.; Fang, S.; Zhou, W. Variation and spatial distribution of surface solar radiation in China over recent 50 years. Acta Ecol. Sin. 2014, 34, 7444–7453. [Google Scholar]
  85. Zhang, Z.; Lan, Y.; Zheng, Y.; Chen, L.; Song, P. Multiple regression analysis of soybean NDVI affected by meteorological factors. Trans. Chin. Soc. Agric. Eng. 2015, 31, 188–193. [Google Scholar]
  86. Zhang, Y.; Zhu, Z.; Liu, Z.; Zeng, Z.; Ciais, P.; Huang, M.; Liu, Y.; Piao, S. Seasonal and interannual changes in vegetation activity of tropical forests in Southeast Asia. Agric. For. Meteorol. 2016, 224, 1–10. [Google Scholar] [CrossRef]
  87. Zhang, Y.; Zhang, C.; Wang, Z.; Chen, Y.; Gang, C.; An, R.; Li, J. Vegetation dynamics and its driving forces from climate change and human activities in the Three-River Source Region, China from 1982 to 2012. Sci. Total Environ. 2016, 563, 210–220. [Google Scholar] [CrossRef] [PubMed]
Figure 1. Elevation and climate zone in the study area (a); distribution of unchanged land cover from 1980 to 2015 (b).
Remotesensing 13 00187 g001
Figure 2. Flow chart of the Normalized Difference Vegetation Index (NDVI) analysis methods and processes.
Remotesensing 13 00187 g002
Figure 3. The spatial distribution of the multi-year mean NDVIgs (a) and its coefficient of variation (CV) (b) in the study area from 1982 to 2015.
Remotesensing 13 00187 g003
Figure 4. Inter-annual variations of NDVIgs, temperature, precipitation and solar radiation in the growing season of the study area. Black, red, blue, and magenta solid lines indicate fitting curve during 1982–2015, 1982–1990, 1990–2006, and 2006–2015, respectively.
Remotesensing 13 00187 g004
Figure 5. Spatial distribution of the slopes of NDVIgs (a), temperature (b), precipitation (c), and solar radiation (d) in the growing season of the study area during 1982–2015.
Remotesensing 13 00187 g005
Figure 6. Spatial distribution of the significant levels of NDVIgs (a), temperature (b), precipitation (c), and solar radiation (d) in the growing season of the study area during 1982–2015.
Remotesensing 13 00187 g006
Figure 7. Spatial distributions of the partial correlation coefficients (PCCs) between NDVIgs and temperature (a), precipitation (b), and solar radiation (c) and spatial pattern of dominant climate factors (d) in the study area, from 1982 to 2015. Note: Tem, Pre, and SR refer to temperature, precipitation, and solar radiation, respectively.
Remotesensing 13 00187 g007
Table 1. Detailed information on 11 climate zones in the study area.
CodeClimate ConditionCodeClimate Condition
A1Cold-temperate humid zoneC4Warm temperate arid zone
B1Middle temperate humid zoneD2Plateau climate sub-humid zone
B2Middle temperate sub-humid zoneD3Plateau climate sub-arid zone
B3Middle temperate sub-arid zoneD4Plateau climate arid zone
B4Middle temperate arid zoneE1Subtropical humid zone
C2Warm temperate sub-humid zone
Table 2. Area statistics of NDVIgs and climate factors at different significance levels. (%).
Level1982–20151982–19901990–20062006–2015
NDVI 3Tem 4Pre 5SR 6NDVITemPreSRNDVITemPreSRNDVITemPreSR
1 p < 0.013.300.000.021.830.050.000.003.822.810.004.620.000.500.580.000.27
p < 0.052.780.000.993.220.220.000.5916.045.050.019.310.002.056.630.006.41
p > 0.0519.280.5444.8524.8114.3913.5035.5556.2644.002.6035.9915.9128.6782.3720.9864.98
2 p > 0.0530.842.5847.3442.5571.6578.3963.7823.8841.2022.5147.5860.7452.0910.4265.8628.32
p < 0.0510.083.435.4718.4710.835.810.080.004.3732.972.2114.5511.880.0011.510.02
p < 0.0133.7293.451.339.122.862.300.000.002.5741.910.298.804.810.001.650.00
1, ↑ 2, NDVI 3, Tem 4, Pre 5 and SR 6 refer to decreased, increased, NDVIgs, temperature, precipitation and solar radiation, respectively, and 0.01, 0.05 represent the significance levels.
Table 3. Statistics of PCC between NDVIgs and three climatic factors in different periods.
1982–20151982–19901990–20062006–2015
RTemRPreRSRRTemRPreRSRRTemRPreRSRRTemRPreRSR
Average value0.1750.1980.0030.0980.061−0.1480.0600.161−0.0210.0200.2270.023
Pixel value > 0 (%)76.2175.5052.4459.9155.0638.0558.2369.0447.5550.4074.2752.35
p < 0.01 (%)14.6118.982.871.361.642.972.764.910.881.881.770.81
p < 0.05 (%)14.3515.116.385.925.727.146.479.323.335.057.003.37
RTem, RPre, RSR represent the partial correlation coefficients of NDVIgs with temperature, precipitation, and solar radiation, respectively.
Table 4. Area percentage of vegetation controlled by different climate factors in different land cover types (%).
Land Cover1982–20151982–19901990–20062006–2015
TemPreSRTemPreSRTemPreSRTemPreSR
WL39.5833.4227.0040.0822.4537.4735.0835.4029.5225.3141.8032.90
HCG28.6852.0719.2527.6232.9039.4827.7147.5124.7824.7246.6528.63
MCG32.0652.2015.7327.9236.1635.9232.4146.3821.2133.2348.1318.64
LCG46.2138.2315.5529.8229.8040.3839.0139.8021.1841.5038.4520.05
ALL37.2944.0818.6330.8230.7538.4234.0042.4023.6032.4643.4924.05
Publisher’s Note: MDPI stays neutral with regard to jurisdictional claims in published maps and institutional affiliations.

