Article

Solar Radiation Climatology in Camagüey, Cuba (1981–2016)

by
Juan Carlos Antuña-Sánchez
1,*,
René Estevan
2,
Roberto Román
1,
Juan Carlos Antuña-Marrero
1,
Victoria E. Cachorro
1,
Albeth Rodríguez Vega
3 and
Ángel M. de Frutos
1
1
Atmospheric Optics Group (GOA), Valladolid University, 47011 Valladolid, Spain
2
Geophysical Institute of Peru, 15012 Lima, Peru
3
Atmospheric Optics Group of Camagüey, Meteorological Institute of Cuba, 70100 Camagüey, Cuba
*
Author to whom correspondence should be addressed.
Remote Sens. 2021, 13(2), 169; https://doi.org/10.3390/rs13020169
Submission received: 2 December 2020 / Revised: 1 January 2021 / Accepted: 3 January 2021 / Published: 6 January 2021
(This article belongs to the Special Issue Remote Sensing of Cloud and Aerosol Effects on Solar Radiation)

Abstract

:
The transition to renewable energies is an unavoidable step to guarantee a peaceful and sustainable future for humankind. Although solar radiation is one of the main sources of renewable energy, there are broad regions of the planet where it has not been characterized appropriately to provide the necessary information for regional and local planning and design of the different solar powered systems. The Caribbean, and Cuba in particular, lacked until very recently at least one long-term series of surface solar radiation measurements. Here we present the first long-term records of solar radiation for this region. Solar radiation measurements manually conducted and recorded on paper were rescued, reprocessed and quality controlled to develop the solar radiation climatology at the Actinometrical Station of Camagüey, in Cuba (21.422 ° N; 77.850 ° W; 122 m a.s.l.) for the period 1981–2016. The diurnal cycle based on the average hourly values of the global, direct and diffuse horizontal variables for the entire period have been determined and analyzed showing the dependence on solar zenith angle (SZA) and clouds. The annual cycle of global solar component given by the mean monthly daily values presents two maxima, one in April and another one in July with values of 5.06 and 4.91 kWh m 2 , respectively (18.23 and 17.67 MJ m 2 per day for insolation), and the minimum in December (3.15 kWh m 2 or 11.33 MJ m 2 ). The maxima are governed by the direct solar components and are modulated by cloudiness. Both, diurnal and annual cycles of the diffuse solar component show a smoothed bell shaped behavior. In general solar radiation at this station presents a strong influence of clouds, with little seasonal variation but with higher values during the rainy season. Daily global radiation annual averages showed its maximum value in the year 1983, with 17.45 MJ m 2 explained by very low cloudiness this year, and the minimum value was reported in 2009 with a value of 12.43 MJ m 2 that could not explained by the cloud coverage or the aerosols optical depths registered that year. The effects of the 1982 El Chichón and 1991 Mount Pinatubo volcanic eruptions on the solar radiation variables at Camagüey are also shown and discussed. The results achieved in this study shown the characteristics of solar radiation in this area and their potential for solar power applications.

1. Introduction

The solar radiation reaching the Earth’s surface is a topic of interest at global, regional and local levels, due to the role it plays on the energy balance of the earth-atmosphere system [1]. It is the main source of energy with dominant influence on the weather, climate, and in the mechanisms and effects associated with climate change [2]. The amount of solar radiation reaching the surface also impacts agriculture-forestry, hydrology, ecology, and many other human activities. Solar energy is seen from at least four decades as an alternative, renewable and non-polluting energy source, these characteristics make it a key element today as one of the absolutely necessary sources of clean energy for the current and future period of decarbonisation [3].
The use of solar energy-derived production has been increasing all over the world in the last decades [4] as assessed by recent reports [5] which show a growing number of solar radiation applications in the energy sector. Worldwide, the concentrating solar thermal power production in 2018 increased to 5.5 GW with respect to the 4.9 GW generated the year before. At the same scale, the highest increase in 2018 occurred in photovoltaic energy; 1000 GW with respect to 405 GW generated in 2017, the highest annual rate of increase ever recorded. A recent assessment of the solar energy potential at global scale, using solar radiation satellite measurements and numerical model simulations outputs, determined Cuba and in particular the Camagüey region have and excellent solar potential both for the global horizontal and the direct normal irradiances [6]. The results from the present study provide the information for a more realistic assessment of the solar energy potential in the Camagüey region and in Cuba.
Most of surface solar radiation data are carried out by regional networks depending on the National Meteorological Services, although other networks are under the management of different institutions or centers, aimed at interest such as research, agricultural, ecology, solar energy, or other applications, etc. Despite the advances in the observations of solar radiation variables with remote sensing and surface-based instruments, there are regions in the world where there are no high-quality, long term measured data on solar surface radiation. Anyway, surface observations of solar radiation remain the recognized standard to be compared to other solar radiation data-base. For example, to cover wide areas on the Earth lacking of solar radiation data, these are supplied by satellite sensors [7,8,9], but these data can not be directly measured from the space and the algorithms for their derivation present different problems. The signal registered by the instruments onboard satellites is the solar radiation reflected by the surface and modulated by the atmospheric radiative transfer processes from the surface to the space, requiring the signal to be corrected. These corrections make use of radiative transfer models or empirical relations, which introduce high and variables uncertainties. These uncertainties are the reasons why the state-of-art-satellite-produced surface solar radiation data does not fully agree with surface observations [10,11]. In this context, research on solar radiation employing very different methodologies for its estimation and forecasting is increasing every day [12]. Areas such as the Great Caribbean have an enormous solar potential but few data are today available, mainly surface measurements [1]. Therefore, analysis of existing surface data is of great interest in order to characterize solar radiation components and to know the potential of solar energy availability, mainly due to the great influence of clouds in this area.
A solar radiation data rescue project in Cuba was conducted, by the Grupo de Óptica Atmosférica de Camagüey [13,14], which maximized the use of the limited available resources and the local scientific expertise capacity in order to rescue and reconstruct the 36 years of surface solar radiation observations recorded at Camagüey (Cuba) [13]. Here, one of four existing series of surface solar radiation observations in Cuba dating back more than 30 years with still ongoing manual measurements with the same instrumental technology and methodology is analyzed (see details in Antuña et al. [13]).
The main objective of this work is to analyze the recovered solar radiation data series in the actinometric station of Camagüey during the period 1981–2016 to obtain the characterization of solar radiation and its modulators that lead to establishing its climatology. The present paper is structured as follows: Section 2 presents the main characteristics of the instrumentation and measurements, Section 3 analyzes the solar radiation database in detail showing the obtained results and Section 4 summarizes the main conclusions.

2. Instrumentation and Data

2.1. Instrumentation

The solar radiation station of Camagüey, Cuba (21.422 ° N; 77.850 ° W; 122 m a.s.l.) is operated by the Meteorology Institute of Cuba. The solar radiation measurements at Camagüey, located in the eastern section of the Cuba Island, are obtained from a manually operated actinometric Yanishevsky station, which was provided by the Hydrometeorological Service of the former Soviet Union, and operates based on the thermoelectric principle. The instruments of these stations are pyrheliometers model M-3 for direct normal irradiance (DNI) measurements and pyranometers models M-80-M and M-115-M for global horizontal (GHI) and diffuse horizontal irradiance (DHI). The direct normal irradiance on a horizontal surface (NHI) is obtained by multiplying the DNI by the cosine of the solar zenith angle (SZA). GSA-1MA and GSA-1MB galvanometers are used to record the electrical signals from the sensors [15]. Measurements are manually taken every hour from sunrise to sunset (more detail about measurements can be seen in Antuña et al. [13]). It must be noted that these solar radiation records are instantaneous values, given as irradiance data in Wm 2 , measured every hour during the day. Hence, they are not mean hourly values but we will consider them as such and refer to them as hourly data, because the measured data has been assumed to be constant for one hour around the measurement time, allowing the data to be converted to irradiation/insolation values. Thus, the measured solar irradiances values are transformed to energy unit (J or kWh) by its integration to a defined time interval, as for example the mentioned constant hour, or a day, to determine in the latter case the daytime insolation in MJ m 2 per day [16] and named GHIn, NHIn and DHIn.
The Soviet methodology used in the Yanishevsky stations for measuring solar radiation variables at the surface “used as the regular value for GHI” is the one calculated by the sum of NHI and DHI measured by the pyrheliometer and the shadowed pyranometer respectively. In the cases when no clouds are present in the line of sight between the pyrheliometer, to within a region of 5 ° around the sun, GHI is measured with the pyranometer (GHIm). Then the pairs of values of GHI and GHIm are used for the quality control of the GHI has been reported [16]. Recently it has been reported the application of the cited quality control procedure to the 1981–2016 series of GHI values [17]. The results showed similarity between the absolute magnitudes and the magnitudes and signs of the trends from GHIm and GHI, and confirm the instrumental stability throughout the series of observations. The results also show the consistency and quality of the GHI series. In addition to the radiation variables, cloud cover (visually detected in tenths), temperature and wind speed, among other quantities, are measured. Detailed information about these measurements, instruments, and processed data can be found in Kirilov et al. [16] and GOAC [18]. Similar instruments have collected valuable broadband solar radiation datasets in other regions of the world, like at the Soviet Union [19] and Eastern Europe [20].
The measurements of solar radiation in the Camagüey station start in April 1st 1969 and continue until the present. After an exhaustive search, the authors of this work did not find any records or documents about how the first observations were made and under what conditions: for this reason all the meta-information about the measurements was obtained by directly consulting the staff who worked during the earlier period of measurements [13] and from the available books of actinometric observations. Due to the lack of information and quality check at the beginning of the data series, for the present study it was decided to use the period between 1 January 1981 and 31 December 2016. In this way, the need of at least 30 years imposed for the establishment of normal climatological conditions is satisfied as is regulated by the Guide of Climatological Practices (GCP) of the World Meteorological Organization [21,22].

2.2. Available Data and Quality Control

As mentioned, the study period covers 36 years (1981–2016), which is composed by a 13,148 total days in the period, with an effective number of 11,558 days on which measurements were conducted (87.91% of the maximum, thus more than the 80% recommended by the GCP to establish a climatology). Different reasons like instrumentation malfunction and maintenance but also the lack of recording books and loss of some of them cause the lack of data. GCP guidelines recommend that the average monthly values should not be calculated when there are more than 10 days without data; in addition, at least 3 observations should be available during the day [22]. The quality control of the data included the review and verification of all the instrument’s certificates, both from the sensors and the recorders, the calibrations made in the period and the conversion factors derived from them. The quality control procedures established for the observations of each instrument where applied following the methodology from Kirilov [16]. Finally, the quality control algorithms and procedures used by the BSRN network (Baseline Solar Radiation Network; https://bsrn.awi.de) to guarantee the higher standards of quality of the surface solar radiation measurements, were applied to the Camagüey dataset [23,24,25,26].
Figure 1 shows the number of annual total available days with at least 3 GHI observations, as well as the number of total annual available observations. The years 1996 and 2006 has been discarded since it only contains 111 and 206 days of measurements respectively. Because the GCP do not provide criteria for the amount of months necessary to calculate the normal’s of solar radiation, the authors decide to use the criteria of discarding the year with less than 60% days of the year.

3. Results

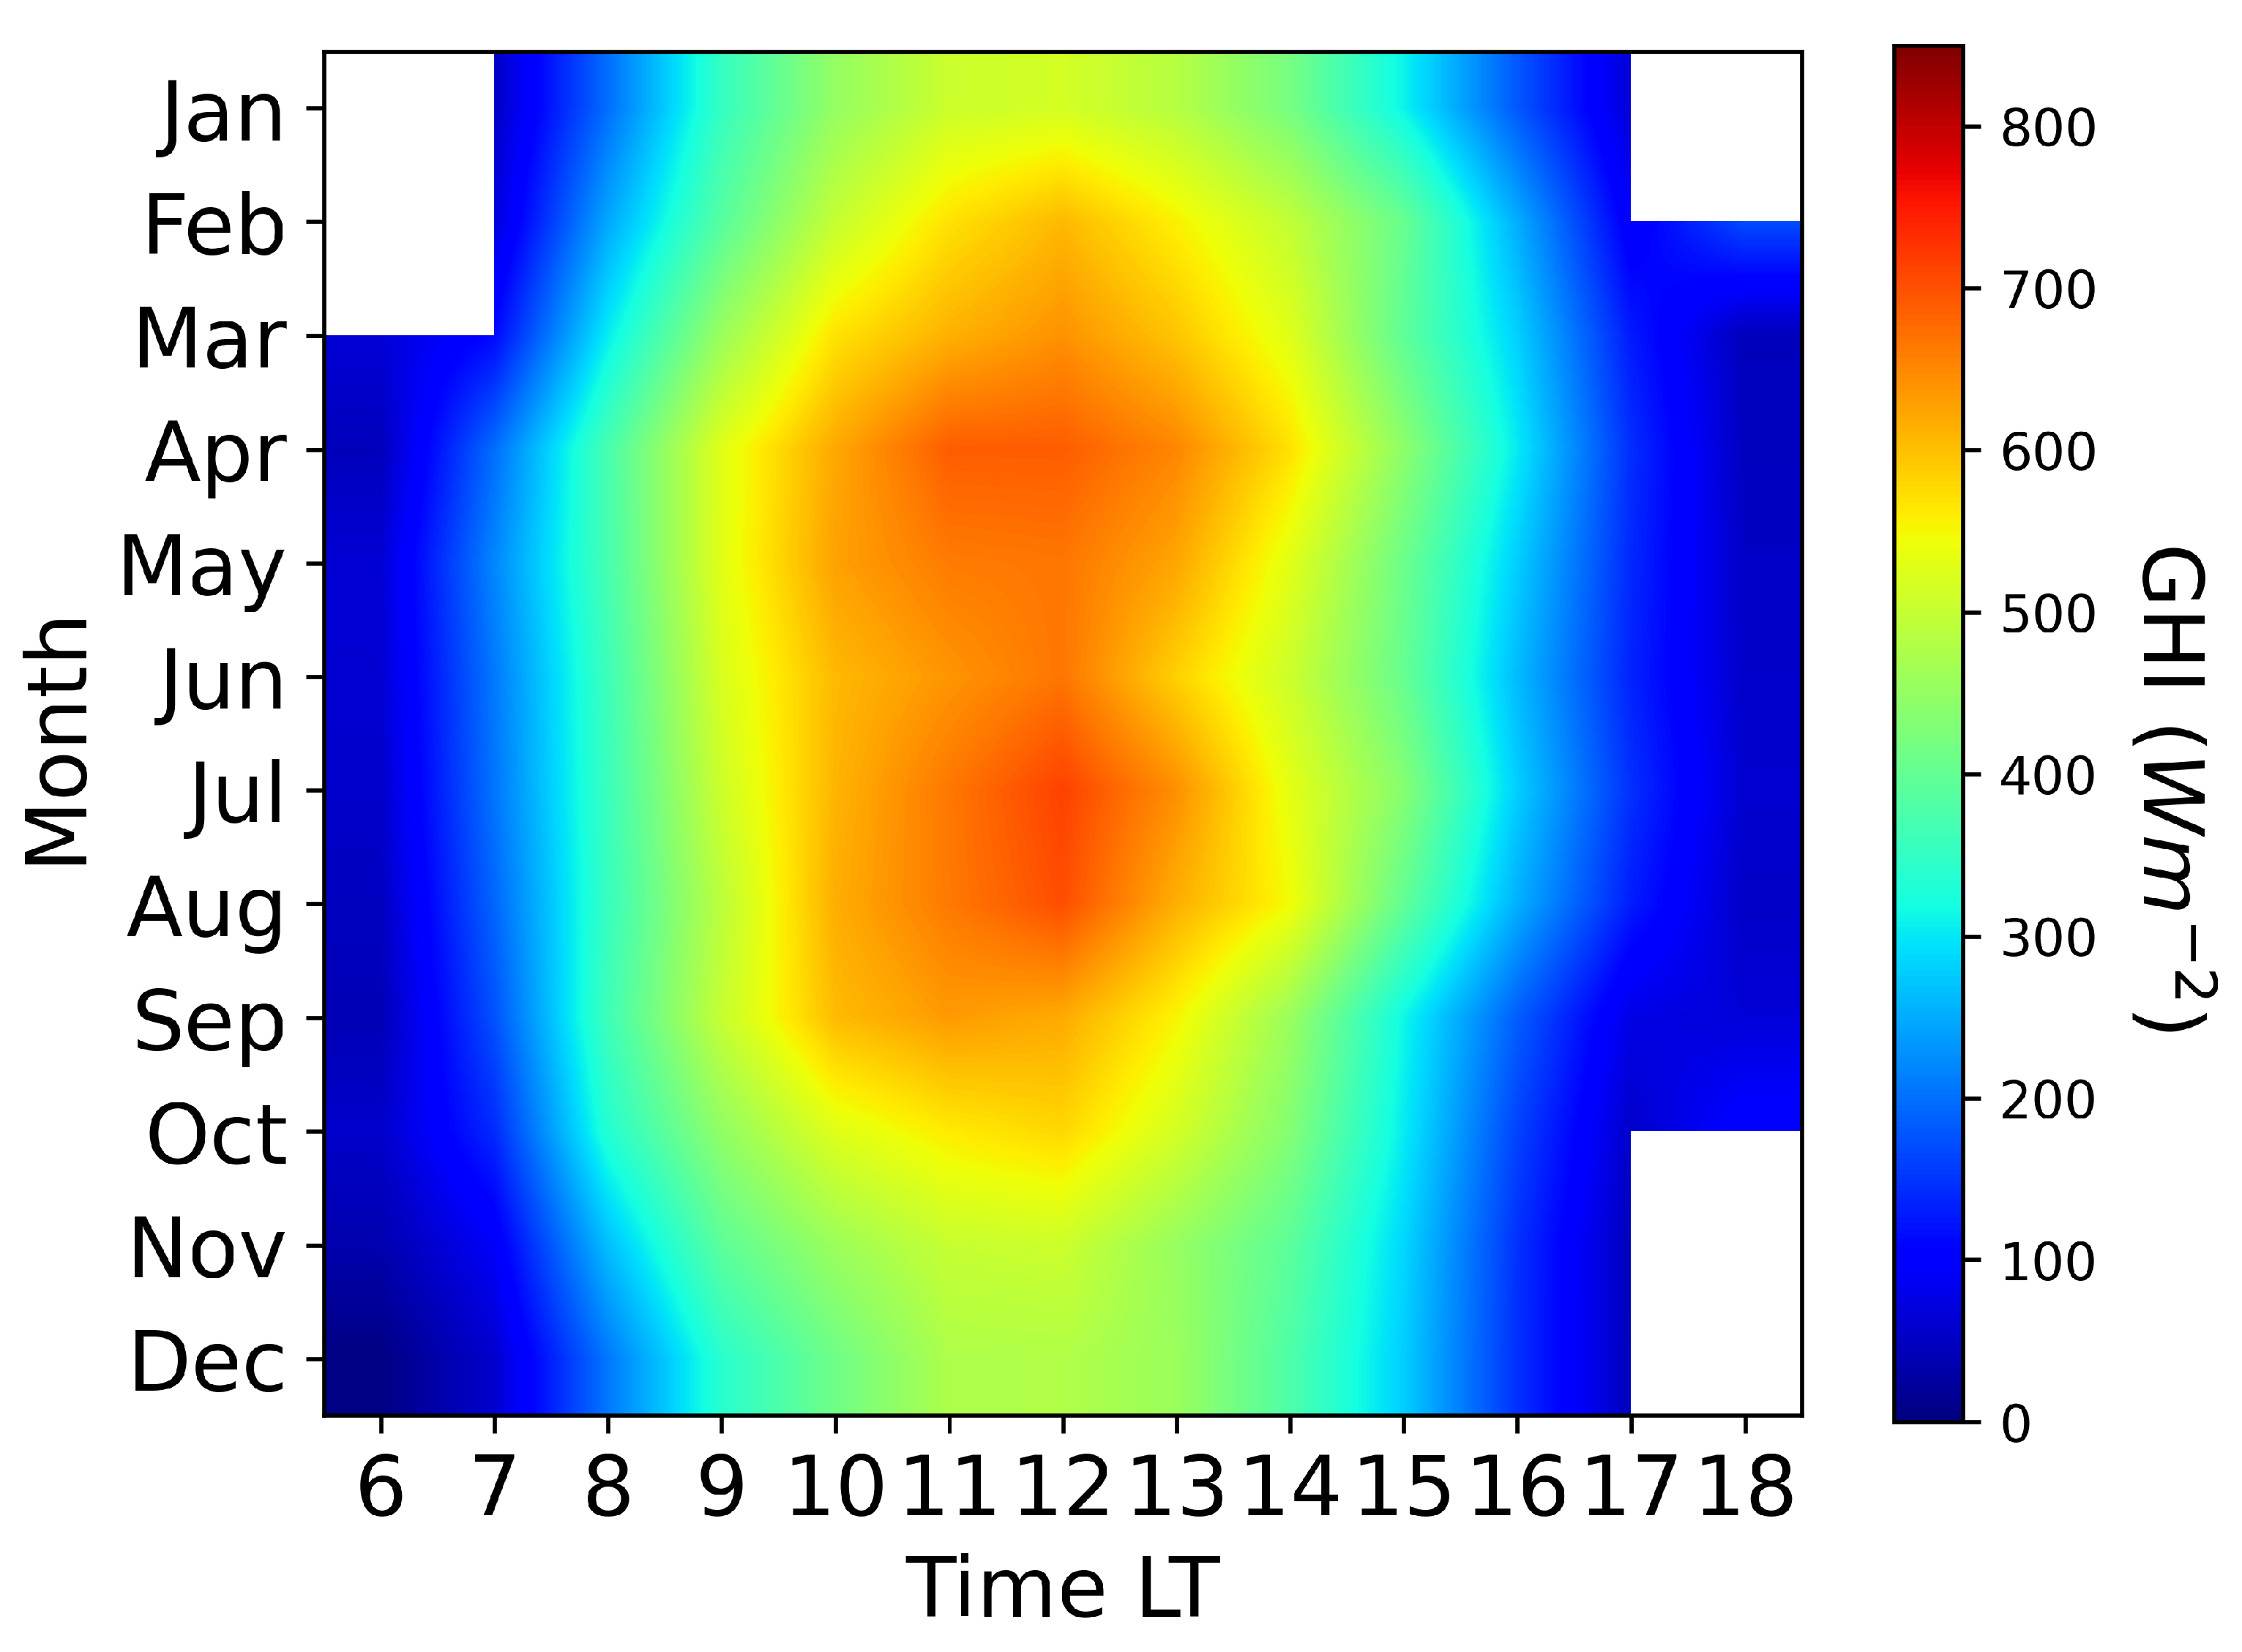
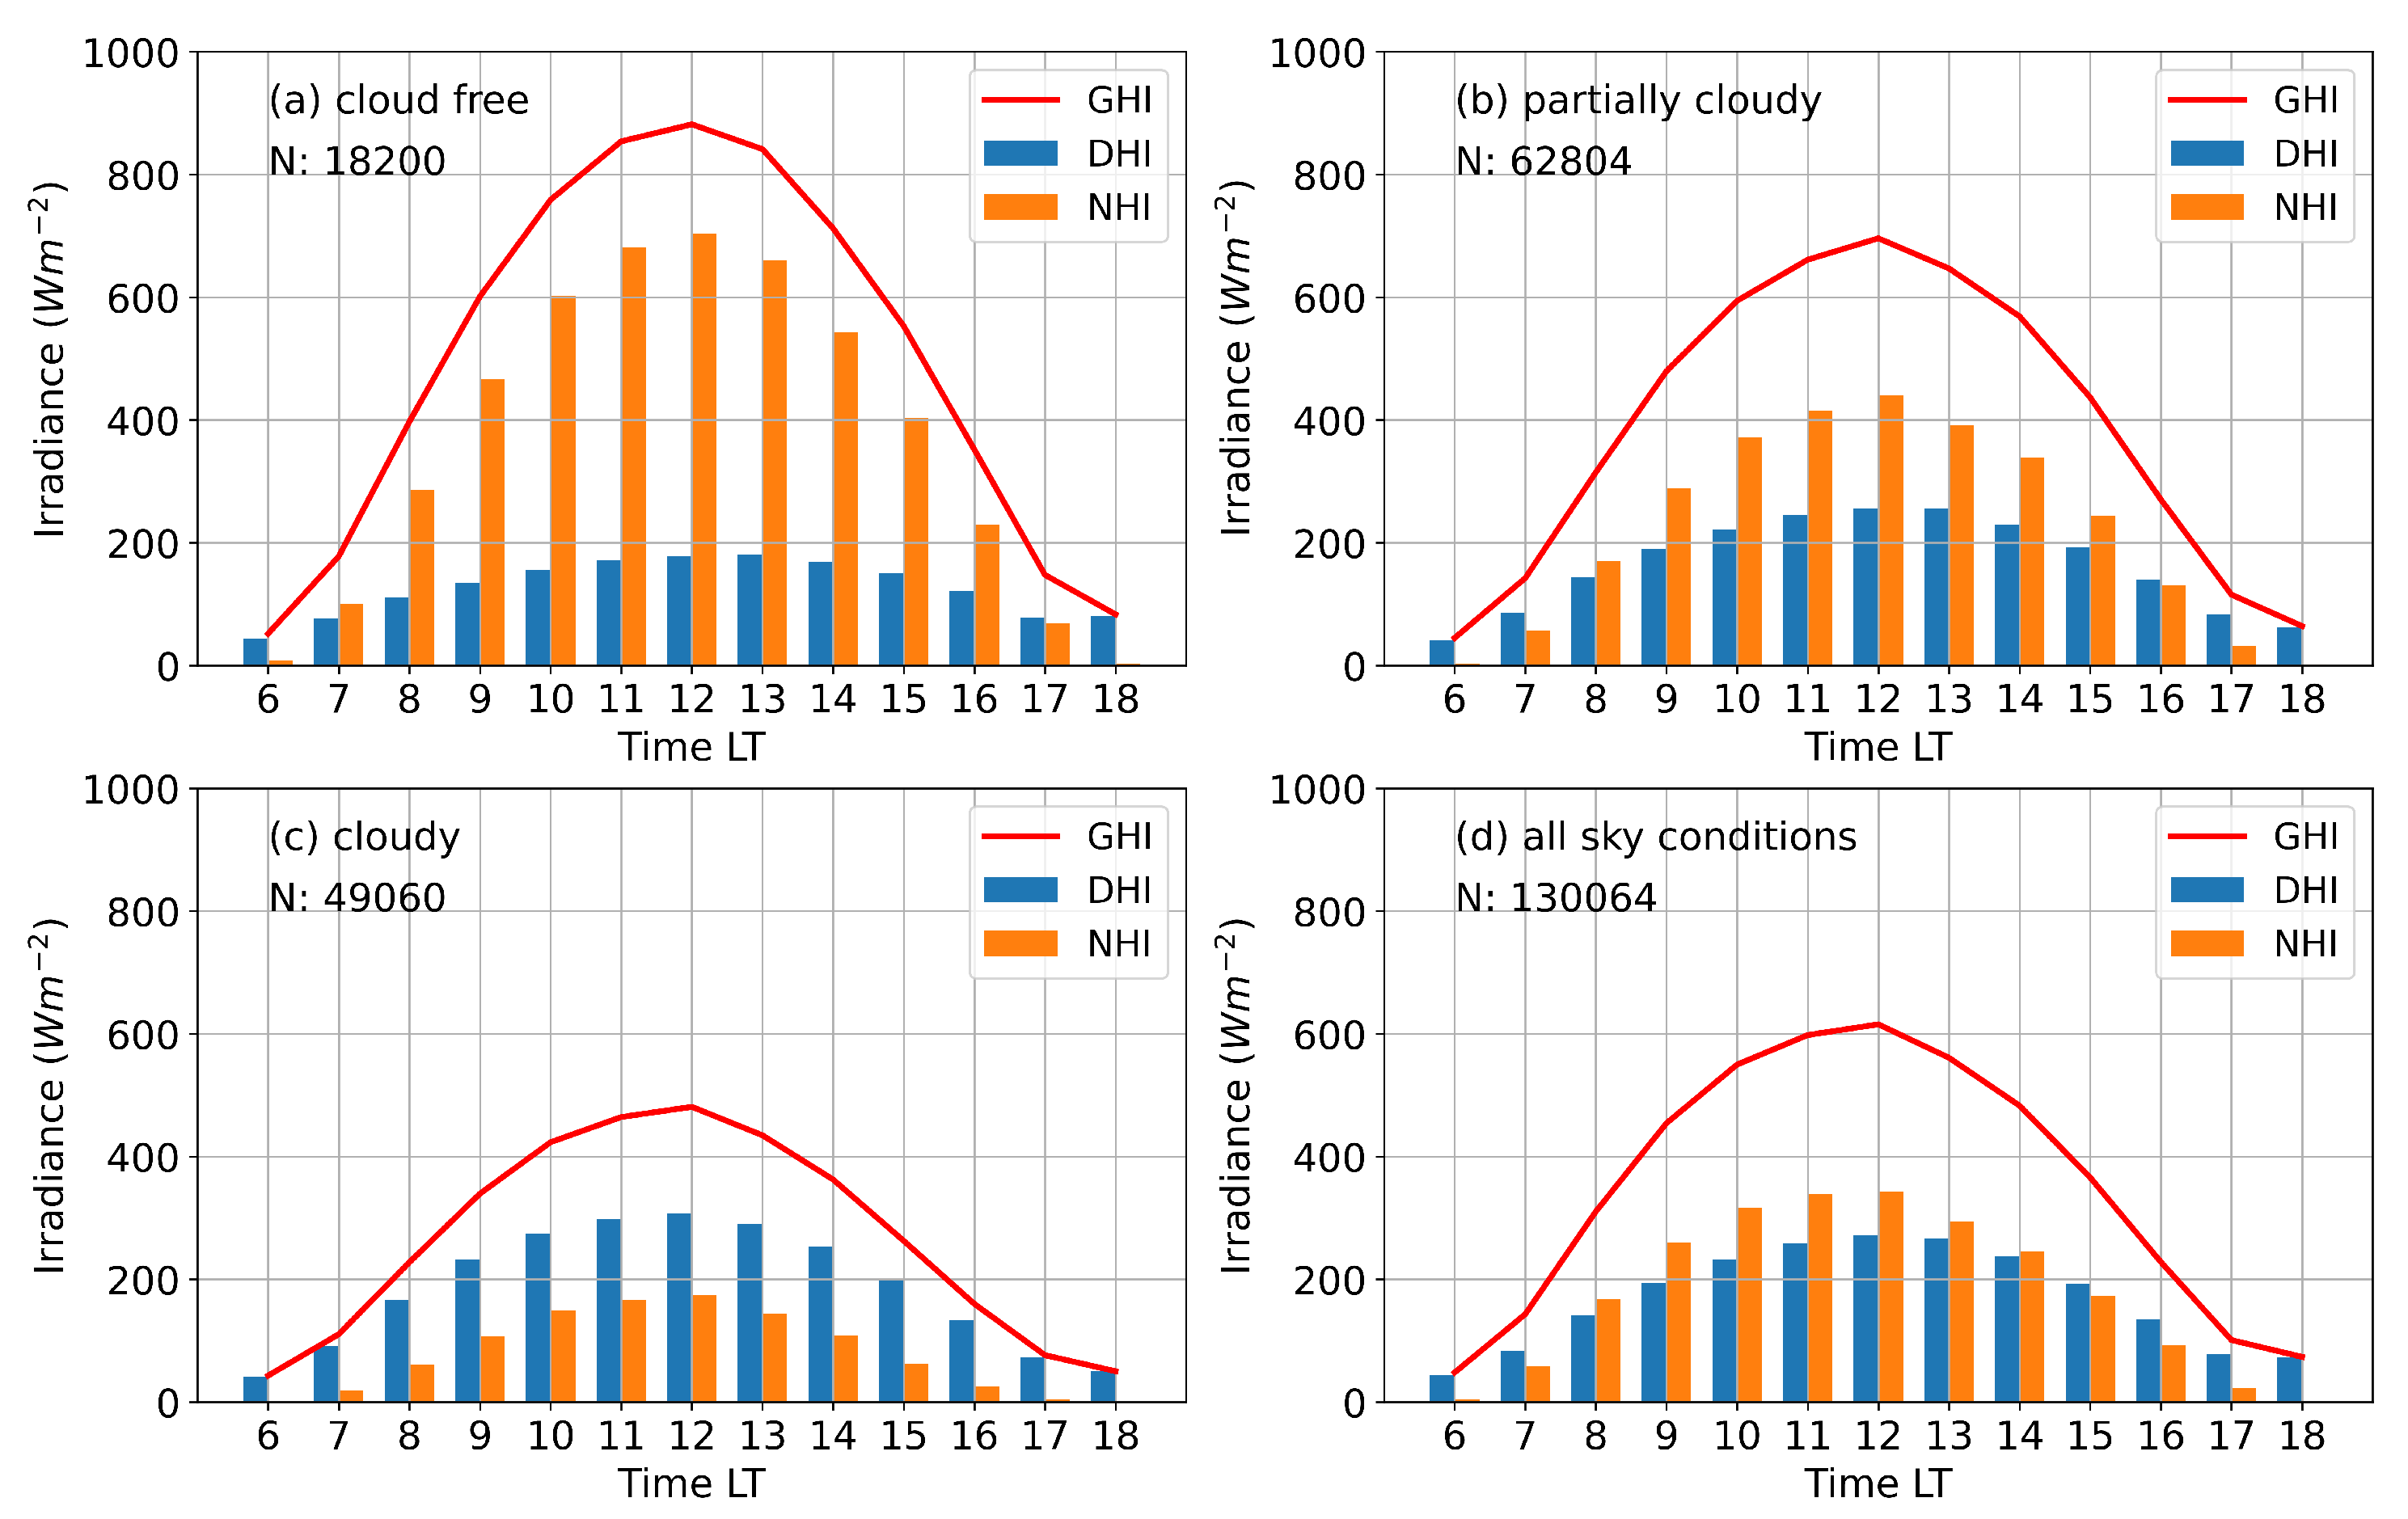
3.1. Solar Irradiance: Hourly Values

Taking as base the hourly irradiance values, we have evaluated the monthly mean for the whole period of measurements, 1981–2016, according to GCP recommendations. Figure 2 shows these hourly monthly averages of GHI representing its climatologist values. This figure points out the homogeneity in the GHI, typical of tropical areas. The highest GHI values, above 500 Wm 2 , are presented for a long time period from February to October between 9 and 14 LT (local time). The maxima values appear in July with a magnitude of 713.47 Wm 2 at 12.00 LT. However, the great cloudiness (Figure 7) across this area can be inferred since the highest values are far from maxima hourly values observed in other locations [27] where even the SZA does not reach lower values than Camagüey. In addition, the footprint of clouds can be observed in a local GHI maximum appearing in April at noon, but also given higher values in the afternoon than in May or June. This can be explained by the presence of clouds because in absence of clouds the GHI variation is mainly controlled by SZA values, which means that at northern hemisphere the GHI in cloudless conditions is higher in May and June than in April. The GHI behavior in April with respect to May and June could not be attributed to the AOD because the climatology table of aerosol optical depth (AOD; version 3, level 2.0, period 2008–2016) at 500 nm from AERONET (Aerosol Robotic NETwork; https://aeronet.gsfc.nasa.gov; [28]) indicates that aerosol presence is very similar for the three months, being the AOD at 500 nm equal to 0.175.
In order to study the diurnal variation of solar radiation during the entire period of measurements and to perform a detailed characterization, the hourly values have been averaged for different sky conditions according to the criteria of Manara [29]. These conditions are based on cloud cover: cloud-free from 0 to 3 tenths, partially cloudy from 4 to 7 tenths and cloudy from 7 to 10 tenths. Figure 3 shows the diurnal course of average hourly values of global, diffuse and direct over the horizontal surface (GHI, DHI and NHI) for the above different sky conditions. The diurnal cycle of the all three variables characterizing the solar irradiance at the surface shows an almost perfect Gaussian behavior centered on 12:00 LT for the four represented sky conditions. This indicates that the SZA variation during the day is the main controller of the diurnal solar radiation cycle at Camagüey. The decreasing magnitudes from cloud free to cloudy categories is the result of the cloudiness modulation of the diurnal cycle. It is worth to note that 86.07% of data were binned into partially cloudy or cloudy categories, indicating the predominance of cloudiness in the area.
As expected, for cloud-free cases the diffuse component is lower than in the other conditions being always below 200 Wm 2 , while the NHI and GHI values are greater than in the other conditions, exceeding 600 Wm 2 and 800 Wm 2 during the peak heating hours of the day, respectively. The most frequent condition is partially cloudy, hence it shows similar values to the averages shown in all conditions. It could be seen that the increase in cloudiness produces an increase in the scattered solar radiation decreasing the NHI under cloudy conditions to around a half of its value under partially cloudy. The slightly higher values of DHI under cloudy conditions than under the partially cloudy are caused by the same increase in the scattering produced by the increase of cloudiness. Regarding cloudy conditions, as expected, the values of DHI exceed the values of NHI at all times; the DHI values are similar to those obtained with partially cloudy (around 200–300 Wm 2 from 9:00 to 15:00), while NHI under cloudy conditions is close to half of the DHI for partially cloudy conditions. For all conditions together, DHI values are similar to NHI but are highest only near sunrise and sunset. The highest averaged values of GHI, NHI and DHI for all conditions together appear at 12:00 LT showing values of 616.6 Wm 2 , 343.5 Wm 2 and 272.1 Wm 2 , respectively. On the other hand, the lowest values for all conditions are located as expected at the sunrise and sunset with values of 48.3 Wm 2 (sunrise), 0.4 Wm 2 (sunset) and 44.4 Wm 2 (sunrise), for GHI, NHI and DHI, respectively.
We compared the estimated solar energy potential in the Camagüey region derived from satellite measurements and modeling [6] with the results reported on Table 1. Those authors used a solar energy potential seven classes classification, shown on Figure 3 and Figure 4 for GHI and DHI respectively [6]. The classes cover the ranges from lower (“Poor”) to the higher (“Superb”) solar energy potential, with intermediate classes in increasing order “Marginal”, “Fair”, “Good”, “Excellent” and “Outstanding.” For the region of Camagüey, Cuba, both for GHI and DHI classified predominantly as “Excellent”. We multiplied by 365.25 the means of the monthly mean daily GHI and NHI irradiances to estimate the annual mean values and then determine the corresponding class. The annual potential GHI and NHI of 1534.1 kWh m 2 and 810.9 kWh m 2 fall in the “Fair” and “Poor” categories respectively, correcting the previous estimates. The reason for the overestimation of the potential solar energy in the region of Camagüey, Cuba, is produced by the well-known limitations of numerical models to simulate the radiative process in presence of clouds. It has been shown that for Camagüey 86% of the days in the 34 years series. In this case the impact of this model limitation is double. Those radiative transfer models are also used for inverting the irradiance measured by satellite instruments at the top of the atmosphere [11]. It is expected that the GHI and DHI classes corrected for the Camagüey region, would be valid also in general for the most part of Cuba, considering the fact that the double sea breeze from north and south coasts [30].

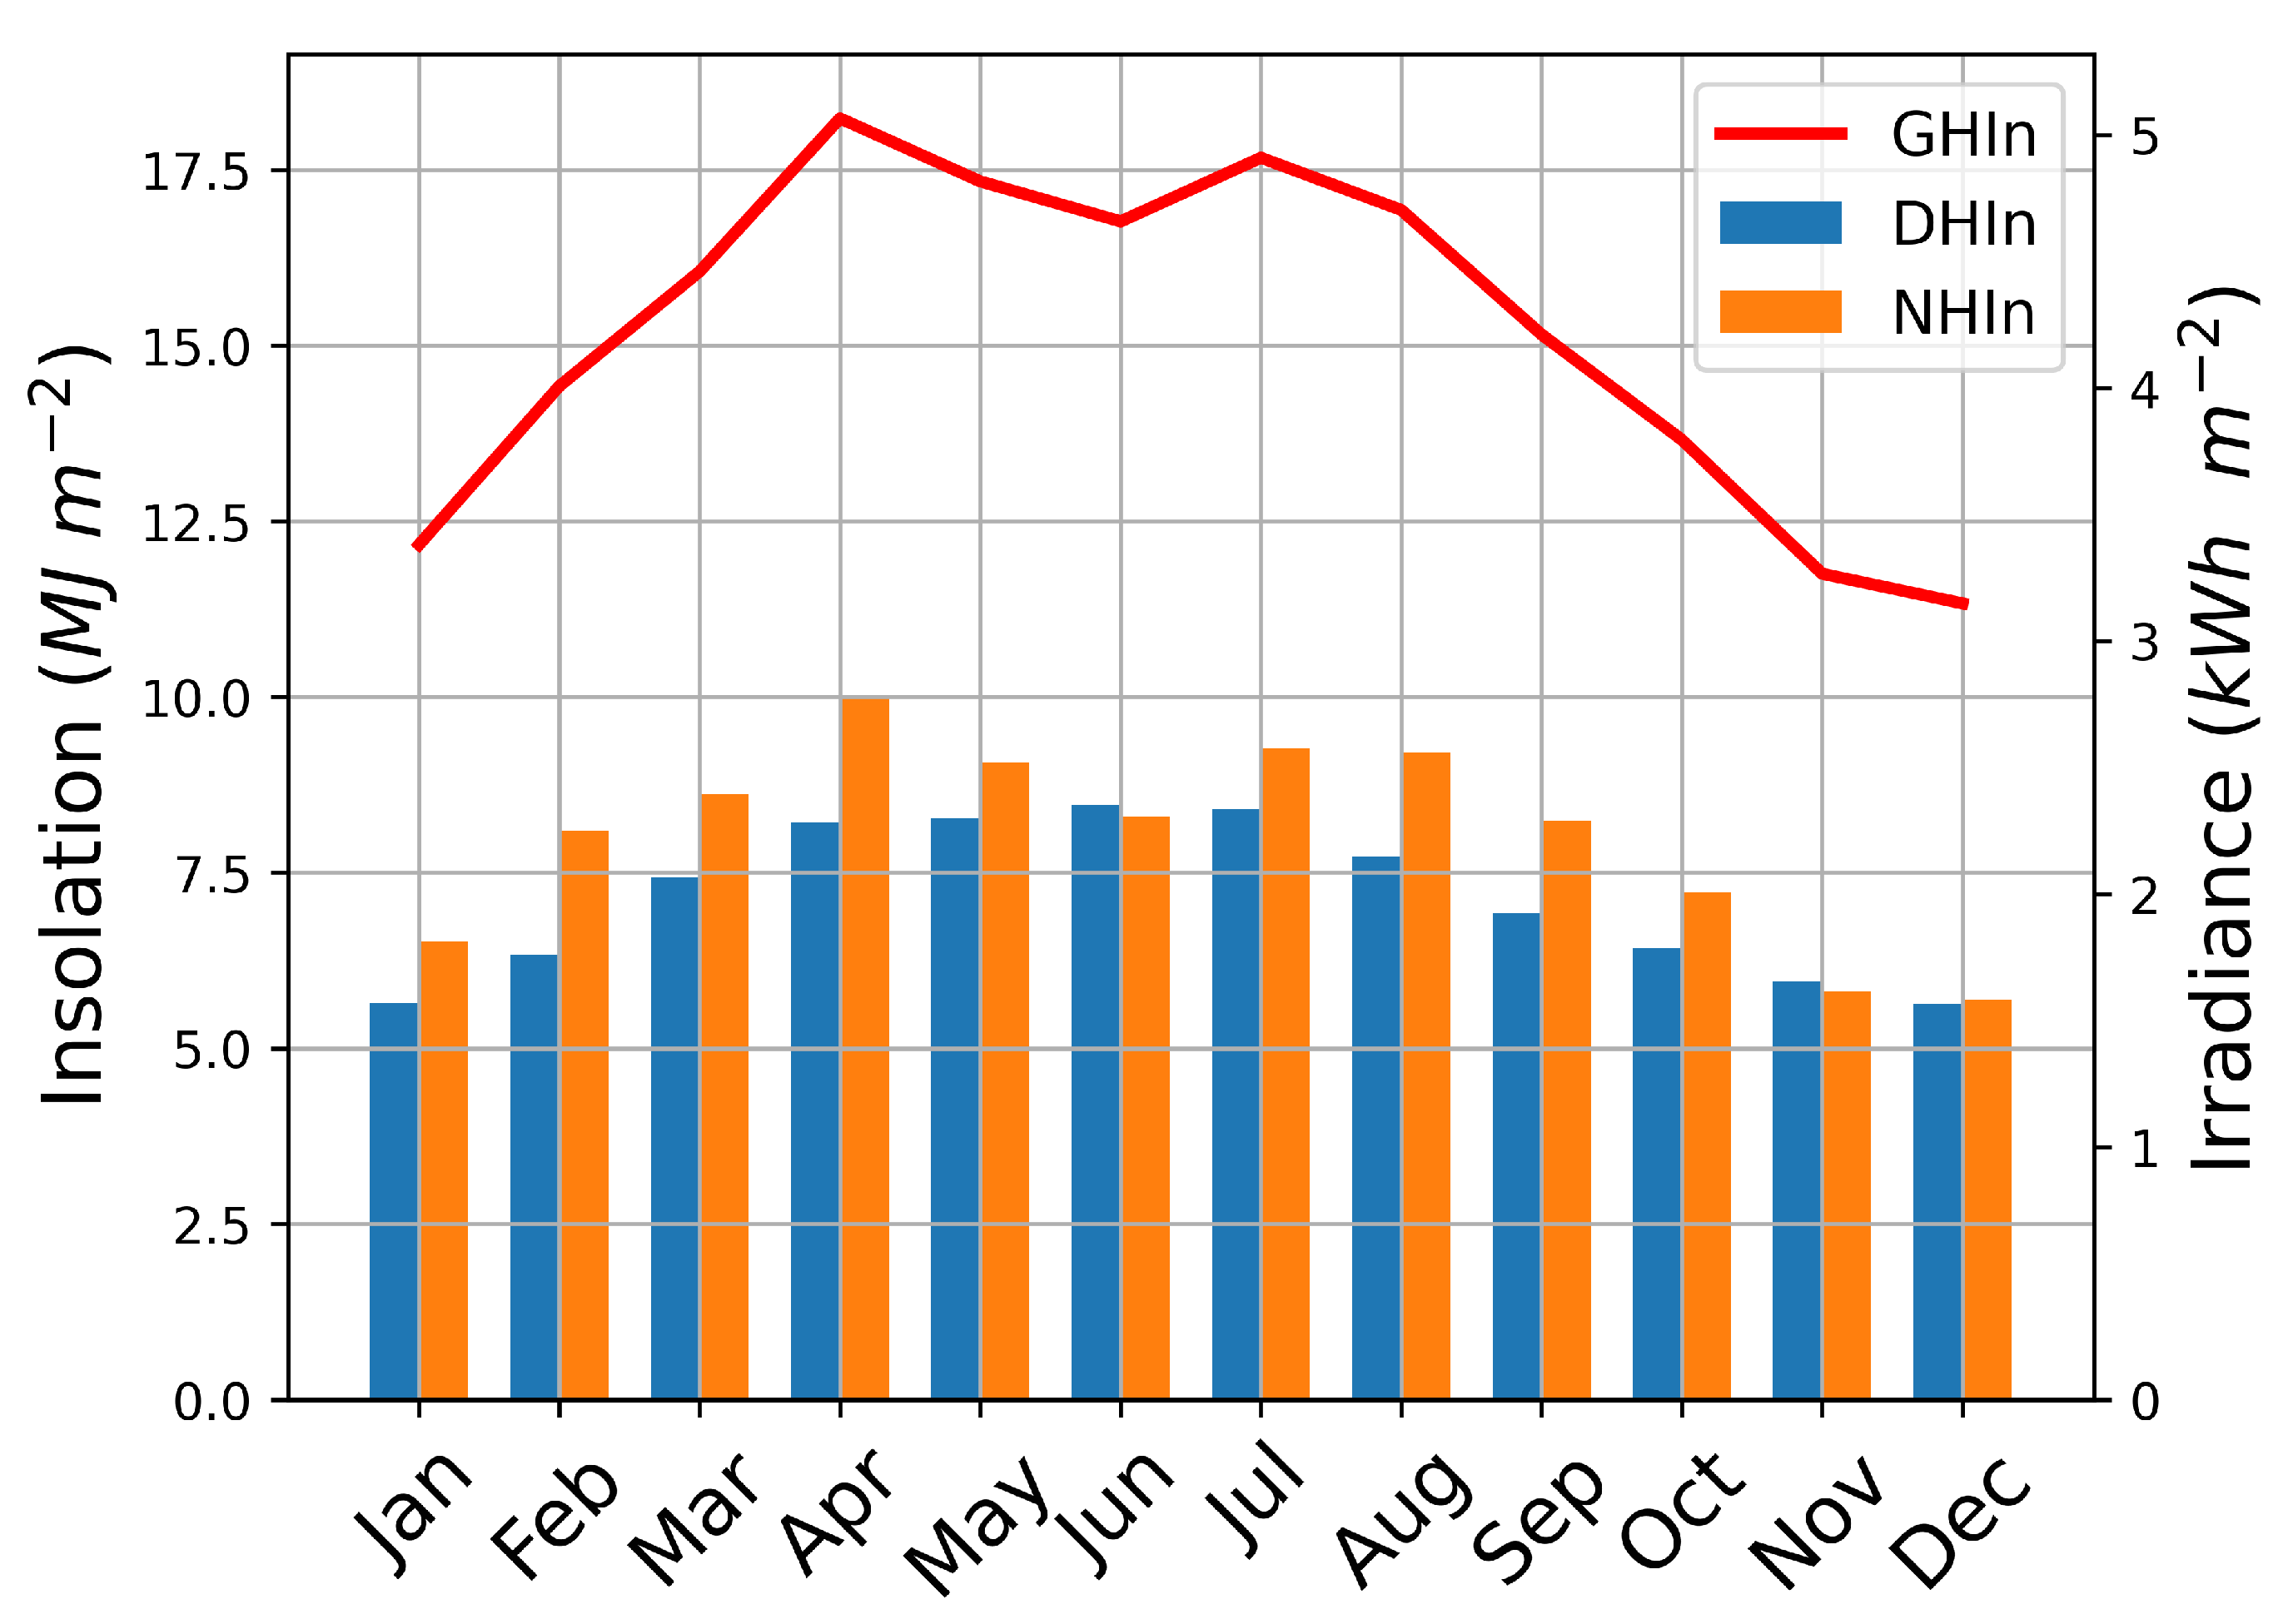
3.2. Solar Irradiance and Insolation: Daily and Monthly Values

Daily values may be generated as explained above, making an average of hourly hours to evaluate the mean daily values of solar irradiances or making the time integration of the day to obtain the solar irradiation or insolation. Figure 4 shows the representative annual climatology of the site or the average monthly cycle taking both, the solar irradiance (kWh m 2 ) in the right axis and the insolation (MJ m 2 ) in the left axis, for the three solar radiation components, (GHI, NHI and DHI, for irradiance and GHIn, NHIn and DHIn, for insolation).
The values of both quantities are reported in Table 1. Global horizontal solar radiation component GHI (or GHIn) presents two maxima, the highest in April and the other in July with 5.06 and 4.91 kWh m 2 respectively (18.23 and 17.67 MJ m 2 per day for insolation). These results do not coincide with the previous study by Lecha [31], who found that July is the month with the maximum. April presents a lower mean cloud cover than the following 4 months with 5 tenths, this is also seen in Figure 7. In the period analyzed we found the maximum GHI in April for 12 years, with a frequency of 35.3%. Figure 2 shows the amplitude of high GHI values in April during more hours of the day than the others months. The minimum of GHI value appears at December (3.15 kWh m 2 or 11.32 MJ m 2 ), which is in agreement with the obtained by Lecha but differs by 0.61 MJ m 2 , followed by November and January with values that did not differ from one another significantly.
As can be seen, not as much variation is observed between the values of the different months throughout the year in this area if compared with middle latitudes, but two seasonal periods may be clearly identified known as rainy and less-rainy (dry season) periods, from May to October and from November to April, respectively. The shape of GHI (or insolation) or its variability is given basically by the contribution of the direct component NHI, with maxima in April, July and August defining the maxima of GHI. NHI is more variable if compared with the diffuse component, DHI, which presents a more smooth behavior (like a smooth bell shape) along the different months of the year, with the maxima during the months of summer with few differences between them. Therefore, the values between direct and diffuse solar components are not very different due to the high influence of clouds in this area throughout the year (Figure 7).
In order to compare the solar radiation results of the present study with that of Lecha et al. [31] in more detail, Figure 5 shows for each month the ratio between the DHI and GHI from this study and from Lecha et al. [31]. The values from this study (orange continuous line) have little variation, with the lowest value of 43.8% in February and the highest value of 50.6% in November. However, according to the results in Lecha et al. [31], the ratio is generally lower and has greater variation. There are similar values in the months of January and May with differences of approximately 1%, but in the months of March, April, July and August the differences can reach values as high as 9–13%, thus the comparison shows notable differences. The results obtained in this work also point out in Figure 7 (where monthly cloudiness for each year during the measured period are illustrated) the higher cloud presence in May and June than in April, which causes a higher ratio of DHI/GHI in these two months. This analysis indicates that in general, the sky conditions do not show a strong variation of solar radiation with the season, which is also an important consequence for solar power applications.
Even though there are the described differences between this study and Lecha [31] the agreement for Camagüey is good. For example, the range of values of global solar insolation, maxima, minima and average moves around similar values taking into account that each database is referred to different periods. According to the mentioned study of Lecha et al. [31] the insolation at Cuba varies between 5100 and 6600 MJ m 2 per year, with annual maxima of 8590 MJ m 2 towards coastal areas, and minima towards the interior regions of the country that reach values of 4800 MJ m 2 . The present study obtains a mean value of 5041 MJ m 2 per year for Camagüey, which is similar to the values given by Lecha et al. [31] for the sites located in the interior regions of Cuba.

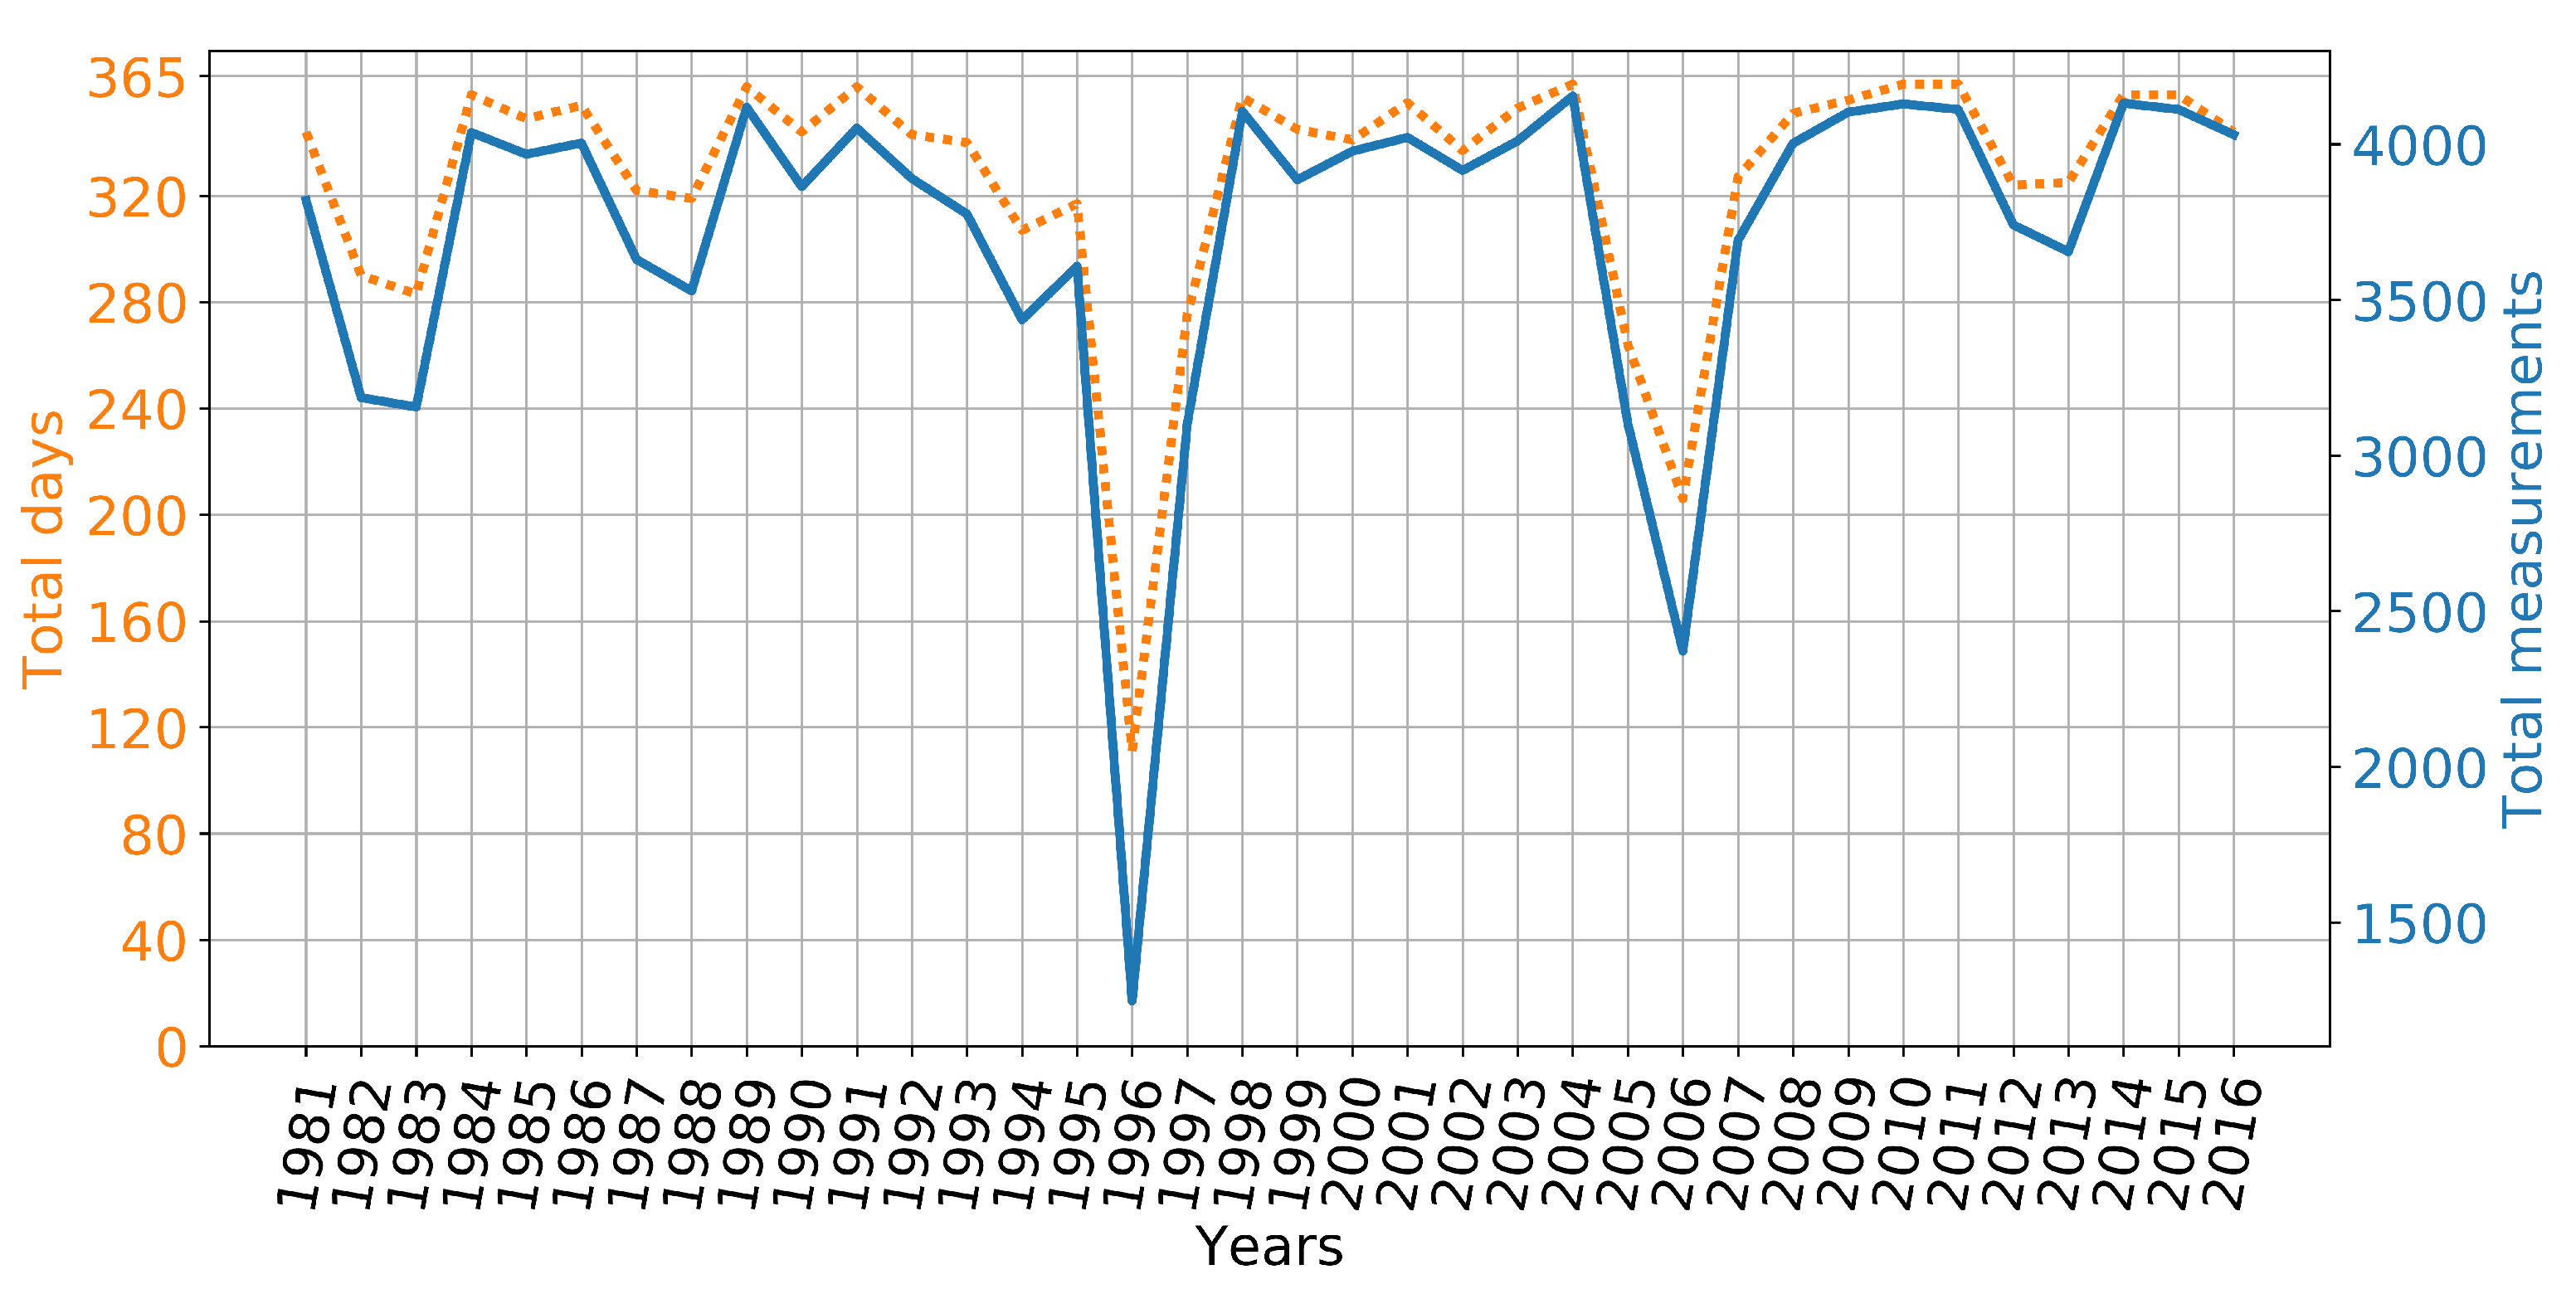
3.3. Year-to-Year Variability

The variability of this station of Camagüey related with solar variables can be seen in Figure 6 where the monthly means of daily insolation for each year during the entire measured period is illustrated. The maximum value for each year is expected in summer months because sunshine duration is longer in these months (especially in June and July). However, due to the proximity of the station to the Tropic of Cancer, the variation in sunshine duration throughout the year is not large; hence, changes due to cloud presence between months can lead to changes on the month showing the annual maximum insolation. This can be appreciated in Figure 6, where yearly maxima appears in summer months but also during the spring, especially in April, which exhibited low cloud presence, as previous results point out.
One notable year was 2009, which had the lowest values of the entire period with a minimum average of 12.43 MJ m 2 . In fact, in this year 2009 minima and maxima are not well-defined, showing all months of this year a similar insolation. The lowest monthly value was observed at the end of 2008. The years 1994 and 1995 feature a behavior similar to the one observed during 2009, but with values, on average, slightly higher. The possible effect of aerosols due to volcanic eruptions on these results will be discussed later. The insolation exceeds a value of 20 MJ m 2 , in a total of 12 years. Most cases occur in one or two months of the year, except 2002 where it occurs in three months. The maximum insolation values occurred in May 1983, with a value of 23.96 MJ m 2 , and in April 1986, reaching a value of 23.56 MJ m 2 .
Figure 7 shows the monthly means of cloud cover for the entire series in order to study the role of clouds on the results shown in Figure 6 for the monthly means of solar insolation. It can be seen that in general cloud cover varies between 5 and 7 tenths. June and February usually show for each year the highest and the lowest cloud cover values with a mean value of 7 and 5 tenths, respectively. The 1981–1984 period presents lower cloud cover values in general than the other years with monthly mean values between 3 and 5 tenths. In fact, the low cloud cover in this period is in agreement with the high insolation values shown in Figure 6 for this period; as an example, April 1986 showed the highest insolation which is related with the lowest cloud cover in Figure 7 which is observed for the same month and year. The 2014–2016 period also shows a lot of months with cloud cover below 6 tenths, which could be responsible in part of the relative high insolation values observed in the same period. The cloud cover values for the year 2009 are not very different from the values in other years (e.g., year 2001 presents more cloud cover), therefore, cloud cover may not be the only reason for the low values of the insolation found for this year. The occurrence of the maximum in April in the general climatology as given in Figure 4 reveals the mentioned impact of clouds on solar radiation because April showed lower cloud cover than other summer months.
In order to observe any variation or trend of solar irradiation with the year, the insolation have been annually averaged for GHIn, DHIn and NHIn, and these averages and their standard deviations are shown in Figure 8. The absolute maximum of GHIn is observed in 1983, reaching 17.45 MJ m 2 , followed by the second maximum in 2002 with a value of 17.35 MJ m 2 . However, the first maximum appears with DHIn higher than NHIn while NHIn is higher than DHIn in the second maximum. Other well observed GHIn highs occurred in 1986, 2012 and 2014. On the other hand, the minimum values of GHIn for the whole period does happened in the years 2009 and 1995 (which can be also appreciated in Figure 6), with 12.43 and 12.97 MJ m 2 , respectively, with both cases having a lower value of NHIn than DHIn. Regarding DHIn, the maximum value occurred in the year 1983, the only year the value exceeded 9.5 MJ m 2 . We attribute this maximum in DHI to the stratospheric aerosols from the eruption of the El Chichón volcano on 4 April 1982 in the state of Chiapas, México. During 1982, because of the dense stratospheric aerosols cloud, estimated in 7 MegaTons of SO 2 , the scattering of solar radiation back to space to predominate reducing NHI with respect to 1981 [32]. During 1983 the stratospheric aerosols cloud was still present but less dense, allowing the solar radiation scattering process to take place in all directions in addition to the back to space scattering, resulting in a decrease in NHI respect to 1982 but and increase of DHI because of the increased scattering process downward from the stratosphere. The effects of the volcanic stratospheric aerosols from El Chichón 1982 eruption on DHI and NHI described above were also present in the same Figure 8 for the 1991 Mt Pinatubo eruption in Philippines, the most intense of the XX century. In 1991 both DHI and NHI decreased with respect to 1990 and the following year DHI slightly increases but NHI continue decreasing, in this case reaching the value of 6.45 MJ m 2 , the minimum for this variable in the entire series, attributed to the very dense stratospheric aerosols cloud, estimated in 7 MegaTons of SO 2 [32]. The minimum DHIn was recorded in the year 2009, in coincidence with the minimum value of GHIn throughout the whole period, with a magnitude of 6.29 MJ m 2 . There are 9 cases where the NHIn is below DHIn: 1983, 1991, 1992, 1994, 1995, 1998, 1999, 2007 and 2009; all years showing a DHIn/GHIn ratio between 50 and 55%. The maximum NHIn value occurred in 2014 with a value of 10.11 MJ m 2 , followed by the year 2002 (9.74 MJ m 2 ). These years had the lowest ratio of DHIn/GHIn, being around 39.75%.
For a seasonal analysis, in the case of Cuba the so-called rainy (May to October) and less rainy (November to April) periods are more representative than seasonal periods; therefore the annual averages of GHIn have been calculated and represented in Figure 8 for both periods. As can be seen, the maxima of GHIn are always reached for the rainy season, with the highest value in 1984 (19.82 MJ m 2 ) and the minimum in 2009 (12.55 MJ m 2 ). For the less rainy period the maximum GHIn appears in 2002, but during this year there are no measurements from January to May, therefore it is not representative and this leaves us with the minimum in 2009 with 12.31 MJ m 2 . The greatest differences between both rainy and less rainy periods are for the year 1984 with values of 6.24 MJ m 2 and the smallest difference is found in 2009 with a value of 0.24 MJ m 2 , which is also the year with the lowest GHIn values; this year also features the minimum DHIn value for the whole data. Further, NHIn is even lower than DHIn. The unusual behavior of GHIn in 2009 could be partially caused by aerosol influence, but the observed values related to aerosols and extracted from the climatology table (version 3, level 2.0) from AERONET for 2009 are similar to the averaged climatology (2008–2018) values. Hence, the main differences of GHIn for 2009 and other years should be caused by clouds. Even though Figure 5 does not show the highest monthly cloud cover means for this year, other cloud factors could be affecting the unusually low value such as cloudiness near noon (when the attenuated radiation should be greater) or a higher frequency of clouds blocking the solar disk. These factors would not appear in the monthly mean value of cloud cover. This issue should be addressed in future research.

4. Conclusions

Long-term solar radiation data in the Caribbean area are scarce despite the great potential of this area as a source of solar resources. Besides, this type of data is also of major interest in this area from a climate perspective. In the present study, 34 years of solar radiation data at Camagüey (Cuba) have been analyzed based on instantaneous hourly irradiance data of the three solar radiation components: global, direct and diffuse horizontal variables. Averages of the hourly, daily, monthly and annual values of irradiance and solar insolation have been determined in order to characterize the diurnal and annual cycles and the year-to-year variability. The main factor on these solar radiation components is due to cloudiness where its predominance is clearly patent but at the same time the homogeneity of cloud cover is manifested in both, the diurnal and annual cycles. The annual cycle of direct horizontal and diffuse components present relatively similar monthly and yearly mean values, but in general the maxima of monthly mean of NHI gives rise to the maxima of global solar radiation, with two maxima, in April and July. This behavior does not strictly follow the classical evolution of SZA during the year, likely because the Camagüey site is close to the Tropic of Cancer and hence the SZA variation during the year is not too strong.
Due to the fact that seasonal variation is not particularly accentuated along the year, diffuse and direct components present very similar values and only the global component gives distinguishable higher values during the rainy season. Because of the long data series, the analysis of inter-annual evolution of the annual averages present fluctuations mainly caused by clouds but it also allows to distinguish variations due to the aerosol presence, such as high volcanic eruptions of great impact in the atmosphere.
The obtained results help to get a better understanding about the solar resource in a Caribbean location like Camagüey. It can be useful in different applications like the calculate dimension of photovoltaic installations, satellite solar data validation or in climatic modeling studies which occasionally need this kind of information to make predictions or evaluations. The planning of solar energy system in this region should take into account the predominance role of cloud cover as the main factor in surface solar radiation. Applying the results for the annual mean GHI and NHI, the estimates of the solar radiation potential for Camagüey, Cuba, that were previously determined by combining modeling and satellite measurements, have been improved.

Author Contributions

J.C.A.-S. and R.E. writing—original draft preparation, methodology and data processing. R.R., V.E.C. and J.C.A.-M., methodology and writing—review and editing. A.R.V. and Á.M.d.F. contributed in the interpretation of results. All authors have read and agreed to the published version of the manuscript.

Funding

This research received no external funding.

Institutional Review Board Statement

Not applicable.

Informed Consent Statement

Not applicable.

Data Availability Statement

The data presented in this study are available on request from A.R.V. The data are not publicly available due to properties right of Meteorological Institute of Cuba.

Acknowledgments

This work was supported by the Spanish Ministry of Economy and Competitiveness (MINECO) under the projects CGL 2016-81092-R, CMT2015-66742-R, FIJCI-2016-30007 (Juan de la Cierva-Incorporación program) and the Framework agreement for international cooperation between the Meteorology Institute (Cuba) and the Valladolid University (Spain). The authors are grateful to the Spanish Ministry of Science, Innovation and Universities for the support through the ePOLAAR project (RTI2018-097864-B-I00).

Conflicts of Interest

The authors declare no conflict of interest.

Abbreviations

The following abbreviations are used in this manuscript:
GHIGlobal horizontal irradiance
DHIDiffuse horizontal irradiance
NHIDirect normal irradiance on a horizontal surface
GHImGlobal horizontal irradiance measured with the pyranometer
GHInGlobal horizontal insolation
DHInDiffuse horizontal insolation
NHInDirect normal insolation on a horizontal surface
DNIDirect normal irradiance
SZASolar zenith angle
GOACAtmospheric Optics Group, Meteorological Institute of Cuba
GCPGuide of Climatological Practices

References

  1. Wild, M.; Ohmura, A.; Schär, C.; Müller, G.; Folini, D.; Schwarz, M.; Hakuba, M.Z.; Sanchez-Lorenzo, A. The Global Energy Balance Archive (GEBA) version 2017: A database for worldwide measured surface energy fluxes. Earth Syst. Sci. Data 2017, 9, 601–613. [Google Scholar] [CrossRef] [Green Version]
  2. Myhre, G.; Shindell, D.; Pongratz, J. Anthropogenic and Natural Radiative Forcing. In Climate Change 2013: The Physical Science Basis; Working Group I Contribution to the Fifth Assessment Report of the Intergovernmental Panel on Climate Change; Stocker, T., Ed.; Cambridge University Press: Cambridge, UK, 2014; pp. 659–740. [Google Scholar]
  3. Schellnhuber, H.J.; van der Hoeven, M.; Bastioli, C.; Ekins, P.; Jaczewska, B.; Kux, B.; Thimann, C.; Tubiana, L.; Wanngård, K.; Slob, A.; et al. Final Report of the High-Level Panel of the European Decarbonisation Pathways Initiative; Technical Report; European Commission: Brussels, Belgium, 2018. [Google Scholar]
  4. Hartmann, D.L.; Tank, A.M.G.K.; Rusticucci, M.; Alexander, L.V.; Brönnimann, S.; Charabi, Y.A.R.; Dentener, F.J.; Dlugokencky, E.J.; Easterling, D.R.; Kaplan, A.; et al. Observations: Atmosphere and surface. In Climate Change 2013 the Physical Science Basis: Working Group I Contribution to the Fifth Assessment Report of the Intergovernmental Panel on Climate Change; Cambridge University Press: Cambridge, UK, 2013; pp. 159–254. [Google Scholar] [CrossRef] [Green Version]
  5. Murdock, H.E.; Gibb, D.; André, T.; Appavou, F.; Brown, A.; Epp, B.; Kondev, B.; McCrone, A.; Musolino, E.; Ranalder, L.; et al. Renewables 2019 Global Status Report; REN21 Secretariat: Paris, France, 2019. [Google Scholar]
  6. Prăvălie, R.; Patriche, C.; Bandoc, G. Spatial assessment of solar energy potential at global scale. A geographical approach. J. Clean. Prod. 2019, 209, 692–721. [Google Scholar] [CrossRef]
  7. Rigollier, C.; Lefèvre, M.; Wald, L. The method Heliosat-2 for deriving shortwave solar radiation from satellite images. Sol. Energy 2004, 77, 159–169. [Google Scholar] [CrossRef] [Green Version]
  8. Mueller, R.; Behrendt, T.; Hammer, A.; Kemper, A. A New Algorithm for the Satellite-Based Retrieval of Solar Surface Irradiance in Spectral Bands. Remote Sens. 2012, 4, 622–647. [Google Scholar] [CrossRef] [Green Version]
  9. Niu, X.; Pinker, R.T. An improved methodology for deriving high-resolution surface shortwave radiative fluxes from MODIS in the Arctic region: Radiative fluxes for the Arctic. J. Geophys. Res. Atmos. 2015, 120, 2382–2393. [Google Scholar] [CrossRef]
  10. Karlsson, K.G.; Anttila, K.; Trentmann, J.; Stengel, M.; Fokke Meirink, J.; Devasthale, A.; Hanschmann, T.; Kothe, S.; Jääskeläinen, E.; Sedlar, J.; et al. CLARA-A2: The second edition of the CM SAF cloud and radiation data record from 34 years of global AVHRR data. Atmos. Chem. Phys. 2017, 17, 5809–5828. [Google Scholar] [CrossRef] [Green Version]
  11. Pfeifroth, U.; Sanchez-Lorenzo, A.; Manara, V.; Trentmann, J.; Hollmann, R. Trends and Variability of Surface Solar Radiation in Europe Based On Surface- and Satellite-Based Data Records. J. Geophys. Res. Atmos. 2018, 123, 1735–1754. [Google Scholar] [CrossRef]
  12. Antonanzas, J.; Osorio, N.; Escobar, R.; Urraca, R.; Martinez-de Pison, F.; Antonanzas-Torres, F. Review of photovoltaic power forecasting. Sol. Energy 2016, 136, 78–111. [Google Scholar] [CrossRef]
  13. Antuña, J.C.; Fonte, A.; Estevan, R.; Barja, B.; Acea, R.; Antuña, J.C. Solar Radiation Data Rescue at Camagüey, Cuba. Bull. Am. Meteorol. Soc. 2008, 89, 1507–1512. [Google Scholar] [CrossRef]
  14. Antuña Marrero, J.C.; Arredondo, R.E.; González, B.B. Demonstrating the Potential for First-Class Research in Underdeveloped Countries: Research on Stratospheric Aerosols and Cirrus Clouds Optical Properties, and Radiative Effects in Cuba (1988–2010). Bull. Am. Meteorol. Soc. 2012, 93, 1017–1027. [Google Scholar] [CrossRef]
  15. Yanishevsky, Y.D. Actinometric Instruments and Methods for Observation; Gidrometeoizdat: Saint Petersburg, Russia, 1957. [Google Scholar]
  16. Kirilov, T.; Vlasov, Y.B.; Flaum, M.Y. Guidrometeoizdat Manual for the Hydrometeorological Stations and Posts to Conduct Actinometrical Observations; Technical Report; Guidrometeoizdat: Leningrad, Russia, 1957. [Google Scholar]
  17. Antuña-Marrero, J.C.; García, F.; Estevan, R.; Barja, B.; Sánchez-Lorenzo, A. Simultaneous dimming and brightening under all and clear sky at Camagüey, Cuba (1981–2010). J. Atmos. Sol. Terr. Phys. 2019, 190, 45–53. [Google Scholar] [CrossRef]
  18. GOAC. Manual de Observaciones Actinométricas; Technical Report; GOAC: Camagüey, Spain, 2010. (In Spanish) [Google Scholar]
  19. Abakumova, G.M.; Feigelson, E.M.; Russak, V.; Stadnik, V.V. Evaluation of Long-Term Changes in Radiation, Cloudiness, and Surface Temperature on the Territory of the Former Soviet Union. J. Clim. 1996, 9, 1319–1327. [Google Scholar] [CrossRef] [Green Version]
  20. Ohvril, H.; Teral, H.; Neiman, L.; Kannel, M.; Uustare, M.; Tee, M.; Russak, V.; Okulov, O.; Jõeveer, A.; Kallis, A.; et al. Global dimming and brightening versus atmospheric column transparency, Europe, 1906–2007. J. Geophys. Res. 2009, 114, D00D12. [Google Scholar] [CrossRef]
  21. WMO. Guide to Climatological Practices, 2nd ed.; WMO: Geneva, Switzerland, 1983; Volume 100. [Google Scholar]
  22. WMO. Guide to Instruments and Methods of Observation, 2018th ed.; WMO: Geneva, Switzerland, 2018. [Google Scholar]
  23. Long, C.; Dutton, E. BSRN Global Network Recommended QC Tests. V2. 0. 2002. Available online: http://bsrn.eth.ch (accessed on 14 May 2020).
  24. Long, C.; Shi, Y. The QCRad value added product: Surface radiation measurement quality control testing, including climatology configurable limits. Atmos. Radiat. Meas. Program Tech. Rep. 2006. [Google Scholar] [CrossRef] [Green Version]
  25. Long, C.N.; Shi, Y. An automated quality assessment and control algorithm for surface radiation measurements. Open Atmos. Sci. J. 2008, 2, 23–37. [Google Scholar] [CrossRef] [Green Version]
  26. Driemel, A.; Augustine, J.; Behrens, K.; Colle, S.; Cox, C.; Cuevas-Agulló, E.; Denn, F.M.; Duprat, T.; Fukuda, M.; Grobe, H.; et al. Baseline Surface Radiation Network (BSRN): Structure and data description (1992–2017). Earth Syst. Sci. Data 2018, 10, 1491–1501. [Google Scholar] [CrossRef] [Green Version]
  27. Román Díez, R. Reconstrucción y Análisis de la Radiación Ultravioleta Eritemática en la Península Ibérica Desde 1950. Ph.D. Thesis, Universidad de Valladolid, Valladolid, Spain, 2014. [Google Scholar] [CrossRef]
  28. Holben, B.; Eck, T.; Slutsker, I.; Tanré, D.; Buis, J.; Setzer, A.; Vermote, E.; Reagan, J.; Kaufman, Y.; Nakajima, T.; et al. AERONET—A Federated Instrument Network and Data Archive for Aerosol Characterization. Remote Sens. Environ. 1998, 66, 1–16. [Google Scholar] [CrossRef]
  29. Manara, V.; Brunetti, M.; Celozzi, A.; Maugeri, M.; Sanchez-Lorenzo, A.; Wild, M. Detection of dimming/brightening in Italy from homogenized all-sky andclear-sky surface solar radiation records and underlying causes (1959–2013). Atmos. Chem. Phys. 2016, 16, 11145–11161. [Google Scholar] [CrossRef] [Green Version]
  30. Camesoltas, M. La circulación local de brisa de mar y tierra. Conceptos fundamentales. Rev. Cuba. Meteorol. 2002, 9, 39–60. [Google Scholar]
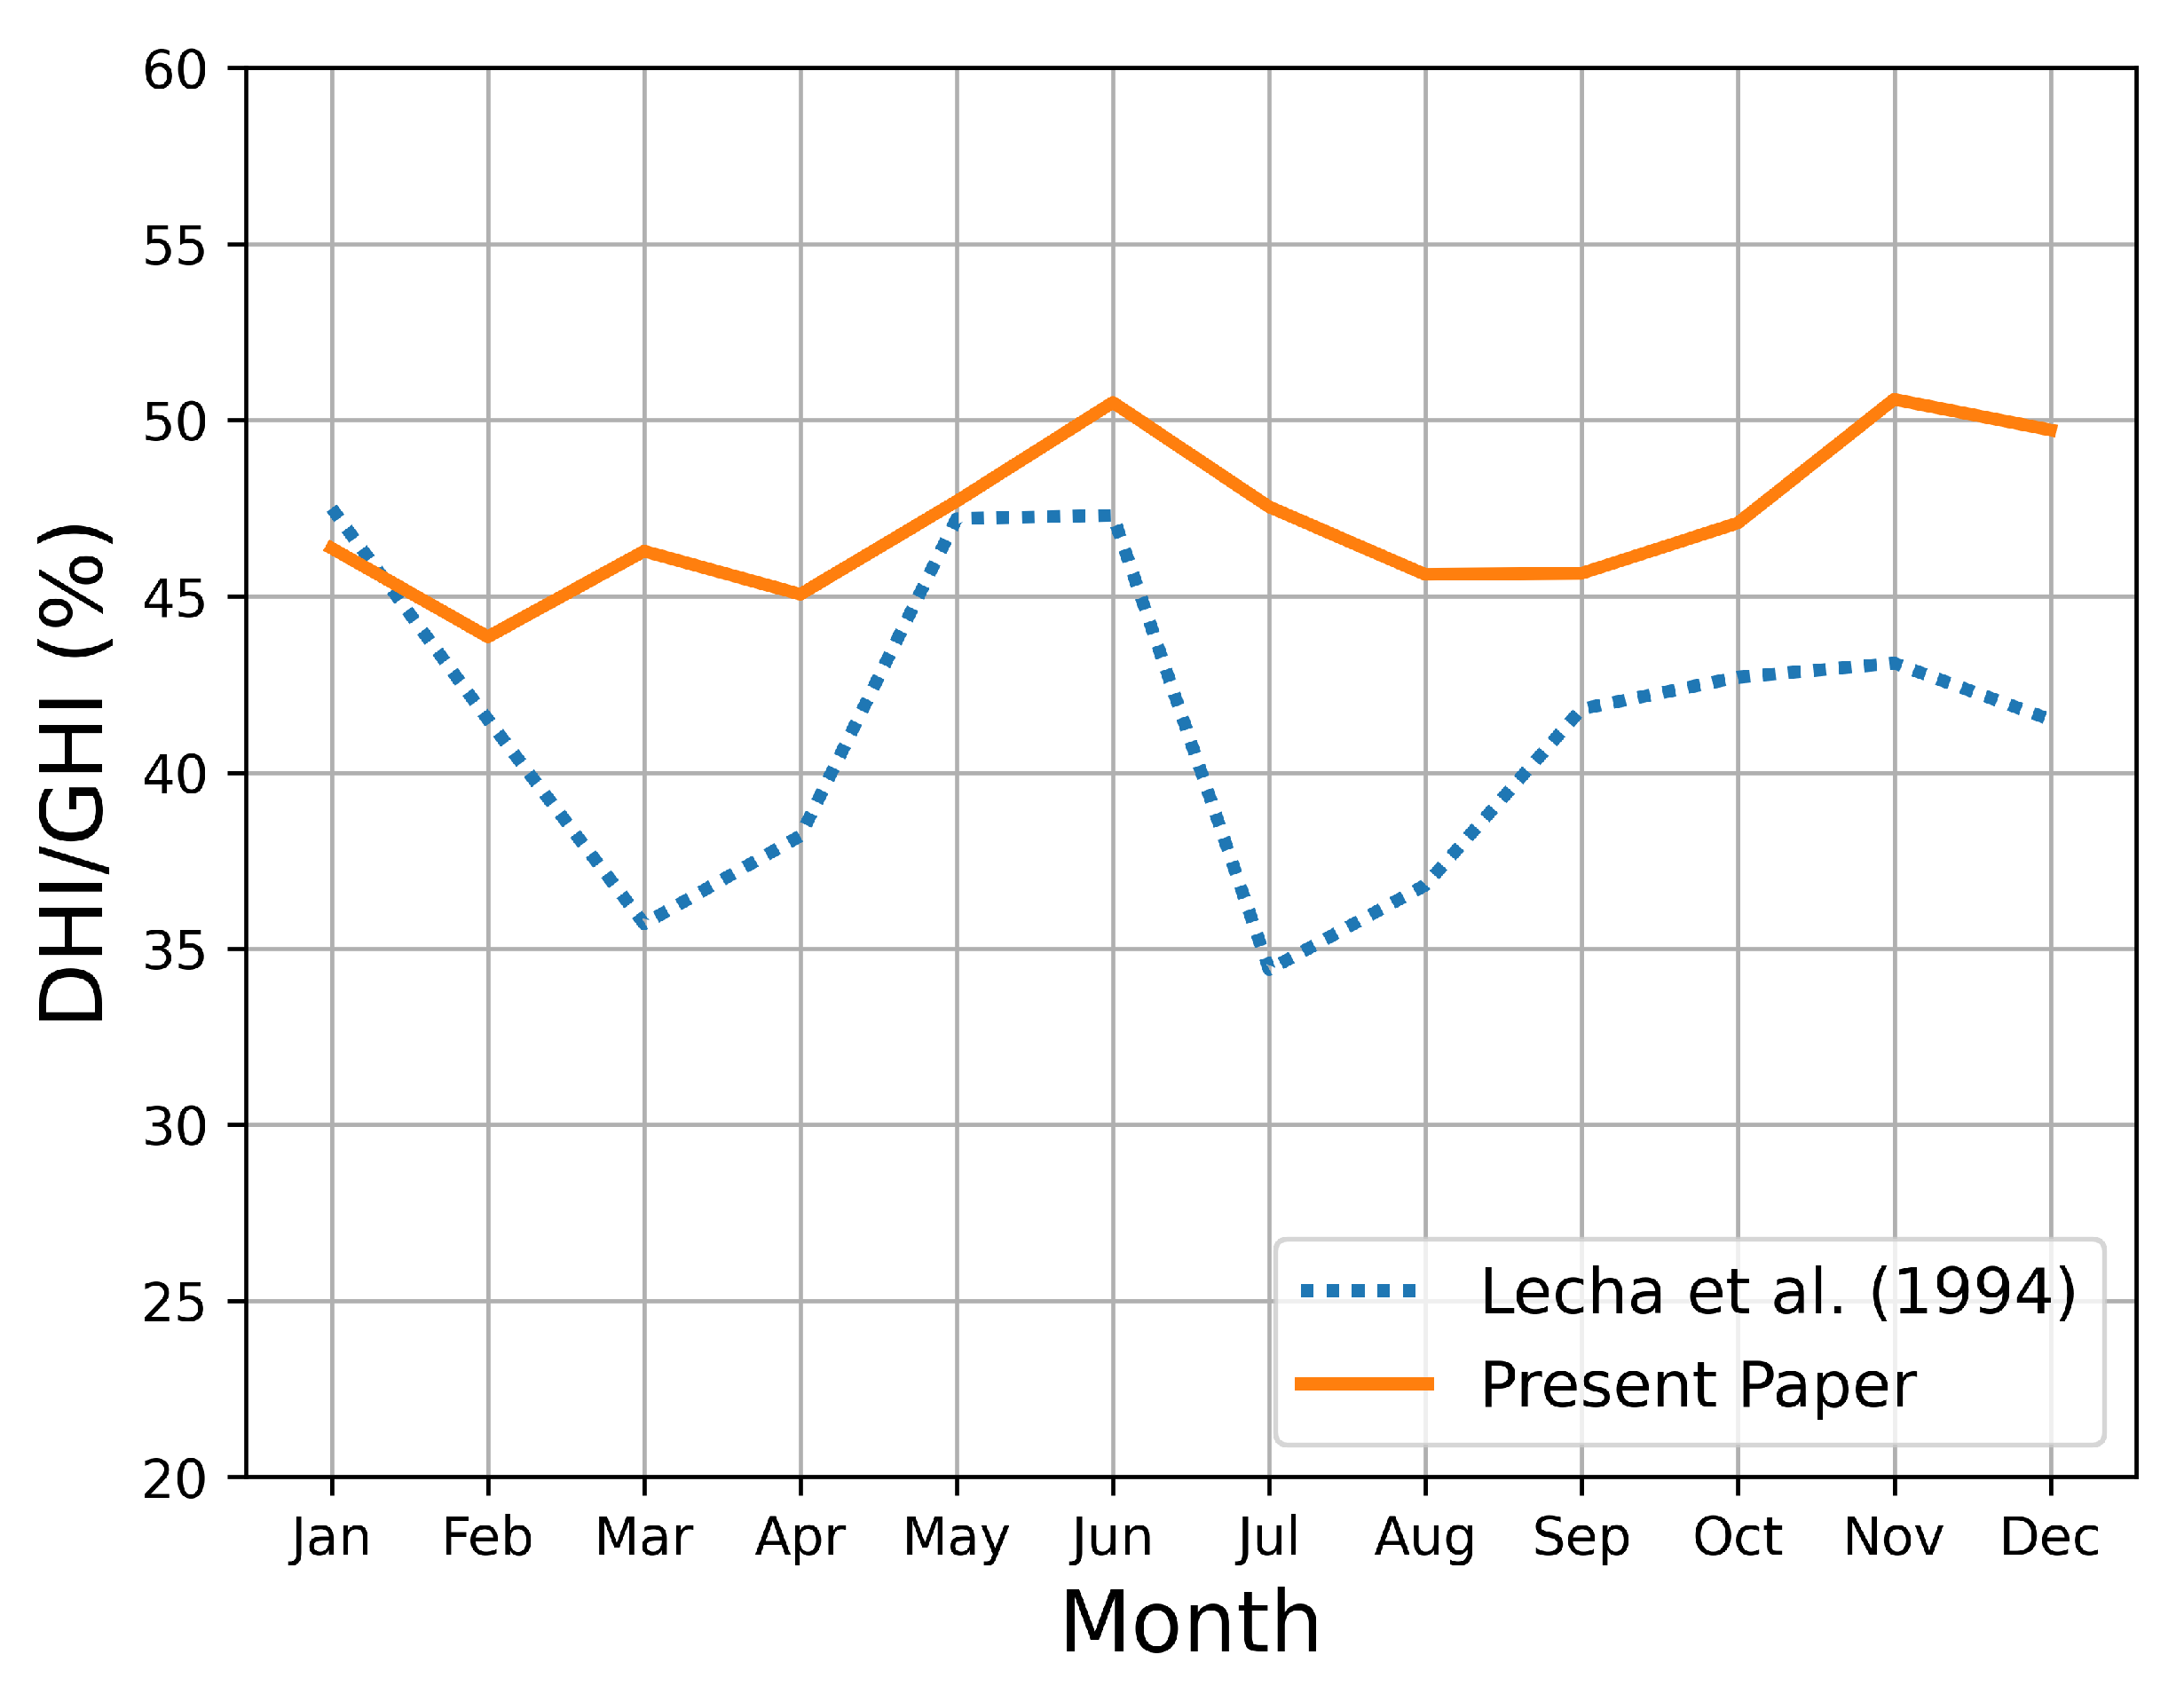
  31. Lecha Estela, L.B.; Paz, L.R.; Lapinel, B. El Clima de Cuba, 1st ed.; Editorial Academia: La Habana, Cuba, 1994. [Google Scholar]
  32. Robock, A. Volcanic eruptions and climate. Rev. Geophys. 2000, 38, 191–219. [Google Scholar] [CrossRef]
Figure 1. Number of annual total available days (orange dotted line) and number of annual total available GHI measurements (blue line) for the entire period (1981–2016).
Remotesensing 13 00169 g001
Figure 2. Monthly hourly averages (Wm 2 ) section of the global solar irradiance (GHI) at Camagüey for the entire measured period (1981–2016).
Remotesensing 13 00169 g002
Figure 3. Averages of hourly irradiance values (Wm 2 ) for global (GHI), diffuse (DHI) and direct (NHI) horizontal surface solar irradiances for the period 1981–2016 under different sky conditions: (a) cloud-free sky, (b) partially cloudy, (c) cloudy, and (d) all sky conditions.
Remotesensing 13 00169 g003
Figure 4. Climatological annual cycle given by the mean monthly daily values for the three components of solar radiation, GHI, NHI and DHI for the entire period 1981–2016 at Camagüey. Left axis represents insolation quantity (in MJ m 2 ) and right axis irradiance values (in kWh m 2 ).
Remotesensing 13 00169 g004
Figure 5. Ratio between the monthly averages of diffuse (DHI) and global (GHI) horizontal surface solar irradiances for the entire period of measurements. Values from Lecha et al. [31] are included (blue dot line).
Remotesensing 13 00169 g005
Figure 6. Monthly mean global solar insolation (GHIn, in MJ m 2 per day) for each year during the measured period, from 1981–2016.
Remotesensing 13 00169 g006
Figure 7. Monthly mean values of cloudiness for each year during the measured period from 1981–2016.
Remotesensing 13 00169 g007
Figure 8. Annual averages of global (GHIn), diffuse (DHIn) and direct (NHIn) horizontal solar insolation for the 1981–2016 period. Shaded areas correspond to standard deviation. GHIn is also represented for rainy period (dotted green line) and less rainy period (dashed brown line).
Remotesensing 13 00169 g008
Table 1. Monthly mean daily values expressing the climatology of solar irradiance and insolation for the three solar components and cloud cover mean for period of measured data (1981–2016) in Camagüey (Cuba).
Insolation (MJ m 2 )Irradiance (kWh m 2 )
MonthGHInDHInNHInGHIDHINHICloud Cover (tenths)
Jan12.175.646.533.381.571.815.27
Feb14.426.328.104.011.762.255.07
Mar16.057.438.624.462.062.405.34
Apr18.238.2110.015.062.282.785.45
May17.338.279.074.822.302.526.08
Jun16.768.478.304.662.352.316.57
Jul17.678.409.274.912.332.586.11
Aug16.937.729.204.702.152.566.10
Sep15.166.928.244.211.922.296.34
Oct13.666.437.233.791.792.016.18
Nov11.755.955.803.261.651.615.80
Dec11.335.635.703.151.561.585.54
Mean15.127.128.014.201.982.225.82
Publisher’s Note: MDPI stays neutral with regard to jurisdictional claims in published maps and institutional affiliations.

