
Coseismic Deformation Mechanisms of the 2021 Ms 6.4 Yangbi Earthquake, Yunnan Province, Using InSAR Observations


Abstract
:
1. Introduction
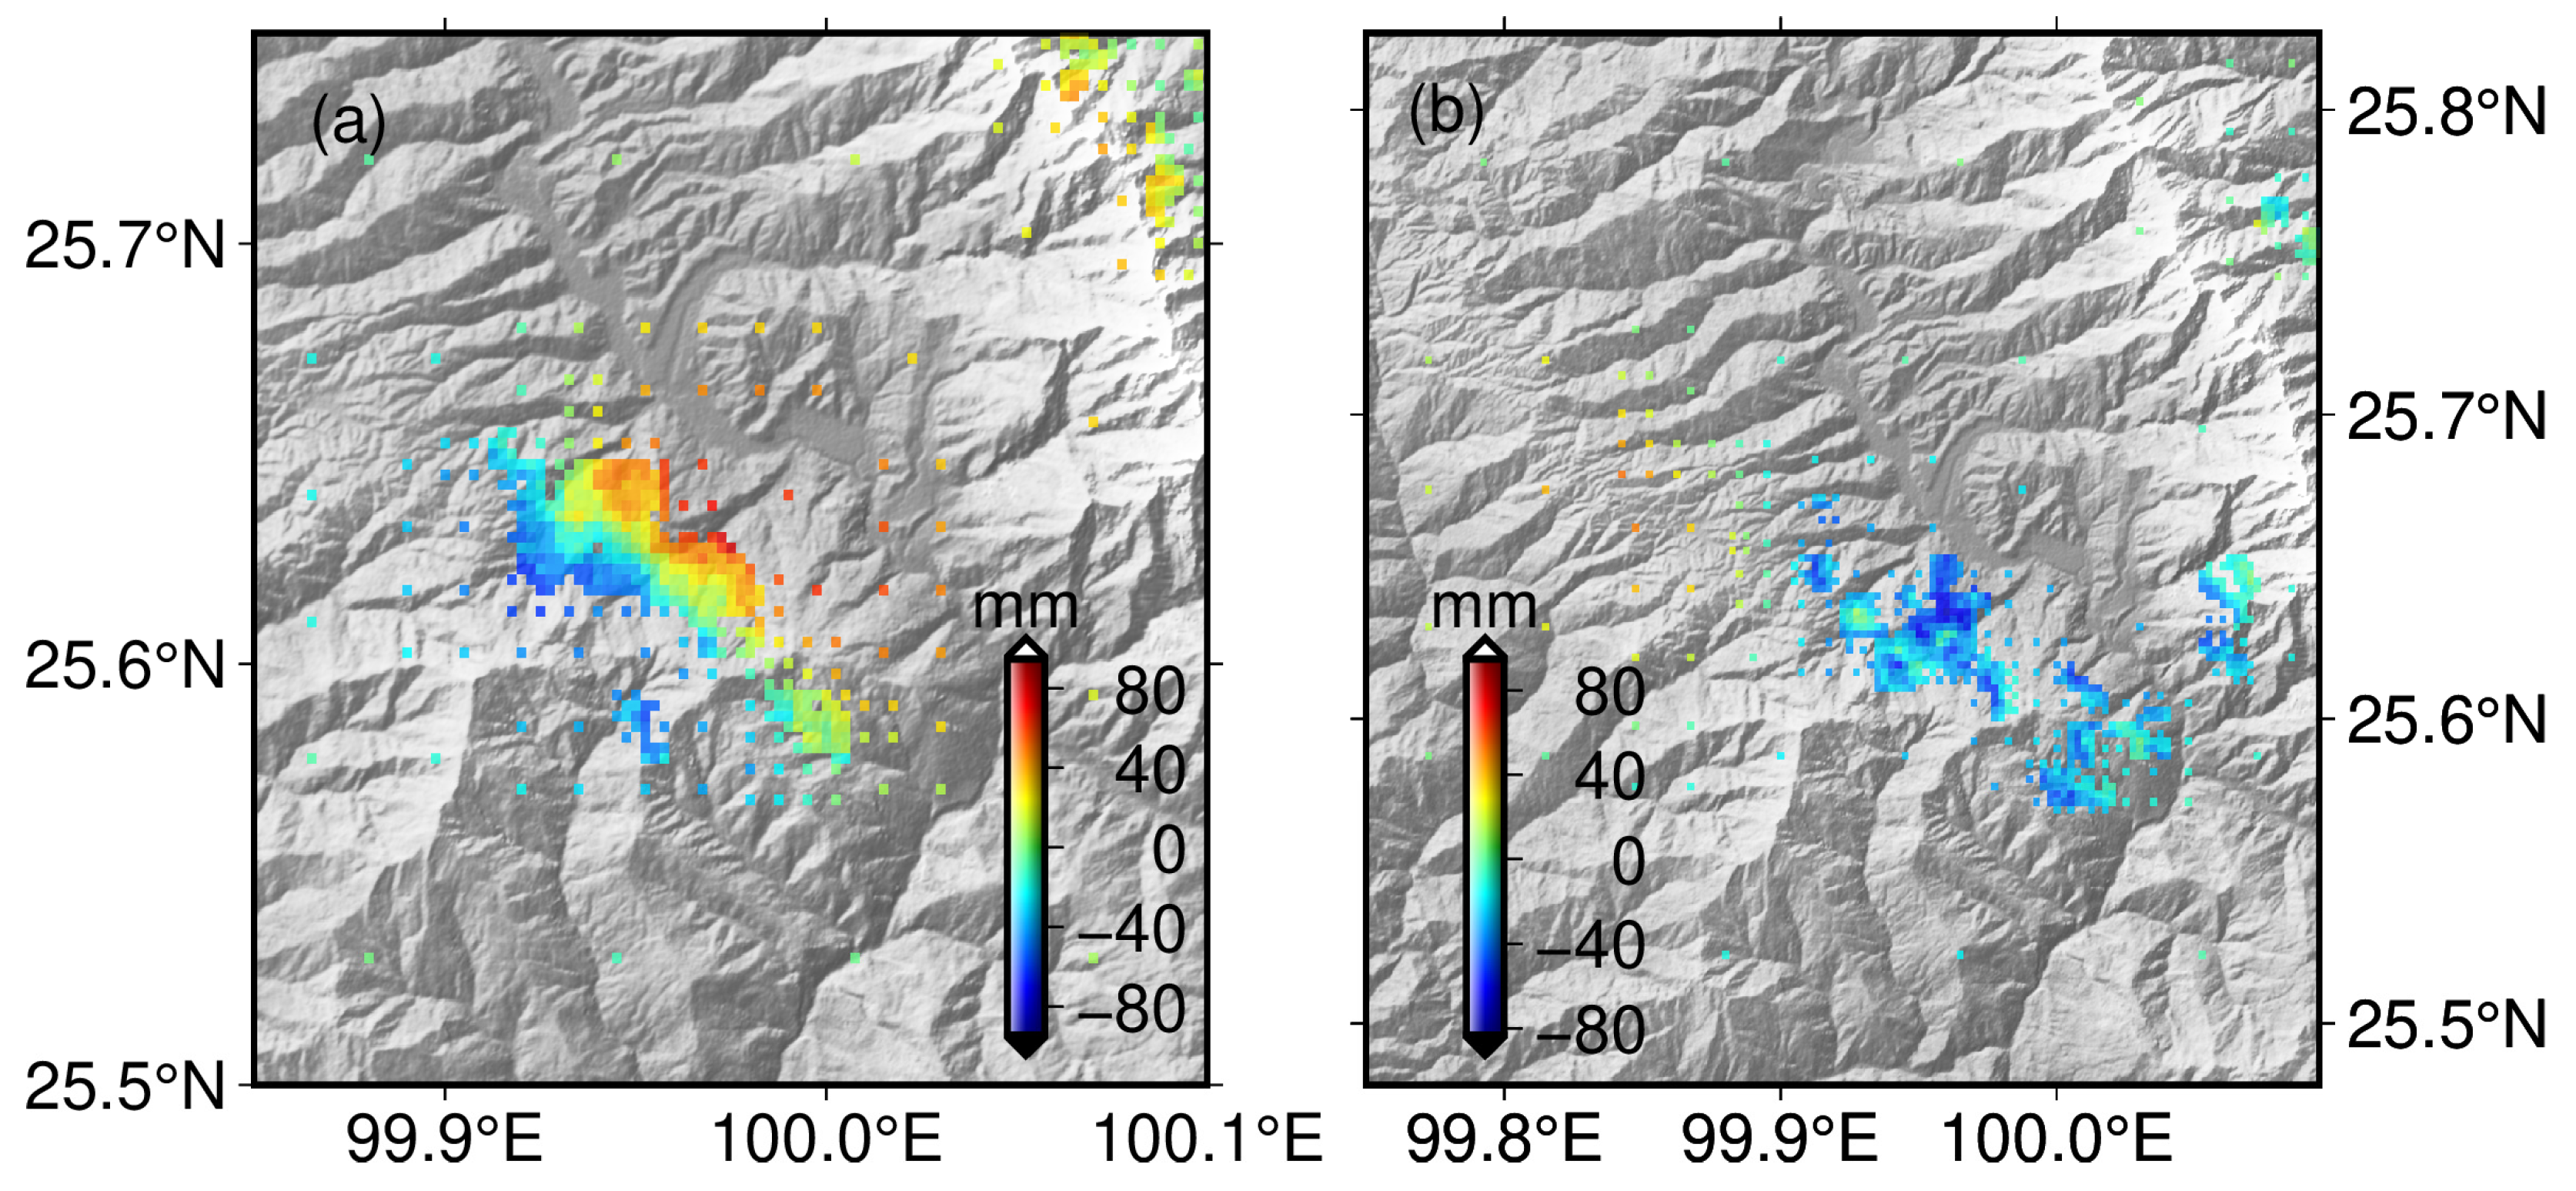
2. Tectonic Setting
3. Methods
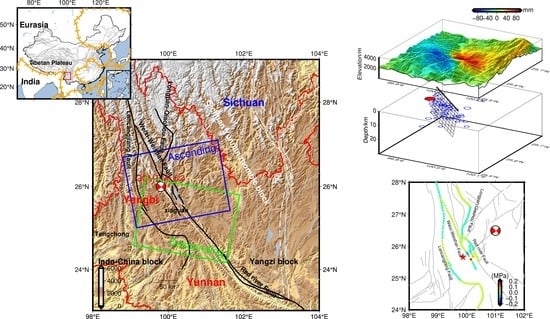
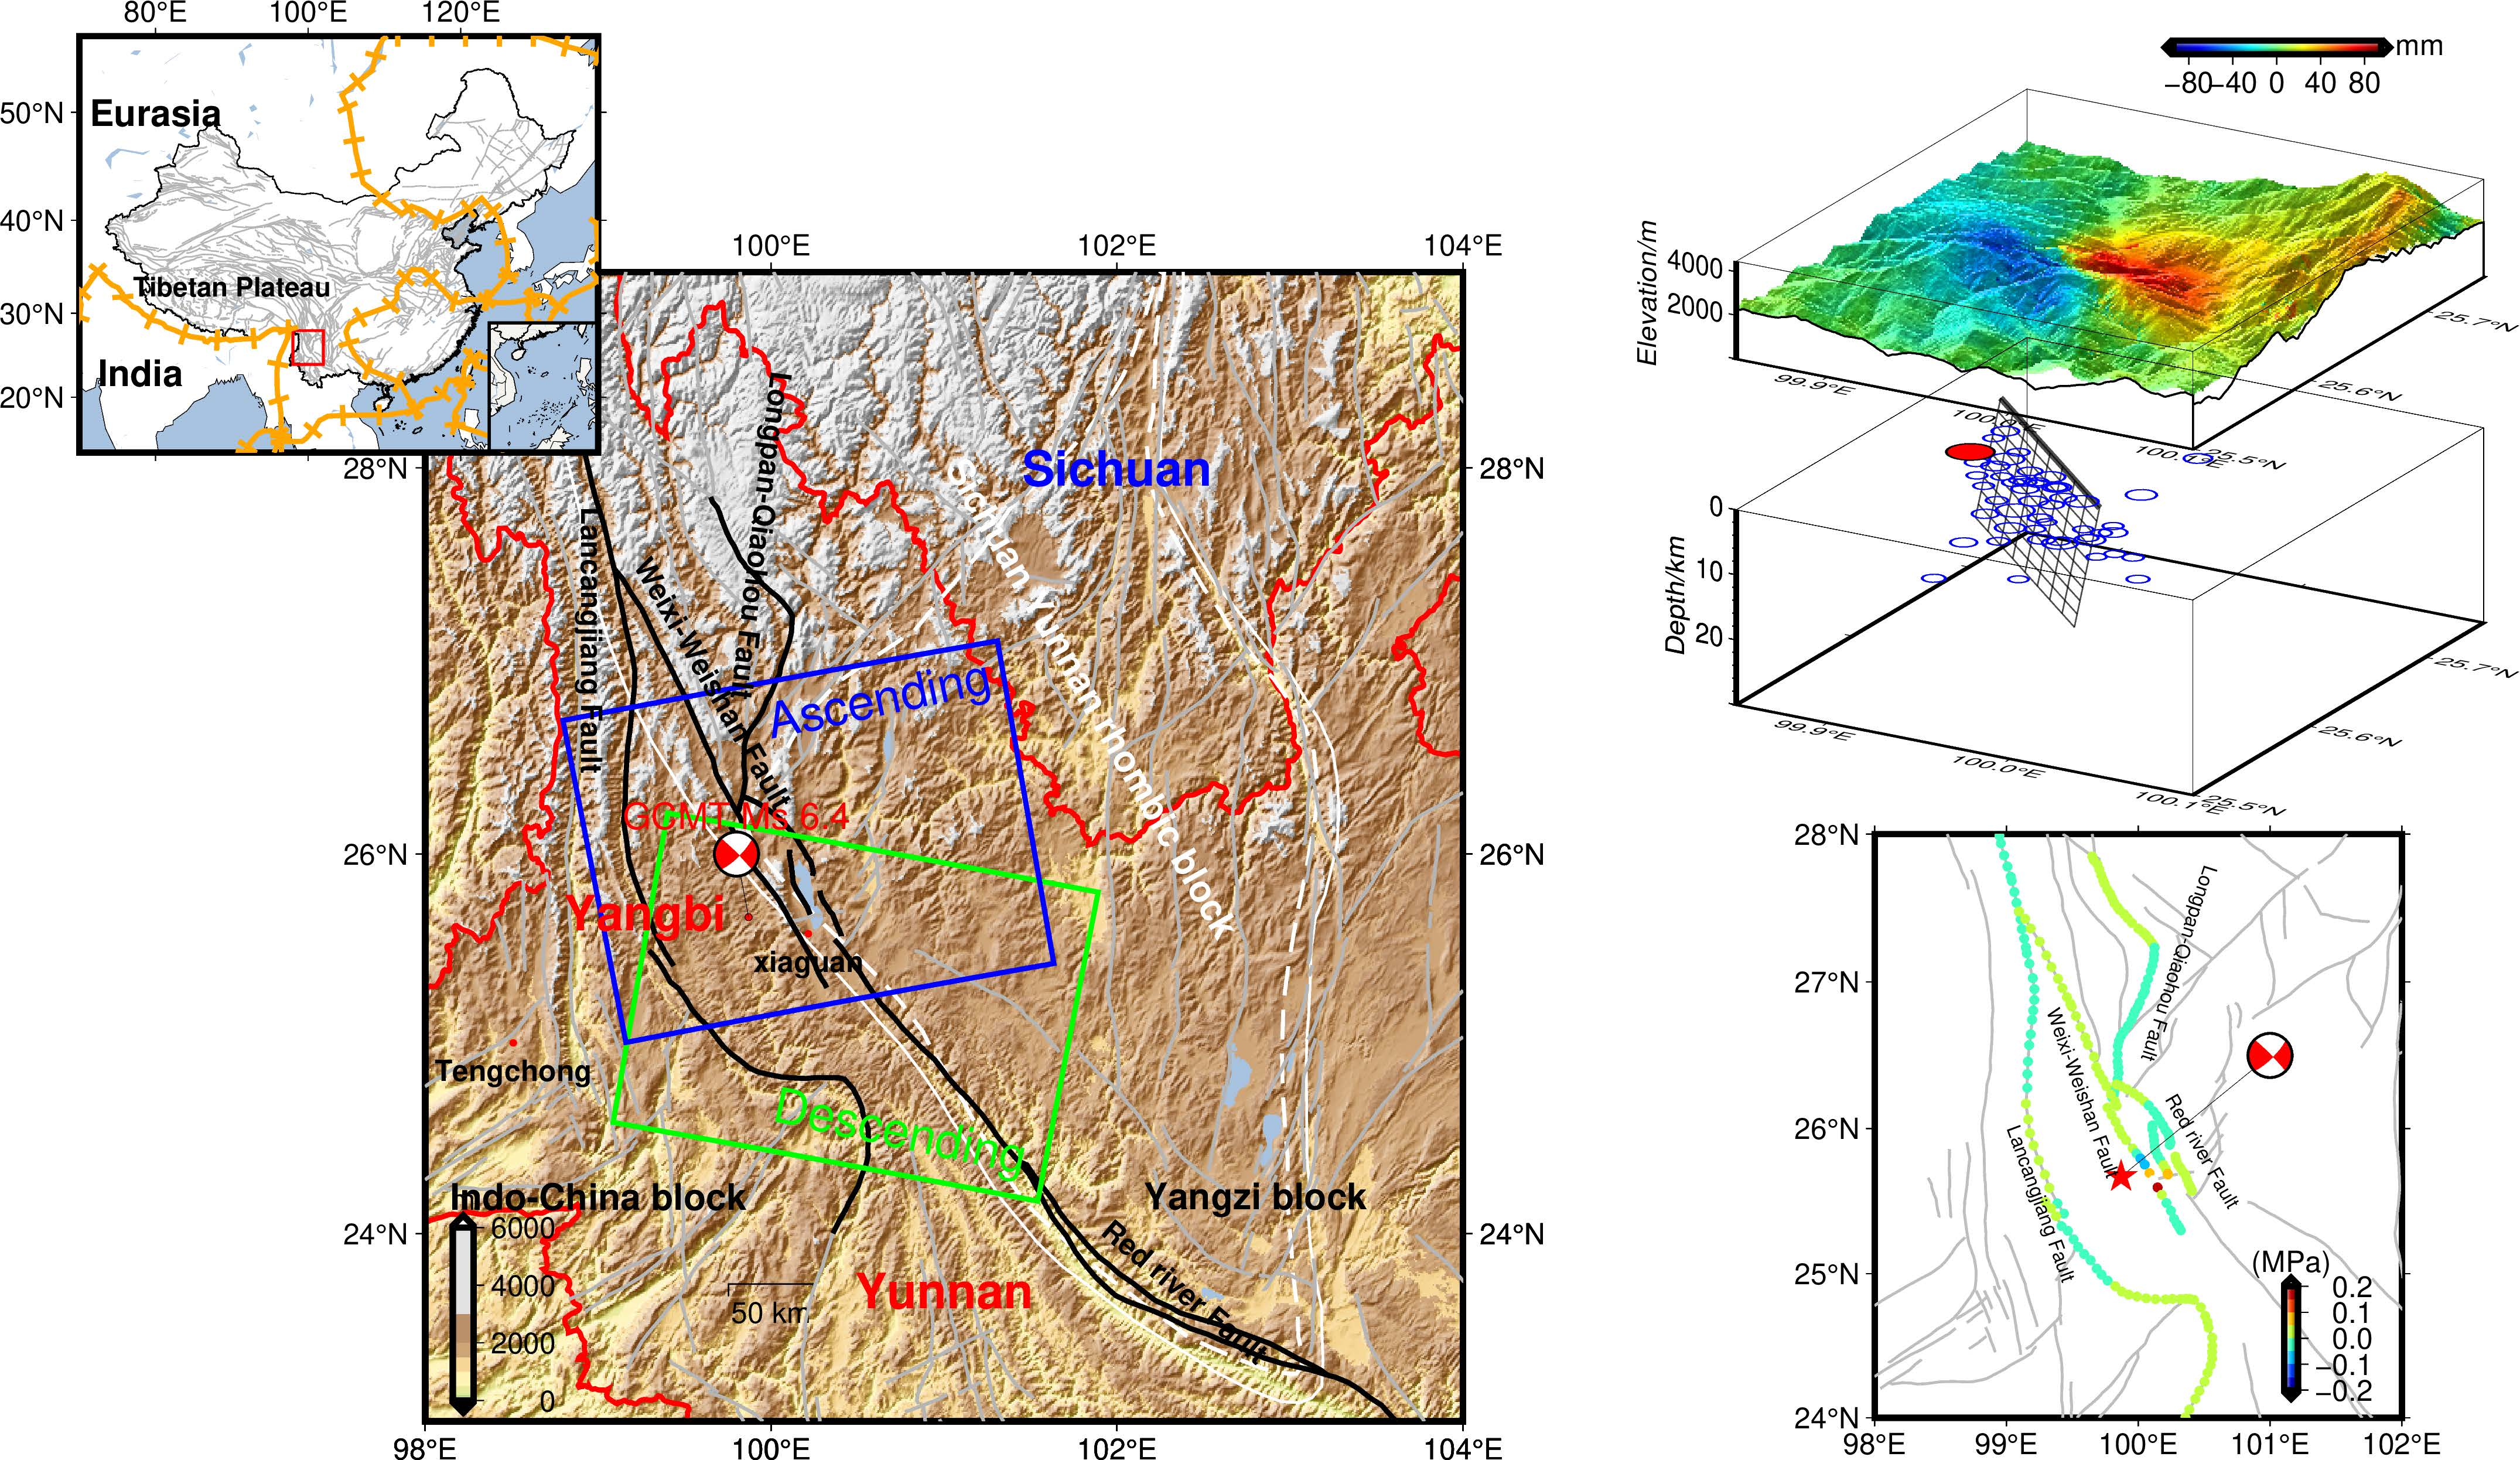
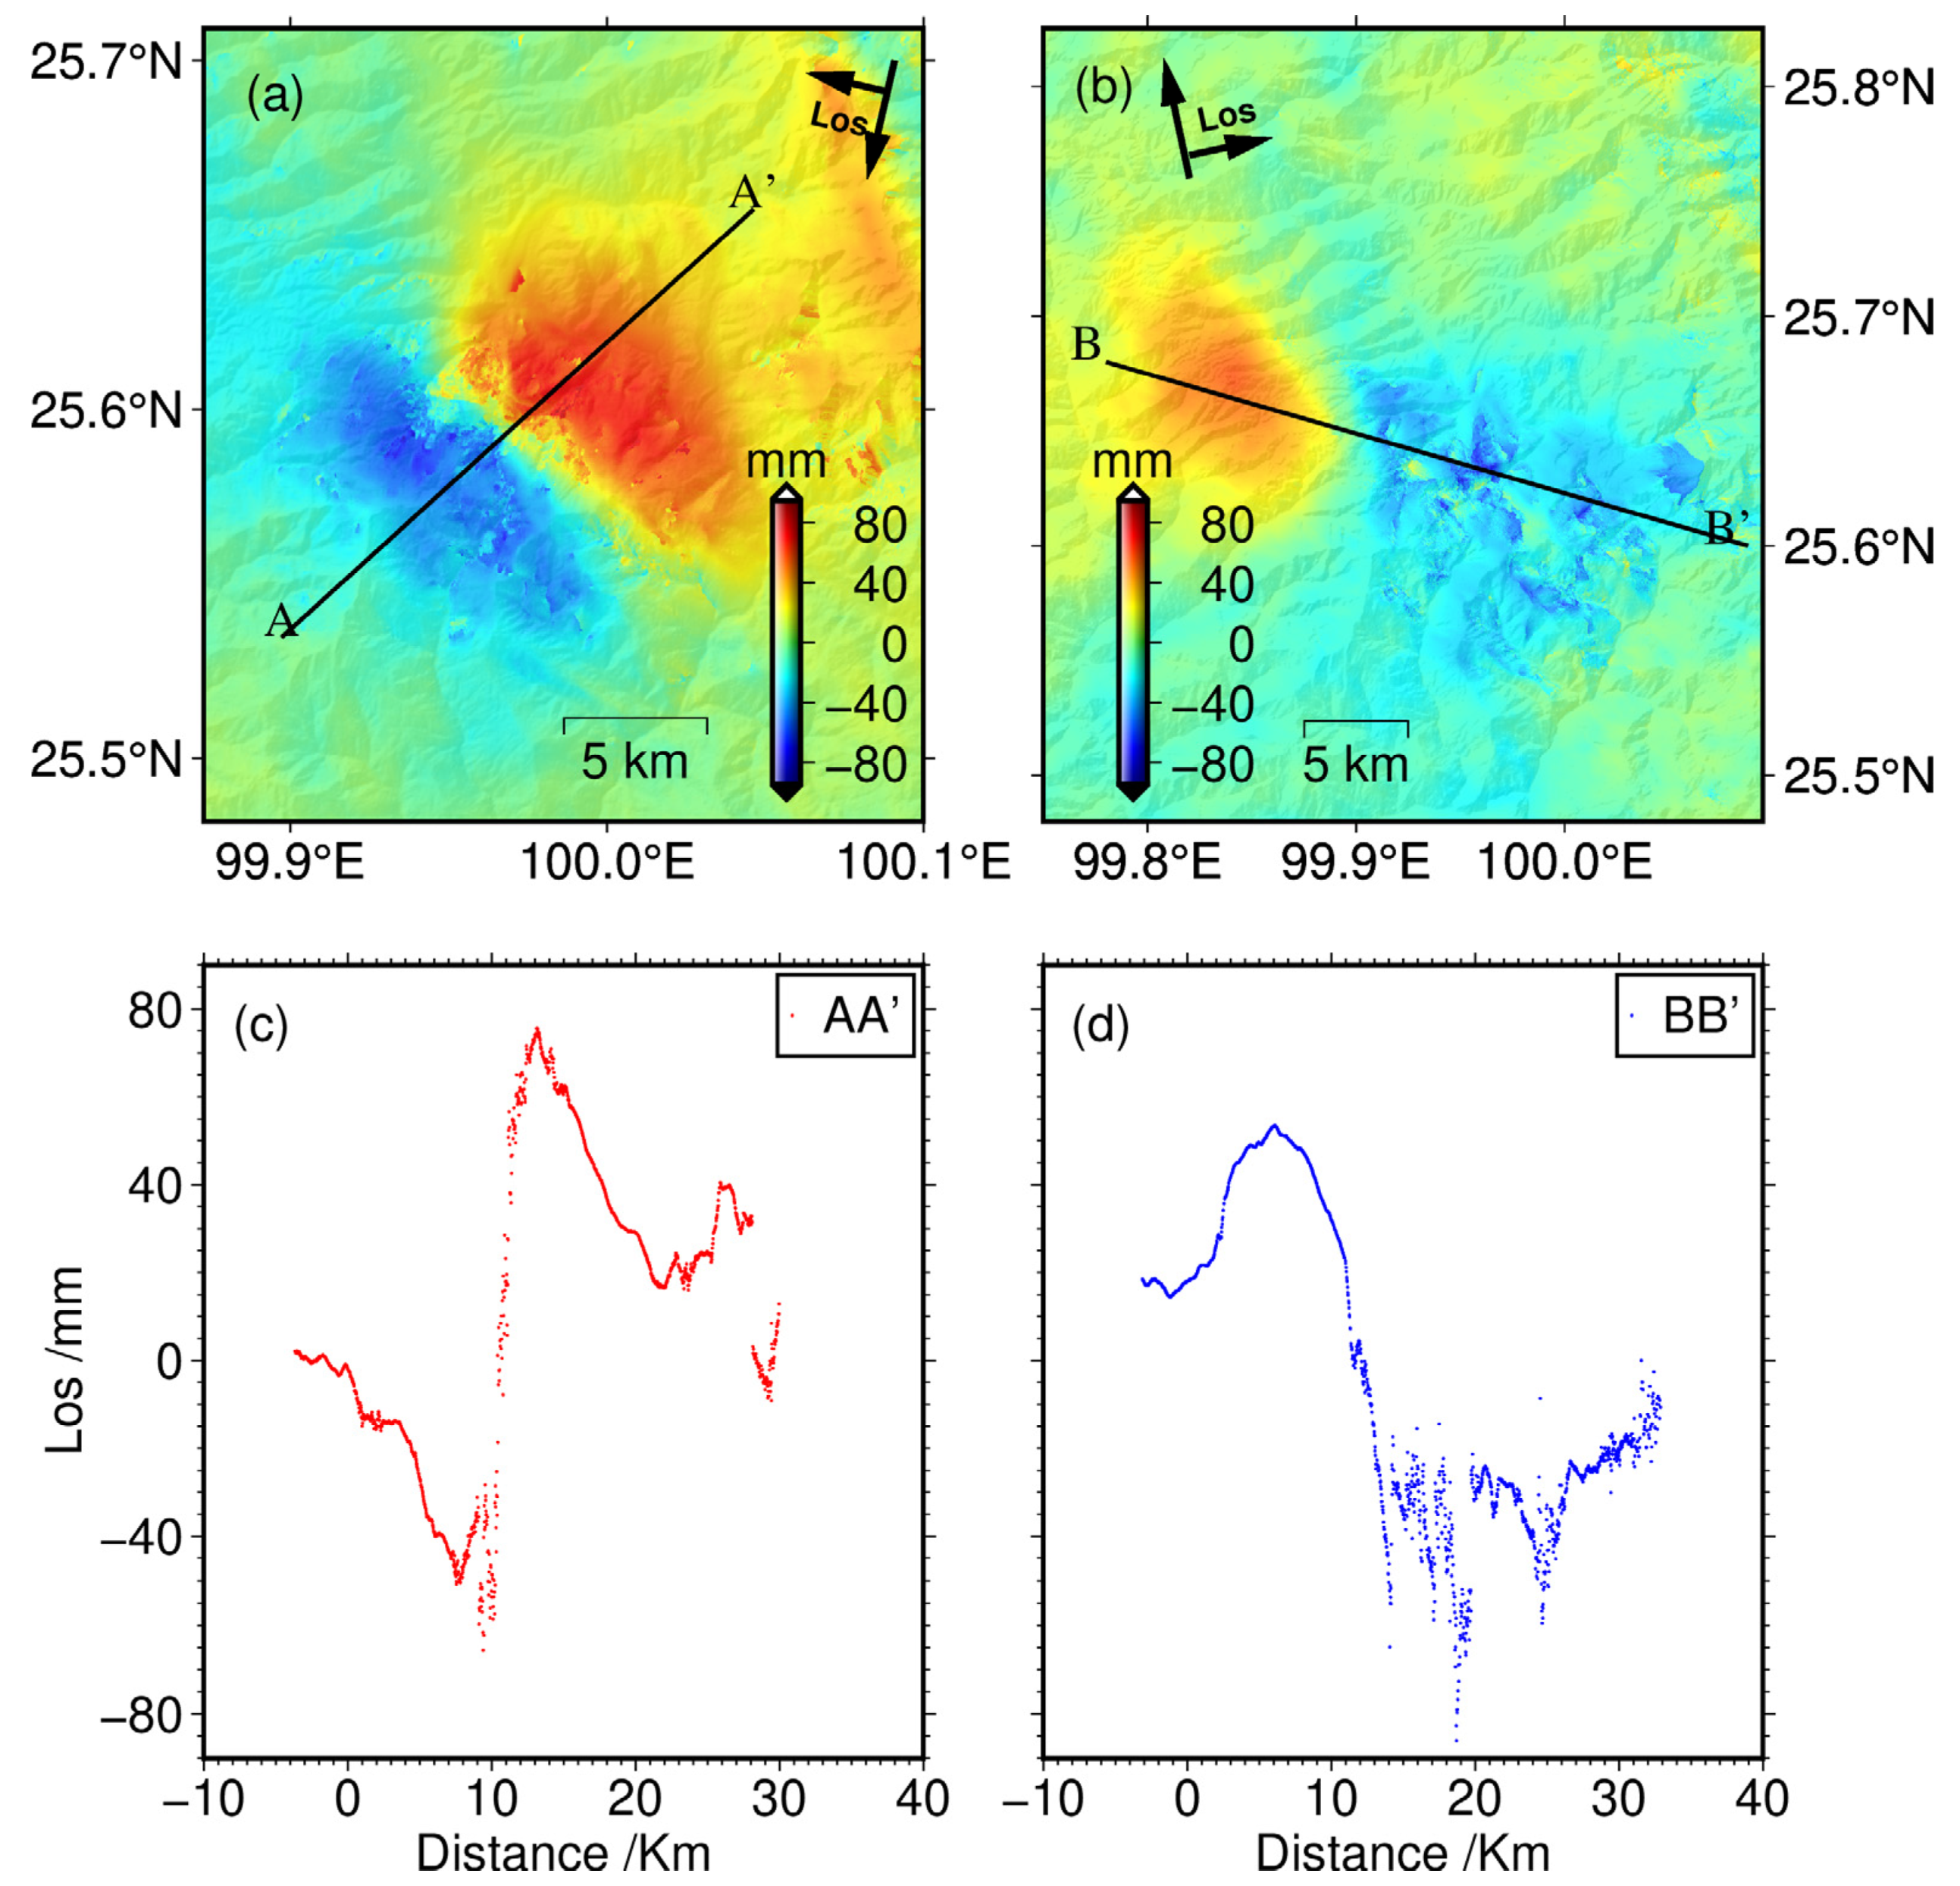
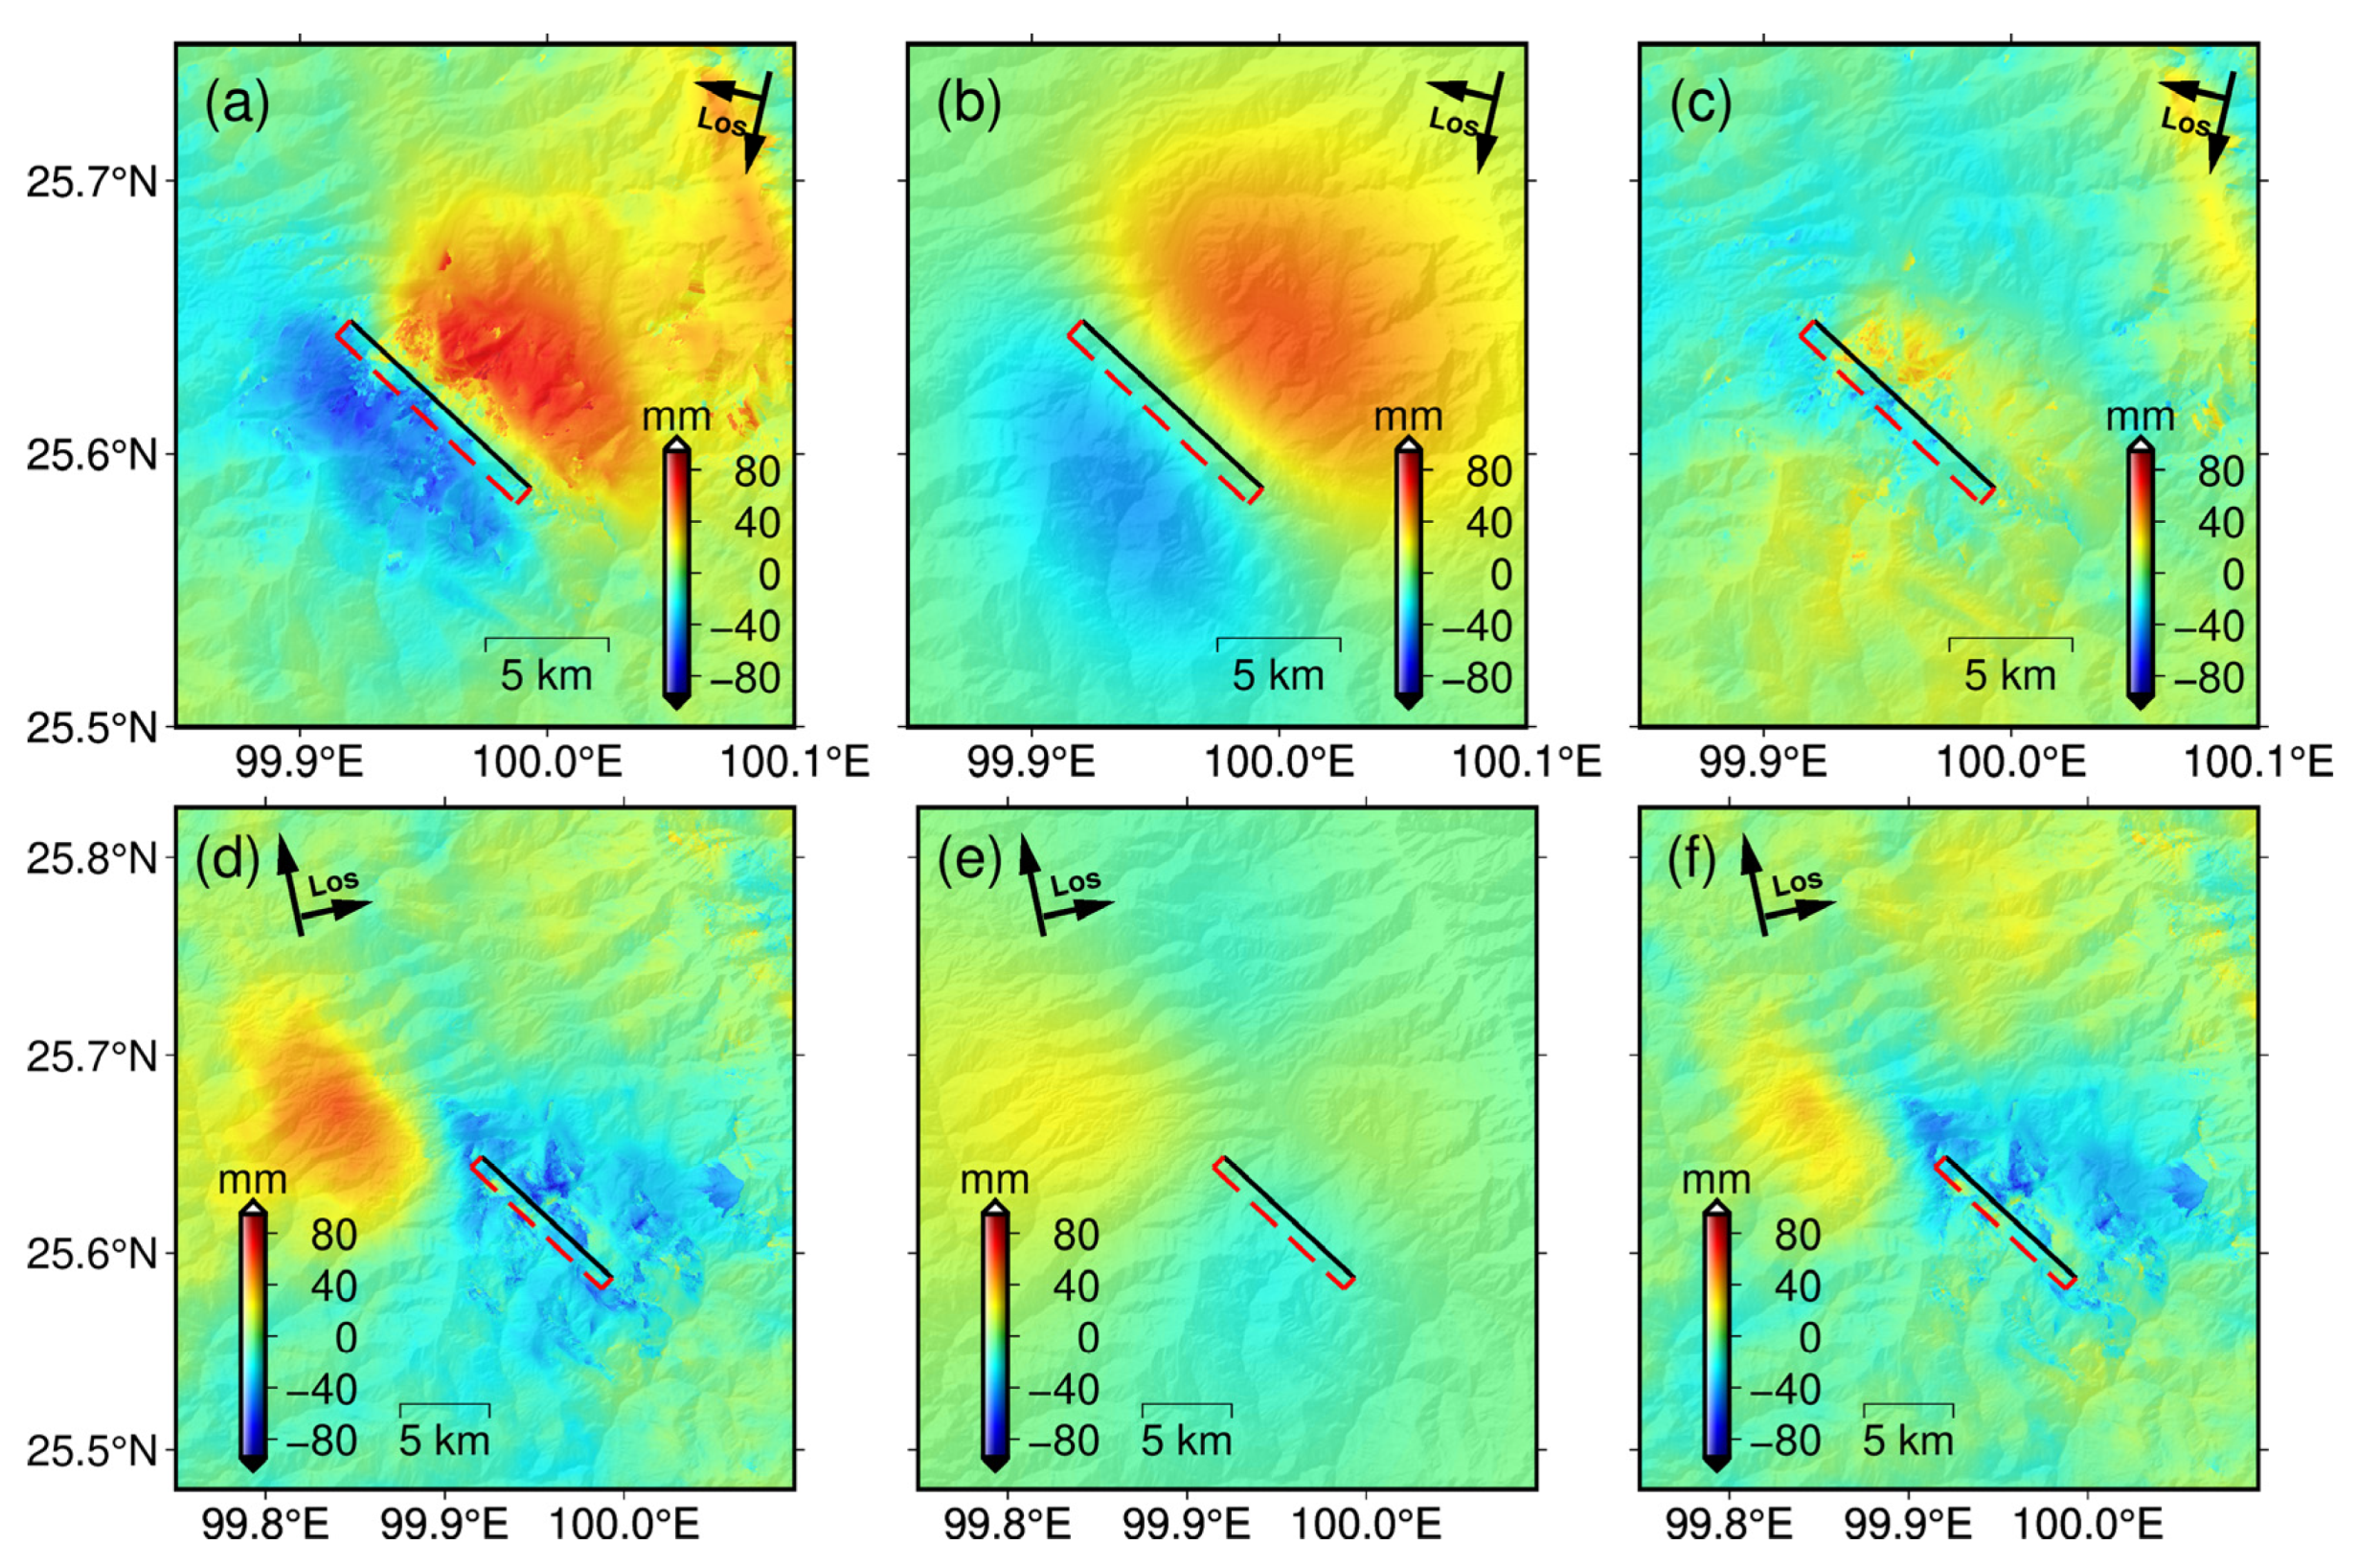
3.1. InSAR Data and Analysis
3.2. Uniform Slip Model
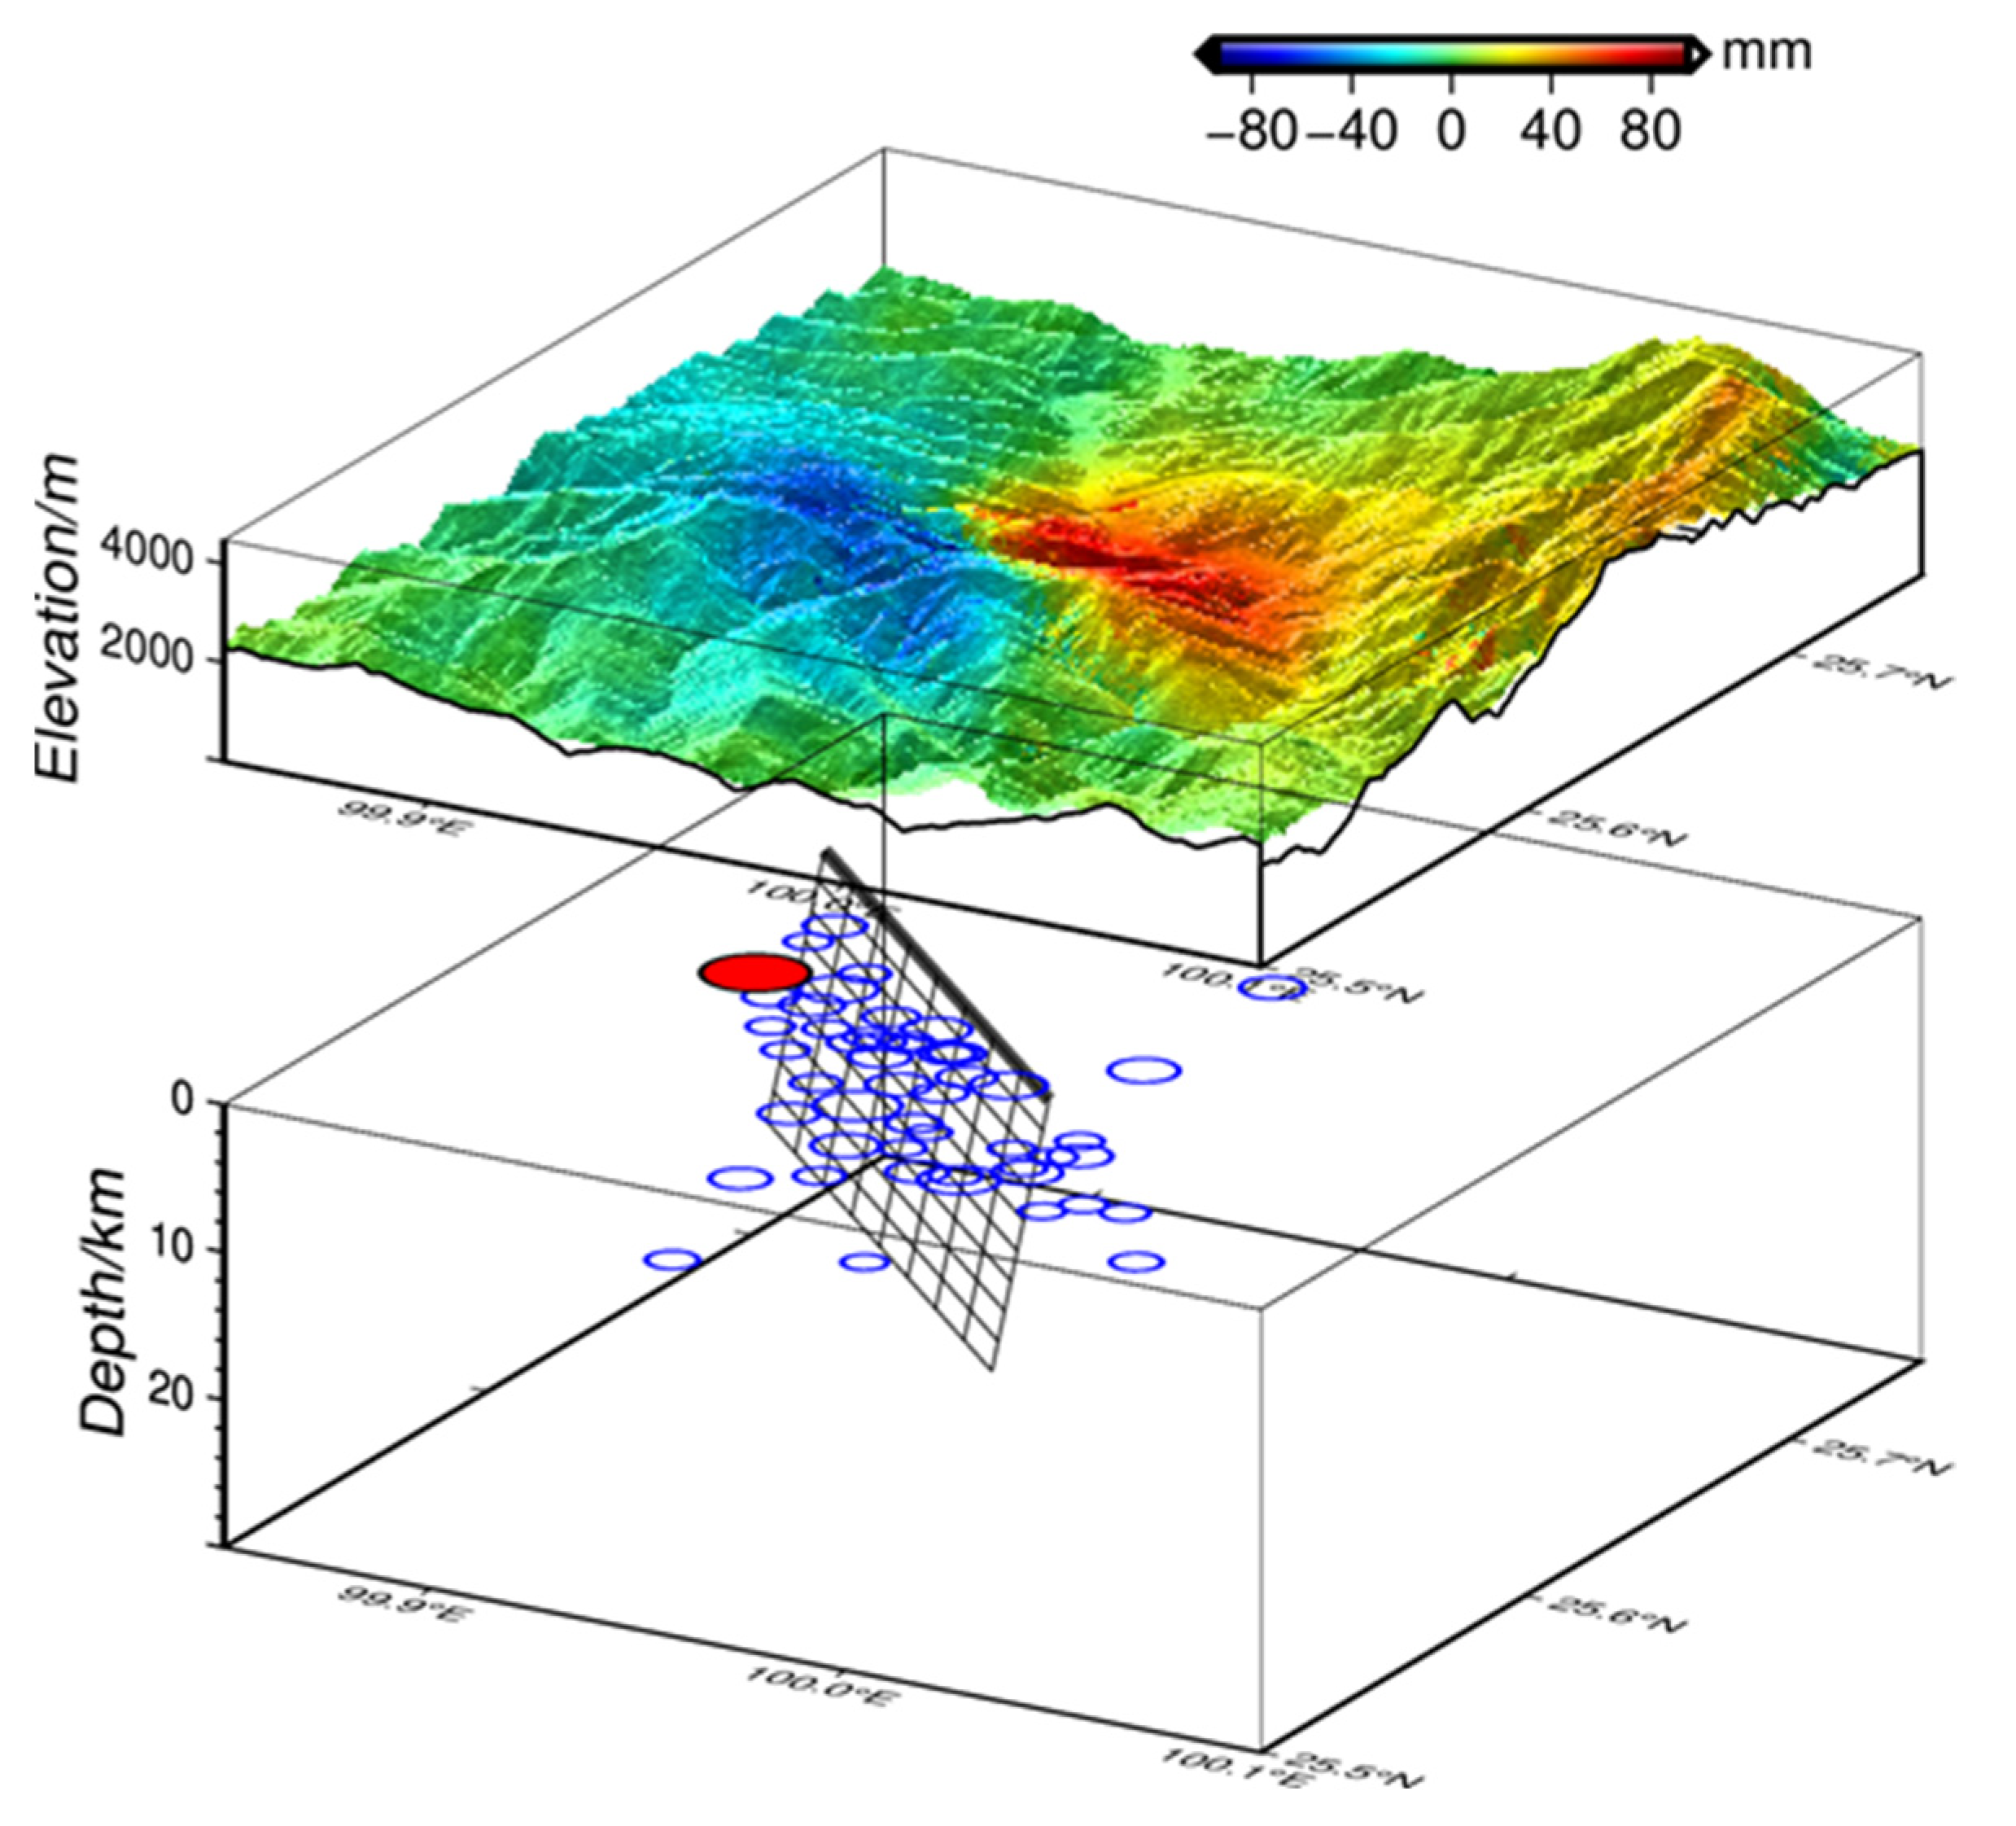
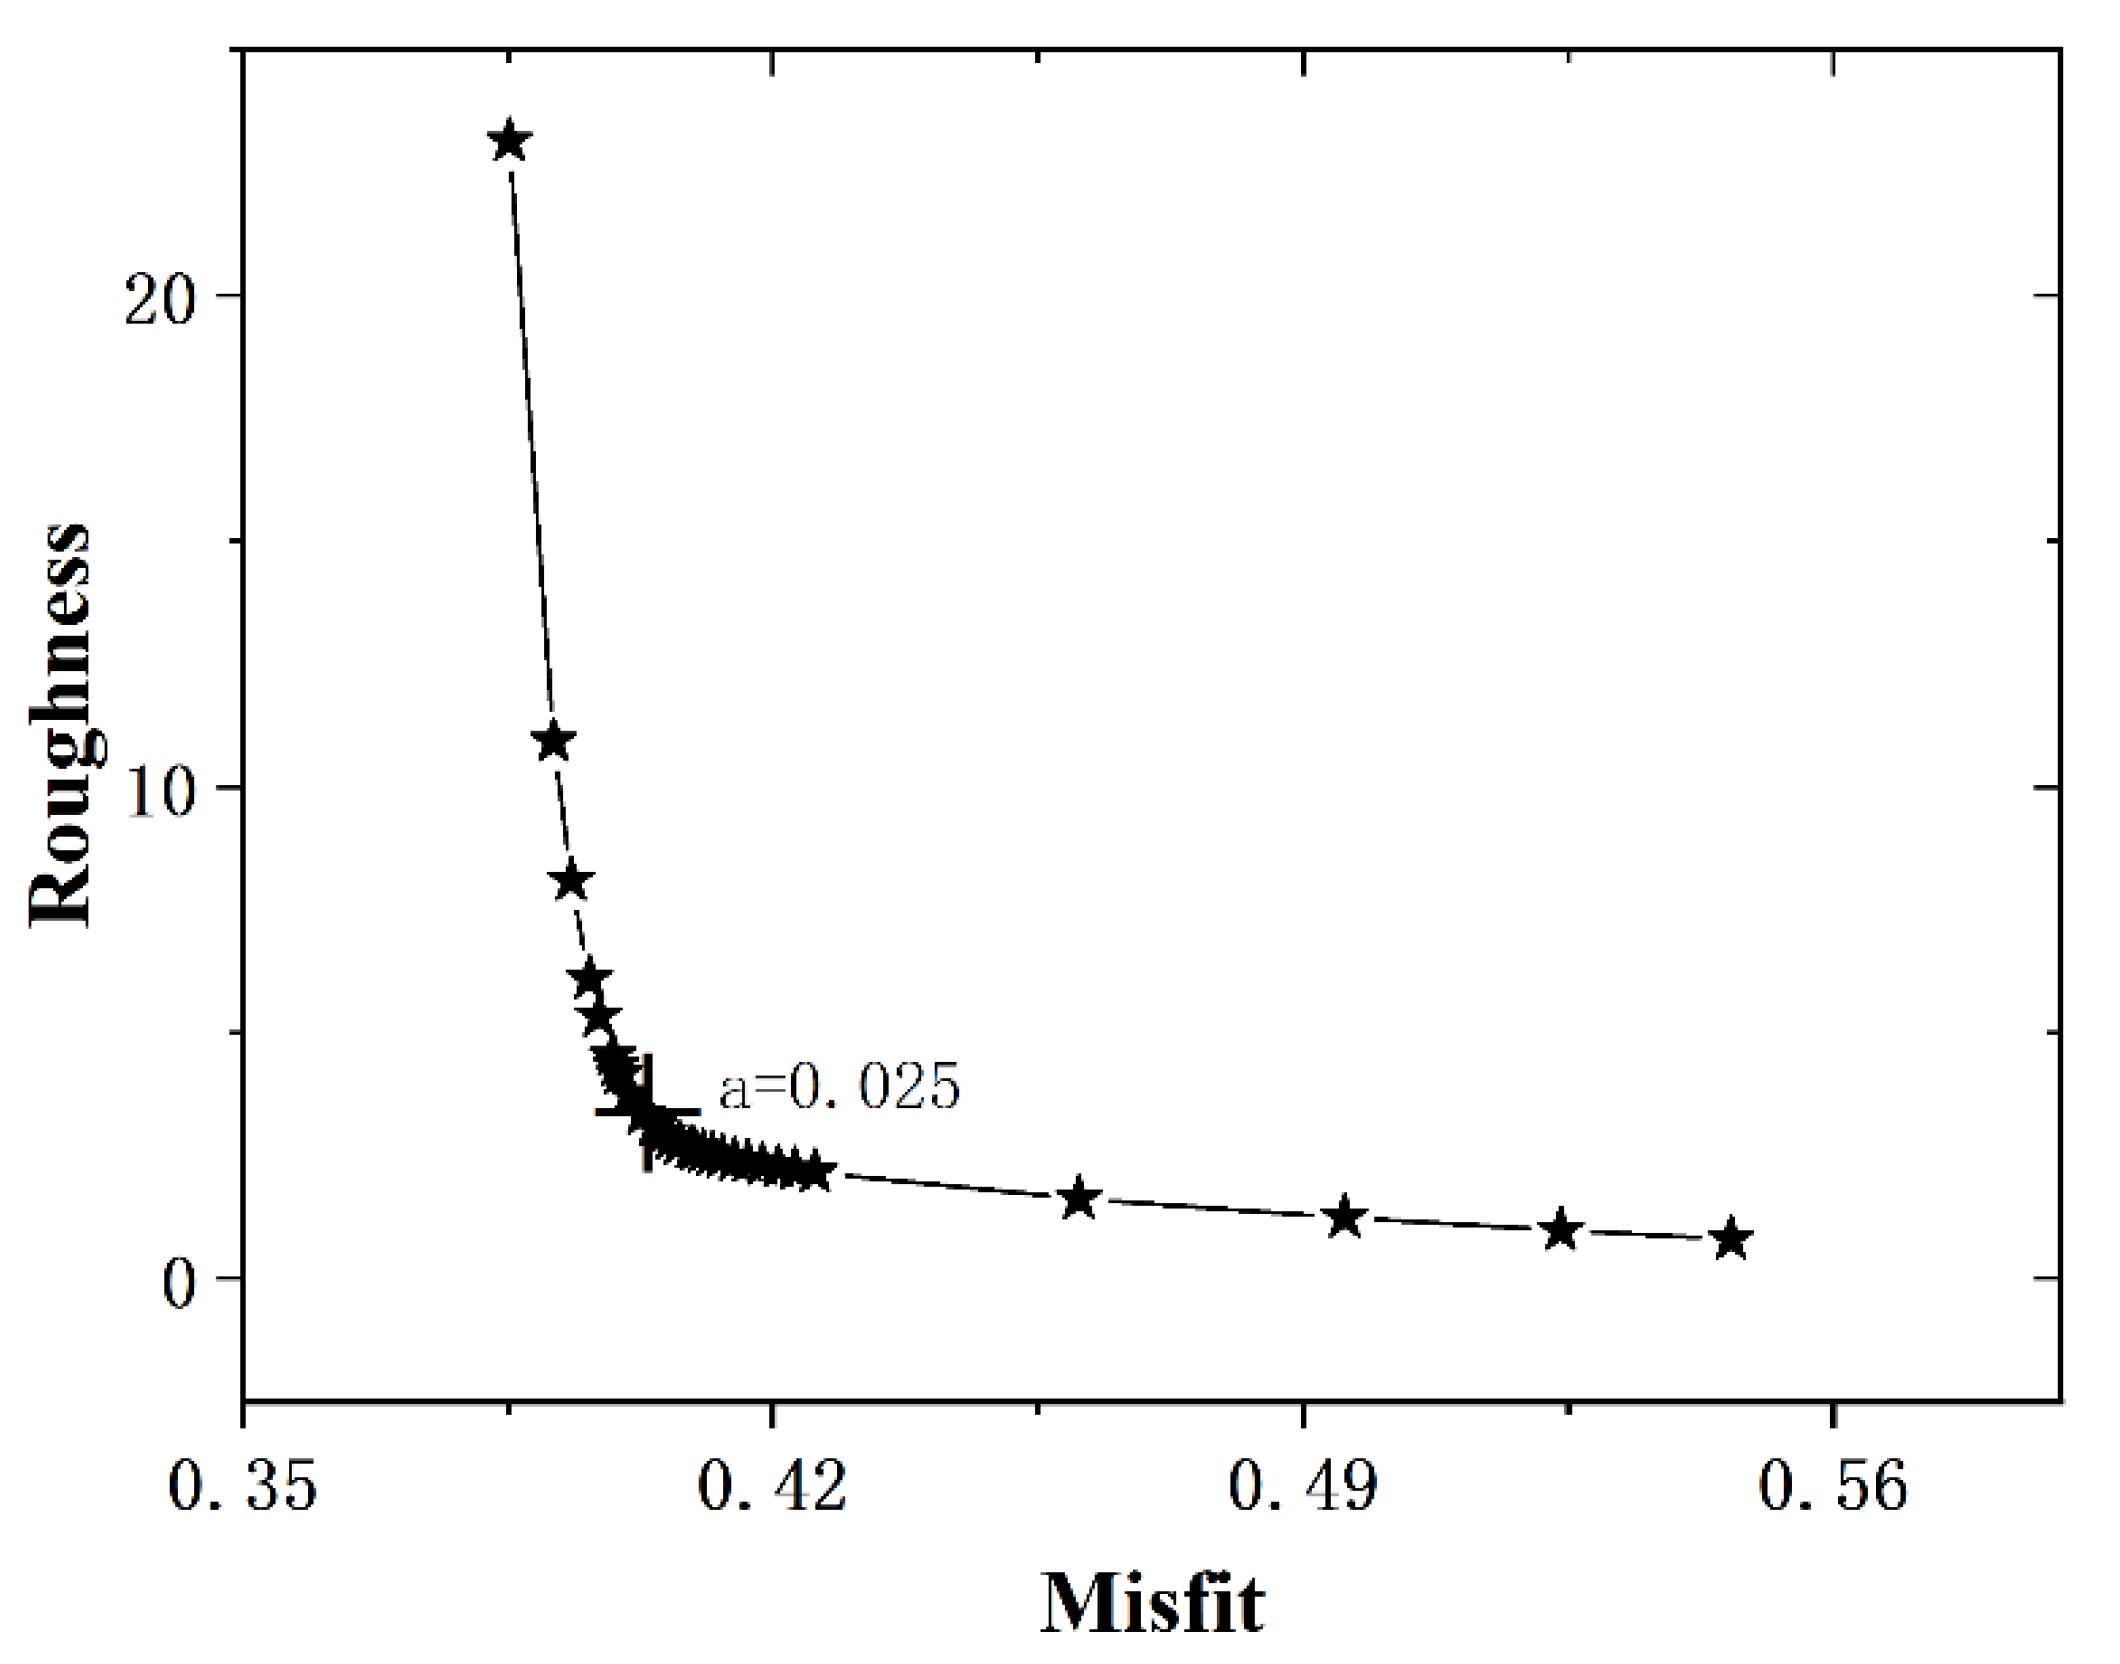
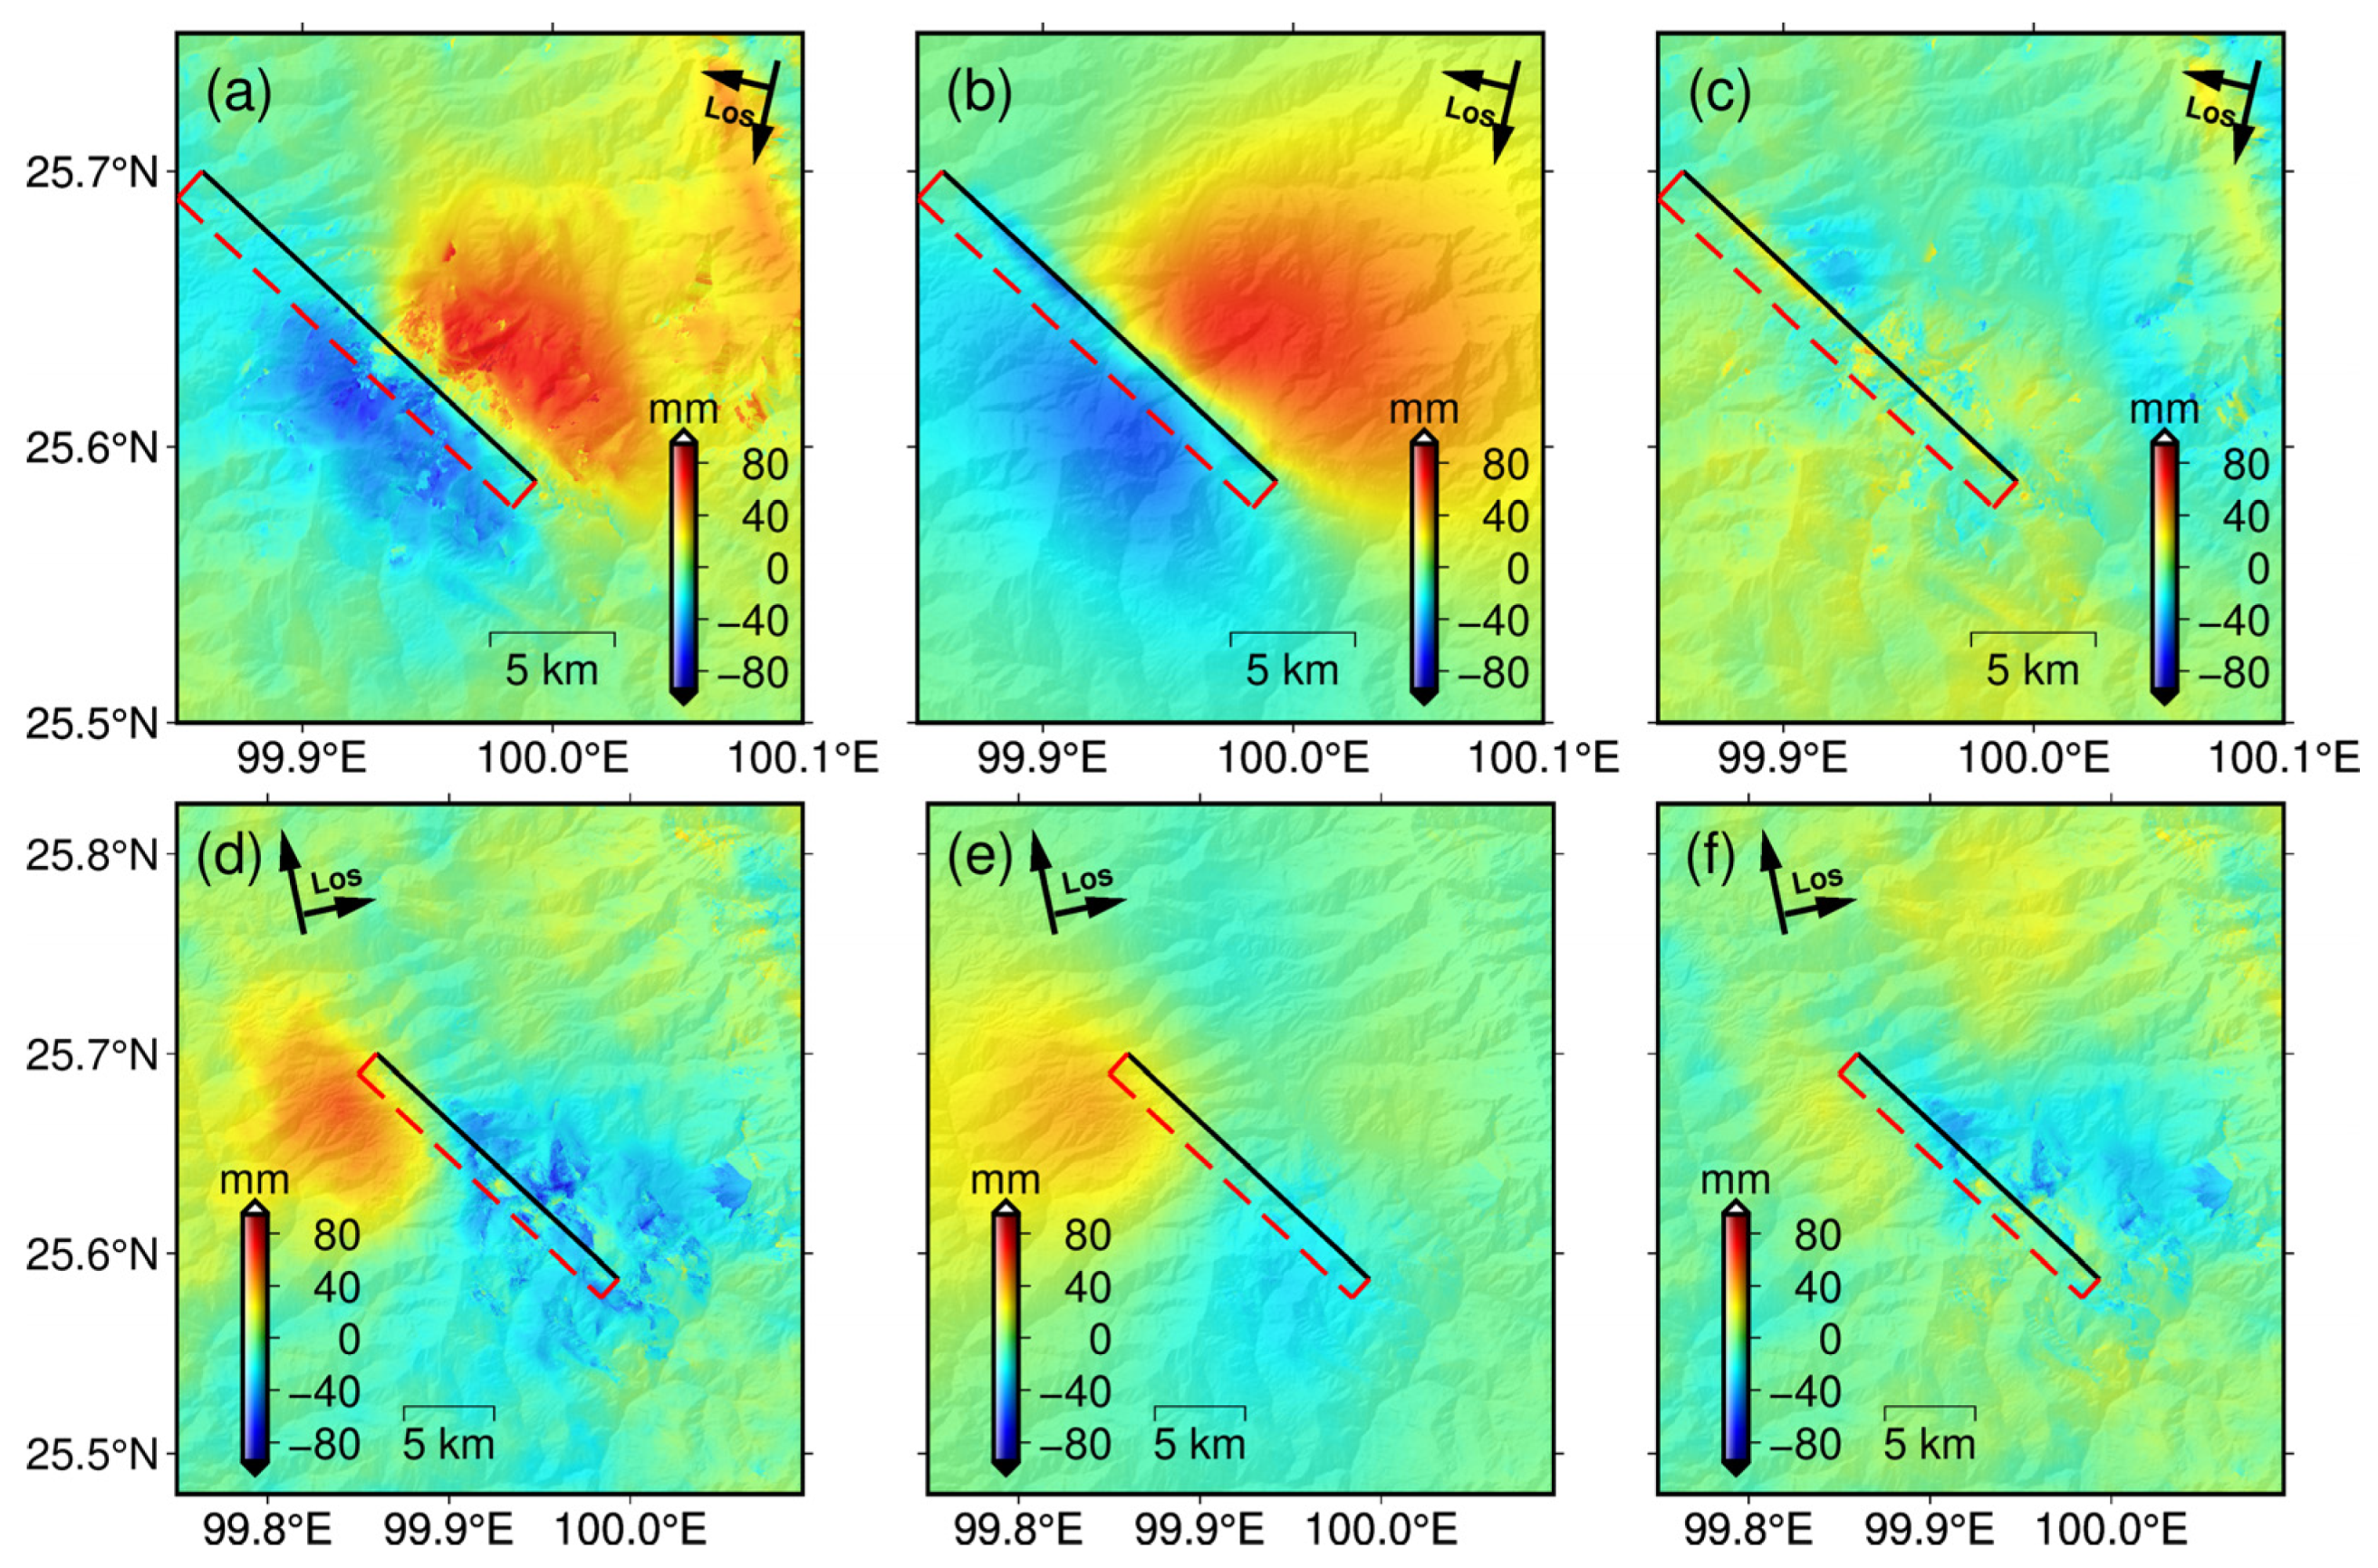
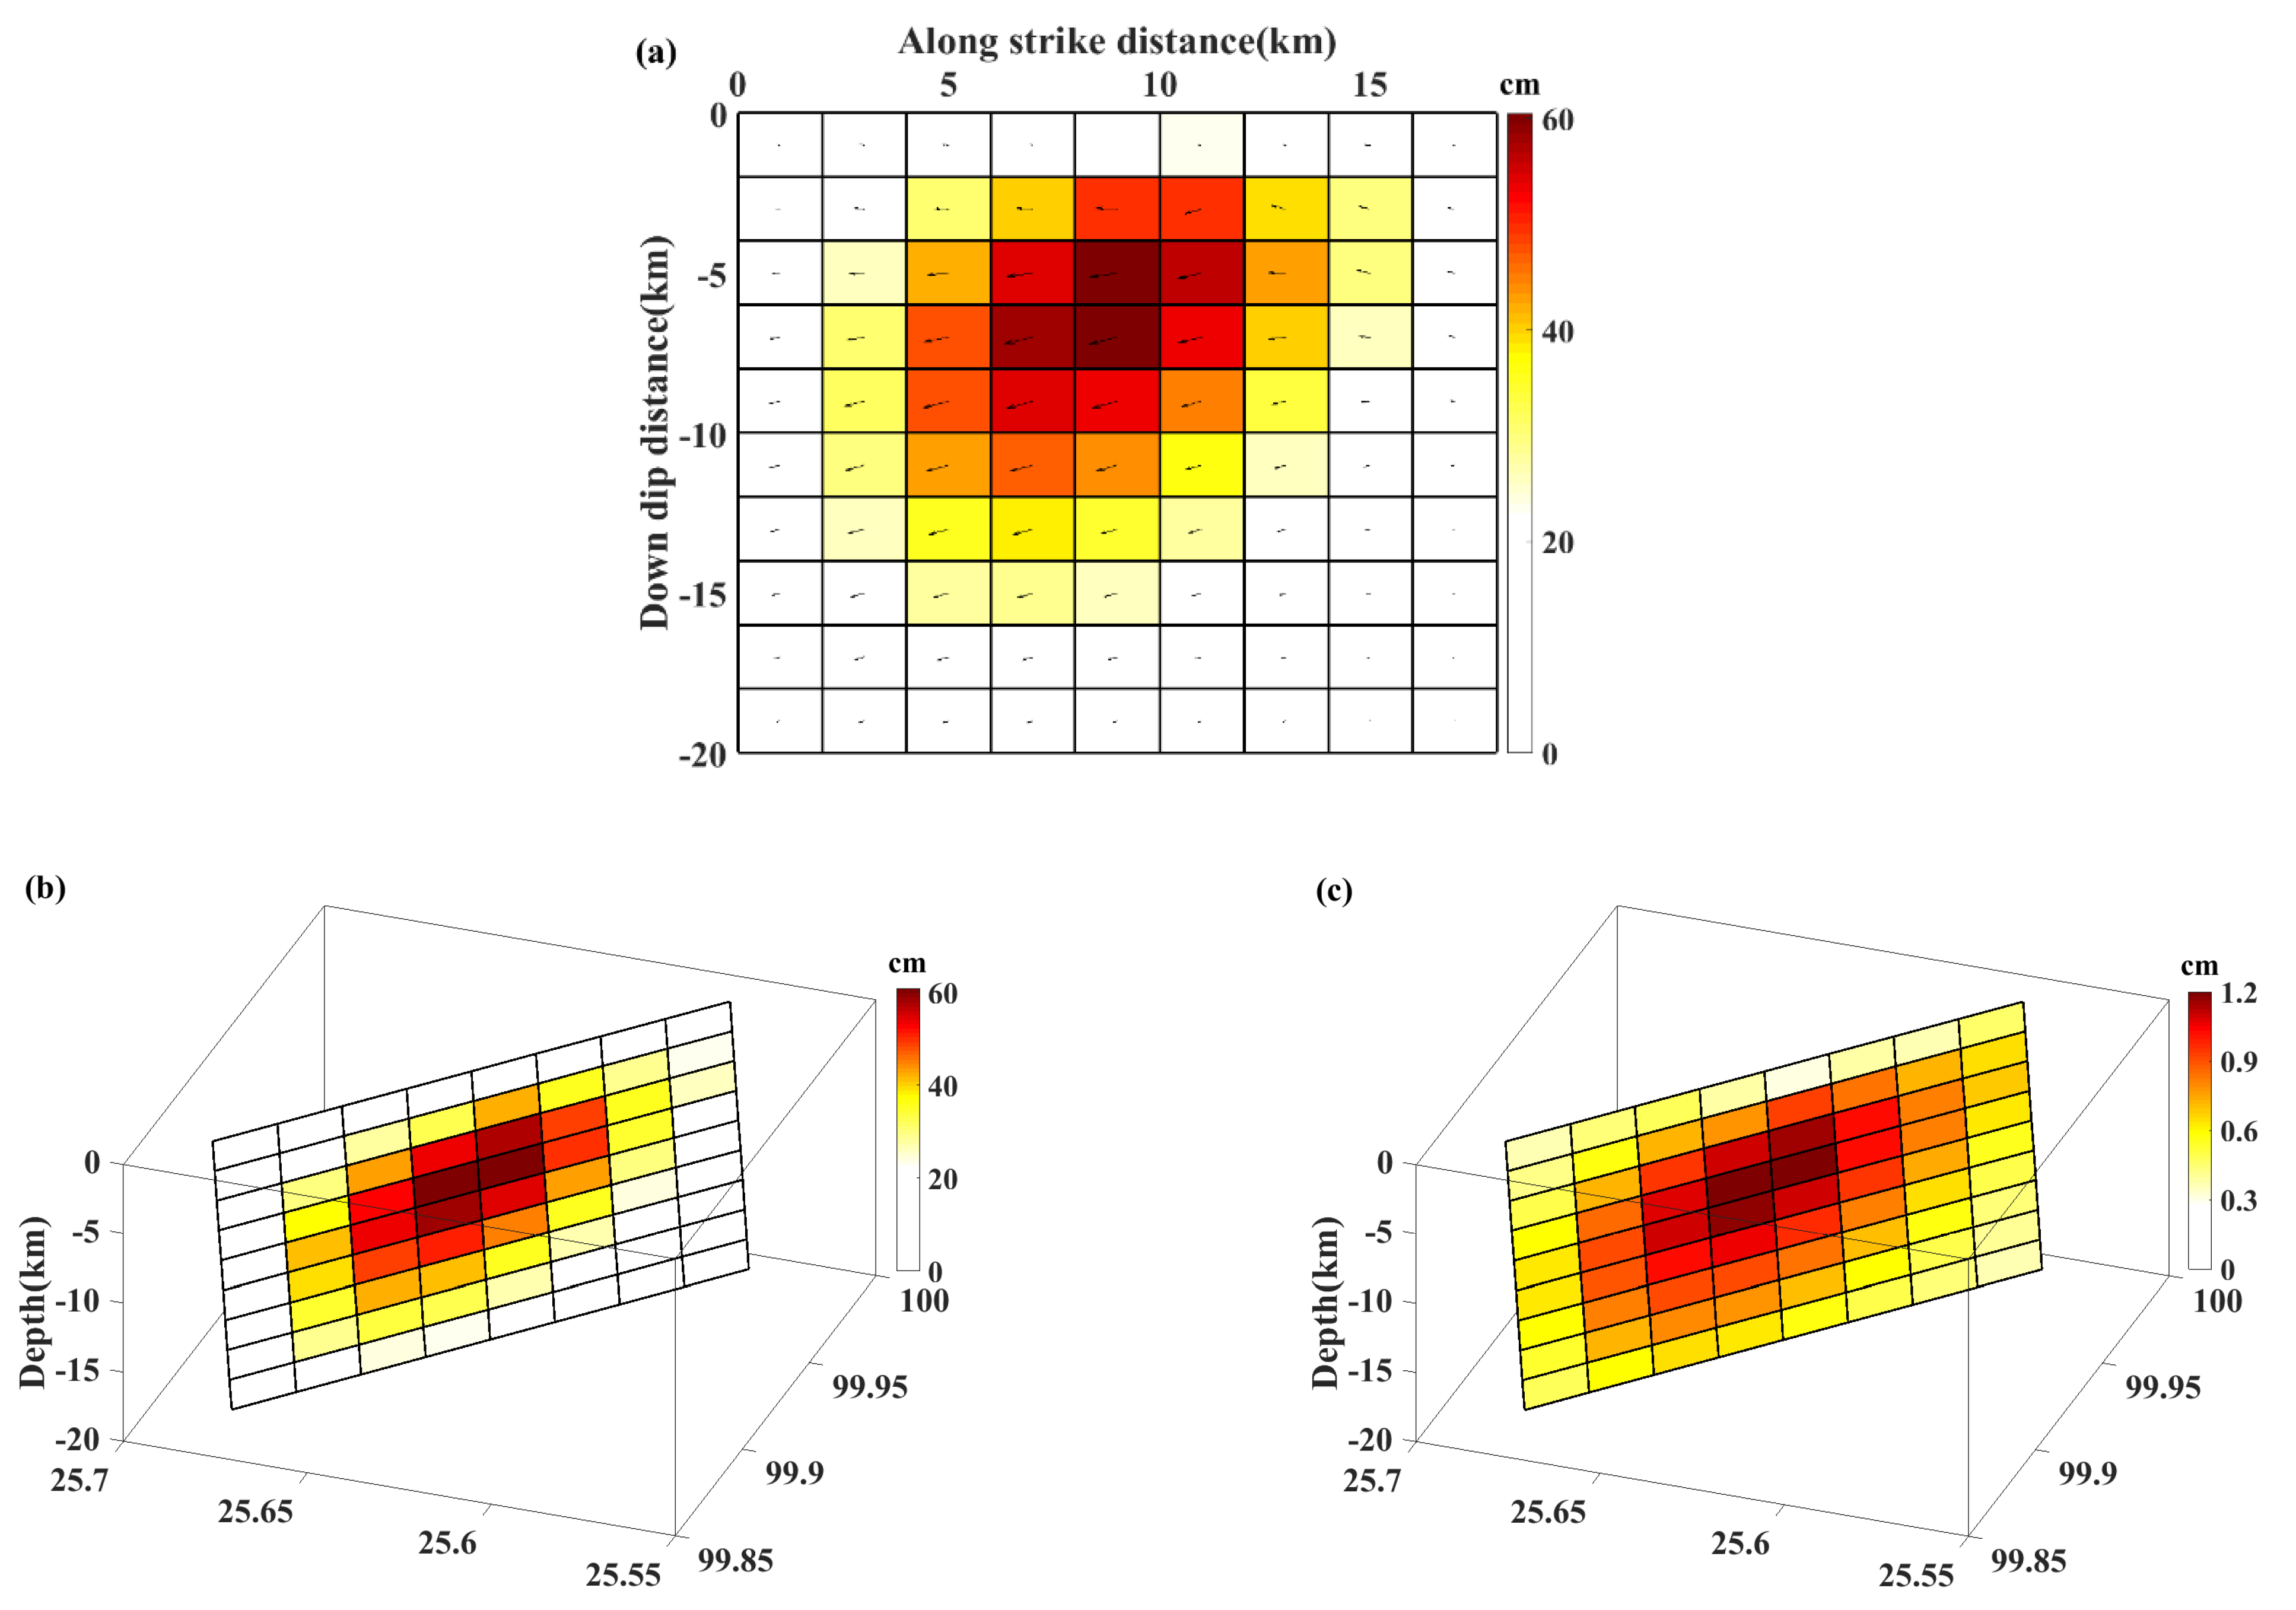
3.3. Distributed Slip Model
4. Discussion
4.1. Analysis of the Yangbi Earthquake Inversion Results
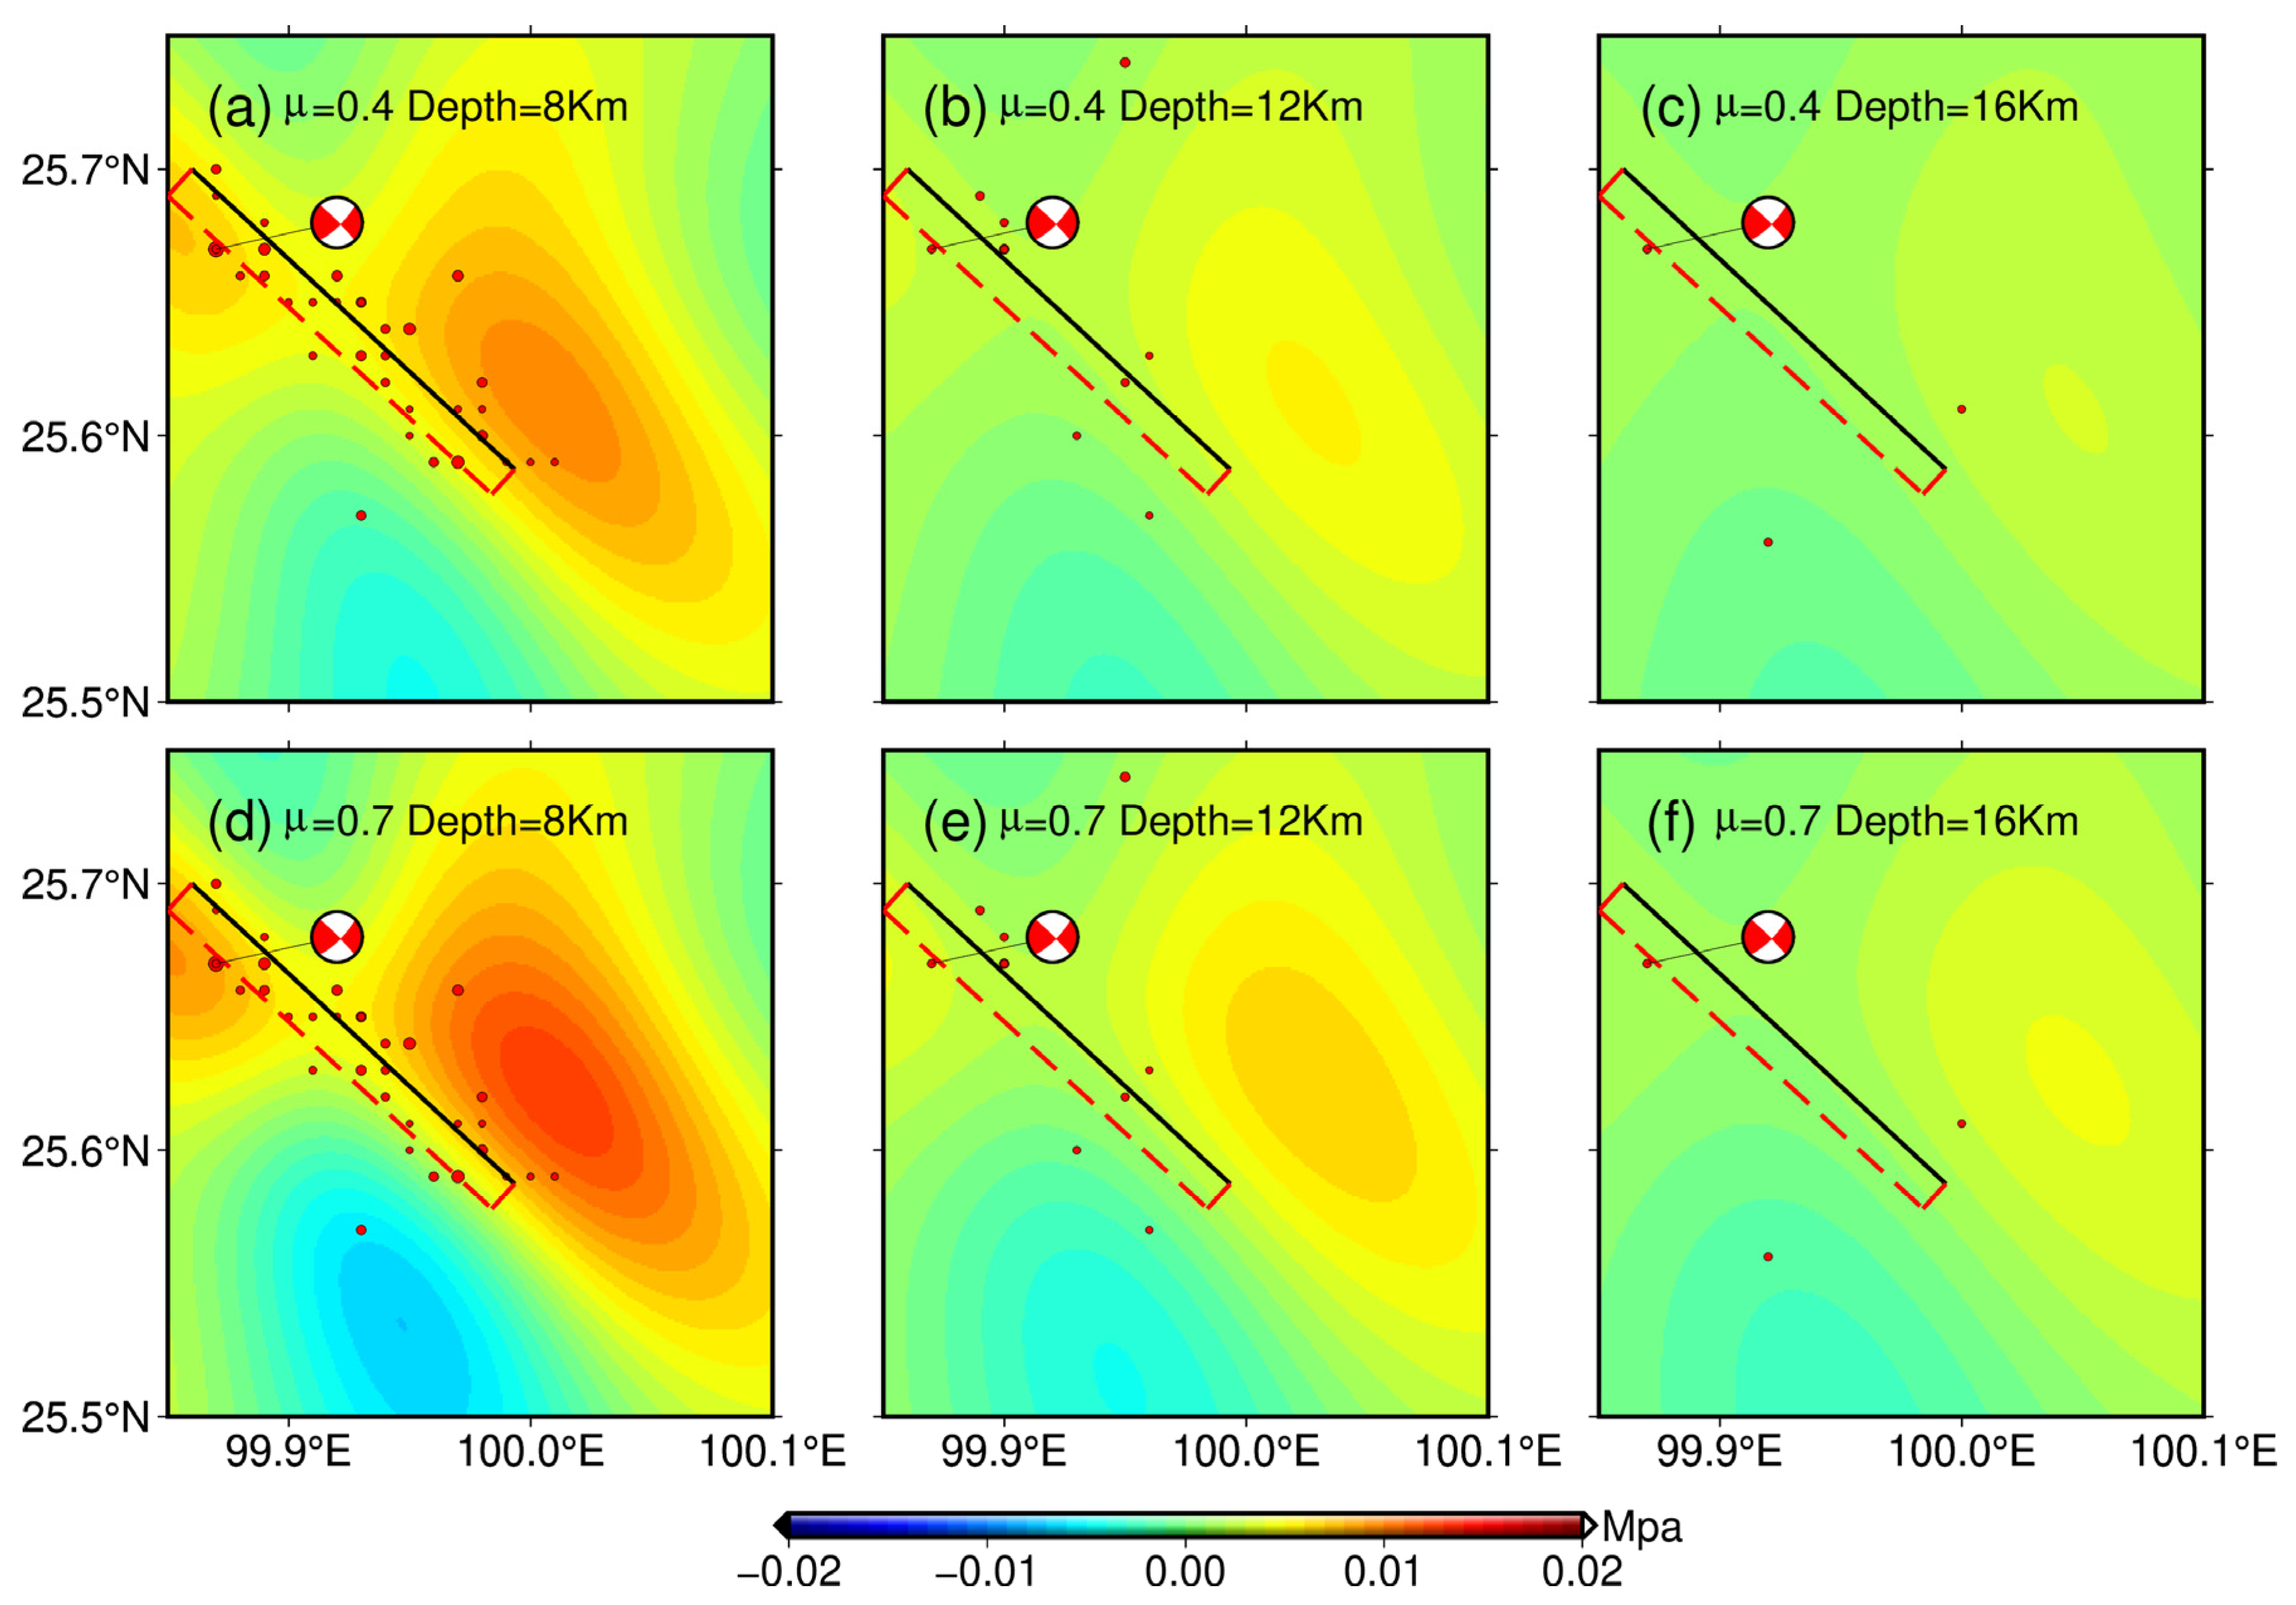
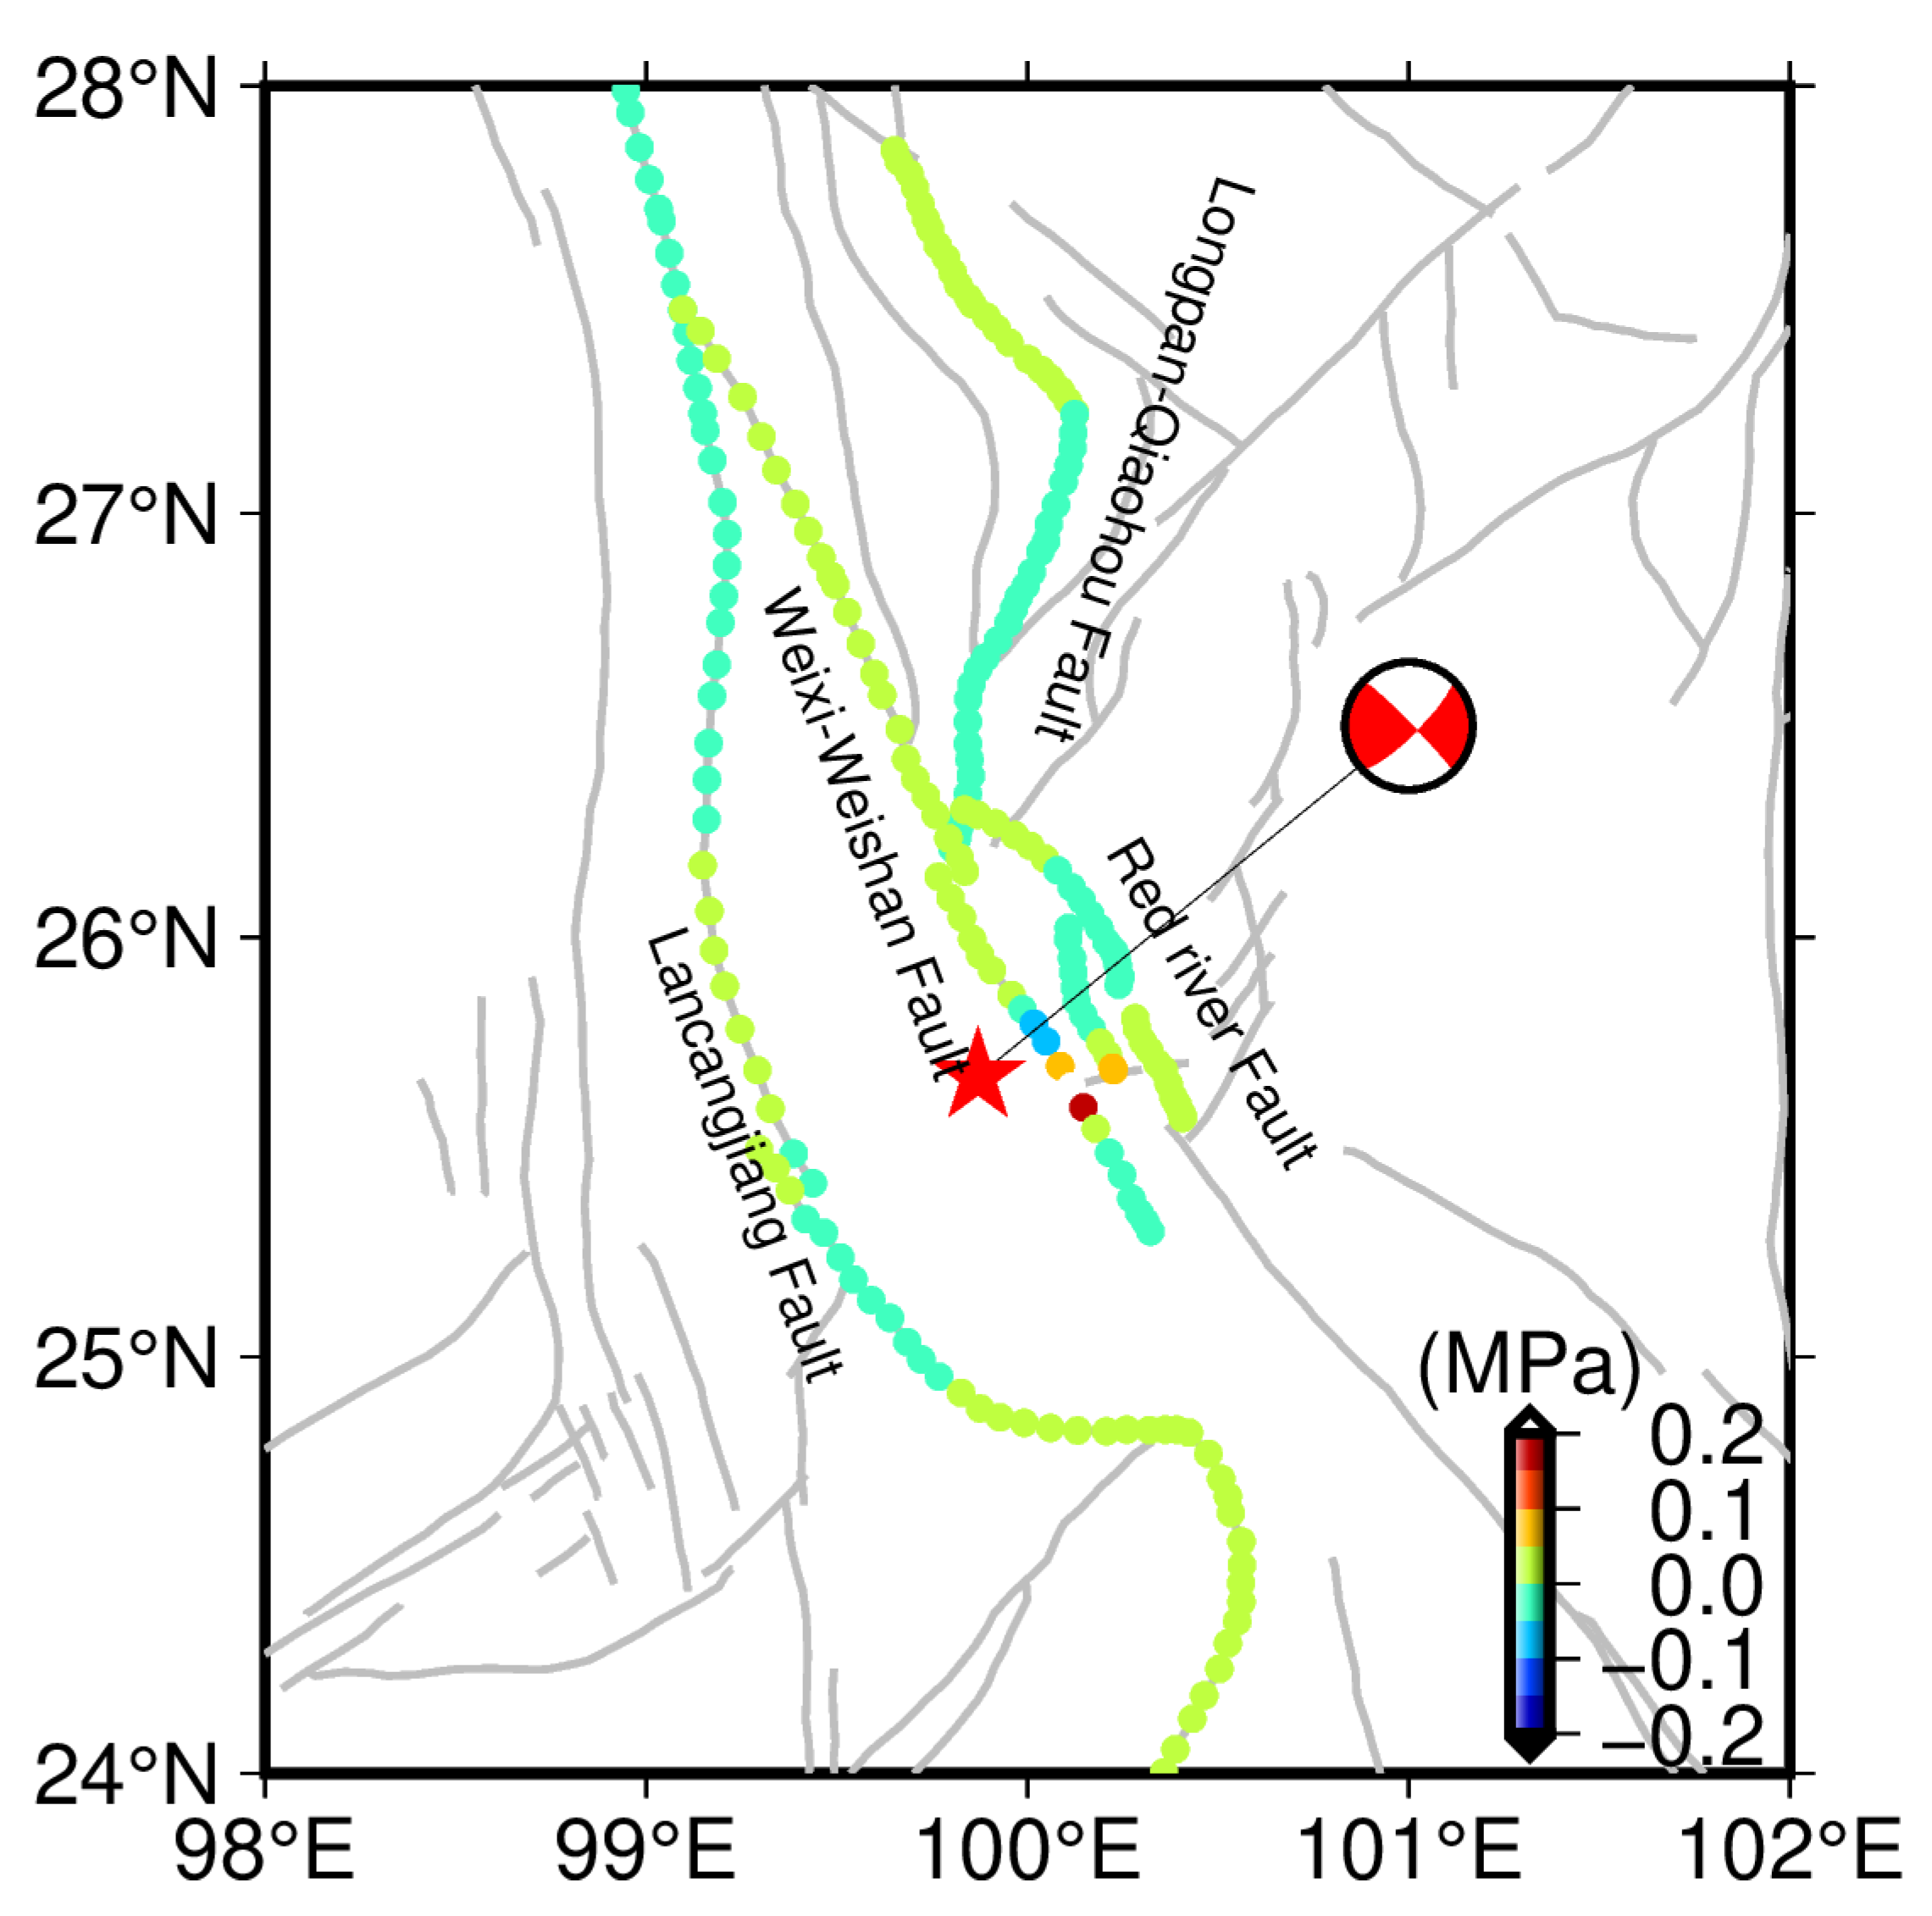
4.2. Stress Loading Caused by the Yangbi Earthquake
5. Conclusions
Author Contributions
Funding
Institutional Review Board Statement
Informed Consent Statement
Data Availability Statement
Acknowledgments
Conflicts of Interest
References
- Li, J.; Jiang, J.Z.; Yang, J.Q. Microseismic detection and relocation of the 2017 MS4.8 and MS5.1 Yangbi earthquake sequence, Yunnan. Acta Seismol. Sin. 2020, 42, 527–542, (In Chinese with English abstract). [Google Scholar]
- Pan, R.; Jiang, J.Z.; Fu, H.; Li, J. Focal mechanism solution and focal depth determination of the m_s5.1 and m_s4.8 earthquakes in Yangbi, Yunnan. J. Seismol. Res. (In Chinese with English abstract). 2019, 42, 338–348. [Google Scholar]
- Xu, C.; Liu, Y.; Wen, Y.; Wang, R. Coseismic Slip Distribution of the 2008 Mw 7.9 Wenchuan Earthquake from Joint Inversion of GPS and InSAR Data. Bull. Seism. Soc. Am. 2010, 100, 2736–2749. [Google Scholar] [CrossRef]
- Atzori, S.; Hunstad, I.; Chini, M.; Salvi, S.; Tolomei, C.; Bignami, C.; Stramondo, S.; Trasatti, E.; Antonioli, A.; Boschi, E. Finite fault inversion of DInSAR coseismic displacement of the 2009 L′Aquila earthquake (central Italy). Geophys. Res. Lett. 2009, 36, L15305. [Google Scholar] [CrossRef]
- Hayes, G.P.; Briggs, R.; Sladen, A.; Fielding, E.; Prentice, C.; Hudnut, K.; Mann, P.; Taylor, F.W.; Crone, A.J.; Gold, R.; et al. Complex rupture during the 12 January 2010 Haiti earthquake. Nat. Geosci. 2010, 3, 800–805. [Google Scholar] [CrossRef] [Green Version]
- Pollitz, F.F.; Brooks, B.; Tong, X.; Bevis, M.G.; Foster, J.; Bürgmann, R.; Smalley, R.; Vigny, C.; Socquet, A.; Ruegg, J.; et al. Coseismic slip distribution of the February 27, 2010 Mw 8.8 Maule, Chile earthquake. Geophys. Res. Lett. 2011, 38. [Google Scholar] [CrossRef]
- Barnhart, W.D.; Willis, M.J.; Lohman, R.B.; Melkonian, A.K. InSAR and Optical Constraints on Fault Slip during the 2010-2011 New Zealand Earthquake Sequence. Seism. Res. Lett. 2011, 82, 815–823. [Google Scholar] [CrossRef]
- Elliott, J.; Copley, A.; Holley, R.; Scharer, K.; Parsons, B. The 2011 Mw 7.1 Van (Eastern Turkey) earthquake. J. Geophys. Res. Solid Earth 2013, 118, 1619–1637. [Google Scholar] [CrossRef]
- Feng, G.; Ding, X.; Li, Z.; Mi, J.; Zhang, L.; Omura, M. Calibration of an InSAR-Derived Coseimic Deformation Map Associated With the 2011 Mw-9.0 Tohoku-Oki Earthquake. IEEE Geosci. Remote. Sens. Lett. 2012, 9, 302–306. [Google Scholar] [CrossRef]
- Wang, K.; Fialko, Y. Slip model of the 2015 M w 7.8 Gorkha (Nepal) earthquake from inversions of ALOS-2 and GPS data. Geophys. Res. Lett. 2015, 42, 7452–7458. [Google Scholar] [CrossRef]
- Tapponnier, P.; Zhiqin, X.; Roger, F.; Meyer, B.; Arnaud, N.; Wittlinger, G.; Jingsui, Y. Oblique Stepwise Rise and Growth of the Tibet Plateau. Science 2001, 294, 1671–1677. [Google Scholar] [CrossRef] [PubMed]
- Wang, Y.; Li, J.; Chen, H.; Zou, Z. The time process of post-earthquake recovery: The Yao′an earthquake in China. Disasters 2014, 38, 774–789. [Google Scholar] [CrossRef] [PubMed]
- Yao, H.J.; van der Hilst, R.D.; Montagner, J.-P. Heterogeneity and anisotropy of the litho-sphere of SE Tibet from surface wave array tomography. J. Geophys. Res. 2010, 115, B12307. [Google Scholar] [CrossRef]
- Xu, X.; Ding, Z.; Shi, D.; Li, X. Receiver function analysis of crustal structure beneath the eastern Tibetan plateau. J. Asian Earth Sci. 2013, 73, 121–127. [Google Scholar] [CrossRef]
- Su, Y.J.; Qin, J.Z. Strong Earthquake Activity and Relation to Regional Neotectonic Movement in Sichuan-Yunnan Region. Earthq. Res. China 2001, 17, 24–34, (In Chinese with English abstract). [Google Scholar]
- Allen, C.R.; Gillespie, A.R.; Yuan, H.; Sieh, K.E.; Buchun, Z.; Chengnan, Z. Red River and associated faults, Yunnan Province, China: Quaternary geology, slip rates, and seismic hazard. Geol. Soc. Am. Bull. 1984, 95, 686. [Google Scholar] [CrossRef]
- Tapponnier, P.; Lacassin, R.; Leloup, P.H.; Schärer, U.; Dalai, Z.; Haiwei, W.; Jiayou, Z. The Ailao Shan/Red River metamorphic belt: Tertiary left-lateral shear between Indochina and South China. Nature 1990, 343, 431–437. [Google Scholar] [CrossRef]
- Zhang, P.Z.; Gan, W.J.; Shen, Z.K. A coupling model of rigid-block movement and continuous deformation: Patterns of the present-day deformation of China’s continent and its vicinity. Acta Geol. Sin. 2005, 79, 748–756. [Google Scholar]
- Massonnet, D.; Feigl, K. Radar interferometry and its application to changes in the Earth’s surface. Rev. Geophys. 1998, 36, 441–500. [Google Scholar] [CrossRef] [Green Version]
- Rosen, P.A.; Hensley, S.; Joughin, I.R.; Li, F.K.; Madsen, S.N.; Rodriguez, E.; Goldstein, R.M. Synthetic aperture radar inter-ferometry. Proc. IEEE 2000, 88, 333–380. [Google Scholar] [CrossRef]
- Werner, C.; Wegmüller, U.; Strozzi, T.; Wiesmann, A. GAMMA SAR and interferometric processing software. In Proceedings of the ERS-Envisat Symposium, Gothenburg, Sweden, 16–20 October 2000. [Google Scholar]
- Farr, T.G.; Rosen, P.A.; Caro, E.; Crippen, R.; Duren, R.; Hensley, S.; Kobrick, M.; Paller, M.; Rodriguez, E.; Roth, L.; et al. The Shuttle Radar Topography Mission. Rev. Geophys. 2007, 45. [Google Scholar] [CrossRef] [Green Version]
- Costantini, M.; Rosen, P.A. A generalized phase unwrapping approach for sparse data. In Proceedings of the IEEE 1999 International Geoscience and Remote Sensing Symposium. IGARSS′99 (Cat. No.99CH36293), Hamburg, Germany, 28 June–2 July 1999; pp. 267–269. [Google Scholar] [CrossRef]
- Qu, W.; Liu, B.; Zhang, Q.; Gao, Y.; Chen, H.; Wang, Q.; Hao, M. Sentinel-1 InSAR observations of co- and post-seismic deformation mechanisms of the 2016 Mw 5.9 Menyuan Earthquake, Northwestern China. Adv. Space Res. 2021, 68, 1301–1317. [Google Scholar] [CrossRef]
- Rosen, P.A.; Hensley, S.; Zebker, H.A.; Webb, F.H.; Fielding, E. Surface deformation and coherence measurements of Kilauea Volcano, Hawaii, from SIR-C radar interferometry. J. Geophys. Res. Space Phys. 1996, 101, 23109–23125. [Google Scholar] [CrossRef]
- Lu, Z.; Dzurisin, D. InSAR Imaging of Aleutian Volcanoes; Springer: Berlin/Heidelberg, Germany, 2014; pp. 87–345. [Google Scholar] [CrossRef]
- Yu, C.; Li, Z.; Penna, N.T.; Crippa, P. Generic Atmospheric Correction Model for Interferometric Synthetic Aperture Radar Observations. J. Geophys. Res. Solid Earth 2018, 123, 9202–9222. [Google Scholar] [CrossRef]
- Li, Z.; Muller, J.-P.; Cross, P.; Fielding, E. Interferometric synthetic aperture radar (InSAR) atmospheric correction: GPS, Moderate Resolution Imaging Spectroradiometer (MODIS), and InSAR integration. J. Geophys. Res. Space Phys. 2005, 110. [Google Scholar] [CrossRef]
- Luo, X.W.; Sun, J.B.; Shen, Z.K.; Yo, F. Co-seismic slip distribution of 2010 Darfield, New Zealand Mw7.1 earthquake inverted using InSAR measurements. Chin. J. Geophys. 2013, 56, 117–128, (In Chinese with English abstract). [Google Scholar]
- Jonsson, S. Fault Slip Distribution of the 1999 Mw 7.1 Hector Mine, California, Earthquake, Estimated from Satellite Radar and GPS Measurements. Bull. Seism. Soc. Am. 2002, 92, 1377–1389. [Google Scholar] [CrossRef]
- An, X.W.; Chang, Z.F.; Chen, Y.J.; Mao, X.J.; Zhuang, R.X. Quaternary Active Faults in Yunnan Area and Distribution Map of the Quaternary Active Faults in Yunnan Area; Seismology Press: Beijing, China, 2018; pp. 57–262. [Google Scholar]
- Chang, Z.F.; Zhang, Y.F.; Chang, H. New Discovery of Holocene Activity along the Weixi-Qiaohou Fault in Southeastern Margin of the Tibetan Plateau and its Neotectonic Significance. Acta Geol. Sin. 2018, 92, 2464–2465, (In Chinese with English abstract). [Google Scholar]
- Okada, Y. Surface deformation due to shear and tensile faults in a half-space. Bull. Seismol. Soc. Am. 1985, 75, 1135–1154. [Google Scholar] [CrossRef]
- Bagnardi, M.; Hooper, A. Inversion of Surface Deformation Data for Rapid Estimates of Source Parameters and Uncertainties: A Bayesian Approach. Geochem. Geophys. Geosystems 2018, 19, 2194–2211. [Google Scholar] [CrossRef]
- Press, W.; Teukolsky, S.; Vetterling, W.; Flannery, B. Numerical Recipes in C, the Art of Scientific Computing; Cambridge University Press: New York, NY, USA, 1992; p. 994. [Google Scholar] [CrossRef]
- Wang, R.; Diao, F.; Hoechner, A. SDM—A geodetic inversion code incorporating with layered crust structure and curved fault geometry. In Proceedings of the EGU General Assembly 2013, Vienna, Austria, 7–12 April 2013. [Google Scholar]
- Tu, H.-W.; Wang, R.-J.; Diao, F.-Q.; Zhang, Y.; Wan, Y.-G.; Jin, M. Slip model of the 2001 Kunlun mountain Ms 8.1 earthquake by SDM: Joint inversion from GPS and InSAR data. Chin. J. Geophys. 2016, 59, 2103–2112, (In Chinese with English abstract). [Google Scholar]
- Wang, R. Computation of deformation induced by earthquakes in a multi-layered elastic crust—FORTRAN programs EDGRN/EDCMP. Comput. Geosci. 2003, 29, 195–207. [Google Scholar] [CrossRef]
- Laske, G.; Masters, G.; Ma, Z.; Pasyanos, M. Update on CRUST 1.0-A1-degree global model of earth’s crust. In Proceedings of the EGU General Assembly 2013, Vienna, Austria, 7–12 April 2013. [Google Scholar]
- Yu, S.Y.; Luo, J.J.; Yang, Y.Y. Seismogenic structure of the Yangbi, Yunnan Ms6.4 earthquake on May 21, 2021 constraines by InSAR data. China Earthq. Eng. J. 2021, 43, 778–783, (In Chinese with English abstract). [Google Scholar]
- Li, C.L.; Zhang, G.H.; Shan, X.J. Coseismic deformation and slip distribution of the Ms 6.4 Jiashi, Xinjiang earthquake revealed by Sentinel-1A SAR imagery. Prog. Geophys. 2020, 36, 481–488, (In Chinese with English abstract). [Google Scholar]
- Xu, X.W.; Han, Z.J.; Yang, X.P. Seismotectionic Map of China and Its Adjacen Areas 2016; Seismological Press: Beijing, China, 2016; (In Chinese with English abstract). [Google Scholar]
- King, G.C.P.; Stein, R.S.; Lin, J. Static stress changes and the triggering of earthquakes. Bull. Seismol. Soc. Am. 1994, 84, 935–953. [Google Scholar] [CrossRef]
- Ji, L.Y.; Liu, C.J.; Xu, J.; Liu, L.; Long, F.; Zhang, Z.W. InSAR obervation and inversion of the seismogenic fault for the 2017 Jiuzhaigou MS7.0 earthquake in china. Chin. J. Geophys. 2017, 60, 4069–4082, (In Chinese with English abstract). [Google Scholar]
- Stein, R.S.; King, G.C.P.; Lin, J. Change in Failure Stress on the Southern San Andreas Fault System Caused by the 1992 Magnitude = 7.4 Landers Earthquake. Science 1992, 258, 1328–1332. [Google Scholar] [CrossRef]
- Wessel, P.; Smith, W. New, improved version of generic mapping tools released. EOS Trans. AGU 1998, 79, 579. [Google Scholar] [CrossRef]


| Orbit | Path | Frame | Master Image | Slave Image | Polarization Mode | Mode | Incident Angle (°) | Azimuth Angle (°) |
|---|---|---|---|---|---|---|---|---|
| Descending | 135 | 508 | 20210510 | 20210522 | VV | IW | 39.3550 | −167.5851 |
| Ascending | 99 | 1265 | 20210520 | 20210601 | 33.9425 | −12.4527 |
| Parameter (Unit) | Intervals of Parameters | Yangbi Earthquake |
|---|---|---|
| Length (km) | (1–20 km) | 10.9 ± 2 |
| Width (km) | (1–20 km) | 1.9 ± 0.3 |
| Depth (km) | (1–12 km) | 7.0 ± 0.05 |
| Strike (°) | (0–360°) | 316 ± 2.89 |
| Dip (°) | (0–90°) | 86 ± 3.41 |
| Strike slip (m) | (−10–10 m) | −0.31 ± 0.03 |
| Dip slip (m) | (−10–10 m) | 1.97 ± 0.01 |
| X (km) | (0–5 km) | 1.5 ± 0.7 |
| Y (km) | (−6–6 km) | −2.7 ± 0.6 |
| Source | Fault Plane | Difference in Strike (°) | Difference in Dip (°) | |
|---|---|---|---|---|
| Strike (°) | Dip (°) | |||
| USGS | 135 | 82.00 | 0 | −4 |
| GCMT | 315 | 86.00 | 0 | 0 |
| Yu et al. [40] | 135 | 83.47 | 0 | −2.53 |
| This study | 315 | 86.00 | ||
Publisher’s Note: MDPI stays neutral with regard to jurisdictional claims in published maps and institutional affiliations. |
© 2021 by the authors. Licensee MDPI, Basel, Switzerland. This article is an open access article distributed under the terms and conditions of the Creative Commons Attribution (CC BY) license (https://creativecommons.org/licenses/by/4.0/).
Share and Cite
Zhang, B.; Xu, G.; Lu, Z.; He, Y.; Peng, M.; Feng, X. Coseismic Deformation Mechanisms of the 2021 Ms 6.4 Yangbi Earthquake, Yunnan Province, Using InSAR Observations. Remote Sens. 2021, 13, 3961. https://doi.org/10.3390/rs13193961
Zhang B, Xu G, Lu Z, He Y, Peng M, Feng X. Coseismic Deformation Mechanisms of the 2021 Ms 6.4 Yangbi Earthquake, Yunnan Province, Using InSAR Observations. Remote Sensing. 2021; 13(19):3961. https://doi.org/10.3390/rs13193961
Chicago/Turabian StyleZhang, Bing, Guochang Xu, Zhiping Lu, Yufang He, Mimi Peng, and Xueshang Feng. 2021. "Coseismic Deformation Mechanisms of the 2021 Ms 6.4 Yangbi Earthquake, Yunnan Province, Using InSAR Observations" Remote Sensing 13, no. 19: 3961. https://doi.org/10.3390/rs13193961
APA StyleZhang, B., Xu, G., Lu, Z., He, Y., Peng, M., & Feng, X. (2021). Coseismic Deformation Mechanisms of the 2021 Ms 6.4 Yangbi Earthquake, Yunnan Province, Using InSAR Observations. Remote Sensing, 13(19), 3961. https://doi.org/10.3390/rs13193961