Article

A Simple and Efficient Method for Correction of Basin-Scale Evapotranspiration on the Tibetan Plateau

1
School of Environmental Science and Engineering, Southern University of Science and Technology, 1088 Xueyuan Ave, Shenzhen 518055, China
2
School of Water Resources and Environment, China University of Geosciences (Beijing), 29 Xueyuan Road, Beijing 430074, China
3
Department of Earth and Environmental Science, School of Human Settlements and Civil Engineering, Xi’an Jiaotong University, Xi’an 710000, China
4
Key Laboratory of Surficial Geochemistry, Ministry of Education, School of Earth Sciences and Engineering, Nanjing University, Nanjing 210093, China
*
Author to whom correspondence should be addressed.
Remote Sens. 2021, 13(19), 3958; https://doi.org/10.3390/rs13193958
Submission received: 12 July 2021 / Revised: 15 September 2021 / Accepted: 30 September 2021 / Published: 2 October 2021
(This article belongs to the Special Issue Estimating Meteorological Variables by Remote Sensing Data)

Abstract

:
Evapotranspiration (ET) is one of the important components of the global hydrologic cycle, energy exchange, and carbon cycle. However, basin scale actual ET (hereafter ETa) is difficult to estimate accurately. We present an evaluation of four actual ET products (hereafter ETp) in seven sub-basins in the Tibetan Plateau. The actual ET calculated by the water balance method (hereafter ETref) was used as the reference for correction of the different ETp. The ETref and ETp show obvious seasonal cycles, but the ETp overestimated or underestimated the ET of the sub-basins in the Tibetan Plateau. A simple and effective method was proposed to correct the basin-scale ETp. The method was referred to as ratio bias correction, and it can effectively remove nearly all biases of the ETp. The proposed method is simpler and more effective in correcting the four ETp compared with the gamma distribution bias correction method. The reliability of the ETp is significantly increased after the ratio bias correction. The ratio bias correction method was used to correct the ETp in the seven sub-basins in the Tibetan Plateau, and regional ET was significantly improved. The results may help improve estimation of the ET of the Tibetan Plateau and thereby contribute to a better understanding of the hydrologic cycle of the plateau.

1. Introduction

Evapotranspiration (ET) represents the total evaporation and transpiration of plants from terrestrial and oceanic surfaces to the atmosphere [1]. ET is a prominent component of the hydrologic cycle, energy exchange, and carbon cycle. In recent years, several global ETp have been developed to estimate the distribution of ETa, including remote sensing-based methods, land surface models, surface energy balance, and reanalysis products [2,3,4,5,6]. These ETp significantly contributed to our knowledge of hydrological components [7]. However, these methods are limited by sparse measurement stations, as well as some uncertainties [8], especially with regard to surface energy balance models. The surface energy balance model, based on satellite images and remote sensing data, is a powerful and accurate method for calculating ET [8,9,10,11,12,13,14]. However, accurate measurements depend on the reliability of the input data, especially the remote sensing data at basin scale. The input data to calculate ETa of the Tibetan Plateau are limited by sparse measurement stations, as well as some uncertainties [15], especially in high-altitude mountains [6,16]. Long et al. [17] evaluated the uncertainty in evapotranspiration from land surface modeling (5 mm/month). Xue et al. [18] compared the annual evapotranspiration of the upper Yellow River and Yangtze River basins with bias −10.8–119.8 mm/yr and −120.9–77 mm/yr for four ETp [2,3,4]. There is an urgent need to evaluate ETp in areas with limited observation stations (e.g., the Tibetan Plateau).
Over the past decades, hydrologists and meteorologists have been making efforts to quantitatively evaluate ETa [16,19,20,21,22]. Although many ETp can be used to estimate actual ET on the Tibetan Plateau, the uncertainty is high [23,24]. The traditional water balance method is a useful tool to calculate ETa at regional scale [17,20,25,26]. In previous studies, ETa was estimated as a residual of precipitation (P) minus runoff (R) at regional scale, and the terrestrial water storage (TWS) changes were often neglected [27,28]. The traditional water balance method cannot be used to estimate ETa at monthly or finer temporal scales. The Gravity Recovery and Climate Experiment (GRACE) satellite [29,30] provides a relatively accurate TWS estimation at basin scale. The calculated ETa that uses the water balance of the GRACE TWS was thought to be accurate [17,22,25]. Therefore, many methods have been proposed for correcting ETp based on the water balance method with GRACE data.
Gamma distribution is an effective method to correct the ETp [18,20,25]. Li et al. [20] used the gamma distribution method to evaluate the existing ETp on the Tibetan Plateau at monthly scale. The correction removed the biases and made the root-mean-square errors (RMSEs) decrease in comparison with the original ETp. But this method has some inaccuracies. It can only correct the systematic error caused by the annual change of TWS [20]. Moreover, the correction of ETp by this method is complicated.
In this study, we propose a simple and efficient method, the ratio bias correction method, to correct four ETp in seven sub-basins on the Tibetan Plateau. First, we calculated ET by using the water balance method with the GRACE TWS and used it as the reference for correction of the different ETp. Second, we used the proposed ratio bias correction method to correct the ETp with the help of the ETref. The gamma distribution bias correction method was also used to correct the ETp. A reasonable and accurate corrected ET on the Tibetan Plateau was obtained after the correction.

2. Materials and Methods
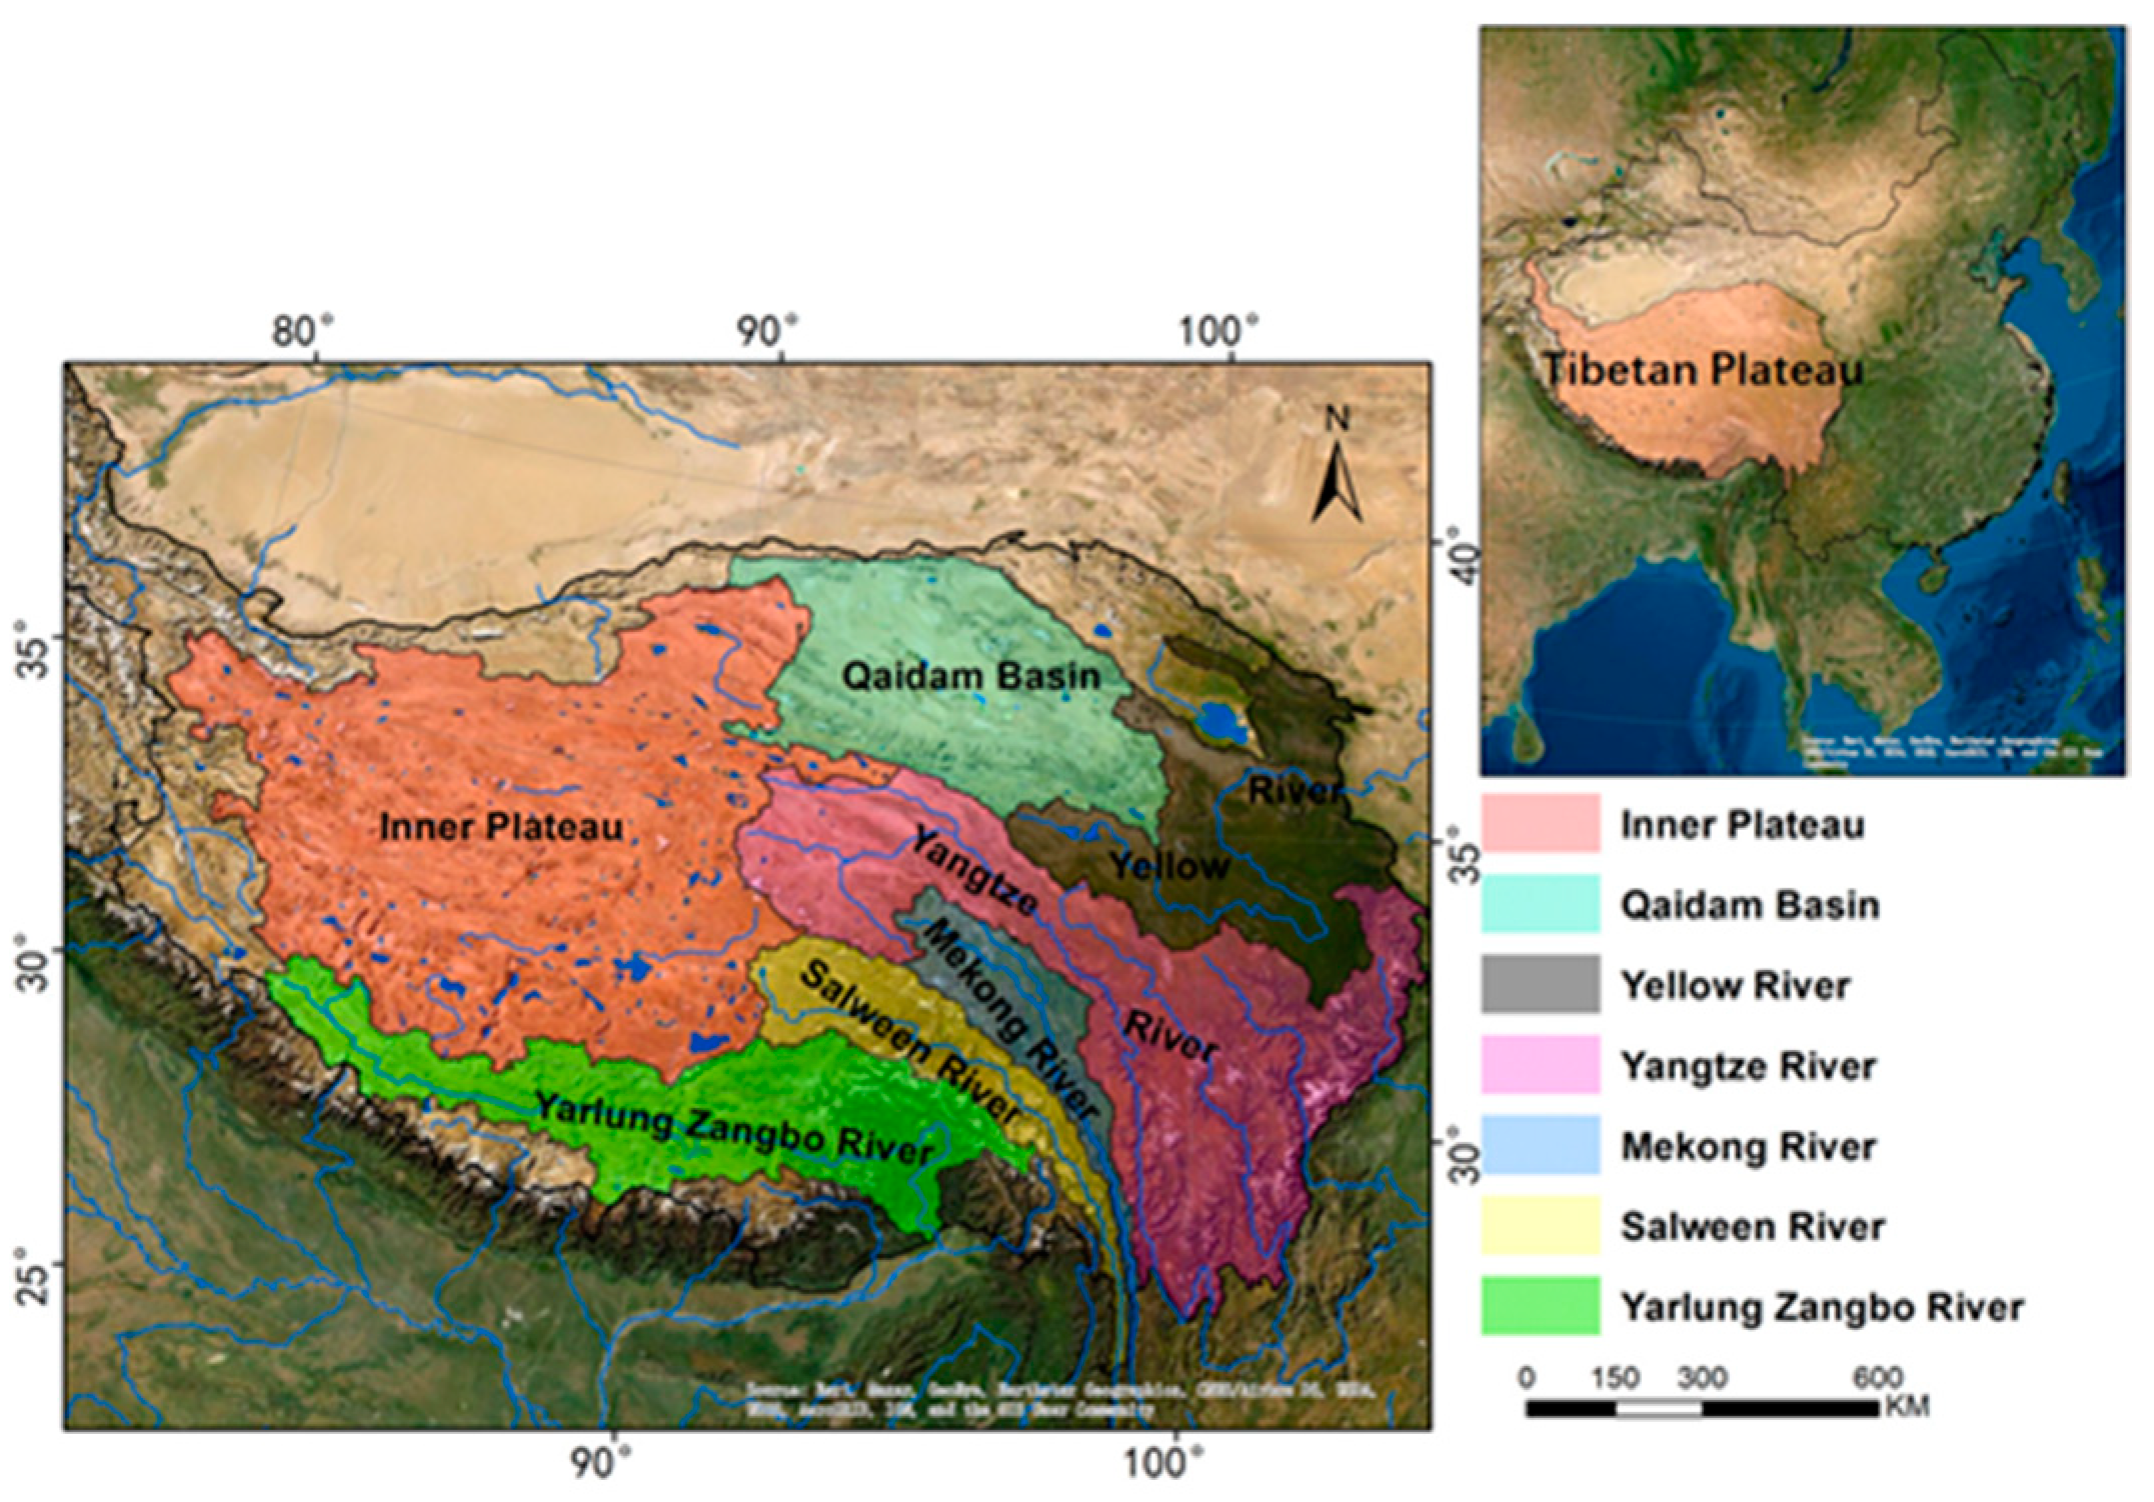
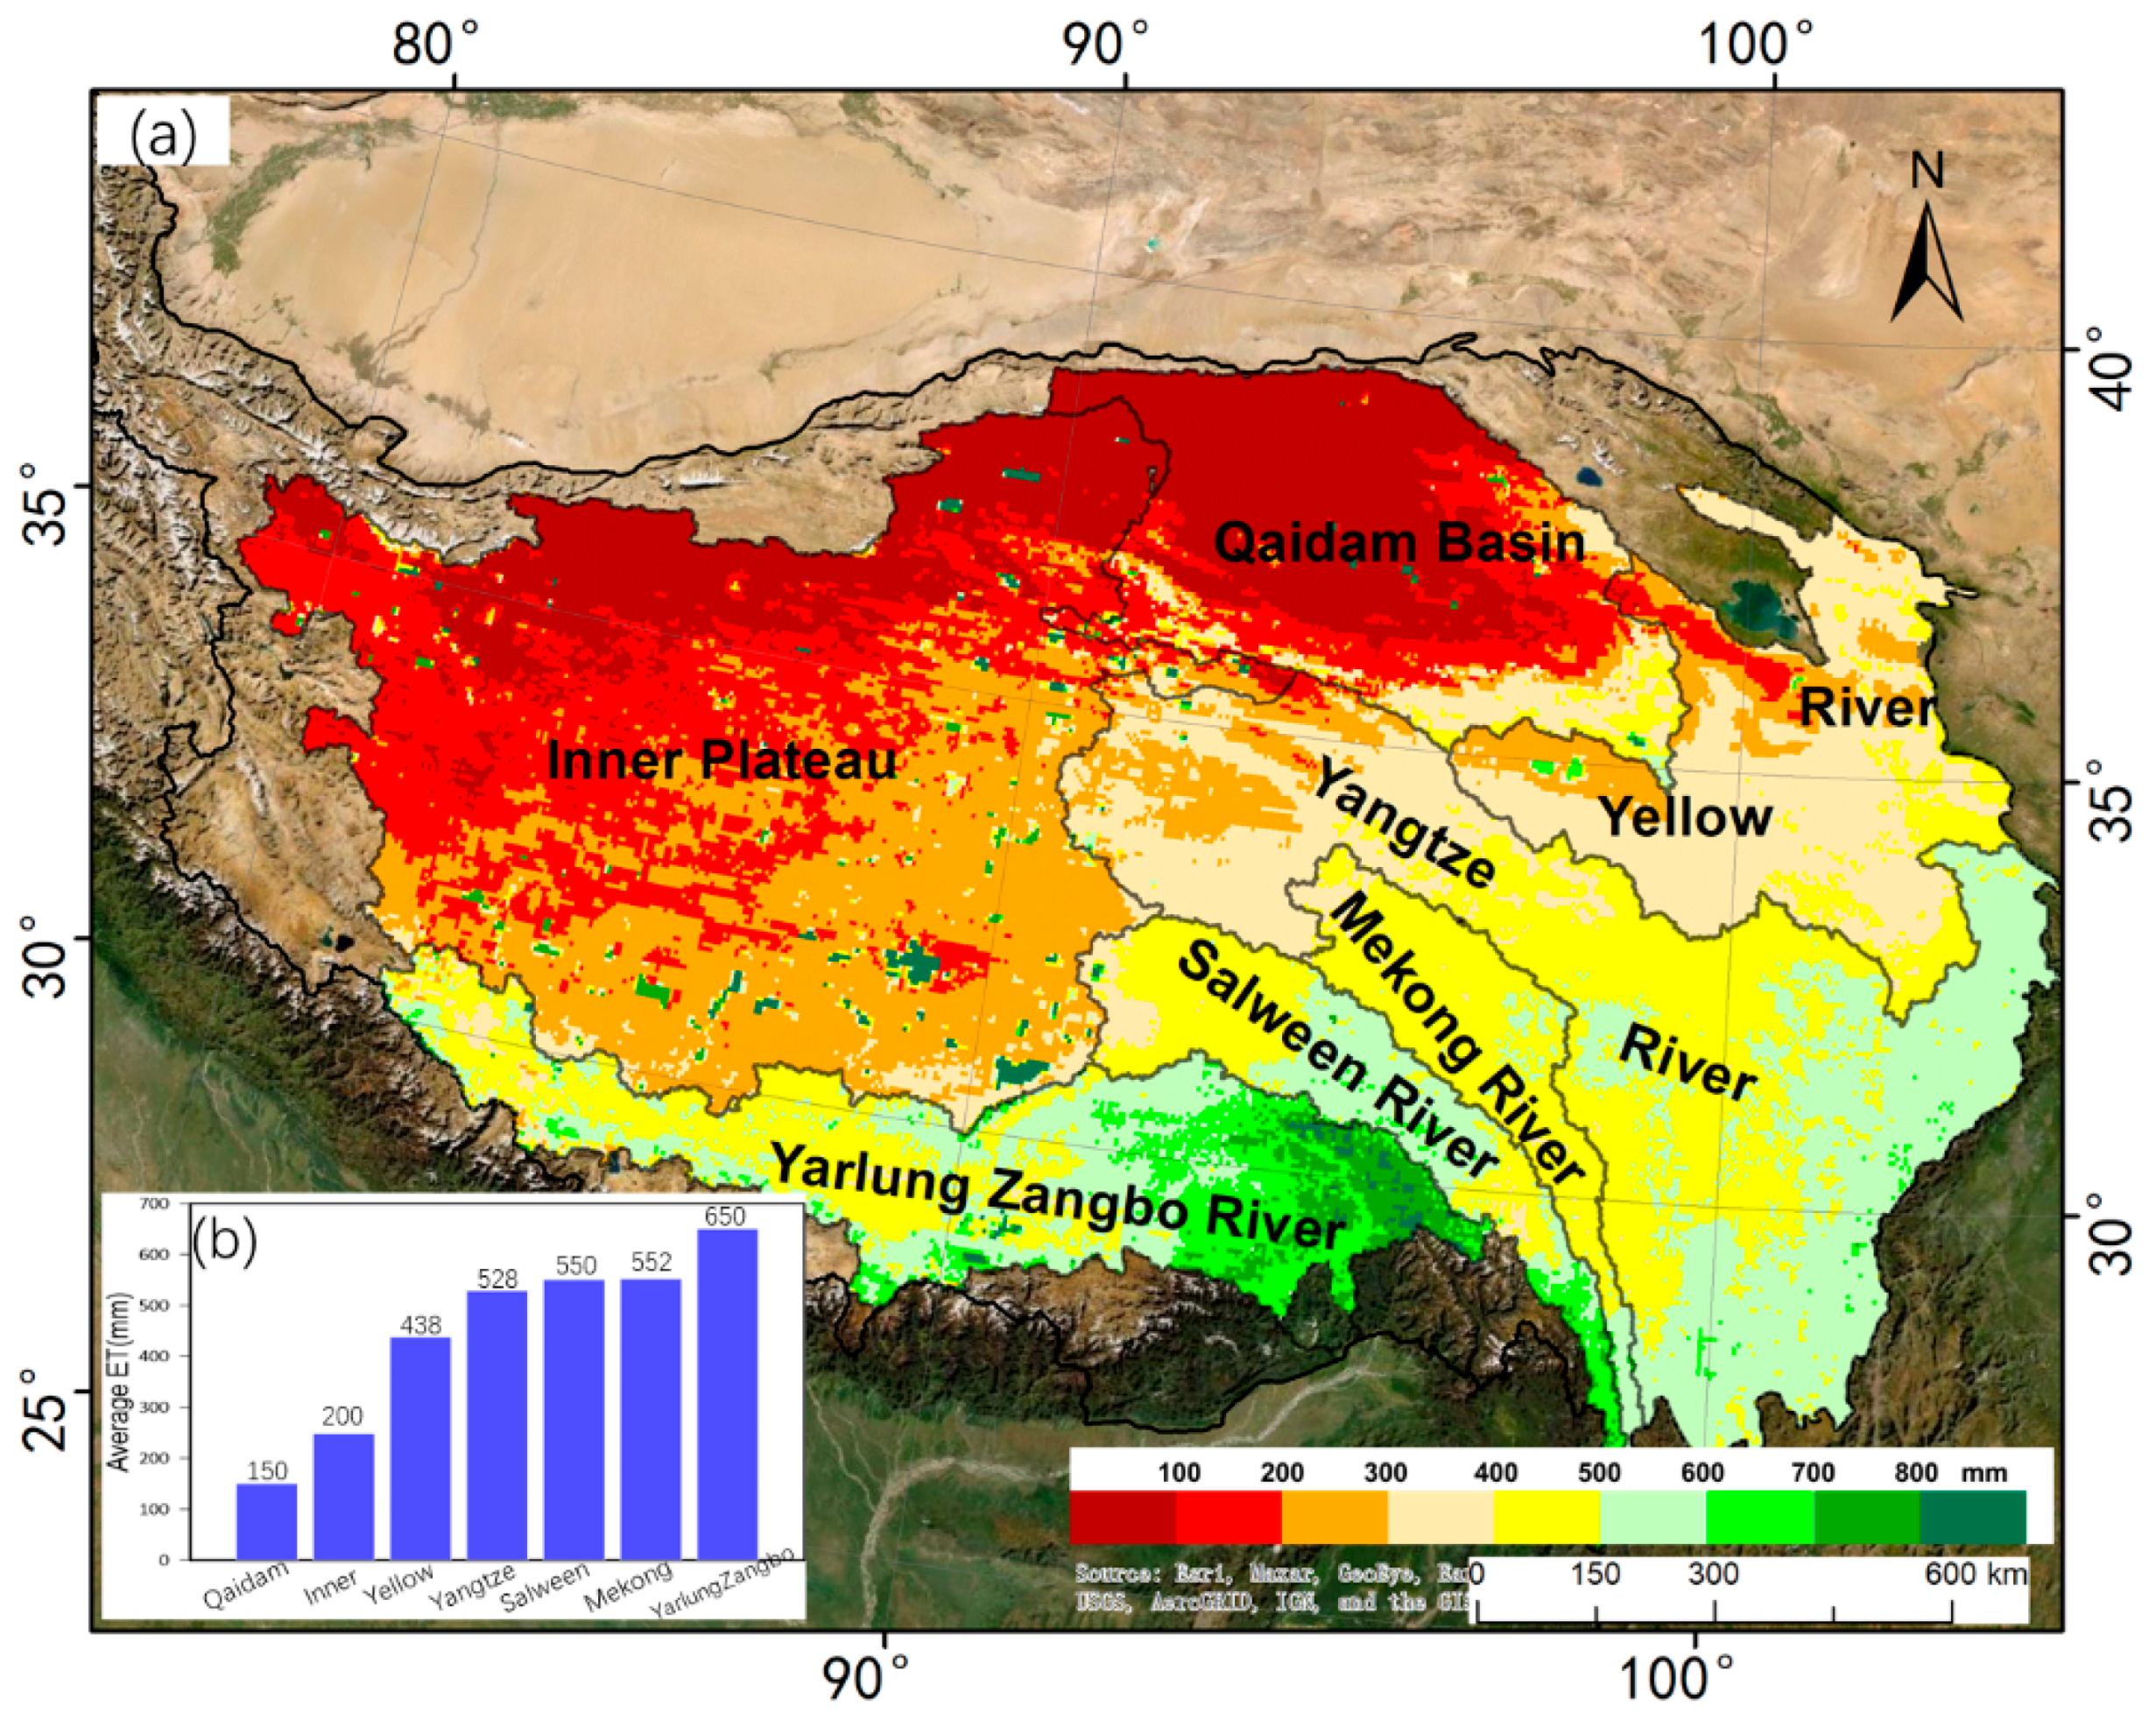
2.1. Study Area

Monthly ETa across the Tibetan Plateau was evaluated, including five outflow basins (Yangtze, Yellow, Yarlung Zangbo, Mekong, and Salween) and two endorheic basins (Inner Plateau and Qaidam Basin), as shown in Figure 1. Overview of the seven sub-basins was shown in Table 1 (Data from the National Meteorological Information Centre and GLDAS 2.1 Noah). The total area of the seven sub-basins is approximately 206 × 104 km2 and covers about 85% of the entire plateau. The Tibetan Plateau is regarded as the “roof of the world” [31]. As it is the source region of the great rivers of Asia, it has also been referred to as the “Asian water tower” [32]. The study areas are dominated by the Indian monsoon and westerlies [33]. The precipitation on the Tibetan Plateau decreases from southeast to northwest [34]. The precipitation of the Yarlung Zangbo basin is largest (73.9 mm/month), and the Qaidam is smallest (13.8 mm/month) (Table 1). The ET on the Tibetan Plateau shows great values (more than 600 mm/yr) in the east and south and small values (less than 50 mm/yr) in the west and north [34,35,36]. The seasonal variation of the ET on the Tibetan Plateau is generally characterized by small values in the cold season and great values in the warm season [37]. The spatial distribution of vegetation cover was obtained from a digitized Atlas of China’s Vegetation (http://westdc.westgis.ac.cn, accessed date: 1 July 2021), which has a scale of 1:1,000,000 [38,39]. Seven vegetation types were identified on the Tibetan Plateau: Meadow, steppe, forest, shrub, crop, alpine vegetation, and sparse vegetation (Figure 2). The main vegetation types are meadow and shrub in the source regions of Yangtze, Yellow, Mekong, and Salween Rivers. The main vegetation types in the Qaidam Basin and the Inner Plateau are sparse vegetation and steppe. The main vegetation types in the Yarlung Zangbo basin are varied due to its unique geographical location and complex plateau climate [40]. The vegetation types distributed in this region are meadow, steppe, forest, and alpine vegetation.

2.2. Data

Four global ETp were assessed, and Table 2 shows the details of the four ETp. ET from a moderate resolution imaging spectroradiometer (MODIS) was calculated by the Penman–Monteith method (hereafter MET) [3]. ET from Zhang et al. [4] was produced based on the Global Inventory Modelling and Mapping Studies (GIMMS) Normalized Difference Vegetation Index (NDVI) with the modified Penman–Monteith method (hereafter GIET). ET from Chen et al. [41] was produced by an algorithm based on the surface energy balance system (SEBS) (hereafter SET). ET form the Global Land Data Assimilation System (GLDAS) with Noah Land Surface was referred to as GET [2].
A gridded daily precipitation dataset was adopted in this study. The dataset is interpolated using observation meteorological stations and DEM data. The Assessment Report was conducted by the National Meteorological Information Centre (NMIC). The dataset can explain the spatial-temporal changes of precipitation with only minimal errors [42]. The gridded data sets have a high correlation with observation stations, which are widely used in China, especially for the Tibetan Plateau [43,44,45,46].
GLDAS-2.1 Noah monthly river discharge (R) was used in this study. The spatial resolution is 0.25° × 0.25°. The dataset is widely used for the Tibetan Plateau with acceptable errors [46].
The main goal of GRACE is to measure TWS in basin scale [30]. The RL05 gridded data obtained from the Center for Space Research (CSR) of University of Texas, the Jet Propulsion Laboratory (JPL), and the GeoForschungsZentrum (GFZ) were used to estimate TWS. The spatial resolution of the data was 1°from 2003 to 2014. Due to factors such as satellite orbital adjustment, some months of TWS data are missing. A simple linear method was used for data interpolation [20,22]. The arithmetic mean value of TWS from the three agencies after interpolation was adopted.
Monthly time series from the mean values of the precipitation, runoff, and the TWS anomaly during 2003–2014 are shown in Figure 3. The data summary was shown in Table 2. All the data were sampled to 0.05° on average to better capture the data changes at the basin boundary of the seven sub-basins. The advantage of regirding coarser resolution to the high resolution is to eliminate errors caused by the boundaries of sub-basins [47]. In this way, uncertainties caused by sub-basin boundaries would be reduced [48].

2.3. Methods to Estimate ET

2.3.1. Calculation of ETref

The four actual ET products was represented by ETp. The traditional water balance method with GRACE satellite data was used to estimate ET (hereafter ETref) for the sub-basins [17,25]:
Pre R ET = Δ TWS
where Pre represents precipitation (mm), R represents river runoff (mm), and Δ TWS is the change in TWS (mm) estimated by reconstructing GRACE satellite data. TWS contains: the soil moisture, snow water equivalent, ice, canopy water, and groundwater. R is zero in the Inner Plateau and Qaidam Basin. The calculated ETref was used as the reference for correction of the different ETp.

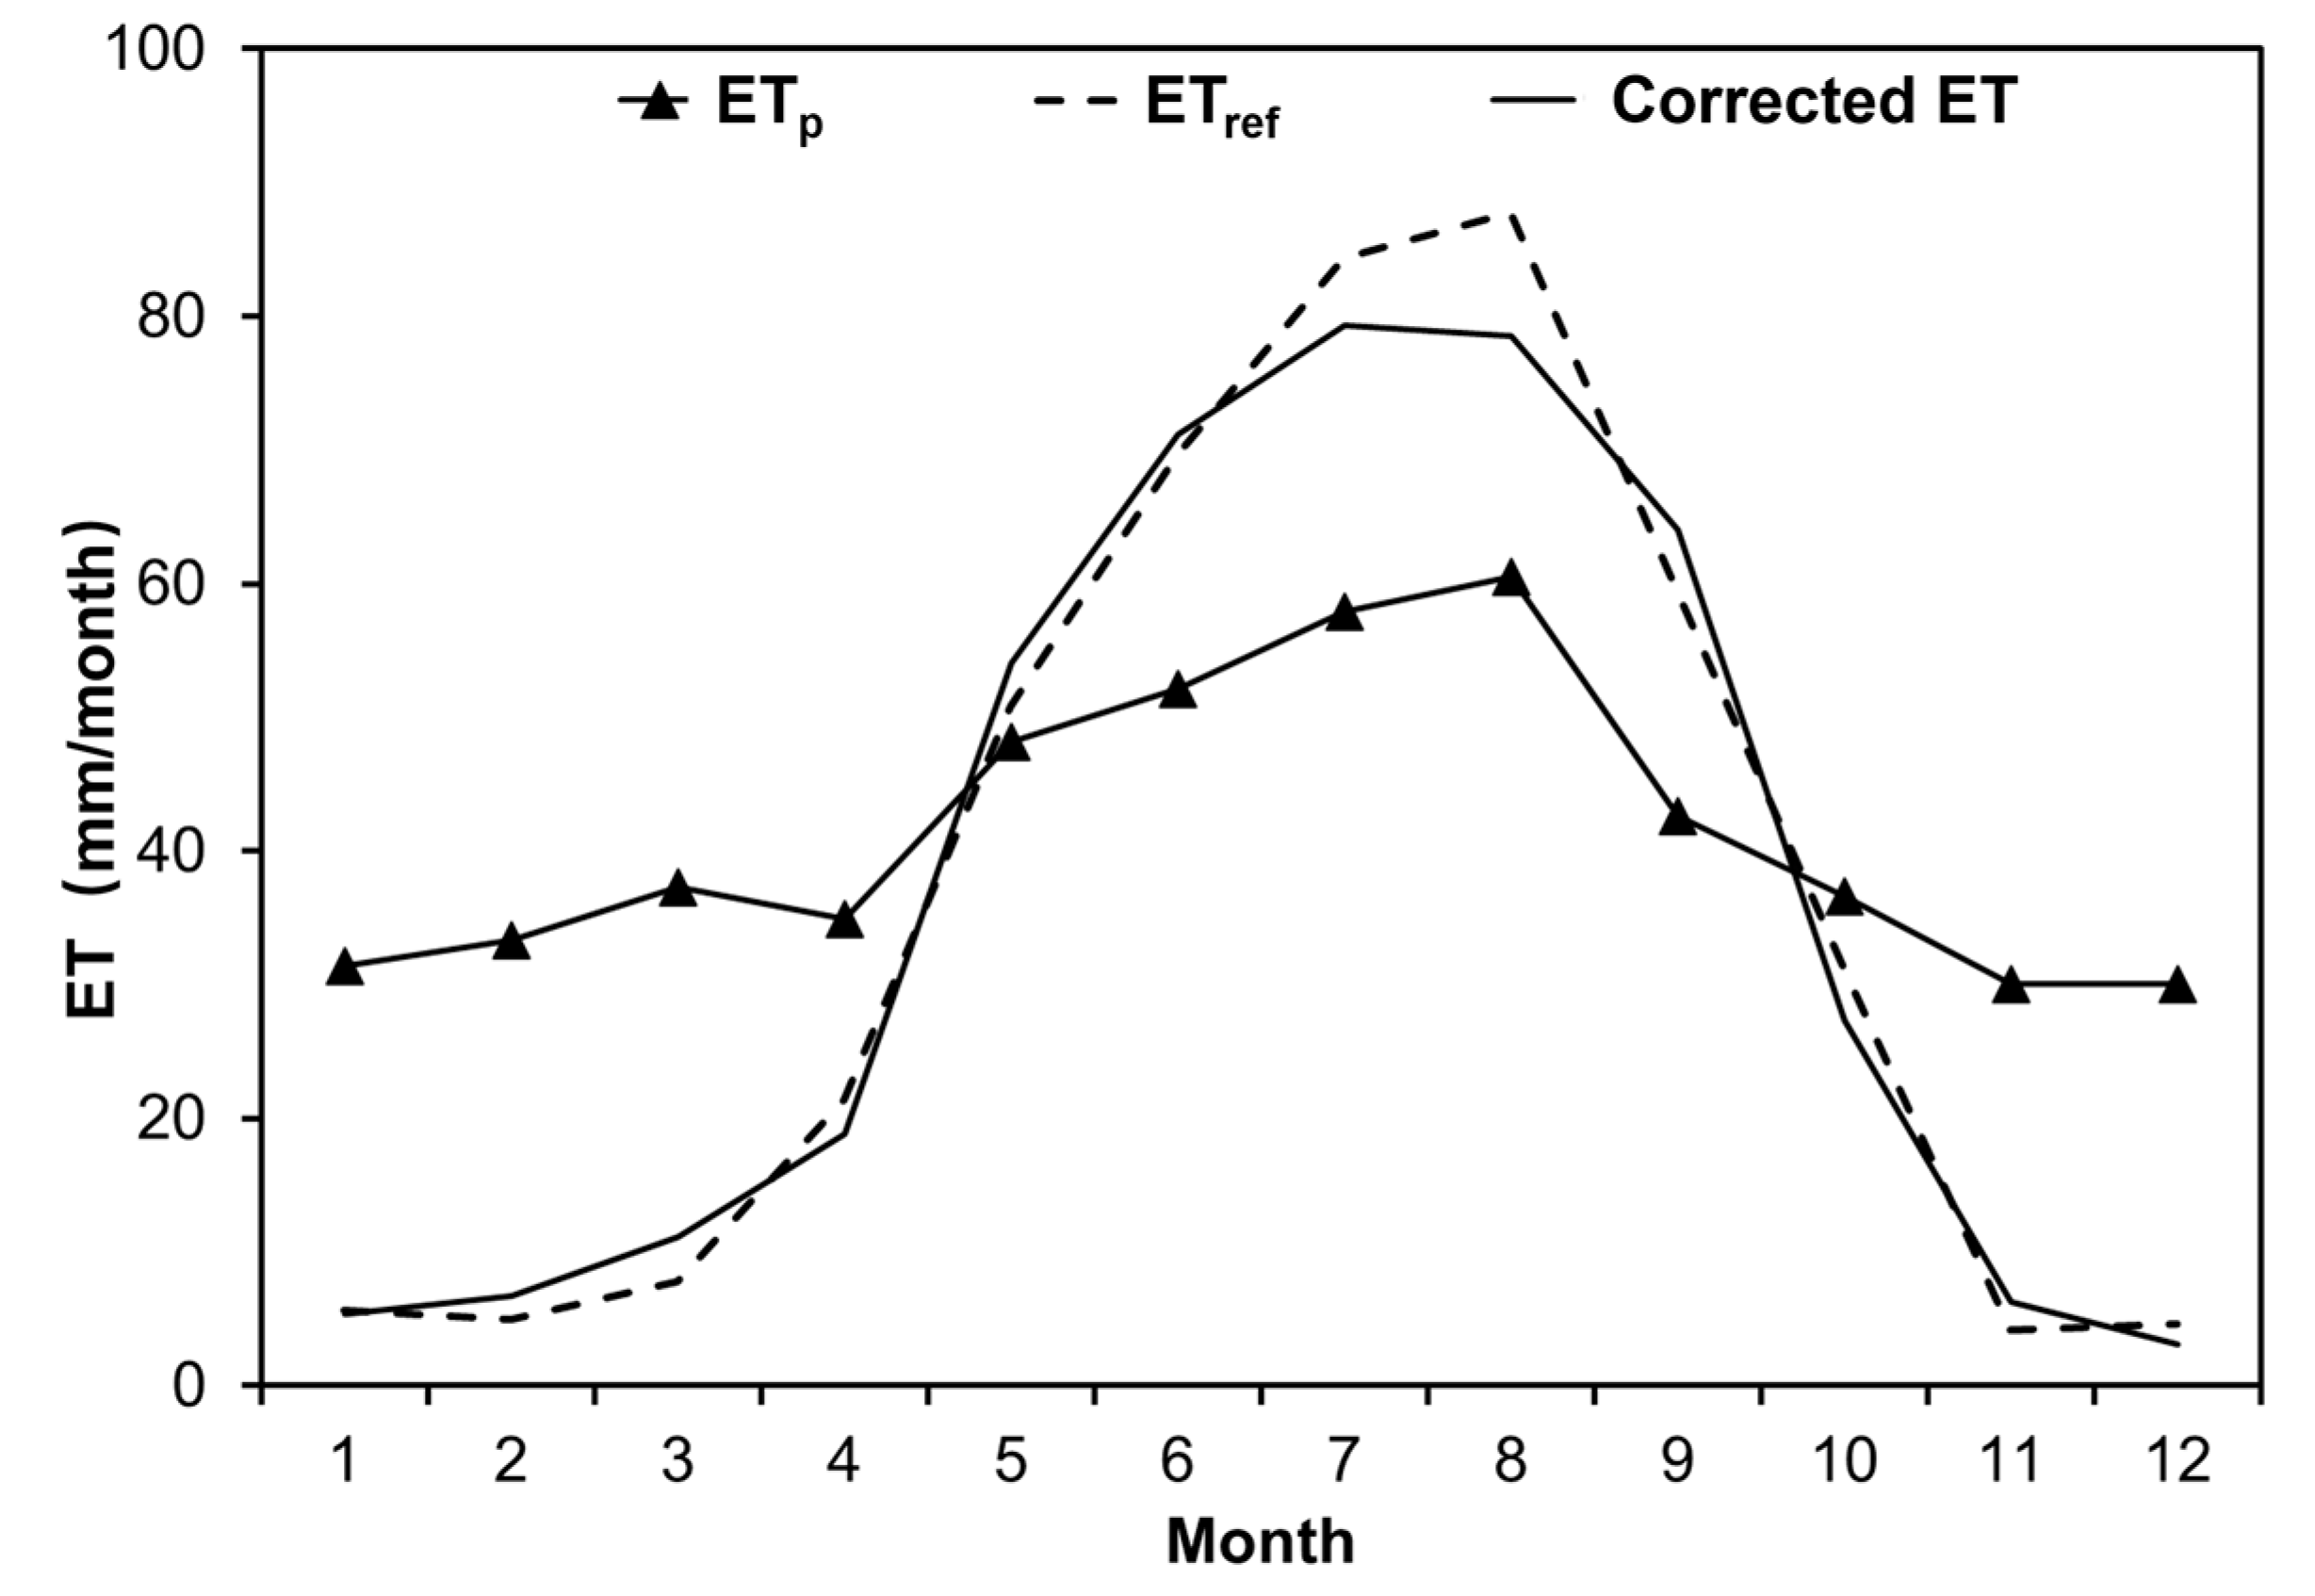
2.3.2. Ratio Correction of ETp

The ratio correction method is mainly based on the traditional water balance method. The ratio of reference ET to the product ET (i.e., r in Equation (2)) was used for correction. In this paper, two timescales were used: monthly scale and annual scale. Schematic diagram of ratio correction is shown in Figure 4.
r i = ET r e f , i ET P , i = Pre i R i Δ TWS i ET P , i ( i = 1 , 2 , 3 , , 12 )
where i represents the month, Pre i , R i , and Δ TWS i are monthly average value during the 2003–2014.
A schematic diagram of the ratio bias correction method is shown in Figure 4. This method is used to correct the ETp by the ratio of ET r e f and ET p . The monthly overestimates and underestimates are corrected using the monthly ratio of factors.

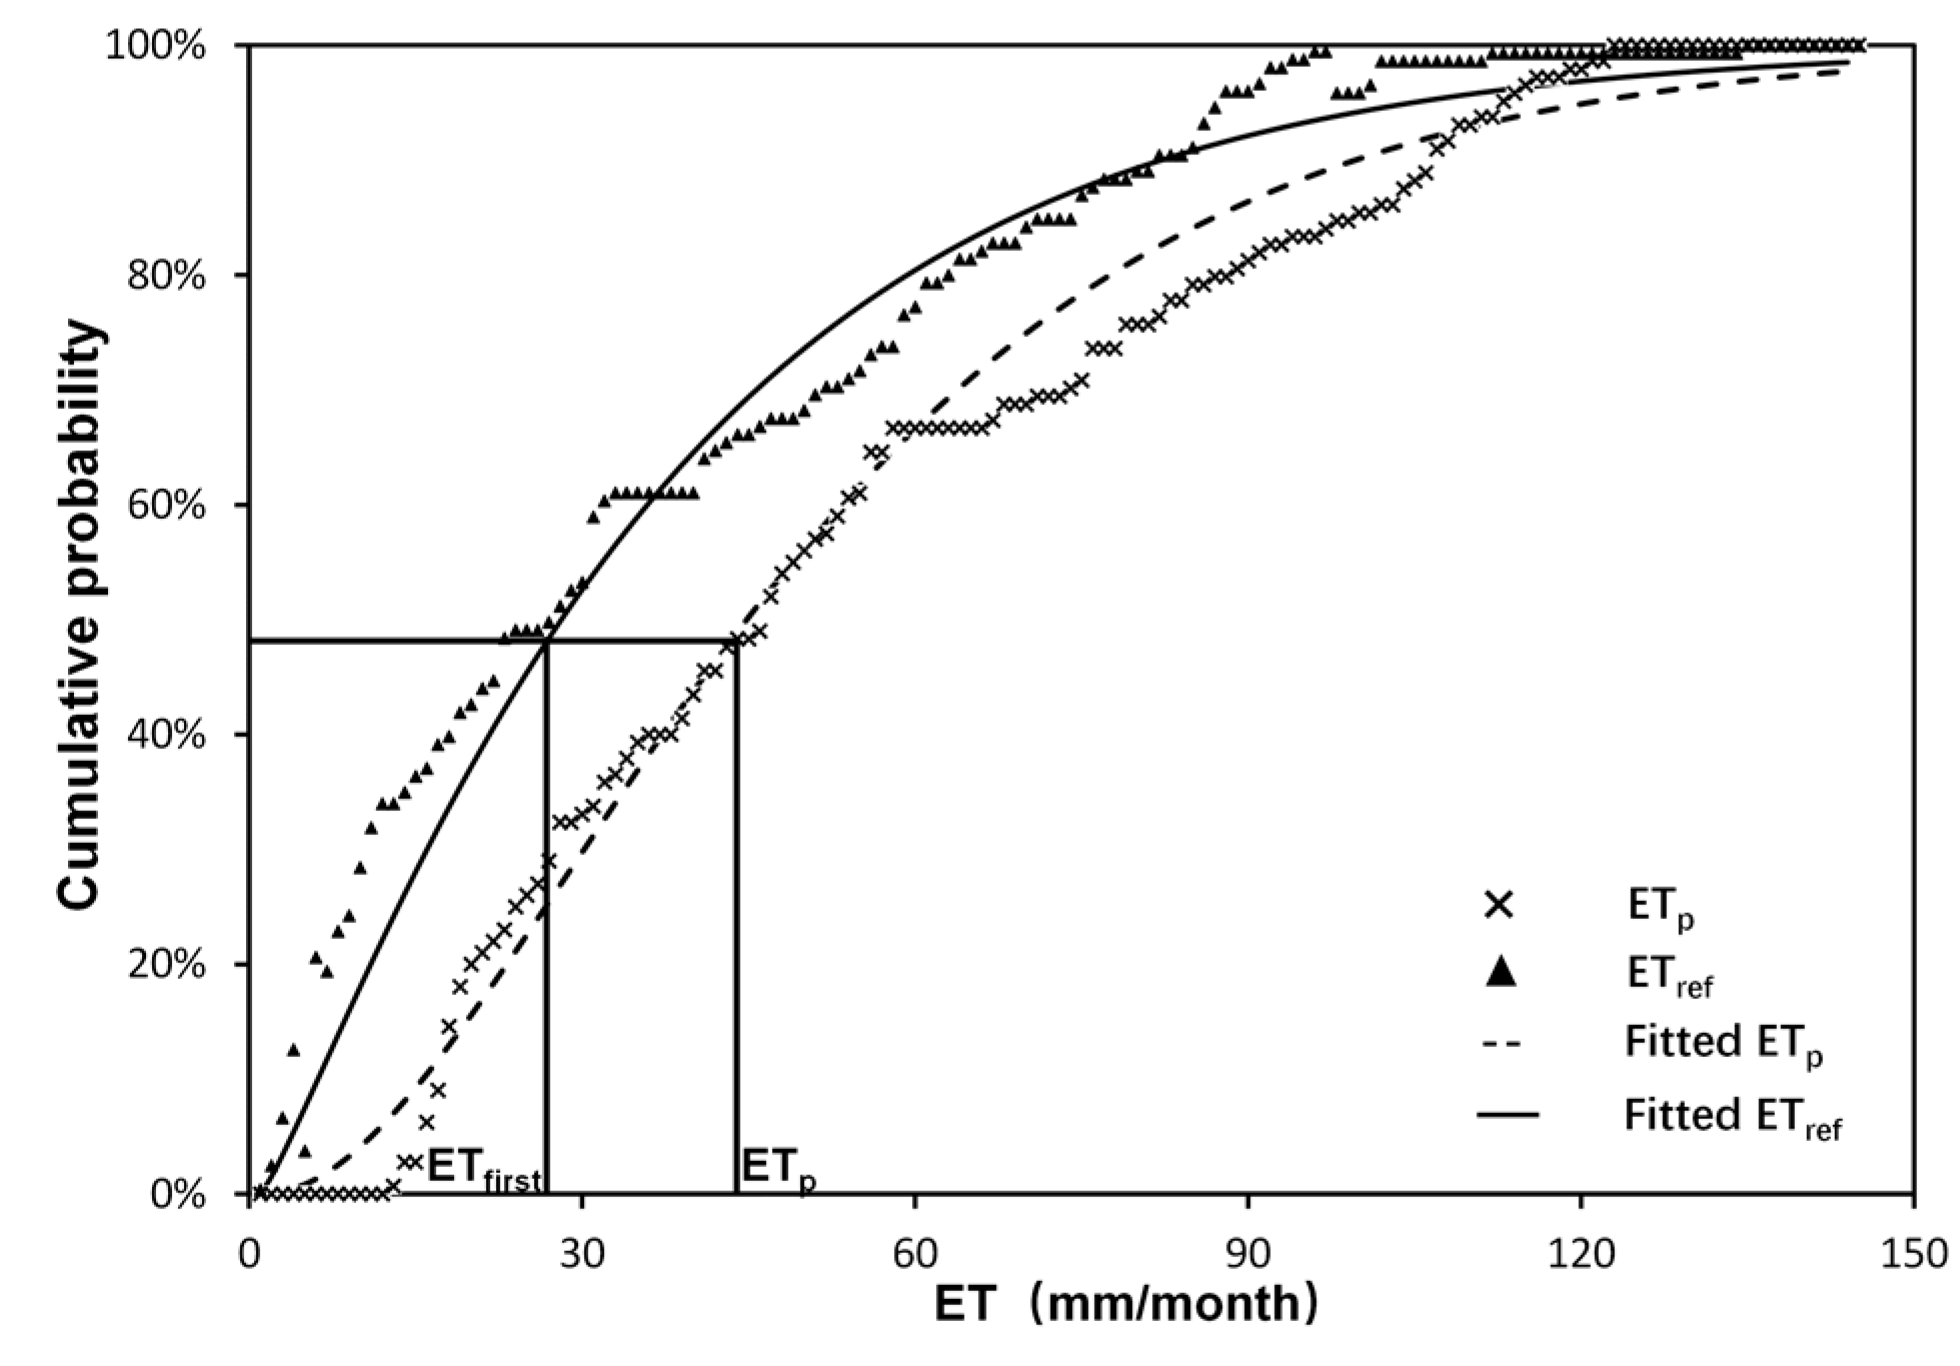
2.3.3. Gamma Distribution Correction of ETp

Gamma distribution is a continuous probability function, which is a very important distribution [49]. The gamma distribution fits the meteorological factors very well [18,25,50]. The gamma distribution can be expressed as [49]:
F ( ET | θ , μ ) = x θ 1 1 μ θ Γ ( θ ) e ET μ ; ET 0 , θ , μ > 0
where θ is the shape of the function, μ is the scale of the function; Γ is the gamma function.
The gamma distribution bias correction method has two steps [18,20,25]. First, the monthly ETp and ETref were fitted by the gamma cumulative distribution, and θ P , μ P and θ r e f , μ r e f were obtained Then the inverse function ( F 1 ) was used to calculate the ET with θ r e f and μ r e f (Equation (4)). Therefore, the monthly ETp was corrected by filling the gap between the two gamma cumulative distribution functions (Figure 5) [20].
ET f i r s t = F γ 1 ( F γ ( ET p | θ p , μ p ) | θ r e f , μ r e f )
where ET f i r s t represents the first monthly corrected ET.
Second, the annual bias was removed using the following equation [20]:
ET c o r r e c t e d ( m ) = P ( a ) R ( a ) ET f i r s t ( a ) ET f i r s t ( m )
where ET c o r r e c t e d is the corrected ET, ET f i r s t ( a ) and ET f i r s t ( m ) is the annual and monthly ET of the first step.

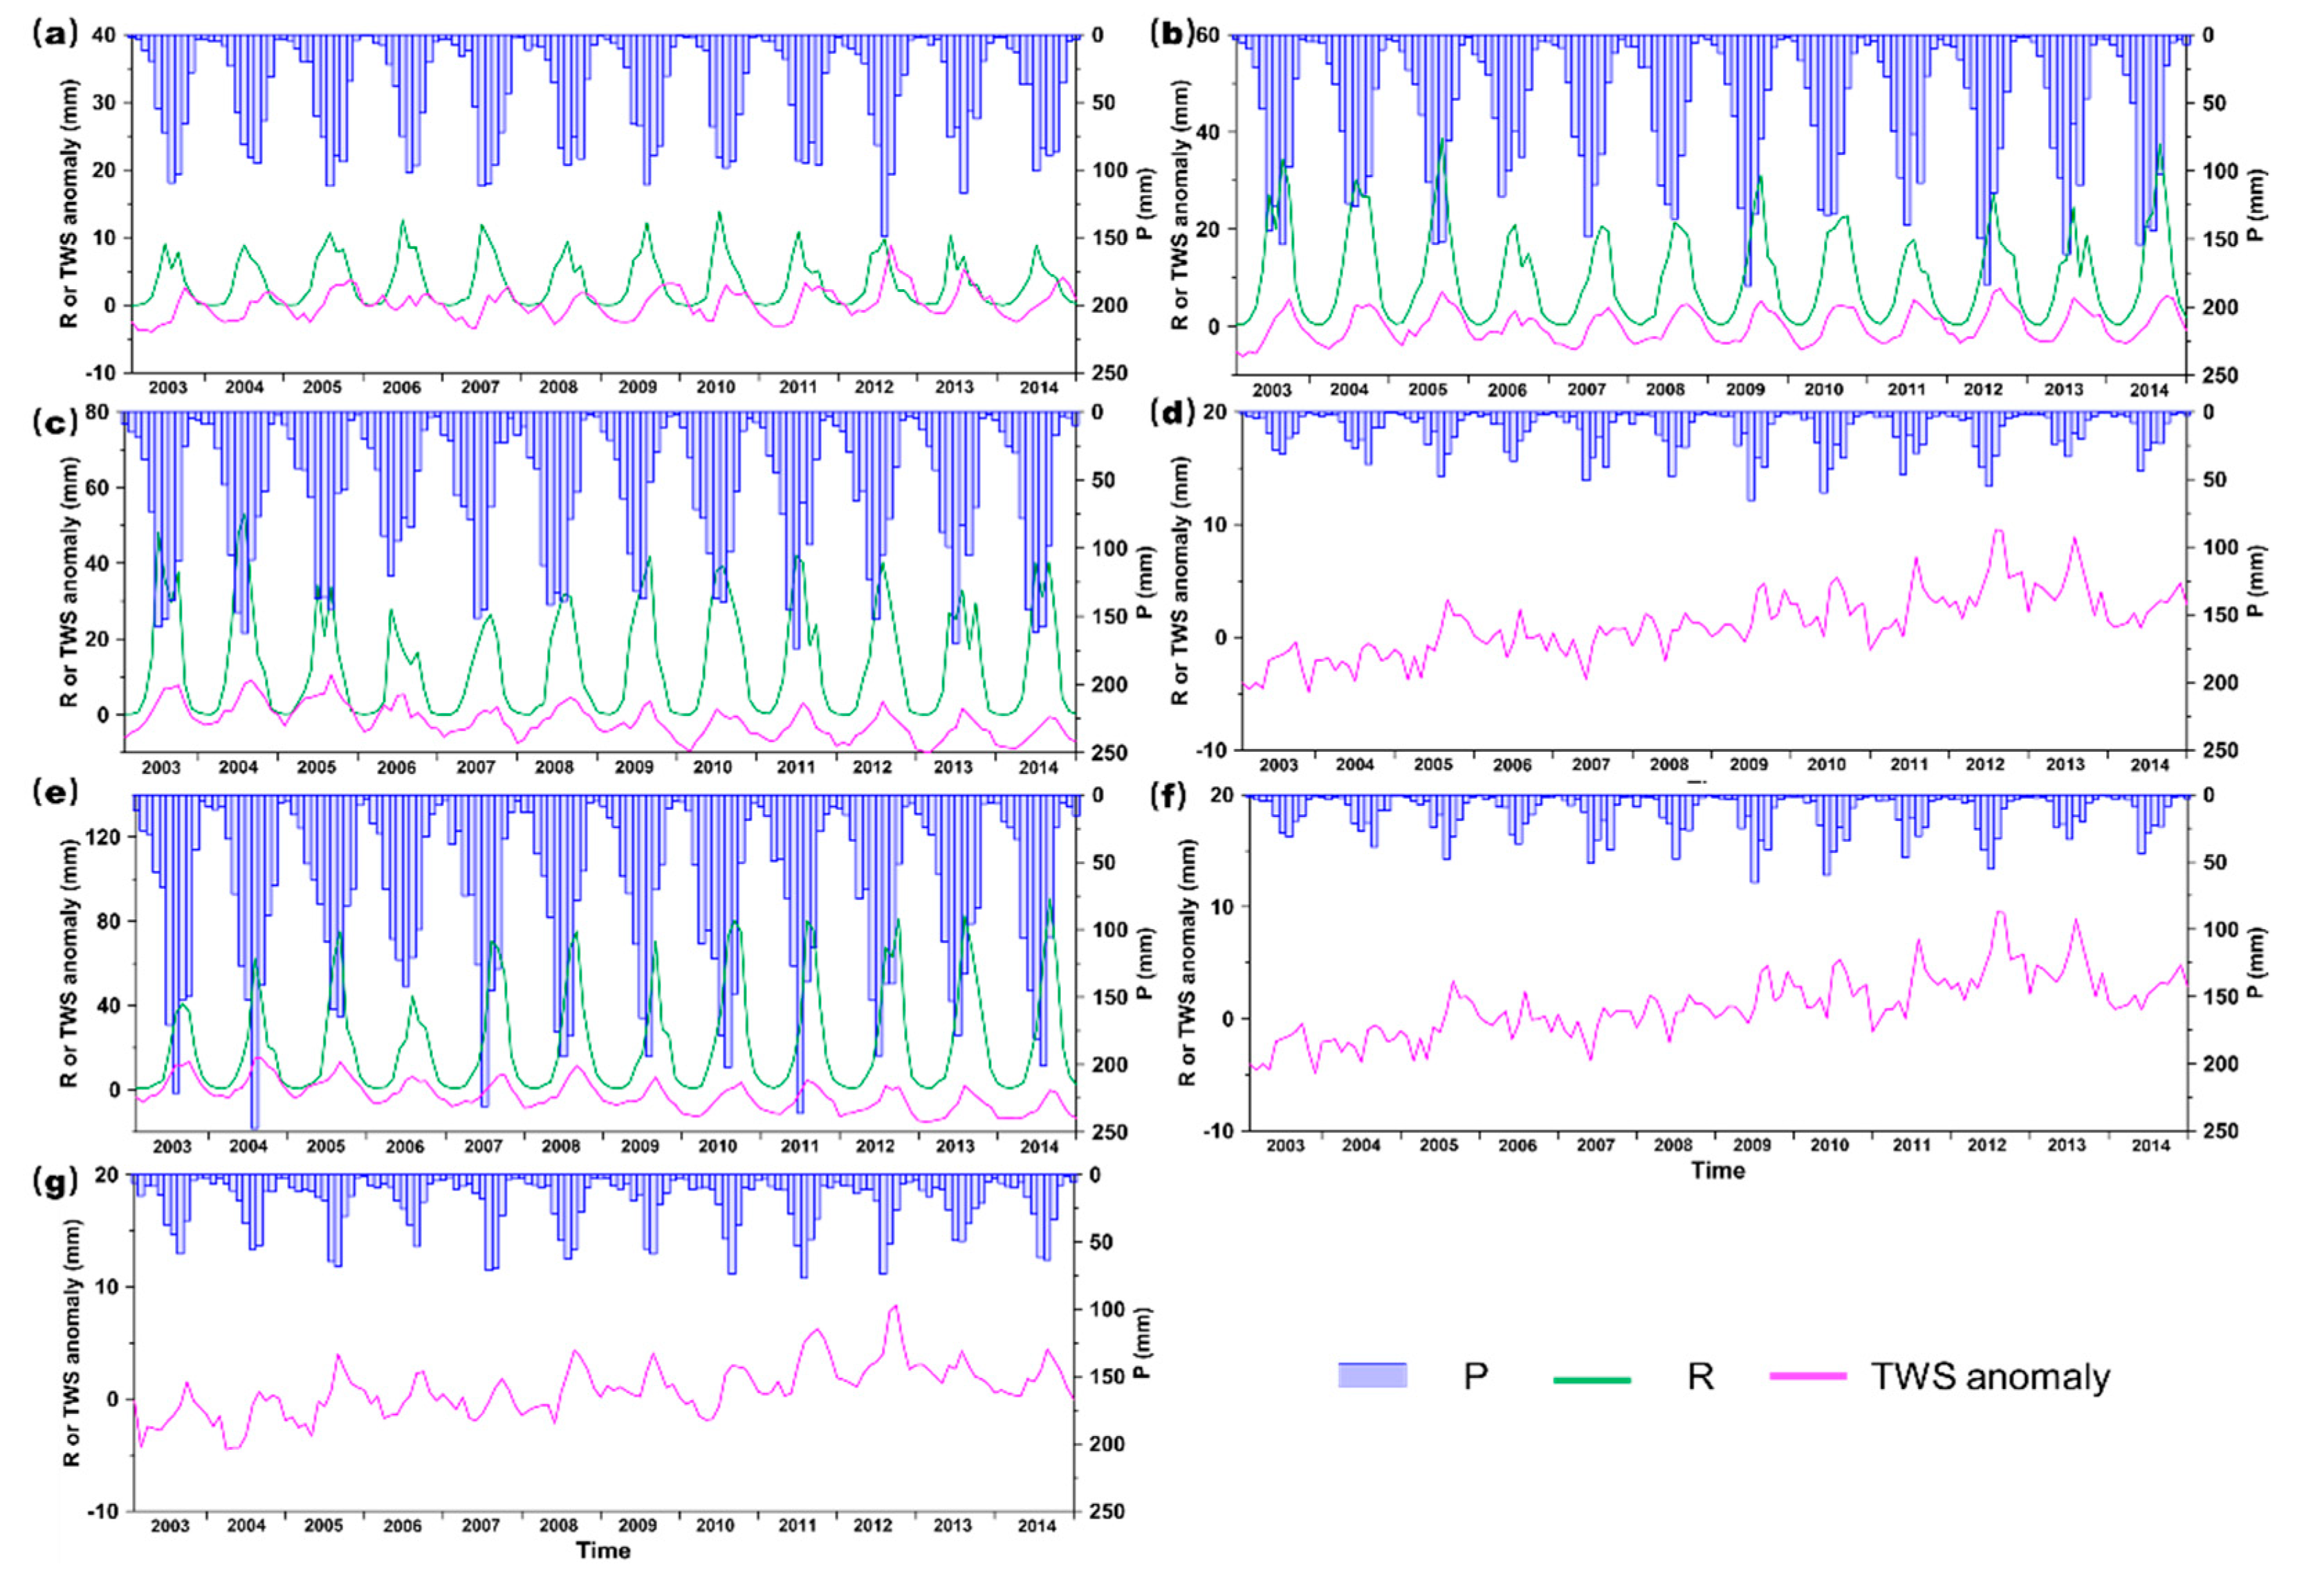
2.3.4. Uncertainty in Water Balance

All the components in the water balance were obtained from independent data sources, the uncertainties of ET r e f can be combined by summing uncertainties in each variable in quadrature [51]:
σ ET r e f = σ Pre 2 + σ R 2 + σ Δ TWS 2
where σ is the estimated uncertainty of the corresponding variable.
Uncertainty in the precipitation product was estimated in the assessment report, which was evaluated by the NMIC [42]. In the report, the error in precipitation was 5% for summer and 3% for other seasons. For the monthly GLDAS runoff data, the error was less than 5%, with a correlation coefficient greater than 0.90 on the Tibetan Plateau [46]. In this study, we adopted 5% for the uncertainty assessment. Uncertainties in GRACE TWS were estimated from variability among the three RL05 TWS gridded data. We used the standard error of the three TWS data to represent the uncertainty [52]. The uncertainties were converted to mm/month using the average monthly data of long time series. The uncertainties of different components were summarized in Table 3 in the sub-basins.

2.3.5. Evaluation Criteria

The deviation (DE), root-mean-square error (RMSE), and correlation coefficient (CR) were used as test standard
D E = j = 1 m ( U j V j m )
R M S E = j = 1 m ( ( U j V j ) 2 m )
C R = j = 1 m ( U j U ¯ ) ( V j V ¯ ) j = 1 m ( U j U ¯ ) 2 j = 1 m ( V j V ¯ ) 2
where m is the number of months, U j represents the monthly ET P or ET c o r r e c t e d , and V j represents the monthly ET r e f , U ¯ represents the monthly mean ET P or ET c o r r e c t e d , and V ¯ represents the monthly mean ET r e f .

3. Results

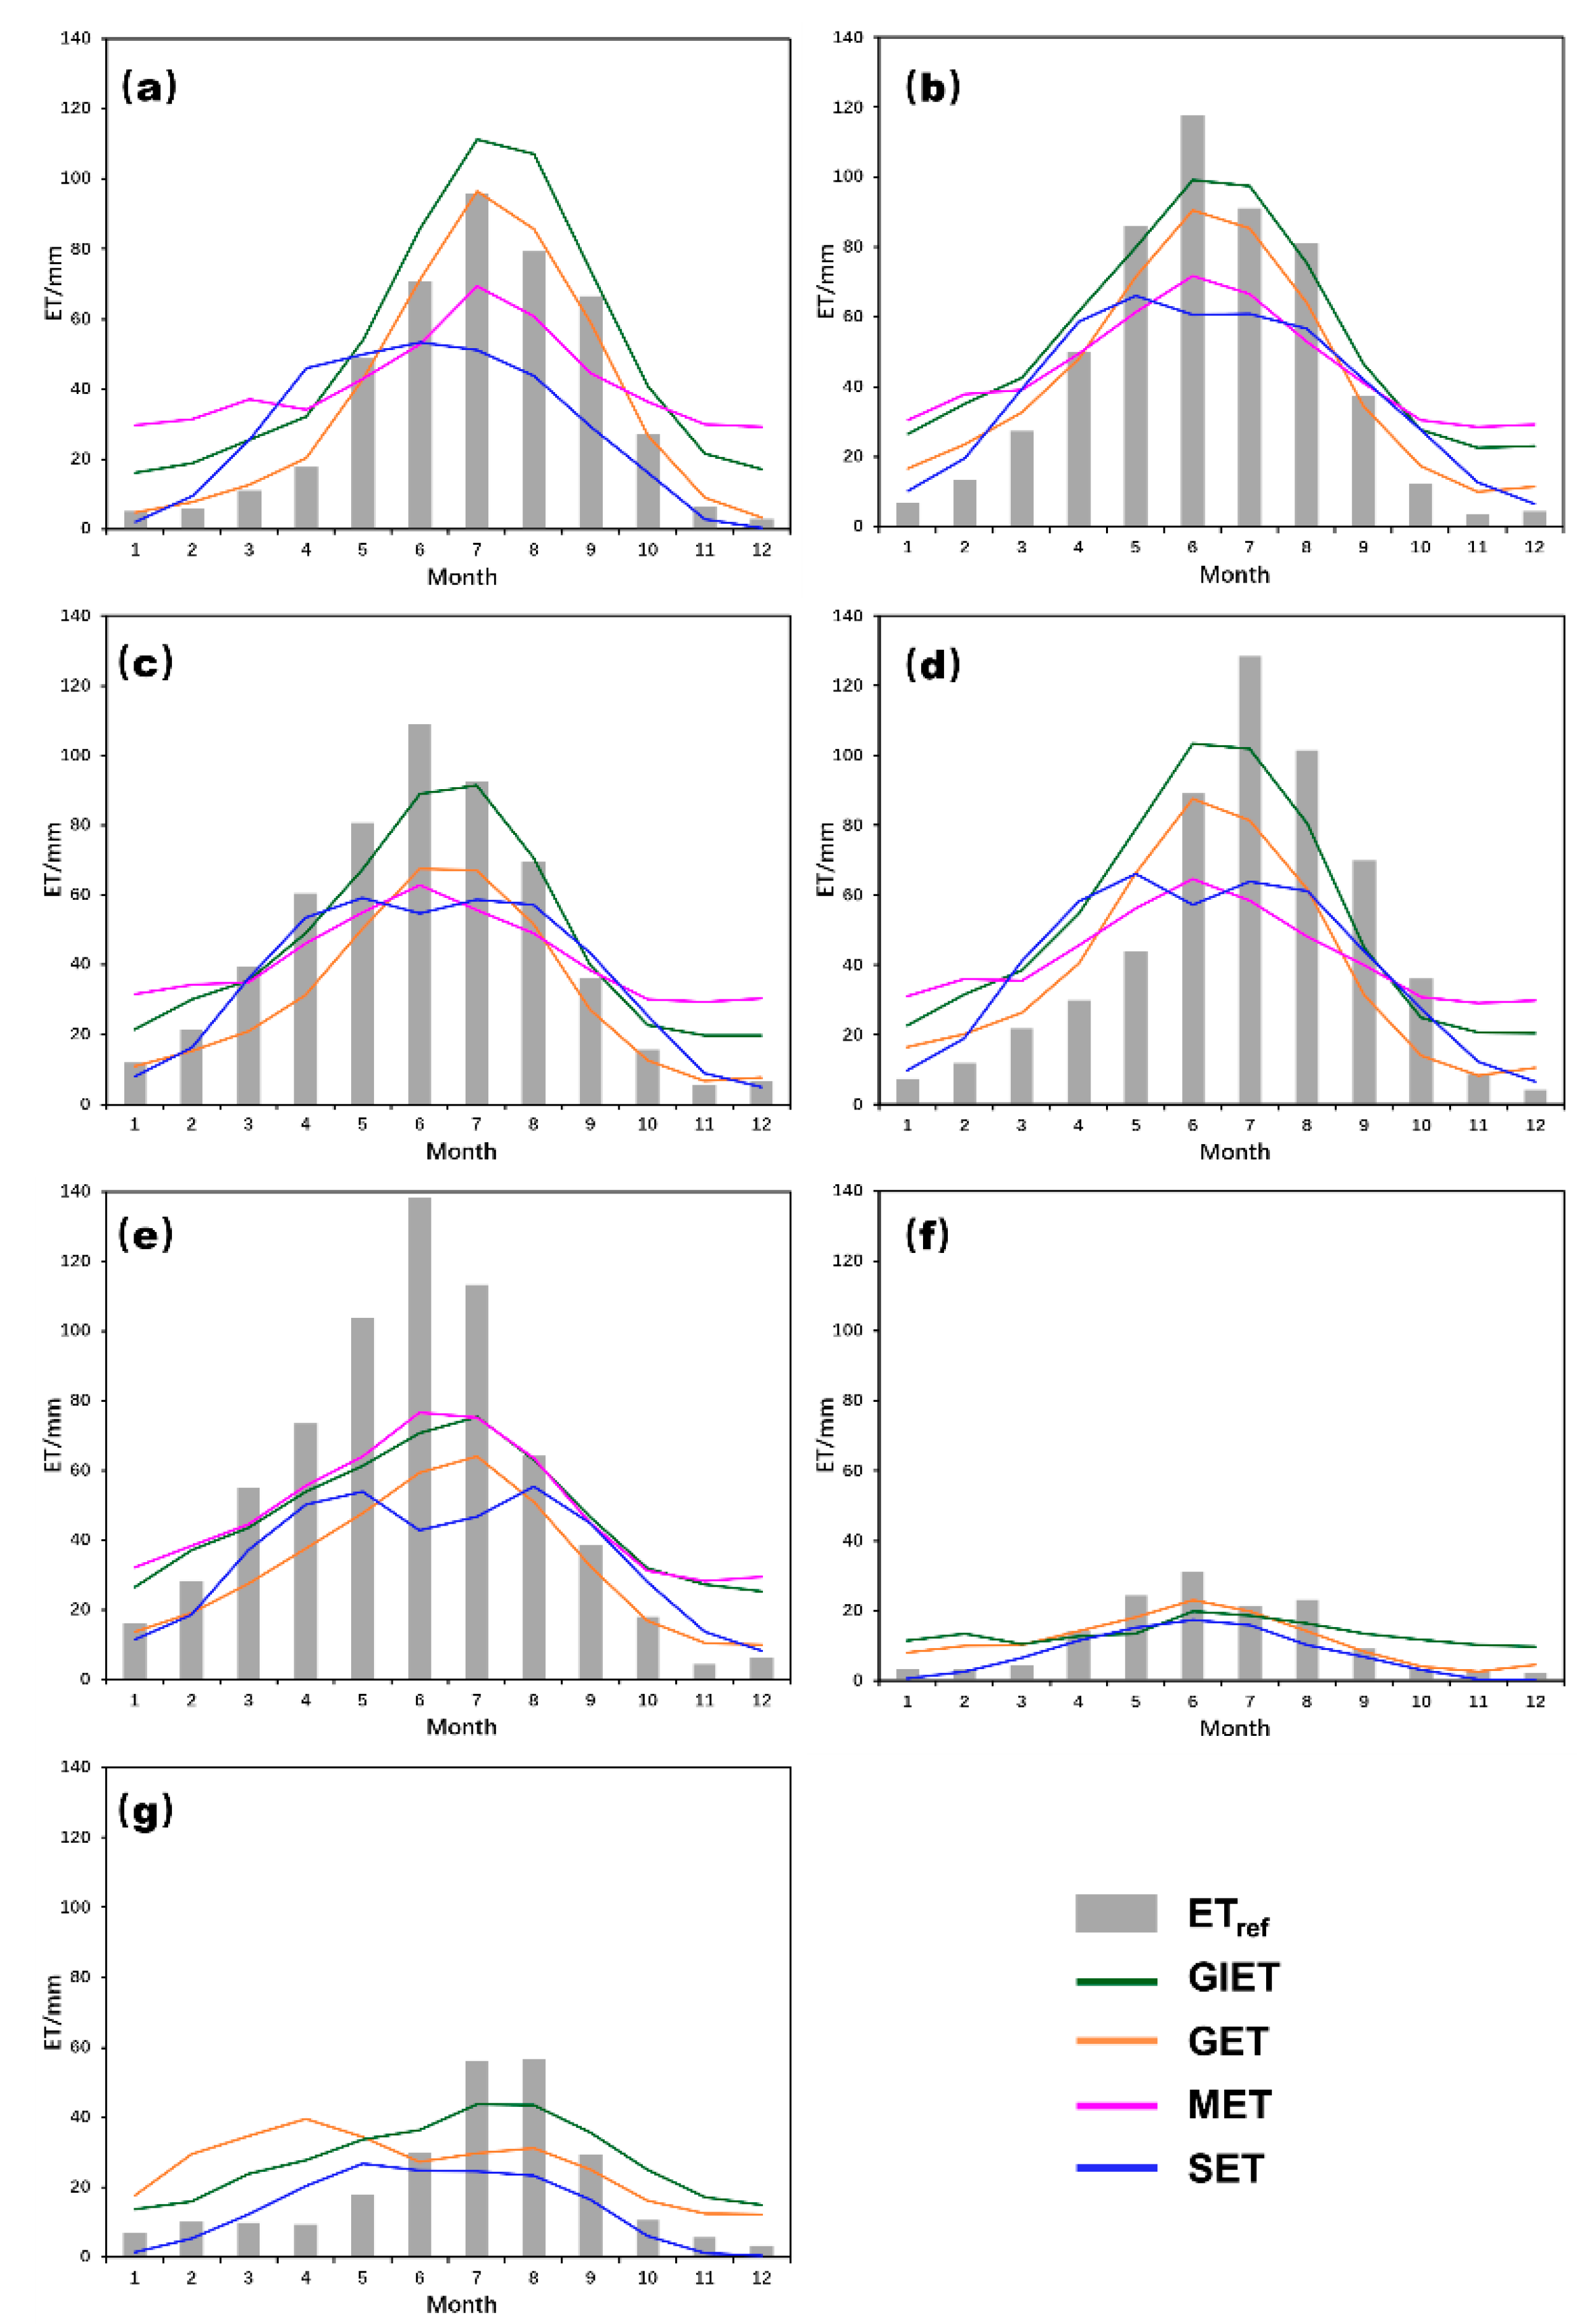
3.1. Evaluation of ETp

Figure 6 and Figure 7 show the domain-averaged values of the four ETp and the ETref in the seven sub-basins. The ETref and ETp is maximum in summer and minimum in winter. The four ETp are significantly different from each other. The ETref in the Yarlung Zangbo Basin is the greatest among the seven sub-basins, with an annual mean ET of 659 mm. The annual mean ET of the Qaidam Basin is the smallest, with an annual mean ET of 143 mm. The annual mean ETref in other sub-basins ranges from 246 to 549 mm. The ETp overestimated winter ET in almost all the sub-basins and underestimated summer ET in all the sub-basins except the Yellow River Basin.
In general, the four ETp are the most accurate with regard to the Yellow River and the worst in terms of the two endorheic basins. GET and GIET are the most accurate in estimating ET, followed by MET. SET is the worst at reproducing monthly ET in the ETp. GET is the best at reproducing monthly variations in the source of Yellow, Yangtze, Salween, and the Qaidam Basin. GIET was best for the source of Mekong, Yarlung Zangbo Basin and the Inner Plateau. There is no special advantage of MET and SET in the estimation of ET in the seven sub-basins.

3.2. Correction of ETp

The gamma distribution correction method and the ratio bias correction method were used to correct the four ETp. In order to compare the correction effects of the two correction methods, the four ETp before and after bias correction are compared in the seven sub-basins (Figure 8). The DE, RMSE, and CR values are shown in Table 4. After the gamma distribution and the ratio bias correction, the four ETp in the seven sub-basins showed greater CR with the ETref, and smaller RMSE and DE values. Table 4 shows that the ratio bias correction method has the smallest DE and RMSE values and the greatest CR value. These statistical values show that the proposed ratio bias correction method performs better than the gamma distribution correction method. Moreover, the ratio bias correction method is simpler and more efficient to correct the ETp.
As shown in Table 4 and Figure 8, the original ETp was not in good agreement with the ETref. In terms of DE, the original ETp has the largest deviation, up to 13.61 mm, while the deviations of the corrected ETp are all less than 0.03 mm. The DE of the monthly ratio correction is the smallest, which is only 0.01 mm. In terms of RMSE, the original ETp has the largest deviation (up to 17.6 mm), and the deviation of monthly ratio correction is also the smallest, which is only 10.1 mm. The monthly ET after the ratio correction has the highest correlation with the ETref (up to 0.97), while the gamma distribution bias correction has the lowest correlation (0.91). The proposed method reduced the deviations and the ETp became more accurate to represent the regional ET. It is simpler and more effective in correcting the four ETp compared with to gamma distribution bias correction method.

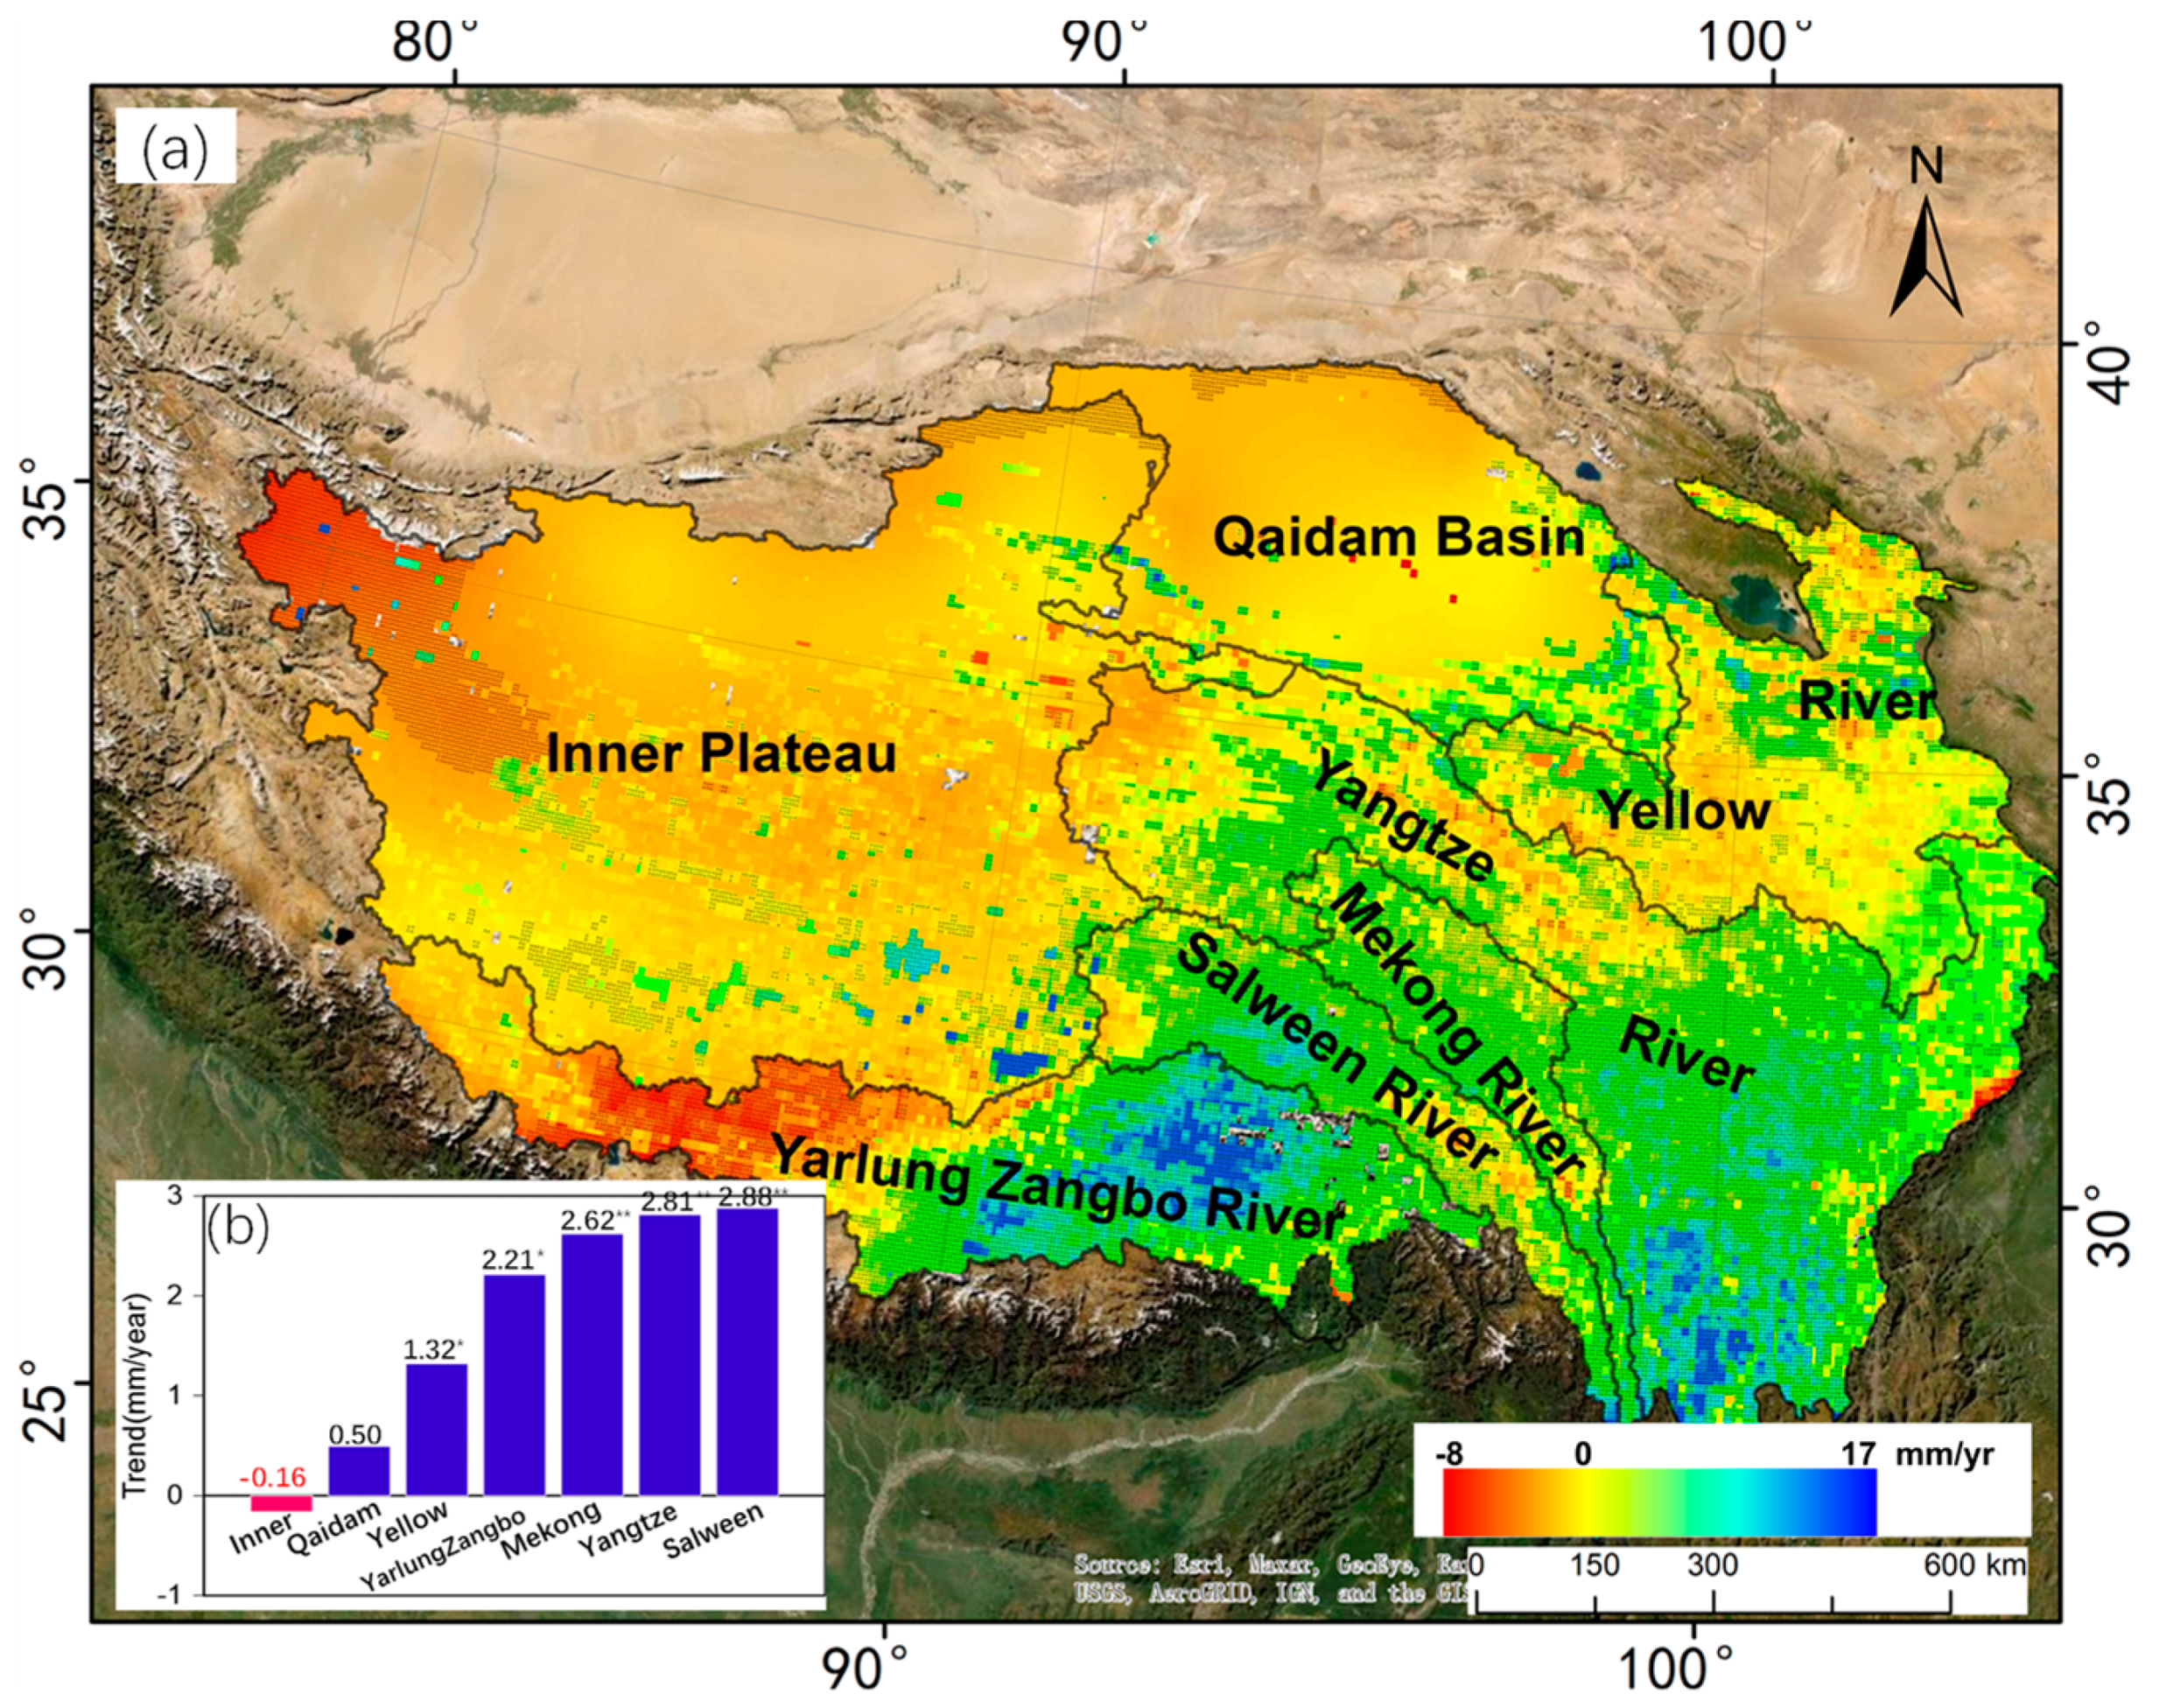
3.3. Spatial Distribution and Trend of ET over the Tibetan Plateau

Considering all the criteria, the monthly ratio correction method was adopted to obtain the optimal ET. We use arithmetic averaging to incorporate the four ETp. The average corrected ETp was combined to draw the distribution of ET on the Tibetan Plateau (Figure 9). Figure 9 shows the corrected ET distribution in the sub-basins on the Tibetan Plateau. The ET decreased from 1600 mm in the south to 26 mm in the north. The spatial distribution of ET is consistent with the distribution of precipitation. The distribution of ET is consistent with the result of Gao et al. [52], which was estimated using gauging stations. The ET of the Yarlung Zangbo Basin is the greatest among the seven sub-basins, ranging from 150 to 1605 mm. The ET is the smallest in the middle reach of the basin and greatest in the downstream. ET in the Qaidam Basin is the smallest, which is 150 mm. The average values of ET in the source regions of Yangtze, Salween, and Mekong River are almost the same at approximately 550 mm. The average ET of the Yellow River source region is 438 mm. The ET in both the Yangtze River source region and the Yellow River source region decreases from southeast to northwest. The distribution of ET of the Inner Plateau and Qaidam Basin also shows a similar pattern. The Inner Plateau is the largest region, located in the central area of the Tibetan Plateau. This region is less affected by monsoons [33], resulting in relatively small ET with an average value of approximately 200 mm. The ET decreases from 400 mm in the south and southeast to 80 mm in the north and northwest.
The trends on the Tibetan Plateau were estimated using the least square method [18,53]. The arithmetic average of the four corrected ETp was used to draw the distribution trend of ET on the Tibetan Plateau (Figure 10). The ET on the Tibetan Plateau increased from 2003 to 2014 with an average value of 1.2 mm/yr. The trend of ET decreased from 17 mm/yr in the southeast to −8 mm/yr in the northwest. The trend of ET in the Inner Plateau was decreasing among the seven sub-basins, while the others were increasing from 2003 to 2014. But the Inner Plateau has only a slight decreasing trend (−0.15 mm/yr). The trend in the Salween is the greatest among the seven sub-basins at 2.88 mm/yr. The trend in the Yangtze, Mekong, and Yarlung Zangbo Basins are similar, at about 2.5 mm/yr. The trends in the Yellow and Qaidam are 1.32 mm/yr and 0.50 mm/yr, respectively. The significance analysis shows that ET trends in the Inner Plateau, Qaidam, west of Yarlung Zangbo Basin, and Yellow River source region have not been identified (p > 0.1). The trends in the Salween, Yangtze, Mekong, and east of Yarlung Zangbo Basin are significant (p < 0.05).

4. Discussion

4.1. Uncertainty of ETref

The ETref (derived from the water balance) is to be taken as a reference. The uncertainty of ETref is important, as this is a basis to correct ETp and is related to the reliability of the corrected results. Table 3 shows the uncertainties of P, R, and TWS. The uncertainties of ETref vary in the seven sub-basins (Table 3 and Table 5). The annual uncertainties of ETref in the five outflow basins (Yangtze, Yellow, Yarlung Zangbo, Mekong, and Salween) are less than 6%. But the annual uncertainties of ETref in the two endorheic basins (Inner Plateau and Qaidam Basin) are 19% and 30%. The reason for this is that the vegetation cover in these areas is very minimal and the quality of remote sensing data is poor [38,44,52].
We must also admit that the estimates of uncertainties are weak according to Li et al. [51] and the national technical report [42]. The uncertainty may not be very precise because there are few observations on the Tibetan Plateau. But the uncertainty can represent the relative differences among the seven sub-basins. We can use more precise data or integration of several reliable products to eliminate data uncertainty [17,22].

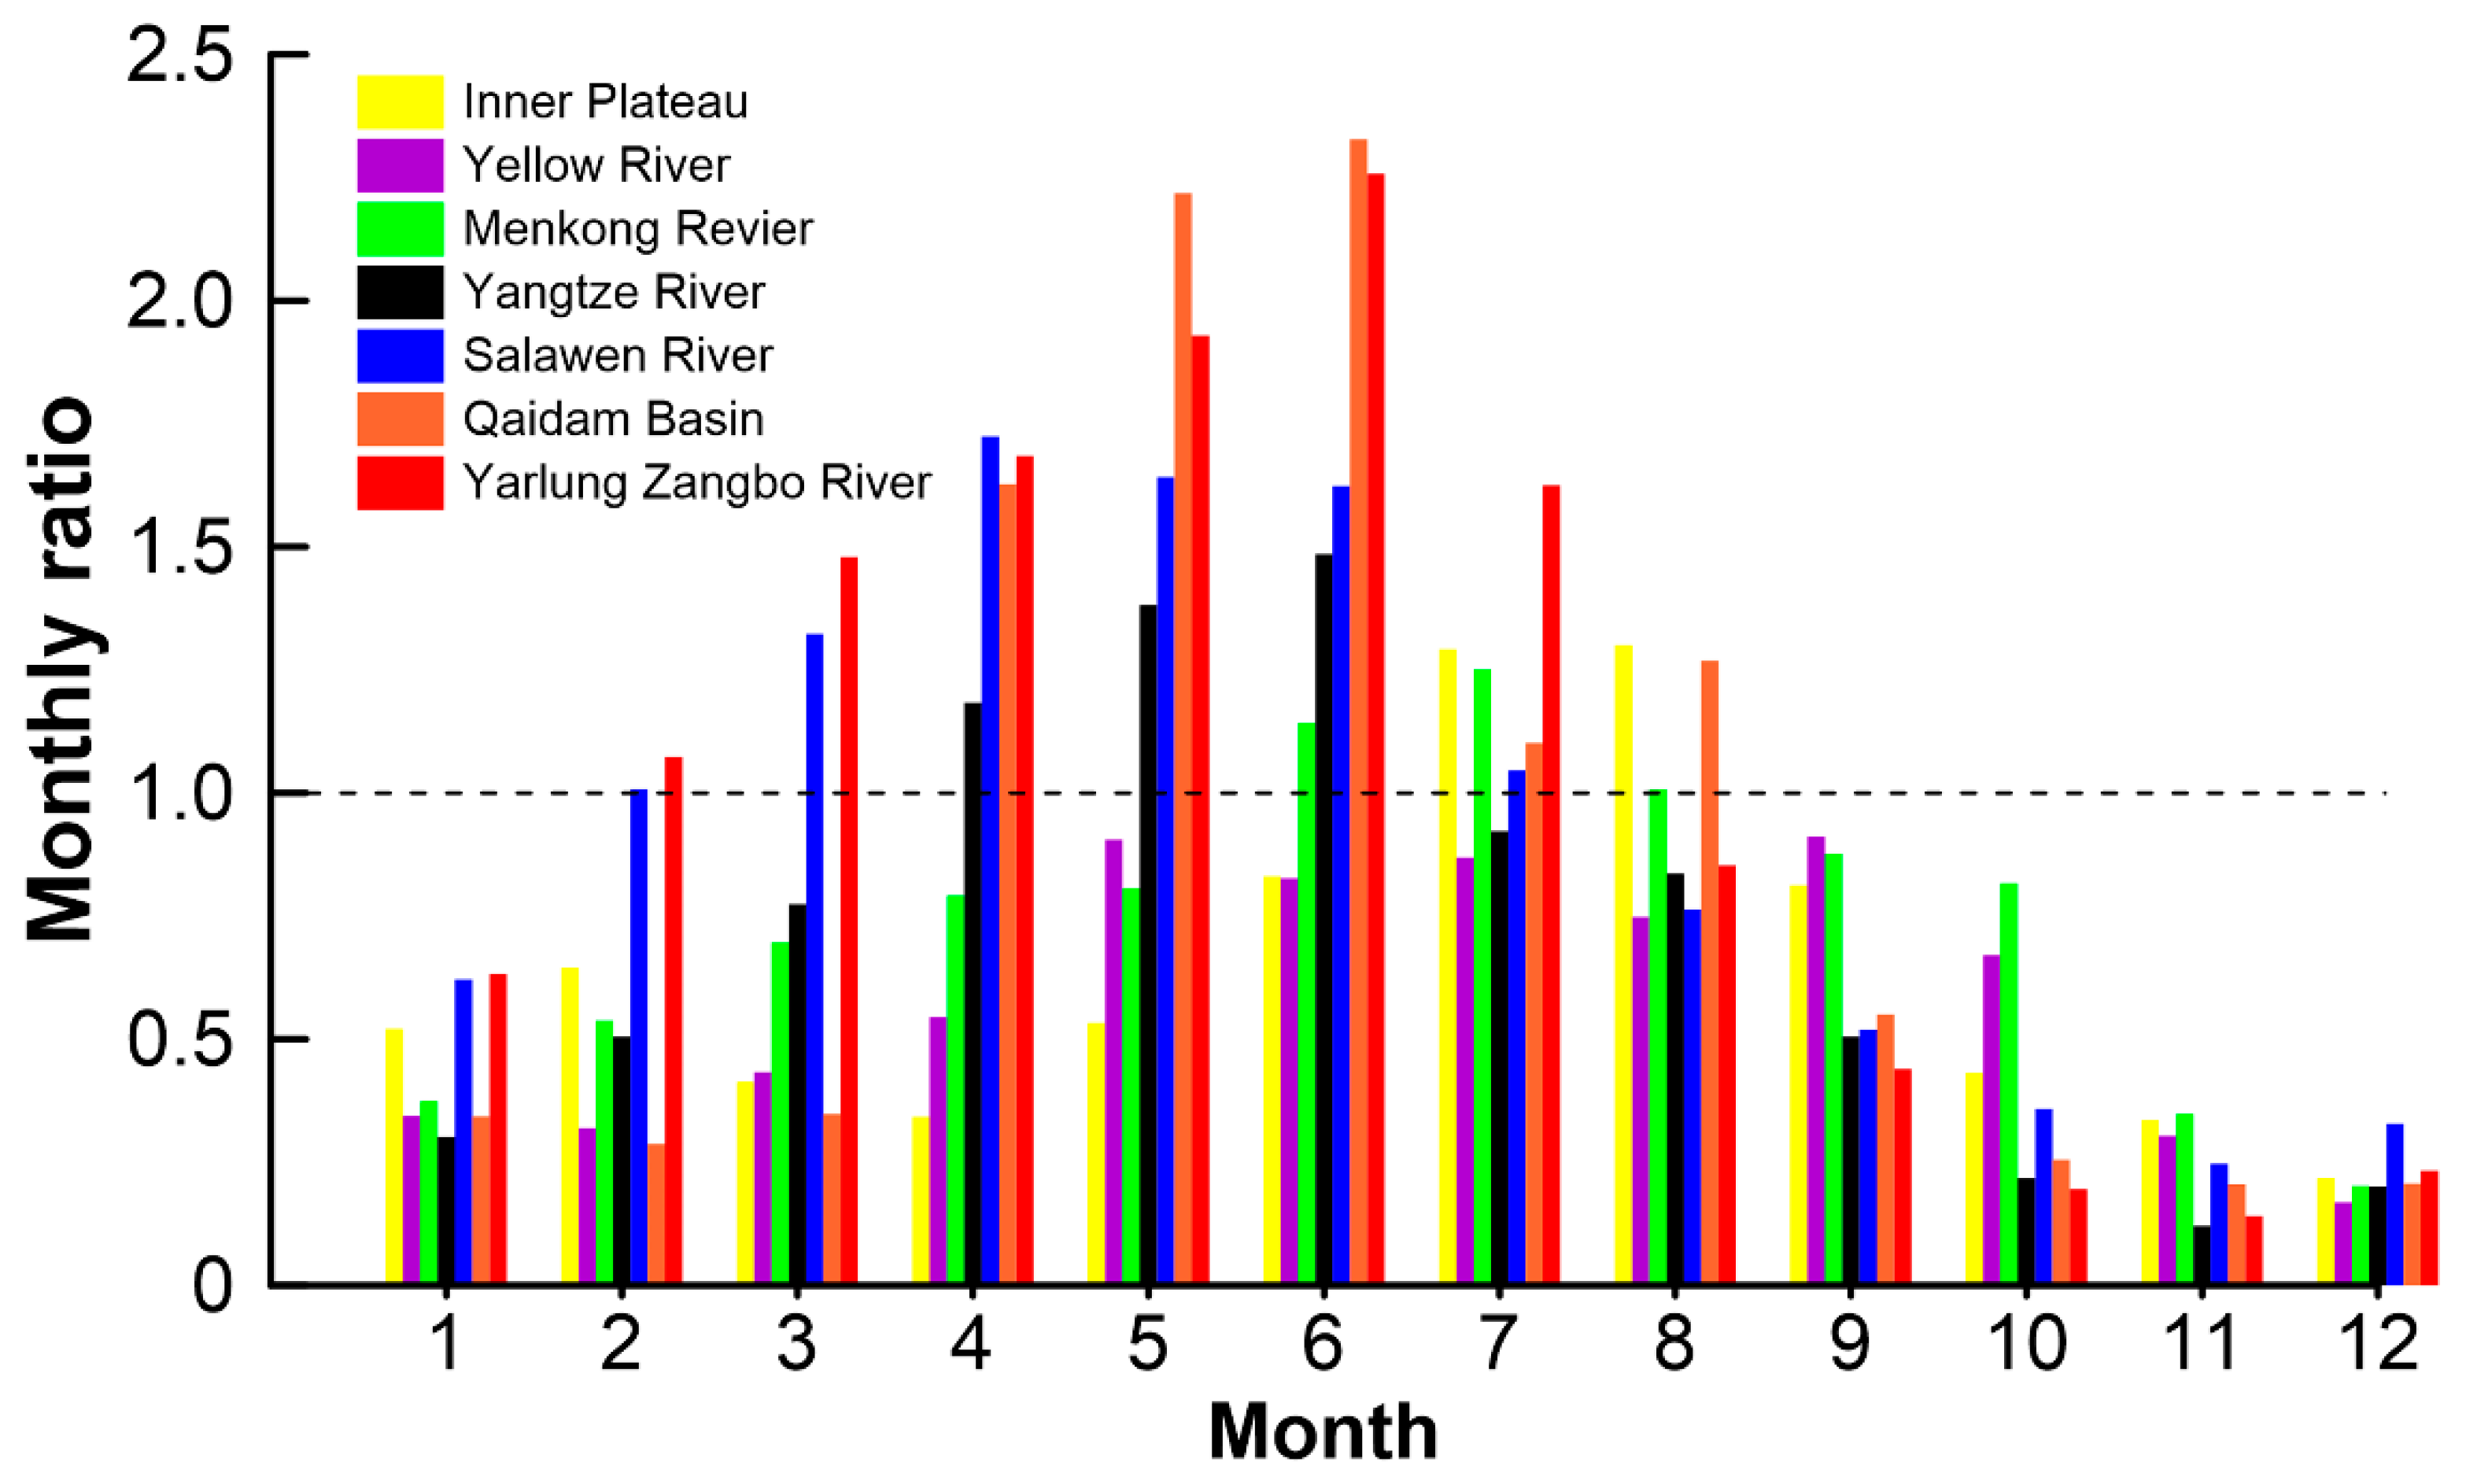
4.2. The Monthly Coefficients of Ratio Bias Correction

The ratio bias correction coefficients for the most optimal corrected ETp in each sub-basin are shown in Figure 11. The result shows different performances in each sub-basin and each month. In addition to the Inner Plateau and the Yellow River, the correction coefficients in spring and summer (March–August) are greater than 1, indicating that the original ETp would overestimate ETa in hot weather. All the correction coefficients are less than 1 in autumn and winter, indicating that the original ETp underestimated ET in cold weather for each sub-basin (Figure 9). The most significant overestimations occurred in the Qaidam Basin, the Yarlung Zangbo Basin, and the Salween River from April to June. The correction coefficients are much greater than 1. This may be related to the climate features of these basins. The climate in the Qaidam Basin is very dry, and the ET is relatively small.
Uncertainties in the ETp come from the input of meteorological and surface cover data [18]. It is difficult to calculate ET in the Qaidam Basin due to the dry climate, which leads to a large error in ETp. In the southwest Tibetan Plateau, clouds are formed due to the water vapor. The overestimations of ET in the Yarlung Zangbo Basin and the source of the Salween River Basin are affected by clouds. The ETp for the source regions of the Yellow River and the Mekong River most seriously underestimated the ET, with the correction coefficients less than 1 in all seasons. The correction coefficient of December was only about 0.2 in these two sub-basins. The freezing phenomenon in cold weather may be the main reason for the underestimation, because most remote sensing data have difficulty capturing phenomenon of freezing [54]. Other sub-basins were characterized by slight overestimation before monsoon and underestimation after monsoon (Figure 11).

4.3. Limitations

The monthly ratio correction method was adopted as an effective method to correct the ET. The corrected ETp are more reasonable and accurate than the original ETp. But we should also be fully aware of the following limitations in the proposed monthly ratio correction method.
The water balance method with a corrected TWS was used to calculate the monthly ET as the ETref. Although the corrected results are reliable, the uncertainty in TWS is relatively large [17,18]. ETref was calculated using the water balance method with the GRACE TWS, whereas the spatial resolution of the TWS data is 1° and the temporal scale is monthly [30]. The ETref is relatively accurate on the basin scale, and has been widely used to evaluate the change of global ET [22]. However, the resolution of this data is too coarse to capture the spatial variation of evaporation in small catchments [51]. The proposed correction should be carried out in large basins [20]. The uncertainty caused by the boundary effect should be considered when applying this method in small basins [17].
The input data (P and R) should also be considered carefully to calculate the ETref. The reliability of ETref depends on the accuracy of P and R. In this study, the estimates of uncertainty is weak according to Li et al. [51] and the national technical report [42]. The integration of several reliable products will improve the accuracy of input data (P and R) [17,22,51].

5. Summary and Conclusions

This study presents an evaluation of four ETp in seven sub-basins in the Tibetan Plateau with the ETref calculated by the water balance method. Obvious seasonal cycles were found in the ETref and ETp. The ET was at maximum in summer and minimum in winter over the period of 2003–2014. The four ETp are significantly different from the ETref, regardless of time series or monthly average.
Two correction methods were compared to correct the four ETp. The proposed ratio bias correction method is simpler and more effective in correcting the four ETp compared with the gamma distribution bias correction method. The corrected ET improved the correlation coefficients, and reduced the biases and RMSEs.
The average corrected ETp, which was obtained from the arithmetic mean of the four corrected ETp, was combined to draw the distribution and trend of ET in the Tibetan Plateau. The ET on the Tibetan Plateau decreases from southeast to northwest. The average value of ET is 380 mm/yr ranging from 26 mm/yr to 1600 mm/yr. There is a general increasing trend of ET in the Tibetan Plateau, with an average value of 1.2 mm/yr over the period of 2003–2014.

Author Contributions

Conceptualization, Y.F. and X.K.; methodology, Y.F.; software, Y.F.; validation, X.K.; formal analysis, S.L. (Sihai Liang); investigation, S.L. (Sihai Liang) and Y.F.; resources, X.K.; data curation, S.L. (Sihai Liang); writing—original draft preparation, Y.F.; writing—review and editing, S.L. (Suning Liu), Y.Y. and Y.X.; visualization, Y.F.; supervision, X.K.; project administration, C.Z.; funding acquisition, X.K. All authors have read and agreed to the published version of the manuscript.

Funding

This research was supported by the National Natural Science Foundation of China (Grant No. 91747204, 92047202), High-level Special Funding of the Southern University of Science and Technology (Grant No. G02296302, G02296402), and China Geological Survey (DD20191006).

Data Availability Statement

The data that support the findings of this study are available upon request from the authors.

Conflicts of Interest

The authors declare no conflict of interest.

References

  1. Fisher, J.B.; Melton, F.; Middleton, E.; Hain, C.; Anderson, M.; Allen, R.; McCabe, M.F.; Hook, S.; Baldocchi, D.; Townsend, P.A.; et al. The future of evapotranspiration: Global requirements for ecosystem functioning, carbon and climate feedbacks, agricultural management, and water resources. Water Resour. Res. 2017, 53, 2618–2626. [Google Scholar] [CrossRef]
  2. Rodell, M.; Houser, P.R.; Jambor, U.; Gottschalck, J.; Mitchell, K.; Meng, C.J.; Arsenault, K.; Cosgrove, B.; Radakovich, J.; Bosilovich, M.; et al. The Global Land Data Assimilation System. Am. Meteorol. Soc. 2004, 85, 381–394. [Google Scholar] [CrossRef] [Green Version]
  3. Mu, Q.; Heinsch, F.A.; Zhao, M.; Running, S.W. Development of a global evapotranspiration algorithm based on MODIS and global meteorology data. Remote Sens. Environ. 2007, 111, 519–536. [Google Scholar] [CrossRef]
  4. Zhang, K.; Kimball, J.S.; Nemani, R.R.; Running, S.W. A continuous satellite-derived global record of land surface evapotranspiration from 1983 to 2006. Water Resour. Res. 2010, 46, W09522. [Google Scholar] [CrossRef] [Green Version]
  5. Kobayashi, S.; Ota, Y.; Harada, Y.; Ebita, A.; Moriya, M.; Onoda, H.; Onogi, K.; Kamahori, H.; Kobayashi, C.; Endo, H.; et al. The JRA-55 Reanalysis: General specifications and basic characteristics. J. Meteorol. Soc. 2015, 93, 5–58. [Google Scholar] [CrossRef] [Green Version]
  6. Yang, W.; Wang, Y.; Liu, X.; Zhao, H.; Shao, R.; Wang, G. Evaluation of the rescaled complementary principle in the estimation of evaporation on the Tibetan Plateau. Sci. Total Environ. 2020, 699, 134367. [Google Scholar] [CrossRef]
  7. Roderick, M.L.; Farquhar, G.D. A simple framework for relating variations in runoff to variations in climatic conditions and catchment properties. Water Resour. Res. 2011, 47, W00G07. [Google Scholar] [CrossRef]
  8. Allam, M.; Mhawej, M.; Meng, Q.; Faour, G.; Abunnasr, Y.; Fadel, A.; Xinli, H. Monthly 10-m evapotranspiration rates retrieved by SEBALI with Sentinel-2 and MODIS LST data. Agric. Water Manag. 2021, 243, 106432. [Google Scholar] [CrossRef]
  9. Allen, R.G.; Tasumi, M.; Morse, A.; Trezza, R.; Wright, J.L.; Bastiaanssen, W.; Kramber, W.; Lorite, I.; Robison, C.W. Satellite-Based energy balance for mapping evapotranspiration with internalized calibration (METRIC)—Applications. J. Irrig. Drain Eng. 2007, 133, 395–406. [Google Scholar] [CrossRef]
  10. Anderson, M.C.; Kustas, W.P.; Norman, J.M.; Hain, C.R.; Mecikalski, J.R.; Schultz, L.; González-Dugo, M.P.; Cammalleri, C.; D’Urso, G.; Pimstein, A.; et al. Mapping daily evapotranspiration at field to continental scales using geostationary and polar orbiting satellite imagery. Hydrol. Earth Syst. Sci. 2011, 15, 223–239. [Google Scholar] [CrossRef] [Green Version]
  11. Bastiaanssen, W.G.M.; Meneti, M.; Feddes, R.A.; Holtslag, M. A remote sensing surface energy balance algorithm for land (SEBAL).: Part 1: Formulation. J. Hydrol. 1998, 212, 198–212. [Google Scholar] [CrossRef]
  12. Bastiaanssen, W.; Pelgrum, H.; Wang, J.; Ma, Y.; Moreno, J.F. A remote sensing surface energy balance algorithm for land (SEBAL).: Part 2: Validation. J. Hydrol. 1998, 212, 213–229. [Google Scholar] [CrossRef]
  13. Mhawej, M.; Nasrallah, A.; Abunnasr, Y.; Fadel, A.; Faour, G. Better irrigation management using the satellite-based adjusted single crop coefficient (aKc) for over sixty crop types in California, USA. Agric. Water Manag. 2021, 256, 107059. [Google Scholar] [CrossRef]
  14. Senay, G.B.; Gowda, P.H.; Bohms, S.; Howell, T.A.; Friedrichs, M. Evaluating the SSEBop approach for evapotranspiration mapping with landsat data using lysimetric observations in the semi-arid Texas High Plains. Hydrol. Earth Syst. Sci. 2014, 11, 723–756. [Google Scholar]
  15. Wang, K.; Dickinson, R.E. A review of global terrestrial evapotranspiration: Observation, modeling, climatology, and climatic variability. Rev. Geophys. 2012, 50, RG2005. [Google Scholar] [CrossRef]
  16. Chang, Y.; Wang, J.; Qin, D.; Ding, Y.; Zhao, Q.; Liu, F. Methodological comparison of alpine meadow evapotranspiration on the Tibetan Plateau, China. PLoS ONE 2017, 12, e0189059. [Google Scholar] [CrossRef] [Green Version]
  17. Long, D.; Longuevergne, L.; Scanlon, B.R. Uncertainty in evapotranspiration from land surface modeling, remote sensing, and GRACE satellites. Water Resour. Res. 2014, 50, 1131–1151. [Google Scholar] [CrossRef] [Green Version]
  18. Xue, B.; Wang, L.; Li, X.; Yang, K.; Chen, D.; Sun, L. Evaluation of evapotranspiration estimates for two river basins on the Tibetan Plateau by a water balance method. J. Hydrol. 2013, 492, 290–297. [Google Scholar] [CrossRef]
  19. Yang, K.; Ye, B.; Zhou, D.; Wu, B.; Foken, T.; Qin, J.; Zhou, Z. Response of hydrological cycle to recent climate changes in the Tibetan Plateau. Clim. Chang. 2011, 109, 517–534. [Google Scholar] [CrossRef]
  20. Li, X.; Wang, L.; Chen, D.; Yang, K.; Wang, A. Seasonal evapotranspiration changes (1983–2006) of four large basins on the Tibetan Plateau. J. Geophys. Res. Atmos. 2014, 119, 13079–13095. [Google Scholar] [CrossRef]
  21. Ma, N.; Szilagyi, J.; Zhang, Y.; Liu, W. Complementary-relationship-based modeling of terrestrial evapotranspiration across China during 1982–2012: Validations and spatiotemporal analyses. J. Geophys. Res. Atmos. 2019, 124, 4326–4351. [Google Scholar] [CrossRef]
  22. Pascolini-Campbell, M.; Reager, J.T.; Chandanpurkar, H.A.; Rodell, M. A 10 per cent increase in global land evapotranspiration from 2003 to 2019. Nature 2021, 593, 543–547. [Google Scholar] [CrossRef]
  23. Bai, P.; Liu, X. Intercomparison and evaluation of three global high-resolution evapotranspiration products across China. J. Hydrol. 2018, 566, 743–755. [Google Scholar] [CrossRef]
  24. Jiménez, C.; Prigent, C.; Mueller, B.; Seneviratne, S.I.; McCabe, M.F.; Wood, E.F.; Rossow, W.B.; Balsamo, G.; Betts, A.K.; Dirmeyer, P.A.; et al. Global intercomparison of 12 land surface heat flux estimates. J. Geophys. Res. 2011, 116, D02102. [Google Scholar] [CrossRef]
  25. Liu, W.; Wang, L.; Zhou, J.; Li, Y.; Sun, F.; Fu, G.; Li, X.; Sang, Y.-F. A worldwide evaluation of basin-scale evapotranspiration estimates against the water balance method. J. Hydrol. 2016, 538, 82–95. [Google Scholar] [CrossRef] [Green Version]
  26. Soni, A.; Syed, T. Analysis of variations and controls of evapotranspiration over major Indian River Basins (1982–2014). Sci. Total Environ. 2020, 754, 141892. [Google Scholar] [CrossRef]
  27. Mueller, B.; Seneviratne, S.I.; Jimenez, C.; Corti, T.; Hirschi, M.; Balsamo, G.; Ciais, P.; Dirmeyer, P.; Fisher, J.B.; Guo, Z.; et al. Evaluation of global observations-based evapotranspiration datasets and IPCC AR4 simulations. Geophys. Res. Lett. 2011, 38, L06402. [Google Scholar] [CrossRef] [Green Version]
  28. Zhang, Y.; Leuning, R.; Chiew, F.; Wang, E.; Zhang, L.; Liu, C.; Sun, F.; Peel, M.; Shen, Y.; Jung, M. Decadal trends in evaporation from global energy and water balances. J. Hydrometeorol. 2012, 13, 379–391. [Google Scholar] [CrossRef]
  29. Wahr, J.; Swenson, S.; Zlotnicki, V.; Velicogna, I. Time-variable gravity from GRACE: First results. Geophys. Res. Lett. 2004, 31, L11501. [Google Scholar] [CrossRef] [Green Version]
  30. Tapley, B.; Bettadpur, S.; Ries, J.; Thompson, P.; Watkins, M.M. GRACE Measurements of Mass Variability in the Earth System. Science 2004, 305, 503–505. [Google Scholar] [CrossRef] [Green Version]
  31. Yao, T.; Xue, Y.; Chen, D.; Chen, F.; Thompson, L.; Cui, P.; Koike, T.; Lau, W.K.M.; Lettenmaier, D.; Mosbrugger, V.; et al. Recent Third Pole’s Rapid Warming Accompanies Cryospheric Melt and Water Cycle Intensification and Interactions between Monsoon and Environment: Multidisciplinary Approach with Observations, Modeling, and Analysis. Bull. Am. Meteorol. Soc. 2019, 100, 423–444. [Google Scholar] [CrossRef]
  32. Immerzeel, W.W.; Van Beek, L.P.H.; Bierkens, M.F.P. Climate change will affect the Asian water towers. Science 2010, 328, 1382–1385. [Google Scholar] [CrossRef]
  33. Yao, T.; Thompson, L.; Yang, W.; Yu, W.; Gao, Y.; Guo, X.; Yang, X.; Duan, K.; Zhao, H.; Xu, B.; et al. Different glacier status with atmospheric circulations in Tibetan Plateau and surroundings. Nat. Clim. Chang. 2012, 2, 663–667. [Google Scholar] [CrossRef]
  34. Kuang, X.; Jiao, J.J. Review on climate change on the Tibetan Plateau during the last half century. J. Geophys. Res. Atmos. 2016, 121, 3979–4007. [Google Scholar] [CrossRef]
  35. Yin, Y.; Wu, S.; Zhao, D.; Zheng, D.; Pan, T. Modeled effects of climate change on actual evapotranspiration in different eco-geographical regions in the Tibetan Plateau. J. Geogr. Sci. 2013, 23, 195–207. [Google Scholar] [CrossRef]
  36. Wang, W.; Li, J.; Yu, Z.; Ding, Y.; Xing, W.; Lu, W. Satellite retrieval of actual evapotranspiration in the Tibetan Plateau: Components partitioning, multidecadal trends and dominated factors identifying. J. Hydrol. 2018, 559, 471–485. [Google Scholar] [CrossRef]
  37. Wang, K.; Zhang, Y.; Ma, N.; Guo, Y.; Qiang, Y. Cryosphere evapotranspiration in the Tibetan Plateau: A review. Sci. Cold Arid. Reg. 2020, 12, 355–370. [Google Scholar]
  38. Feng, Y.; Liang, S.; Kuang, X.; Wang, G.; Wang, X.S.; Wu, P.; Wan, L.; Wu, Q. Effect of climate and thaw depth on alpine vegetation variations at different permafrost degrading stages in the Tibetan Plateau, China. Arct. Antarct. Alp. Res. 2019, 51, 155–172. [Google Scholar] [CrossRef] [Green Version]
  39. Liang, S.; Lv, C.; Wang, G.; Feng, Y.; Wu, Q.; Wan, L.; Tong, Y. Vegetation phenology and its variations in the Tibetan Plateau, China. Int. J. Remote Sens. 2019, 40, 3323–3343. [Google Scholar] [CrossRef]
  40. Che, L.; Xu, J. Land Use Change and Its Impact of Ecosystem Service Value in Yarlung Zangbo River Basin in Southern of Qinghai-Tibet Plateau. J. Geosci. Environ. Prot. 2020, 8, 395–409. [Google Scholar] [CrossRef]
  41. Chen, X.; Su, Z.; Ma, Y.; Yang, K.; Wen, J.; Zhang, Y. An improvement of roughness height parameterization of the Surface Energy Balance System (SEBS) over the Tibetan plateau. J. Appl. Meteorol. Clim. 2013, 52, 607–622. [Google Scholar] [CrossRef] [Green Version]
  42. NMIC. Assessment Report of China’s Ground Precipitation 0.5° × 0.5° Gridded Dataset (V2.0); National Meteorological Information Center: Beijing, China, 2012. [Google Scholar]
  43. Wang, J.; Zhang, M.; Wang, S.; Ren, Z.; Che, Y.; Qiang, F.; Qu, D. Decrease in snowfall / rainfall ratio in the Tibetan Plateau from 1961 to 2013. J. Geogr. Sci. 2016, 26, 1277–1288. [Google Scholar] [CrossRef]
  44. Wu, X.; Wang, Z.; Zhou, X.; Lai, C.; Lin, W.; Chen, X. Observed changes in precipitation extremes across 11 basins in China during 1961–2013. Int. J. Climatol. 2016, 36, 2866–2885. [Google Scholar] [CrossRef]
  45. Meng, F.; Su, F.; Li, Y.; Tong, K. Changes in Terrestrial Water Storage During 2003–2014 and Possible Causes in Tibetan Plateau. J. Geophys. Res. Atmos. 2019, 124, 2909–2931. [Google Scholar] [CrossRef]
  46. Liu, Z.; Yao, Z.; Wang, R.; Yu, G. Estimation of the Qinghai-Tibetan Plateau runoff and its contribution to large Asian rivers. Sci. Total Environ. 2020, 749, 141570. [Google Scholar] [CrossRef]
  47. Ljungqvist, F.C.; Seim, A.; Krusic, P.J.; González-Rouco, J.F.; Werner, J.P.; Cook, E.R.; Zorita, E.; Luterbacher, J.; Xoplaki, E.; Destouni, G.; et al. European warm-season temperature and hydroclimate since 850 CE. Environ. Res. Lett. 2019, 14, 084015. [Google Scholar] [CrossRef]
  48. Xu, Z.; Cheng, L.; Liu, P.; Makarieva, O.; Chen, M. Detecting and quantifying the impact of long-term terrestrial water storage changes on the runoff ratio in the head regions of the two largest rivers in China. J. Hydrol. 2021, 601, 126668. [Google Scholar] [CrossRef]
  49. Thom, H.C. A note on the gamma distribution. Mon. Weather Rev. 2021, 86, 117–122. [Google Scholar] [CrossRef]
  50. Bouraoui, F.; Vachaud, G.; Li, L.Z.X.; Le Treut, H.; Chen, T. Evaluation of the impact of climate changes on water storage and groundwater recharge at the watershed scale. Clim. Dyn. 1999, 15, 153–161. [Google Scholar] [CrossRef]
  51. Li, X.; Long, D.; Han, Z.; Scanlon, B.R.; Sun, Z.; Han, P.; Hou, A. Evapotranspiration Estimation for Tibetan Plateau Headwaters Using Conjoint Terrestrial and Atmospheric Water Balances and Multisource Remote Sensing. Water Resour. Res. 2019, 55, 8608–8630. [Google Scholar] [CrossRef]
  52. Gao, G.; Chen, D.; Xu, C.; Simelton, E. Trend of estimated actual evapotranspiration over China during 1960–2002. J. Geophys. Res. 2007, 112, D11120. [Google Scholar] [CrossRef] [Green Version]
  53. Haario, H.; Laine, M.; Mira, A.; Saksman, E. DRAM: Efficient adaptive MCMC. Stat. Comput. 2006, 16, 339–354. [Google Scholar] [CrossRef]
  54. Zhang, T.; Barry, R.G.; Armstrong, R.L. Application of Satellite Remote Sensing Techniques to Frozen Ground Studies. Polar Geogr. 2004, 28, 163–196. [Google Scholar] [CrossRef]
Figure 1. The sub-basin distribution map of the Tibetan Plateau.
Remotesensing 13 03958 g001
Figure 2. Distribution of vegetation types on the Tibetan Plateau (provided by http://westdc.westgis.ac.cn, accessed date: 1 July 2021).
Remotesensing 13 03958 g002
Figure 3. Monthly time series from the mean values of the precipitation(mm/month), runoff (mm/month), and the TWS anomaly (mm/month) during 2003−2014. (a) Yellow River source region; (b) Yangtze River source region; (c) Salween River source region; (d) Mekong River source region; (e) Yarlung Zangbo basin; (f) Qaidam Basin; and (g) Inner Plateau.
Remotesensing 13 03958 g003
Figure 4. Schematic diagram for monthly ratio correction.
Remotesensing 13 03958 g004
Figure 5. Schematic diagram for the first step of the correction.
Remotesensing 13 03958 g005
Figure 6. Monthly time series from the mean values of the four ETp(mm) and the ETref (mm) during 2003–2014. (a) Yellow River source region; (b) Yangtze River source region; (c) Salween River source region; (d) Mekong River source region; (e) Yarlung Zangbo Basin; (f) Qaidam Basin; and(g) Inner Plateau.
Remotesensing 13 03958 g006
Figure 7. Seasonal variations of the ETref (mm) and the ET products (mm) in the seven sub-basins averaged during 2003–2014. (a) Yellow River source region; (b) Yangtze River source region; (c) Salween River source region; (d) Mekong source region; (e) Yarlung Zangbo Basin; (f) Qaidam Basin; and(g) Inner Plateau.
Remotesensing 13 03958 g007
Figure 8. Comparison of the monthly ETp with the ETref before and after correction for the seven sub-basins on the Tibetan Plateau The vertical axis represents ETp before correction, after ration correction, and after gamma correction, respectively.
Remotesensing 13 03958 g008
Figure 9. Distribution of average corrected ET in the sub-basins on the Tibetan Plateau. (a) The spatial distribution of average corrected ET, (b) The statistics of average corrected ET in each sub-basin.
Remotesensing 13 03958 g009
Figure 10. Distribution of corrected ET trends in the sub-basins on the Tibetan Plateau. (a) The spatial distribution of corrected ET trends, stippling denotes regions where the trend is significant at the 90% level (p < 0.1, t-test). (b) The statistics of corrected ET trends in each sub-basin. The * represents p < 0.1, and ** represents p < 0.05.
Remotesensing 13 03958 g010
Figure 11. The coefficients of the monthly ratio bias correction in the seven sub-basins.
Remotesensing 13 03958 g011
Table 1. Overview of the seven sub-basins.
Sub-BasinArea (104 km2)P (mm/Month)R (mm/Month)Main Vegetation Types
Yellow21.440.63.3 Meadow/Shrub
Yangtze43.554.5 9.8 Meadow/Shrub
Yarlung Zangbo25.373.9 21.3 Meadow/Steppe/Forest/Alpine vegetation
Salween10.859.1 13.2 Meadow/Shrub
Menkon8.153.66.7 Meadow/Shrub
Qaidam24.713.8 /Sparse vegetation
Inner Plateau69.320.6 /Steppe/Meadow
Table 2. Overview of the datasets.
DatasetsCategorySpatial ResolutionTime RangeFrequencyReferences
PInterpolation with observations0.1°1980–2019Monthly[42]
RLand surface model0.25°2000–2016Monthly[2]
TWSRemote sensing2003–2017Monthly[30]
METPenman–Monteith 0.05°2000–2015Monthly[3]
GIETModified Penman-Monteith8 km1982–2015Monthly[4]
SETSurface energy balance system0.1°2001–2015Monthly[41]
GETland surface model0.25°1948–2015Monthly[2]
Table 3. Uncertainty Estimates of Different Components for the sub-basins.
Sub-BasinσPre (mm/Month)σR
(mm/Month)
σΔTWS
(mm/Month)
σETref
(mm/Month)
SpringSummerAutumnWinterMean
Yellow±0.22 ±2.70 ±2.58 ±0.37 ±1.47 ±0.16 ±1.4 ±2.0
Yangtze±0.52 ±4.98 ±2.73 ±0.25 ±2.12 ±0.51 ±1.7 ±2.8
Yarlung Zangbo±1.08 ±6.33 ±3.55 ±0.36 ±2.83 ±1.13 ±2.8 ±4.1
Salween±0.80 ±5.40 ±2.75 ±0.29 ±2.31 ±0.68 ±2.5 ±3.5
Mekong±0.43 ±3.44 ±3.42 ±0.49 ±1.95 ±0.36 ±1.9 ±2.7
Qaidam±0.12 ±1.36 ±0.62 ±0.07 ±0.54 /±2.0 ±2.1
Inner Plateau±0.25 ±1.03 ±1.42 ±0.18 ±0.72 /±2.1 ±2.2
Table 4. Bias (mm/month), RMSE (mm/month), and CORR of the correction methods in comparison with the reference ET (mm/month).
Correction
Method
Product ETGammaMonthly Ratio
Criteria
DE−13.61−0.030.01
RMSE17.614.210.1
CR0.950.910.97
Smaller DE and RMSE and larger CR are in bold.
Table 5. The comparison of the average annual ETp, ETref, and corrected ET of the sub-basins.
Sub-BasinETp (mm/yr)ETref
(mm/yr)
Corrected ET
(mm/yr)
GETGIETMETSET
Yellow440 604 498330 445 ± 24438
Yangtze506 638 540 462 535 ± 20.4528
Yarlung Zangbo389 563 584 411 664 ± 33.6650
Salween369 556 498 426 571 ± 30550
Mekong465 623 506 466 574 ± 22.8552
Qaidam137 161 /90 124 ± 24150
Inner Plateau310 331 /16383 ± 25.2200
Publisher’s Note: MDPI stays neutral with regard to jurisdictional claims in published maps and institutional affiliations.

