Article

The Total Operating Characteristic from Stratified Random Sampling with an Application to Flood Mapping

by
Zhen Liu
1 and
Robert Gilmore Pontius Jr
2,*
1
Clark Labs, Clark University, Worcester, MA 01602, USA
2
School of Geography, Clark University, Worcester, MA 01602, USA
*
Author to whom correspondence should be addressed.
Remote Sens. 2021, 13(19), 3922; https://doi.org/10.3390/rs13193922
Submission received: 31 July 2021 / Revised: 19 September 2021 / Accepted: 22 September 2021 / Published: 30 September 2021

Abstract

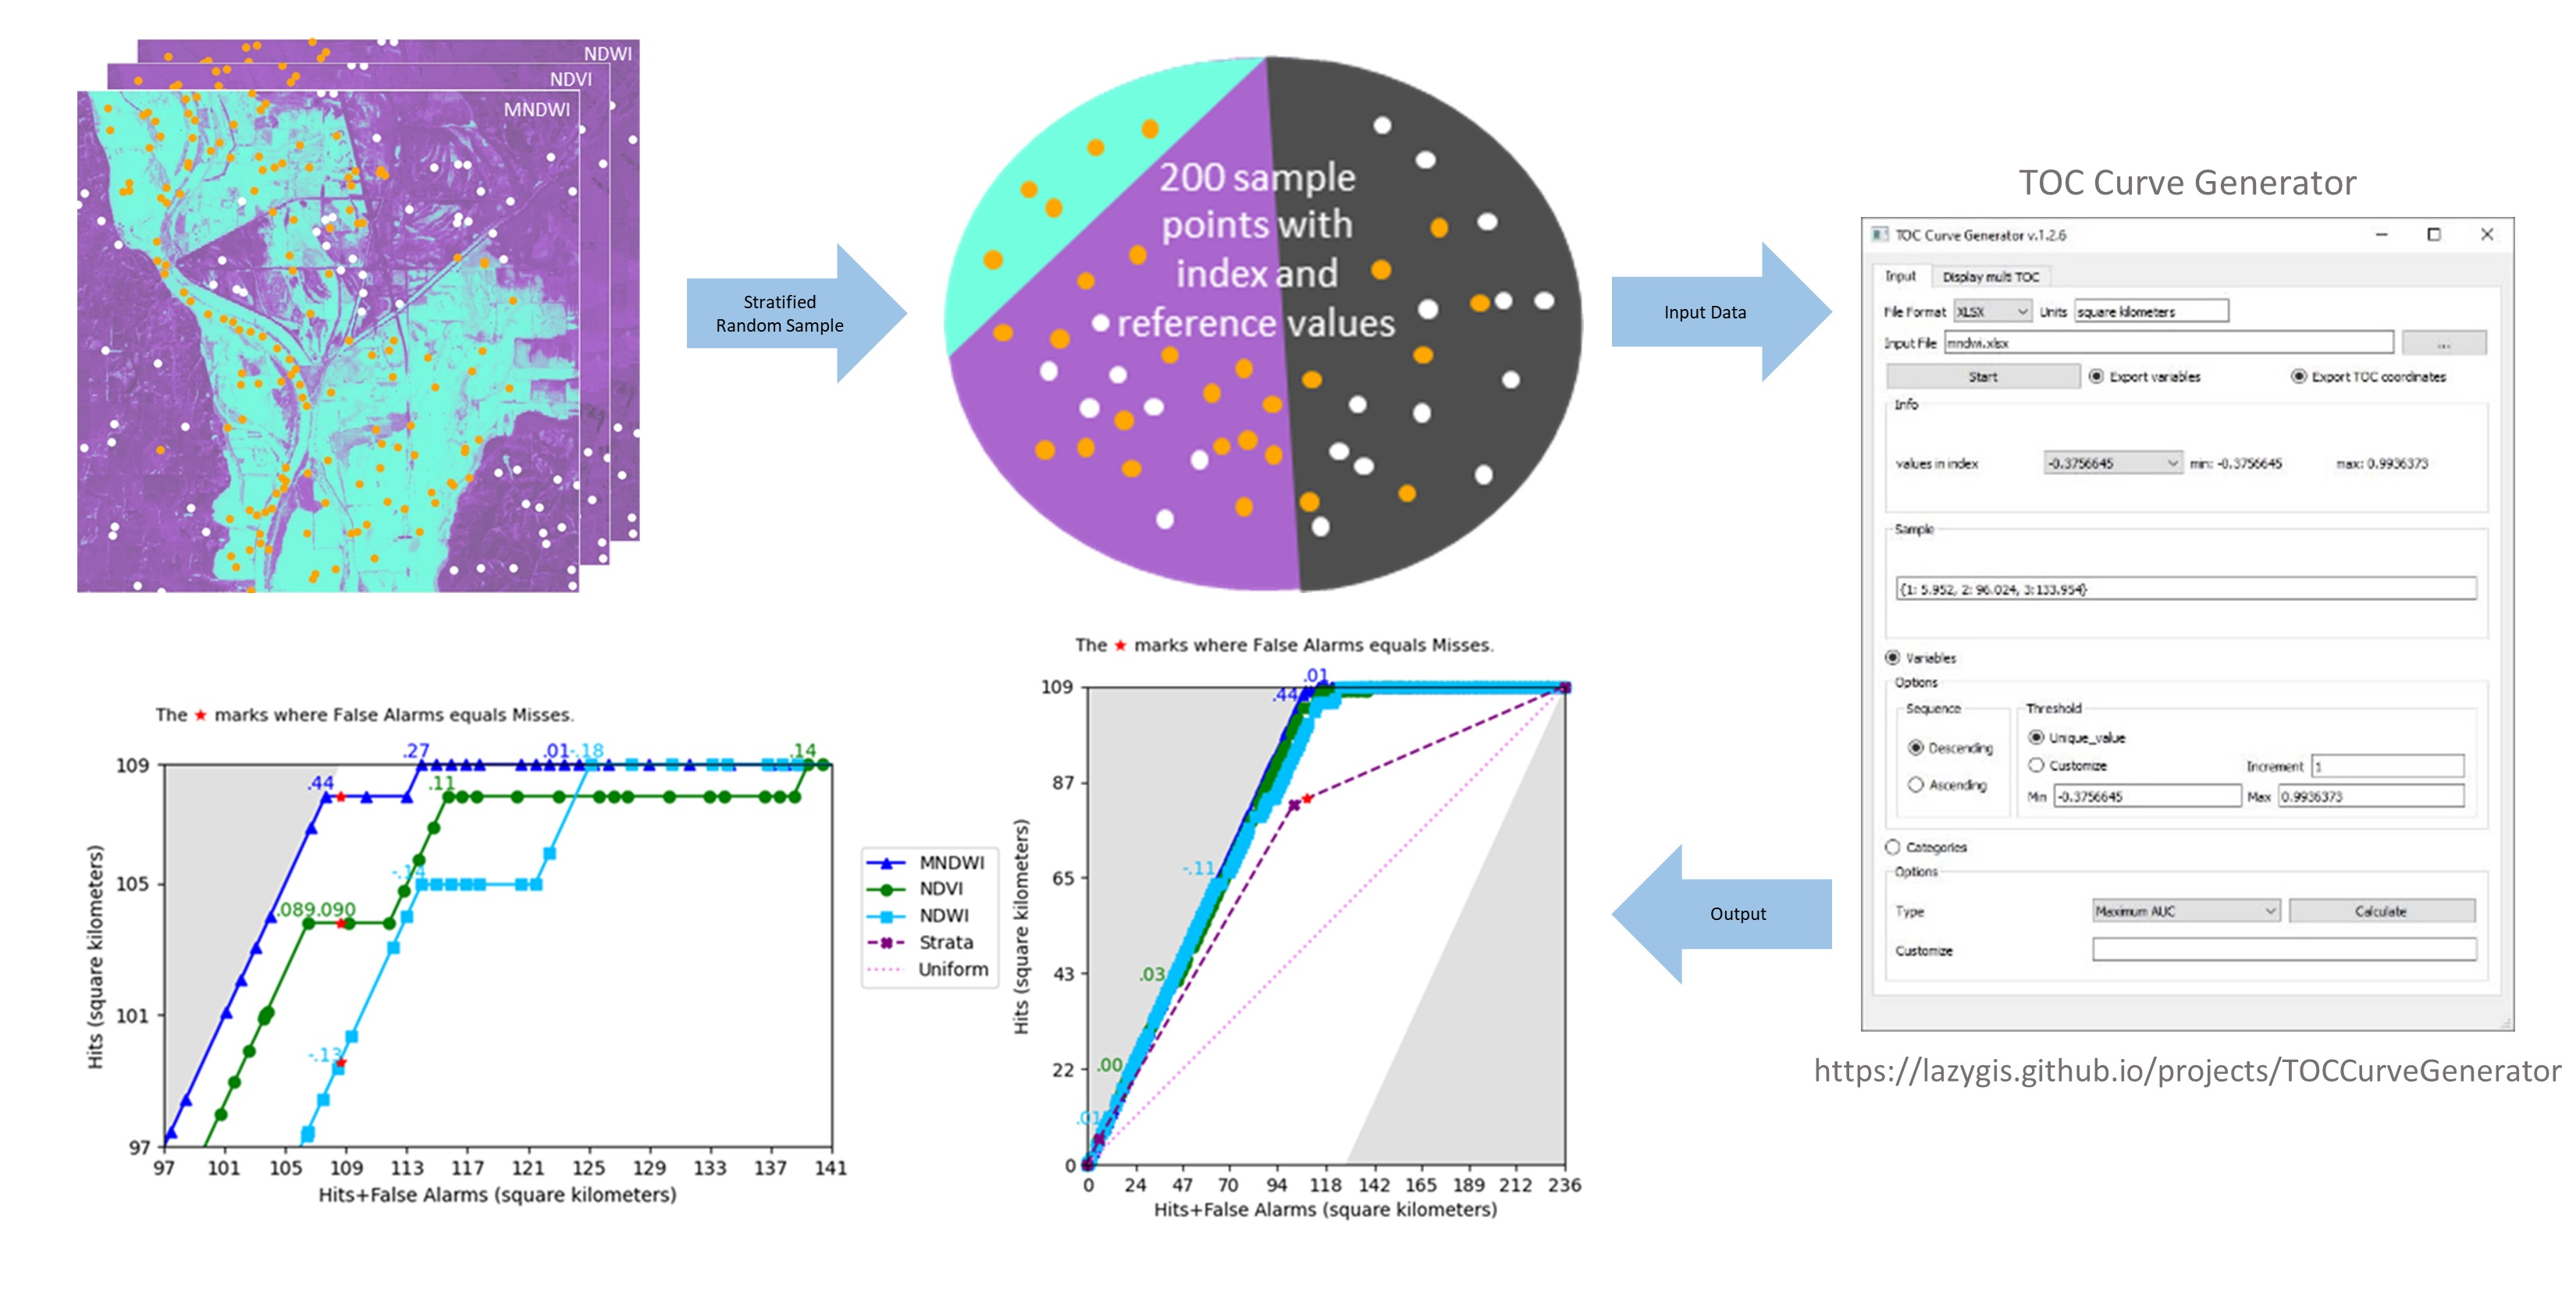
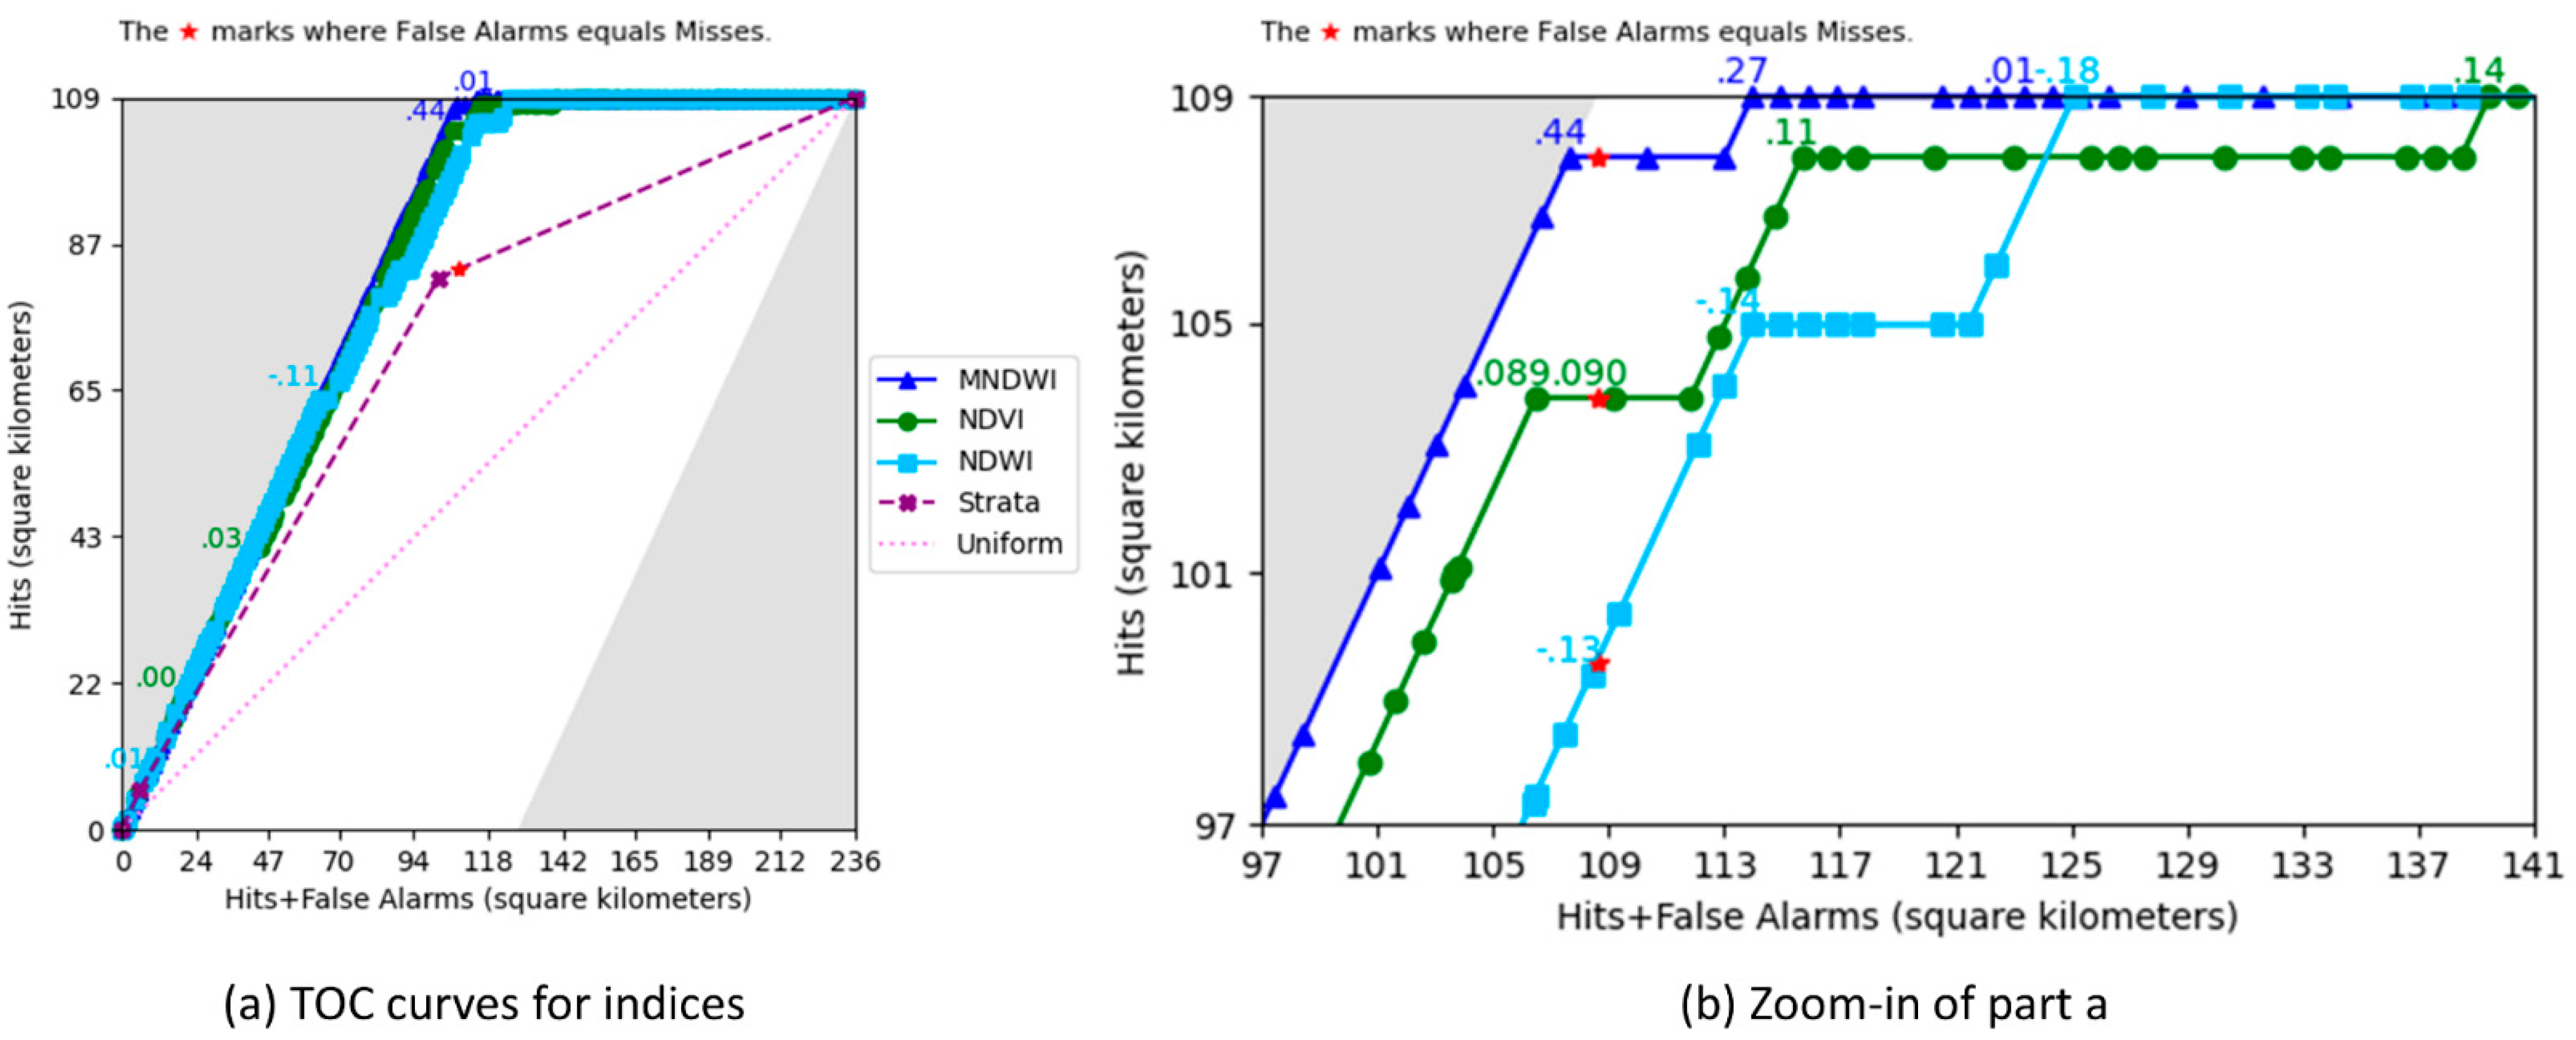
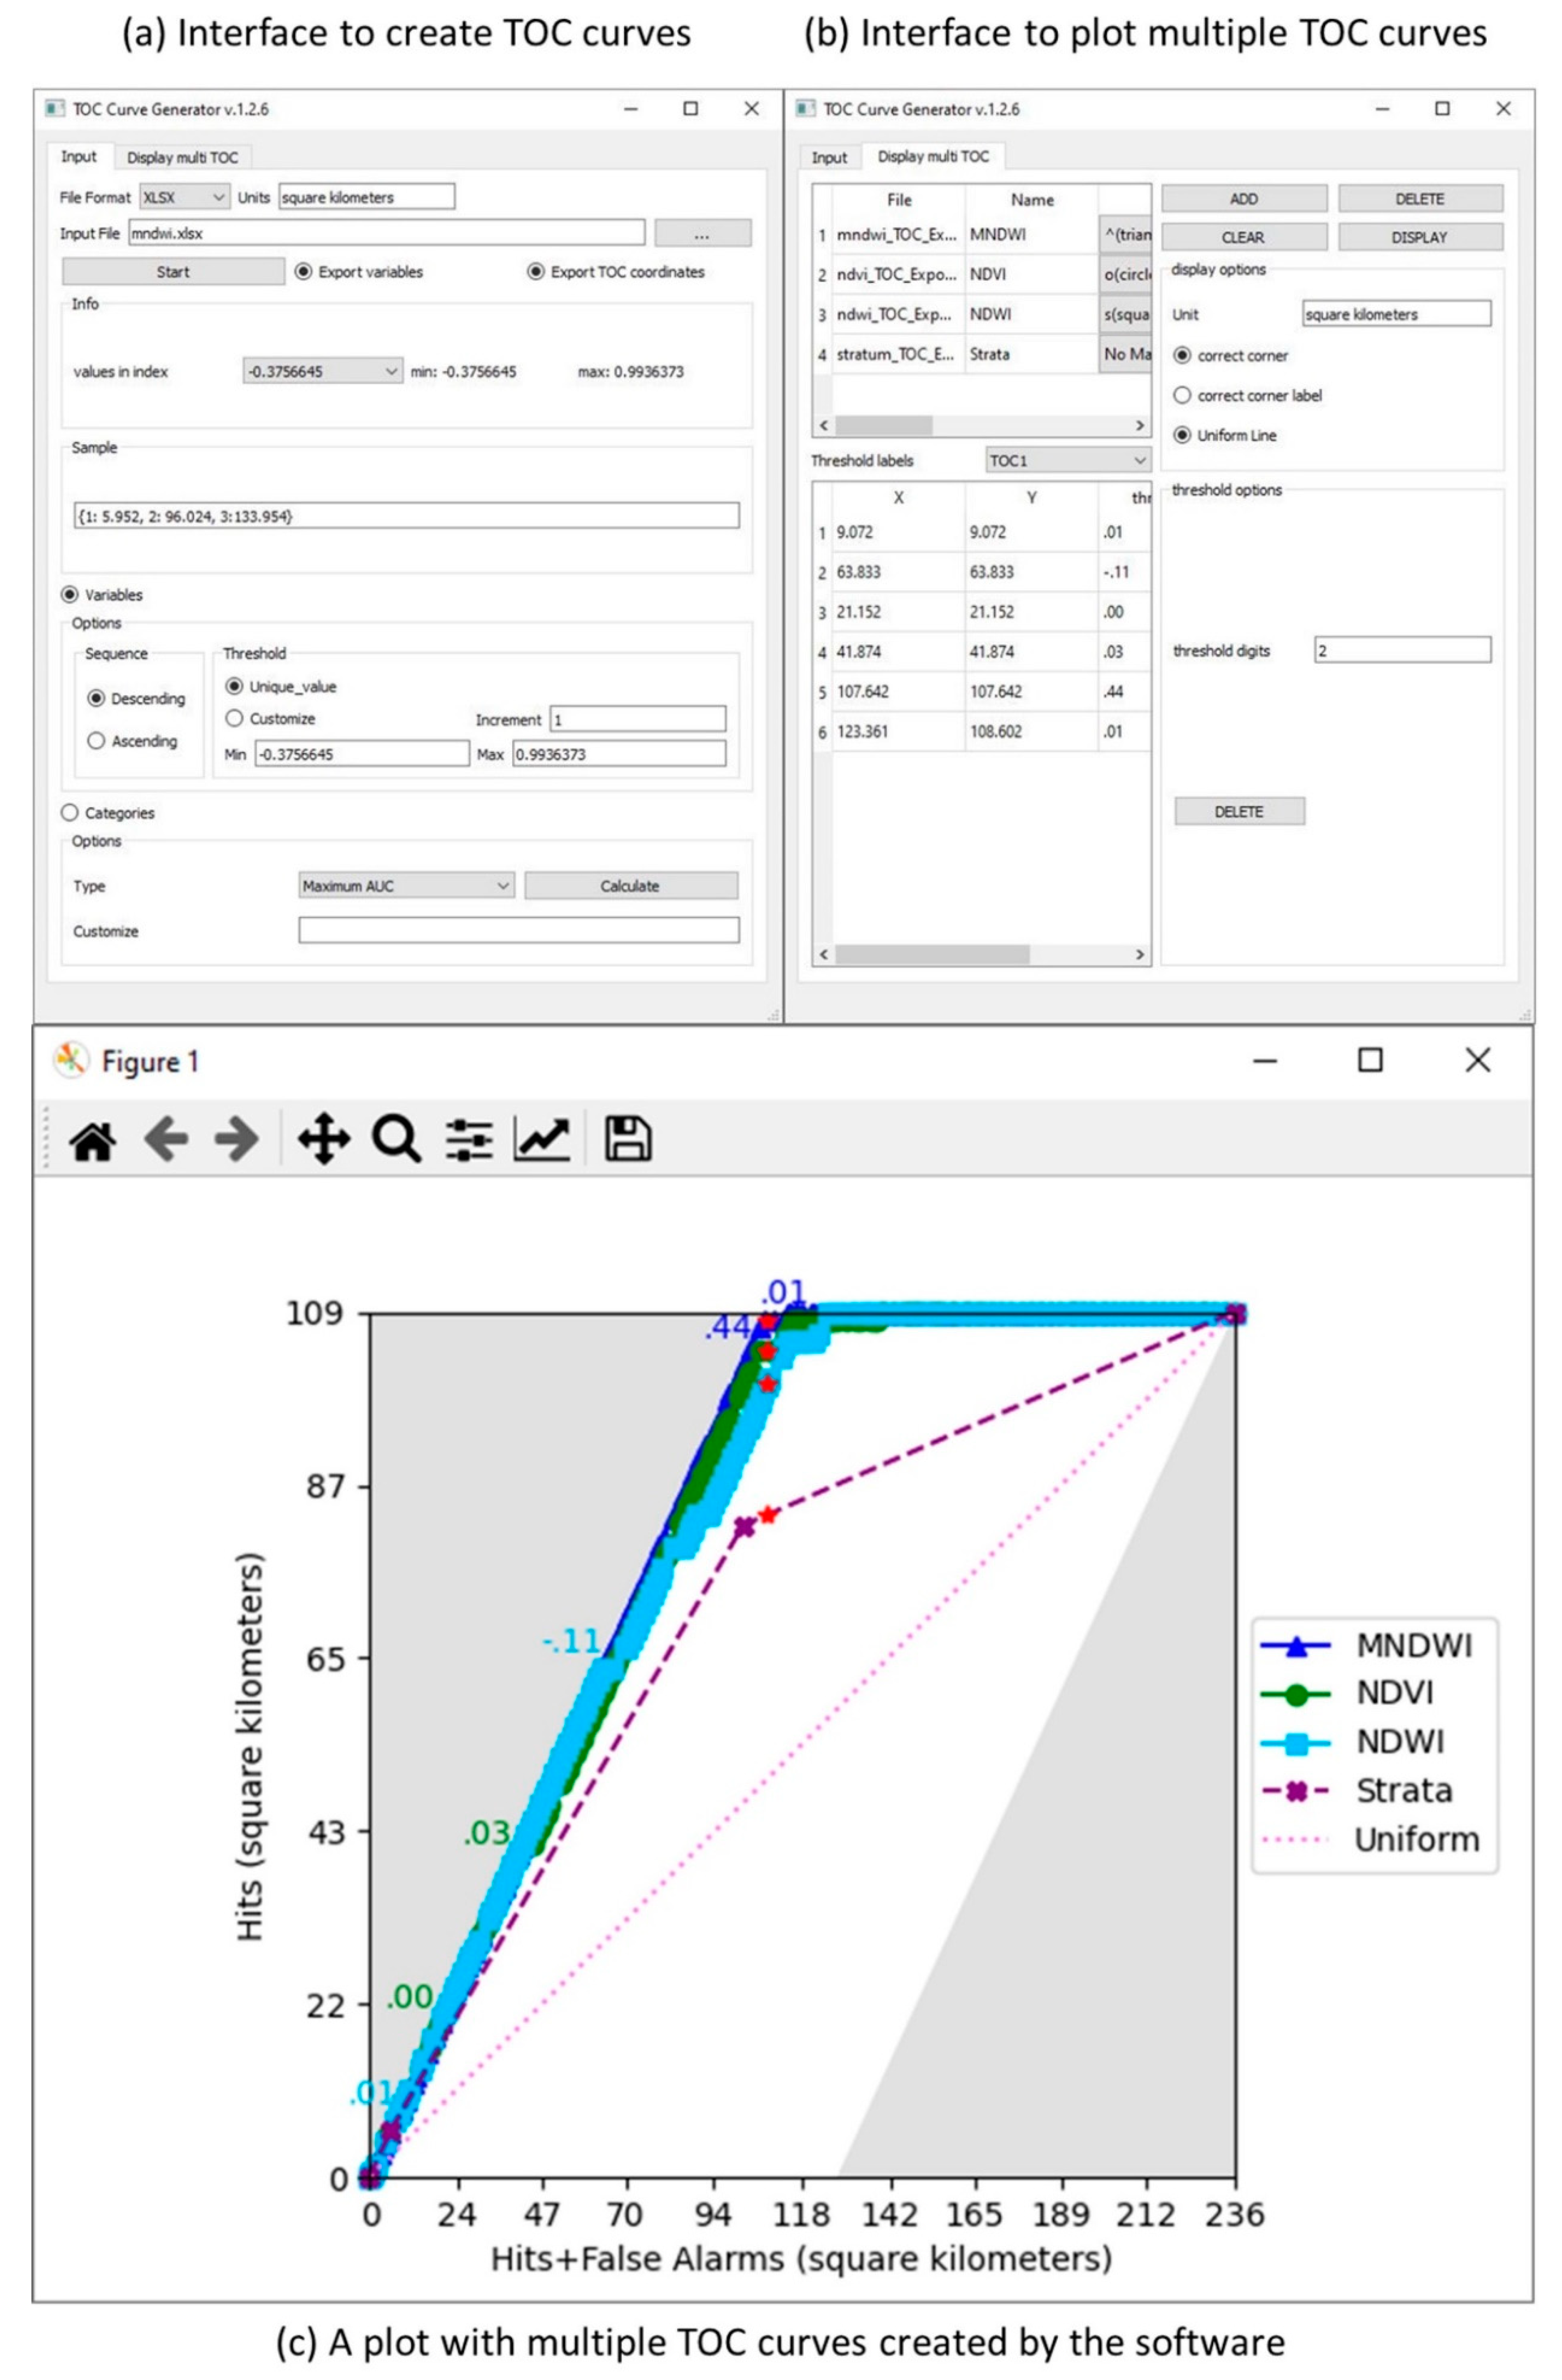
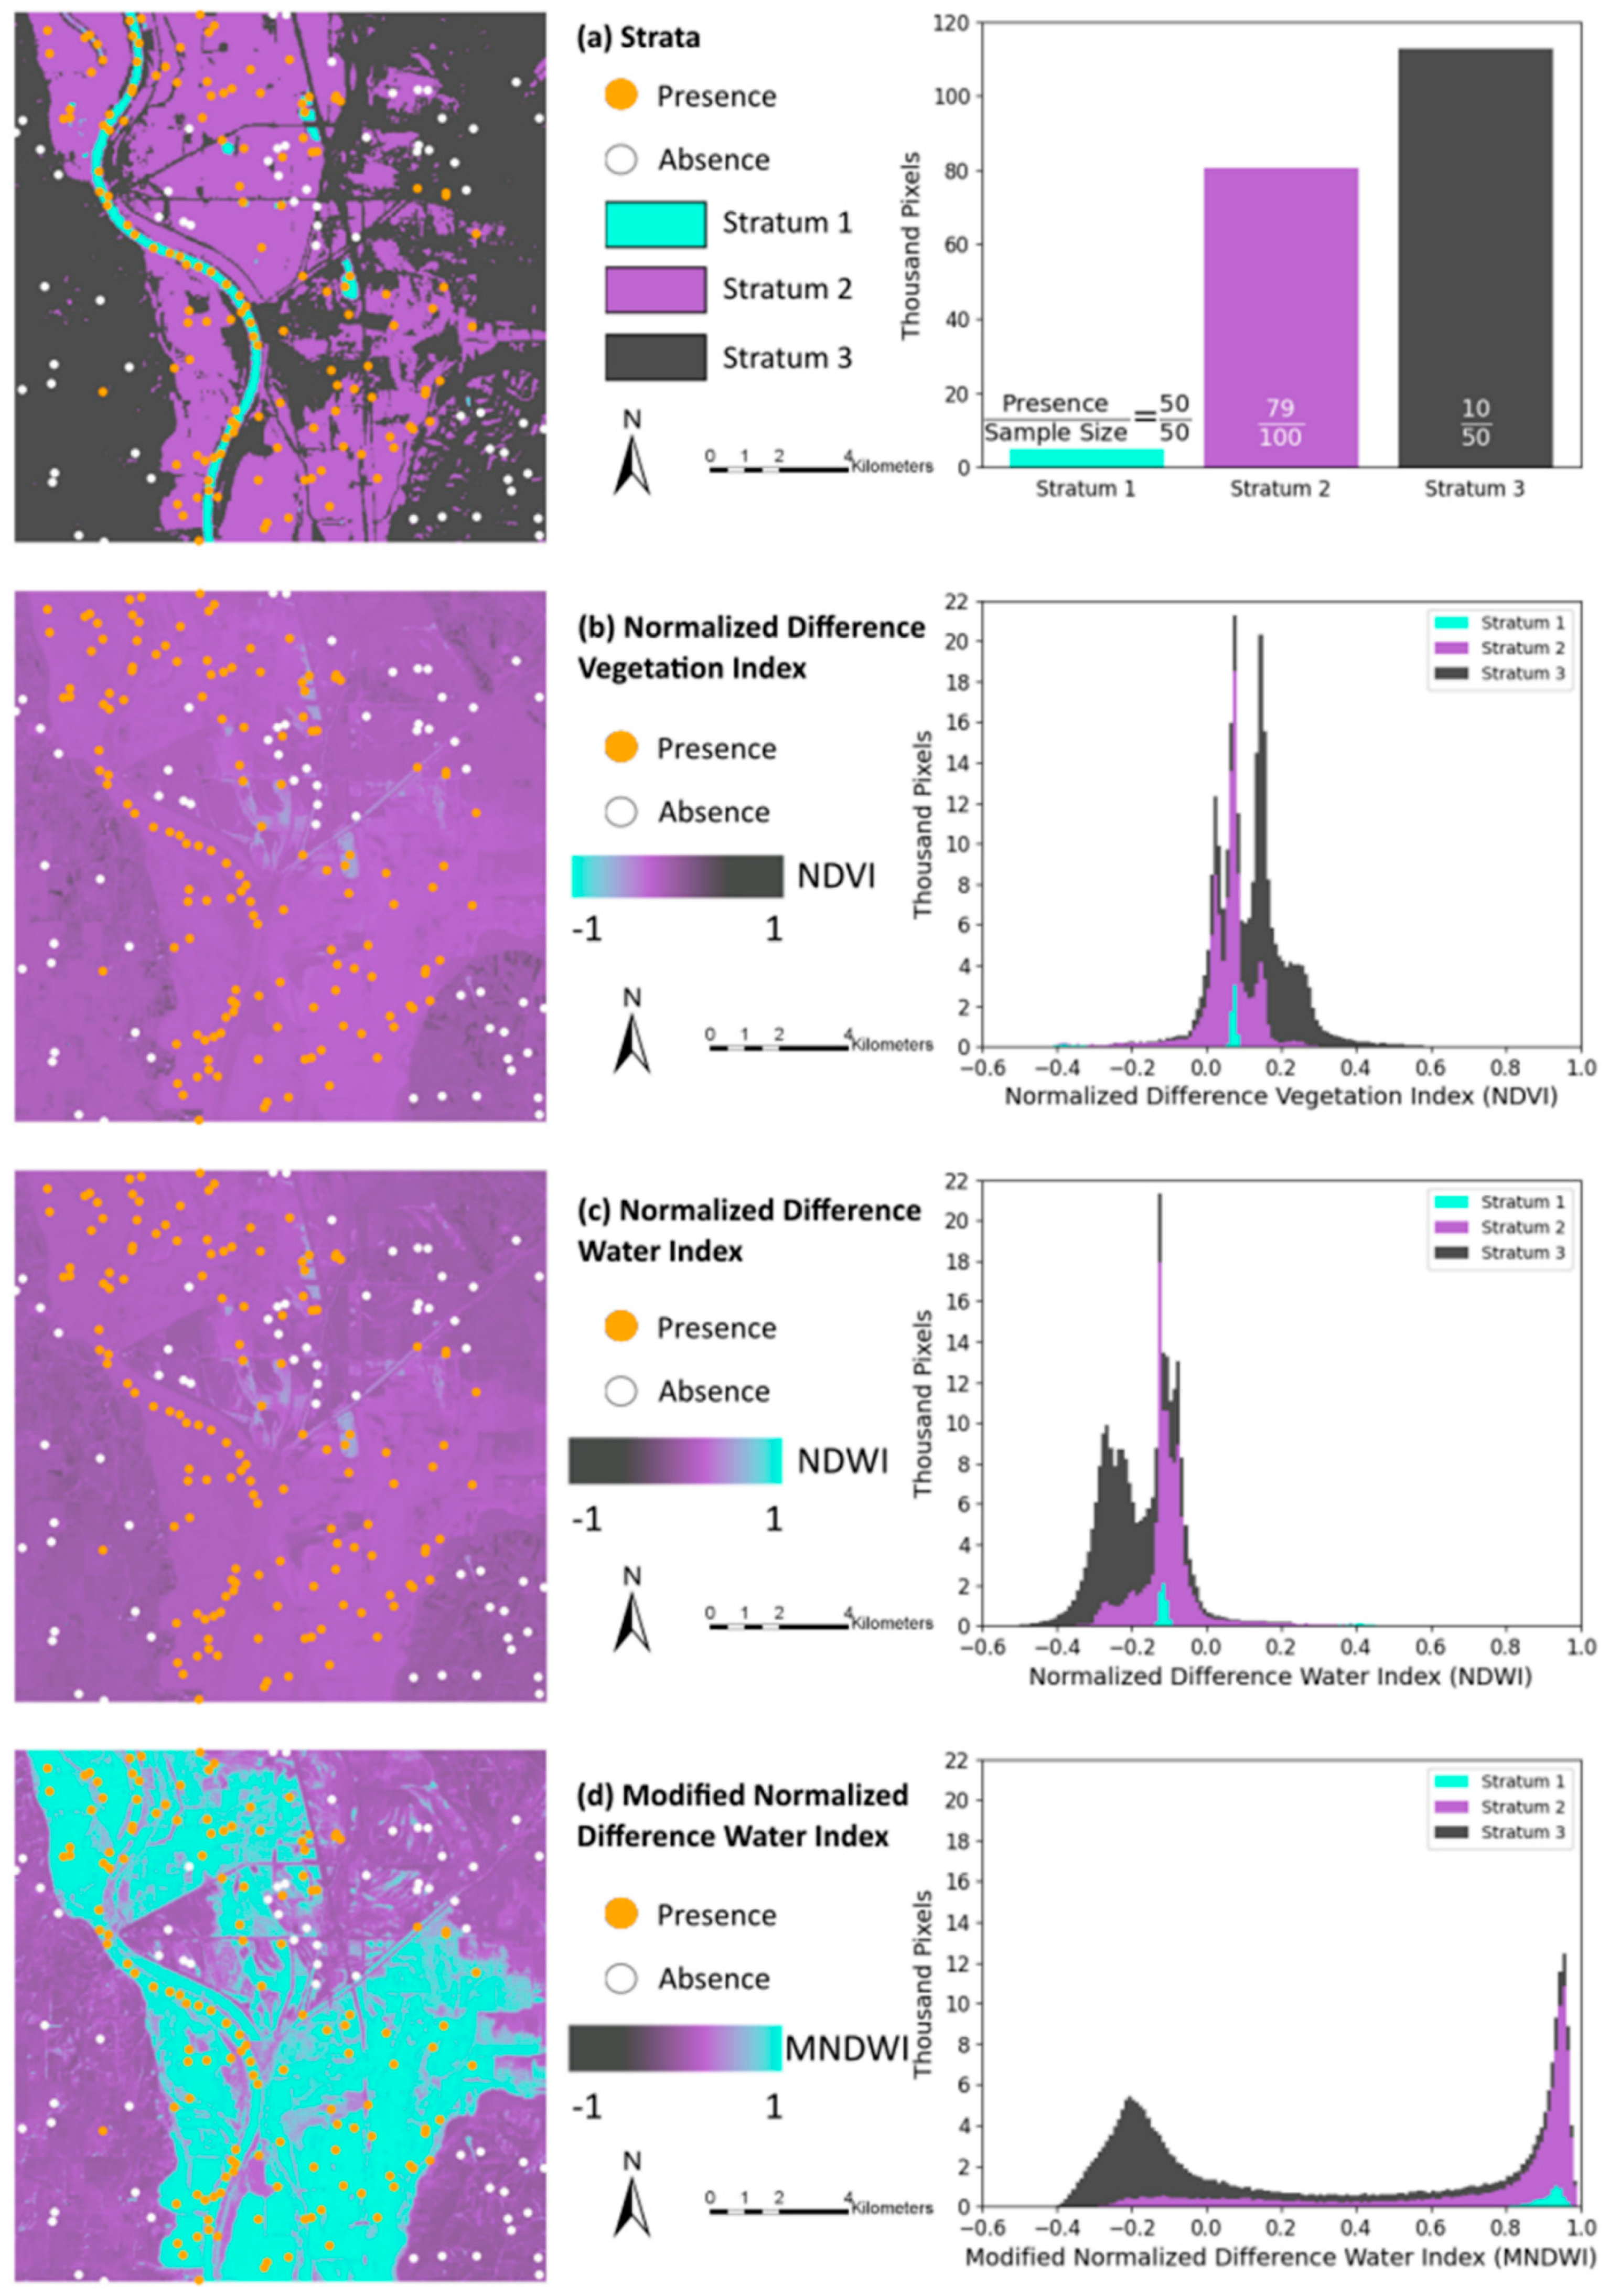
The Total Operating Characteristic (TOC) measures how the ranks of an index variable distinguish between presence and absence in a binary reference variable. Previous methods to generate the TOC required the reference data to derive from a census or a simple random sample. However, many researchers apply stratified random sampling to collect reference data because stratified random sampling is more efficient than simple random sampling for many applications. Our manuscript derives a new methodology that uses stratified random sampling to generate the TOC. An application to flood mapping illustrates how the TOC compares the abilities of three indices to diagnose water. The TOC shows visually and quantitatively each index’s diagnostic ability relative to baselines. Results show that the Modified Normalized Difference Water Index has the greatest diagnostic ability, while the Normalized Difference Vegetation Index has diagnostic ability greater than the Normalized Difference Water Index at the threshold where the Diagnosed Presence equals the Abundance of water. Some researchers consider only one accuracy metric at only one threshold, whereas the TOC allows visualization of several metrics at all thresholds. The TOC gives more information and clearer interpretation compared to the popular Relative Operating Characteristic. Our software generates the TOC from a census, simple random sample, or stratified random sample. The TOC Curve Generator is free as an executable file at a website that our manuscript gives.
Keywords: flood; remote sensing; stratified random sampling; Total Operating Characteristic (TOC); water index flood; remote sensing; stratified random sampling; Total Operating Characteristic (TOC); water index
Graphical Abstract