Article

S-NPP VIIRS Thermal Emissive Bands 10-Year On-Orbit Calibration and Performance

1
Science Systems and Applications, Inc., 10210 Greenbelt Road, Suite 600, Lanham, MD 20706, USA
2
Sciences and Exploration Directorate, NASA/GSFC, Greenbelt, MD 20771, USA
*
Author to whom correspondence should be addressed.
Remote Sens. 2021, 13(19), 3917; https://doi.org/10.3390/rs13193917
Submission received: 19 August 2021 / Revised: 26 September 2021 / Accepted: 27 September 2021 / Published: 30 September 2021

Abstract

:
The Visible Infrared Imaging Radiometer Suite (VIIRS) onboard the Suomi National Polar-orbiting Partnership Program (S-NPP) satellite, launched in late 2011, has reached the decade landmark under successful operations. VIIRS has 22 spectral bands, 7 of which are thermal emissive bands (TEB) that cover the 3.70 to 11.84 μm wavelength range. Over the years, VIIRS TEB observations have been used to generate several data products (e.g., surface/cloud/atmospheric temperatures, cloud top altitude, and water vapor properties). The VIIRS TEB calibration uses a quadratic algorithm and is referenced to an on-board blackbody with temperature measurements traceable to the National Institute of Standards and Technology standard. This manuscript provides an overview of the VIIRS instrument operations and TEB calibration activities and algorithms used in the level 1B data and describes the TEB on-orbit performance for S-NPP VIIRS. The 10-year on-orbit performance of the S-NPP VIIRS TEB has generally been stable, and the degradations in the S-NPP TEB detector responses are minor after a decade in orbit. The noise characterization performance repeatedly meets the design requirements for all TEB detectors as well. On-orbit changes in the TEB response-versus-scan-angle, based on pitch maneuver observations, have been demonstrated to be extremely small. Moreover, multiple time series over select ground targets have shown that the sensor’s on-orbit performance is quite stable.

1. Introduction

Launched on 28 October 2011, the Suomi National Polar-orbiting Partnership (S-NPP) satellite’s primary sensor, the Visible Infrared Imaging Radiometer Suite (VIIRS), has operated successfully for a decade. Designed with substantial Moderate Resolution Imaging Spectroradiometer (MODIS) heritage, VIIRS has 22 spectral bands that span from the visible to infrared wavelengths (0.4–12.5 µm). These spectra are intended to support a cohort of environmental data records (EDR) that assist users in the land, ocean, and atmospheric science communities [1,2,3]. VIIRS bridges the gap between the data collected by the Earth Observing System (EOS) satellites and the future generation of Earth observatories—the Joint Polar Satellite System (JPSS), which carries (NOAA-20) or will carry instruments like the ones onboard S-NPP. The S-NPP spacecraft operates in a near Sun-synchronous polar orbit (nominal altitude ~828 km) and at a 98° inclination angle (relative to the Equator; crossing time is 1:30 p.m.) [4,5]. With an Earth-view (EV) scan-angle range of about ±56 degrees, the VIIRS sensor can make continuous global observations twice daily. The VIIRS sensor intends to perpetuate, advance, and safeguard the datasets—whose calibration is traceable to ground-based references—provided by the MODIS instruments (effectively operating onboard the EOS Terra and Aqua spacecraft). As such, VIIRS was built to succeed and refine the MODIS sensor design. The S-NPP VIIRS instrument was built and tested prelaunch by its vendor, Raytheon Santa Barbara Remote Sensing, while support on the calibration data analyses was provided by the VIIRS Characterization Support Team (VCST) at the NASA Goddard Space Flight Center (GSFC). In addition to prelaunch support, VCST is responsible for the S-NPP VIIRS on-orbit calibration and planning, as well as developing, maintaining, and improving the NASA Science Investigator-led Processing Systems (SIPS) VIIRS level 1B (L1B) algorithm, and deriving and updating calibration lookup tables (LUTs). Moreover, VCST supports the NOAA Interface Data Processing Segment (IDPS) Sensor Data Records (SDR) (i.e., algorithm, products, and LUTs development) [6,7].
The VIIRS instrument is a whiskbroom, cross-track scanning radiometer that collects data continuously from the EV and calibration view (every 1.78 s) using a rotating telescope assembly (RTA). A half-angle mirror (HAM) rotates—at half the rate of the RTA—simultaneously to direct light into stationary optics and the different VIIRS focal plane assemblies (FPAs). The VIIRS spectral channels are positioned on three FPAs (Figure 1). The visible and near-infrared (VIS/NIR) FPA is passively operated at ambient temperature, while the temperatures for the short- and mid-wave infrared (S/MWIR) and long-wave infrared (LWIR) FPAs, often referred to as the cold FPAs, are actively controlled at 80 K. VIIRS has two types of narrow bands (referred to as moderate-resolution (M) and fine-resolution imaging (I)) that provide observations at different spatial resolutions. The M bands have 16 detectors and a 750 m resolution at nadir, while the I bands have 32 detectors and a 375 m (at nadir) spatial resolution with about half the integration time. Both have a ground swath that is approximately 3040 km in the cross-track direction. Several M bands are dual gain—their gain can switch between two settings; high to detect low radiance and vice versa. This feature is used to reach the desired dynamic range.
VIIRS has five M-thermal emissive bands (TEB) and two I-TEB. Located in the S/MWIR FPA are bands I4, M12, and M13, while bands I5, M14, M15, and M16 are situated on the LWIR FPA. Band M16 has two separate (and time delay integrated) arrays of 16 detectors. Only band M13 is dual gain—its low gain is primarily used for fire detection. Table 1 shows a summary of key design specifications for the VIIRS TEB. The VIIRS TEB are calibrated by referencing an onboard blackbody (BB). Key TEB performance parameters (i.e., detector responses (gains), dynamic ranges, noise equivalent differential temperatures (NEdT), and relative spectral responses) were carefully evaluated during prelaunch calibration and characterization using accurate and traceable sources and test equipment [8,9]. Postlaunch, the quality of the VIIRS TEB data and their downstream products relies vigorously on devoted efforts to regularly monitor instrument operations and onboard calibrator (OBC) functions. Moreover, it is equally important to evaluate and update the calibration parameters (when necessary) and employ new calibration strategies to address and correct on-orbit changes in the sensor characteristics [10,11]. Both the VIIRS TEB prelaunch and on-orbit calibrations are traceable to the standards maintained by the National Institute of Standards and Technology (NIST) [12].
This paper provides a comprehensive assessment of one decade of S-NPP VIIRS TEB on-orbit calibration and performance, which are critical to the SDR and EDR data quality. It serves as an update to previous reports [13,14]. Overall, the TEB on-orbit performance, in terms of detector responses, noise characteristics, and vicarious calibration, has remained extremely stable throughout the entire mission. In Section 2, an overview of the S-NPP VIIRS on-orbit operation and calibration activities, along with any changes to its calibration strategies over the last decade, is provided. Section 3 describes the VIIRS TEB calibration algorithm. The sensor’s TEB on-orbit performance using responses derived from its OBC BB and select ground targets will be discussed in Section 4. To conclude, Section 5 provides a brief summary of this manuscript.

2. Instrument On-Orbit Operation and Calibration Activities

Following its launch in late October 2011, but prior to opening the nadir aperture door, S-NPP VIIRS underwent a sequence of sensor and OBC functional tests. Constructed by the VIS/NIR bands, the “first light” images were originated on 21 November 2011. Yet, observations from the S/MWIR and LWIR channels became technically reliable after the opening of the cryo-cooler door (18 January 2012). Afterwards, two more days were required for the S/MWIR and LWIR FPAs to reach operational temperatures. Important calibration activities executed during the sensor’s early thorough calibration and validation stages involved routine operations and special calibration maneuvers. Table 2 itemizes some of the main events for the S-NPP VIIRS on-orbit operation and TEB calibration. Only the first event of each instrument anomaly and TEB routine calibration activity is registered in Table 2.
The onboard BB is the primary TEB calibration target. On a scan-by-scan basis, the BB temperature is derived based on measurements from six thermistors embedded on the backside of the BB substrate. The OBC BB uniformity–regarded as the standard deviation of the temperatures measured by the six thermistors—the requirement is 30 mK (under temperature-controlled or unpowered conditions) [12]. The S-NPP VIIRS BB temperature is nominally controlled at 292.7 K. Since the S-NPP launch (starting from February 2012) up until mid-2018, VIIRS BB warm-up and cool-down (WUCD) activities used to be scheduled on a quarterly basis. Afterwards, the BB WUCD operation frequency was changed to once annually. This was done to minimize the marginal thermal effects during each BB WUCD, which have an undesirable impact on data quality. Throughout a WUCD operation, the BB temperature sequences over discrete temperatures varying from instrument ambient temperature (~267 K) to 315 K. The process is performed recurrently to characterize and monitor changes in the TEB detector nonlinear responses while at the same time allowing for the examination of the detector noise characterization for the TEB over an ample temperature range. As of 31 December 2021, a total of 28 S-NPP VIIRS BB WUCD events have been completed thus far. Figure 2a shows a typical S-NPP VIIRS BB temperature profile during an entire WUCD cycle; the process takes roughly 2 days to complete. In Figure 2b, the BB uniformity for the same event is illustrated. It demonstrates how the BB operates within its design uniformity requirement (30 mK; red line) throughout the CD and most of the WU process. This behavior is consistent for all WUCD operations.
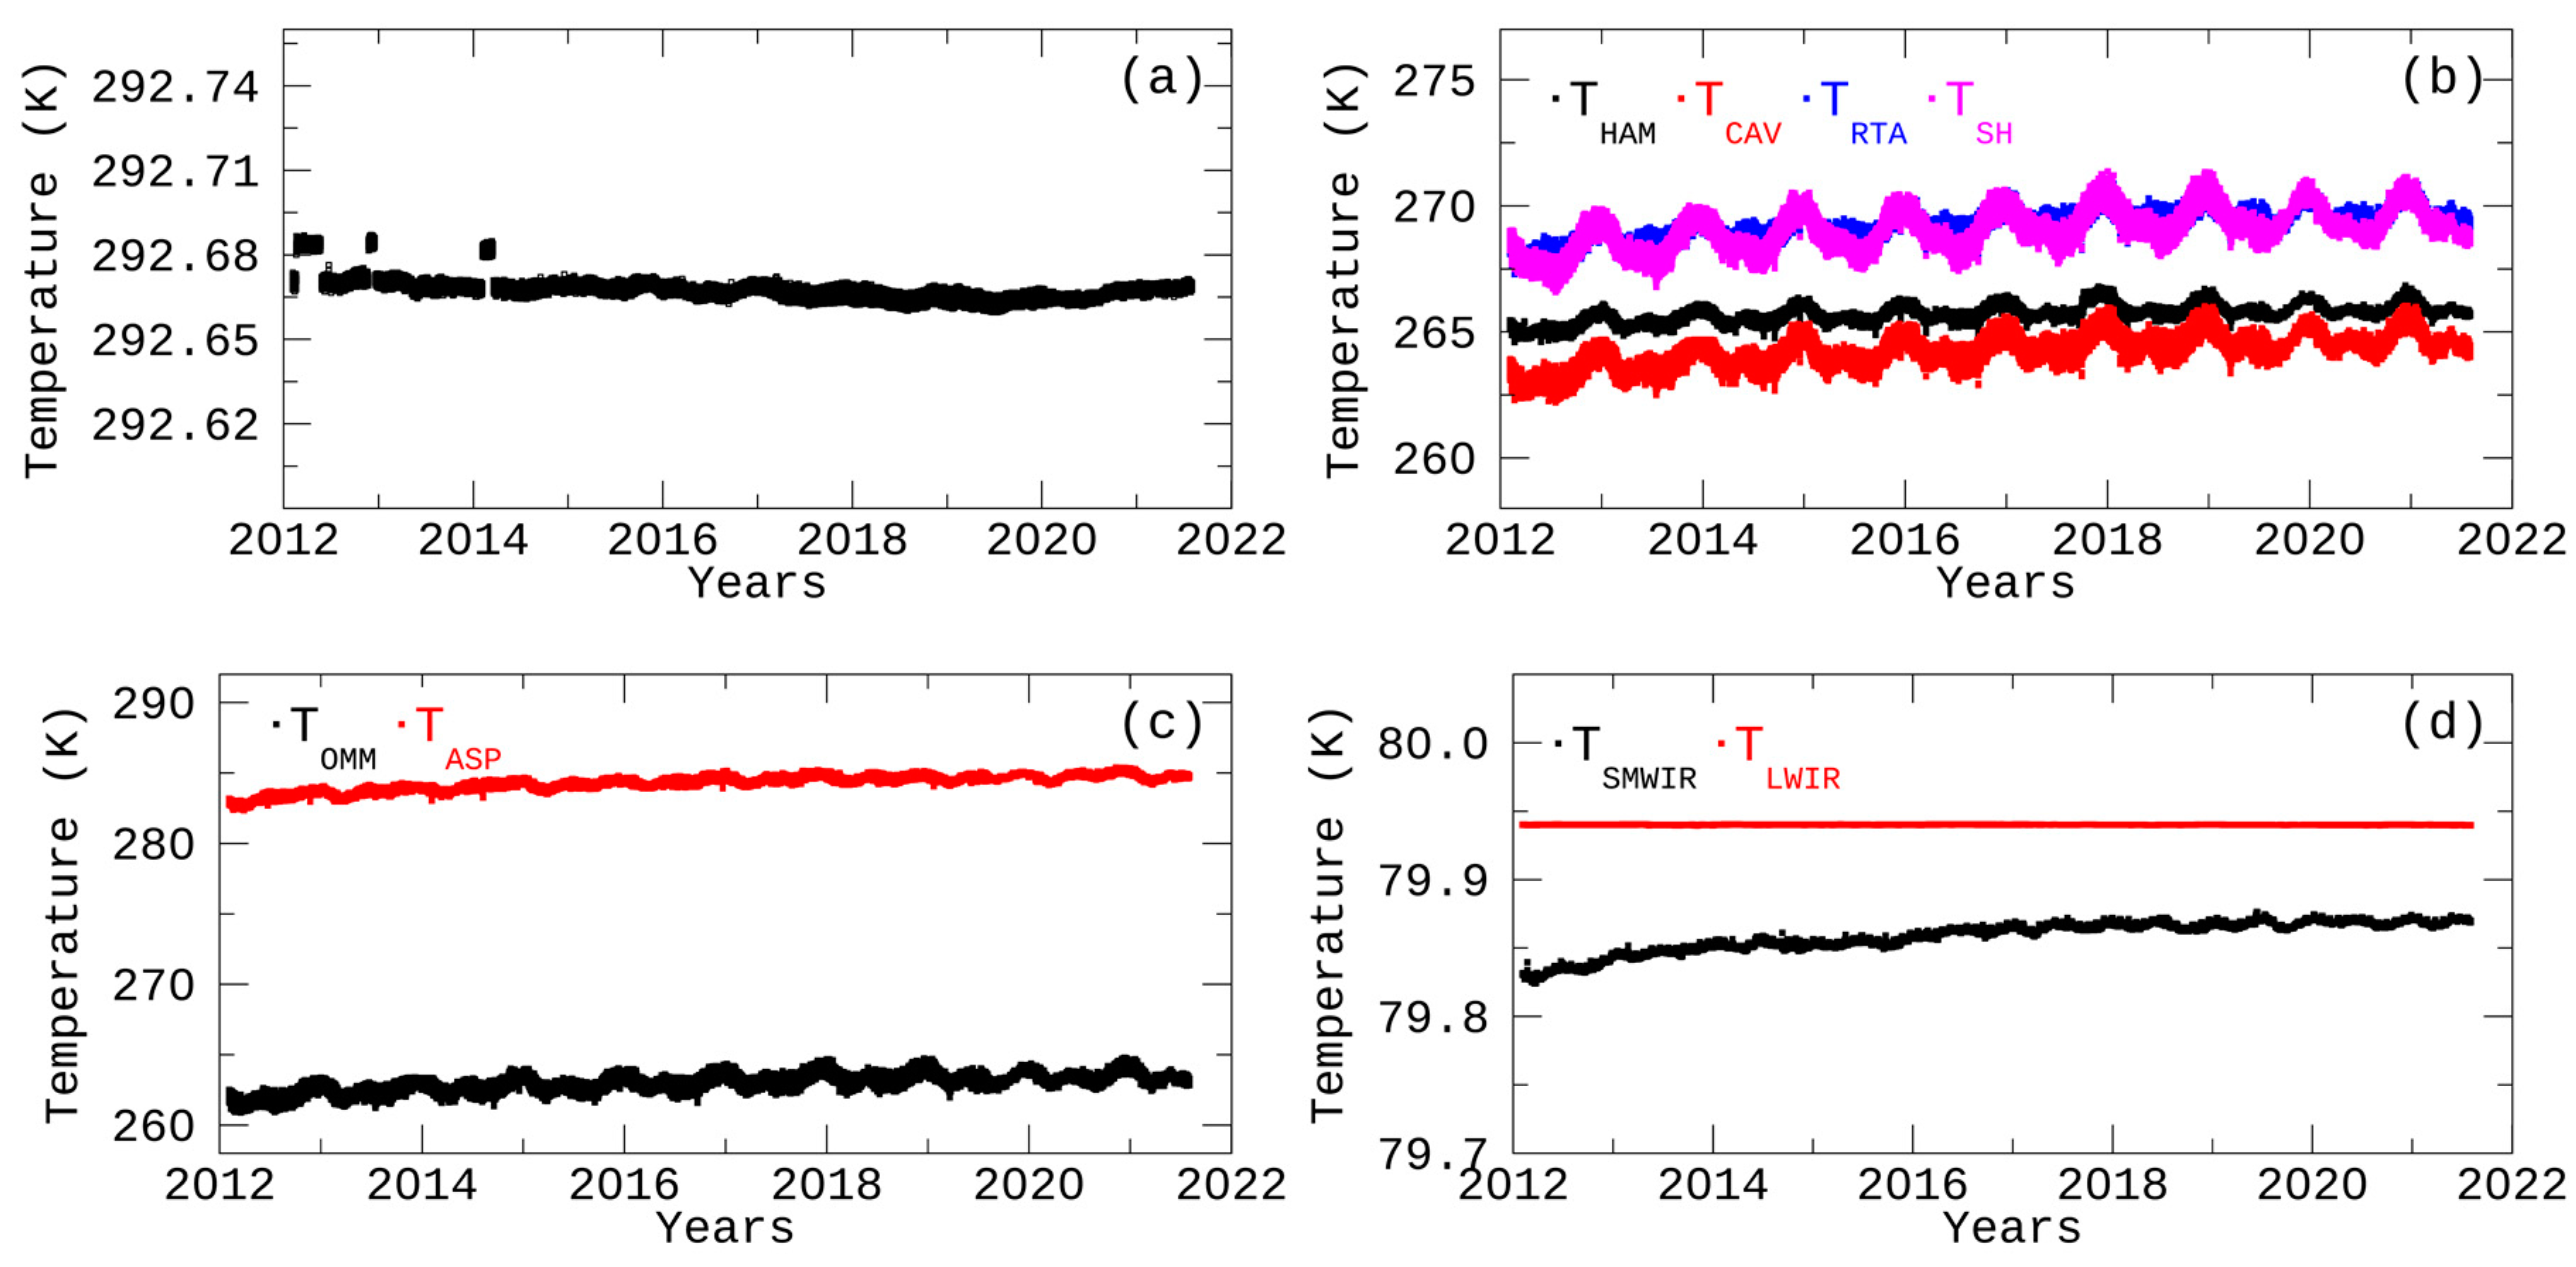
In order to evaluate the BB short-term performance during normal operations, Figure 3a illustrates the average BB temperature over three orbits (approximately 5 h) on 1 February 2021; it varies with the orbital cycle at about an amplitude of approximately 27 mK (during daytime). This pattern was recorded during early mission [10,13] and remains in present time. Moreover, it was reported that Thermistors 3 and 6 (farthest from the EV port) drive these average BB temperature variations (with the possible cause attributed to the BB heating on one side only due to Earth illumination). Nonetheless, the OBC BB still operates within its design stability and uniformity requirements (see Figure 3b; daytime (σ ≈ 27 mK) and nighttime orbit values (σ ≈ 6 mK) are within the 30 mK requirement). Figure 4a illustrates the long-term average BB temperature; its mission-long time series demonstrates that it has been stable (within 25 mK), excluding WUCD processes and instrument anomalies. Early mission discontinuities (~15 mK) were due to the application of two different BB settings (driven by a WUCD event and an instrument anomaly) [13]. Subsequent operational processing was updated to avoid this artifact and the BB temperature has remained steady—within 10 mK—since the update.
Also used in the thermal model and to inform about the instrument’s health, Figure 4b–d displays the mission-long time series of the other crucial telemetry points (such as the cold FPAs temperatures). The non-BB temperatures used in the thermal model are shown in Figure 4b. All temperatures show yearly variations no larger than 3 K; the local maximums correspond to the Earth at perihelion, while some other out-of-behavior values are due to single board computer lock-up/petulant mode events. The electronics and instrument temperatures, shown in Figure 4c, exhibited an increase of about 2.5 K over a decade. Figure 4d displays the cold FPAs temperatures. The LWIR FPA temperature has been rather stable (79.94 K) since it reached its operational temperature. The S/MWIR FPA temperature has risen approximately 40 mK (from ~79.83 K to ~79.87 K) over 10 years. Because the S/MWIR FPA temperature is passively controlled, as opposed to the LWIR FPA temperature, it shows more fluctuation [4]. Under nominal operation conditions, the impact due to such temperature variations on the calibrated L1B product is minimal, since the TEB calibration is updated on a scan-by-scan basis by referencing detector responses to the onboard BB.

3. On-Orbit Calibration Methodologies

3.1. Calibration Algorithm

Table 3 lists all the acronyms used in Section 3.1 to facilitate readability. The VIIRS TEB apply a quadratic polynomial algorithm to retrieve EV scene spectral radiance, L E V , using background-subtracted detector responses ( d n E V ) and prelaunch-derived calibration coefficients [4,5,7]. Additionally, these radiances are corrected for on-orbit detector degradation effects, instrument self-emission, and response-versus-scan-angle (RVS) effects,
L E V = F · i = 0 2 c i · d n E V i ( R V S E V R V S S V ) · L b g R V S E V
L b g = ( 1 ρ R T A ) · L R T A L H A M ρ R T A
where c i are the instrument temperature-dependent calibration coefficients derived during prelaunch characterization; R V S E V and R V S S V   are the detector’s RVS at the EV and space view (SV) HAM angle-of-incidence (AOI), correspondingly. R V S E V was derived from prelaunch measurements and R V S S V   is equal to 1 since the SV is chosen as the normalization point of the RVS function. Moreover, L b g is the instrument background emission radiance difference; ρ R T A is the RTA reflectivity; and L R T A and L H A M   are the RTA and HAM emitted radiances, respectively. F is the on-orbit degradation or calibration scaling factor (F-factor), which is derived scan-by-scan from on-orbit BB measurements by comparing the known BB spectral radiance ( L B B _ t h e r m a l _ m o d e l ) with that retrieved by the sensor ( L B B _ p r e l a u n c h ) using the prelaunch calibration coefficients for each band, HAM-side, and detector,
F = L B B _ t h e r m a l _ m o d e l L B B _ p r e l a u n c h
where L B B _ p r e l a u n c h = i = 0 2 c i · d n B B i and d n B B is the background-subtracted BB detector response.
Because the VIIRS TEB on-orbit calibration is performed referencing the instrument’s onboard BB, L B B _ t h e r m a l _ m o d e l is modeled as the radiance difference between the BB and SV paths as:
L B B _ t h e r m a l _ m o d e l = L B B + ( 1 R V S S V / R V S B B ) · L b g
where L B B is the BB radiance and R V S B B is the RVS at the BB HAM AOI. The TEB BB radiance, L B B , is the sum of the emitted—from the thermal sources around the BB (i.e., BB shield, cavity, and telescope originated radiances)—and reflected (off the BB into the optical path) radiances. The BB emission (>99.6%) dominates L B B . The instrument background emission term, L b g , in Equation (2) accounts for the RTA and HAM emissions that do not cancel out in the path differences (due to RVS differences at the two viewing angles) in Equations (1) and (4). Figure 5 shows a simplified diagram of the RTA as it rotates and views the different sectors used for the VIIRS TEB calibration. Using Equation (3), the TEB F-factors are estimated in alternating scans (for every HAM side) for all TEBexcept for the band M13 high gain (HG). The M13 HG F-factors are calculated sequentially every fourth scan (because L B B is too low to trend accurately, the M13 low gain (LG) F-factors are set to 1). A methodology to calibrate the M13 LG state using regular Moon observations, as the maximum surface temperature is around 390 K, from the SV port was proposed by McIntire et al. [15]. The general idea was that because dual gain bands alternate gain states every two scans during the calibration sector view, an opportunity presents itself to compare the M13 LG and HG responses over the intersecting portion of their dynamic ranges. McIntire et al. [15] describe that a 60 K range (about 40 low gain counts) over which to compare the calibration of both gain states is available (M13 HG saturation: 360 K; M13 LG signal becomes detectable at around 300 K).

3.2. On-Orbit Calibration Coefficients

The BB WUCD operation provides the basis to calibrate radiance over a large temperature range of nearly 50 K—nine temperature planes during warm-up; continual dataset during cool-down—over which the detector’s on-orbit offset, linear response, and quadratic terms ( c 0 o n o r b i t , c 1 o n o r b i t , and c 2 o n o r b i t ) can be derived with a second-order polynomial fit to the incident detector radiance ( L B B _ t h e r m a l _ m o d e l ) as it relates to the detector’s response ( d n B B ) as such:
i = 0 2 c i o n o r b i t · d n B B i = L B B + ( 1 R V S S V / R V S B B ) · L b g = L B B _ t h e r m a l _ m o d e l
These on-orbit-derived calibration coefficients support the characterization and monitoring of changes in the TEB detector offset and nonlinear responses.

3.3. NEdT at Nominal BB and Typical Temperatures

The NEdT describes the instrument’s sensitivity and denotes the (per sample) noise in the temperature space. Considered to be a noise estimate at the BB temperature level, the NEdT is derived over the 48-sample background-subtracted BB signal using the standard deviation [4,13]. NEdT can thus be calculated as,
N E d T = N E d L L / T
where N E d L is the Noise Equivalent radiance difference, which itself is dependent upon the BB detector response’s signal-to-noise ratio, and L / T is the derivative of the Planck function evaluated at the BB temperature. During a WUCD, because the BB temperature range is quite large, the NEdT can be assessed at each band’s Ttyp, with which the instrument requirements are defined (see Table 1). Under normal operations, the NEdT is monitored at the nominal BB temperature (~292.7 K).

4. On-Orbit Performance

This section discusses the S-NPP VIIRS TEB on-orbit calibration performance by assessing the detector response trends, noise characterization, and WUCD calibration coefficients. It also discusses RVS stability assessments based on results from a designated spacecraft maneuver. Lastly, it presents results from vicarious calibration techniques to support the sensor’s on-orbit calibration performance evaluation. Overall, the S-NPP VIIRS TEB calibration has been quite stable since launch. Note that all the results shown begin on 20 January 2012 (cold FPAs reached operational temperatures).

4.1. Detector Gain Trends

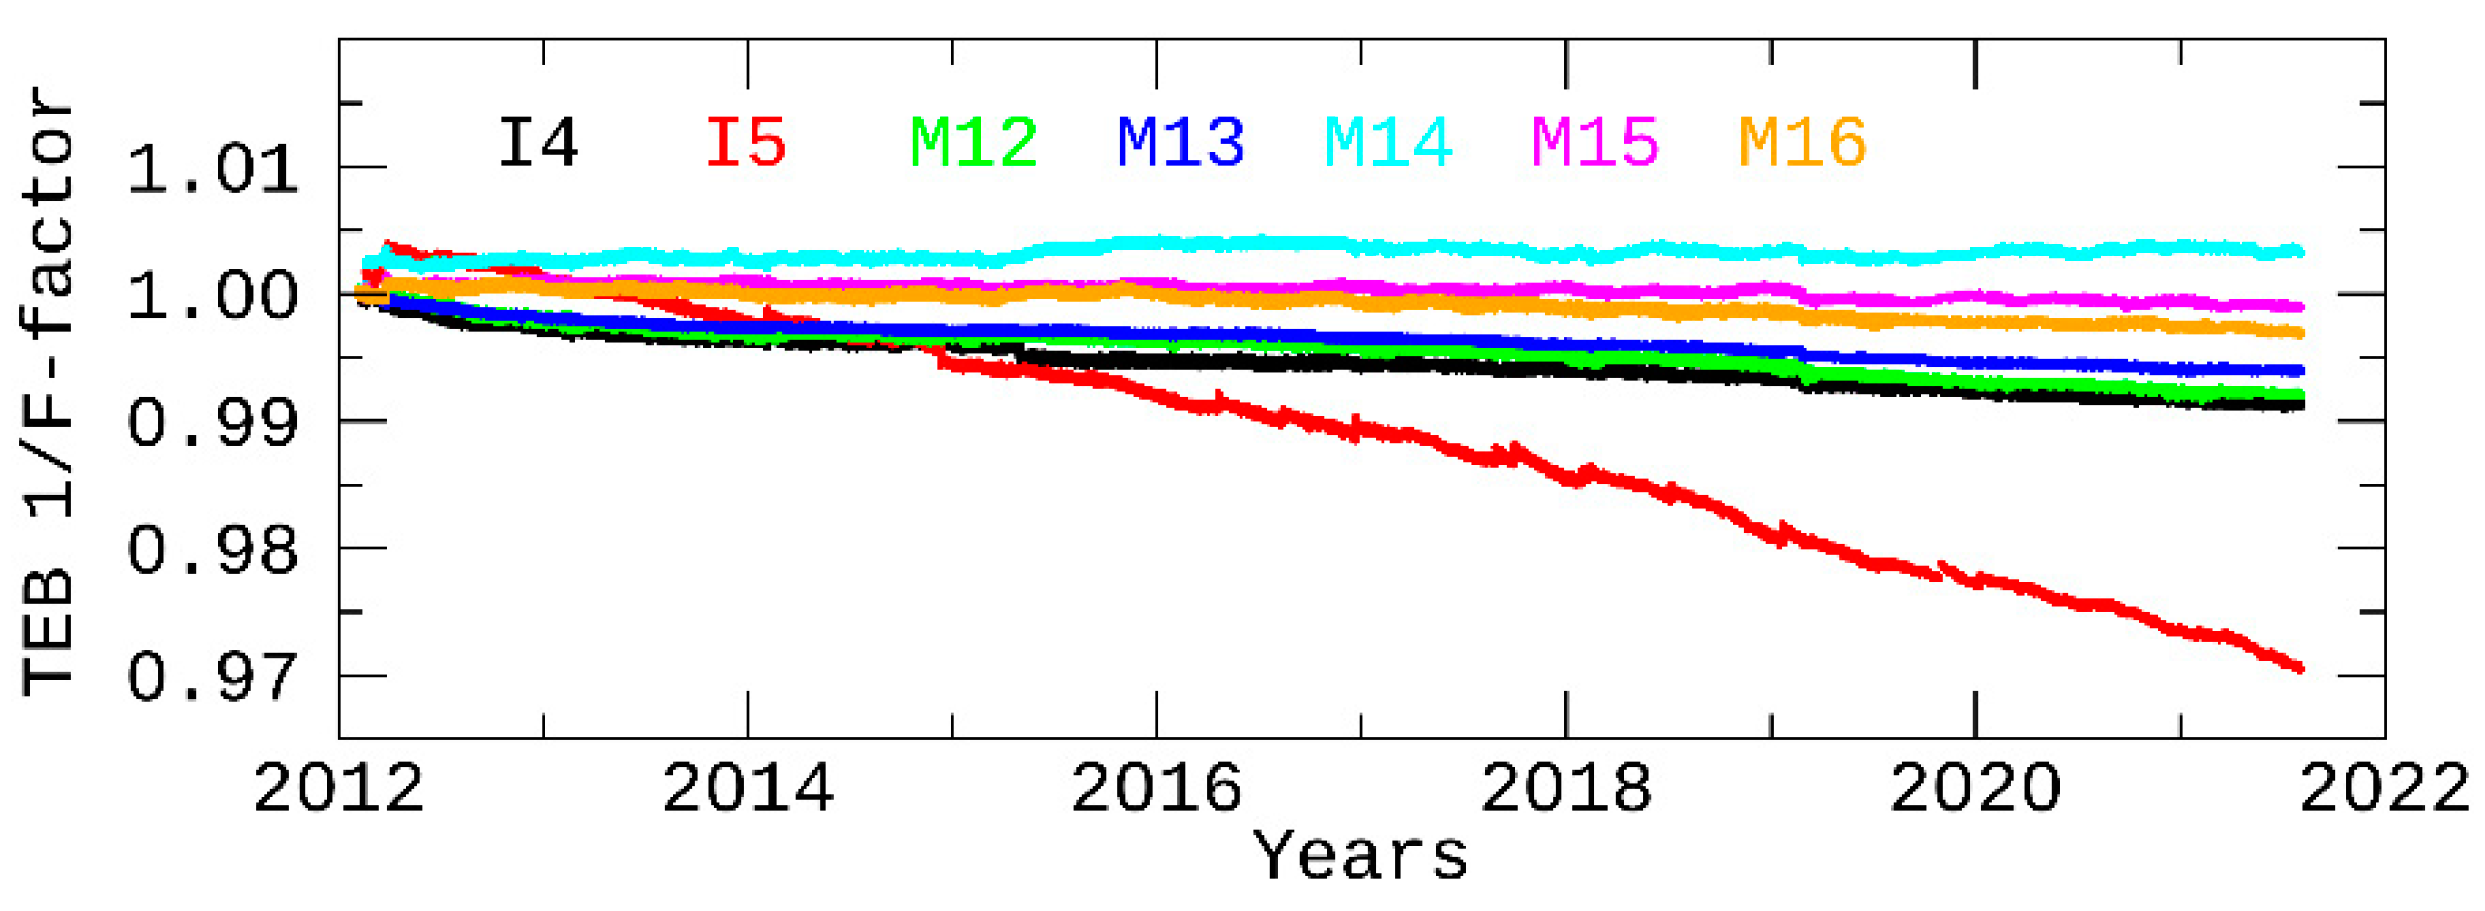
As presented in Section 3.1, the VIIRS TEB calibration uses a quadratic algorithm, and the detector gain (1/F-factor) is computed on a scan-by-scan basis using its response to the BB radiance. Using Equation (3), the TEB F-factors during nominal operations were calculated (data collected from two granules during every orbit’s solar observation). Afterwards, the TEB gains were trended over on-orbit operations. Figure 6 shows the band-averaged results. All results shown henceforth are for HAM-side A only to avoid redundancy and prevent all figures from being overcrowded, since the HAM-side B results are essentially similar. All values are normalized to 20 January 2012. The degradations of the S-NPP VIIRS TEB have generally been small after a decade on-orbit. Band I5 exhibits the most degradation (around 3.1%), while the other LWIR bands show degradations no larger than 0.3%. Moreover, while bands M15 and M16 cover the same spectra as I5, these do not share the same level of degradation; this is possibly due to different electronics and sampling. All the LWIR bands display an annual cycle wherein local minimums are seen whenever the Earth is at perihelion. Moreover, a small jump early in the mission (mostly noticeable for the LWIR bands) can be attributed to a different BB temperature setting during a short period. These annual gain sequences are correlated to those in the temperatures used in the instrument thermal calibration model; though, since these temperatures are highly interrelated, it is difficult to pinpoint any specific telemetry temperature. All changes in the S-NPP MWIR detector responsivities are smaller than 1% after 10 years of sensor operations. Moreover, the MWIR bands had a minor gain decrease during early mission, it has since flattened. Additional discontinuities can be attributed to single board lock-up/petulant mode events and early mission instrument and spacecraft anomalies (see Table 2).
In the interest of evaluating the on-orbit short-term performance at the detector level, Figure 7 illustrates the bands I4 (detector 16, Product Order) and M14 (detector 8, Product Order) scan-by-scan and granule-averaged F-factors for one day’s worth of data (1 February 2021). The F-factors were normalized to the first data point of the day and are only shown for HAM-side A. These two bands were selected to represent both cold FPAs and band types. Minor orbital variations (~0.1% and ~0.2% (or smaller) on a granule-averaged and scan-by-scan basis, respectively) can be observed for all TEB; all partially attributable to BB temperature variations throughout every orbit [13].
While the S-NPP VIIRS TEB F-factors have been demonstrated to exhibit little variability and overall good stability during nominal operations, it is important to assess the on-orbit F-factors throughout non-nominal OBC BB temperatures (i.e., during WUCD operations). In Figure 8, the bands I4 (detector 16, Product Order) and M14 (detector 8, Product Order) F-factors, along with the BB temperature, are shown during the WUCD event performed from 15 March to 17 March 2021. All the F-factor values are granule-averaged and only illustrated for HAM-side A. The M14 F-factors were shifted upward by 2.75% so that these can be in the same range as the I4 F-factors and in the same figure. Similar to Figure 7, these bands were selected to represent both cold FPAs and band types. Small F-factor anomalies and thus TEB calibration biases can be observed during the BB WUCD. F-factor transients at each WU step can be linked to each 5-K BB temperature step/interval during the WUCD process. Moreover, there is a noticeable increase in the F-factor during CD. This behavior is consistent for all WUCD operations. As shown in Figure 8, the band M14 F-factor decreases during WU and vice versa throughout the BB WUCD. Moreover, the WU period is shorter (~15 h) than the CD (24 h), and the latter’s change in magnitude is larger as well. Because the F-factor performs as a scaling agent to the calibrated radiances, any flawed variations in F will transfer biases in the EV radiances. Other infrared bands exhibit similar behavior during the WUCD operation, albeit smaller in magnitude as the wavelengths become shorter. As mentioned previously, the 292.5 K nominal temperature is close to peak thermal emission for the long-wave infrared channels spectrally. Thus, any temperature change will have larger effects on the calibration of these bands. Cao et al. and Wang et al. have discussed this in detail [10,16], and Wang and Cao provided the methodology to attenuate the TEB calibration anomalies during the WUCD processes [14]. The NOAA IDPS SDRs have been updated to handle these changes since 25 July 2019. As discussed in detail by Wang and Cao, the F-factor computation will not change during nominal operations, and the updated TEB calibration algorithm supports three WUCD bias correction techniques: the Nominal-F method, the Ltrace method, and the Ltrace-2 method [14]. Moreover, the VIIRS emissive LUT was amended appropriately to arrange the WUCD bias correction technique used and to fit in the required correction coefficients. Their results indicate that implementing this correction efficiently decreases the F-factor anomalies for S-NPP VIIRS. More importantly, the daily-averaged F-factor anomalies subsided from 0.18% to 0.02% and –0.17% to −0.05% for M15 and M13, respectively, during the cool-down portion of the WUCD operation. The F-factor anomalies for the other TEB were also successfully mitigated. Lastly, Wang and Cao also provide a VIIRS–Cross-track Infrared Sounder (CrIS) brightness temperature (BT) bias time series comparison during the WUCD from March 2020 and show that the WUCD bias correction works properly for S-NPP (residual biases of ~0.01 K).

4.2. Noise Characterization

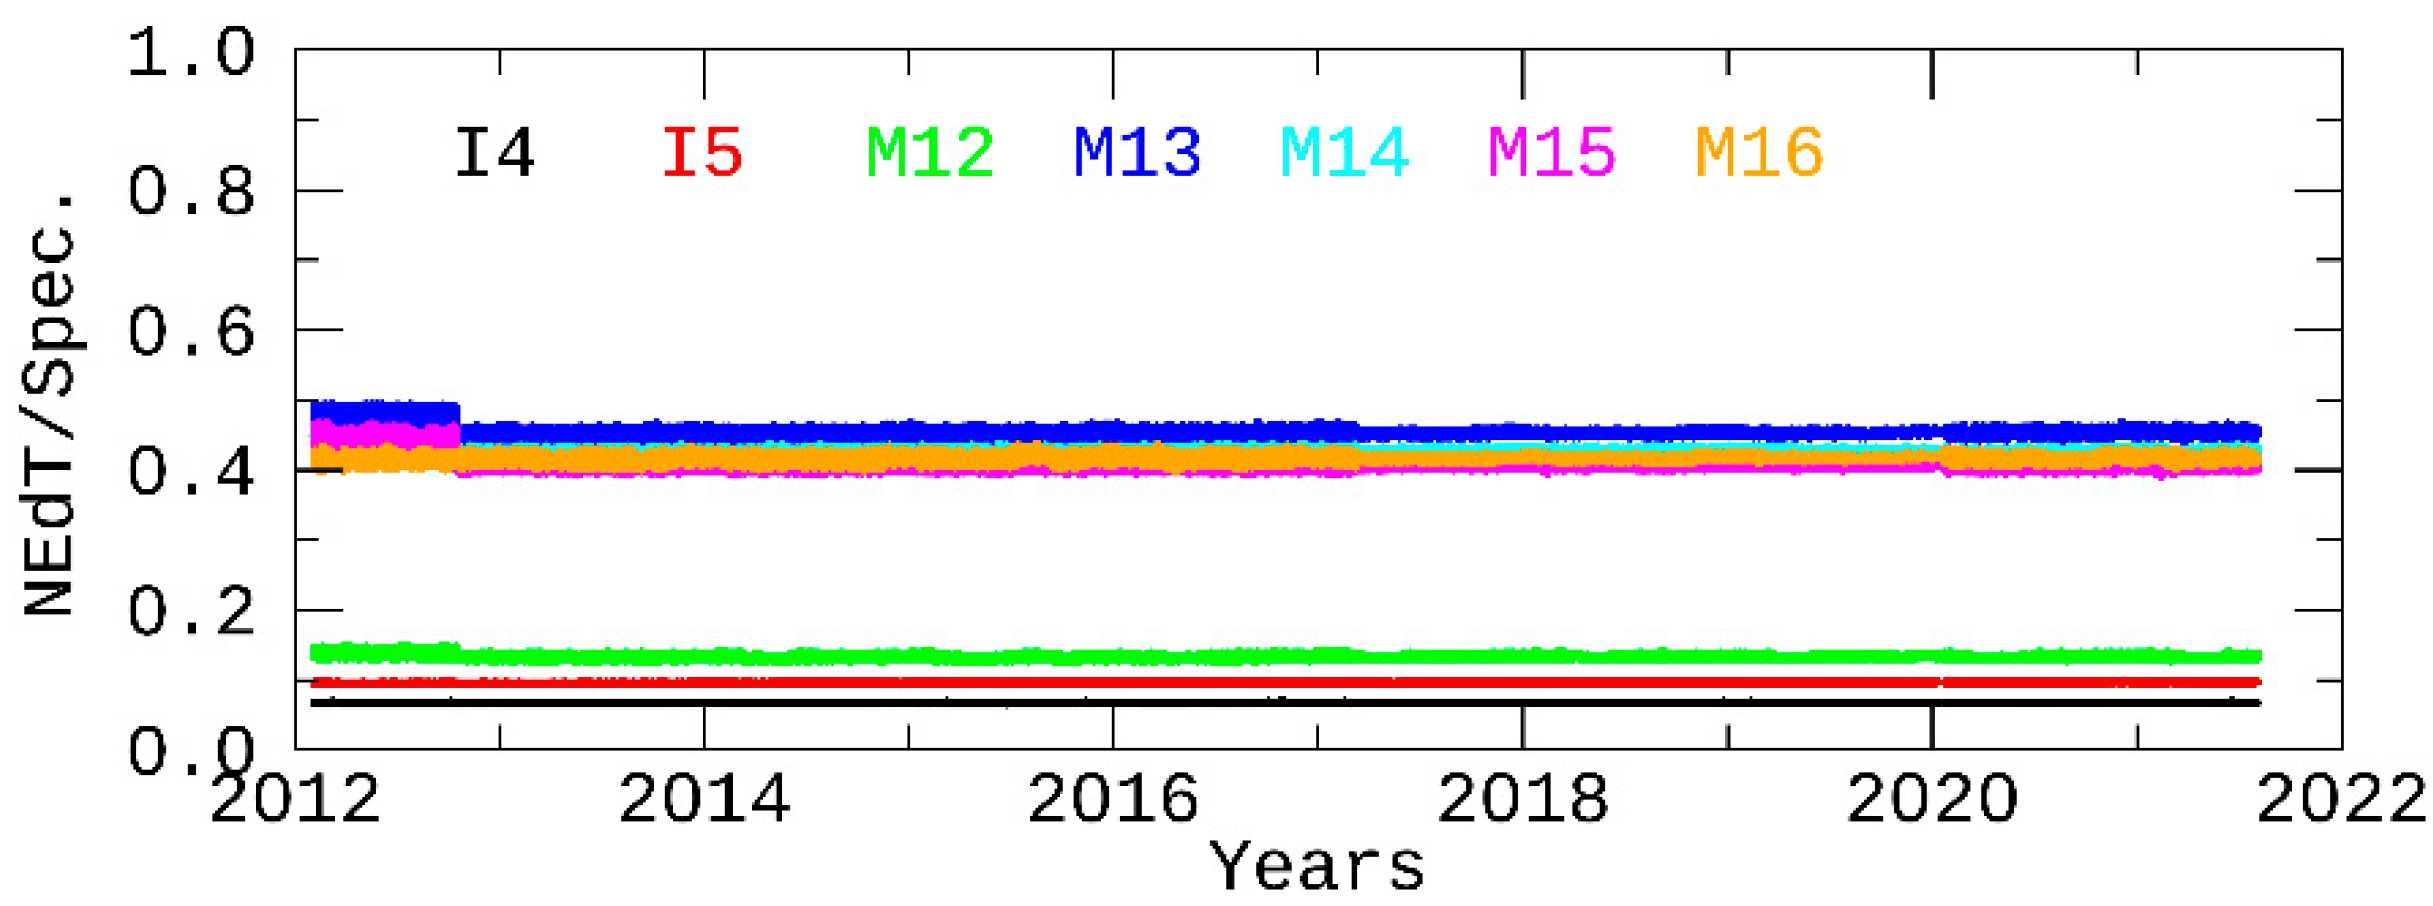
As mentioned in Section 3.3, the noise performance for each TEB detector is characterized using the NEdT during nominal operating temperatures (~292.7 K) as well as the NEdT at Ttyp-derived using measurements from periodic BB WUCD operations. Figure 9 shows the band-averaged normalized NEdT trends (HAM-side A only) during nominal operations for all the S-NPP VIIRS TEB. These trends were plotted with the same granules used for Figure 6. All data points are normalized to the NEdT specification for each band. It can be observed that all TEB are well within the specification for the entirety of the mission. Bands M13, M15, and M16 are at about the halfway mark (~0.40–0.50) from their respective NEdT specifications, while bands I4, I5, and M12 have NEdT values no higher than 15% of their specification. Overall, the noise performance for all bands is quite stable. As discussed previously in Section 3.1, the small jump during early mission can be attributed to a different BB temperature setting. It should be noted that detector 2 in band I5, detector 16 in band M12, and detector 9 in band M16A (all in Product Order) have shown higher NEdT, albeit well within the specification, than other detectors in their respective bands and have been consistently like this throughout the mission. However, while well within their respective requirements, some of the stripe noise from these three bands propagates from the L1B clear-sky BT onto the Level 2 Sea Surface Temperature (SST) products. This striping has been shown to cause up to a 0.2 K SST difference in some cases [17]. Bouali and Ignatov [17] proposed an empirical destriping approach and demonstrated it to be feasible over ocean scenes via quantitative and qualitative analyses using an S-NPP VIIRS 3-day global dataset. Table 4 summarizes the band-averaged NEdT at Ttyp-derived from BB CD data for all S-NPP VIIRS TEB. The NEdT values are provided for three different years (2012, 2016, and 2021) in the sensor’s mission. It also includes the prelaunch NEdT values as well as the NEdT requirement for each band. Similar to the results during nominal operations, the NEdT values for all bands are well within their specification at Ttyp. Moreover, all bands exhibit on-orbit NEdT slightly lower than their prelaunch-derived noise characterization. Lastly, the NEdT at Ttyp for the three years selected demonstrates that the noise performance has been quite stable over the instrument’s mission as well.

4.3. WUCD Calibration Coefficients

As briefly discussed in Section 3.2, the data from the WUCD operation provide a calibration radiance foundation over a broad 50 K temperature range that is independent from the prelaunch calibration source. Moreover, band, HAM-side, and detector-dependent 2nd order polynomial calibration coefficients ( c 0 o n o r b i t , c 1 o n o r b i t , and c 2 o n o r b i t ) can be derived using Equation (5). These WUCD-derived coefficients can be used to describe the VIIRS TEB on-orbit calibration nonlinearity over time. Furthermore, and as discussed previously, these can be utilized to lessen calibration biases during the WUCD cycle [14].
Figure 10 illustrates the band-averaged on-orbit-derived calibration coefficients (HAM-side A only) for the S-NPP VIIRS TEB over the entire mission. Results are separated into WU and CD processes. Prelaunch coefficients are also included and defined by horizontal black lines. The offset ( c 0 o n o r b i t ) and nonlinear ( c 2 o n o r b i t ) coefficients derived from each WUCD are steady over the twenty-eight WUCD events thus far. These are also consistent with the LUT values derived prelaunch. There are some differences between the WU and CD calibration coefficients; the WU sequence generates larger nonlinear terms. For the S-NPP MWIR bands, the WUCD-derived linear coefficients ( c 1 o n o r b i t ) appear to be trending upward. This behavior is consistent with the slow degradations shown in the F-factors time series (see Figure 6). Band I5 also exhibits similar performance.
It is important to mention that the F-factor efficiently adjusts for detector response changes at nominal BB temperatures. Over a broader range of scene temperatures, the F-factor is sensitive to gain changes, while changes in the nonlinear terms would affect the calibration at lower and higher temperatures than the nominal 292.7 K. Hence, these two on-orbit derived nonlinear terms are less accurate than their prelaunch counterparts, which were derived over a larger range of temperatures (190–345 K) using a NIST-calibrated BB source. Thus, any significant discrepancies between the prelaunch- and WUCD-derived coefficients can be evaluated using vicarious calibration results (Section 4.5) to determine if the prelaunch values should be updated. Currently, the prelaunch calibration coefficients, as opposed to the on-orbit-derived, are used to generate the NASA SIPS L1B product. Generally, successful calibration can be achieved this way because gain changes are corrected for using the calibration scaling F-factor (which is a function of detector response, the prelaunch calibration coefficients, instrument self-emission, and scan angle effects) discussed in Section 4.1. This is later confirmed in Section 4.5 through vicarious calibration. The NOAA IDPS SDR use a combination of the prelaunch coefficients (during nominal operations) and the WUCD-derived coefficients (during BB WUCD unsteady states; as discussed by Cao et al. and Wang et al. [10,14]).
As part of the VIIRS TEB calibration, it is quite challenging to accurately account for the instrument’s nonlinear response. This is due to the fact that the sensor’s nonlinearity cannot be simply determined after launch, and thus has to be transferred from prelaunch with an external blackbody calibration source in a laboratory. This is not uncommon for infrared radiometers. However, this philosophy (prelaunch to on-orbit calibration transfer) is quite different in the VIIRS radiometric calibration algorithm theoretical basis when compared to its heritage approach. As mentioned in Section 3.1, a nonlinear calibration curve is determined using the prelaunch calibration coefficients. In the case of heritage sensors such as MODIS, the linear term is dynamically calculated and applied on-orbit based on onboard BB measurements, while the nonlinear terms are updated frequently (when necessary). Hence, the VIIRS algorithm carries these three terms ( c 0 , c 1 , c 2 ) from prelaunch to on-orbit assuming that the prelaunch laboratory test using the NIST blackbody calibration source provides the best sensor characterization and the derived prelaunch coefficients are reliable. Therefore, all postlaunch calibration is traceable to prelaunch. If indeed the instrument response remains identical from prelaunch to postlaunch, the on-orbit calibration can be achieved using Equation (1) with the prelaunch calibration coefficients. However, instrument degradation and different operating conditions may call for on-orbit calibration updates. There is a major hurdle when trying to transfer prelaunch nonlinear calibration to on-orbit: three calibration coefficients (Equation (1)) and only one blackbody at nominal temperature. This results in one known parameter with two unknowns during on-orbit calibration. Ultimately, it was decided that an assumption was necessary to make this transfer possible. Thus, the degradation was represented by a single scaling (F) factor. This F-factor is one for the prelaunch test data. Cao et al. [16] proved this assumption to have its setbacks and have since then developed and implemented a methodology to remove F-factor fluctuations during BB WUCD events in the NOAA IDPS SDRs. The NASA SIPS L1B products have yet to implement it. Nonetheless, monitoring these coefficients is essential to track changes in sensor performance and characterization.

4.4. RVS Validation during Designated Spacecraft Maneuver

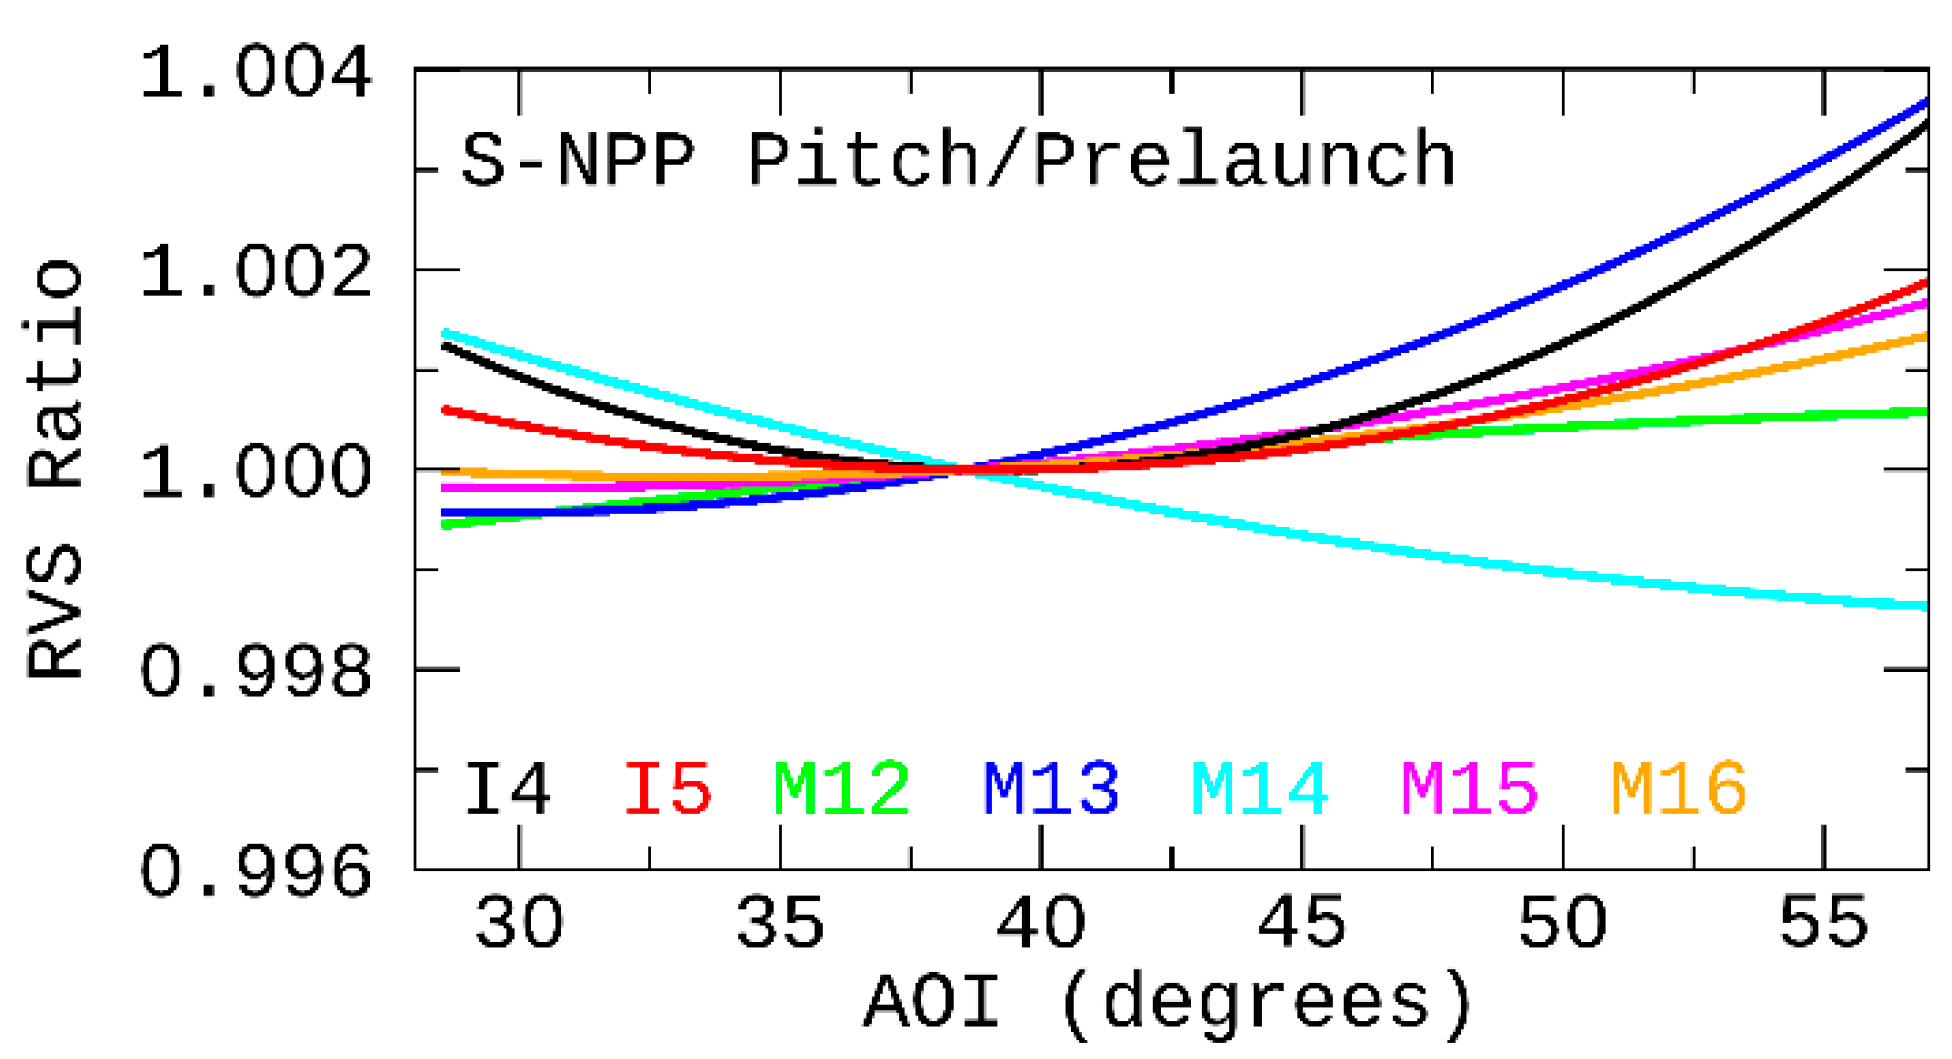
A spacecraft deep space pitch maneuver is a designated postlaunch activity for RVS characterization. The S-NPP VIIRS pitch maneuver was designed and performed to validate its prelaunch TEB RVS characterization. It was completed on 20 February 2012 as part of the VIIRS rigorous calibration and validation stage to provide data for the on-orbit characterization of the TEB RVS [18]. In this maneuver, the spacecraft rotates around its y-axis and VIIRS gets a clear deep space view for a quarter of an orbit. When observing the deep space, the radiance perceived by the detectors comes from the sensor components’ thermal emissions (including the HAM; whose emission varies with scan angle), while the EV external radiance is fundamentally zero. As such, the emissive radiation’s relative change across the EV scan range (proportional to the change in detector’s relative responses) can be examined to determine the TEB RVS. Data used for the TEB RVS characterization include the deep space and OBC BB detector responses. Furthermore, there is an underlying assumption that there are no polarization effects. This would impede HAM self-emission with scan angle variations from being effortlessly translated to RVS. During the prelaunch RVS derivation, an external unpolarized source was used to estimate the RVS [19]. Figure 11 illustrates the results published by Wu et al. [18,20]. These demonstrate good agreement between the on-orbit pitch maneuver-based and prelaunch RVS values—within 0.4% (close to the 0.3% requirement, and only exceeded by bands I4 and M13 at the edge-of-scan angles). It was inferred then that any HAM emission polarization effects are insignificant, and thus the RVS prelaunch characterization is valid.

4.5. Vicarious Calibration

Vicarious calibration practices make use of natural or artificial sites on the Earth’s surface to calibrate sensors postlaunch. These are frequently used as an alternative to the common on-orbit calibration methods used to monitor sensor performance. Hence, Earth observations offer valuable information for calibration assessments. In this subsection, the on-orbit calibration performance of the S-NPP VIIRS TEB is evaluated using both an in situ ocean buoy and the Infrared Atmospheric Sounding Interferometer (IASI) instrument as references. The idea is to provide performance assessments via a ground site and through an inter-sensor comparison. Overall, the S-NPP VIIRS TEB show excellent performance over the instrument’s mission through vicarious calibration.

4.5.1. VIIRS-In Situ Ocean Buoy Comparison

The in situ ocean buoy used belongs to the National Water Level Observation Network. The site is overseen and preserved by the NOAA’s National Data Buoy Center (NDBC) and has operated mostly uninterrupted for all the on-orbit S-NPP VIIRS lifetime. It is often referred to as Station SNDP5 (or #1619910), and is situated near the Sand Island, Midway Islands, HI (28.215 N, 177.361 W). The station consists of a 3-m discus buoy with a standard Self-Contained Ocean Observing Payload of sensors. It records SST measurements-at the Mean Lower Low Water level with high-accuracy (±0.002 °C) inductive sensors; these deliver SST data with excellent long-term stability (0.0001 K/y). Established in 2005, the data have been recorded every 6 min. Significant data gaps coinciding with the S-NPP VIIRS mission include 2 months in 2014 and another 2 months in 2019 for a total of 4 months.
S-NPP VIIRS Collection 1 L1B calibrated radiance, geolocation, and cloud mask products were downloaded for the 6-min granules collocated with the ocean buoy to extract the necessary radiance, location, and cloud cover information, respectively. Generally, there are two S-NPP overpasses over the site per day. Only nighttime observations were used to avoid the solar reflectance impacts on the MWIR bands. The methodology employed for the VIIRS-buoy comparison is described in detail by Perez Diaz et al. [21,22]. In simplified terms, using the VIIRS L1B calibrated radiance and geolocation data, a 576 km2 (24 km × 24 km) region-of-interest aligned around the site is found using the great-circle distance. Radiance data are converted to BT for all the TEB (via the band’s spectral response function and Planck’s law). All overcast pixels, by way of the VIIRS cloud mask, are sifted and the average BT of the residual pixels is computed. Data from all detectors for each TEB are utilized to compute the band-averaged BT. Lastly, all buoy SST data are temporally matched with the coincident VIIRS overpass.
Figure 12 shows the S-NPP VIIRS bands M13 and M15 BT and in situ SST over the ocean buoy site near the Hawaii Islands. These two bands were selected to represent one band from each cold FPA and because their Ttyp are quite close to the average SST (see Table 1). The VIIRS and buoy temperatures are collocated in space and coincident in time. The brightness temperatures for the VIIRS bands were plotted as monthly averages. The in situ SST shown are nighttime observations only. All time series start on 20 January 2012. Data gaps in the SST observations are due to outages. It can be observed that both VIIRS bands exhibit similar temperatures in terms of magnitude and seasonal oscillations. Moreover, while there is an offset between the SST and VIIRS BT, it seems apparent that their overall trends are quite similar. This offset can be attributed to slight differences between the BT perceived by the VIIRS infrared channels and the water depth of the temperature sensors. To confirm this, Table 5 shows the VIIRS-buoy yearly change rates for each TEB over the sensor’s mission. A detailed description and more thorough analyses of the results presented next is discussed by Pérez Díaz and Xiong [22]. Results indicate that all TEB display excellent on-orbit performance through vicarious calibration. All bands exhibit change rates within 0.02 K/y. Band M13 shows the largest temperature trend when compared to the buoy data with a total drift of 0.19 K after a decade in orbit. It is followed by band M12 with a downward drift of 0.13 K over 10 years of operations. These results demonstrate that the S-NPP VIIRS TEB continue to be well-calibrated throughout the mission at typical temperature scenes. In Section 4.5.2, the S-NPP VIIRS TEB on-orbit performance will be evaluated over a broader temperature range using an inter-sensor comparison.

4.5.2. VIIRS-IASI Comparison

The VIIRS TEB on-orbit performance was also evaluated by using IASI simultaneous nadir observations (SNOs) as reference. IASI, onboard the Meteorological Operational satellites (MetOp)--A and MetOp-C polar-orbiting meteorological satellites (altitude ~817 km), SNO data were used from May 2007 to April 2020, and from July 2019 to April 2021. The IASI spectral range spans from 3.6 μm to 15.5 μm with 8700 spectral samples covering nearly the whole VIIRS TEB spectrum. Hyperspectral IASI measurements were integrated to obtain simulated radiances for each VIIRS spectral band. All VIIRS pixels within each IASI SNO pixel (6-km radius) were aggregated to match the IASI pixel footprint. The radiances were then converted to BT values for cross-comparison [23]. MetOp-A shares overpasses with S-NPP at higher latitudes (73.0° ± 1.1°). The number of IASI SNOs coincident with VIIRS retrievals are limited by each satellite’s overpass time periodicity. There is a coincident S-NPP-IASI overpass event approximately every 50 days. There are roughly 270 VIIRS pixels within each IASI field-of-view.
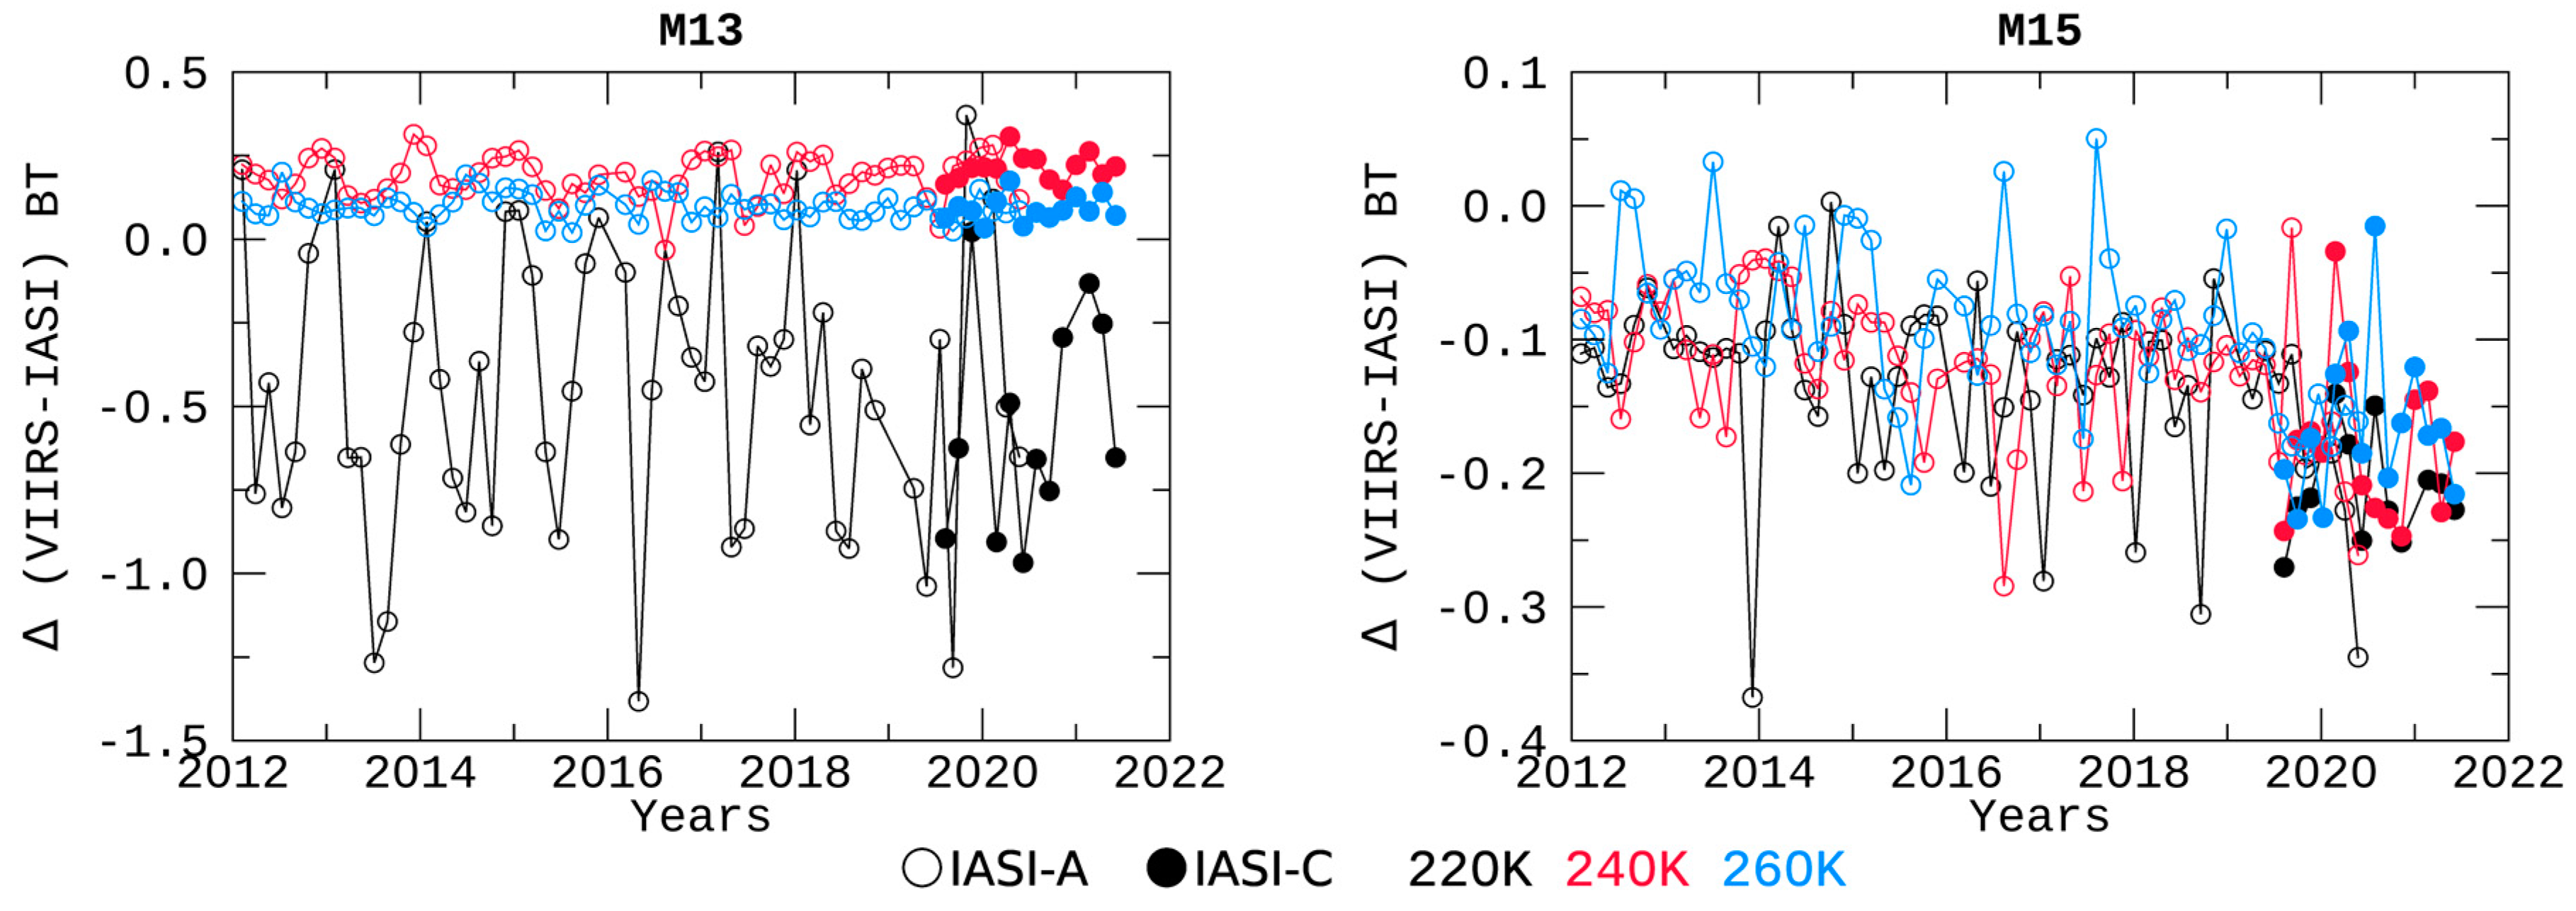
In order to assess the calibration consistency over time, the BT difference (ΔBT) between S-NPP VIIRS and IASI at different BT levels were trended over time. These three BT tiers were selected to evaluate the sensor performance at different scene temperatures, albeit with the caveat that the typical temperature (see Table 1) for each TEB cannot be reached using SNOs. Figure 13 displays the ΔBT time series for bands M13 and M15 at IASI-simulated M15 BT centered at 220 K, 240 K, and 260 K (described by different colors) with bin sizes of ±5 K. Empty symbols define IASI-A, while filled symbols represent IASI-C. It is observed that the ΔBT trends are stable over time (within 0.4 K; peak-to-peak variation), except for band M13 at 220 K (1.5 K peak-to-peak fluctuation). Table 6 summarizes the average ΔBT between the S-NPP VIIRS TEB and IASI measurements at different BT levels. Results indicate that bands I4 and M12 have relatively large ΔBT values, this is due to the fact that the relative spectral response functions for these two VIIRS bands are not fully covered by the IASI spectrum. All other bands exhibit smaller ΔBT values (low for high BT values and vice versa). Bands I5 and M16 have the smallest ΔBT values (less than 0.1 K), followed by bands M15 and M14 (within 0.2 K). The largest ΔBT values are observed for band M13 among those bands fully covered by the IASI spectrum.

5. Discussion

After close to a decade in-orbit, a solid S-NPP VIIRS TEB calibration methodology foundation has been established. Some challenges and room for improvement remain, with new challenges and anomalies more than likely to emerge as the instrument continues to operate past its designed lifetime (5 years). Moreover, improvements to the higher-level science products will surely make it necessary for the TEB to be accurately calibrated. There are remaining topics that need additional investigation as well as current issues that need resolution.
The S-NPP VIIRS TEB have dynamic ranges defined prelaunch. Oftentimes, when a channel’s incident radiance reaches its maximum defined radiance level, the band’s response is typically saturated. This is known as digital saturation. However, for some channels, as is the case for bands I4 and M12, the detector response decreases with increasing radiance. This phenomenon is defined as analog saturation or radiance rollover. This was defined during prelaunch testing and confirmed postlaunch. Generally, the concern is that such a band’s response may seem valid and be recorded in the L1B when in reality, it is not. This artifact would then trickle down to the higher-level products. Band I4 is the most impacted by this artifact. It is crucial to identify the impacted pixels and flag them appropriately in the L1B product. VCST is currently investigating the analog saturation phenomenon and developing a mitigation strategy for future use.
The TEB calibration uncertainty is essential to evaluate the quality and accuracy of the TEB calibration. A detailed description of the uncertainty contributors to the TEB calibration was presented by McIntire et al. [24]. The preliminary results demonstrated that the leading terms in the MWIR bands EV uncertainties are the relative L B B and relative d n E V uncertainties, while the LWIR channels uncertainties are dominated by the c 0 , R V S , and d n E V relative uncertainties. Supplementary investigation and analyses are ongoing. The VIIRS TEB uncertainty algorithm is under refinement. Ultimately, the L1B product will have uncertainty information for each pixel once implemented.

6. Conclusions

S-NPP VIIRS has completed nearly 10 years of successful on-orbit operation and provided high-quality, long-term Earth data records to the scientific user community. Its OBC BB continues to function and is routinely operated to provide baseline calibration for—and distinctively categorize—the S-NPP VIIRS TEB. The S-NPP VIIRS TEB calibration performance has remained stable throughout the mission. The gains of the S-NPP VIIRS detectors have experienced changes on orbit (within 3%), while the noise characterization performance has remained stable with most TEB detectors continuously meeting their design requirements. Moreover, the S-NPP VIIRS TEB on-orbit-derived calibration coefficients continue to exhibit and confirm this stability. The TEB RVS were validated via an on-orbit deep space maneuver and agree with the prelaunch values (within 0.4%). Lastly, calibration stability assessments using an in situ site and IASI SNOs demonstrate excellent calibration stability for all the S-NPP VIIRS TEB over a broad range of scenes and brightness temperatures. Uninterrupted stable calibration performance for any Earth observing instrument is key for the continuity and longevity of its data records. This presents a challenge towards the development of long-term climate data records. As evidenced in this paper, this requires devoted efforts to track (and possibly correct) on-orbit changes in sensor characteristics. The Joint Polar Satellite System VIIRS instruments intend to extend the VIIRS data records presented here for decades to come.

Author Contributions

Conceptualization, X.X.; methodology, C.L.P.D. and X.X.; formal analysis, C.L.P.D. and Y.L.; investigation, C.L.P.D. and Y.L.; writing—original draft preparation, C.L.P.D. and Y.L.; writing—review and editing, C.L.P.D., X.X and K.C. All authors have read and agreed to the published version of the manuscript.

Funding

This research received no external funding.

Institutional Review Board Statement

Not applicable.

Informed Consent Statement

Not applicable.

Data Availability Statement

Not applicable.

Acknowledgments

The authors would like to thank VCST member Tiejun Chang for his recommendations and suggestions. We would also like to thank previous members of the VIIRS Characterization Support Team for their technical support.

Conflicts of Interest

The authors declare no conflict of interest.

References

  1. Justice, C.O.; Romàn, M.O.; Csiszar, I.; Vermote, E.F.; Wolfe, R.E.; Hook, S.J.; Friedl, M.; Wang, Z.; Schaaf, C.B.; Miura, T.; et al. Land and cryosphere products from Suomi VIIRS: Overview and status. J. Geophys. Res. Atmos. 2013, 118, 9753–9765. [Google Scholar] [CrossRef] [PubMed] [Green Version]
  2. Wang, M.; Liu, X.; Tan, L.; Jiang, L.; Son, S.H.; Shi, W.; Rausch, K.; Voss, K. Impacts of VIIRS SDR performance on ocean color products. J. Geophys. Res. Atmos. 2013, 118, 10–347. [Google Scholar] [CrossRef]
  3. Jackson, J.; Liu, H.; Laszlo, I.; Kondragunta, S.; Remer, L.A.; Huang, J.; Huang, H.C. Suomi-NPP VIIRS Aerosol Algorithms and Data Products. J. Geophys. Res. 2013, 118, 12673–12689. [Google Scholar] [CrossRef]
  4. Joint Polar Satellite System (JPSS). VIIRS Radiometric Calibration Algorithm Theoretical Basis Document (ATBD); NASA Goddard Space Flight Center: Greenbelt, MD, USA, 2013. [Google Scholar]
  5. Xiong, X.; Butler, J.; Chiang, K.; Efremova, B.; Fulbright, J.; Lei, N.; McIntire, J.; Oudrari, H.; Sun, J.; Wang, Z.; et al. VIIRS on-orbit calibration methodology and performance. J. Geophys. Res. Atmos. 2014, 119, 5065–5078. [Google Scholar] [CrossRef]
  6. Cao, C.; Xiong, J.; Blonski, S.; Liu, Q.; Uprety, S.; Shao, X.; Bai, Y.; Weng, F. Suomi NPP VIIRS sensor data record verification, validation, and long-term performance monitoring. J. Geophys. Res. Atmos. 2013, 118, 11664–11678. [Google Scholar] [CrossRef]
  7. Cao, C.; Xiong, X.; Wolfe, R.; De Luccia, F.; Liu, Q.; Blonski, S.; Lin, G.; Nishihama, M.; Pogorzala, D.; Oudrari, H.; et al. Visible Infrared Imaging Radiometer Suite (VIIRS) Sensor Data Record (SDR) User’s Guide; NOAA Technical Report NESDIS; NOAA: College Park, MD, USA, 2013. [Google Scholar]
  8. Oudrari, H.; Mcintire, J.; Xiong, X.; Butler, J.; Lee, S.; Lei, N.; Schwarting, T.; Sun, J. Prelaunch Radiometric Characterization and Calibration of the SNPP VIIRS Sensor. IEEE Trans. Geosci. Remote Sens. 2015, 53, 2195–2210. [Google Scholar] [CrossRef]
  9. Wolfe, R.E.; Lin, G.; Nishihama, M.; Tewari, K.P.; Tilton, J.C.; Isaacman, A.R. Suomi NPP prelaunch and on-orbit geometric calibration and characterization. J. Geophys. Res. Atmos. 2013, 118, 11–508. [Google Scholar] [CrossRef] [Green Version]
  10. Wang, W.; Cao, C.; Ignatov, A.; Liang, X.; Li, Z.; Wang, L.; Zhang, B.; Blonski, S.; Li, J. Improving the Calibration of Suomi NPP VIIRS Thermal Emissive Bands during Blackbody Warm-Up/Cool-Down. IEEE Trans. Geosci. Remote Sens. 2019, 57, 1977–1994. [Google Scholar] [CrossRef]
  11. Eplee, R.E.; Turpie, K.R.; Meister, G.; Patt, F.S.; Franz, B.A. Updates to the on-orbit calibration of SNPP VIIRS for ocean color applications. In Earth Observing Systems XX; International Society for Optics and Photonics: Bellingham, WA, USA, 2015; p. 9607. [Google Scholar]
  12. Xiong, X.; Butler, J.; Wu, A.; Chiang, V.; Efremova, B.; Madhavan, S.; Mcintire, J.; Oudrari, H. Comparison of MODIS and VIIRS onboard blackbody performance. In Sensors, Systems, and Next-Generation Satellites XVI; International Society for Optics and Photonics: Bellingham, WA, USA, 2012; p. 8533. [Google Scholar]
  13. Efremova, B.; McIntire, J.; Moyer, D.; Wu, A.; Xiong, X. S-NPP VIIRS thermal emissive bands on-orbit calibration and performance. J. Geophys. Res. Atmos. 2014, 119, 10859–10875. [Google Scholar] [CrossRef] [Green Version]
  14. Wang, W.; Cao, C. NOAA-20 and S-NPP VIIRS Thermal Emissive Bands On-Orbit Calibration Algorithm Update and Long-term Performance Inter-Comparison. Remote Sens. 2021, 13, 448. [Google Scholar] [CrossRef]
  15. McIntire, J.; Efremova, B.; Xiong, X. Calibration of NPP VIIRS fire detection band using lunar observations. In Sensors, Systems, and Next-Generation Satellites XVI; International Society for Optics and Photonics: Bellingham, WA, USA, 2012; p. 85331B. [Google Scholar] [CrossRef]
  16. Cao, C.; Wang, W.; Blonski, S.; Zhang, B. Radiometric traceability diagnosis and bias correction for the Suomi NPP VIIRS longwave infrared channels during blackbody unsteady states. J. Geophys. Res. Atmos. 2017, 122, 5286–5297. [Google Scholar] [CrossRef]
  17. Bouali, M.; Ignatov, A. Adaptive Reduction of Striping for Improved Sea Surface Temperature Imagery from Suomi National Polar-Orbiting Partnership (S-NPP) Visible Infrared Imaging Radiometer Suite (VIIRS). J. Atmos. Ocean. Technol. 2014, 31, 150–163. [Google Scholar] [CrossRef]
  18. Wu, A.; Xiong, X.; Chiang, K.; Sun, C. Assessment of the NPP VIIRS RVS for the thermal emissive bands using the first pitch maneuver observations. In Earth Observing Systems XVII; International Society for Optics and Photonics: Bellingham, WA, USA, 2012; p. 8510. [Google Scholar]
  19. Wu, A.; Xiong, X.; Chiang, K. Postlaunch assessment of the response versus scan angle for the thermal emissive bands of visible infrared imaging radiometer suite on-board the Suomi national polar-orbiting partnership satellite. J. Appl. Remote Sens. 2017, 11, 044002. [Google Scholar] [CrossRef]
  20. Wu, A.; McIntire, J.; Xiong, X.; de Luccia, F.J.; Oudrari, H.; Moyer, D.; Xiong, S.; Pan, C. Comparison of VIIRS pre-launch RVS performance using results from independent studies. In Earth Observing Systems XVI; International Society for Optics and Photonics: Bellingham, WA, USA, 2011; p. 8153. [Google Scholar]
  21. Pérez Díaz, C.L.; Xiong, X.; Wu, A.; Chang, T. Terra and Aqua MODIS Thermal Emissive Bands Calibration and RVS Stability Assessments Using an In Situ Ocean Target. IEEE Trans. Geosci. Remote Sens. 2021, 1–14. [Google Scholar] [CrossRef]
  22. Pérez Díaz, C.L.; Xiong, X. S-NPP and NOAA-20 VIIRS thermal emissive bands calibration stability assessments using an in situ ocean target. In Earth Observing Systems XXVI; International Society for Optics and Photonics: Bellingham, WA, USA, 2021; Volume 11829, p. 11829E. [Google Scholar] [CrossRef]
  23. Li, Y.; Xiong, X.; McIntire, J.; Wu, A. Comparison of the MODIS and VIIRS Thermal Emissive Band Radiometric Calibration. IEEE Trans. Geosci. Remote Sens. 2020, 58, 4852–4859. [Google Scholar] [CrossRef]
  24. McIntire, J.; Efremova, B.; Xiong, X. S-NPP VIIRS On-Orbit Uncertainty Estimate for Emissive Bands. In Proceedings of the CALCON 2013, Logan, UT, USA, 19–22 August 2013. [Google Scholar]
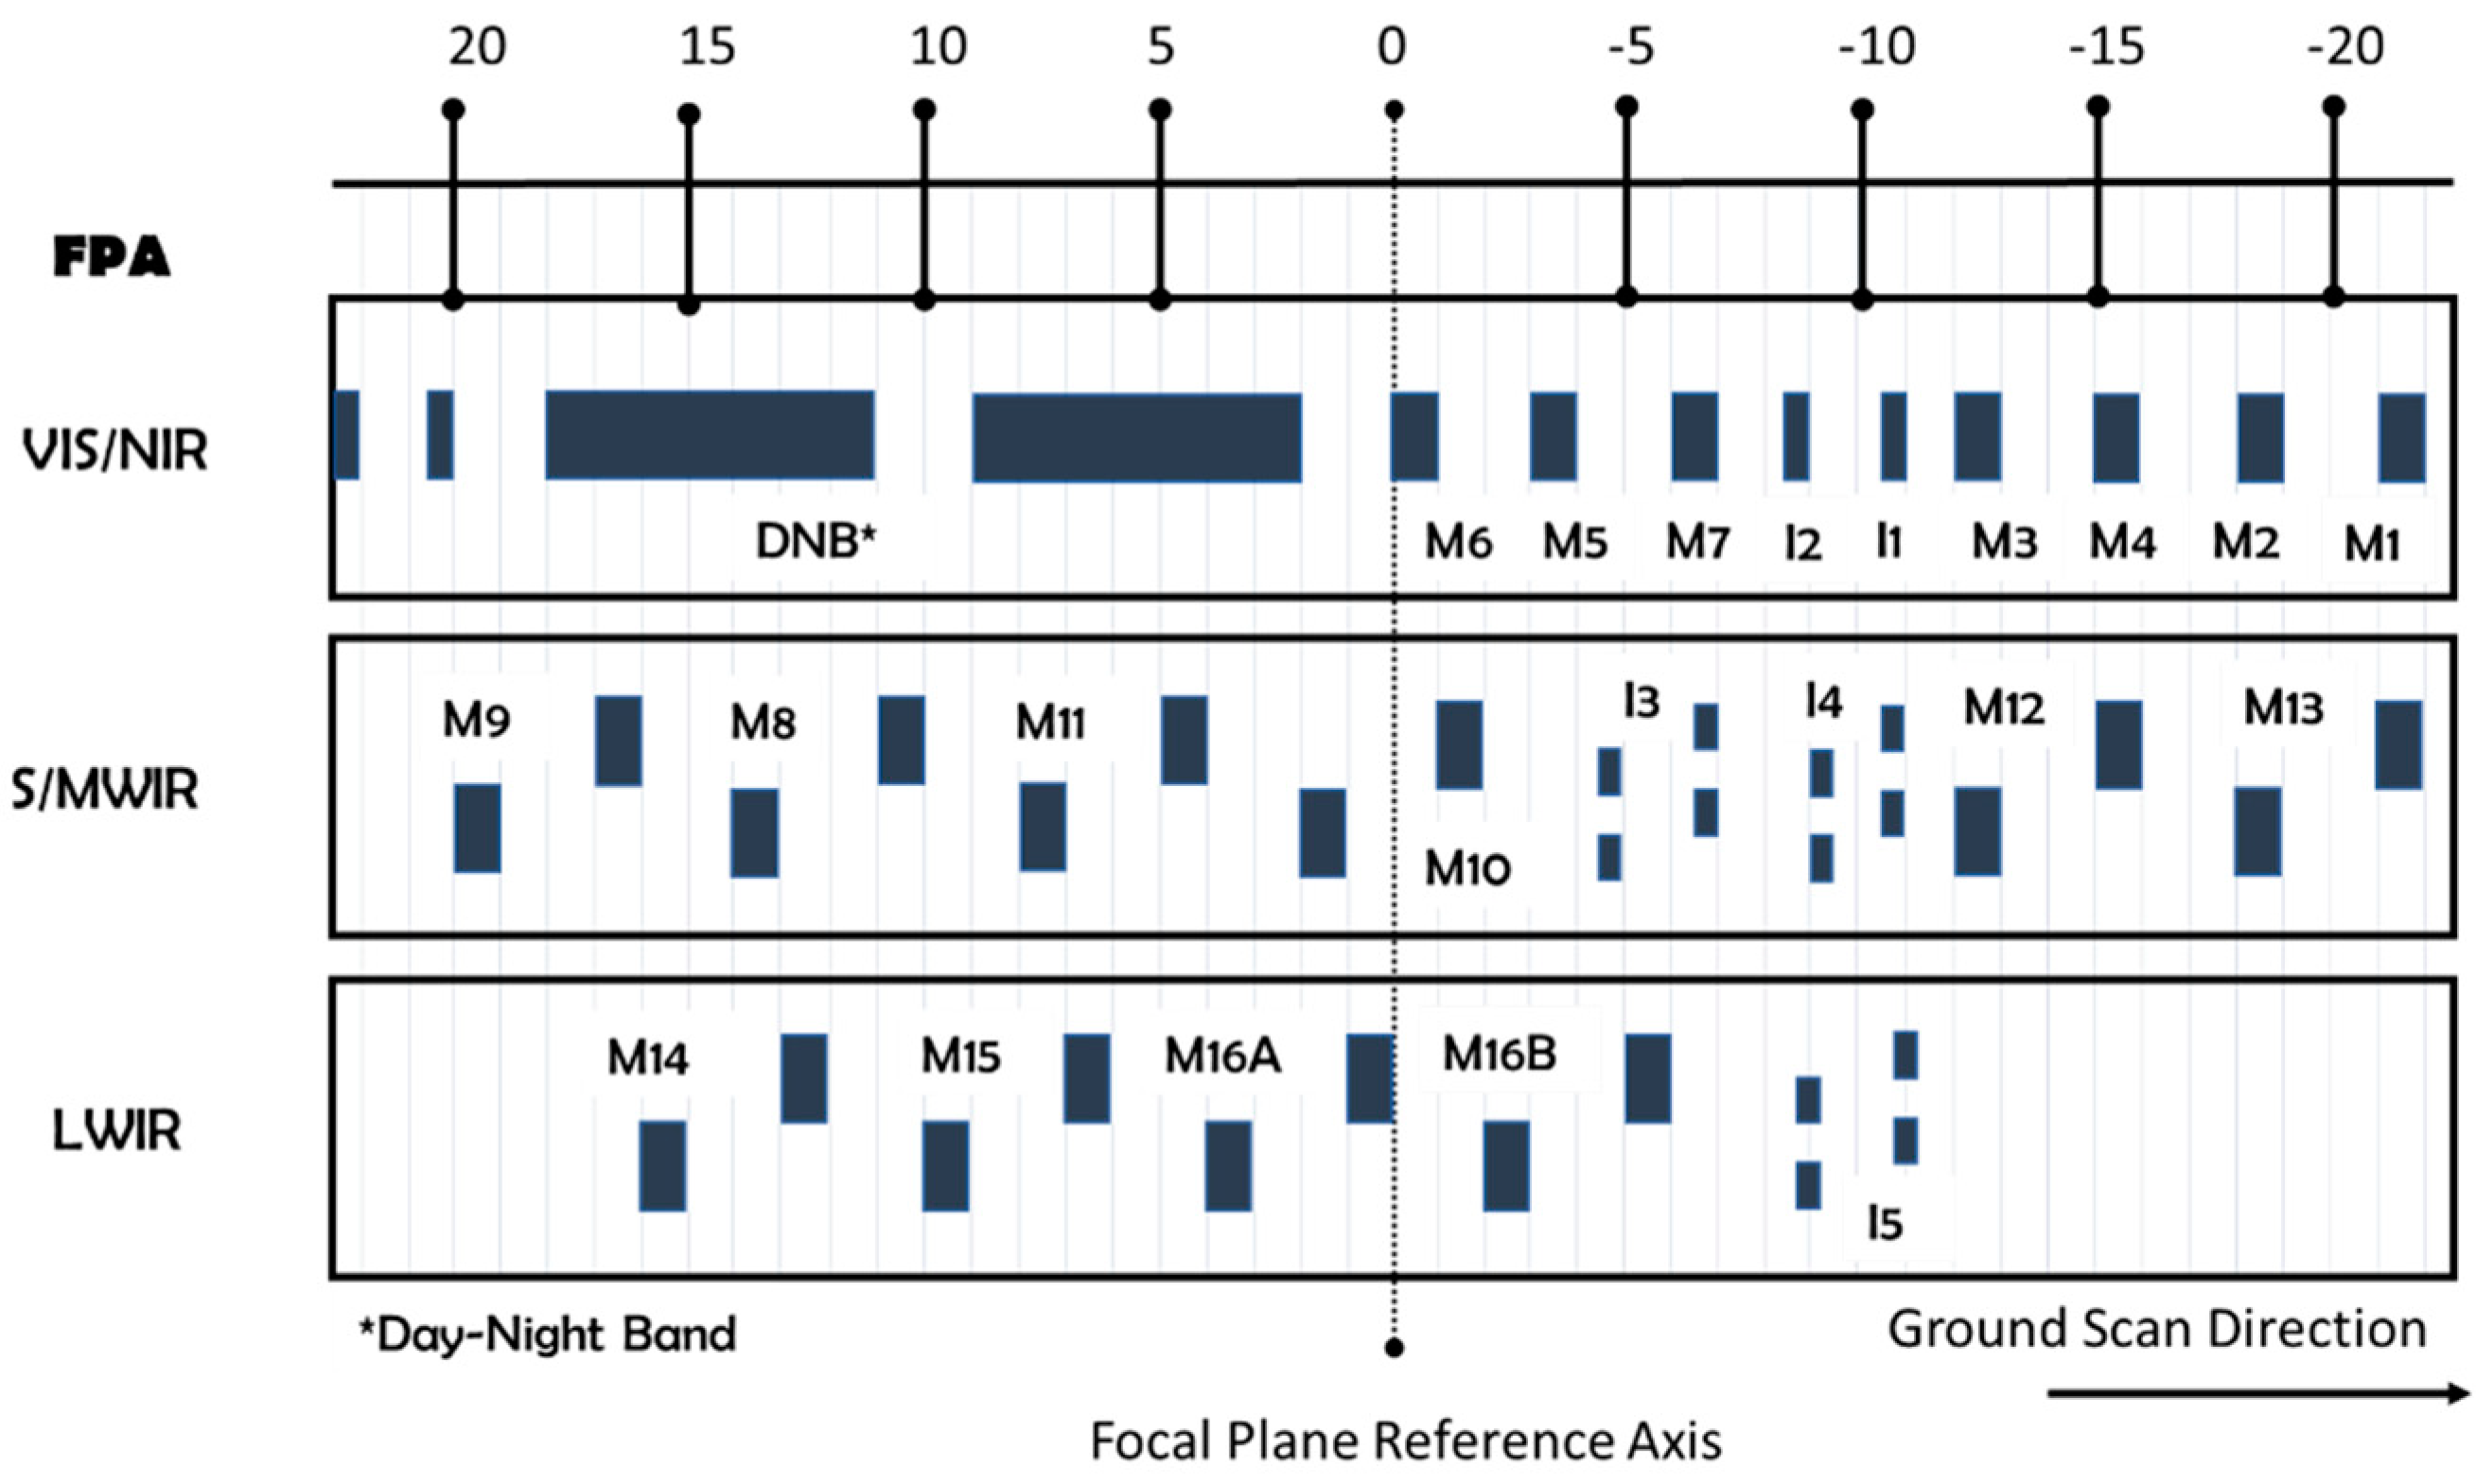
Figure 1. VIIRS FPAs: VIS/NIR, S/ MWIR, and LWIR. The VIIRS band layout is in the scan direction. The M- and I-bands have 16 and 32 detectors in the track direction, respectively. Values at the top of the figure represent each band’s position in M-band sampling interval units relative to the focal plane reference axis. These values also define the relative number of samples removed at the EV beginning-of-scan for alignment. The Day-Night Band illustrates four detector arrays in three gain stages and is not to scale.
Remotesensing 13 03917 g001
Figure 2. S-NPP VIIRS BB (a) temperature and (b) uniformity with requirement (red line) throughout an entire WUCD operation from 15 March to 17 March 2021.
Remotesensing 13 03917 g002
Figure 3. S-NPP VIIRS (a) average BB temperature and (b) BB uniformity for three orbits on 1 February 2021. Horizontal red line represents the BB uniformity requirement of 30 mK. Values are on a per scan basis.
Remotesensing 13 03917 g003
Figure 4. S-NPP VIIRS (a) BB temperature; (b) inputs to the thermal model: HAM, RTA, scan cavity (CAV), and BB shield (SH) temperatures; (c) electronics (ASP) and instrument opto-mech module (OMM) temperatures; and (d) cold FPAs temperatures over the entire mission. Values are daily-averaged.
Remotesensing 13 03917 g004
Figure 5. Schematic simplification of the RTA as it rotates and views the sectors (with their respective scan angles) used for the VIIRS TEB calibration. Not to scale.
Remotesensing 13 03917 g005
Figure 6. S-NPP VIIRS TEB band-averaged gains (1/F-factor) during nominal operations over the entire mission. Values are normalized to 20 January 2012. Only HAM-side A is illustrated.
Remotesensing 13 03917 g006
Figure 7. S-NPP VIIRS bands (a) I4 (detector 16, Product Order) and (b) M14 (detector 8, Product Order) normalized F-factors during nominal operations on 1 February 2021. Values are shown on a granule-averaged and scan-by-scan basis and are normalized to the first data point of the day. Only HAM-side A is illustrated. Note: Throughout this paper, the detectors are listed/numbered in Product Order. This means that the highest numbered detector (e.g., detector 16 for the M-bands and detector 32 for the I-bands) of a given scan is adjacent to detector 1 in the next scan. This is opposite to the prelaunch numbering convention (also known as Santa Barbara Remote Sensing (SBRS) Order), which is reversed.
Remotesensing 13 03917 g007
Figure 8. S-NPP VIIRS bands I4 (detector 16, Product Order) and M14 (detector 8, Product Order) F-factors and BB temperature during WUCD event performed from 15 March to 17 March 2021. Values shown are granule-averaged. Only the F-factors for HAM-side A are illustrated. The M14 F-factors were shifted upward by 2.75% so that these can be in the same range as the I4 F-factors.
Remotesensing 13 03917 g008
Figure 9. S-NPP VIIRS TEB band-averaged NEdT/Spec. during nominal operations (BB temperature at ~ 292.7 K) over the entire mission. Only HAM-side A is illustrated.
Remotesensing 13 03917 g009
Figure 10. S-NPP VIIRS TEB band-averaged on-orbit-derived ( c 0 o n o r b i t , c 1 o n o r b i t , and c 2 o n o r b i t ) calibration coefficients for (ac) I4, (df) I5, (gi) M12, (jl) M13, (mo) M14, (pr) M15, and (su) M16 over the entire mission. Results are separated into WU and CD processes. Prelaunch coefficients are also included and defined by horizontal black lines. Only HAM-side A is illustrated.
Remotesensing 13 03917 g010
Figure 11. S-NPP VIIRS pitch-to-prelaunch RVS ratios for all TEB. Results are averaged for HAM-side A.
Remotesensing 13 03917 g011
Figure 12. S-NPP VIIRS bands M13 and M15 BT and in situ SST over ocean scene near Hawaii Islands. Results between VIIRS and SST are collocated in space and coincident in time. The brightness temperatures for the VIIRS bands are monthly-averaged. The in situ SST are nighttime observations only. Time series start on 20 January 2012. Data gaps in SST observations are due to outages.
Remotesensing 13 03917 g012
Figure 13. S-NPP VIIRS-IASI BT difference (ΔBT) time series for bands M13 and M15 at IASI-simulated M15 BT centered at 220 K, 240 K, and 260 K (described by different colors) with bin sizes of ±5 K. Empty symbols define IASI-A, while filled symbols represent IASI-C. Brightness temperature units are in Kelvin.
Remotesensing 13 03917 g013
Table 1. VIIRS TEB design specifications including minimum (Tmin), typical (Ttyp), and maximum (Tmax) scene temperatures. NEdT Spec. stands for NEdT specification at Ttyp.
FPABandSpatial Resolution at Nadir (m)Spectral
Range
(µm)
Band GainTmin
(K)
Ttyp
(K)
Tmax
(K)
NEdT Spec. (K)
S/MWIRM127503.660–3.840Single2302703530.396
I43753.550–3.930Single2302703532.5
M137503.973–4.128High
Low
210
343
300
380
343
634
0.107
0.423
LWIRM147508.400–8.700Single1902703360.091
M1575010.263–11.263Single1903003430.07
I537510.500–12.400Single1902103401.5
M1675011.538–12.488Single1903003400.072
Table 2. Significant events for S-NPP VIIRS on-orbit operation and TEB calibration.
DateEvent Description
28 October 2011S-NPP launch
8 November 2011VIIRS turned on
18 November 2011RTA/HAM sync loss
21 November 2011Nadir door open
25 November 2011First VIIRS safe mode that caused single board computer lock-up *
18 January 2012Cryo-cooler door open
6 February 2012First BB warm-up and cool-down (frequency: quarterly) **
15 February 2012Yaw maneuver (fifteen orbits)
20 February 2012Pitch maneuver
24 March 2012Spacecraft anomaly: Sun point mode
21 June 2018BB warm-up and cool-down frequency changed to once a year
1 February 2019VIIRS control processor reset
* Up to this date, 15 single board computer lock-up/petulant mode events have been registered. ** There have been a total of 28 BB warm-up and cool-down events as of 31 December 2021.
Table 3. VIIRS TEB calibration algorithm acronyms and definitions. Listed in order of appearance.
AcronymDefinition
L E V Retrieved EV spectral radiance
F Calibration scaling factor
c i Prelaunch calibration coefficients
d n E V Background-subtracted EV detector response
R V S E V EV response-versus-scan-angle
R V S S V SV response-versus-scan-angle (=1)
L b g Instrument background radiance difference
ρ R T A RTA reflectivity
L R T A RTA emitted radiance
L H A M HAM emitted radiance
L B B _ t h e r m a l _ m o d e l Modeled BB spectral radiance
L B B _ p r e l a u n c h Retrieved BB radiance
d n B B Background-subtracted BB detector response
L B B BB radiance
R V S B B BB response-versus-scan-angle
Table 4. S-NPP VIIRS TEB band-averaged NEdT values at Ttyp. The NEdT values were extracted from the BB CD data. NEdT units are in Kelvin. PL stands for prelaunch.
TEBI4I5M12M13M14M15M16
NEdT Req.2.51.50.3960.1070.0910.0700.072
TimePL0.4100.4200.1300.0440.0610.0300.038
20120.4060.3950.1230.0420.0560.0290.028
20160.4060.3970.1170.0400.0550.0270.029
20210.4080.4030.1170.0400.0550.0270.029
Table 5. S-NPP VIIRS-buoy temperature change rates for each TEB. VIIRS data are L1B calibrated radiance converted to BT. Buoy data are SST observations. Both datasets are collocated in space and coincident in time.
TEBI4I5M12M13M14M15M16
Change Rate (K/year)0.0010.001−0.0130.019−0.0020.0000.001
Table 6. Average ΔBT between SNPP VIIRS and IASI-A/C at different BT levels. All units are in Kelvin.
BandSNPP-IASI/ASNPP-IASI/C
220240260220240260
I4−6.79 ± 1.40−1.42 ± 0.24−1.16 ± 0.12−6.90 ± 1.86−1.41 ± 0.18−1.20 ± 0.13
I50.03 ± 0.080.01 ± 0.060.02 ± 0.06−0.04 ± 0.04−0.04 ± 0.06−0.04 ± 0.06
M12−7.42 ± 1.45−1.43 ± 0.32−0.58 ± 0.08−7.55 ± 2.24−1.40 ± 0.24−0.60 ± 0.11
M13−0.45 ± 0.430.19 ± 0.070.10 ± 0.04−0.54 ± 0.340.21 ± 0.040.09 ± 0.04
M14−0.24 ± 0.10−0.19 ± 0.07−0.16 ± 0.05−0.16 ± 0.03−0.17 ± 0.05−0.18 ± 0.05
M15−0.14 ± 0.07−0.12 ± 0.05−0.09 ± 0.06−0.21 ± 0.04−0.18 ± 0.06−0.16 ± 0.06
M160.04 ± 0.080.01 ± 0.060.01 ± 0.06−0.04 ± 0.04−0.05 ± 0.07−0.06 ± 0.07
Publisher’s Note: MDPI stays neutral with regard to jurisdictional claims in published maps and institutional affiliations.