Abstract
In situ sea surface temperatures (SST) are the key component of the calibration and validation (Cal/Val) of satellite SST retrievals and data assimilation (DA). The NOAA in situ SST Quality Monitor (iQuam) aims to collect, from various sources, all available in situ SST data, and integrate them into a maximally complete, uniform, and accurate dataset to support these applications. For each in situ data type, iQuam strives to ingest data from several independent sources, to ensure most complete coverage, at the cost of some redundancy in data feeds. The relative completeness of various inputs and their consistency and mutual complementarity are often unknown and are the focus of this study. For four platform types customarily employed in satellite Cal/Val and DA (drifting buoys, tropical moorings, ships, and Argo floats), five widely known data sets are analyzed: (1) International Comprehensive Ocean-Atmosphere Data Set (ICOADS), (2) Fleet Numerical Meteorology and Oceanography Center (FNMOC), (3) Atlantic Oceanographic and Meteorological Laboratory (AOML), (4) Copernicus Marine Environment Monitoring Service (CMEMS), and (5) Argo Global Data Assembly Centers (GDACs). Each data set reports SSTs from one or more platform types. It is found that drifting buoys are more fully represented in FNMOC and CMEMS. Ships are reported in FNMOC and ICOADS, which are best used in conjunction with each other, but not in CMEMS. Tropical moorings are well represented in ICOADS, FNMOC, and CMEMS. Some CMEMS mooring reports are sampled every 10 min (compared to the standard 1 h sampling in all other datasets). The CMEMS Argo profiling data set is, as expected, nearly identical with those from the two Argo GDACs.
Keywords:
iQuam; in situ SST; ICOADS; FNMOC; CMEMS; AOML; drifters; tropical moorings; ships; Argo floats; data completeness 1. Introduction
In situ sea surface temperatures (SST) play a critical role in the calibration and validation (Cal/Val) of satellite SST retrievals and data assimilation (DA) (see, e.g., in [1,2,3,4,5,6,7,8,9,10]). However, the quality and completeness of in situ SST observations is not always optimal. On the one hand, a small portion of outliers included in the Cal/Val matchup database may lead to untrustworthy results. On the other hand, discarding some unexplained but correct in situ measurements could miss important climate or diurnal warming signals (see, e.g., in [11,12]). To fuse in situ SST observations from all available sources and provide their uniform quality control (QC), and thus facilitate their use for Cal/Val and DA applications of satellite retrievals, the in situ SST Quality Monitor (iQuam) system was developed at the National Oceanic and Atmospheric Administration (NOAA) in 2009. The iQuam strives to provide the most authoritative in situ SST standard, for the satellite era, which is both maximally complete and uniformly quality controlled using a flexible, community consensus QC algorithm [12,13]. The iQuam collects both real-time and delayed mode in situ SST measurements obtained from different platforms and applies an advanced and systematic QC to the original measurements. These QC schemes consist of basic screenings, such as duplicate removal, plausibility and SST spike checks, and Bayesian reference and buddy checks [12]. These QC’d observations are then displayed and monitored online, both spatially and in time series. Finally, iQuam freely distributes these QC’d measurements to users. Note that some of the external data sources have their own QCs [13]. These QCs are not applied in iQuam but retained in the final products to facilitate data use for more advanced users.
In the current iQuam version 2.10, in situ SSTs from the following platforms are reported: drifting buoys (including heritage and high-resolution, HR, drifters [14,15]), ships (including vessels of opportunity, research vessels, commercial ships, and the Integrated Marine Observing System, IMOS, ships [16]), coastal and tropical moorings, and Argo floats. Redundancy is one of the key iQuam principles. Whenever possible, SST data are collected from more than one data source, to provide back-up (in case of occasional outages in individual feeds) and ensure a more complete coverage, by taking advantage of their complementarity. For example, drifting buoys in the current iQuam v2.10 come from three sources: (1) the International Comprehensive Ocean-Atmosphere Data Set (ICOADS), (2) the Fleet Numerical Meteorology and Oceanography Center (FNMOC), and (3) the NOAA National Centers for Environmental Prediction (NCEP) Global Telecommunications System (GTS) data stream. These three datasets are not identical due to their different inputs and processing. The relative completeness and complementarity of different data sets is often unknown and is the focus of this study.
Our immediate objective was to evaluate several data sources, currently ingested or under consideration for future ingestion, in iQuam, and minimize the data redundancy, while still keeping the in situ SST observations for the satellite era maximally complete in iQuam. Ranking their relative uniqueness largely determines the order in which they are being ingested, with most complete and reliable data feeds prioritized and ingested first. More broadly, these analyses will benefit wider remote sensing and DA communities, if they prefer using the source datasets (ICOADS, FNMOC, etc.) directly and not via iQuam, by informing users of their relative merit and completeness.
2. Data Sets
Not all data sources currently ingested in iQuam are analyzed in this paper. For example, the current NCEP GTS data employed in iQuam v2.10 will be discontinued in the next release because they only report the 5-digit World Meteorological Organization (WMO) IDs in Traditional Alphanumeric Code (TAC) format, and missing all reports with the new 7-digit WMO IDs in BUFR format (Binary Universal Form for the Representation of meteorological data) since November 2016. At the same time, some data products are currently under consideration for possible future incorporation into iQuam (e.g., the Copernicus Marine Environment Monitoring Service, CMEMS) and therefore included in this study. Data sources are briefly introduced below. Two full years of data from all described datasets (January 2016–December 2017) are consistently analyzed for most platforms (except for Argo; see details in Section 3.4). Recall that since November 2016, all newly deployed drifting and moored buoys have been using 7-digit WMO identifiers (rather than the previously used 5-digit IDs), as the BUFR format of meteorological data was widely adopted in the GTS data transmission. Evaluation of whether this TAC to BUFR transition was properly captured in various data sets is part of the motivation for the selection of this two-year period.
2.1. ICOADS
ICOADS is a collection of surface marine observations widely used for the construction of gridded SST analyses, estimates of air–sea interaction and other meteorological and oceanographic applications (see, e.g., in [17]). The ICOADS was first released in 1985. As of this writing, release 3.0 (R3.0; delayed mode, covering 1662–2014 and comprising over 455 million individual marine reports) is available, in conjunction with the near real time (NRT) R3.0.1 update (covering from Jan 2015 to present [18,19]). A comprehensive Quality Flag (QF) is provided. In this study, measurements from drifting buoys, ships, and coastal and tropical moorings from ICOADS R3.0.1 are evaluated for years 2016–2017.
2.2. FNMOC
Another data source used in iQuam is the United States Global Ocean Data Assimilation Experiment (GODAE) Fleet Numerical Meteorology and Oceanography Center (FNMOC) data set (https://www.usno.navy.mil/FNMOC, accessed on 16 September 2021). The FNMOC provides the highest quality worldwide meteorological and oceanographic support to the U.S. and coalition forces. FNMOC data are being processed and updated in NRT but require 2 to 8 days to acquire a complete record [20]. In situ SSTs in FNMOC are collected from multiple platforms, with the bulk of data coming from GTS, complemented by a few additional unspecified data sources. The data are available from September 1998 onward. A continuous quality indicator (QI) is appended to each data record. Similarly to ICOADS, FNMOC SST measurements from drifting buoys, ships, and tropical and coastal moorings will be analyzed below, for the same period from 2016–17.
2.3. AOML Drifting Buoys
Another drifting buoy data set is now being considered for ingestion into iQuam and therefore included in this study: the Global Drifter Program (GDP) dataset produced at the NOAA Atlantic Oceanographic and Meteorological Laboratory (AOML). The GDP is the principal component of the Global Surface Drifting Buoy Array, a branch of NOAA’s Global Ocean Observing System (GOOS) and a scientific project of the Data Buoy Cooperation Panel (DBCP). In conjunction with the Scripps Institution of Oceanography (SIO [21]), the AOML coordinates deployments of drifters, processes and archives the data, maintains metadata files describing each drifter deployed, and develops and distributes products [22].
A dataset consisting of separate position and temperature files from the late 1970s to present with hourly temporal resolution and proper QC was provided by the AOML (R. Lumpkin and M. Pazos, 2020, personal communication). Note that the AOML only houses and processes the Surface Velocity Program (SVP) type drifters that are drogued (nominally, at ~15 m depth). Undrogued buoys, or those drogued at different depths, are not included in the AOML dataset (M. Pazos, 2020, personal communication). Consistently with other data sets, the same two years (2016–2017) of AOML data are analyzed.
2.4. CMEMS
Another data source under consideration for potential incorporation into iQuam is the Copernicus Marine Environment Monitoring Service (CMEMS), which reports a comprehensive set of ocean data. The European Copernicus Program includes three key components: space, in situ, and services. In situ data, in conjunction with satellite data, provide robust integrated information for a variety of applications including DA and Cal/Val of satellite retrievals [23]. Out of all CMEMS products, the global ocean historical in situ data dating back to 1950 and the NRT data set starting from 2010 are potentially useful for iQuam. These data sets are collected from main global networks, e.g., Argo; the Global Ocean Surface Underway Data (GOSUD; www.gosud.org/, accessed on 16 September 2021); Ocean Sustained Interdisciplinary Time-series Environment Observation System (OceanSITES; www.oceansites.org/, accessed on 16 September 2021), World Ocean Database (WOD; www.ncei.noaa.gov/products/world-ocean-database, accessed on 16 September 2021), etc., complemented by European Global Ocean Observing System (EUROGOOS; https://eurogoos.eu/, accessed on 16 September 2021) regional and national systems.
The data are QC’d using automated procedures and updated continuously within 24–48 h from acquisition, on average. Measurements from drifting buoys, coastal, and tropical moorings and Argo floats are analyzed. Ship reports are currently not available in NRT CMEMS and therefore excluded from current analyses. The CMEMS NRT in situ data for two years (2016–2017) are analyzed.
2.5. Argo Floats
The Argo program has created the first global array for observing the subsurface ocean (see, e.g., in [24]). The float program and its data management system began with regional arrays in 1999, scaled up to global deployments by 2004, and achieved its target of ~3000 active floats in 2007 (see, e.g., in [25]). Given that Argo floats can carry more than one sensor and all sensors may sample the water profile to different depths at different intervals, Argo data are more complex than the surface platforms such as drifting buoys. Two key concepts are important to understand the Argo data and illustrated here.
1. Argo primary and auxiliary sensors. All Argo floats are equipped with a primary Conductivity-Temperature-Depth (CTD) sensor, which can measure profiles of sea temperature and salinity up to 2000 m depth with a typical 10-day cycle. Usually, Argo floats do not sample above the ~4–5 dbar (4–5 m) depth, where the primary CTD’s pump shuts off to protect the salinity sensor. However, several float types are equipped with a secondary sensor and can continue sampling data closer to the surface, with the pump on or off. Due to the strong interest in the near-surface layers from the remote sensing community, some Argo floats also carry auxiliary modules for high-resolution near-surface samplings [26]. A limited number of experimental Argo floats deployed since 2008, carry an auxiliary Surface Temperature and Salinity (STS) CTD sensor, to sample the top layer of the ocean up to approximately 20 cm depth at a step of ~10 cm [27].
2. Vertical sampling scheme (VSS). The VSS describes pressure levels at which a sensor measures the water profile. According to the Argo user manual, there are at least four VSSs: primary, secondary, near-surface, and bounce VSS. A primary VSS refers to measurements that are taken at the same standard pressure levels, and with the same sampling method, as the primary CTD profile. A secondary VSS profile includes measurements that are taken at pressure levels different from the primary CTD profile. A near-surface VSS profile typically includes measurements in the top 5 dbar (meters) of the sea surface (although for the purpose of cross-calibration, it can extend deeper than the top 5 dbar (meters), to overlap with the primary sampling profile. These measurements are taken at pressure levels different from the primary CTD profile). The last VSS, bounce sampling, is less commonly seen. This scheme contains profiles that are collected on multiple rises and falls during a single cycle. A single-cycle file may have one (i.e., primary) or multiple profiles, which can be differentiated and identified by their VSSs.
Note that the various VSSs profiles can be generated by both the primary and auxiliary sensors. The same word “primary” may be used to describe a sensor or a VSS, causing some confusion. We will avoid such confusing usage in this study.
Argo’s data are freely available at the two Global Data Assembly Centers (GDACs), one in Monterey, California, USA (ftp://usgodae.org/pub/outgoing/argo, accessed on 16 September 2021), and the other one in Brest, France (ftp://ftp.ifremer.fr/ifremer/argo, accessed on 16 September 2021). All data and contents from these two GDACs’ sites mirror each other and, by design, should be identical. Another place to access Argo data is the CMEMS profiling data set. When a new Argo file (real time or delayed mode) is received and included in the Argo Coriolis GDAC, it is also loaded or updated in the CMEMS (note that the Coriolis GDAC and CMEMS are collocated, in the same data center) (S. Tarot, personal communication). Therefore, by design, the CMEMS profiling data, although reported in a slightly different format, should be identical to those in the IFREMER (French Research Institute for Exploitation of the Sea) Coriolis GDAC, and may be viewed as their backup (or copy), in case they are interpreted consistently. This expectation will be further verified in this study. Instead of two years, only three months’ (1 January–31 March 2016) of Argo data are used, due to the large data volumes.
Note that the three comprehensive data sets—ICOADS, FNMOC, and CMEMS—comprise SSTs from multiple platform types, whereas the other two data sets, AOML drifters and Argo GDAC, are platform-specific. A summary of the platform types included in each data source is listed in Table 1.

Table 1.
The platform types included in each data set in this study. Y stands for Yes and N for No.
3. Results
This section analyzes the completeness and complementarity of different data holdings for the four observational platforms. Focus is on the number of platform IDs; the number of measurements is only discussed where large differences between the sources are observed. Recall that although some data sources (e.g., ICOADS, FNMOC, and CMEMS) come with their own QC schemes, they are not applied in this study (or in iQuam). All the analyses are conducted on the original, hence most complete, data sets.
3.1. Drifting Buoys
Drifting buoys have always been one of the most important in situ data references in satellite Cal/Val and DA. Recall that they measure SST at ~20 cm depth. In this section, drifters’ holdings in four products are investigated: ICOADS, AOML, CMEMS, and FNMOC. Note that in years 2016–2017, some data sets only reported 5-digit IDs (ICOADS R3.0.1), while some others contained a mix of 5- and 7-digit IDs (e.g., CMEMS and FNMOC). In iQuam, all 5-digit IDs are converted into the equivalent 7-digit IDs following the WMO rule, i.e., by inserting two zeros between the second and third digits, right after the regional area and subarea codes (https://community.wmo.int/rules-allocating-wmo-numbers, accessed on 16 September 2021). After standardizing IDs, the number of unique IDs (UIDs) is calculated. In this analysis, the sum of all the UIDs seen in all four products is considered as 100%.
The summary of the number of UIDs and observations (Nobs) in each data set is shown in Table 2. Combining all data sets defines a total of N = 4020 UIDs, which is considered as 100% in this analysis. The UID numbers found in FNMOC (N = 3798) and CMEMS (N = 3776) are similar, accounting for 94.5% and 93.9% of total UIDs, respectively. Fewer UIDs are observed in the AOML data set (N = 3294; 81.9%), which recall only reports SVP drifters drogued at ~15 m. Note that there are only N = 1974 UIDs included in ICOADS R3.0.1, due to missing all newly deployed 7-digit ID buoys in BUFR format after Nov 2016. ICOADS team is working on R3.0.2 which will include the BUFR data with the “true” 7-digit IDs. Pending its official release in 2022, ICOADS R3.0.1 is excluded from the following analyses in this section, and only three data sets are analyzed.
Table 2.
The number of unique IDs (UIDs) and observations (Nobs) in four data sets. The total is a logical sum of all UIDs observed in the top three sources (excluding ICOADS) and set as 100%. The ICOADS row is shaded to indicate that these data are discarded from the following analyses.
The result is also shown in graphical form in Figure 1. Out of the N = 4020 UIDs, there are N = 3172 (78.9%) shared by all three data sets (FNMOC, CMEMS, and AOML). This “intersection” number is largely determined by the AOML (which only reports SVP drifters drogued at ~15 m), whereas the FNMOC and CMEMS share more UIDs with each other: N = 3690 (91.8%) including those 518 UIDs not found in AOML. Note that there are 70–83 (1.7–2.1%) UIDs found only in one of the three data sets, suggesting that using all three feeds makes the iQuam dataset more complete.
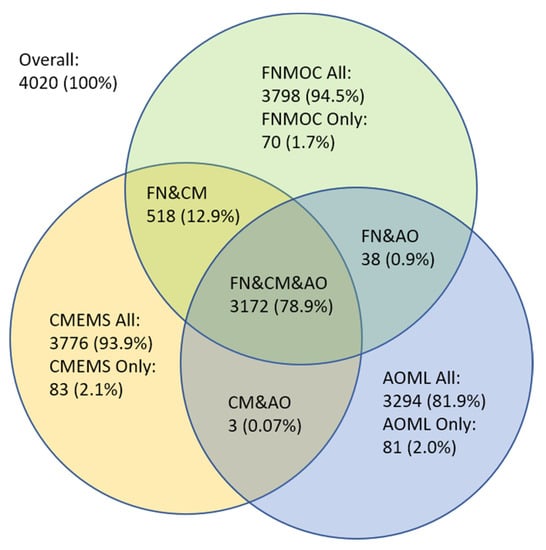
Figure 1.
Distribution of drifters’ UIDs across the three data sets: FNMOC, CMEMS, and AOML.
Spatial distributions of the UIDs shared by various pairs of the three data sets are shown in Figure 2. The 518 buoys shared by FNMOC and CMEMS (but not AOML) are shown in Figure 2a. They are spread around pretty much all over the global oceans, with the majority clustering in the North Atlantic Ocean, and some also found in the Indian and Pacific Oceans (particularly in the Kuroshio Current area). Quite some buoys are seen in the Arctic seas. The 38 UIDs shared between FNMOC and AOML (but not CMEMS) are shown in Figure 2b. Most of them are found around the Southeast Asia, from the Bay of Bengal to the South China Sea and the Kuroshio Current region. Finally, only three UIDs are shared by CMEMS and AOML (but not FNMOC), all in the eastern Mediterranean Sea (Figure 2c).
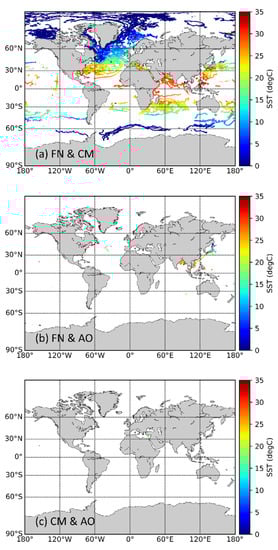
Figure 2.
The UIDs shared by two out of the three data sets: (a) 518 UIDs by FNMOC & CMEMS; (b) 38 by FNMOC & AOML; and (c) 3 by CMEMS & AOML. Color bar indicates the SST.
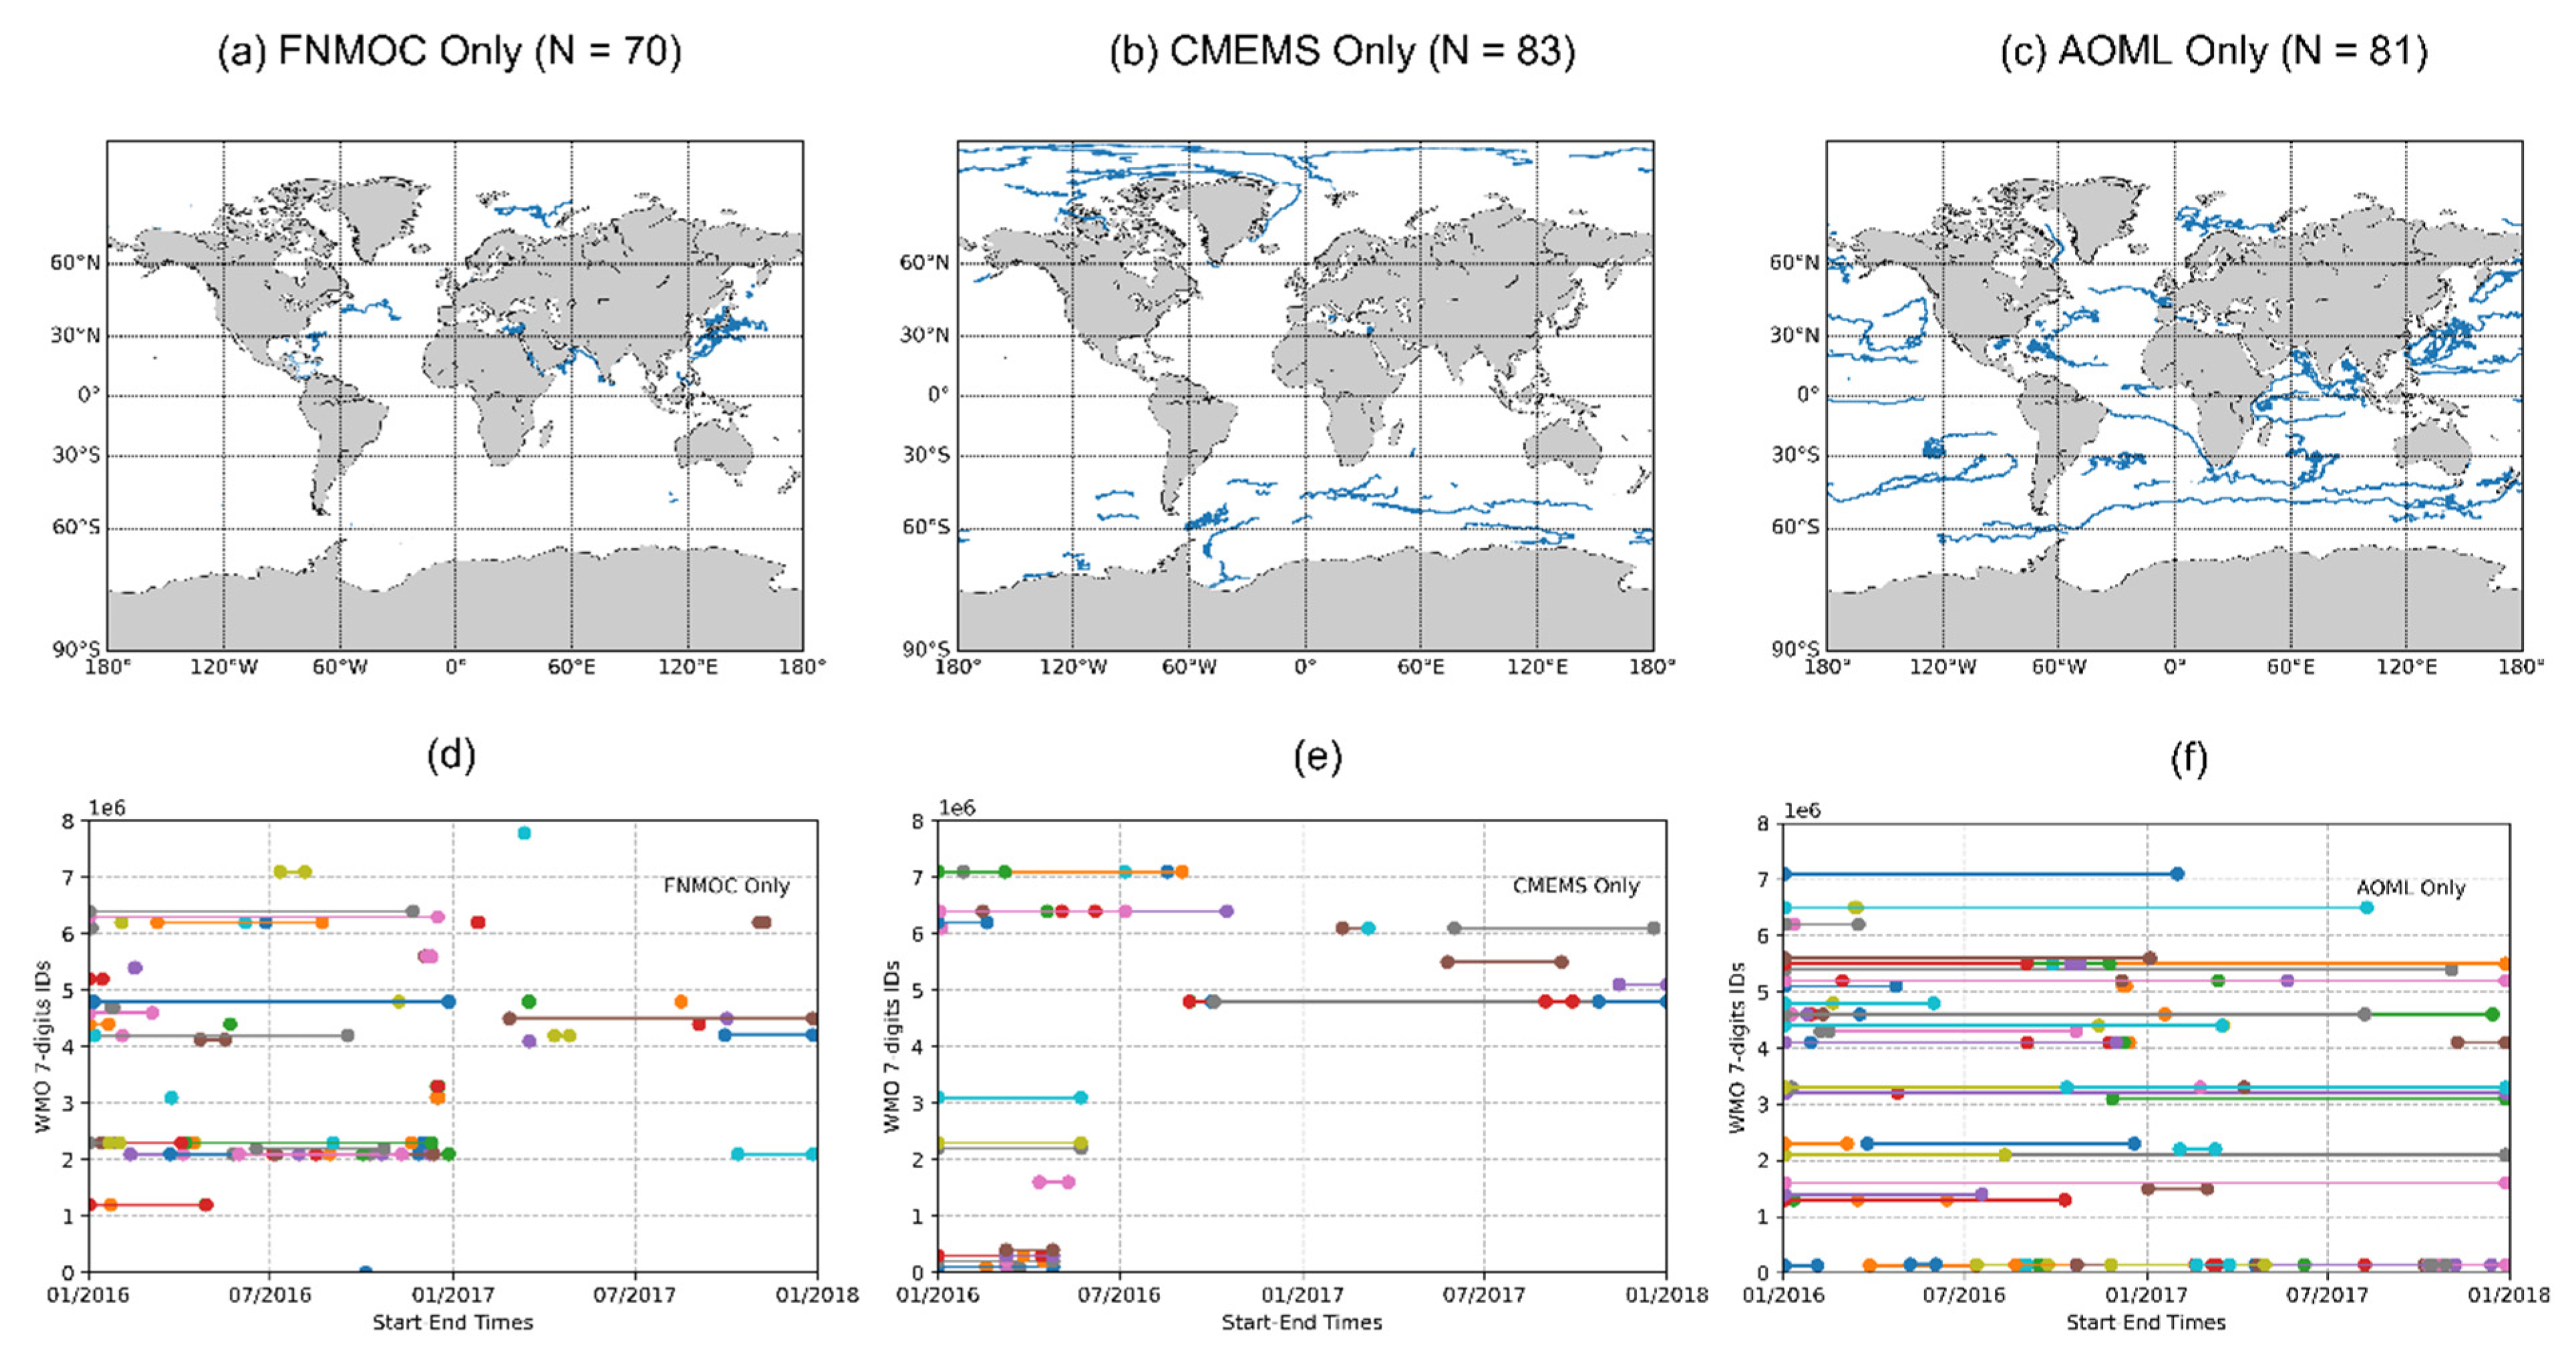
A similar analysis for the UIDs found in one data source only was also performed. The buoys included in FNMOC only (N = 70; Figure 3a) are often found in coastal regions (such as the eastern coast of Japan) and in the internal seas (e.g., Arabian and Mediterranean Seas). The CMEMS only buoys (N = 83; Figure 3b) drift mostly in the high latitudes. The drifters contained only in AOML data set (N = 81; Figure 3c) are seen across the global open oceans, with no region particularly favored. The corresponding temporal coverage for each buoy (presented in the bottom panels of Figure 3) shows that they have different life spans. The AOML only drifters (Figure 3f) generally last longer than the corresponding FNMOC (Figure 3d) or CMEMS only buoys (Figure 3e), which often live shorter than a few months. This suggests that some well-maintained, long-lived buoys with larger amount of measurements and incorporated in AOML, may be missing in FNMOC and CMEMS. In contrast, FNMOC or CMEMS host some buoys, which are likely employed in shorter scientific experiments and may be of other types than SVP and/or are undrogued (or drogued at different depths than ~15 m), such as the Coastal Ocean Dynamics Experiment (CODE) type [28].
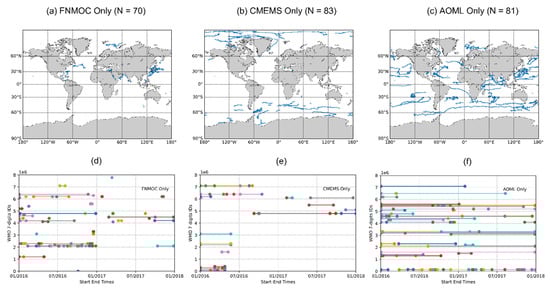
Figure 3.
Trajectories of buoys found in (a) only FNMOC, (b) only CMEMS, and (c) only AOML, and life spans of buoys found in (d) only FNMOC, (e) only CMEMS, and (f) only AOML. In the bottom panels, the start and end times of a buoy are marked by two solid circles sharing the same color as the connecting line. The y-axis is the 7-digit WMO ID value.
3.2. Ships
Before the large-scale deployment of drifters in the 1990s, ships were the major source of in situ SSTs. Although their quality has been suboptimal, compared to the more recent observational technologies, ship SSTs have the longest history with different measurement instruments being employed over the years (see, e.g., in [29,30]). Two data sets are investigated in this section: ICOADS and FNMOC. Note that CMEMS NRT data currently do not incorporate SST measurements labelled as “SHIP” from GTS (L. Drouineau, personal communication), and therefore are not included in the current analyses. Platform type = 5 data (ship observations) in ICOADS, and data from all shipborne sensor types (i.e., buckets, engine room intake, ERI, and hull-contact sensors) in FNMOC are considered.
The statistics are summarized in Table 3. As before, the sum of all UIDs from ICOADS and FNMOC is considered as 100%, which is N = 5046 in this case. The two data sets have close UID numbers, accounting for 88.0% and 84.0%, respectively, but FNMOC has a significantly larger number of observations than ICOADS. Out of the total N = 5046 ship UIDs, there are N = 3632 (72.0%) shared by the ICOADS and FNMOC, and the two Nobs values for these shared UIDs are very close. Lastly, there are N = 810 and N = 604 UIDs found in ICOADS and FNMOC only, respectively. The Nobs, however, are very different, with the FNMOC Nobs being > 4 million and the ICOADS Nobs being just below 55 thousand.
Table 3.
The numbers of ship UIDs and Nobs in ICOADS and FNMOC for all, shared, and single-source UIDs. Values in parentheses are the percentages against total UIDs (N = 5046 = 100%).
A further investigation into the larger Nobs for the FNMOC-only UIDs has shown that these measurements come mostly from stationary (i.e., not moving) platforms. In this analysis, we define a platform as ‘stationary’ if it has not moved more than 1° in either longitude or latitude, within the two years’ study period. Accordingly, 357 out of the 810 ICOADS-only UIDs are ‘stationary’ platforms, which return 27,630 (out of the 54,795) valid SSTs, whereas 507 out of the 604 FNMOC-only UIDs are ‘stationary’, responsible for >3.9 million (out of the ~4 million) SST measurements. There are several possible reasons accounting for this mislabeling: (1) moorings being misclassified as ships, or (2) ships and moored buoys inconsistently being transmitted in FM-13 (ship) or FM-18 (buoy) TAC formats. A closer look into iQuam data sets indicates that, in the current iQuam v.2.10 system, these ‘stationary’ platforms are still labelled as ‘Ships’. This will be analyzed and fixed in the future system updates.
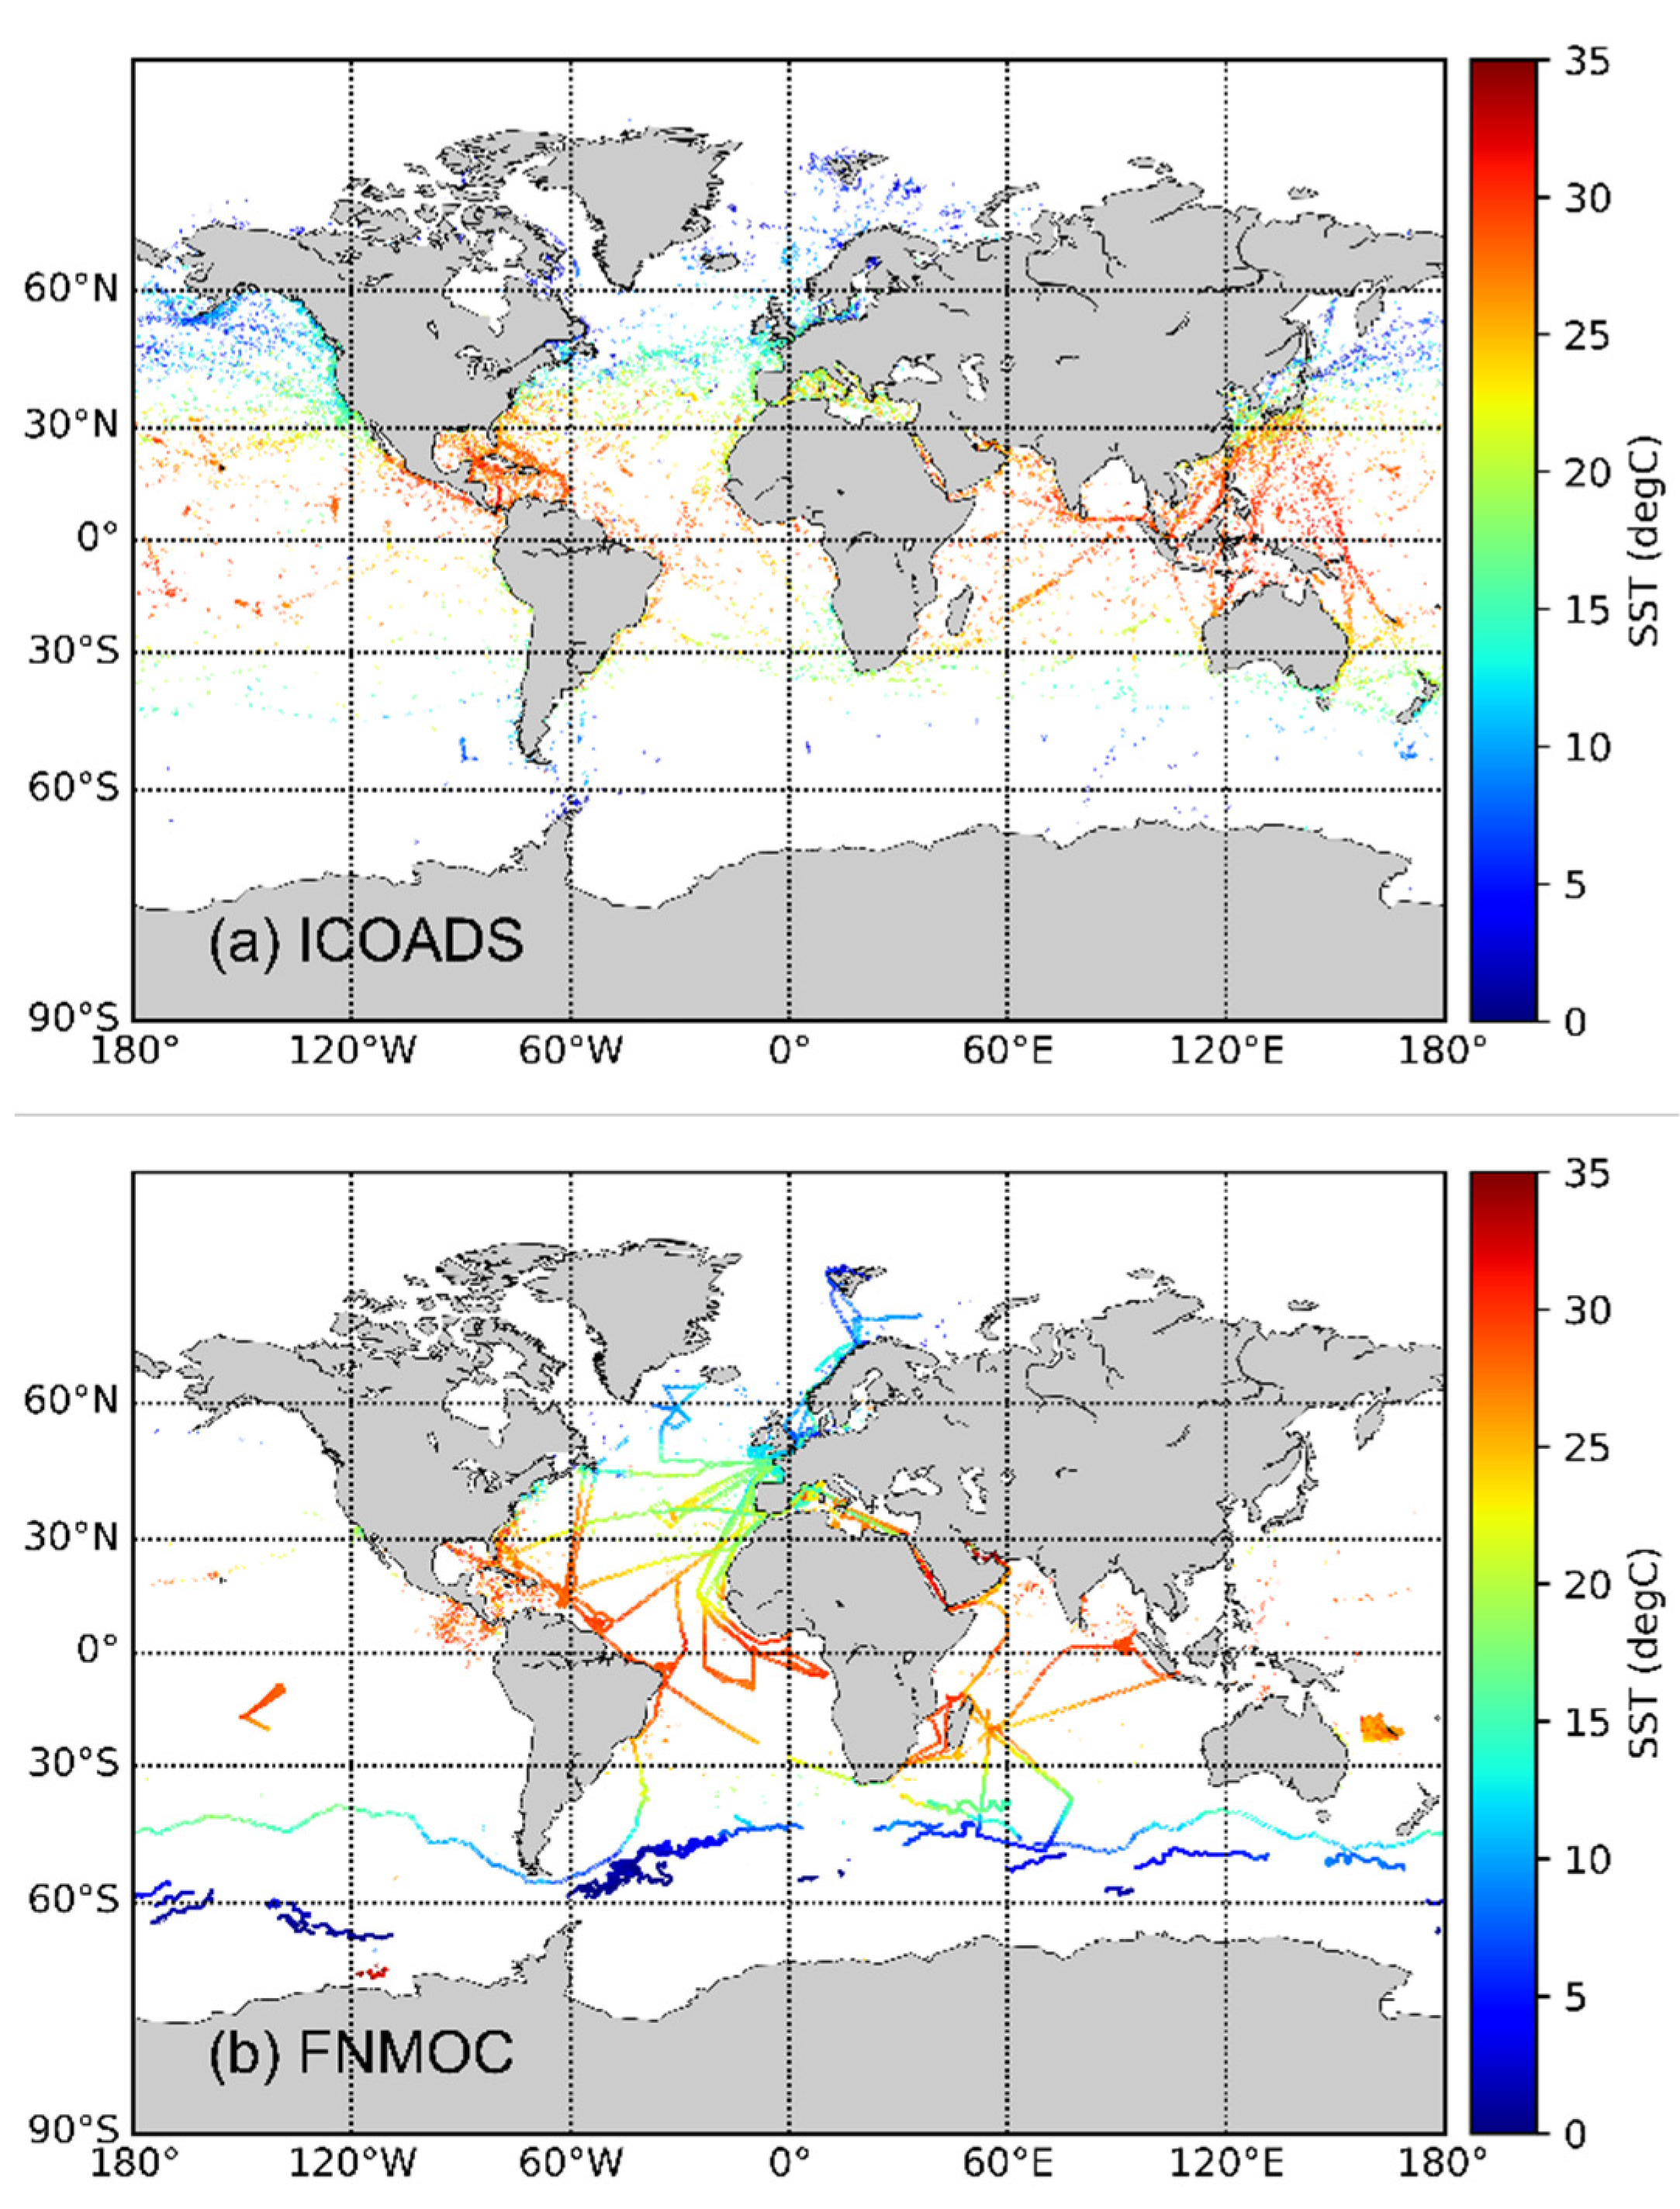
The spatial distributions of these ship SSTs from single-source only UIDs (excluding ‘stationary’ UIDs) are shown in Figure 4. Most of the measurements in ICOADS are found in the North Atlantic Ocean and in the West Pacific Ocean, while in FNMOC, they cluster more often in the Atlantic Ocean and (more sparsely) in the Southern Oceans.
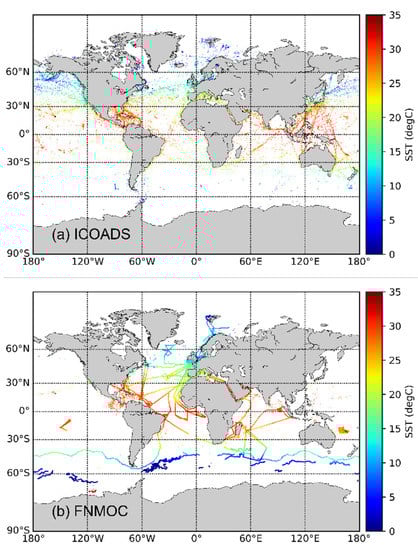
Figure 4.
The trajectories of the ships with UIDs found only in (a) ICOADS and (b) FNMOC. (Note that both exclude ‘stationary’ ones). The color bar represents the SST.
The distribution of ship SST observations as a function of different sensor types is shown in Figure 5. As expected, only a very small fraction (2.8% for ICOADS, and 2.7% for FNMOC) of ship SSTs in 2016–2017 were obtained with buckets, the more traditional method that is gradually getting phased out (see, e.g., in [30,31]). Most of the data in 2016–2017 were measured using the engine room intake (ERI) method. Note that the percentage of ERI SSTs in FNMOC (88.2%) is noticeably larger than in ICOADS (72.4%). The rest of observations are made with the more recent method, the hull-contact sensors. Hull-sensor SSTs make up 24.8% of all measurements in ICOADS versus only 9.1% in FNMOC. According to Beggs et al. [16], the SSTs measured with hull-contact sensor, are more precise than ERI and bucket, and often exhibit similar, or even lower, random errors compared with drifting and moored buoy SSTs.
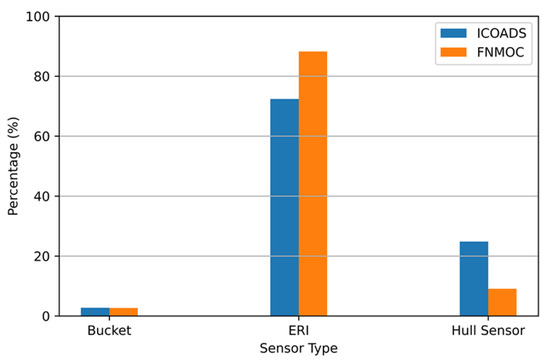
Figure 5.
The normalized distribution of the SST measurements obtained from different sensor types, i.e., bucket, Engine Room Intake (ERI), and hull-contact sensors, for ICOADS (blue) and FNMOC (orange).
3.3. Moorings
SST measurements obtained from tropical moorings (TM), are found to be of high quality comparable to drifters (see, e.g., in [32] and references therein). Although TM SSTs are usually measured at a different depth (~1 m) than drifters (~20 cm), they complement their spatial distribution in the tropics, where drifters are sparse due to the ocean circulation patterns. This section focuses on three data sets: ICOADS, CMEMS, and FNMOC. Coastal moorings (CMs) are only briefly introduced, and more emphasis is put on the tropical moorings (TMs) most often used in the satellite Cal/Val and DA.
All “platform type = 6” in ICOADS and “fixed buoy” data in FNMOC are adopted. Due to a slightly different data structure, the CMEMS reports need to meet a few criteria before they are included in the analyses. First, the measurements should be in the MO (moorings) family. There should also be a temperature (‘TEMP’) variable in the file. Then, there must be a valid SST value within the top 1.5 m depth.
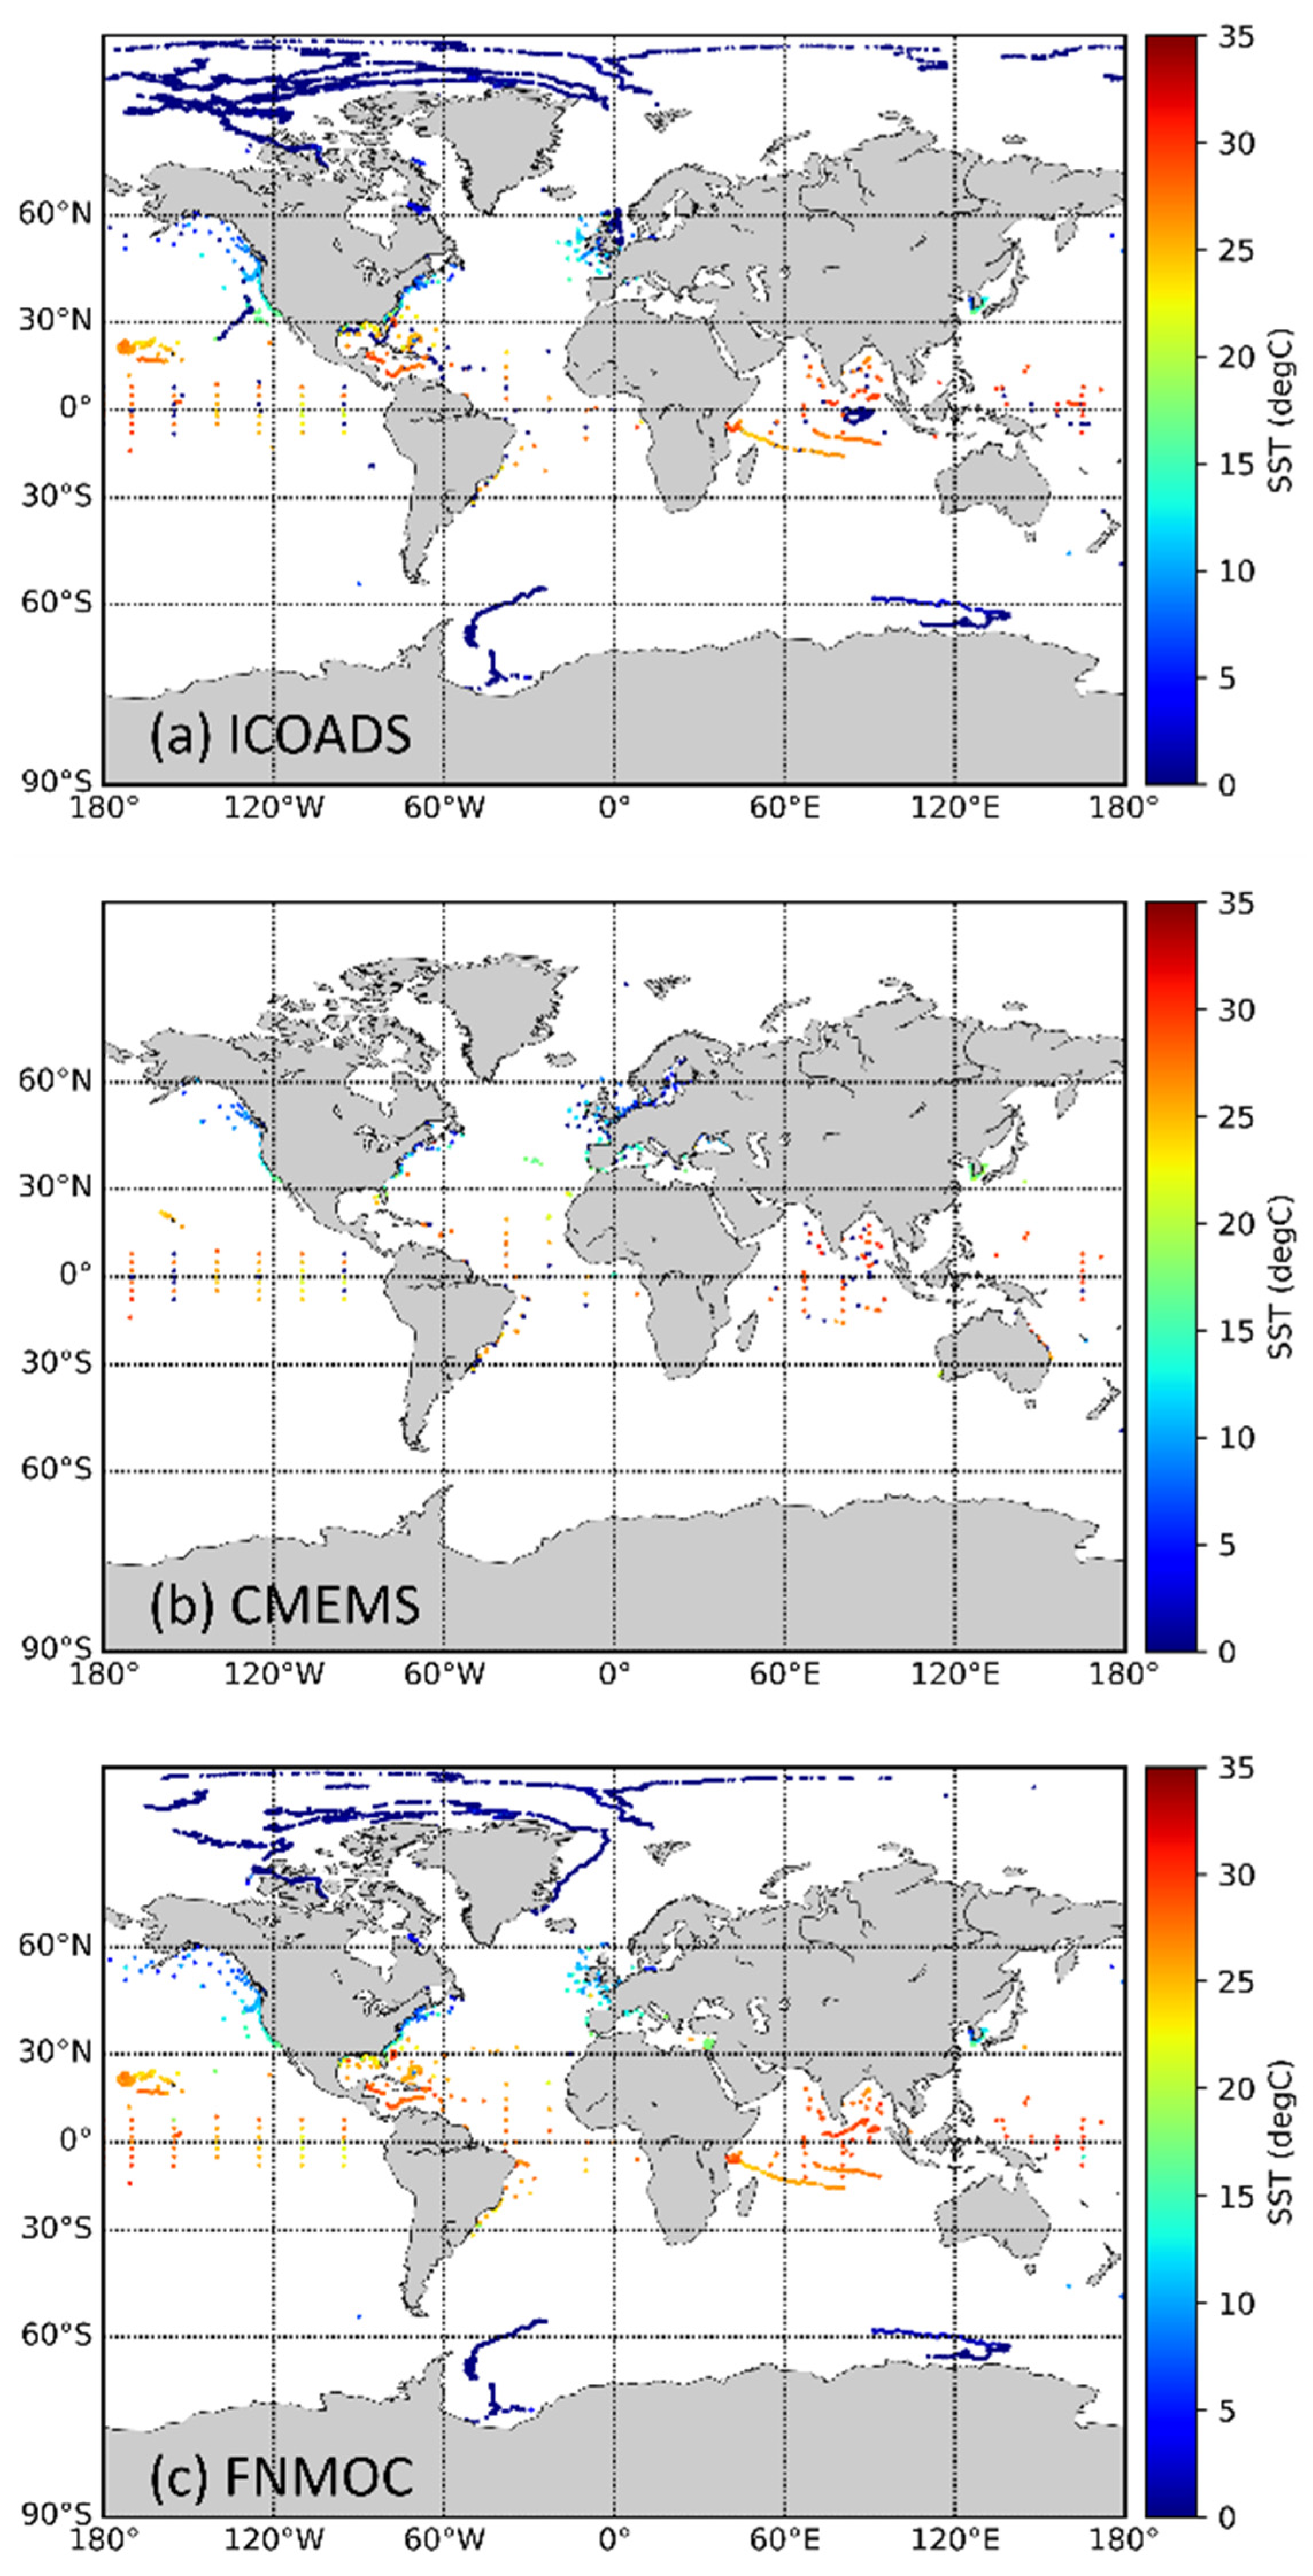
The spatial distributions of all moorings (both CMs and TMs) from the three data sets are shown in Figure 6. The moorings are easily identified with their fixed positions. In total, there are N = 644, N = 450, and N = 659 UIDs found in ICOADS, CMEMS, and FNMOC, respectively. However, although ICOADS and FNMOC have more UIDs, many of those appear as moving, especially in the high latitudes, likely due to mislabeling ships or drifters as moorings (note that CMEMS is the only data set not reporting ‘moving moorings’). It is expected that the addition of BUFR format data in ICOADS R3.0.2 will mitigate this confusion, for the most part (E. Freeman, personal communication, 2020).
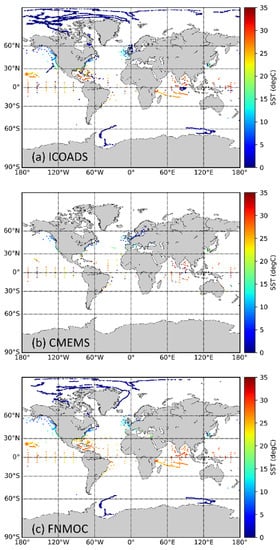
Figure 6.
Spatial distribution of all moorings (coastal + tropical) from: (a) ICOADS, (b) CMEMS, and (c) FNMOC. The color bar represents SST.
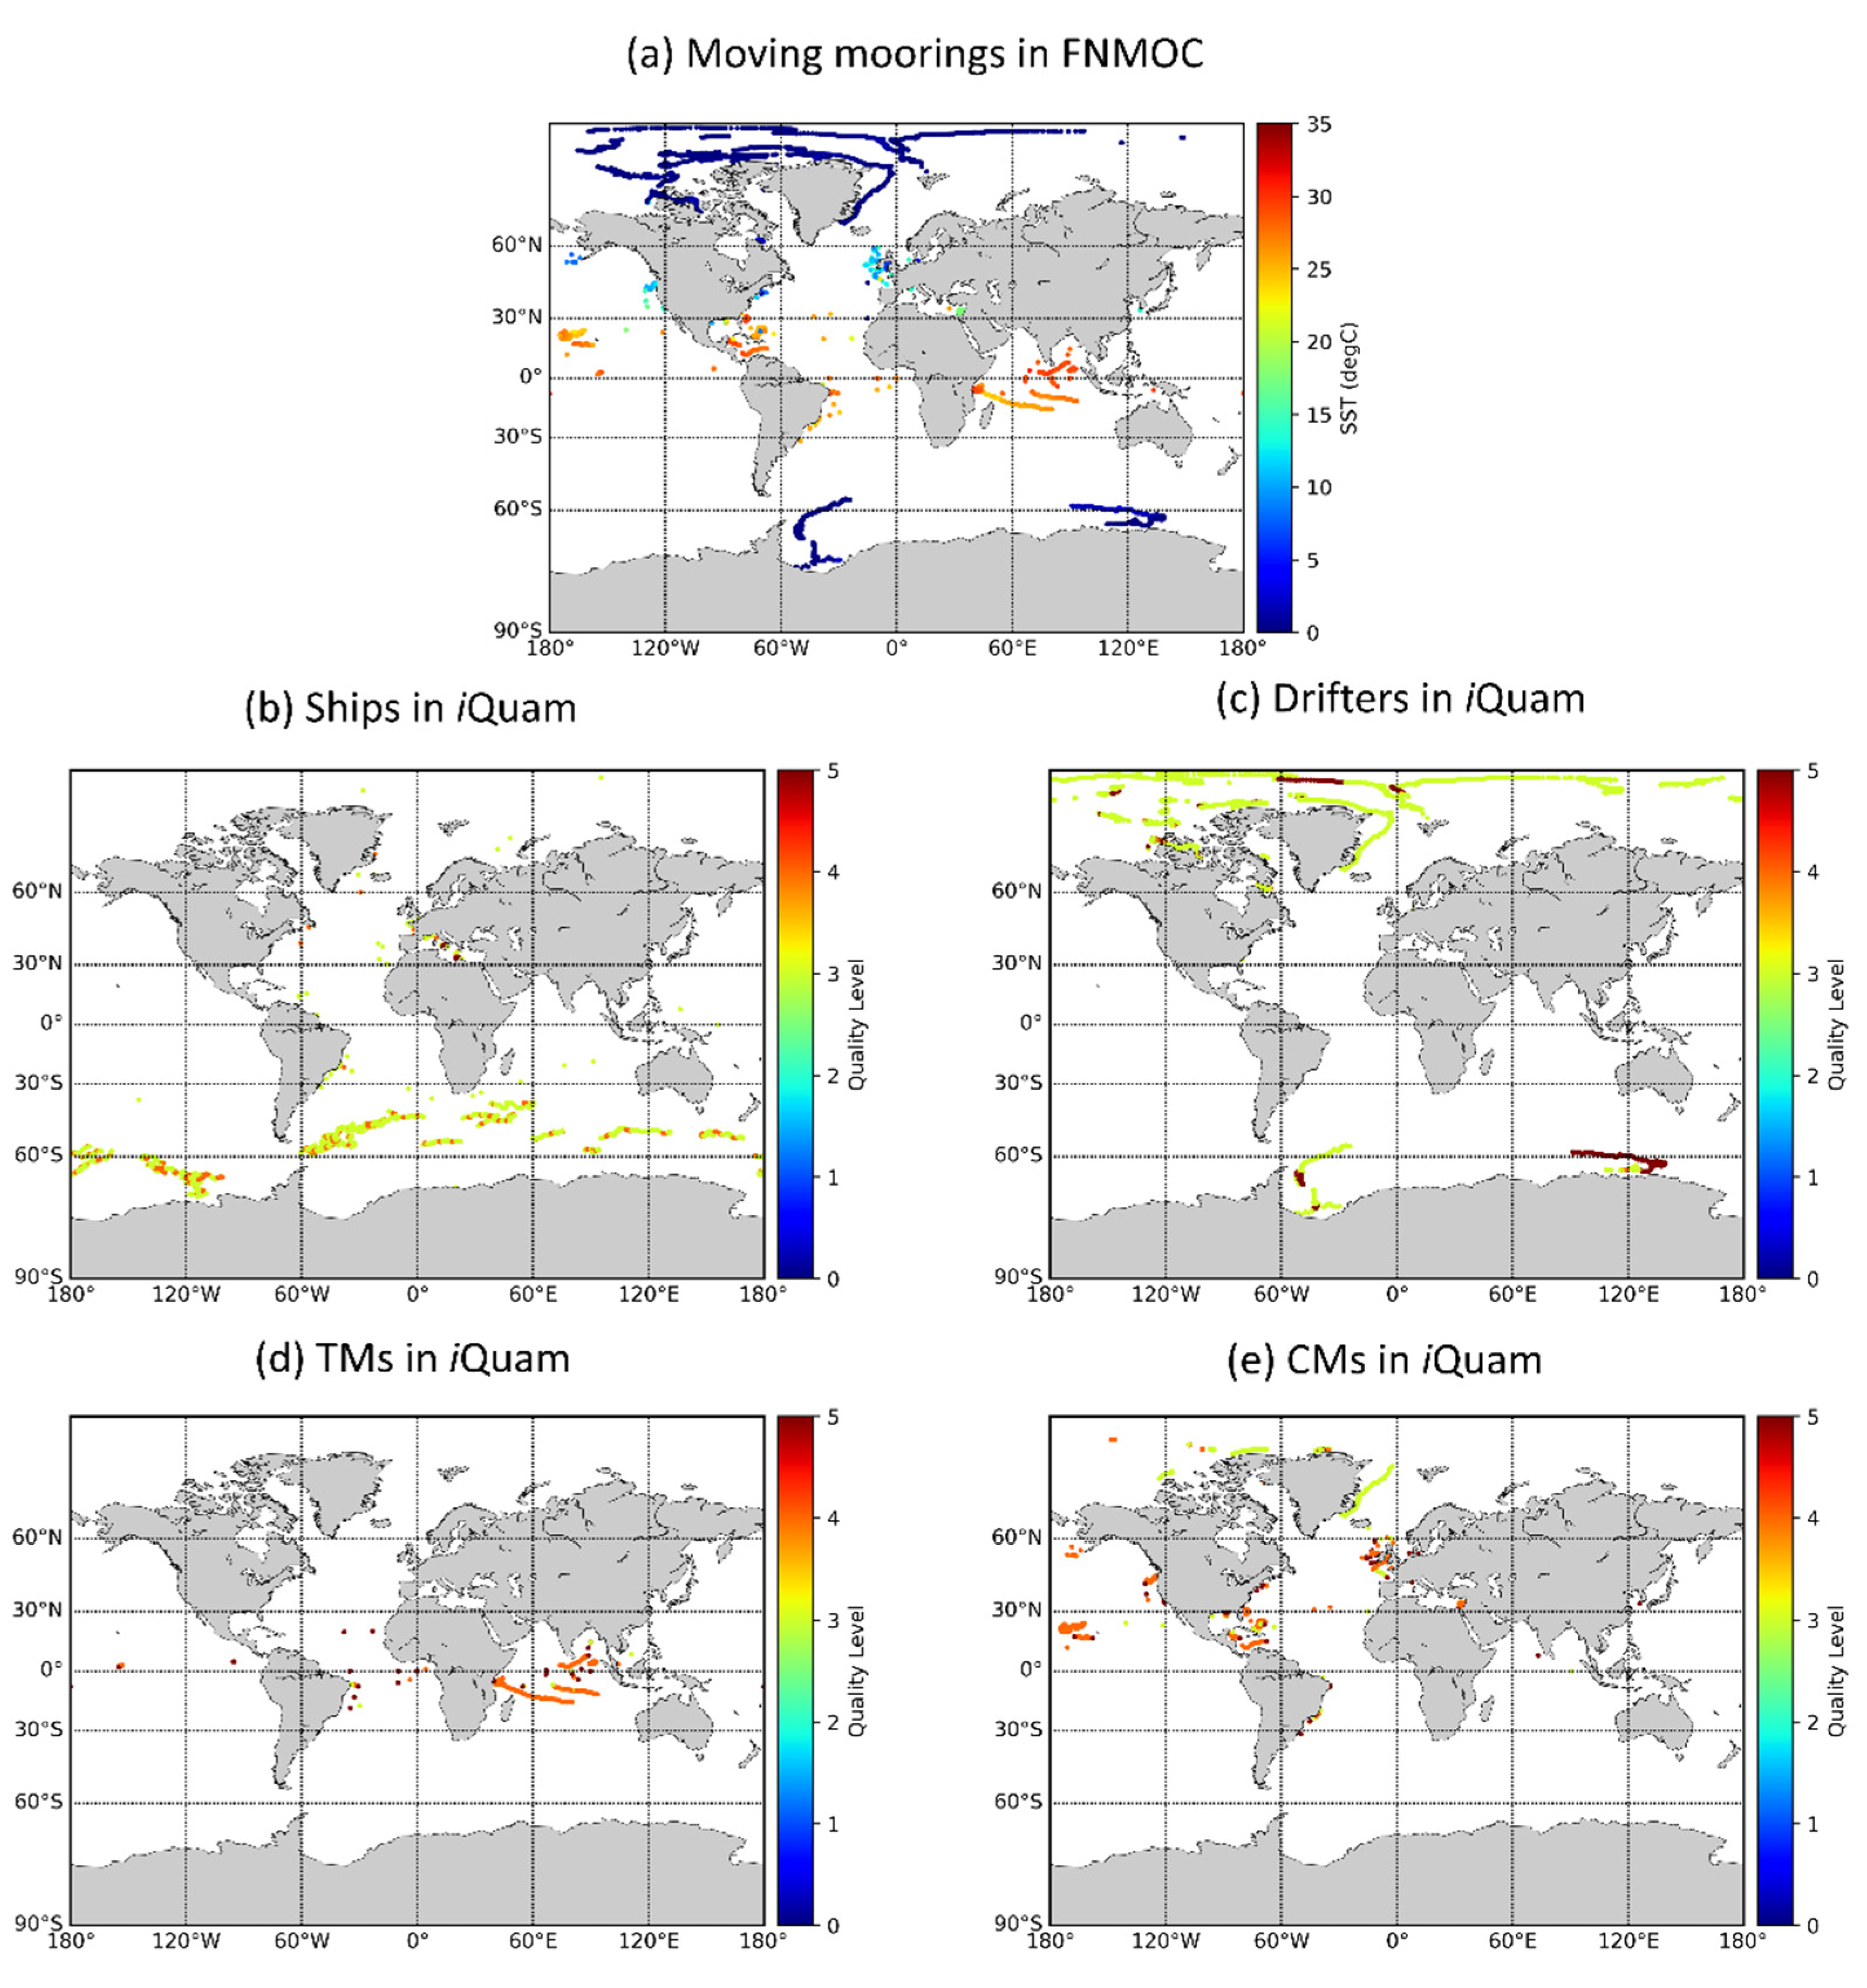
The QC scheme adopted in iQuam v2.10 is capable of identifying those ‘moving moorings’ in ICOADS and FNMOC, using a similar criterion as in Section 3.2: if the maximum longitude difference of a platform within the study period is larger than 1 degree, then it is defined as ‘moving’. In FNMOC, 102 UIDs of such ‘moving moorings’ were found. Upon identifying, iQuam reclassifies those into other platforms or retains them as moorings. Out of the 102 UIDs, one is now reclassified as ship, 20 as drifters, and 24 as TMs. There are 60 UIDs retained as CMs in iQuam (Figure 7). It is noticed that there are three extra UIDs (105 rather than 102) found in iQuam, which is because the invalid ID ‘0000000’ is occasionally observed and counts as one UID (this problem takes place not only for moorings, but for all platform types). Some ship measurements with ID ‘0000000’ in the Southern Oceans in iQuam have been picked up in this analysis, which are not seen in FNMOC (Figure 7b). Although the identification and reclassification in iQuam are generally successful, a few ‘moving moorings’ still remain (Figure 7d). Although these measurements have been flagged with suboptimal quality levels (QL = 4 or 3; see Figure 7), this issue will be further investigated in the future iQuam release.
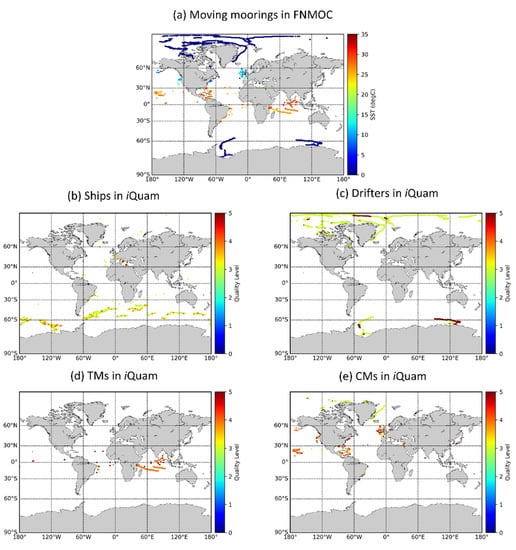
Figure 7.
(a) The ‘moving moorings’ in FNMOC. The color bar in panel (a) indicates SST. These moorings have been (re)classified in iQuam as (b) ship, (c) drifting buoys, (d) tropical moorings, and (e) coastal moorings. Note the color bar in panels (b–e) represents the iQuam quality levels.
The TM SSTs are generally considered to be more precise than CM SSTs (e.g., in [32] and references therein), and more widely used in satellite SST Cal/Val and DA. The following analyses will focus on TMs only. Table 4 displays the number of TM UIDs and Nobs. The UID counts found in all data sets are very close. Out of the ~100 UIDs, 98 are shared by all three data sets. However, the Nobs vary from one source to another. The ICOADS has ~1.03 million records, CMEMS >5 million, and FNMOC ~0.85 million.
Table 4.
The number of unique IDs and Nobs of TMs in three data sets.
Further analysis of the Nobs of the 98 shared UIDs is conducted (Figure 8). It is observed that for 55 out of the 98 UIDs, the Nobs in CMEMS is ~6 times larger than in the other two data sets. These IDs provide close to 100,000 measurements in CMEMS in 2016–2017, compared with only 17,000 in ICOADS and FNMOC. These 55 moorings are all from the TAO/TRITON (Tropical Atmosphere Ocean–Triangle Trans-Ocean Buoy Network) project in the Pacific Ocean. Their SSTs are reported in CMEMS every 10-min, compared to 1-hr in ICOADS and FNMOC. For the remaining 43 UIDs (PIRATA in the Atlantic Ocean and RAMA in the Indian Ocean), the data are reported with the same temporal once-an-hour frequency, resulting in more consistent number of observations in all three data sets.
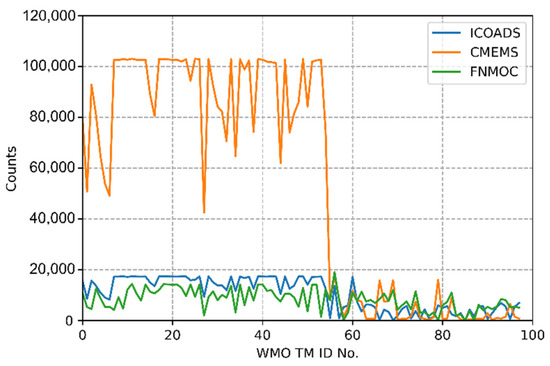
Figure 8.
NOBS from 98 UIDs shared by ICOADS, CMEMS, and FNMOC.
3.4. Argo Floats
As the data in the two Argo GDAC sites mirror each other, Argo measurements used in this study are obtained from one GDAC (Coriolis/IFREMER), and from a third source, CMEMS profiling in situ data. The two sources are produced by Coriolis service at IFREMER and should be identical. This identity is verified below. Instead of two years, only three months (1 January–31 March 2016) of data are used, due to the large data volumes. For each source, all measurements within the 10 dbar pressure (~10 m depth) are included. The focus in this section will be on the measurements obtained from different VSSs and Argo float types.
The number of UIDs and Nobs from the Coriolis GDAC and CMEMS are shown in Table 5. The two data sources have indeed very close statistics in terms of both UIDs and Nobs. The slight differences are mainly due to the random broken/flawed files, with certain variables being unreadable (e.g., VSS), and therefore were discarded. Out of the 44,092 and 12,068 individual files from GDAC and CMEMS during this study period, there are 710 (1.6%) and 214 (1.8%) files discarded, respectively. The different file counts for GDAC and CMEMS is simply due to different data organization: the GDAC files are single-cycle files, whereas the CMEMS files combine single-cycle files into monthly data. This extra processing in CMEMS may minimally affect the statistics as well.
Table 5.
The number of Argo UIDs and observations in Coriolis GDAC and CMEMS.
A breakdown of the data by different VSSs is illustrated in Table 6. As expected, both data sets have nearly identical Nobs, for all VSSs. (There are no bounce VSS measurements found in either dataset.) It is also noticed that the near-surface measurements make up the largest portion of all observations, followed by the secondary measurements. The primary measurements are the fewest in number. In terms of the UIDs generating these measurements, one can see that nearly all Argo floats provide primary VSS observations. The missing 15 (14) UIDs in GDAC (CMEMS) actually provide primary VSS observations as well, yet their top layers are below 10 dbar (m); thus, they are not shown in this analysis which is confined to within the 10 dbar (m) pressure range. Note that only ~10% and ~29% of all the Argo floats report secondary and near-surface VSS measurements, respectively.
Table 6.
The Nobs obtained with different VSSs. The first value in the parentheses is the number of UIDs that return the measurements. The percent value shows the fraction of UIDs to the total UIDs in the corresponding data set.
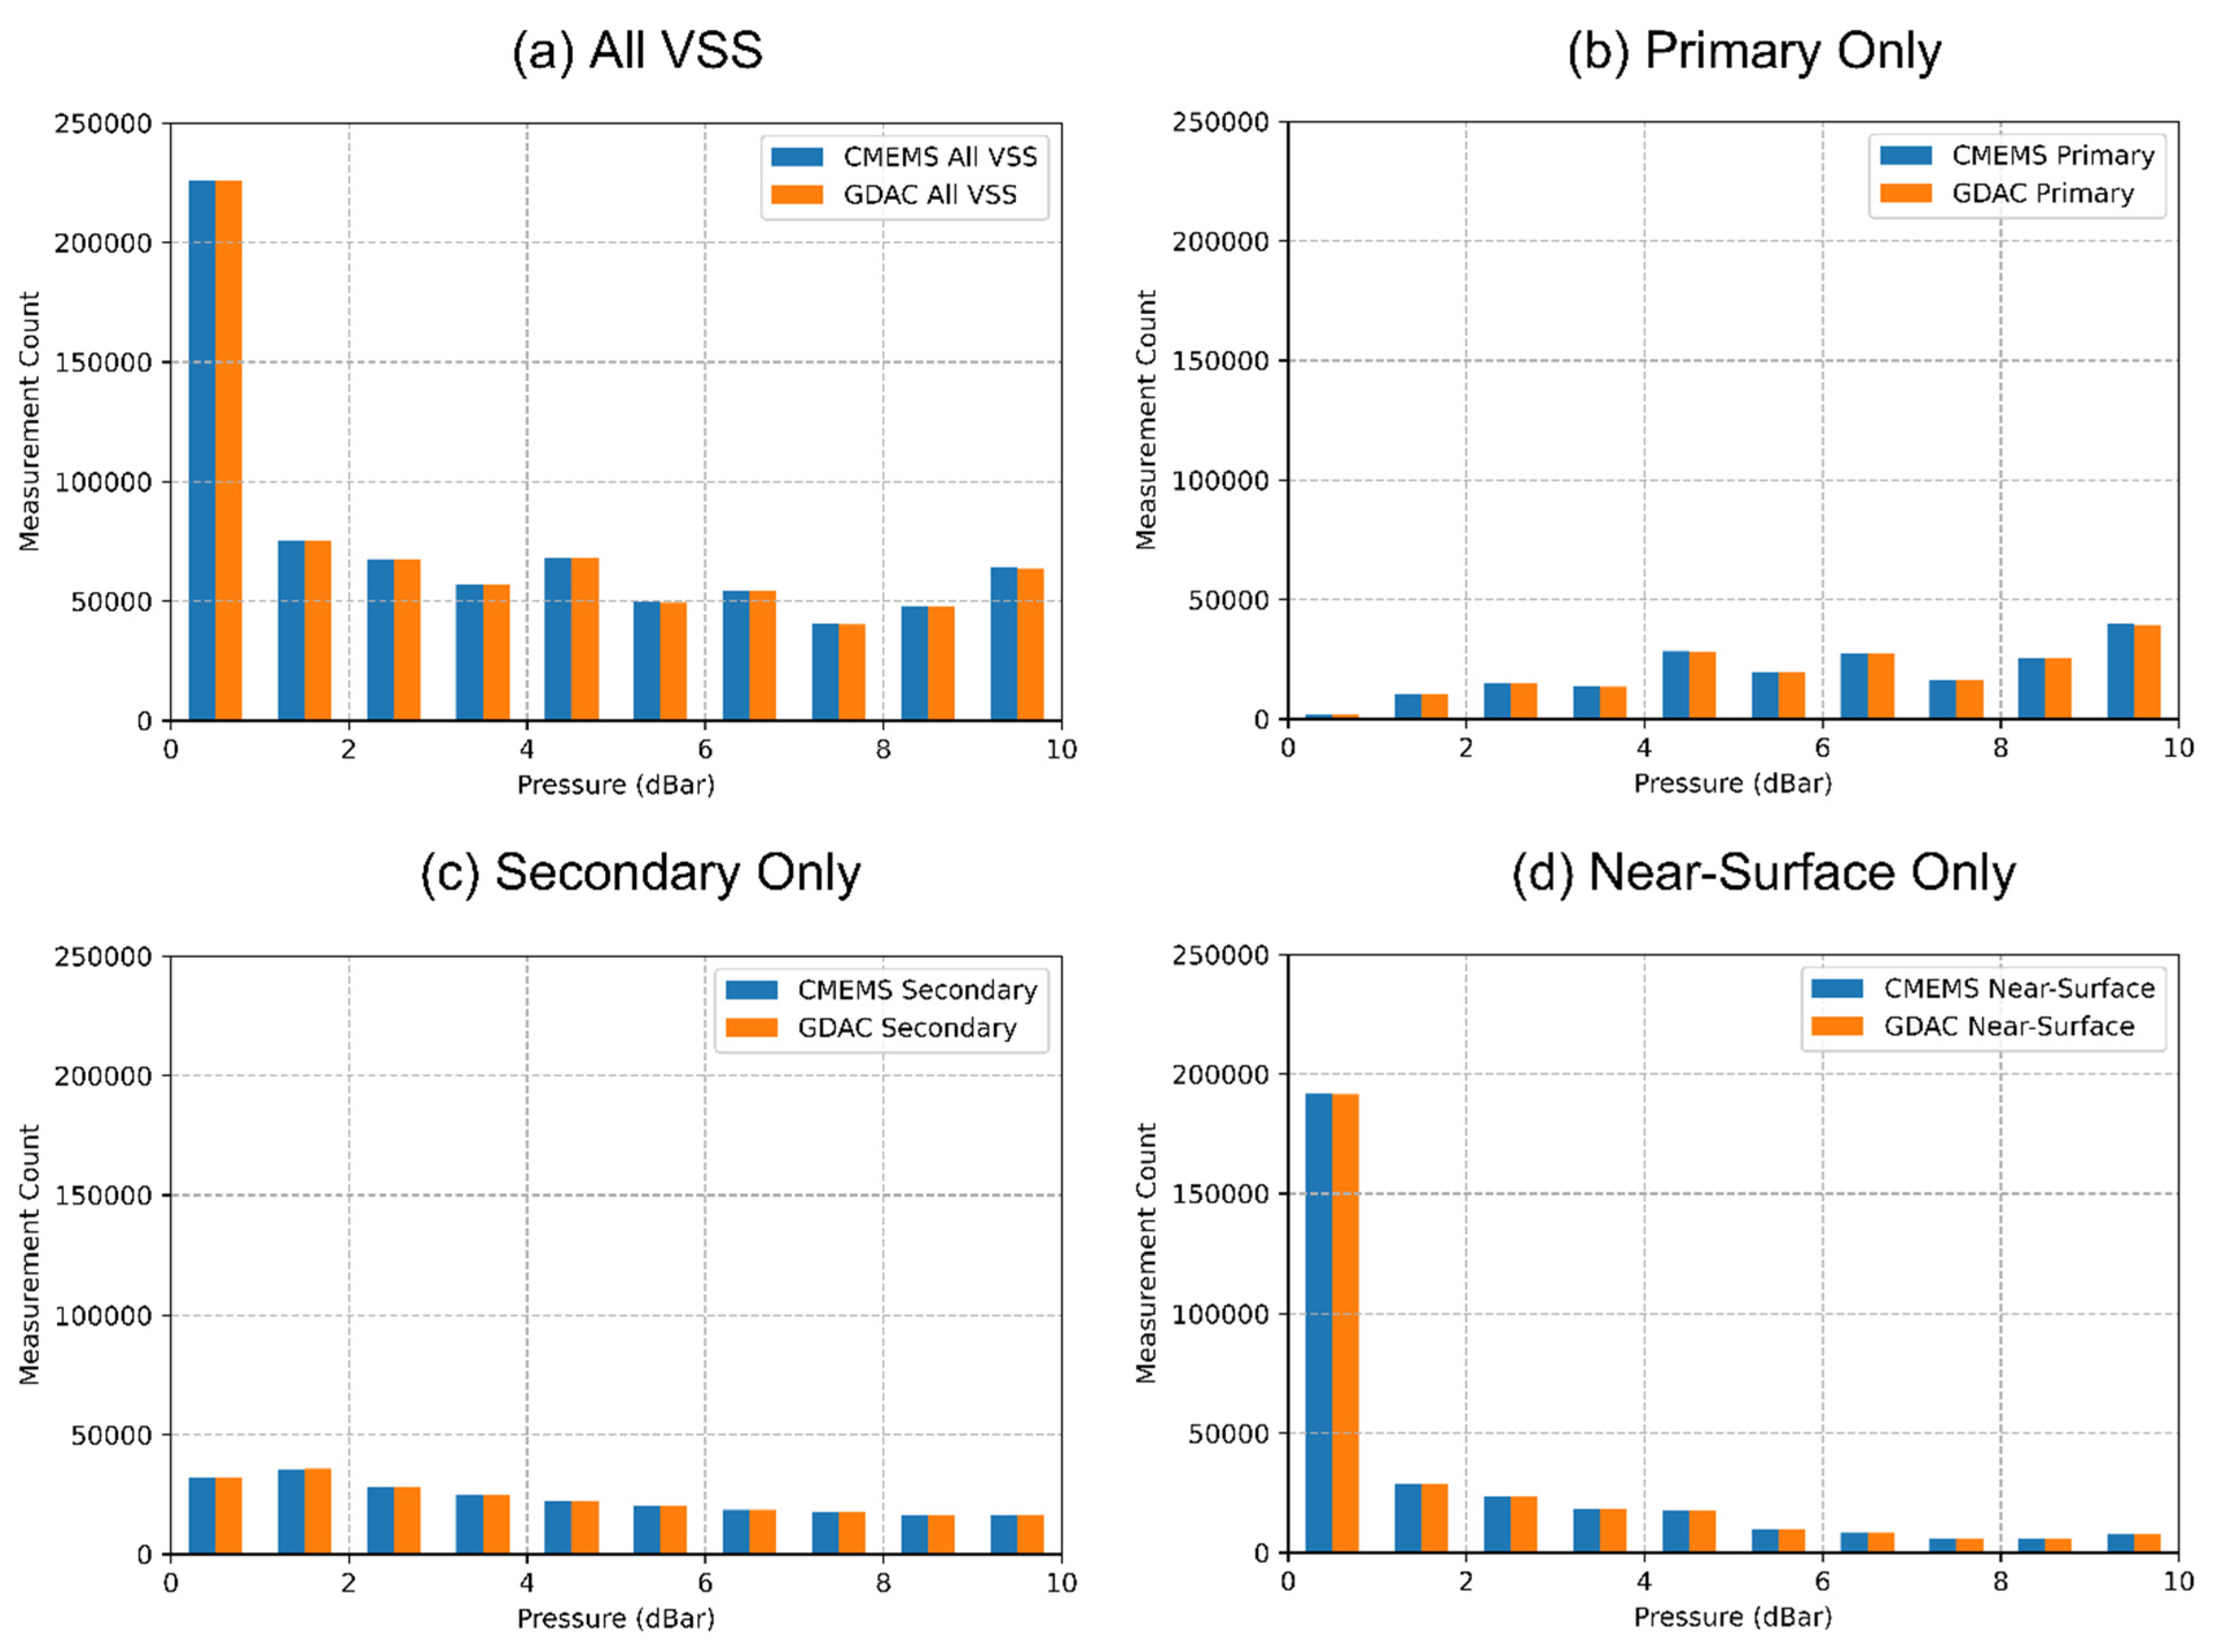
The histograms of Nobs against pressure for each VSS are displayed in Figure 9.
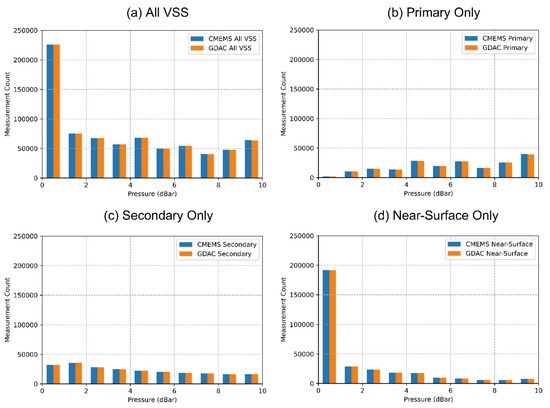
Figure 9.
Distribution of Nobs from the two data sets against pressure: (a) measurements from all VSSs are included, (b) primary VSS only, (c) secondary VSS only, and (d) near-surface VSS only.
The distributions of the two data sets are very similar, for all VSSs. The Nobs within the 0–1 dbar (m) bin really stands out, being significantly higher than at other pressure levels. This is mostly due to the extraordinarily large near-surface Nobs (Figure 9d). The measurements from primary and secondary VSSs are more evenly distributed across the whole 0–10 dbar (m) pressure range (Figure 9b,c). At this point, we have verified that the two Argo data sets are nearly identical, with minor inconsistencies due to the different data structures and random damaged files.
4. Conclusions
The completeness and complementarity of five data sources currently ingested into iQuam, or planned to be ingested in the near future, are analyzed over a period of two years (2016–2017) for ICOADS, CMEMS, FNMOC, AOML are investigated, and first 3 months of 2016 for Argo floats. The analyses for ICOADS and FNMOC products are conducted based on three platform types: drifting buoys, ships, and moorings. The analyses for CMEMS products are for drifting buoys, moorings, and Argo floats. AOML GDP data set is produced specifically for drifting buoys and might serve as an extra data source in iQuam in the future. A few conclusions are drawn as follows.
(1) Drifting buoys. Out of the four data sets from which drifting buoy measurements are extracted, CMEMS and FNMOC have the largest coverage in terms of both unique IDs and Nobs. AOML has a decent UID coverage and similar Nobs. The fewer UIDs in AOML mainly result from this data set exclusively housing SVP buoys drogued at ~15 m depth. The current NRT ICOADS extension, R3.0.1 is missing many drifting buoy data following the ongoing 5-digit ID TAC to 7-digit BUFR template 315009 transition after November 2016. This deficiency will be mitigated in the newer ICOADS NRT R3.0.2, expected to be released in 2022 (E. Freeman, C. Liu, H.-M. Zhang, personal communications, 2020, 2021).
(2) Ships. Both ICOADS and FNMOC do an excellent job providing ship SSTs, obtained from all three major sensors, i.e., bucket, ERI, and hull sensors. ICOADS R3.0.1 incorporates slightly more ship IDs. Nonetheless, many single-source only UIDs in both data sets are found to be ‘stationary’ platforms rather than moving ships, which needs to be addressed by the data producers, as well as in the updated iQuam system in the future.
(3) Moorings. When combining both CMs and TMs, FNMOC and ICOADS have the most complete coverage in terms of UIDs. However, some of these platforms are clearly moving, suggesting that they have been incorrectly labeled as ‘moorings’. Most of them are successfully identified and reclassified into different platform types in iQuam. As for the TMs, all three data sets (i.e., ICOADS, CMEMS, and FNMOC) report quite complete set of measurements. For the TAO/TRITON project in the Pacific Ocean, SST reports in CMEMS have a resolution of 10-min, compared to 1-h in the other two data sets. This may be helpful for satellite Cal/Val and QC’ing in situ SST, and other applications that require higher temporal resolution.
(4) Argo. As expected, the CMEMS profiling data are nearly identical with the GDAC data given that their inputs are from the same source. The secondary and near-surface SSTs implemented on several Argo float types, may be particularly useful for the remote sensing community due to its higher vertical resolution and being closer to the sea surface.
The analyses performed in this study can help iQuam to reduce its redundancy in data source options, by ranking their relative uniqueness. The results also provide non-iQuam users (of ICOADS, FNMOC, CMEMS, etc. data) with a more complete understanding of their completeness, complementarity and relative merits.
Author Contributions
Conceptualization, A.I.; methodology, A.I. and H.Z.; formal analysis, H.Z.; writing—original draft preparation, H.Z.; writing—review and editing, A.I. and H.Z.; visualization, H.Z.; supervision, A.I.; project administration, A.I.; funding acquisition, A.I. All authors have read and agreed to the published version of the manuscript.
Funding
This research was funded by the Department of Commerce—National Oceanic and Atmospheric Administration, award number: NA19OAR4320073.
Institutional Review Board Statement
Not applicable.
Informed Consent Statement
Not applicable.
Data Availability Statement
The ICOADS R3.0.1 data set is obtained from https://www.ncei.noaa.gov/data/international-comprehensive-ocean-atmosphere/v3/archive/nrt/ (accessed on 16 September 2021), CMEMS products from https://resources.marine.copernicus.eu/products (accessed on 16 September 2021), and FNMOC from https://www.usno.navy.mil/FNMOC (accessed on 16 September 2021). The two Argo data sets are obtained from the IFREMER GDAC ftp://ftp.ifremer.fr/ifremer/argo/ (accessed on 16 September 2021) and the profiling subset within the CMEMS product.
Acknowledgments
We thank Rick Lumpkin and Mayra Pazos for help with providing the AOML buoy data set and answering questions. We also acknowledge the help of Stéphane Tarot, Ludovic Drouineau, and Jean-François Piollé with the CMEMS product and Stephen Riser with the Argo data. The views, opinions, and findings contained in this report are those of the authors and should not be construed as an official NOAA or U.S. Government position, policy, or decision.
Conflicts of Interest
The authors declare no conflict of interest.
References
- Saunders, P.M. Aerial measurement of sea surface temperature in the infrared. J. Geophys. Res. 1967, 72, 4109–4117. [Google Scholar] [CrossRef]
- Strong, A.E.; McClain, E.P. Improved Ocean Surface Temperatures from Space—Comparisons w ith Drifting Buoys. Bull. Am. Meteorol. Soc. 1984, 65, 138–142. [Google Scholar] [CrossRef] [Green Version]
- Kilpatrick, K.A.; Podestá, G.P.; Evans, R. Overview of the NOAA/NASA advanced very high resolution radiometer Pathfinder algorithm for sea surface temperature and associated matchup database. J. Geophys. Res. Ocean. 2001, 106, 9179–9197. [Google Scholar] [CrossRef]
- Brisson, A.; Le Borgne, P.; Marsouin, A. Results of one year of preoperational production of sea surface temperatures from GOES-8. J. Atmos. Ocean. Technol. 2002, 19, 1638–1652. [Google Scholar] [CrossRef]
- Donlon, C.J.; Minnett, P.J.; Gentemann, C.; Nightingale, T.J.; Barton, I.J.; Ward, B.; Murray, M.J. Toward improved validation of satellite sea surface skin temperature measurements for climate research. J. Clim. 2002, 15, 353–369. [Google Scholar] [CrossRef] [Green Version]
- Merchant, C.J.; Horrocks, L.A.; Eyre, J.R.; O’Carroll, A.G. Retrievals of sea surface temperature from infrared imagery: Origin and form of systematic errors. Q. J. R. Meteorol. Soc. 2006, 132, 1205–1223. [Google Scholar] [CrossRef] [Green Version]
- Castro, S.L.; Wick, G.A.; Jackson, D.L.; Emery, W.J. Error characterization of infrared and microwave satellite sea surface temperature products for merging and analysis. J. Geophys. Res. Ocean. 2008, 113, C03010. [Google Scholar] [CrossRef]
- O’Carroll, A.G.; Eyre, J.R.; Saunders, R.W. Three-way error analysis between AATSR, AMSR, E, and in situ sea surface temperature observations. J. Atmos. Ocean. Technol. 2008, 25, 1197–1207. [Google Scholar] [CrossRef] [Green Version]
- Petrenko, B.; Ignatov, A.; Kihai, Y.; Stroup, J.; Dash, P. Evaluation and selection of SST regression algorithms for JPSS VIIRS. J. Geophys. Res. 2014, 119, 4580–4599. [Google Scholar] [CrossRef]
- Chin, T.M.; Vazquez-Cuervo, J.; Armstrong, E.M. A multi-scale high-resolution analysis of global sea surface temperature. Remote Sens. Environ. 2017, 200, 154–169. [Google Scholar] [CrossRef]
- Lorenc, A.C.; Hammon, O. Objective quality control of observations using Bayesian methods. Theory, and a practical implementation. Q. J. R. Meteorol. Soc. 1988, 114, 515–543. [Google Scholar] [CrossRef]
- Xu, F.; Ignatov, A. In situ SST quality monitor (iQuam). J. Atmos. Ocean. Technol. 2014, 31, 164–180. [Google Scholar] [CrossRef]
- Zhang, H.; Ignatov, A.; Hinshaw, D. Evaluation of the In Situ Sea Surface Temperature Quality Control in the NOAA in Situ SST Quality Monitor (iQuam) System. J. Atmos. Ocean. Technol. 2021, 38, 1249–1263. [Google Scholar] [CrossRef]
- Le Menn, M.; Poli, P.; David, A.; Sagot, J.; Lucas, M.; O’Carroll, A.; Belbeoch, M.; Herklotz, K. Development of Surface Drifting Buoys for Fiducial Reference Measurements of Sea-Surface Temperature. Front. Mar. Sci. 2019, 6, 578. [Google Scholar] [CrossRef] [Green Version]
- Poli, P.; Lucas, M.; O’Carroll, A.; Le Menn, M.; David, A.; Corlett, G.K.; Blouch, P.; Meldrum, D.; Merchant, C.J.; Belbeoch, M.; et al. The Copernicus Surface Velocity Platform drifter with Barometer and Reference Sensor for Temperature (SVP-BRST): Genesis, design, and initial results. Ocean. Sci. 2019, 15, 199–214. [Google Scholar] [CrossRef] [Green Version]
- Beggs, H.M.; Verein, R.; Paltoglou, G.; Kippo, H.; Underwood, M. Enhancing ship of opportunity sea surface temperature observations in the Australian region. J. Oper. Oceanogr. 2012, 5, 59–73. [Google Scholar] [CrossRef]
- Woodruff, S.D.; Steurer, P.M.; Slutz, R.J.; Jenne, R.L. A comprehensive ocean-atmosphere data set. Bull. Am. Meteorol. Soc. 1987, 68, 1239–1250. [Google Scholar] [CrossRef] [Green Version]
- Freeman, E.; Woodruff, S.D.; Worley, S.J.; Lubker, S.J.; Kent, E.C.; Angel, W.E.; Berry, D.I.; Brohan, P.; Eastman, R.; Gates, L.; et al. ICOADS Release 3.0: A major update to the historical marine climate record. Int. J. Climatol. 2017, 37, 2211–2232. [Google Scholar] [CrossRef] [Green Version]
- Freeman, E.; Kent, E.C.; Brohan, P.; Cram, T.; Gates, L.; Huang, B.; Liu, C.; Smith, S.R.; Worley, S.J.; Zhang, H.M. The international comprehensive ocean-atmosphere data set-meeting users needs and future priorities. Front. Mar. Sci. 2019, 6, 435. [Google Scholar] [CrossRef] [Green Version]
- Xu, F.; Ignatov, A. Evaluation of in situ sea surface temperatures for use in the calibration and validation of satellite retrievals. J. Geophys. Res. Ocean. 2010, 115, C09022. [Google Scholar] [CrossRef]
- Centurioni, L.R.; Turton, J.; Lumpkin, R.; Braasch, L.; Brassington, G.; Chao, Y.; Charpentier, E.; Chen, Z.; Corlett, G.; Dohan, K.; et al. Global in situ Observations of Essential Climate and Ocean Variables at the Air–Sea Interface. Front. Mar. Sci. 2019, 6, 419. [Google Scholar] [CrossRef] [Green Version]
- Lumpkin, R.; Pazos, M. Measuring surface currents with Surface Velocity Program drifters: The instrument, its data, and some recent results. In Lagrangian Analysis and Prediction of Coastal and Ocean Dynamics; Cambridge University Press: Cambridge, UK, 2009; Volume 67, pp. 39–67. [Google Scholar] [CrossRef]
- Le Traon, P.Y.; Reppucci, A.; Alvarez Fanjul, E.; Aouf, L.; Behrens, A.; Belmonte, M.; Bentamy, A.; Bertino, L.; Brando, V.E.; Kreiner, M.B.; et al. From Observation to Information and Users: The Copernicus Marine Service Perspective. Front. Mar. Sci. 2019, 6, 234. [Google Scholar] [CrossRef] [Green Version]
- Gould, J.; Roemmich, D.; Wuffels, S.; Freeland, H.; Ignaszewsky, M.; Jianplng, X.; Pouliquen, S.; Desaubies, Y.; Send, U.; Radhakrishnan, K.; et al. Argo profiling floats bring new era of in situ ocean observations. Eos Trans. Am. Geophys. Union 2004, 85, 185–191. [Google Scholar] [CrossRef]
- Roemmich, D.; Belbéoch, M.; Freeland, H.; Garzoli, S.L.; John Gould, W.; Grant, F.; Ignaszewski, M.; Klein, B.; le Traon, P.Y.; King, B.; et al. Argo: The challenge of continuing 10 years of progress. Oceanography 2009, 22, 46–55. [Google Scholar] [CrossRef]
- Wong, A.; Keeley, R.; Carval, T.; Argo Management Team. Argo Data Management Team Argo Quality Control Manual for CTD and Trajectory Data; Version 3.5; IFREMER: Brest, France, 2021. [Google Scholar] [CrossRef]
- Anderson, J.E.; Riser, S.C. Near-surface variability of temperature and salinity in the near-tropical ocean: Observations from profiling floats. J. Geophys. Res. Ocean. 2014, 119, 7433–7448. [Google Scholar] [CrossRef]
- Davis, R.E. Drifter observations of coastal surface currents during CODE: The method and descriptive view. J. Geophys. Res. 1985, 90, 4741. [Google Scholar] [CrossRef]
- Folland, C.K.; Parker, D.E. Correction of instrumental biases in historical sea surface temperature data. Q. J. R. Meteorol. Soc. 1995, 121, 319–367. [Google Scholar] [CrossRef]
- Kent, E.C.; Taylor, P.K. Toward estimating climatic trends in SST. Part I: Methods of measurement. J. Atmos. Ocean. Technol. 2006, 23, 464–475. [Google Scholar] [CrossRef]
- Kent, E.C.; Kennedy, J.J.; Berry, D.I.; Smith, R.O. Effects of instrumentation changes on sea surface temperature measured in situ. Wiley Interdiscip. Rev. Clim. Chang. 2010, 1, 718–728. [Google Scholar] [CrossRef] [Green Version]
- Xu, F.; Ignatov, A. Error characterization in iQuam SSTs using triple collocations with satellite measurements. Geophys. Res. Lett. 2016, 43, 10826–10834. [Google Scholar] [CrossRef]


Publisher’s Note: MDPI stays neutral with regard to jurisdictional claims in published maps and institutional affiliations. |
© 2021 by the authors. Licensee MDPI, Basel, Switzerland. This article is an open access article distributed under the terms and conditions of the Creative Commons Attribution (CC BY) license (https://creativecommons.org/licenses/by/4.0/).