Article

Quantitative Contributions of Climate Change and Human Activities to Vegetation Changes in the Upper White Nile River

1
State Key Laboratory of Soil Erosion and Dryland Farming on Loess Plateau, Institute of Soil and Water Conservation, Northwest A&F University, Yangling 712100, China
2
University of Chinese Academy of Sciences, Beijing 100049, China
3
Department of Environmental Information Systems, Faculty of Environmental Studies, University of Lay Adventists of Kigali, K K 508 St., Kigali P.O. Box 6392, Rwanda
4
Institute of Water Resources and Hydro-Electric Engineering, Xi’an University of Technology, No. 5 South Jinhua Road, Xi’an 710048, China
*
Author to whom correspondence should be addressed.
Remote Sens. 2021, 13(18), 3648; https://doi.org/10.3390/rs13183648
Submission received: 10 August 2021 / Revised: 4 September 2021 / Accepted: 10 September 2021 / Published: 13 September 2021

Abstract

:
Vegetation changes in the Upper White Nile River (UWNR) are of great significance to the maintenance of local livelihoods, the survival of wildlife, and the protection of species habitats. Based on the GIMMS NDVI3g and MODIS normalized difference vegetation index (NDVI) data, the temporal and spatial characteristics of vegetation changes in the UWNR from 1982 to 2020 were analyzed by a Theil-Sen median trend analysis and Mann-Kendall test. The future trend of vegetation was analyzed by the Hurst exponential method. A partial correlation analysis was used to analyze the relationship of the vegetation and climate factors, and a residual trend analysis was used to quantify the influence of climate change and human activities on vegetation change. The results indicated that the average NDVI value (0.75) of the UWNR from 1982 to 2020 was relatively high. The average coefficient of variation for the NDVI was 0.059, and the vegetation change was relatively stable. The vegetation in the UWNR increased 0.013/10 year on average, but the vegetation degradation in some areas was serious and mainly classified as agricultural land. The results of a future trend analysis showed that the vegetation in the UWNR is mainly negatively sustainable, and 62.54% of the vegetation will degrade in the future. The NDVI of the UWNR was more affected by temperature than by precipitation, especially on agricultural land and forestland, which were more negatively affected by warming. Climate change and human activities have an impact on vegetation changes, but the spatial distributions of the effects differ. The relative impact of human activities on vegetation change accounted for 64.5%, which was higher than that of climate change (35.5%). Human activities, such as the large proportion of agriculture, rapid population growth and the rapid development of urbanization were the main driving forces. Establishing a cross-border drought joint early warning mechanism, strengthening basic agricultural research, and changing traditional agricultural farming patterns may be effective measures to address food security and climate change and improve vegetation in the UWNR.

1. Introduction

As an important part of terrestrial ecosystems, vegetation is important in climate regulation, atmospheric composition regulation, water-energy-carbon exchange, and soil and water conservation; thus, changes in vegetation will have a significant impact on the ecological environment [1,2,3,4]. Changes in vegetation may be caused by many driving forces, including geological and landform changes, climate changes, natural disasters, increased CO2 concentrations, nitrogen deposition processes, land-use changes, and many other natural processes and human factors [2,5,6,7,8]. Changes in vegetation can also reflect changes in regional nature and human activities [9]. The effects of climate change and human activities on vegetation against the background of global change can provide a theoretical basis for ecosystem adaptability, which make it an important research topic in global change research and geography [10,11,12]. Climate is closely related to human activities, and it affect many major issues such as food, energy, population, vegetation and ecology. Climate provides the necessary living environment for human beings, and human beings have gradually established a coexistence relationship with the surrounding climate environment. However, human activities also have a significant impact on the climate. Human activities lead to changes in greenhouse gases, aerosols (small particles) and cloud cover in the Earth’s atmosphere, which result in climate change [13]. Studies have shown that vegetation changes are mainly related to long-term changes in climate factors and short-term human activities, and the speed and extent of the effects of human activities on vegetation in the short term have exceeded the effects of climate factors [14,15]. With the increase in global extreme temperature frequency and extreme precipitation events, the temperature and precipitation patterns continue to change, which has an enormous impact on vegetation growth [2,16,17]. Understanding the current states and dynamic change of different types of vegetation related to climate change and human activities is essential for formulating adaptive strategies to meet the challenges caused by climate change and the effects of human activities on the ecosystem [18].
The normalized difference vegetation index (NDVI) can well characterize vegetation growth and land cover change; it has been widely used to study vegetation dynamics and the impact of climate change on vegetation change, and it is the preferred indicator to study the relationship between vegetation change and climate change [12,18,19,20,21,22,23]. Lamchin et al. [24] used Advanced Very High-Resolution Radiometer (AVHRR) NDVI data from 1982 to 2014 to analyze the relationship between global vegetation greenness and both climate change and human activities. Zhao et al. [25] used AVHRR NDVI data to analyze global vegetation change and its driving factors from 1982 to 2013. Understanding and predicting how anthropogenic climate change will affect terrestrial ecosystems in Sub-Saharan Africa is not only a key issue of ecology but also a key to the development of regional and global climate policies [26]. Studies indicate that the vegetation in Sub-Saharan Africa is driven by rainfall and both fluctuations and oscillations of the sea surface temperature and atmospheric pressure, and the El Niño-Southern Oscillation (ENSO) is the main driving force that affect vegetation productivity and phenological changes in eastern and southern Africa [26]. In eastern Africa, climate change may cause droughts to last longer, be more severe, and occur more frequently [27]. East Africa is one of the known regions with serious vegetation degradation in Africa, and 49% of the area has vegetation degradation problems [28]. Abera [29] analyzed the effect of climate change on vegetation dynamics in East Africa. He believed that in the situation of increasing effects of climate change and human activities on the natural vegetation cover, understanding and monitoring the potential biogeographical processes of vegetation that affect climate is crucial for formulating and implementing effective land-use plans and mitigation measures. Pricope et al. [30] analyzed the relationship between vegetation degradation and both climate and population in the rangeland and pastoral livelihood zones of the Horn of East Africa. The results showed that not only drying precipitation patterns but also local population pressure and land-use changes resulted in the decline in vegetation conditions in the Horn of Africa. Located on the East African Plateau, Lake Victoria is the second largest freshwater lake in the world and an important water source area of the White Nile. Human development and climate change have significantly altered the vegetation characteristics in this area, and human activities are the main driving factors of the vegetation change in the Lake Victoria basin, where the expansion of urbanization occurs at the cost of vegetation [31].
In the present study, the main objectives were to (1) study the temporal and spatial characteristics of the vegetation change trend in the UWNR, (2) explore the spatial differences in the correlation of vegetation and climate factors, (3) quantify the impacts of climate change and human activities on vegetation change, and (4) explore the driving mechanism of vegetation change in the UWNR. This research can provide scientific evidence for regional ecological environmental protection and restoration and offer reliable background information for environmental improvement, benefit evaluation and land use adjustment for UWNR-related countries.

2. Study Area

The White Nile is one of the two main tributaries of the Nile River. It is located in the Lake Plateau of East Africa and is the core area of the East African Rift Valley. In this study, the Mongalla hydrological station in South Sudan was selected as the control point, and the confluence area controlled by the hydrological station was used as the research basin (Figure 1a). The main body of the study area is situated in Uganda and covers parts of Rwanda, Burundi, Tanzania, Kenya, South Sudan and the Democratic Republic of Congo. It covers an area of approximately 4.78 × 10⁵ km2 (29.0287°–35.8499°E, 5.2209°N–3.9928°S), of which the water area is approximately 0.81 × 10⁵ km2, including Lake Victoria, Lake Albert, Lake Edward and Lake Kyoga. The altitude of the study area is 432–5034 m; the lowest altitude is at the outlet of the basin and the highest altitude is in the Rwenzori Mountains (Figure 1d,e). The eastern and western sides of the basin are mostly mountainous, and the terrain north of the equator is relatively flat. Most of the region has a tropical savanna climate and tropical mountain climate. The annual average precipitation is 1199 mm, and the annual average temperature is 22.29 °C. Due to the large area of the study area and the complex and variable topography, the durations of the dry season and rainy season in different regions are quite different. Based on the precipitation from 1982 to 2018, the dry season of the UWNR is mainly from December to February and from June to August, with average monthly precipitation of 74 mm and 76 mm, respectively. The wet season is mainly from March to May and from September to November, with average monthly precipitation of 138 mm and 112 mm, respectively. According to the analysis of the annual precipitation (PRE) and annual mean temperature (TMP) in the upper reaches of the UWNR from 1982 to 2018, both PRE and TMP show an increasing trend, and the entire region shows a “warming and becoming more humid” trend. Areas with a relatively high PRE are mainly located in Kenya, while the southeastern part of the basin has the lowest precipitation in Tanzania (Figure 1b). The spatial distribution of TMP is closely associated with the altitude and latitude of the region. The TMP of the mountainous areas on the eastern and western sides of the basin is relatively low, while the TMP in the north of the basin is relatively high and mainly distributed in South Sudan (Figure 1c). According to the land-use status data in 2001, the study area was dominated by agricultural land, and the area of forestland was relatively small. Agricultural land, forestland, grassland and shrubland accounted for 49.56%, 16.90%, 2.88% and 11.60% of the total area, respectively, and the four land-use types accounted for a total of 80.94% (Figure 1f). Located in the Great Rift Valley of East Africa, the UWNR is an important wildlife habitat and an area with a high degree of agricultural development. The livelihood problems caused by rapid population growth have promoted increasing human activities in this area, and the ecological problems of the UWNR, which are already prominent in the man-land contradiction, have gradually become prominent.

3. Materials and Methods

3.1. Data Sources and Processing

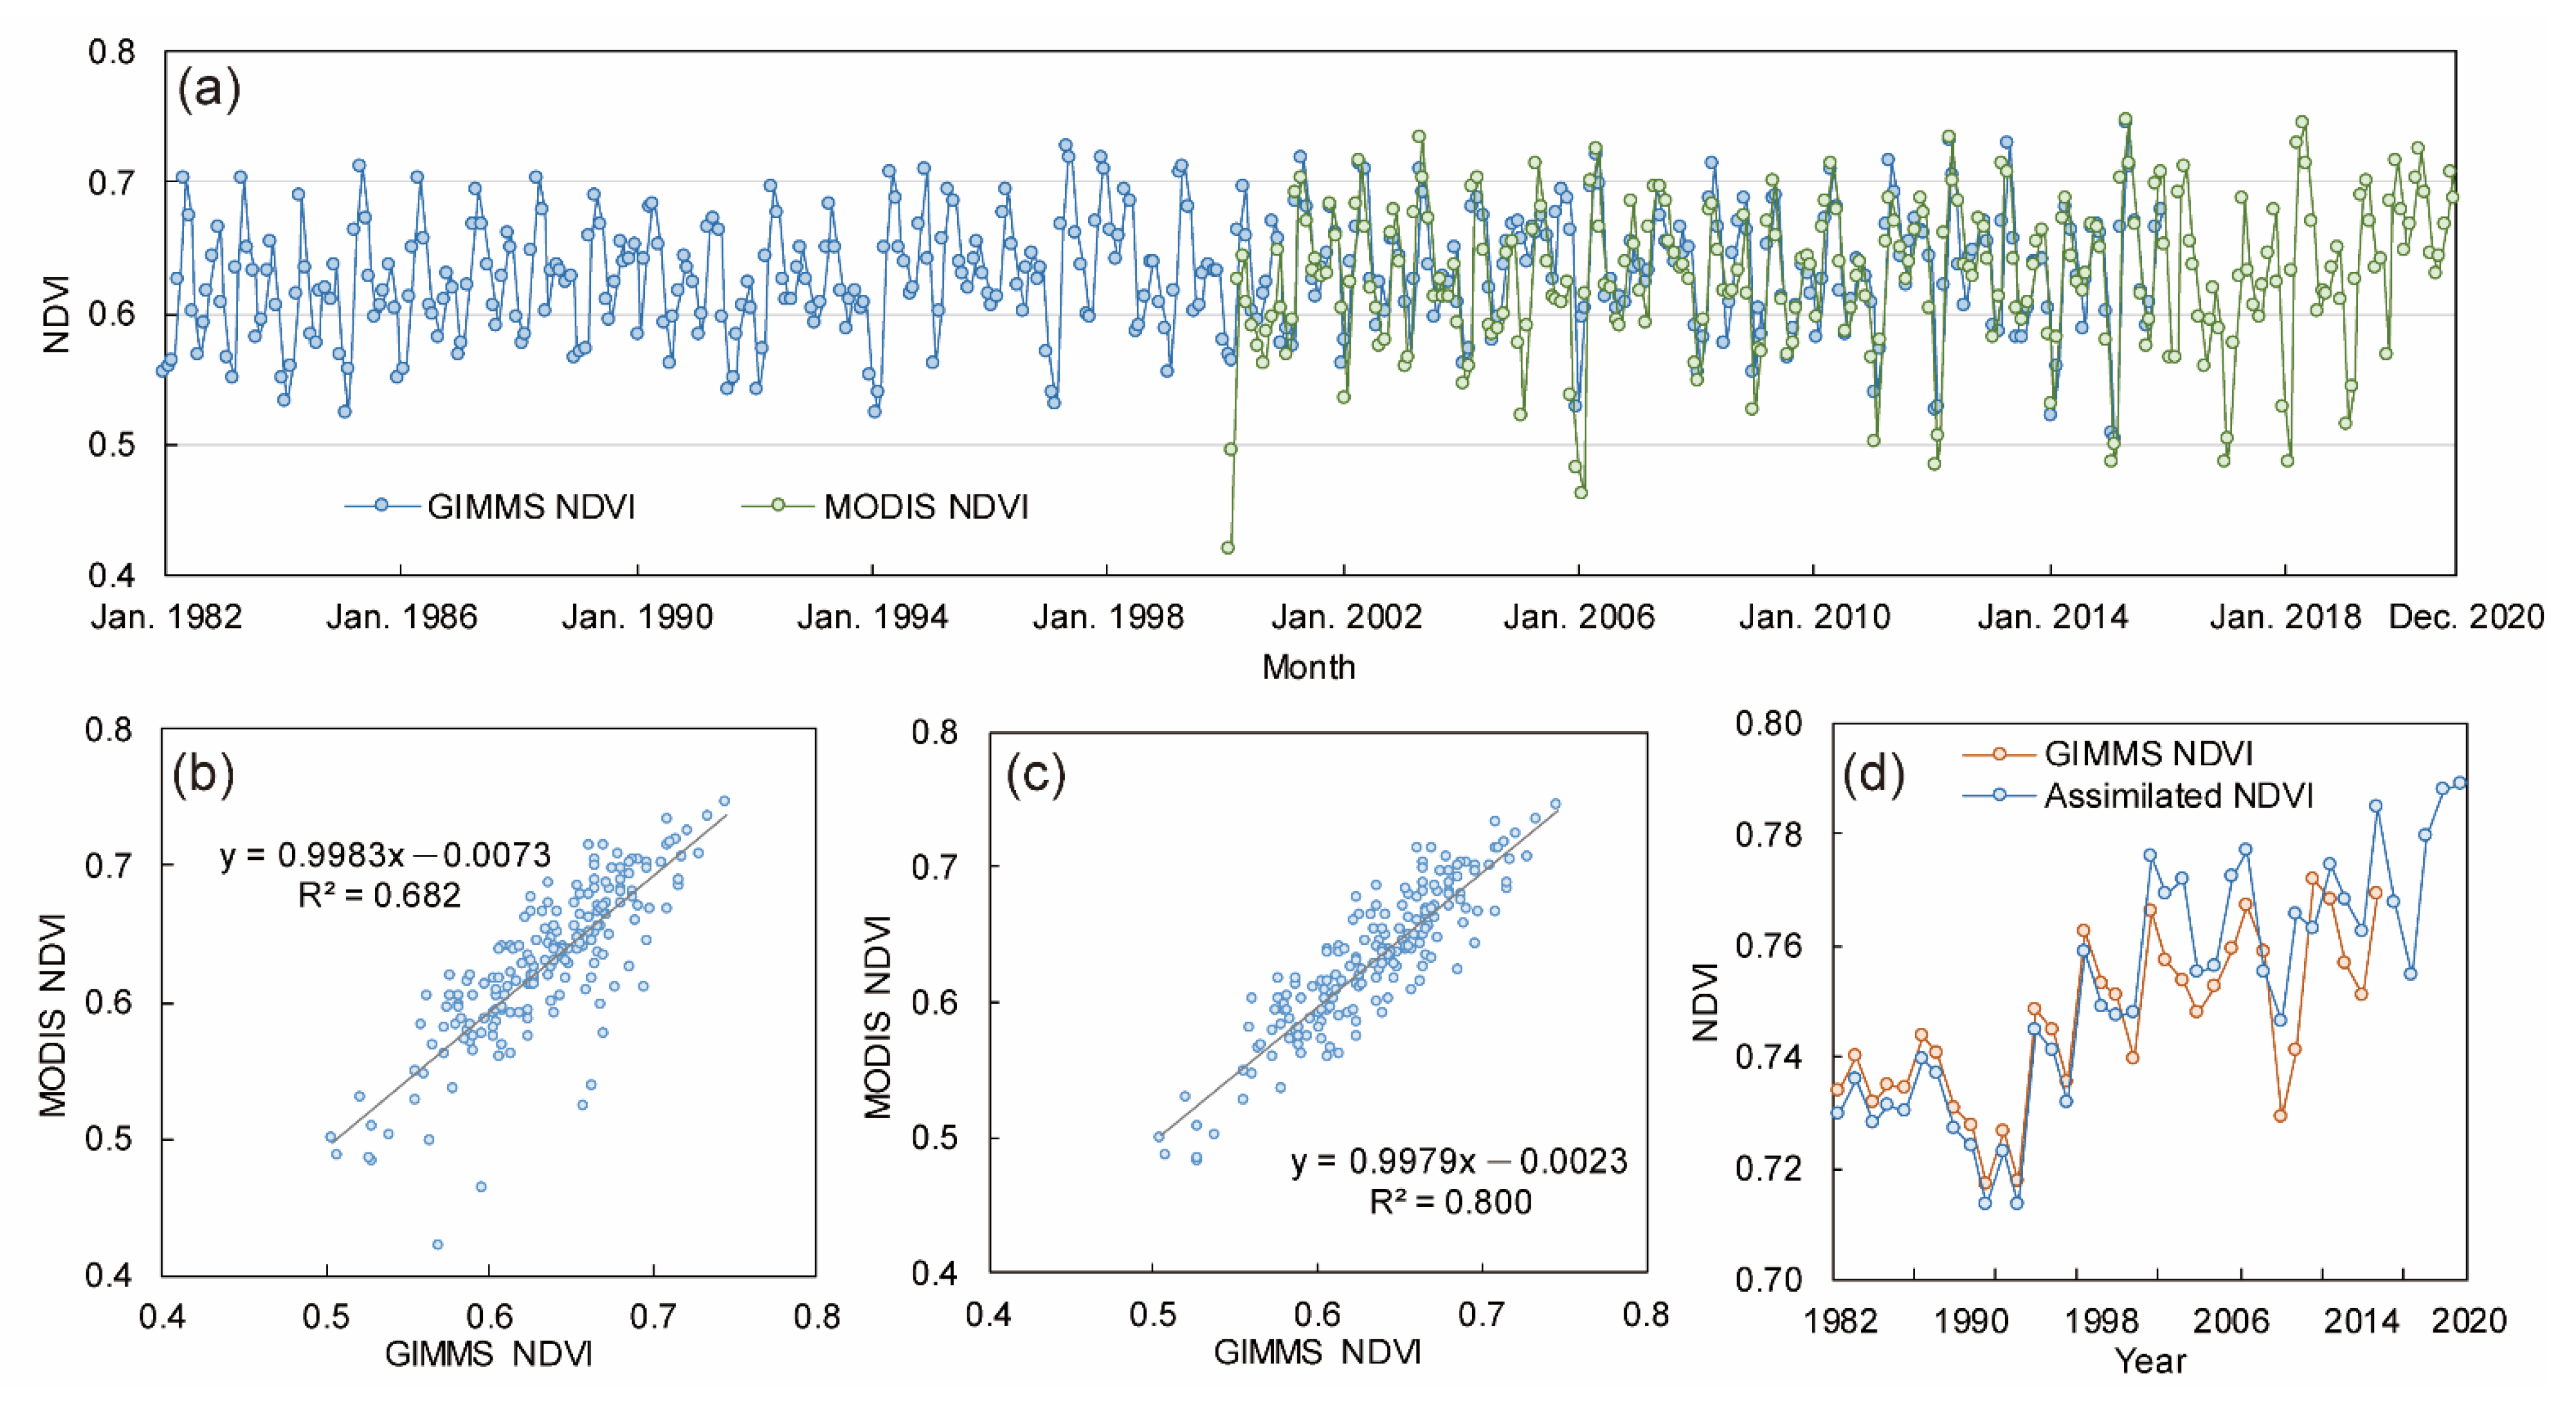
This study used NDVI data and climate, topography and land-use data. The NDVI data that we used included the National Oceanic and Atmospheric Administration (NOAA) AVHRR dataset released by the Global Inventor Modeling and Mapping Studies (GIMMS) of National Aeronautics and Space Administration (NASA) and the EOS MODIS NDVI dataset provided by NASA’s Land Processes Distributed Active Archive Center (LP DAAC/NASA). The NOAA AVHRR dataset spans a long period, but the spatial resolution is low. Considering satellite sensors and data processing problems, the dataset has considerable noise [32]. The MODIS NDVI dataset spans a shorter period but has a higher spatial resolution and accuracy than the GIMMS NDVI; thus, MODIS NDVI data are widely used in the study of regional vegetation cover changes [33,34]. The semi-monthly AVHRR GIMMS NDVI 3g V1 data used in this study are from January 1982 to December 2015, and the spatial resolution is 8 km. (https://ecocast.arc.nasa.gov/data/pub/gimms/ (accessed date: 17 December 2018)). The period of the MODIS MOD13Q1 16 d data is February 2000–December 2020, and the spatial resolution is 250 m (http://modis.gsfc.nasa.gov/data (accessed date: 26 February 2020)). The monthly and annual NDVI adopted the maximum value composite method (MVC, Figure 2a,d), which could further eliminate the disturbance of clouds, the atmosphere and other factors and improve the accuracy of the data [35].
The overlapping period of GIMMS NDVI and MODIS NDVI data is from February 2000 to December 2020. Based on the above period, a linear relationship of monthly data was established, and this linear relationship was applied to the period of GIMMS NDVI from January 1982 to January 2000 to obtain new time series data to complete the assimilation of GIMMS NDVI and MODIS NDVI data [15]. The monthly GIMMS NDVI data and the monthly MODIS NDVI data tended to be consistent in the overlapping period (Figure 2a). The two sets of data had very significant differences (p < 0.001), but the correlation between the two was poor (R2 = 0.68, Figure 2b). The differential value between the two datasets was analyzed by using a SPSS Explore analysis, and we found that there were some singular and extreme values, mainly in 2000 and 2005. Therefore, after eliminating the above singular values and extreme values, there was a significant difference between the two datasets (p < 0.05), and a good correlation showed that the GIMMS NDVI data can be linearly corrected (R2 = 0.80, Figure 2c). Therefore, the GIMMS NDVI data from January 1982 to March 2000 were adjusted by using the linear fitting relationship between the two datasets, and combined with the MODIS NDVI data from April 2000 to December 2020 to form a new series of NDVI data from 1982 to 2020 (Figure 2d).
The monthly precipitation and temperature data from 1982 to 2018 used in this study came from historical monthly weather data from the Global Climate and Weather Data (1960–2018, https://www.worldclim.org (accessed date: 29 December 2019)). These data were downscaled from CRU-TS-4.03 data by the Climatic Research Unit, University of East Anglia after adopting WorldClim 2.1 for bias correction [36,37]. After analyzing the trends of PRE and TMP in the UWNR, it was found that both PRE and TMP increased. The increase in PRE was 3.68 mm/year, and the increase in TMP was 0.023 °C/year.
Different land uses and land covers have decisive effects on the spatial distribution of the NDVI values. Therefore, the change trend of the NDVI value under different vegetation types was discussed by using land cover in the middle year (2001) of the research period as a benchmark. Climate Change Initiative Land Cover data products were used for the land cover data, which have a spatial resolution of 300 m (http://maps.elie.ucl.ac.be (accessed date: 16 October 2020)). The data included 21 types of land cover in 6 categories. Considering the major vegetation types in the research area, we further divided the agricultural land into two different types (Table 1). Therefore, the land cover types in the study area were combined into five main vegetation types.
Digital elevation model (DEM) data came from the SRTM (Shuttle Radar Topography Mission) digital elevation data product with a spatial resolution of 90 m [38] (http://srtm.csi.cgiar.org (accessed date: 17 April 2020)). Gradient UWNR data were obtained with ArcGIS 10.6, and the elevation and gradient were graded to analyze the relationship between terrain and vegetation (Figure 1d,e). According to the elevation range of the UWNR, the elevation of the area was divided into the following 6 elevation zones: <500 m (E1); 500–1000 m (E2); 1000–1500 m (E3); 1500–2000 m (E4); 2000–2500 m (E5) and >2500 m (E6). A total of 67.47% of the research area (including bodies of water) is in the E3 elevation zone. The gradient was also divided into the following 6 grades: 0–2° (G1); 2–5° (G2); 5–10° (G3); 10–15° (G4); 15–25° (G5) and >25° (G6). A total of 47.46% of the land area had a slope below 2°, and 28.30% of the area was in the G2 slope zone.

3.2. Methods

3.2.1. Coefficient of Variation

The coefficient of variation is an effective indicator to measure the degree of numerical variation, and it can truly reflect the difference in numerical changes over time. It is a commonly used method in vegetation research [39,40,41,42] and is calculated as follows:
C V = 1 NDVI ¯ [ 1 n i = 1 n ( NDVI i NDVI ¯ ) 2 ] 0.5
where CV is the coefficient of variation of the NDVI value of each pixel on different time scales, σ NDVI is the standard deviation of the NDVI value, NDVI ¯ is the average annual NDVI, i is the time series; NDVI i is the NDVI value of the ith year, and n is the year span of the time scale. In this study, the coefficient of variation is used to express the relative fluctuation degree of vegetation NDVI. When the coefficient of variation is large, the intensity of the disturbance is greater and the vegetation is more unstable. When the value is smaller, the vegetation is relatively stable.

3.2.2. Mann-Kendall Mutation Test

The nonparametric Mann-Kendall (MK) mutation test method was adopted to test the mutation points of PRE, TMP and the annual NDVI value. This method does not need samples to fit a specific distribution and is not influenced by outliers [43]. This method is currently extensively used for mutation testing with long-term sequence data [44,45,46,47].
When using the MK mutation method for mutation testing, a sequence 𝑆k is constructed by using the time series X of length n:
S k = i = 1 k r i   ,               k = 2 ,   3 ,   ,   n
When xi > xj, ri = 1, and when xi < xj, ri = 0 (j = 1, 2, ⋯, i). Under the assumption of the random independence of the time series, UFk is defined as follows:
U F k = [ S k E ( S k ) ] / v a r ( S k )   ,               k = 1 ,   2 ,   ,   n
where 𝐸(𝑆k) and var(𝑆k) are the mean and variance of 𝑆k, respectively. UFk satisfies the normal distribution. When UFk > 0, the data tend to increase; conversely, the data have a downward trend. The significance threshold is 1.96; that is, when |UFk|> 1.96, the change trend passes the 0.05 significance test. According to the reverse order of the 𝑥i time series, we then repeat the above calculation and slove UBk = −UFk (k = n, n − 1, …, 1, UB1 = 0) to obtain the new statistic UBk. Next, the UFk and UBk curves are drawn. If the UFk curve intersects the UBk curves and the intersection point is between the critical lines (±1.96), then the time point that correspond to the intersection point is the time when the mutation starts.

3.2.3. Theil-Sen Median Trend Analysis and Mann-Kendall Nonparametric Significance Test

The Theil-Sen median trend analysis method was adopted to analyze the spatial distribution characteristics of vegetation trends, and the statistical significance of the trend analysis results was tested by the MK test [41,45]. The combined use of the two methods can enhance the immunity to noise, and it can be not affected by the sample distribution pattern and the interference of outliers. The combination improves the accuracy of the test results to a certain extent and is an available method to test the tendency of time series [45,48,49,50].
The Theil–Sen slope test method can be expressed as follows:
β = m e d i a n ( x j x i j i ) ,     1 i < j n
where β is the change tendency of the NDVI (the annual change rate of the NDVI), and xj and xi are the corresponding NDVI values of the jth and ith years of the time series, respectively. If β > 0, then this indicates that the NDVI has a tendency to increase; if β < 0, then this indicates that the NDVI has a downward trend.
The merits of the MK nonparametric significance test method are that the sample data do not need to fit a certain distribution, and they cannot be disturbed by outliers. Therefore, this method can be adopted to test the significance of vegetation change trends in the time sequence [41,45,48,51,52]. For time series [xi], i = 1, 2, …, n, the standardized test statistic Z is defined as follows:
Z = { S 1 V a r ( s )     ( S > 0 ) 0         ( S = 0 ) S + 1 V a r ( s )     ( S < 0 )
where Z is the standardized test statistic, S is the test statistic, and n is the number of NDVI time series samples. When n ≥ 8, the statistic S is roughly normally distributed, with a mean value of 0. m is the number of knots (repetitive data groups) in the series, and ti is the width of the knot (the number of repeated data in the ith repeated data group). The normalized Z is the standard normal distribution. If |Z| > Z1−α/2, then the change trend is statistically significant. Z1−α/2 is the corresponding value of the standard normal function distribution table under confidence level α. The NDVI time series in this study covers 39 years (1982–2020), and the length of each period is 18 (1982–1999) or 21 (2000–2020) years. The trend test was performed by the test statistic Z, and the significance level was α = 0.05, Z1-α/2 = 1.96.

3.2.4. Hurst Exponent

The Hurst exponent is an available method to quantitatively represent the long-term dependence of time sequence data. It is extensively used in hydrology, meteorology and economics to detect the evolution trend of long-term series variables in the future. It has also been gradually used in vegetation research [5,41,53,54]. This study used the Hurst exponent calculation with the R/S analysis method, and the principle is as follows [5,41]:
R ( τ ) S ( τ ) = R S
If R/SτH, then this shows that [NDVI(t)] has the Hurst phenomenon. H and τ represent the Hurst exponent and the length of the time series, respectively. The linear regression equation of one variable log(R/S)n = a + H × log(n) is obtained with a logarithmic transformation, and then, the least square method is used to fit H. The range of H values is 0–1. If 0 < H < 0.5, then the NDVI time sequence has anti-continuity, and the future change tendency is opposite to the past change tendency. If 0.5 < H < 1, then this means that the NDVI time sequence has continuity traits, and the future tendency of changes accords with the past. When H is closer to 0, the anti-persistence is stronger. When H is closer to 1, the continuity is stronger. If H = 0.5, then the NDVI time sequence is random, and the future tendency is not related to the past tendency.

3.2.5. Partial Correlation Analysis

Partial correlation analysis is a geostatistical method based on correlation analysis. When two variables are correlated with the third variable at the same time, the influence of the third variable is eliminated, and only the degree of correlation between the other two variables is considered [5,55]. Compared with the simple correlation coefficient, the partial correlation coefficient reflects a more intrinsic correlation of the two variables by eliminating the influence of random variables on the correlation of these two variables [56]. Partial correlation analysis can make the results more precise and credible and can be widely employed in the study of the relationship between regional vegetation and climate [2,5,41,57,58,59]. Compared with correlation analysis, partial correlation analysis can exclude the impact of other climate factors [55]. The calculation formula is as follows:
R x y , z = R x y R x z R y z ( 1 R x z 2 ) ( 1 R y z 2 )
where Rxy,z is the partial correlation coefficient between variable x and variable y after independent variable z is fixed, and Rxy, Rxz, and Ryz are the correlation coefficients of variables x and y, variables x and z, and variables y and z, respectively. The T test method was used to test the significance of the above partial correlation coefficient.

3.2.6. Attributing Vegetation Change

This study used the method developed by Li et al. [15] to quantify the effects of climate change and human activities on vegetation in the UWNR. Changes in the NDVI can be decomposed into the NDVI (NDVIclim) influenced by climate change and the NDVI (NDVIhum) influenced by human activities [14]. Then, the average NDVI over a period of time can be decomposed into the NDVI with the impact of climate change ( NDVI ¯ c l i m a t e ) and the NDVI with the impact of human activities ( NDVI ¯ h u m a n ) [15]:
NDVI ¯ = NDVI ¯ c l i m a t e + NDVI ¯ h u m a n
Assuming that the effect of human activities varies greatly in different periods, the NDVI, PRE, and TMP of the entire research time period can be divided into two periods, namely, the pre-change (T1) and post-change (T2) periods [14,15,60].
According to Formula (18), the calculation formula of the NDVI affected by human activities in the two periods is as follows:
NDVI ¯ h u m a n , T 1 = NDVI ¯ T 1 NDVI ¯ c l i m a t e , T 1
NDVI ¯ h u m a n , T 2 = NDVI ¯ T 2 NDVI ¯ c l i m a t e , T 2
Since the beginning of the 21st century, the overall situation of the African continent has changed from chaos to stability, the economy has grown rapidly for many years, and the population has increased rapidly, which has prompted the impact of human activities on the ecological environment to increase rapidly. Combined with the results of the mutation test, the year 2000 was regarded as the time node, and the research period was divided into periods T1 and T2. Although the vegetation change in the study area before 2000 was also affected by human activities, the intensity was relatively low compared with that after 2000. Therefore, it is assumed that the intensity of human activities is lower in the T1 period than in the T2 period, which is mainly affected by climate change, the NDVI during the T1 period has a good correlation with precipitation and the average temperature, and the regression relationship of the NDVI and climate factors can be established as NDVI c a l , i = β 1 + β 2 PRE i + β 3 TMP i . Equation (9) can be rewritten as:
NDVI ¯ h u m a n , T 1 = NDVI ¯ T 1 1 n i = 1 n NDVI c a l , i
where NDVIcal,i represents the predicted value of the ith year in the T1 period, β1 represents the constant of the regression equation, β2 and β3 represent the regression coefficients, PREi and TMPi are the PRE and TMP of the ith year, respectively, and n presents the number of time series samples during the T1 period. In the T2 period, it is believed that the impact of human activities on the NDVI has increased significantly. The regression relationship of the NDVI and climate factors in the T1 period was applied to the T2 period, the predicted value of the NDVI time series under the impact of climate factors was calculated, and the average value was calculated:
NDVI ¯ h u m a n , T 2 = NDVI ¯ o b s , T 2 NDVI ¯ c a l , T 2
where NDVI ¯ o b s , T 2 and NDVI ¯ c a l , T 2 are the average values of the observed and predicted values of the NDVI in the T2 period, respectively. The total change in vegetation during the T2 period relative to the T1 period can be calculated by the following formula:
Δ NDVI t o t a l = NDVI ¯ T 2 NDVI ¯ T 1
where ΔNDVItotal represents the common impact of climate change and human activities and can be expressed by the following formula:
ΔNDVItotal = ΔNDVIclimate + ΔNDVIhuman
The vegetation change caused by human activities (ΔNDVIhuman) and the vegetation change caused by climate change (ΔNDVIclimate) were calculated by the following formulas:
Δ NDVI h u m a n = NDVI ¯ h u m a n , T 2 NDVI ¯ h u m a n , T 1
ΔNDVIclimate = ΔNDVIclimate,T2 – ΔNDVIclimate,T1
Using the above formulas, this study can quantify the contributions of climate change and human activities to NDVI changes. The T1 period was 1982 to 1999, and the T2 period was from 2000 to 2018.

4. Results

4.1. Variation in the NDVI

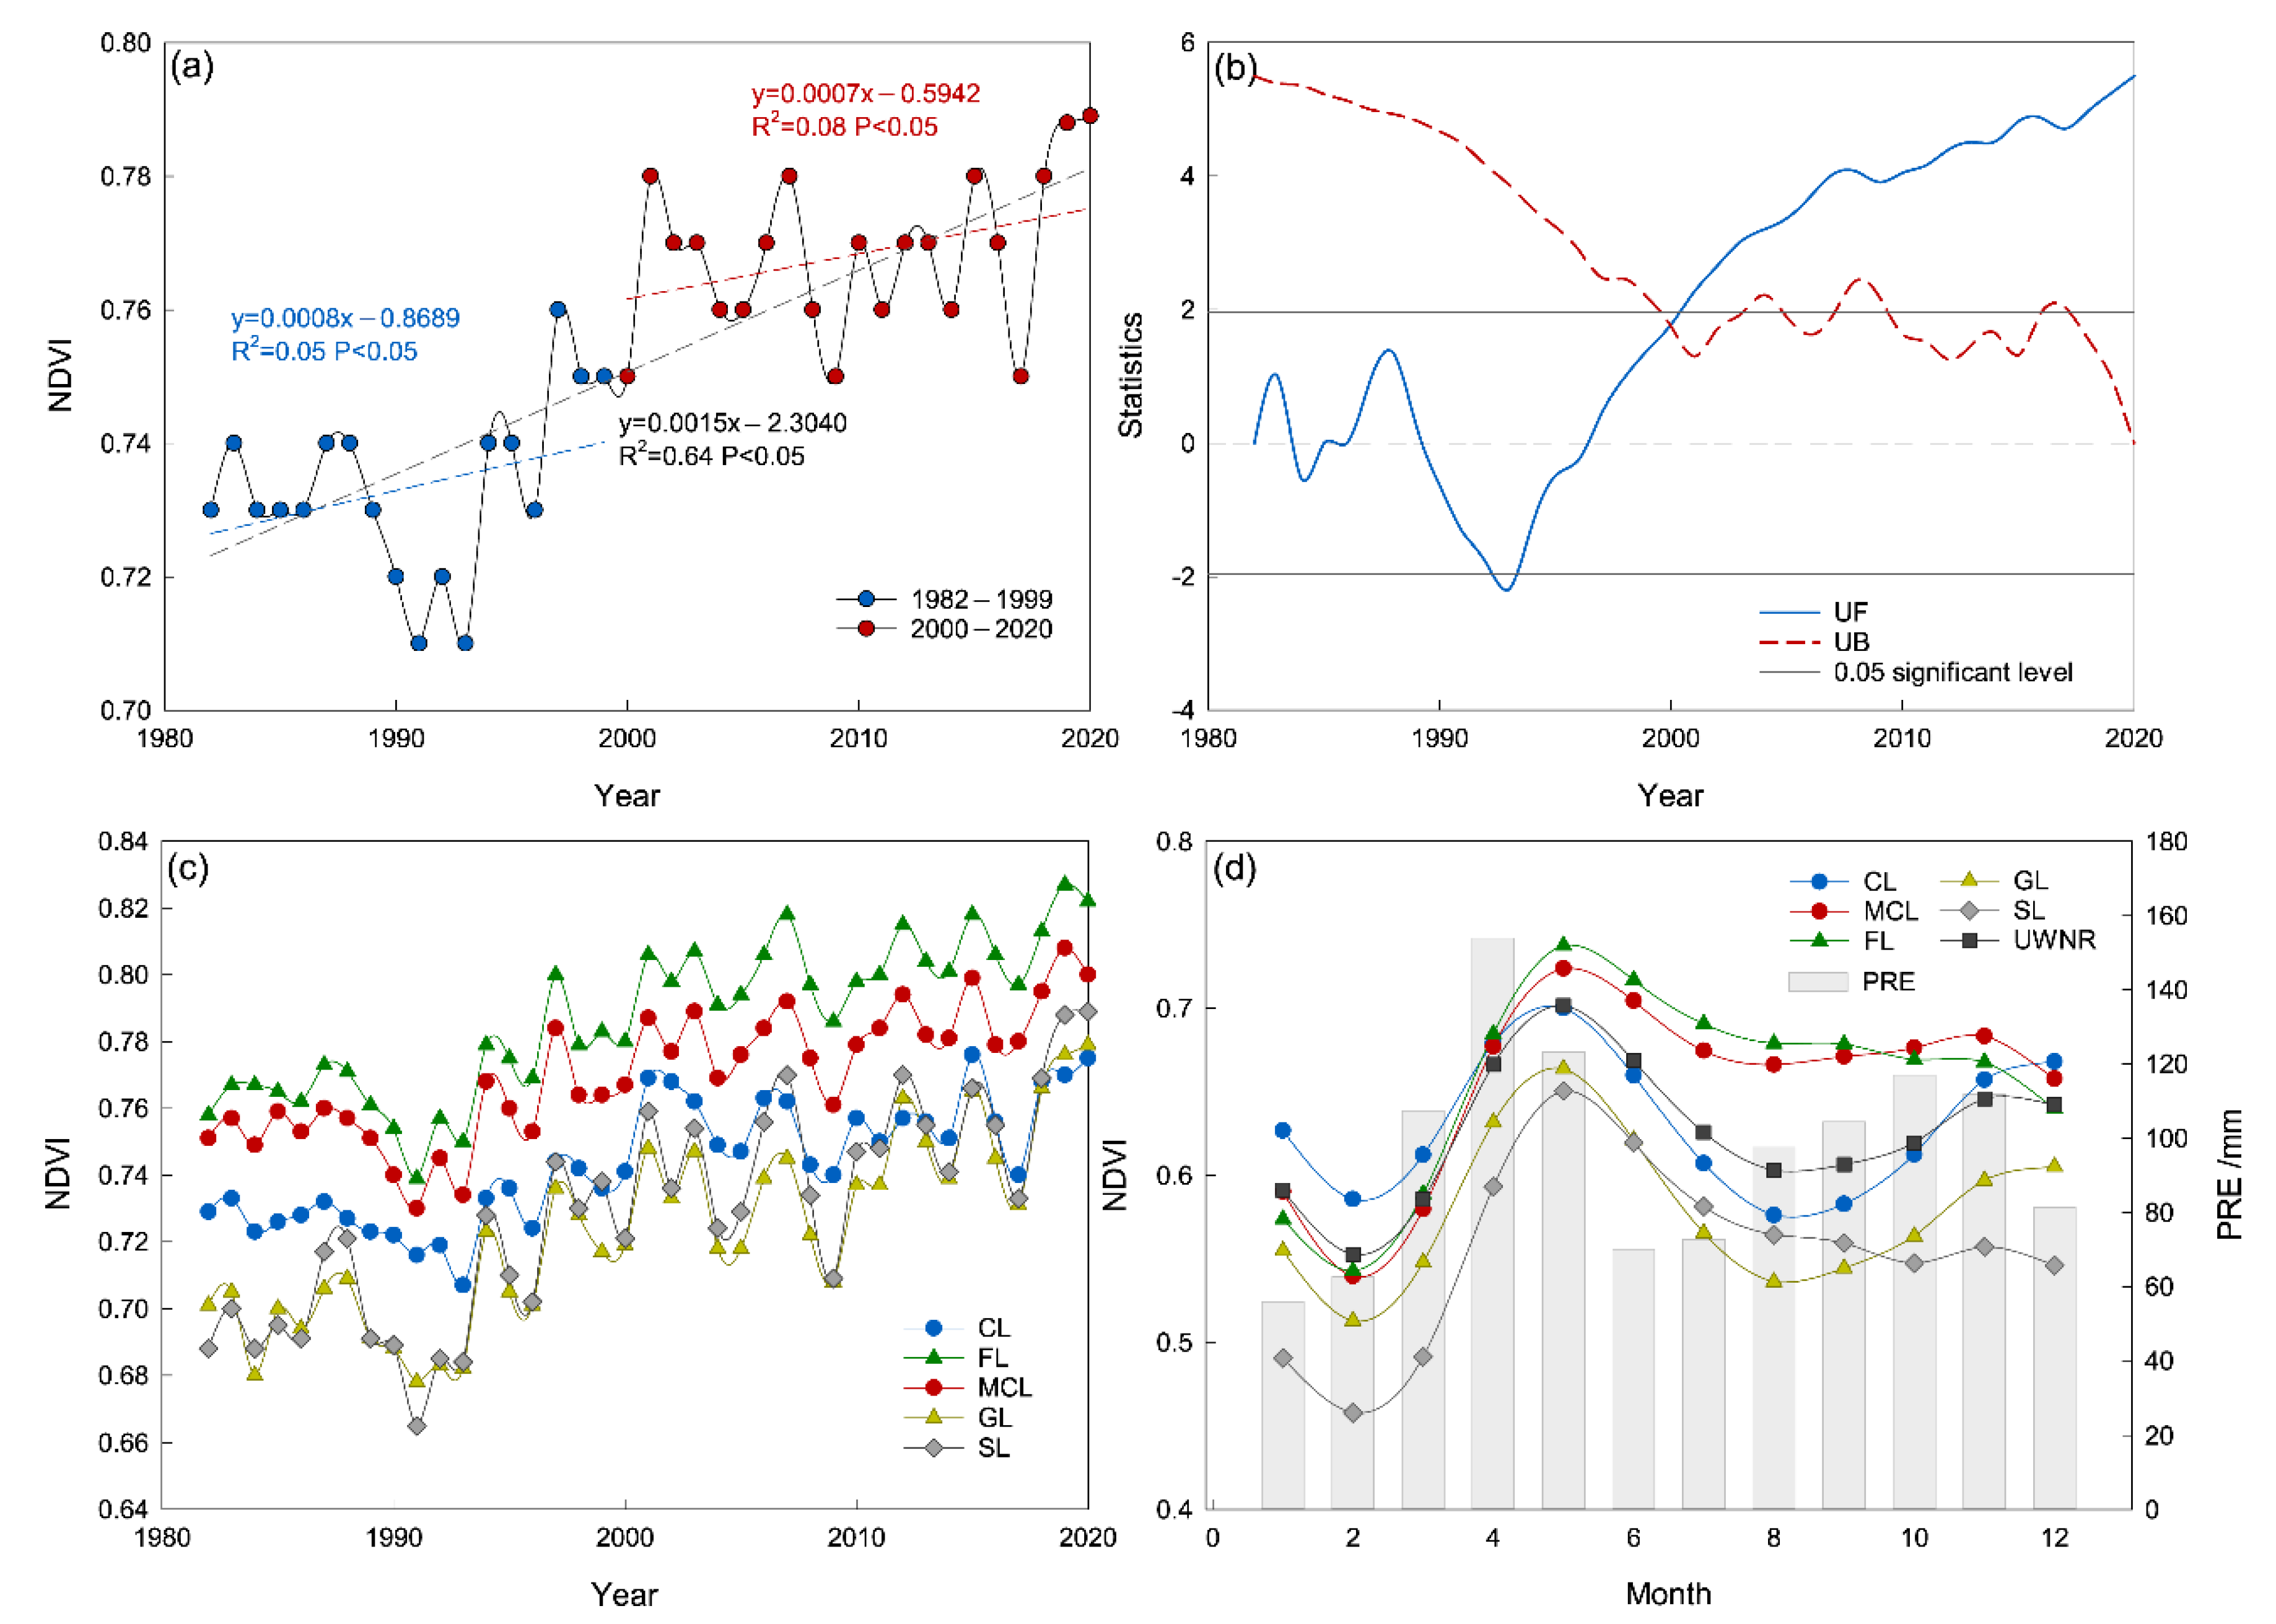
The average NDVI value of the UWNR from 1982 to 2020 fluctuated between 0.71 and 0.79, and the overall state of vegetation coverage was relatively high. The minimum and maximum values were 0.713 in 1991 and 0.789 in 2020, respectively. The NDVI value of vegetation showed an overall increasing trend over time (Figure 3a), and the increase in the NDVI was 0.013/10 year (on the basis of the results of the Theil-Sen median trend analysis, the same below). Based on the MK mutation test results of the NDVI time series, the abrupt change in vegetation in the study area from 1982 to 2020 occurred in 1999, and the vegetation change trend could be roughly divided into two stages (Figure 3b). In the first stage (1982–1999), the NDVI showed a process from increasing to a significant decrease and then to increasing, and the range of changes was large. In the second stage (2000–2020), the NDVI showed a trend of rising volatility. The increasing trends of the NDVI were 0.009 and 0.0086/10 year, respectively. The increase in the NDVI was higher in the first stage than in the second stage.
The distribution of the NDVI intra-annual change showed a bimodal curve trend (Figure 3d), with the first peak in May and the second peak in November–December. The intra-annual change in the NDVI had a certain correspondence with the intra-annual change in precipitation, but the peak of the NDVI was delayed by approximately 1 month after the peak of precipitation, which indicated an obvious lag. The variation patterns of the NDVI of various vegetation types were relatively similar and tended to be consistent with the variation patterns of the NDVI in the whole basin.
The average NDVI of CL, MCL, FL, GL and SL from 1982 to 2020 were 0.74, 0.77, 0.79, 0.72 and 0.73, respectively. The NDVI of CL and MCL was higher than that of GL and SL but lower than that of FL. The NDVI of all types of vegetation showed an increasing trend over time (Figure 3c), and the interannual variation range of GL and SL was relatively large.
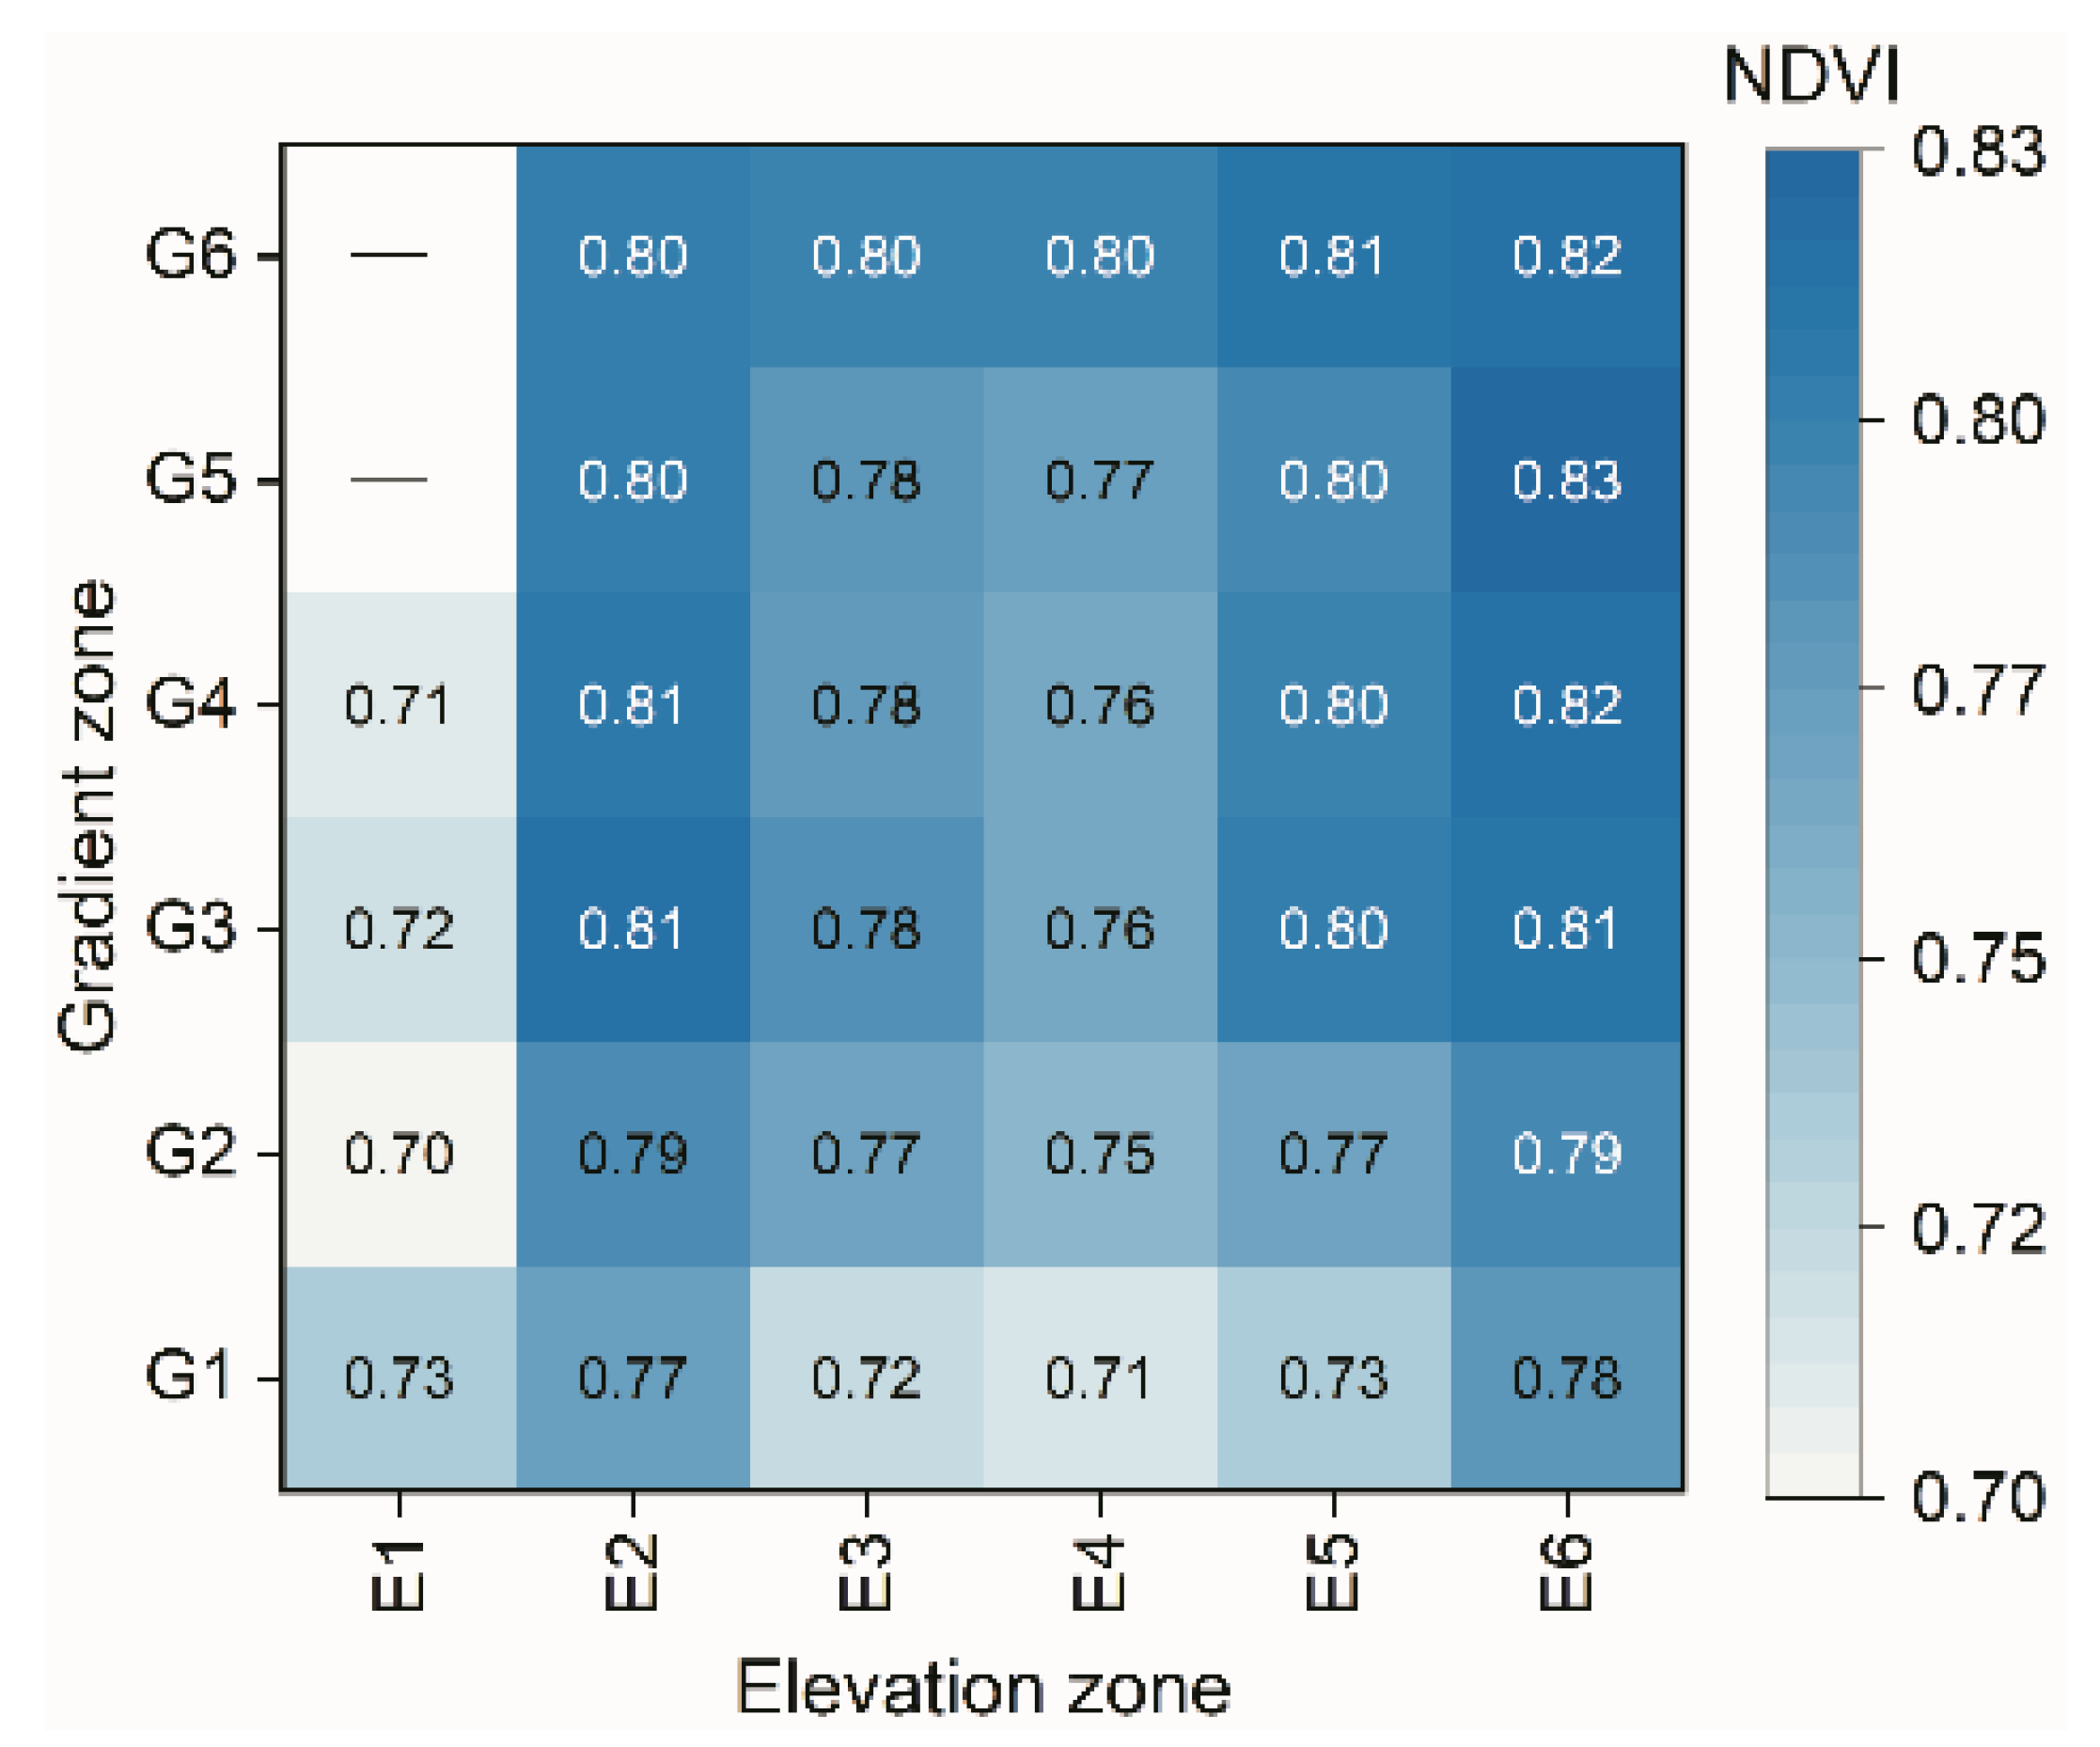
The NDVI value of the UWNR presented an obvious zonal distribution with topographical changes (Figure 4). With increasing elevation and gradient, the average NDVI value represented an increasing trend. The lowest average NDVI value was in the E1/G2 region, with an average NDVI value of 0.695; the highest area was in the E6/G5 region, with an average NDVI of 0.826. There were great differences in the elevation and slope between the two areas. Overall, areas with elevations higher than 2500 m and gradients greater than 10° had the best vegetation conditions, and sites with these criteria were mainly located in the high mountain areas on the eastern and western edges of the basin. Areas with relatively poor vegetation conditions were mainly located in the areas with an elevation below 500 m and in areas with a gradient of less than 2°. These areas were mainly located in the areas north of the equator and in low-lying areas at the outlet of the drainage basin in South Sudan.
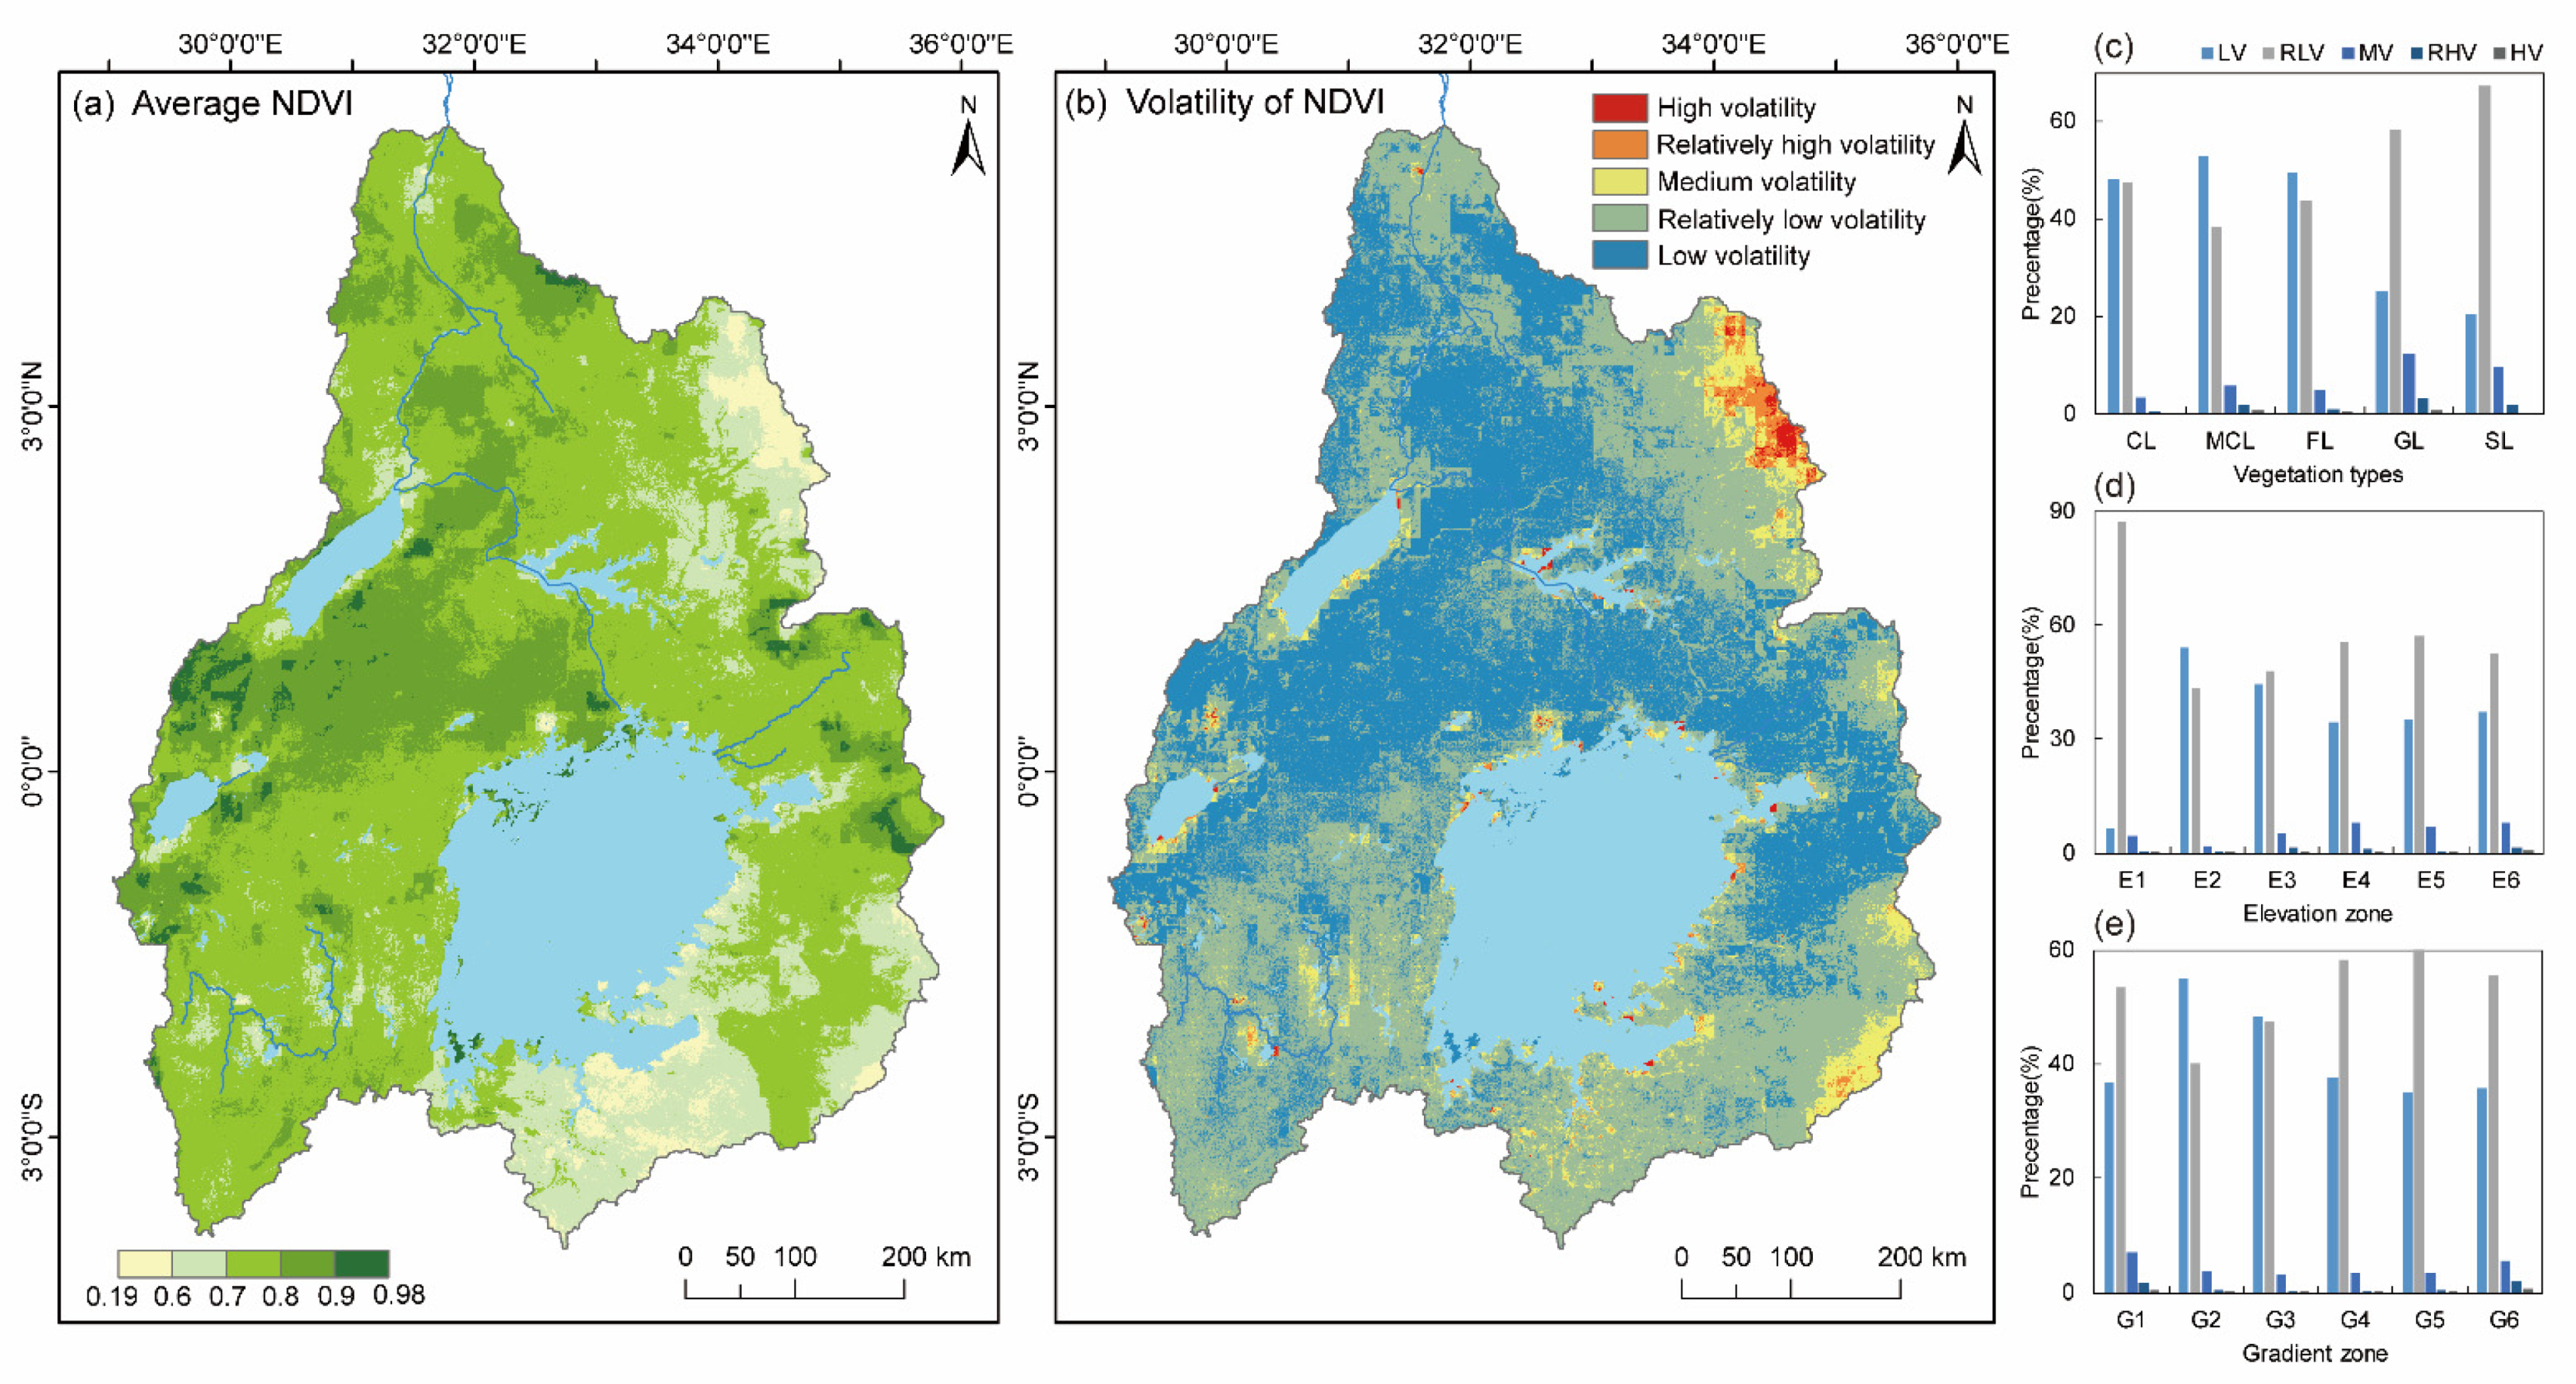
The NDVI value of the area north of the equator in the basin was generally higher than that of the area south of the equator (Figure 5a). The areas with high annual average NDVI values were mainly distributed among the four lakes. A total of 73.51% of the land area in the basin had an NDVI value between 0.6 and 0.8, and 23.19% of the area had an NDVI value greater than 0.8. In 1.87% of the area, the NDVI value was higher than 0.9, and these sites were mainly distributed in mountainous areas with an elevation higher than 2000 m and located at the edge of the eastern and western sides of the basin. Areas with NDVI values lower than 0.6 were mainly located in the northeastern part of the basin and areas south of Lake Victoria, and they accounted for the smallest proportion (3.30%).

4.2. The Volatility of the Vegetation

The coefficient of variation (CV) represents the relative fluctuation degree of vegetation in a time sequence and can be used to explore the stability of vegetation changes. When the CV value is higher, the vegetation is more disturbed and the volatility is higher. When the CV value is smaller, the vegetation state is more relatively stable. When CV < 0.10, the vegetation fluctuation is small, and the vegetation condition is stable. When CV is between 0.10 and 0.15, the vegetation fluctuation is considered to be at the middle level. When CV > 0.15, the vegetation fluctuation is high, and the vegetation is unstable. We calculated the CV of vegetation NDVI from 1982 to 2020 pixel-by-pixel and divided it into 5 levels [1]. The results are represented in Table 2. According to the classification and statistical results in the table, the NDVI fluctuated slightly in most areas of the UWNR from 1982 to 2020, which accounted for 93.02% of the total land area. The area of low volatility accounted for 43.56% and was mainly distributed north of the equator (Figure 5b). The area with relatively low volatility accounted for 49.45% and was mainly located in the region south of the equator, followed by the northeast and northern regions. The area proportions of high volatility and relatively high volatility in the UWNR were only 0.41% and 1.14%, respectively, and were mainly located in mountainous areas in the northeast and southwest of the basin, lake shore areas and large cities.
The NDVI vegetation changes on CL, MCL and FL were relatively more stable due to the higher proportion of low volatility areas (Figure 5c). The relatively low volatility areas of GL and SL were absolutely dominant. The relatively low volatility area of E1 accounted for 87.62% (Figure 5d). The areas with low vegetation volatility on E2~E6 accounted for 24.76~54.29%. The vegetation stability of E1 was lower than that of the other elevation zones. However, as elevation increased, the proportion of high volatility areas also increased, but the proportion was very small. The areas with low and relatively low volatility accounted for a higher proportion in each gradient zone, and the vegetation was relatively stable (Figure 5e). However, the low volatility regions of G2 and G3 accounted for a higher proportion, which indicated that the vegetation in these two gradient zones was more stable than the vegetation in the other gradient zones.

4.3. Spatial Trend Characteristics

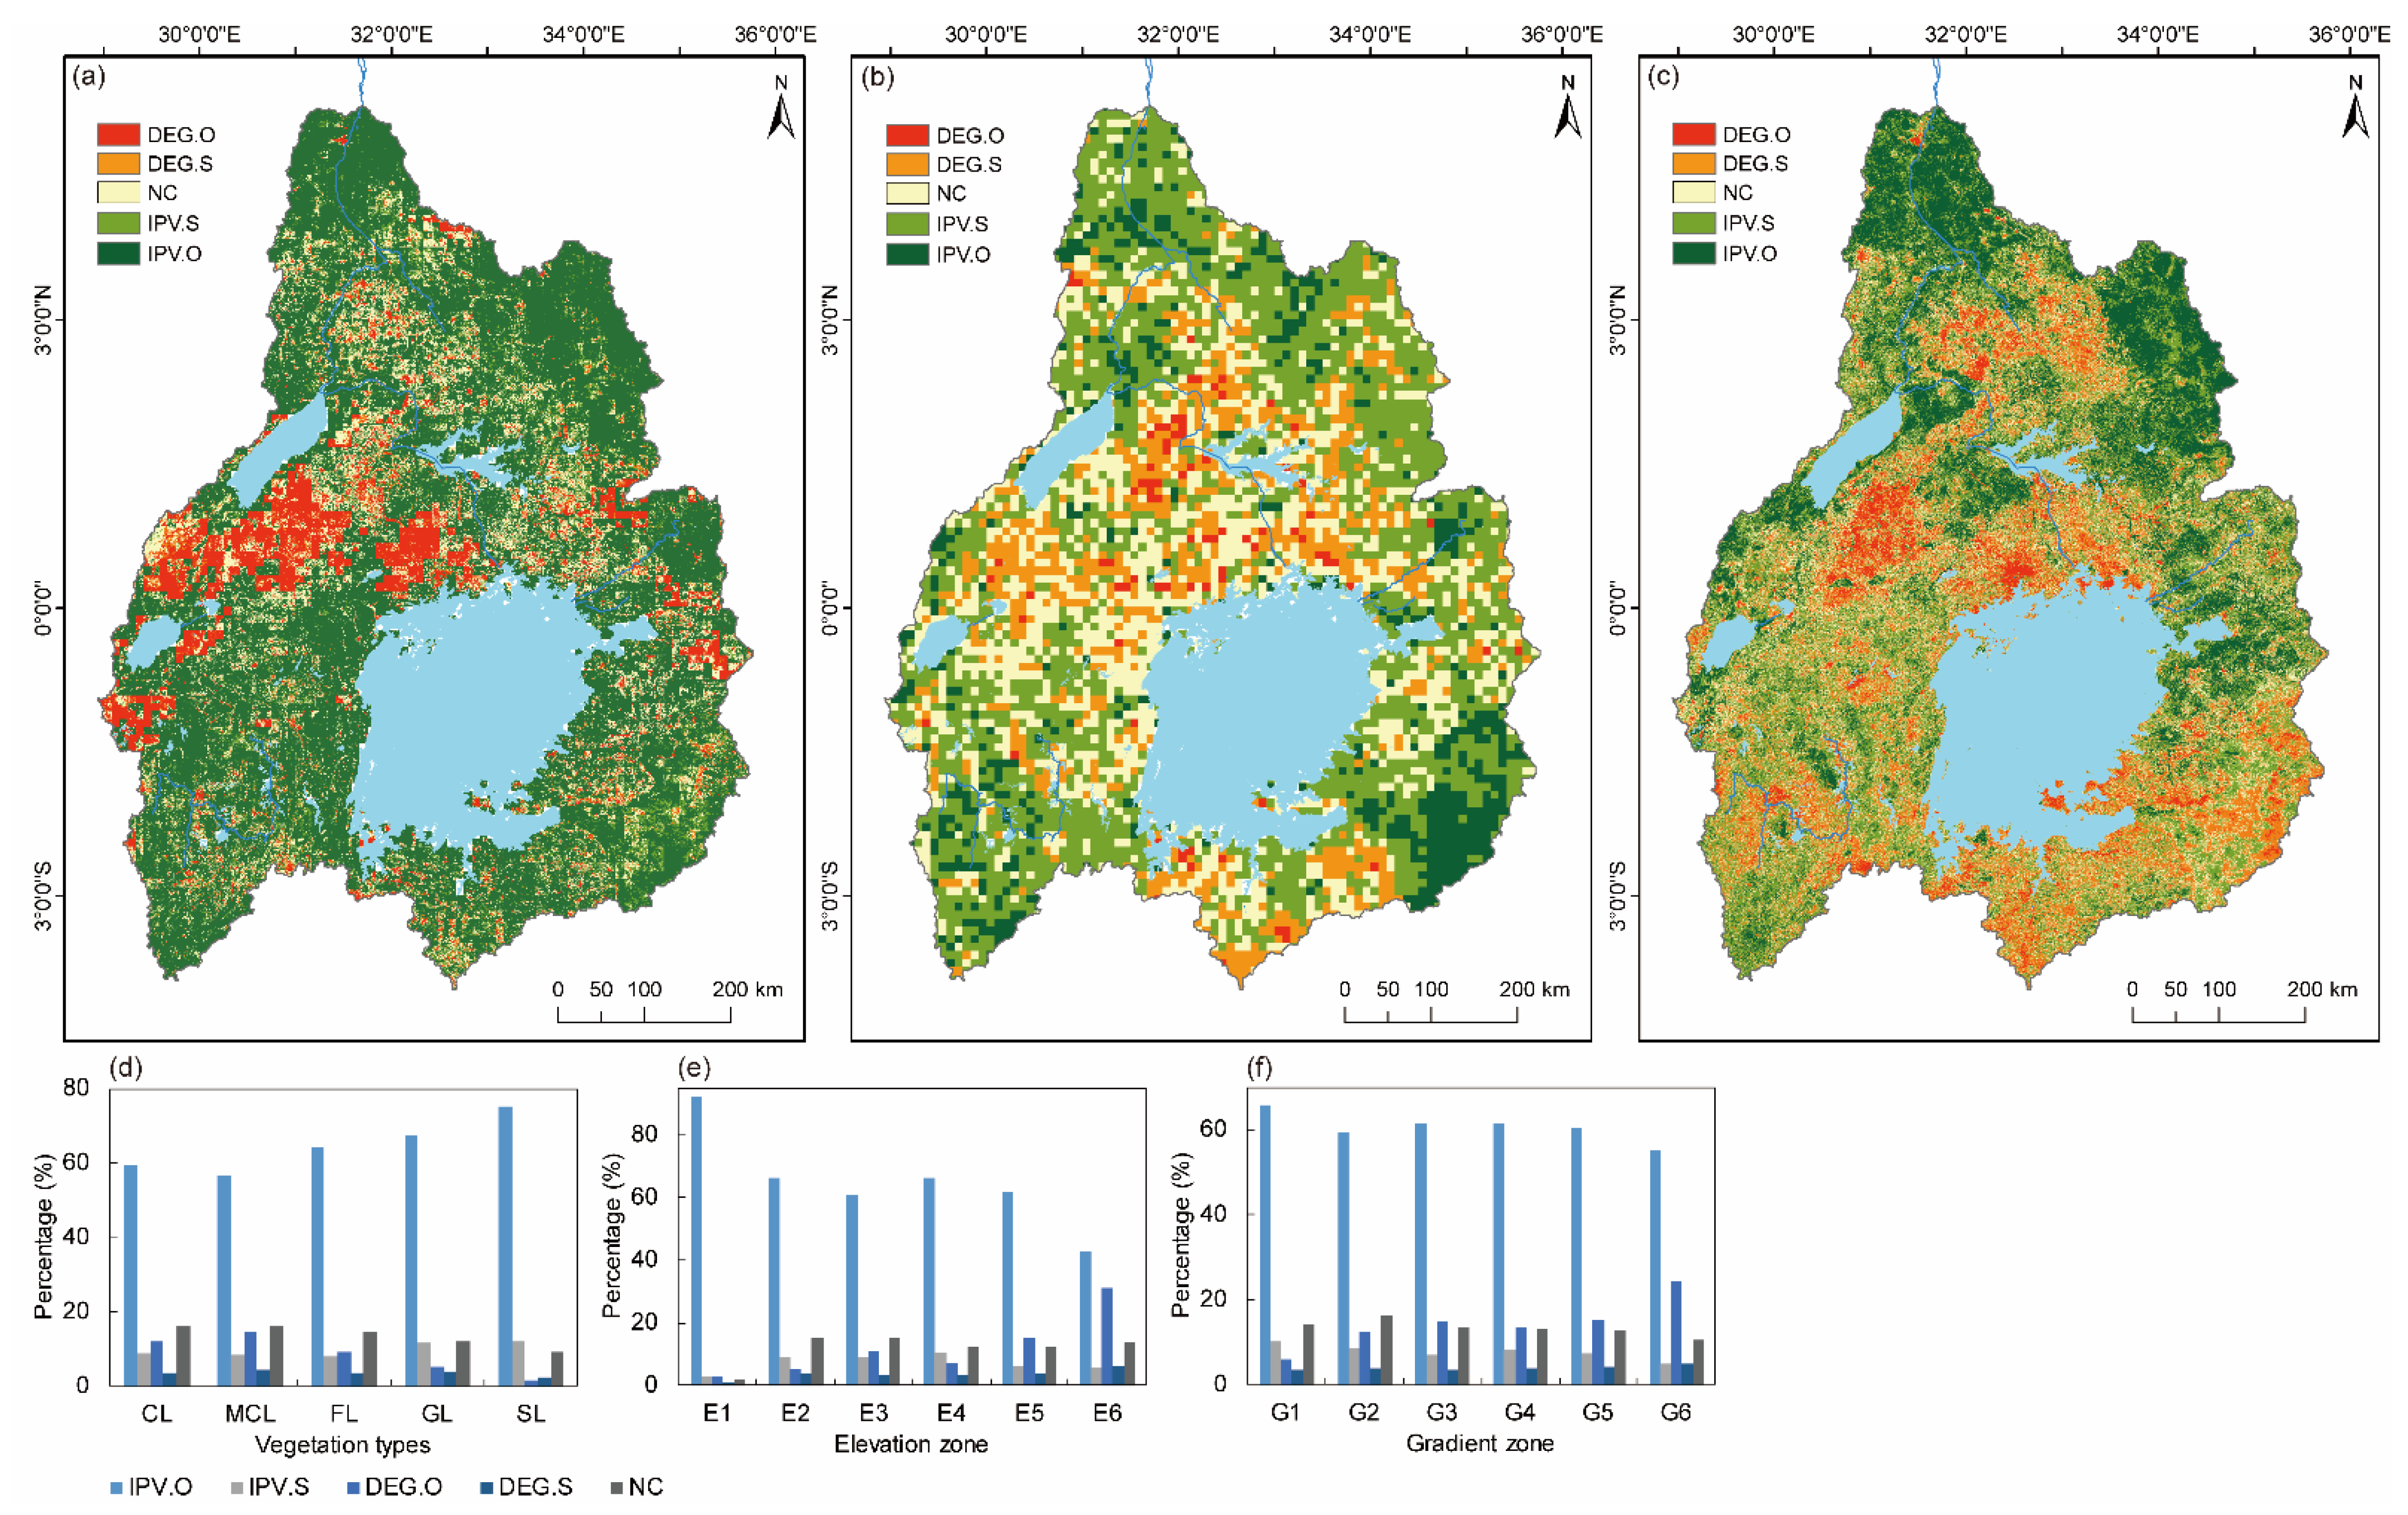
Based on the Theil-Sen median trend analysis, the characteristics of the vegetation trend of the UWNR in different periods were analyzed (Figure 6a–c). From 1982 to 2020, the vegetation cover showed an increasing trend in most areas of the UWNR. The increasing trend of vegetation accounted for 80.33% of the land area of the UWNR, while the decreasing trend accounted for 19.47%. A total of 72.82% of the vegetation trends were statistically significant (p < 0.05). During the period from 1982 to 1999, the increasing trend of vegetation accounted for 67.28%, and the decreasing trend accounted for 29.11%. From 2000 to 2020, the increasing trend of regional vegetation accounted for 66.14%, and the decreasing trend accounted for 33.77%. From 2000–2020, the decreasing area of the vegetation trend in the UWNR increased by 16.01% compared with that from 1982–1999. This result showed that the vegetation degradation trend of the UWNR was more serious in some areas from 2000 to 2020.
Combined with a Theil-Sen median trend analysis and MK test, the vegetation trend in the study area was divided into the following 5 types (Table 3): significantly degraded (β < −0.0005, Z > 1.96 or Z < −1.96); slightly degraded (β < −0.0005, −1.96 ≤ Z ≤ 1.96); significantly improved (β ≥ 0.0005, Z > 1.96 or Z < −1.96); slightly improved (β ≥ 0.0005, −1.96 ≤ Z ≤ 1.96) and stable (−0.0005 < β ≤ 0.0005). From 1982 to 2020, the area with significantly improved vegetation in the UWNR accounted for 62.85%, and these sites were mainly distributed in the south of the equator and the northernmost part of the basin (Figure 6a). The area with slight improvements accounted for 9.06% and was scattered throughout the basin. Significantly degraded areas accounted for 9.93%, and most of them were concentrated in the area between the 4 lakes in the middle of the basin. In addition, there were concentrated contiguous areas south of Lake Edward and east of Lake Victoria. The area where vegetation was slightly degraded accounted for 3.58%, and these sites were mainly distributed around areas where vegetation was significantly degraded. Taking the equator as the boundary, the vegetation degradation in the area north of the equator was acuter than that in the area south of the equator. Uganda had the most serious vegetation degradation, followed by the research areas in the D.R. Congo and Kenya. The Kagera River basin in the southwest is the largest tributary of Lake Victoria, and the vegetation in this subbasin also shows significant degradation and a patchy distribution.
For different periods, the vegetation trends were different. From 1982 to 1999, areas with significant vegetation improvement accounted for 11.36%, areas with slight improvement accounted for 44.13%, and areas with relatively stable vegetation changes accounted for 26.20%, which indicated that during this period, the UWNR vegetation generally tended to be better, and vegetation increased rapidly (Table 3). Areas with significant vegetation degradation accounted for 1.75%, and slightly degraded areas accounted for 16.56%. Vegetation degradation areas were mainly divided into areas north of the equator and parts of the area south of Lake Victoria (Figure 6b). From 2000 to 2020, the area where vegetation has significantly degraded accounted for 6.05%, which was a substantial increase compared to the period from 1982 to 1999, with an increase of 2.46 times. Areas with slight vegetation degradation accounted for 19.37%. The areas where vegetation has degraded were distributed across a wide range. With the exception of the northern and northeastern parts of the basin, the vegetation in the rest of the area has been degraded to varying degrees (Figure 6c). Areas with significant vegetation improvement accounted for 22.57%, which was an increase of 98.68% compared to the period of the 1982–1999. The areas where slight improvement occurred accounted for 33.94%, which was a decrease of 23.09% compared with the period of 1982–1999. In general, during the period of 2000–2020, the vegetation conditions in the northern part of the basin showed an improved trend, while the vegetation in most of the remaining areas showed a degradation trend. Compared with the period of 1982–1999, the overall vegetation condition further deteriorated.
From 1982 to 2020, the vegetation change trend of each vegetation type was mostly improved significantly, and its area accounted for more than 50% of the area of each vegetation type (Figure 6d). The area with significant improvement in SL had the highest vegetation change trend, which accounted for 75.08% of the total area of SL; the area with significant improvement in MCL was the lowest, which accounted for 56.64%. The areas of CL, FL and GL that showed significant improvement accounted for 59.33%, 64.38% and 67.39% of the total area of the respective vegetation type, respectively. CL and MCL had the highest proportion of areas that showed a significant degradation trend, with values of 11.97% and 14.66%, respectively, followed by FL, with a value of 9.33%. The areas of GL and SL with a degradation trend were relatively small and accounted for 5.06% and 1.38%, respectively. Based on the above analysis, SL and GL had the best vegetation improvement, while CL and MCL had more serious vegetation degradation.
As the elevation increased, the area where the vegetation of the UWNR was significantly improved as a percentage of the elevation zone gradually decreased, from 91.96% of E1 to 42.84% of E6 (Figure 6e). When the elevation was below 1000 m, the change trend of vegetation was mainly indicative of significant improvement. The degraded areas of E1 and E2 accounted for 3.42% and 9.16% of the elevation zone, respectively (including significantly degraded areas and slightly degraded areas). The elevation was between 1000 and 2000 m, and the proportion of the area where vegetation was significantly degraded gradually increased, with E3 and E4 accounting for 11.03% and 7.31%, respectively; additionally, the proportion of areas with stable vegetation gradually increased, with values of 15.35% and 12.41%, respectively. When the elevation was higher than 2000 m, the proportion of degraded vegetation area was 15.52% and 31.12% of E5 and E6, respectively. This result shows that as the elevation increased, the proportion of vegetation degradation also gradually increased. Areas with significant vegetation change trends in the UWNR were mainly E3 with an elevation between 1000 and 1500 m, followed by E4 with an elevation of 1500–2000 m.
For the slope (Figure 6f), as the gradient increased, the percentage of vegetation in each gradient zone that showed a significant improvement trend decreased from 65.83% in G1 to 55.17% in G6. The vegetation change trend in each gradient zone was mainly the area with a significant improvement of vegetation, followed by the area with a significant degradation of vegetation. With the increase in gradient, the proportion of the area of significantly degraded vegetation in each gradient zone increased from 6.08% in G1 to 24.24% in G6. This result shows that with the increase in gradient, the proportion of vegetation improvement trend area gradually decreased, and the proportion of vegetation degradation trend area gradually increased.

4.4. Prediction of the Future Trend of Vegetation

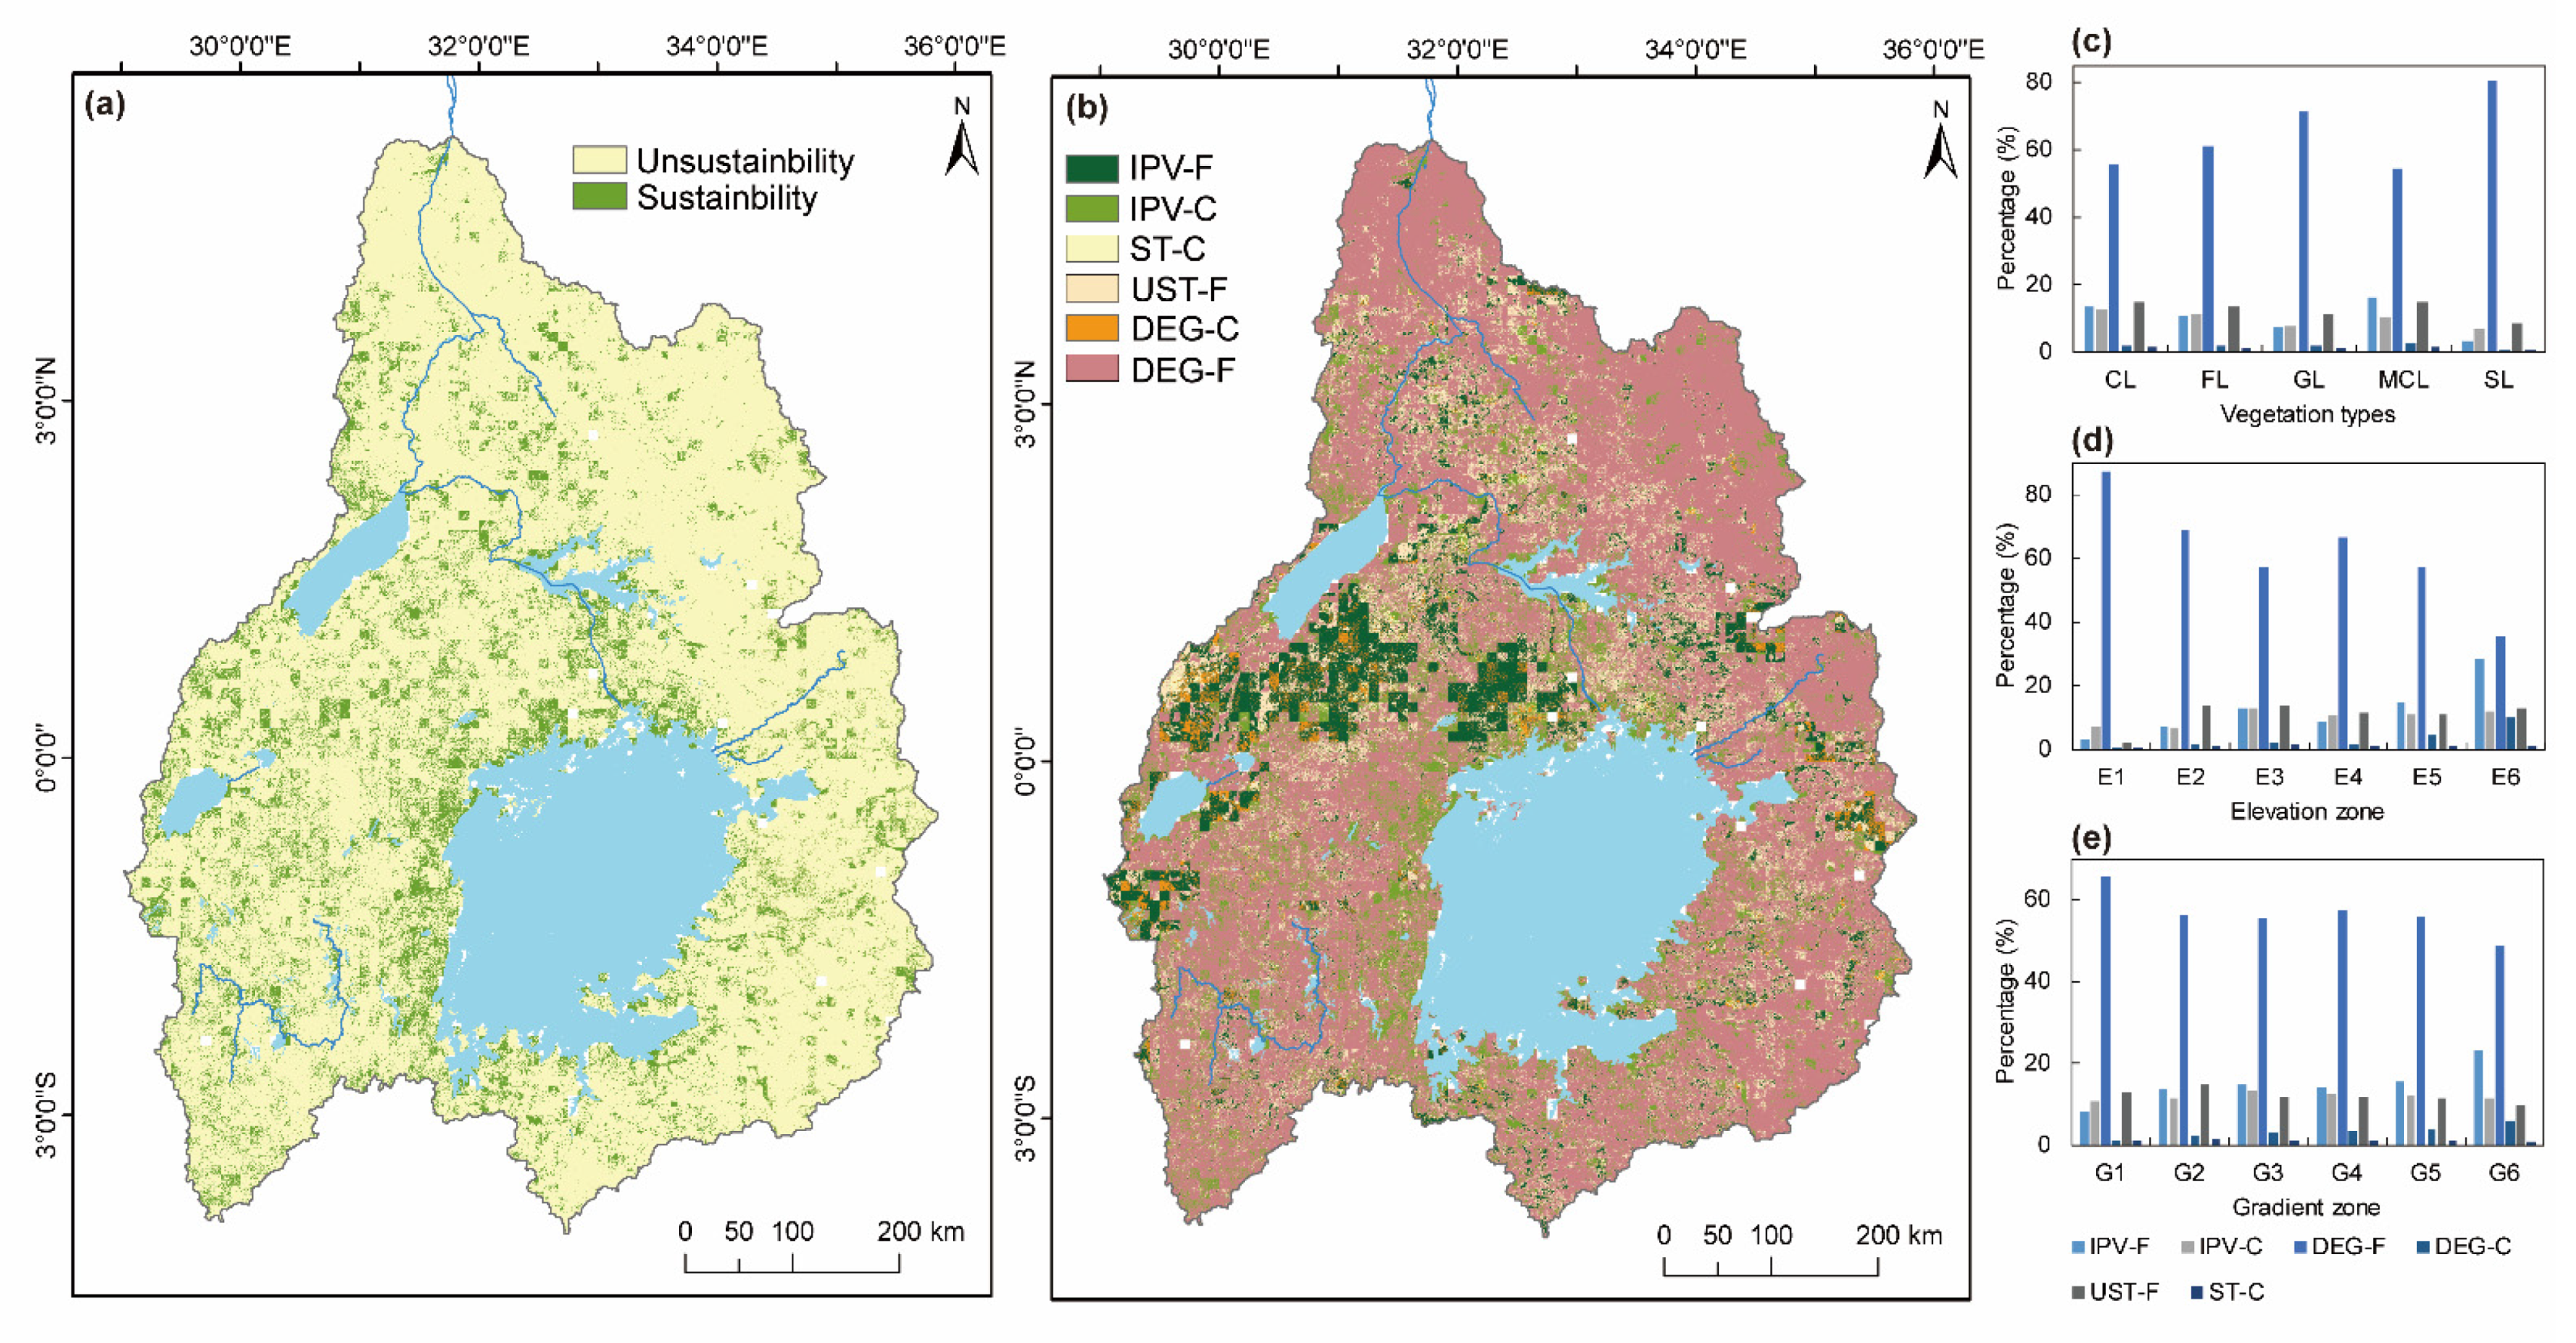
In this study, the Hurst exponent method was adopted to evaluate the future trend of vegetation in the UWNR, as shown in Figure 7a. The Hurst exponent ranged from 0.05 to 0.93, with an average of 0.41. The trend of vegetation change in the UWNR was generally unsustainable. The proportions of sustainable and unsustainable areas in land area were 14.75% and 85.25%, respectively. By superimposing the Theil-Sen median trend analysis, MK test and Hurst exponent, the future trend of UWNR vegetation can be divided into 6 types (Table 4), namely, improved in the future, degraded in the future, continuous improvement, persistent degradation, unstable in the future and continuously stable [1]. The sustainability of vegetation in the UWNR was mainly based on the trend of improvement to degradation. The area accounted for 60.51% of the land area and was distributed throughout the basin (Figure 7b, Table 4).
A total of 52.25% of the total area of vegetation will transform from significant improvement to degradation in the future. A total of 2.03% of vegetation will continue to degrade in the future, and will be scattered in the middle of the basin. The area of vegetation transformation from degradation to improvement was mainly distributed in the area between the four lakes, which accounted for 11.48%. Over the past 39 years, the vegetation of this area has been significantly degraded, and the area where the vegetation condition will be improved in the future accounted for 8.29%. The area where vegetation will continue to improve in the future accounted for 11.39%, and these sites were scattered across the entire basin. Among them, the shoreline of Lake Victoria is densely distributed, while the north and northeast of the basin are less distributed. The area where vegetation changed from stable to unstable accounted for 13.26% and was distributed throughout the basin. The area where vegetation will continue to stabilize in the future accounted for only 1.32%, which was mainly distributed in D. R. Congo of the western edge of the UWNR. Based on the above analysis, it can be inferred that the vegetation status of the UWNR will be degraded to varying degrees in the future with the interference of climate change, human activities and natural disasters.
Regarding different vegetation types, the vegetation type will mainly degrade in the future (Figure 7c). SL and GL will have the highest proportion of vegetation degradation in the future, with values of 80.49% and 71.29%, respectively; additionally, the ratio in CL and MCL was relatively low, with values of 55.60% and 54.54%, respectively. The percentage of the area where vegetation has changed from a degradation trend to a future improvement trend in CL was 13.59%; 12.48% of CL will continue to improve in the future, and 14.66% of the area will change from stable to unstable. In the MCL, the area where vegetation changed from a degradation trend to an improvement trend accounted for 16.11%, the area that will continue to improve in the future accounted for 10.35%, and the area where vegetation changed from stable to unstable accounted for 14.69%. The area where vegetation changed from a degradation trend to an improvement trend accounted for 10.80%, the area that will continue to improve in the future accounted for 11.25%, and the area where vegetation changed from stable to unstable accounted for 13.31%. These results showed that the vegetation of GL and SL will be severely degraded in the future, followed by that of FL. The vegetation in approximately half of the area of CL and MCL will degrade in the future.
As the elevation increased, the proportion of the vegetation in each elevation zone that will be degraded in the future showed a downward trend, e.g., from 87.10% of E1 to 35.59% of E6 (Figure 7d). The proportion of vegetation in the future that showed an improvement trend showed an increasing trend with increasing elevation, from 3.03% of E1 to 28.39% of E6. The proportion of vegetation that will be continuously degraded in the future also has a similar pattern, which increased from 0.39% of E1 to 9.99% of E6. This result shows that in areas where the elevation is lower than 1000 m, the vegetation will be mainly degraded in the future. As the elevation rises, the proportion of the area will gradually increase, and the vegetation will improve in the future. In high-altitude areas above 2500 m, the vegetation will be greatly improved in the future. The regular characteristics of the future trend of vegetation in each gradient zone were more consistent with the regular characteristics of the elevation zones (Figure 7e). This result shows that vegetation on gentle slopes with a gradient of less than 2° will be mainly degraded in the future, which accounted for 66.75%. As the slope increased, the proportion of the future degradation trend gradually decreased, and the proportion of the future improvement trend gradually increased. By G6, the proportion of the area where the future vegetation will change from improvement to degradation was reduced to 48.79%. The percentage of the area where vegetation will change from a degraded trend to an improvement trend increased from 8.33% in G1 to 23.13% in G6. This result shows that in flat areas with small slopes in the basin, future vegetation change will be dominated by the degradation trend. Although the high and steep slopes still account for a high proportion of future degradation trends, the areas where vegetation will improve in the future are also large.

4.5. Correlation between Climate Factors and Vegetation

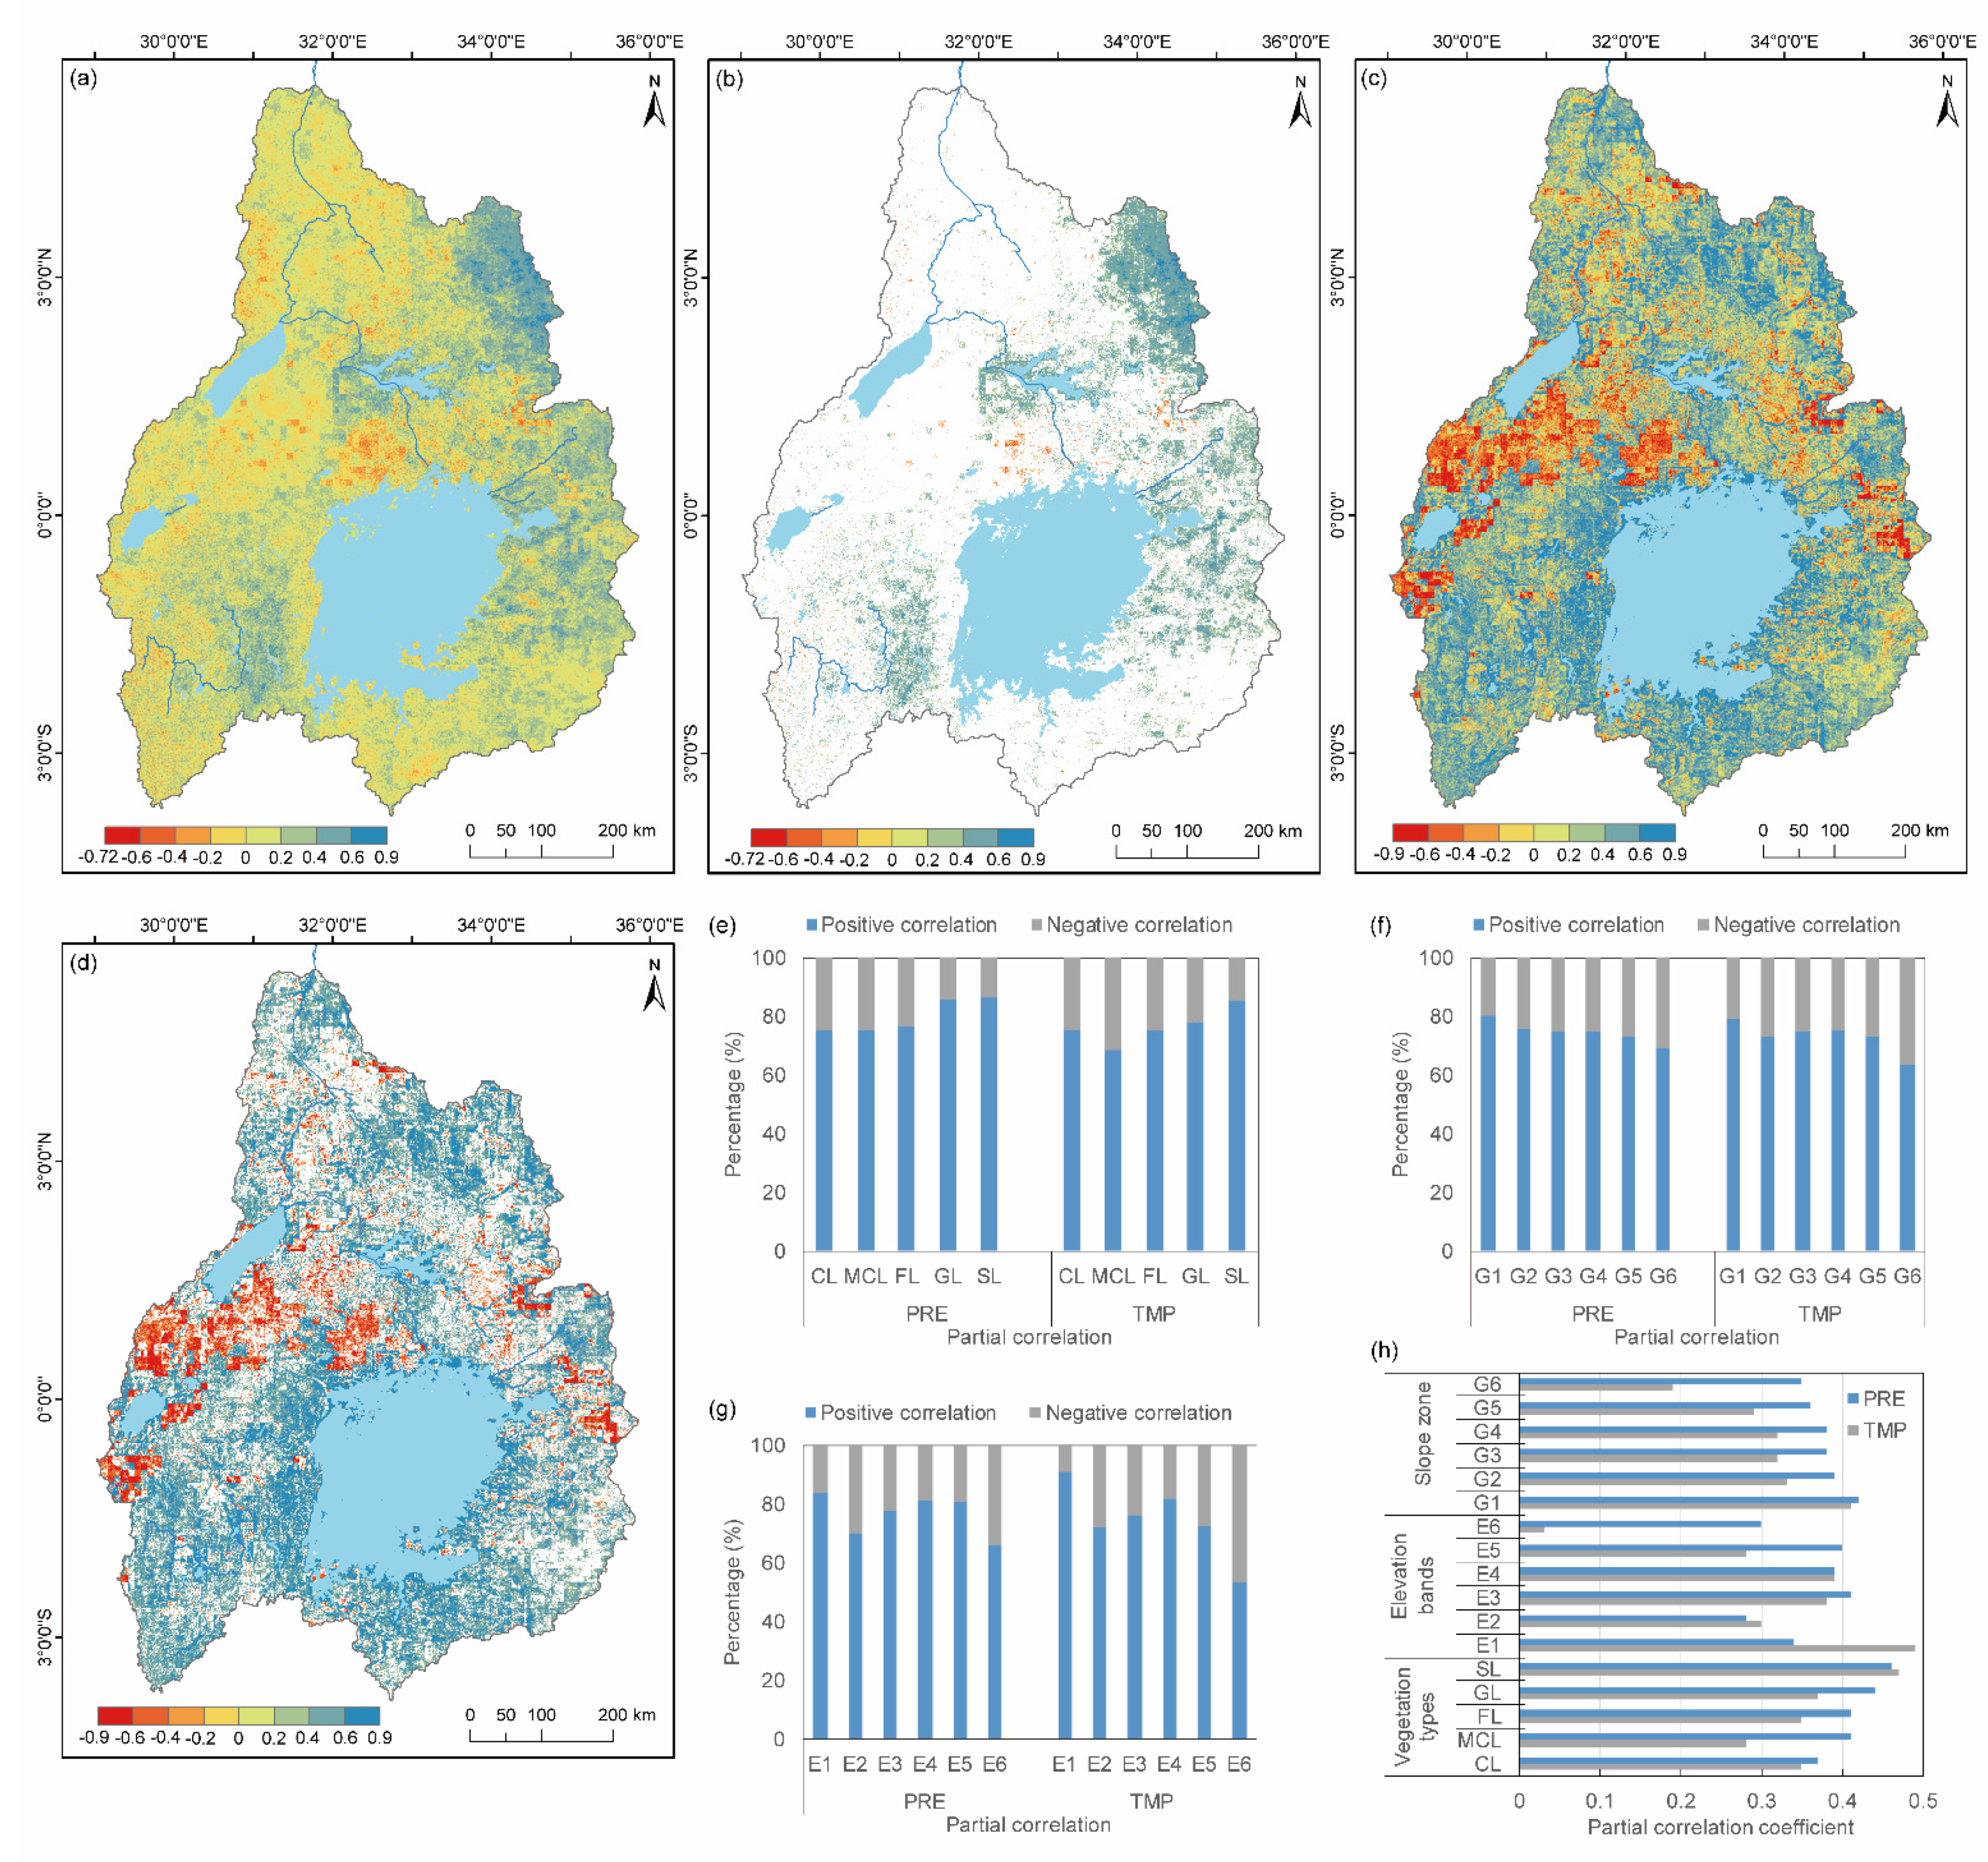
To analyze the correlation between climate factors and vegetation, the partial correlation analysis method can be adopted to eliminate the impact of other variables to only study the correlation degree between one variable and vegetation [2,5]. Since the climate data, used in this study were updated only to December 2018, the analysis period was from 1982 to 2018, for a total of 37 years. To spatially identify the impact of PRE and TMP on the NDVI, we drew the NDVI partial correlation coefficient diagrams with PRE and TMP.
From 1982 to 2018, the average partial correlation coefficient between PRE and vegetation was 0.40 (p < 0.05), and there was a positive partial correlation between PRE and vegetation in 77.46% of the area (Figure 8a). Among them, only 17.27% of the area showed a significant positive correlation, which was mainly located in the northeastern part of the basin and in the area east of Lake Victoria (Figure 8b). The area where PRE was negatively partially correlated with vegetation accounted for 22.54% of the total land area, and the sites were mainly located in the north-central part of the basin, especially along the north shore of Lake Victoria. A total of 0.69% of the area showed a significant negative correlation, and these sites were distributed in the area north of Lake Victoria and scattered in the Kagera sub-basin in the southwest of the UWNR. The average partial correlation coefficient between TMP and vegetation was 0.36 (p < 0.05). The positive partial correlation area accounted for 76.38%, and the significant positive correlation area accounted for 52.03%. The spatial distribution was relatively scattered, but the southern part of the basin was more widely distributed (Figure 8c,d). The area with negative partial correlation accounted for 23.62%, and the area with significant negative correlation accounted for 10.71%.
We classified and counted the partial correlation coefficients and obtained the average partial correlation coefficients under different vegetation types and different terrain conditions, as represented in Figure 8h. From 1982 to 2018, except for SL, the partial correlation coefficients of PRE and the vegetation of various vegetation types were generally higher than those of TMP and vegetation. The partial correlation coefficient of climate factors and vegetation in CL was less than that of the other four vegetation types. Regarding the correlation of PRE and vegetation (Figure 8e), the areas of positive correlation for CL, MCL, FL, GL, and SL accounted for 75.19%, 75.45%, 76.95%, 85.86% and 86.47% of the total area of each vegetation type, respectively; the proportions of negatively correlated areas were 24.81%, 24.55%, 23.05%, 14.14% and 13.53%, respectively. The proportions of regions whose partial correlation coefficients passed the 0.05 level of significance test were 15.43%, 20.61%, 17.00%, 27.01% and 25.17% for CL, MCL, FL, GL, and SL, respectively. The influence of PRE on GL and SL was the highest among all vegetation types. For the correlation between TMP and vegetation, CL, MCL, FL, GL and SL were positively correlated with 75.45%, 68.72%, 75.28%, 77.93% and 85.58% of each vegetation type, respectively, and negatively correlated with 24.55%, 31.28%, 24.72%, 22.07% and 14.42% of each vegetation type, respectively. The proportion of the areas whose partial correlation coefficient passed the 0.05 level of significance test was 63.65%, 59.96%, 64.44%, 57.34% and 57.45% for CL, MCL, FL, GL, and SL, respectively. The influence of TMP was higher on CL and FL than on the other three vegetation types, and MCL was the most seriously affected by TMP.
For E1 and E2, the average partial correlation coefficient of PRE and vegetation was lower than that of TMP and vegetation, and the opposite was true for E3~E6 (Figure 8h). For E6, the correlation between vegetation and TMP was extremely low, the average partial correlation coefficient was only 0.03, and the partial correlation coefficient with PRE was 0.30. From E1 to E6, the proportions of the area of vegetation and PRE that were positively correlated to the area of each elevation zone were 84.01%, 70.21%, 77.95%, 81.41%, 80.77%, and 66.07% (Figure 8g), respectively, and the percentages of negatively correlated areas were 15.99%, 29.79%, 22.05%, 18.59%, 19.23% and 33.93%, respectively. The proportions of the regions whose partial correlation coefficients passed the 0.05 level of significance test were 2.42%, 1.80%, 20.19%, 21.53%, 27.43% and 18.40% for E1 to E6, respectively. In the areas where the elevation was lower than 1000 m, the correlation between vegetation and PRE was less significant, and in the areas between 2000 and 2500 m, vegetation was most significantly affected by PRE. The area proportions of the positive correlation areas between vegetation and TMP were 90.95%, 71.94%, 76.37%, 82.06%, 72.76% and 53.13%, respectively, and the area proportions of the negative correlation areas were 9.05%, 28.06%, 23.63%, 17.94%, 27.24% and 46.87%, respectively. For E1 to E6, the area proportions of the partial correlation coefficients that passed the 0.05 level of significance test were 71.02%, 53.52%, 64.14%, 63.34%, 68.40% and 66.68% for E1 to E6, respectively. With increasing elevation, the proportion of vegetation negatively affected by TMP increased. Especially in the high mountainous area with an elevation of more than 2500 m, nearly half of the vegetation was negatively affected by TMP. Combined with the proportion of the area that passed the significance test, it was found that at different elevations, the influence of TMP on vegetation was higher than the influence of PRE.
The average partial correlation coefficient was higher between vegetation and PRE than between vegetation and TMP in each gradient zone. In the G1~G6 gradient zones (Figure 8f), as the gradient increased, the area of positive correlation between vegetation and PRE decreased from 80.19% in G1 to 69.22% in G6, and the area of negative correlation increased from 19.81% to 30.78%. The proportion of the regions whose partial correlation coefficient passed the 0.05 level of significance test ranged from 14.90% (G6) to 19.82% (G1). The proportion of the positive correlation area between vegetation and TMP decreased from 79.36% in G1 to 63.60% in G6, and the proportion of the negative correlation area increased from 20.64% to 36.40%. The proportion of the regions whose partial correlation coefficient passed the 0.05 level of significance test ranged from 60.52% (G2) to 72.38% (G1). Accordingly, when the slope is gentler, the positive effect of vegetation on climate factors is more obvious; in contrast, when the slope is steeper, the negative effect of vegetation on climate factors is more obvious.

4.6. Synthetic Analysis of the Main Drivers of Vegetation Changes

Based on the NDVI mutation test results of the UWNR, the research time series can be divided into two stages, specifically, 1982–1999 and 2000–2018, and the pixel-by-pixel regression relationship between the NDVI and PRE and TMP from 1982–1999 was established. Then, the NDVI prediction value from 2000–2018 was calculated by using the relationship, and the contribution of climate change and human activities to vegetation change was quantified. The average effect rate of human activities on the UWNR vegetation change was 64.5%, while the average effect rate of climate change was 35.5%, which showed that the UWNR vegetation change was dominated by human activities. The relative intensity of human activities and climate change on vegetation had a varied spatial distribution (Figure 9a,b). The vegetation area affected by human activities of over 60% was mainly located in the middle and north of the basin, which accounted for 61.85%. The national boundaries were mainly distributed in Uganda, DR Congo, South Sudan and Kenya. The area with the strongest effect of human activities (>80%) accounted for 35.33%, and the area with a relatively strong effect (60~80%) accounted for 26.52%. The area with an effect rate between 40% and 60% accounted for 18.47%, and the area with an action rate of less than 40% accounted for 19.68%. The regions with relatively strong effects of climate change (>60%) were mainly located in the mountainous areas in the northeast, southwest and southeast of the basin.
Among the different vegetation types, the vegetation of CL and MCL had the highest impact rates of human activities, with values of 66.57% and 66.82%, respectively, and the impact rates of climate change were 33.43% and 33.18%, respectively (Figure 9c). This result was followed by FL, where the effect rate of human activities was 64.21%. The human activity rates of GL and SL were relatively low, with values of 58.83% and 55.32%, respectively, which were lower than the average level of the basin. With increasing elevation, the effect rate of human activities on vegetation first decreased and then increased, from 76.24% of E1 to 59.70% of E4, and then increased to 79.84% of E6 (Figure 9d). The contribution rates of human activities on E1, E5 and E6 were all greater than 70%, while the relative contribution rates of climate change were all less than 30%. The vegetation of E6 and E4 was most affected by human activities and climate change, respectively. With the increase in gradient, the action rate of human activities increased from 61.28% in G1 to 74.77% in G6, while the action rate of climate change decreased from 38.73% to 25.23% (Figure 9e). G6 was the most strongly affected by human activities, and G1 was most strongly affected by climate change.

5. Discussion

5.1. Vegetation Trends and Spatial Heterogeneity

During the 39-year research period, the NDVI in the UWNR showed a tendency to increase (Figure 3a). This is more consistent with the results of Kalisa et al. [28]. They assessed the dynamics of vegetation in East Africa from 1982 to 2015 and concluded that the vegetation in East Africa showed an increasing trend, which is evidence of favorable agricultural and land use practices in recent decades. However, for the entire East African region, the vegetation has a clear downward trend after 2000. Our research found that for the UWNR, the overall vegetation still showed an increasing trend after 2000, and the area where vegetation was degraded accounted for 25.42%. Lunyolo et al. [61] discussed the dynamics of land cover in Uganda and found that a large number of forests and permanent wetlands in the country have been converted into farmland, which has further led to the degradation of vegetation. Our research area covers most of Uganda, and our findings confirm Lunyolo’s research results. Uganda has the most severely degraded vegetation area in the UWNR. During the study period in the UWNR, the increasing trend was not continuous, and there were many obvious turning points. The vegetation NDVI from 1987 to 1991 showed a continuous declining stage, and the PRE during the same period also showed an obvious downward trend. The first turning point of the NDVI occurred in 1991 and 1993, when the average NDVI of vegetation decreased to the minimum and then began to increase with fluctuations. From 1991 to 1993, the vegetation condition was the worst in the research area, which was related to drought in the same period [62,63]. During 1993–1994, 1996–1997 and 2000–2001, the vegetation in the study area rapidly greened, which was closely related to the rapid increase in PRE during the same period, but the TMP during the same period was also at the highest level of the study period. From 2001 to 2003, the degree of vegetation greening was maintained at a relatively high level. The vegetation status from 2004–2005 was relatively poor due to a relatively severe drought that occurred during the same period, which coincided with the results of Nzabarinda et al. [63]. The second turning point of vegetation NDVI was in 2009. High temperature and drought caused serious vegetation degradation in this year. The vegetation greening was relatively rapid from 2009–2015, and this result was related to the increase in PRE and the decrease in TMP during the same period. In general, the vegetation in the UWNR declined during the period of 1982–1993 and showed an increasing trend during the period of 1993–2020. In accordance with the average value of the entire basin, the increase or decrease in vegetation was mainly related to the amount of PRE. For example, overall, the vegetation of the UWNR was worse in the period of 1991–1993, 1999–2000, 2004–2005, 2009 and 2017. This result was mainly because of the impact of the high temperature and drought of the meteorological environment during the same period.
This study found that better vegetation conditions in the UWNR led to more stable vegetation over the 39-year period (Figure 5). Areas with poor vegetation conditions tended to have higher instability, which may have been related to the lower PRE in the area. The areas with the highest volatility of vegetation change in the basin were located in the marginal areas of the northeast and southwest of the basin. The average NDVI values of these two regions were both low, and they were also regions with low average PRE distributions (Figure 1b). However, it is worth of remark that the NDVI of the vegetation along lakes and large cities, such as Kampala and Kigali, had high volatility, which may have resulted from strong human activities. From 1982 to 1999, the area with low fluctuations accounted for 82.84%, and the area with high fluctuations accounted for only 0.002%. The vegetation in the basin was in a relatively stable condition. The vegetation volatility from 2000–2020 was higher than that from 1982–1999, which was mainly reflected by an increase in the proportion of the medium fluctuation area and high fluctuation area and a decrease in the proportion of the low fluctuation area.
Our research showed that the average NDVI of vegetation in the UWNR from1982–2020 had a spatial distribution characteristic of gradually decreasing from west to east (Figure 5a), which coincided with the spatial distribution of PRE in this study area. The vegetation in the mountainous areas on the western edge of the basin may be affected by the southwestern Atlantic monsoon. High mountainous areas with lush vegetation, such as the Rwenzori Mountains and Ergon Mountain, are mainly affected by the combination of topography and forest vegetation. The west bank of Lake Victoria is mainly affected by the regulation of the easterly airflow of Lake Victoria. The territory of Kenya east of Lake Victoria may be affected by the tropical forest climate. From 1982 to 2020, the areas with severe vegetation degradation in the UWNR were mainly distributed in Virunga National Park, the Rwenzori Mountains, the Ergon Mountain and the areas between the four major lakes. The average NDVI value of the vegetation in these areas was relatively high, and the vegetation types were mainly CL, MCL and FL. The degradation of vegetation may be related to the significant local temperature increase and high-intensity agricultural activities. However, the analysis of the Hurst index indicated that the vegetation status in this area will be improved in the future (Figure 7b). The area and degree of vegetation degradation in the UWNR after 2000 exceeded those in the period of 1982–1999. By comparing the spatial distribution of vegetation trends from 1982–1999 (Figure 6b,c), areas with good vegetation conditions underwent significant degradation during the period of 2000–2020. For example, the mountainous area in the southwestern part of the basin had good vegetation conditions during the period of 1982–1999 but severe vegetation degradation during the period of 2000–2020. In contrast, the forest vegetation in southwestern Lake Kyoga was seriously degraded from 1982–1999, but it was significantly improved after 2000. The southwestern part of the basin includes Masai Mara National Park and Serengeti-Ngorongoro Conservation Area, which are important animal habitats and migration channels in East Africa. The vegetation type in this area was mainly shrubland. From 1982–1999, the vegetation condition in this area was good, and the vegetation was significantly improved; however, since 2000, the vegetation in this area has been degraded to varying degrees (Figure 6c) and will continue to be degraded in the future (Figure 7b). This result is closely related to climate change, the development of local tourism and other economic activities.
According to the results of the trend analysis, GL and SL had the fastest increase in the NDVI from 1982 to 2020, both with a value of 0.025/10 year, followed by FL, with an increase of 0.023/10 year, while CL and MCL had the smallest increase in the NDVI, with values of 0.019 and 0.022/10 year, respectively. From 1982 to 1999, the proportions of the areas with significant and slight improvements in SL were 22.59% and 54.00%, respectively, which is higher than other vegetation types, and SL was the vegetation type with the best vegetation conditions at this stage. This was followed by GL, FL, CL and MCL, where the vegetation conditions were relatively poor. During the period of 2000–2020, the growth rates of the NDVI of all types of vegetation were higher than those of the period from 1982–1999. The growth rates of the NDVI for CL, MCL, FL, GL and SL in the 2000–2020 period were 0.017, 0.022, 0.021, 0.029 and 0.029/10 year, respectively. During the period from 2000 to 2020, the increase in the area with significant vegetation degradation was much higher than that of the area with significant vegetation improvement. The area with a slight improvement in vegetation decreased, but the area where vegetation had slightly degraded increased. In particular, the significantly degraded area in SL increased by 8.6 times compared with the period of 1982–1999, which represent the most severely degraded vegetation type. In the 2000–2020 period, although the area where vegetation improved was relatively large, the proportion of degraded areas gradually increased, which indicated that the trend of UWNR vegetation degradation cannot be ignored. In particular, the Masai Mara National Park and Serengeti-Ngorongoro Conservation Area, where the SL is more concentrated, should devote more attention to its severe vegetation degradation.
During the period from 1982 to 1999, the vegetation change was mainly characterized as slight improvement and relatively stable vegetation in all elevation zones and slope zones. However, during the period from 2000 to 2020, the area where vegetation degraded increased in all elevation zones and slope zones. The areas where the vegetation was significantly improved on H1 and H2 increased the fastest, and they increased by 4.21 times and 2.26 times, respectively, compared with the period of 1982–1999. H1 and H2 were the areas when the vegetation was most significantly improved during this period. However, the area of vegetation degradation in the other elevation zones increased relatively faster. The significantly degraded area of H4 increased by 21.99 times, which made it the most severely degraded elevation zone. The area with significant degradation in each gradient zone increased the fastest, and G6 increased by 14.67 times, which was the gradient zone with the most serious vegetation degradation.
In the 39 years from 1982 to 2020, the vegetation of the UWNR improved significantly. However, since 2000, the vegetation has degraded across a large area, because of the different time scales of the analysis. We were more concerned about the spatial differences in the UWNR vegetation trends from 2000 to 2020 because the period from 1982 to 1999 was relatively farther away. However, the degradation trend was easily concealed by the high NDVI value of the vegetation in this study area. The vegetation change trend in this area thus needs further research attention.

5.2. Vegetation Changes and Climate Factors

The response of vegetation changes to climate factors is essential to explain the dynamics and structure of ecosystems [2,7,64]. The UWNR is located in a tropical plateau and has obvious rainy and dry seasons. The vegetation growth in this region may be limited by both water and heat. Through a correlation analysis, Kalisa et al. [28] stated that the correlation between the NDVI and PRE in East Africa is higher than the correlation between the NDVI and TMP, and the spatial distribution of the average NDVI is more closely related to PRE than to TMP. The same results are also shown in the UWNR. Areas with higher PREs in Uganda and Kenya tend to have higher average NDVIs. The average partial correlation coefficient between vegetation and PRE was higher than that between vegetation and TMP (Figure 8), but we cannot focus only on the difference of the average partial correlation coefficient and take it as the main basis to judge the correlation between climate factors and the NDVI. The partial correlation coefficient between vegetation and PRE passed the 0.05 significance test in 17.95% of the area, and the partial correlation coefficient between vegetation and TMP passed the 0.05 significance test in 62.73% of the area (the area with a statistically significant partial correlation coefficient between vegetation and PRE (p < 0.05) accounted for 17.95%, and the area with a statistically significant partial correlation coefficient between vegetation and TMP (p < 0.05) accounted for 62.73%). Considering the results of the significance test, we believe that the impact of TMP on vegetation is more significant and has a wider range. Therefore, TMP is the predominant climate factor that influence vegetation changes in the UWNR.
The vegetation reduction related to PRE was mainly concentrated in northern Lake Victoria and Mount Elgon (p < 0.05), and the distribution area was small. The vegetation reduction related to PRE was mainly concentrated in northern Lake Victoria and Mount Elgon (p < 0.05), and the distribution area was small. Additionally, the increase in vegetation related to PRE was mainly distributed in the northeastern part of the basin and east of Lake Victoria, and the increase in PRE could have a positive impact on vegetation coverage. Figure 6a and Figure 9c also show that the decrease in the vegetation cover was significantly related to TMP, the area of vegetation degradation highly overlapped with the area where the NDVI was negatively correlated with TMP, and the vegetation type was mainly CL, which indicates that the vegetation degradation in this area was closely related to regional warming and agricultural activities. Increasing temperature may affect local agricultural cultivation and lead to a reduction in harvest, which is detrimental to local food production and even food security. In addition, the FL in this degraded area was mainly distributed in high mountainous areas with elevations higher than 2000 m, such as the Rwenzori Mountains and Ergon Mountain. This is also where the national parks and nature reserves are located. Vegetation degradation caused by warming may bring greater risks to local biodiversity protection. In the 39-year time series, both PRE and TMP had significant positive effects on vegetation growth south of the equator.
In different periods, vegetation changes were affected to different degrees by climate factors. From 1982 to 1999, the average partial correlation coefficient of vegetation and PRE was 0.52 (p < 0.05), the average partial correlation coefficient of vegetation and TMP was 0.54 (p < 0.05), and the difference between the two was small. In the 2000–2018 period, the average partial correlation coefficient of vegetation and PRE was 0.47 (p < 0.05), and the average partial correlation coefficient of vegetation and TMP was −0.31 (p < 0.05). There was a large difference between the two, and vegetation was negatively correlated with TMP. From 1982 to 1999, the areas of vegetation and PRE were significantly positively and negatively correlated, and they accounted for 14.28% and 1.46% of the land area of the basin, respectively. Significantly positively correlated areas were concentrated in the mountains west of Lake Victoria and the mountains east of the basin. From 2000–2018, vegetation and PRE were significantly positively and negatively correlated, which accounted for 14.02% and 3.31% of the land area, respectively. The areas with a significantly positive correlation were mainly located in the mountains in the northeastern part of the basin and the vast area east of Lake Victoria. From 1982 to 1999, the positive and negative significant correlation areas of vegetation and TMP accounted for 16.45% and 1.76%, respectively, while from 2000 to 2018, these two proportions were 5.37% and 10.78%, respectively. The law of area proportion in the two periods was the opposite. During the period from 1982 to 1999, the areas where vegetation was significantly positively correlated with TMP were concentrated in the mountains in the southwest of the basin and the southeast of the basin. The significantly negatively correlated areas from 2000 to 2018 were generally distributed in the area north of Lake Victoria. In the period from 1982 to 1999, the degree of influence of vegetation changes by climate factors was slightly lower than that of the period from 2000 to 2018. During this period, the growth of vegetation NDVI was significantly affected by warming and humidification. From 2000 to 2018, the increase in the NDVI was correlated with the increase of PRE, but the decrease in the NDVI was closely related to the increase in TMP.
Although there is an uneven distribution of precipitation during the year, the annual average PRE is relatively large (1199 mm). The PRE can provide sufficient water to vegetation in the area during the rainy season, but it is difficult to supply water to vegetation during the dry season. With climate change, the duration of the dry season during the year is prolonged, and the frequency of extreme rainfall in the rainy season increases. The increase in PRE showed a lower sensitivity to vegetation growth. In terms of interannual variation, the average NDVI was more consistent with the precipitation fluctuation trend, but it was less consistent with the variation tendency of TMP.

5.3. Vegetation Changes and Human Activities

This study used a method developed by Li et al. [15] to quantify the effects of climate change and human activities on vegetation. This method consider the impact of human activities before and after the change in vegetation and contains all potential factors that dominate vegetation change in every period. Therefore, it is reliable to use this method to quantify the attribution of vegetation change in the UWNR. A prerequisite of this method is to select an appropriate period as the forecast period under natural conditions. We used 1982–1999 as the forecast period because 1999 was the year when the average NDVI value of the Nile vegetation mutated. It is common to determine the change period by using statistical methods to detect the year of mutation.
Climate change and human activities usually lead to vegetation change. In this study, the vegetation improvement and degradation areas of the UWNR were mainly prompted by human activities, with action rates of 64.39% and 64.71%, respectively. The results of this study are consisten with those of Morgan et al. [31]. By analyzing the vegetation changes in the Lake Victoria basin from 2003 to 2018, these scholars suggested that climate change is the driving force that affects vegetation in the short term, but the long-term impact is mainly driven by human influence. Morgan et al. found that only the vegetation in Tanzania in the Lake Victoria basin may be driven by climate change to some extent. Our research found that climate change and human activities in Tanzania are equally important to vegetation. The impact rate of climate change is 40.90%, and the impact rate of human activities on vegetation is 59.12%. However, the impact of climate change on vegetation is still relatively high compared to other countries in the UWNR. This difference in the results may be due to different analytical methods. This study found that after 2000, the areas where the vegetation of the UWNR improved were mainly concentrated in the northern and northeastern parts of the basin. The vegetation in this area was mainly FL and SL, but the northern vegetation changes were mainly affected by human activities (68.77%). The significant improvement of vegetation in SL in the northeast, especially the Matheniko and Bokora Corridor Wildlife Reserve, was mainly affected by the dual effects of human activities (44.34%) and climate change (55.66%). In the study area in Uganda north of Lake Victoria, human activities were the main factors that affected the significant degradation of vegetation (65.50%). The mountainous area in the southwest of the basin was dominated by CL and MCL, and its vegetation degradation was also affected by strong human activities. In the western part of the basin, there are many national parks and wildlife reserves centered on Lake Edward and the Rwenzori Mountains. The vegetation in this area improved to a certain extent after 2000, mainly due to climate change. Among them, the areas of Virunga National Park and the Rwenzori Mountains are relatively large, and the human activity rates of vegetation change were as high as 76.83% and 77.82%, respectively. However, the significant vegetation degradation in Maasai Mara National Park and the Serengeti-Ngorongoro Conservation Area in the southeastern part of the basin was dominated by climate change. Among them, the vegetation changes in Masai Mara and Serengeti National Park were affected by climate change at 61.56% and 62.23%, respectively. Due to the large number of national parks, forest conservation areas and nature reserves in the study area, it is impossible to analyze all nature reserves separately. Through the analysis of relatively large and internationally famous protected areas, it can be seen that vegetation changes are still dominated by human activities overall.
Land-use change promoted by human activities is one of the major driving factors of vegetation change. In Sub-Saharan Africa, agriculture accounts for a high proportion of the national economy [29]. Between 1992 and 2015, the arable land in Sub-Saharan Africa increased by approximately 20 million hectares, mainly at the expense of forest and shrub deforestation [65]. In East Africa, the situation is more serious. From 2002 to 2008, the spatial scope of forest, woodland and shrubland in East Africa decreased by 5.1%, 15.8% and 19.1%, respectively [66]. However, this study did not explore the effect of land-use change on vegetation; therefore, the coupling effect of land use and climate change on vegetation could not be discussed in depth. Based on the analysis of land-use change in the UWNR from 2000 to 2018, the proportion of agricultural land (including Cl and MCL) had a decreasing trend (−0.79%), but it increased significantly in some areas. The increase in agricultural land was caused by the decreases in FL, SL and GL. FL increased significantly (+7.32%), mainly from the agricultural land, SL and FL that surrounded the original forestland. The increase in human activity intensity leads to a decrease in shrubbery, grassland and wetland area. With the development of the local economy, population increase and urbanization, a large amount of agricultural land, woodland and shrubland was converted into construction land. In the Lake Victoria basin, urbanization is expanding at the expense of vegetation [31]. In 2018, the construction land in the study area increased by two times compared to the value in 2000. Especially in large cities and surrounding areas such as Kampala and Kigali, which are densely populated, large amounts of agricultural land and FL have been converted into construction land. The area where vegetation is degraded has a direct correspondence with the population distribution in this area. The population of Africa is growing rapidly, and most of the population is distributed in rural areas. Agriculture and animal husbandry are the leading industries. The development of the national economy and the maintenance of local livelihoods are heavily dependent on the development of traditional biological resources. This demographic situation has led to an ever-increasing demand for land, firewood, and food, which has caused extensive environmental damage and possible social unrest and instability. In Rwanda, Burundi, Uganda and other countries, at least 90% of the population depends on firewood and other biological resources to meet their daily energy needs. Through the analysis of population density distribution data and vegetation change trends in 2020, it was found that vegetation degradation in the mountains in the southwestern part of the basin and the northern part of Lake Victoria often occurred in dense areas with a population density of more than 250 people/km2. Special attention was given to the northern and southern shores of Victoria, where the population density is generally above 500 persons/km2, which has a direct effect on the degradation of vegetation along the lake. Large cities such as Kampala and Kigali have population densities above 1000 persons/km2 and are the most degraded areas in this study area. This result shows that the accumulation of population has led to the continuous increase in construction land. With the acceleration of urbanization, population migration has become increasingly obvious. Therefore, in areas with faster economic development and higher population density, human activities have played a significant inhibitory effect on vegetation.
Human activities have a negative driving effect on UWNR vegetation, and the effects of human activities are inseparable from the effects of rapid population increases and the current agricultural development in this area. Furthermore, to address the climate change and biodiversity crisis, UWNR-related countries actively participate in and promote regional biodiversity protection and take measures such as formulating biodiversity protection policies and action plans and establishing protected areas, which play an important role in the economic development strategies of East African countries. For example, the establishment and maintenance of nature reserves such as Virunga National Park, Murchison Falls National Park and Matheniko Wildlife Reserve may be the main reason for the improvement in vegetation in the corresponding areas. However, with the development of tourism, human disturbance to nature reserves is increasing, which contradicts ecological restoration and biodiversity protection. To alleviate the pressure on the local ecological environment and food production caused by drought, countries in the UWNR should establish a joint early warning mechanism for drought and other natural disasters to jointly resist future risks. This may be an important measure to fight drought and ensure bumper harvests. It is also necessary to strengthen agricultural research, change traditional extensive farming habits, and introduce agricultural planting models that can improve the efficiency of water and soil resource utilization to increase the yield of existing arable land. The cultivated land area should be expanded to ensure that grain output will be transformed in a way to improve the existing cultivated land output. This can reduce deforestation, which is helpful to increase the local vegetation.

6. Conclusions

This study analyzed the response of vegetation to climate, topography and vegetation types in the UWNR and evaluated the vegetation trend in different time stages from 1982 to 2020. In addition, the effects of climate change and human activities on vegetation were separately analyzed by a residual trend analysis. The novelty of this study is to analyze the difference in topography and vegetation types in the contribution of climate change and human activities to vegetation change. The main conclusions are as follows. During the period of 1982–2020, the average NDVI of UWNR vegetation was relatively high (0.75) and overall showed an increasing trend. Since 2000, vegetation has increased rapidly, but some areas have been degraded (33.77%), and they are mainly distributed in the Victoria Lake subbasin. The vegetation status of FL in the basin was the best, and the conditions of GL and SL were relatively poor. The vegetation degradation of CL and MCL was more serious, and more than half of the vegetation will be degraded in the future. The zonal distribution of vegetation was obvious, the vegetation condition in low-altitude areas was relatively poor, and the vegetation conditions in high-altitude and steep slope areas were the best. UWNR vegetation showed strong negative persistence. Most of the areas (62.54%) will be degraded in the future. A small part of the area (22.29%) had a significant positive correlation between vegetation and PRE, while the area with a significant positive correlation between vegetation and TMP was larger (68.11%). The change in TMP is a critical climate factor that affects vegetation growth. Climate change and human activities have an impact on UWNR vegetation changes. The relative role of human activities accounted for 64.5%, and the relative effect of climate change accounted for 35.5%. Human activities were the predominant driving force of vegetation change. Human activities, such as the large proportion of agriculture, rapid population growth, and rapid urban expansion, were the major driving forces. Establishing a joint drought warning mechanism while improving the utilization efficiency of existing farmland is an effective way for the UWNR to resist risks, improve vegetation and increase food production in the future. Due to the lack of necessary field monitoring data, the study of vegetation changes under the conditions of high population density and high-intensity agricultural development has certain limitations. This research clarifies the impact of long-term climate change and human activities on vegetation changes and provides scientific evidence for regional ecological environmental protection and recovery and the scientific adjustment of land use.

Author Contributions

Conceptualization: B.M. and C.M.; Methodology: B.M. and C.M.; Formal analysis: B.M.; Writing—original draft: B.M.; Software, Data processing: H.L.; Writing—review & editing: S.W., J.M. and Z.L.; Supervision, Funding acquisition: Z.L. All authors have read and agreed to the published version of the manuscript.

Funding

This research was supported by grants from the National Natural Science Foundation of China (Grants 41561144011, 41771311) and the Strategic Priority Research Program of Chinese Academy of Sciences, Grant No. XDA 20040202.

Institutional Review Board Statement

Not applicable.

Informed Consent Statement

Not applicable.

Data Availability Statement

The semimonthly AVHRR GIMMS NDVI 3g V1 data used in this study are from January 1982 to February 2015, and the spatial resolution is 8 km. (https://ecocast.arc.nasa.gov/data/pub/gimms/ (accessed date: 17 December 2018)). The period of MODIS MOD13Q1 16 d da-ta is February 2000~November 2020 and the spatial resolution is 250 m (http://modis.gsfc.nasa.gov/data (accessed date: 26 February 2020)).

Acknowledgments

We would like to thank reviewers and the editor for their constructive comments and suggestions. This research was supported by grants from the National Natural Science Foundation of China (Grants 41561144011, 41771311) and the Strategic Priority Research Program of Chinese Academy of Sciences, Grant No. XDA 20040202.

Conflicts of Interest

The authors declare no conflict of interest.

References

  1. Sun, W.Y.; Song, X.Y.; Mu, X.M.; Gao, P.; Wang, F.; Zhao, G.J. Spatio-temporal vegetation cover variations associated with climate change and ecological restoration in the Loess Plateau. Agric. For. Meteorol. 2015, 209–210, 87–99. [Google Scholar] [CrossRef]
  2. Shi, S.Y.; Yu, J.J.; Wang, F.; Wang, P.; Zhang, Y.C.; Jin, K. Quantitative contributions of climate change and human activities to vegetation changes over multiple time scales on the Loess Plateau. Sci. Total Environ. 2021, 755, 142419. [Google Scholar] [CrossRef]
  3. Law, B.E.; Falge, E.; Gu, L.; Baldocchi, D.D.; Bakwin, P.; Berbigier, P.; Davis, K.; Dolman, H.; Falk, M.; Fuentes, J.D.; et al. Envi-ronmental controls over carbon dioxide and water vapor exchange of terrestrial vegetation. Trans. Inst. Br. Geogr. 2002, 16, 507. [Google Scholar] [CrossRef] [Green Version]
  4. Yu, Y.; Zhao, W.; Martinez-Murillo, J.F.; Pereira, P. Loess Plateau: From degradation to restoration. Sci. Total Environ. 2020, 738, 140206. [Google Scholar] [CrossRef] [PubMed]
  5. Sun, Y.L.; Shan, M.; Pei, X.R.; Zhang, X.K.; Yang, Y.L. Assessment of the impacts of climate change and human activities on vegetation cover change in the Haihe River basin, China. Phys. Chem. Earth Parts A/B/C 2020, 115, 102834. [Google Scholar] [CrossRef]
  6. Mao, J.F.; Shi, X.Y.; Thornton, P.; Hoffman, F.; Zhu, Z.C.; Myneni, R. Global Latitudinal-Asymmetric Vegetation Growth Trends and Their Driving Mechanisms: 1982–2009. Remote Sens. 2013, 5, 1484–1497. [Google Scholar] [CrossRef] [Green Version]
  7. Piao, S.L.; Wang, X.H.; Park, T.; Chen, C.; Lian, X.; He, Y.; Bjerke, J.W.; Chen, A.; Ciais, P.; Tømmervik, H.; et al. Characteristics, drivers and feedbacks of global greening. Nat. Rev. Earth Environ. 2020, 1, 14–27. [Google Scholar] [CrossRef]
  8. Zhu, Z.; Piao, S.; Myneni, R.B.; Huang, M.; Zeng, Z.; Canadell, J.G.; Ciais, P.; Sitch, S.; Friedlingstein, P.; Arneth, A.; et al. Greening of the Earth and its drivers. Nat. Clim. Chang. 2016, 6, 791–795. [Google Scholar] [CrossRef]
  9. He, Z.H.; Zhang, Y.H.; He, Y.; Zhang, X.W.; Cai, J.Z.; Lei, L.P. Trends of vegetation change and driving factor analysis in recent 20 years over Zhejiang province. Ecol. Environ. Sci. 2020, 29, 1530–1539. [Google Scholar] [CrossRef]
  10. Krishnaswamy, J.; John, R.; Joseph, S. Consistent response of vegetation dynamics to recent climate change in tropical mountain regions. Glob. Chang. Biol. 2014, 20, 203–215. [Google Scholar] [CrossRef]
  11. Wang, H.; Zhou, S.L.; Li, X.B.; Liu, H.H.; Chi, D.K.; Xu, K.K. The influence of climate change and human activities on ecosystem service value. J. Ecol. Eng. 2016, 87, 224–239. [Google Scholar] [CrossRef]
  12. Gao, J.B.; Jiao, K.W.; Wu, S.H.; Ma, D.Y.; Zhao, D.S.; Yin, Y.H.; Dai, E.F. Past and future effects of climate change on spatially het-erogeneous vegetation activity in China. Earth’s Future 2017, 5, 679–692. [Google Scholar] [CrossRef] [Green Version]
  13. Lutgens, F.K.; Tarbuck, E.J.; Tasa, D. The Atmosphere: An Introduction to Meteorology, 12th ed.; Pearson Education, Inc.: Cranbury, NJ, USA, 2013. [Google Scholar]
  14. Zheng, K.; Wei, J.Z.; Pei, J.Y.; Cheng, H.; Zhang, X.L.; Huang, F.Q.; Li, F.M.; Ye, J.S. Impacts of climate change and human activities on grassland vegetation variation in the Chinese Loess Plateau. Sci. Total Environ. 2019, 660, 236–244. [Google Scholar] [CrossRef]
  15. Li, J.J.; Peng, S.Z.; Li, Z. Detecting and attributing vegetation changes on China’s Loess Plateau. Agric. For. Meteorol. 2017, 247, 260–270. [Google Scholar] [CrossRef]
  16. Baumbach, L.; Siegmund, J.F.; Mittermeier, M.; Donner, R.V. Impacts of temperature extremes on European vegetation during the growing season. Biogeosciences 2017, 14, 4891–4903. [Google Scholar] [CrossRef] [Green Version]
  17. Deng, C.L.; Zhang, B.Q.; Cheng, L.Y.; Hu, L.Q.; Chen, F.H. Vegetation dynamics and their effects on surface water-energy balance over the Three-North Region of China. Agric. For. Meteorol. 2019, 275, 79–90. [Google Scholar] [CrossRef]
  18. Jiang, L.L.; Guli, J.; Bao, A.M.; Guo, H.; Ndayisaba, F. Vegetation dynamics and responses to climate change and human activities in Central Asia. Sci. Total Environ. 2017, 599–600, 967–980. [Google Scholar] [CrossRef] [PubMed]
  19. Tong, X.Y.; Brandt, M.; Hiernaux, P.; Herrmann, S.; Tian, F.; Prishchepov, A.; Fensholt, R. Revisiting the coupling between NDVI trends and cropland changes in the Sahel drylands: A case study in western Niger. Remote Sens. Environ. 2017, 191, 286–296. [Google Scholar] [CrossRef] [Green Version]
  20. Fung, T.; Siu, W. Environmental quality and its changes, an analysis using NDVI. Int. J. Remote Sens. 2000, 21, 1011–1024. [Google Scholar] [CrossRef]
  21. Pettorelli, N.; Vik, J.O.; Mysterud, A.; Gaillard, J.-M.; Tucker, C.J.; Stenseth, N.C. Using the satellite-derived NDVI to assess eco-logical responses to environmental change. Trends Ecol. Evol. 2005, 20, 503–510. [Google Scholar] [CrossRef]
  22. Clerici, N.; Weissteiner, C.; Gerard, F. Exploring the Use of MODIS NDVI-Based Phenology Indicators for Classifying Forest General Habitat Categories. Remote Sens. 2012, 4, 1781–1803. [Google Scholar] [CrossRef] [Green Version]
  23. Li, F.; Guo, S.; Zhu, L.J.; Zhou, Y.N.; Di, L. Urban vegetation phenology analysis using high spatio-temporal NDVI time series. Urban For. Urban Green. 2017, 25, 43–57. [Google Scholar] [CrossRef]
  24. Lamchin, M.; Wang, S.W.; Lim, C.-H.; Ochir, A.; Pavel, U.; Gebru, B.M.; Choi, Y.; Jeon, S.W.; Lee, W.-K. Understanding global spa-tio-temporal trends and the relationship between vegetation greenness and climate factors by land cover during 1982–2014. Glob. Ecol. Conserv. 2020, 24, e01299. [Google Scholar] [CrossRef]
  25. Zhao, L.; Dai, A.; Dong, B. Changes in global vegetation activity and its driving factors during 1982–2013. Agric. For. Meteorol. 2018, 249, 198–209. [Google Scholar] [CrossRef]
  26. Davis-Reddy, C. Assessing Vegetation Dynamics in Response to Climate Variability and Change across Sub-Saharan Africa; StelLenbosch University: Stellenbosch, South Africa, 2018. [Google Scholar]
  27. Nicholson, S.E. An analysis of recent rainfall conditions in eastern Africa. Int. J. Climatol. 2016, 36, 526–532. [Google Scholar] [CrossRef]
  28. Kalisa, W.; Igbawua, T.; Henchiri, M.; Ali, S.; Zhang, S.; Bai, Y.; Zhang, J. Assessment of climate impact on vegetation dynamics over East Africa from 1982 to 2015. Sci. Rep. 2019, 9, 16865. [Google Scholar] [CrossRef] [Green Version]
  29. Abera, T.A. Climatic Impacts of Vegetation Dynamics in Eastern Africa; University of Helsinki: Helsinki, Finland, 2020. [Google Scholar]
  30. Pricope, N.G.; Husak, G.; Lopez-Carr, D.; Funk, C.; Michaelsen, J. The Climate-Population Nexus in the East African Horn: Emerging Degradation Trends in Rangeland and Pastoral Livelihood Zones. Glob. Environ. Chang. 2013, 23, 1525–1541. [Google Scholar] [CrossRef]
  31. Morgan, B.; Awange, J.L.; Saleem, A.; Kexiang, H. Understanding vegetation variability and their ‘‘hotspots’’ within Lake Victoria Basin (LVB: 2003–2018). Appl. Geogr. 2020, 122, 102238. [Google Scholar] [CrossRef]
  32. Fensholt, R.; Proud, S.R. Evaluation of Earth Observation based global long term vegetation trends—Comparing GIMMS and MODIS global NDVI time series. Remote Sens. Environ. 2012, 119, 131–147. [Google Scholar] [CrossRef]
  33. Herrmann, S.M.; Anyamba, A.; Tucker, C.J. Recent trends in vegetation dynamics in the African Sahel and their relationship to climate. Glob. Environ. Chang. 2005, 15, 394–404. [Google Scholar] [CrossRef]
  34. Fensholt, R.; Rasmussen, K.; TheisNielsen, T.; Mbow, C. Evaluation of earth observation based long term vegetation trends—Intercomparing NDVI time series trend analysis consistency of Sahel from AVHRR GIMMS, Terra MODIS and SPOT VGT data. Remote Sens. Environ. 2009, 113, 1886–1898. [Google Scholar] [CrossRef]
  35. Holben, B.N. Characteristics of maximum-value composite images from temporal AVHRR data. Int. J. Remote Sens. 1986, 7, 1417–1434. [Google Scholar] [CrossRef]
  36. Fick, S.E.; Hijmans, R.J. WorldClim 2: New 1-km spatial resolution climate surfaces for global land areas. Int. J. Climatol. 2017, 37, 4302–4315. [Google Scholar] [CrossRef]
  37. Harris, I.; Jones, P.D.; Osborn, T.J.; Lister, D.H. Updated high-resolution grids of monthly climatic observations—The CRU TS3.10 Dataset. Int. J. Climatol. 2014, 34, 623–642. [Google Scholar] [CrossRef] [Green Version]
  38. Jarvis, A.; Reuter, H.I.; Nelson, A.; Guevara, E. Hole-Filled SRTM for the Globe Version 4, Available from the CGIAR-CSI SRTM 90 m Database. 2008. Available online: https://data.tpdc.ac.cn/en/data/literature/c5e73417-5451-47ac-b3c1-c49d2162a700/ (accessed on 3 September 2021).
  39. Tucker, C.J.; Newcomb, W.W.; Los, S.O.; Prince, S.D. Mean and inter-year variation of growing-season normalized difference vegetation index for the Sahel 1981–1989. Int. J. Remote Sens. 1991, 12, 1133–1135. [Google Scholar] [CrossRef]
  40. Milich, L.; Weiss, E. GAC NDVI interannual coefficient of variation (CoV) images: Ground truth sampling of the Sahel along north-south transects. Int. J. Remote Sens. 2000, 21, 235–260. [Google Scholar] [CrossRef]
  41. Jiang, W.G.; Yuan, L.H.; Wang, W.J.; Cao, R.; Zhang, Y.F.; Shen, W.M. Spatio-temporal analysis of vegetation variation in the Yellow River Basin. Ecol. Indic. 2015, 51, 117–126. [Google Scholar] [CrossRef]
  42. Lei, Y.B.; Zhu, Y.L.; Wang, B.; Yao, T.D.; Yang, K.; Zhang, X.W.; Zhai, J.Q.; Ma, N. Extreme Lake Level Changes on the Tibetan Plateau Associated With the 2015/2016 El Niño. Geophys. Res. Lett. 2019, 46, 5889–5898. [Google Scholar] [CrossRef]
  43. Yue, S.; Pilon, P.; Cavadias, G. Power of the Mann-Kendall and Spearman’s Rho Tests For Detecting Monotonic Trends in Hydro-logical Series. J. Hydrol. 2002, 259, 254–271. [Google Scholar] [CrossRef]
  44. Zhang, R.P.; Liang, T.G.; Guo, J.; Xie, H.J.; Feng, Q.S.; Aimaiti, Y. Grassland dynamics in response to climate change and human activities in Xinjiang from 2000 to 2014. Sci. Rep. 2018, 8, 2888. [Google Scholar] [CrossRef]
  45. Liu, Z.Z.; Wang, H.; Li, N.; Zhu, J.; Pan, Z.W.; Qin, F. Spatial and Temporal Characteristics and Driving Forces of Vegetation Changes in the Huaihe River Basin from 2003 to 2018. Sustainability 2020, 12, 2198. [Google Scholar] [CrossRef] [Green Version]
  46. Wei, O.Y.; Wan, X.Y.; Xu, Y.; Wang, X.L.; Lin, C.Y. Vertical difference of climate change impacts on vegetation at temporal-spatial scales in the upper stream of the Mekong River Basin. Sci. Total Environ. 2020, 701, 134782. [Google Scholar] [CrossRef]
  47. Bai, Y.; Guo, C.; Degen, A.A.; Ahmad, A.A.; Wang, W.; Zhang, T.; Li, W.; Ma, L.; Huang, M.; Zeng, H.; et al. Climate warming benefits alpine vegetation growth in Three-River Headwater Region, China. Sci. Total Environ. 2020, 742, 140574. [Google Scholar] [CrossRef]
  48. Gocic, M.; Trajkovic, S. Analysis of changes in meteorological variables using Mann-Kendall and Sen’s slope estimator statistical tests in Serbia. Glob. Planet. Chang. 2013, 100, 172–182. [Google Scholar] [CrossRef]
  49. Cai, B.F.; Yu, R. Advance and evaluation in the long time series vegetation trends research based on remote sensing. J. Remote Sens. 2009, 13, 1170–1186. [Google Scholar] [CrossRef]
  50. Li, Y.; Xie, Z.; Qin, Y.; Xia, H.; Zheng, Z.; Zhang, L.; Pan, Z.; Liu, Z. Drought Under Global Warming and Climate Change: An Empirical Study of the Loess Plateau. Sustainability 2019, 11, 1281. [Google Scholar] [CrossRef] [Green Version]
  51. Kendall, M.G. Rank Correlation Methods; Charles Griffin: London, UK, 1975. [Google Scholar]
  52. Tošić, I. Spatial and temporal variability of winter and summer precipitation over Serbia and Montenegro. Theor. Appl. Climatol. 2004, 77, 47–56. [Google Scholar] [CrossRef]
  53. Hou, X.Y.; Wu, T.; Yu, L.J.; Qian, S. Characteristics of multi-temporal scale variation of vegetation coverage in the Circum Bohai Bay Region, 1999–2009. Acta Ecol. Sin. 2012, 32, 297–304. [Google Scholar] [CrossRef]
  54. Huang, F.R.; Mo, X.G.; Lin, Z.H.; Hu, S. Dynamics and responses of vegetation to climatic variations in Ziya-Daqing basins, China. Chin. Geogr. Sci. 2016, 26, 478–494. [Google Scholar] [CrossRef] [Green Version]
  55. Stow, D.; Daeschner, S.; Hope, A.; Douglas, D.; Petersen, A.; Myneni, R.; Zhou, L.; Oechel, W. Variability of the Seasonally Integrated Normalized Difference Vegetation Index Across the North Slope of Alaska in the 1990s. Int. J. Remote Sens. 2003, 24, 1111–1117. [Google Scholar] [CrossRef]
  56. Lipsitz, S.R.; Leong, T.; Ibrahim, J.; Lipshultz, S. A Partial Correlation Coefficient and Coefficient of Determination for Multivariate Normal Repeated Measures Data. J. R. Stat. Soc. 2001, 50, 87–95. [Google Scholar] [CrossRef]
  57. Hu, S.; Wang, F.Y.; Zhan, C.S.; Zhao, R.X.; Mo, X.G.; Liu, L.M.Z. Detecting and attributing vegetation changes in Taihang Mountain, China. J. Mt. Sci. 2019, 16, 337–350. [Google Scholar] [CrossRef]
  58. Ghebrezgabher, M.G.; Yang, T.B.; Yang, X.M.; Eyassu Sereke, T. Assessment of NDVI variations in responses to climate change in the Horn of Africa. Egypt. J. Remote Sens. Space Sci. 2020, 23, 249–261. [Google Scholar] [CrossRef]
  59. Gu, Z.J.; Duan, X.W.; Shi, Y.D.; Li, Y.; Pan, X. Spatiotemporal variation in vegetation coverage and its response to climatic factors in the Red River Basin, China. Ecol. Indic. 2018, 93, 54–64. [Google Scholar] [CrossRef]
  60. Shi, Y.; Jin, N.; Ma, X.L.; Wu, B.Y.; He, Q.S.; Yue, C.; Yu, Q. Attribution of climate and human activities to vegetation change in China using machine learning techniques. Agric. For. Meteorol. 2020, 294, 108146. [Google Scholar] [CrossRef]
  61. Lunyolo, L.D.; Khalifa, M.; Ribbe, L. Assessing the interaction of land cover/land use dynamics, climate extremes and food systems in Uganda. Sci. Total Environ. 2021, 753, 142549. [Google Scholar] [CrossRef]
  62. Calow, R.C.; Macdonald, A.M.; Nicol, A.L.; Robins, N.S. Ground water security and drought in Africa: Linking availability, access, and demand. Ground Water 2010, 48, 246–256. [Google Scholar] [CrossRef]
  63. Nzabarinda, V.; Bao, A.; Xu, W.; Uwamahoro, S.; Madeleine, U.; Dufatanye Umwali, E.; Nyirarwasa, A.; Umuhoza, J. A Spatial and Temporal Assessment of Vegetation Greening and Precipitation Changes for Monitoring Vegetation Dynamics in Climate Zones over Africa. Int. J. Geo-Inf. 2021, 10, 129. [Google Scholar] [CrossRef]
  64. Knapp, A.K. Variation among Biomes in Temporal Dynamics of Aboveground Primary Production. Science 2001, 291, 481–484. [Google Scholar] [CrossRef] [Green Version]
  65. Fenta, A.A.; Tsunekawa, A.; Haregeweyn, N.; Tsubo, M.; Yasuda, H.; Shimizu, K.; Kawai, T.; Ebabu, K.; Berihun, M.L.; Sultan, D.; et al. Cropland expansion outweighs the monetary effect of declining natural vegetation on ecosystem services in sub-Saharan Africa. Ecosyst. Serv. 2020, 45, 101154. [Google Scholar] [CrossRef]
  66. Pfeifer, M.; Platts, P.J.; Burgess, N.D.; Swetnam, R.D.; Willcock, S.; Lewis, S.L.; Marchant, R. Land use change and carbon fluxes in East Africa quantified using earth observation data and field measurements. Environ. Conserv. 2013, 40, 241–252. [Google Scholar] [CrossRef] [Green Version]
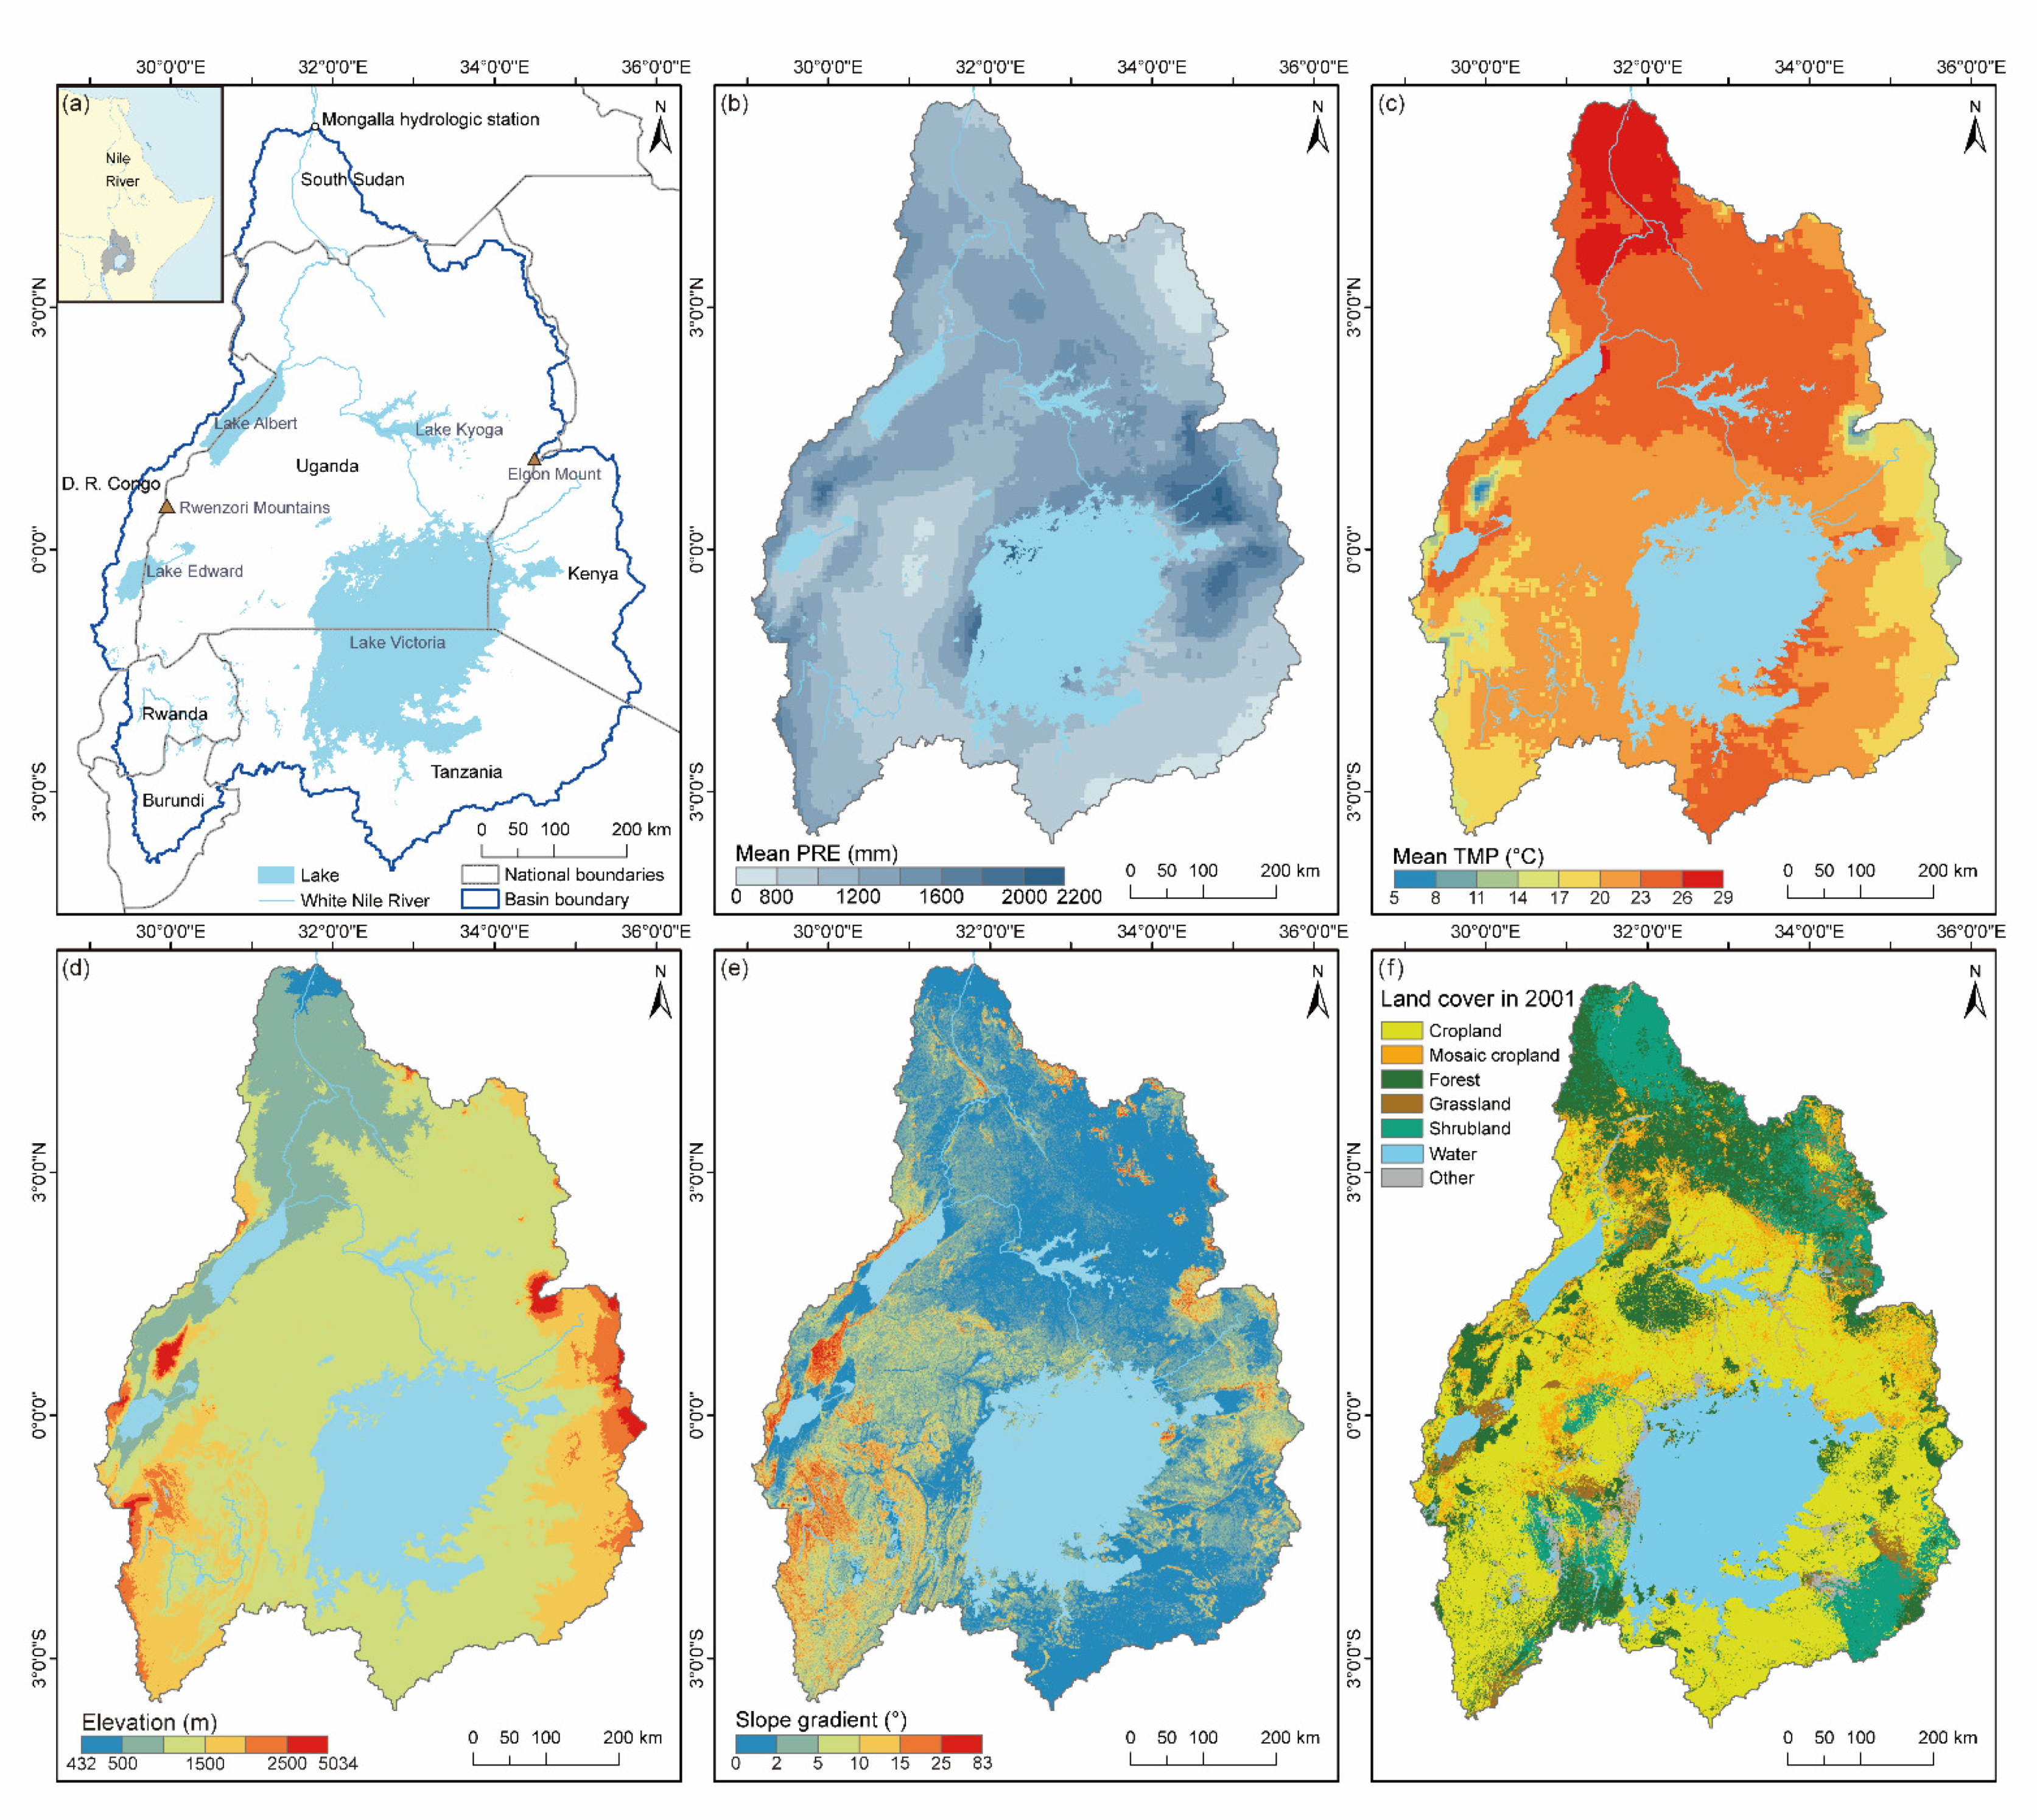
Figure 1. Schematic diagram of the basic information space of the UWNR. (a) Location map. (b) Mean PRE. (c) Mean TMP. (d) Elevation. (e) Slope gradient. (f) Land cover in 2001.
Remotesensing 13 03648 g001
Figure 2. NDVI time series from GIMMS and MODIS. (a) Monthly NDVI time series from 1982–2020. (b) Correlations of the two datasets for 2000–2015. (c) Correlations of the two datasets for 2000–2015 without singular values and extreme values. (d) Assimilated NDVI for 1982–2020.
Remotesensing 13 03648 g002
Figure 3. Changes of the NDVI in the UWNR from 1982 to 2020. (a) Piecewise linear fitting of the inter annual variation in the NDVI. (b) Mann-Kendall mutation test of the NDVI in the UWNR. (c) Interannual variations in the NDVI in different vegetation types from 1982 to 2020. (d) Monthly variation in the NDVI (1982–2020) and PRE (1982–2018) in the UWNR.
Remotesensing 13 03648 g003
Figure 4. Heat map of the average the NDVI with elevation and slope from 1982 to 2020 in the UWNR.
Remotesensing 13 03648 g004
Figure 5. The spatial distribution of the NDVI and volatility in the UWNR from 1982 to 2020. (a) Spatial distribution of the average NDVI value. (b) Spatial distribution of volatility. (c) Percentage of different volatilities in the area of each vegetation type. (d) Percentage of different volatilities in the area of each elevation zone. (e) Percentage of different volatilities in the total area of each gradient zone.
Remotesensing 13 03648 g005
Figure 6. Vegetation change trends in different stages: (a) Vegetation trend from 1982 to 2020. (b) Vegetation trend from 1982 to 1999. (c) Change trend from 2000 to 2020. (d) Change trend under different vegetation types from 1982 to 2020. (e) The change trend of vegetation in different elevation zones from 1982 to 2020. (f) The change trend of vegetation in different slope zones from 1982 to 2020. Note: IPV.O means that the vegetation is significantly improved, IPV.S means that the vegetation is slightly improved, DEG.S means that the vegetation is slightly degraded, DEG.O means that the vegetation is significantly degraded, and NC means that the vegetation is relatively stable.
Remotesensing 13 03648 g006
Figure 7. Future trends of vegetation in the UWNR. (a) Sustainability of the NDVI. (b) Future trends of vegetation. (c) Future trend under different vegetation types. (d) Future trend of vegetation in different elevation zones. (e) Future trend of vegetation in different slope zones. Note: IPV-F represents that vegetation will change from a degradation trend to an improvement trend in the future, IPV-C represents that vegetation will continue to improve in the future, ST-C represents that the continuous stability of vegetation, UST-F represents that unstable in the future, DEG-C represents that vegetation will continue to degenerate in future, and DEG-F represents that vegetation will change from an improvement trend to a degradation trend in the future.
Remotesensing 13 03648 g007
Figure 8. Partial correlation coefficients between vegetation and climate factors. (a) Spatial distribution of the partial correlation coefficients between vegetation and PRE. (b) Spatial distribution of the partial correlation coefficients between vegetation and PRE that passed the 0.05 significance test. (c) Spatial distribution of the partial correlation coefficients between vegetation and TMP. (d) Spatial distribution of the partial correlation coefficients between vegetation and TMP that passed the 0.05 significance test. (e) The proportion of positive and negative correlations in the area of each vegetation type. (f) The proportion of positive and negative correlations in the area of each gradient zone. (g) The proportion of positive and negative correlations in the area of each elevation zone. (h) The average partial correlation coefficient in different vegetation types, elevation zones and gradient zones. Note: The partial correlation value in (h) is the average value of the area that passed the 0.05 significance test.
Remotesensing 13 03648 g008
Figure 9. Relative role of human activities and climate change. (a) The relative role of human activities. (b) The relative role of climate change. (c) The relative role of different vegetation types. (d) The relative role of different elevation zones. (e) The relative role of different gradient zones. Note: RHA is the relative role of human activities, and RCC is the relative role of climate change.
Remotesensing 13 03648 g009
Table 1. Percentage of area occupied by various vegetation types in the UWNR.
Land Cover TypeAbbreviationProportion of Total UWNR Area (%)
Agricultural landRainfed cropland and irrigated croplandCL41.16
Mosaic cropland mixed with natural vegetationMCL8.4
ForestFL16.9
GrasslandGL2.88
ShrublandSL11.6
Table 2. Coefficient of variation of NDVI in the UWNR.
CVVolatility DegreeArea Percentage (%)
1982–20201982–19992000–2020
<0.05Low volatility43.5682.8457.53
0.05–0.10Relatively low volatility49.4516.4537.73
0.10–0.15Medium volatility5.430.713.80
0.15–0.20Relatively high volatility1.140.0020.74
≥0.20High volatility0.41--0.20
Table 3. Trend of NDVI in the UWNR.
Trend SlopeZNDVI TrendArea Percentage (%)
1982–20201982–19992000–2020
β < −0.0005|Z| > 1.96Significantly degraded9.931.756.05
β < −0.0005|Z| ≤ 1.96Slightly degraded3.5816.5619.37
0.0005 ≥ β > −0.0005|Z| > 1.96 or
|Z| ≤ 1.96
Stable14.5926.2018.07
β ≥ 0.0005|Z| ≤ 1.96Slightly improved9.0644.1333.94
β ≥ 0.0005|Z| > 1.96Significantly improved62.8511.3622.57
Table 4. NDVI trend and Hurst index in the UWNR from 1982 to 2020.
Trend SlopeZHVariation TypeFuture TrendsArea Precentage (%)
β < −0.0005|Z| > 1.960 ≤ H < 0.5Unsustainbility and significantly degradedImprove in the future8.29
β < −0.0005|Z| ≤ 1.960 ≤ H < 0.5Unsustainbility and slightly degradedImprove in the future3.19
β ≥ 0.0005|Z| > 1.960 ≤ H < 0.5Unsustainbility and significantly improvedDegrade in the future52.25
β ≥ 0.0005|Z| ≤ 1.960 ≤ H < 0.5Unsustainbility and slightly improvedDegrade in the future8.26
β ≥ 0.0005|Z| > 1.960.5 < H ≤ 1Sustainability and significantly improvedContinuous improvement10.59
β ≥ 0.0005|Z| ≤ 1.960.5 < H ≤ 1Sustainability and slightly improvedContinuous improvement0.81
β < −0.0005|Z| > 1.960.5 < H ≤ 1Sustainability and significantly degradedPersistent degradation1.64
β < −0.0005|Z| ≤ 1.960.5 < H ≤ 1Sustainability and slightly degradedPersistent degradation0.39
0.0005 ≥ β > −0.0005|Z| > 1.96 or |Z| ≤ 1.960 ≤ H < 0.5Unsustainbility and stableUnstable in the future13.26
0.0005 ≥ β > −0.0005|Z| > 1.96 or |Z| ≤ 1.960.5 < H ≤ 1Sustainability and stableContinuously stable1.32
Publisher’s Note: MDPI stays neutral with regard to jurisdictional claims in published maps and institutional affiliations.