Technical Note

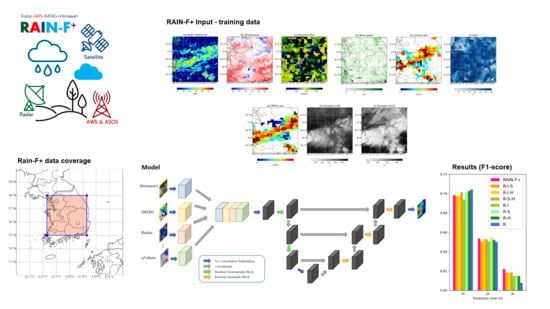
RAIN-F+: The Data-Driven Precipitation Prediction Model for Integrated Weather Observations

SI-Analytics, 70 Yuseong-daero 1689 beon-gil, Yuseong-gu, Daejeon 34047, Korea
*
Author to whom correspondence should be addressed.
Remote Sens. 2021, 13(18), 3627; https://doi.org/10.3390/rs13183627
Submission received: 31 July 2021 / Revised: 7 September 2021 / Accepted: 8 September 2021 / Published: 11 September 2021
(This article belongs to the Section Atmospheric Remote Sensing)

Abstract

:
Quantitative precipitation prediction is essential for managing water-related disasters, including floods, landslides, tsunamis, and droughts. Recent advances in data-driven approaches using deep learning techniques provide improved precipitation nowcasting performance. Moreover, it has been known that multi-modal information from various sources could improve deep learning performance. This study introduces the RAIN-F+ dataset, which is the fusion dataset for rainfall prediction, and proposes the benchmark models for precipitation prediction using the RAIN-F+ dataset. The RAIN-F+ dataset is an integrated weather observation dataset including radar, surface station, and satellite observations covering the land area over the Korean Peninsula. The benchmark model is developed based on the U-Net architecture with residual upsampling and downsampling blocks. We examine the results depending on the number of the integrated dataset for training. Overall, the results show that the fusion dataset outperforms the radar-only dataset over time. Moreover, the results with the radar-only dataset show the limitations in predicting heavy rainfall over 10 mm/h. This suggests that the various information from multi-modality is crucial for precipitation nowcasting when applying the deep learning method.

Graphical Abstract

1. Introduction

Weather observation provides the state of the atmosphere with various types of information from in situ and remote measurements. Surface observations are from the in situ sensors that provide direct atmospheric state observations such as temperature, humidity, or pressure, while many remote sensing data from radar and satellites provide radiance and reflectivity measurements over distance. Historically, observations have been used to analyze the current atmospheric state or the past weather phenomenon. However, recent advances in deep learning techniques provide data-driven weather forecasting using weather observations and show great potential for improving forecasting performance.
Weather forecasting using deep learning approaches is an interesting research topic in the weather and climate community and the computer vision community since weather data are considered a typical spatial-temporal dataset related to many applications in image prediction. Therefore, there have been many studies related to weather forecasting using deep learning approaches, and the famous Conv-LSTM architecture [1] is developed to predict future precipitation using radar observations in the Hong Kong area and is applied to various image prediction applications.
However, quantitative precipitation prediction has still been challenging because the physical process of clouds and precipitation should be considered from the particle formation in the microscale to the precipitation system within the synoptic scale for accurate precipitation prediction. Due to the limited representative resolution of observations and model simulations, understanding clouds and precipitation are difficult. According to their physical conditions, various types of clouds and precipitation microphysics parameterization methods predict clouds and precipitation processes in the numerical weather forecasting model [2]. Since most numerical models have limitations for predicting cloud and precipitation in 1–3 h due to the cold start of the physical process, radar observation has been widely used for the nowcasting based on the extrapolation method. However, extrapolation methods do not consider the lifecycle of the precipitation system. Recently, there are attempts to overcome the limitations of the extrapolation method [3,4,5,6]. Reference [6] proposed the model to predict the growth and decay of vertically integrated liquid based on an autoregressive integrated process and showed improved prediction skill scores compared to the conventional method. Reference [7] blended the radar-based nowcasting with the numerical weather prediction model, and the results showed that prediction skills with blending techniques are outperformed compared with radar-only nowcasting and numerical weather forecasts with data assimilation. Moreover, recent advances in data-driven approaches using deep learning also provide the great possibility to predict precipitation with improved prediction skills. Google’s MetNet [8] predicts precipitation over the continental United States up to 8 h from the past radar and satellite observations using deep neural networks. The MetNet outperforms the prediction results from the operational numerical weather prediction model, High-Resolution Rapid Refresh (HRRR), of the National Oceanic and Atmospheric Administration (NOAA). The SmaAT-Unet [9], the Convcast [10], the Rainnet [11], and the Rainbench [12] are also proposed for precipitation nowcasting. The SmaAT-Unet uses the UNet architecture with attention modules and depthwise-separable convolutions, and the input data are the radar maps over the Netherlands. The Convcast uses ConvLSTM architectures, and the Integrated Multi-satelliteE Retrievals for Global precipitation measurement (IMERG) dataset was used for the input data. The results from them were all reasonable for rain or no-rain separations and light rainfall. However, the results for the heavy rain rate over 10 mm/h showed the significant limitation for predictions in advance. Moreover, heavy rainfall occurrence numbers a few, providing limited information for physical understanding.
Recently, the multimodal deep learning technique is considered for rich and diverse information from the various data sources by combining them into the training dataset [13,14,15]. The multimodal knowledge from weather and climate observations is also used for data-driven weather analysis and predictions in many studies [16,17,18,19]. Reference [16] introduces the input data structures composed of Delay-Doppler maps (DDM) and all satellite receiver status (SRS) parameters for retrieving ocean wind speed. They proposed a heterogeneous multimodal deep learning method, and they compared the heterogeneous model to the homogeneous multimodal approach, which extracts the features from each data source using only a multilayer perceptron (MLP). Their proposed heterogeneous multimodal approach uses a convolutional neural network (CNN) and two MLPs for extracting features from DDM, SAS parameters, and wind speed, respectively. The results showed that the heterogeneous approach outperformed the homogeneous approaches, showing improved prediction accuracy at 7.7%. Reference [17] proposed the LightningNet for lightning nowcasting from three different types of observations: a geostationary meteorological satellite, Doppler weather radar network, and CG lightning location system. These three different sources of the dataset are interpolated to the uniform resolution. The lightningNet has an encoder and decoder network with three-dimensional convolutional layers, and the prediction results showed that the performance is improved more than 50% when all three data sources are used for training. Reference [18] proposed a multimodal semisupervised deep graph learning framework for precipitation nowcasting. They merged different data from meteorological and non-meteorological observations, including radar echo maps, air humidity images, satellite images, temperature images, a topographic map, and available precipitation maps. They also showed reduced mean squared errors with multiple data sources such as input data for training. Reference [19] introduced a Geoscience Data Integration Platform (GeoDIP) to manage big geoscience data based on high-performance computing clusters, and the integrated data from satellite and reanalysis products are used to predict precipitation based on deep learning approaches. The results showed that the performance with the integrated dataset does not decline as much as the results, with only one dataset when prediction time goes by.
This study proposed the fusion dataset and the benchmark model for rainfall prediction based on a deep learning approach. The precipitation prediction using multimodal dataset is also performed in [12] that used three different types of weather data, including the simulated satellite data, numerical reanalysis data, and IMERG global precipitation estimates. Since RainBench focuses on global precipitation forecasting, their multimodal information covers the global area, and the training dataset is converted into the 5.625 ° spatial resolution images. Comparing with their research, the RAIN-F+ uses the real-world dataset from weather observation data at higher spatial resolutions covering the land area over the Korean peninsula.
We aim to address the following goals in our study: (1) to introduce the integrated real-world weather observation dataset named RAIN-F+ for rainfall prediction; (2) to propose the rainfall prediction algorithm based on the U-Net with residual blocks; (3) and to evaluate the prediction performance according to the number of modalities using RAIN-F+ dataset.

2. Data Descriptions

The fusion dataset for this study is named RAIN-F+. It comprises four types of weather observation data related to precipitation:
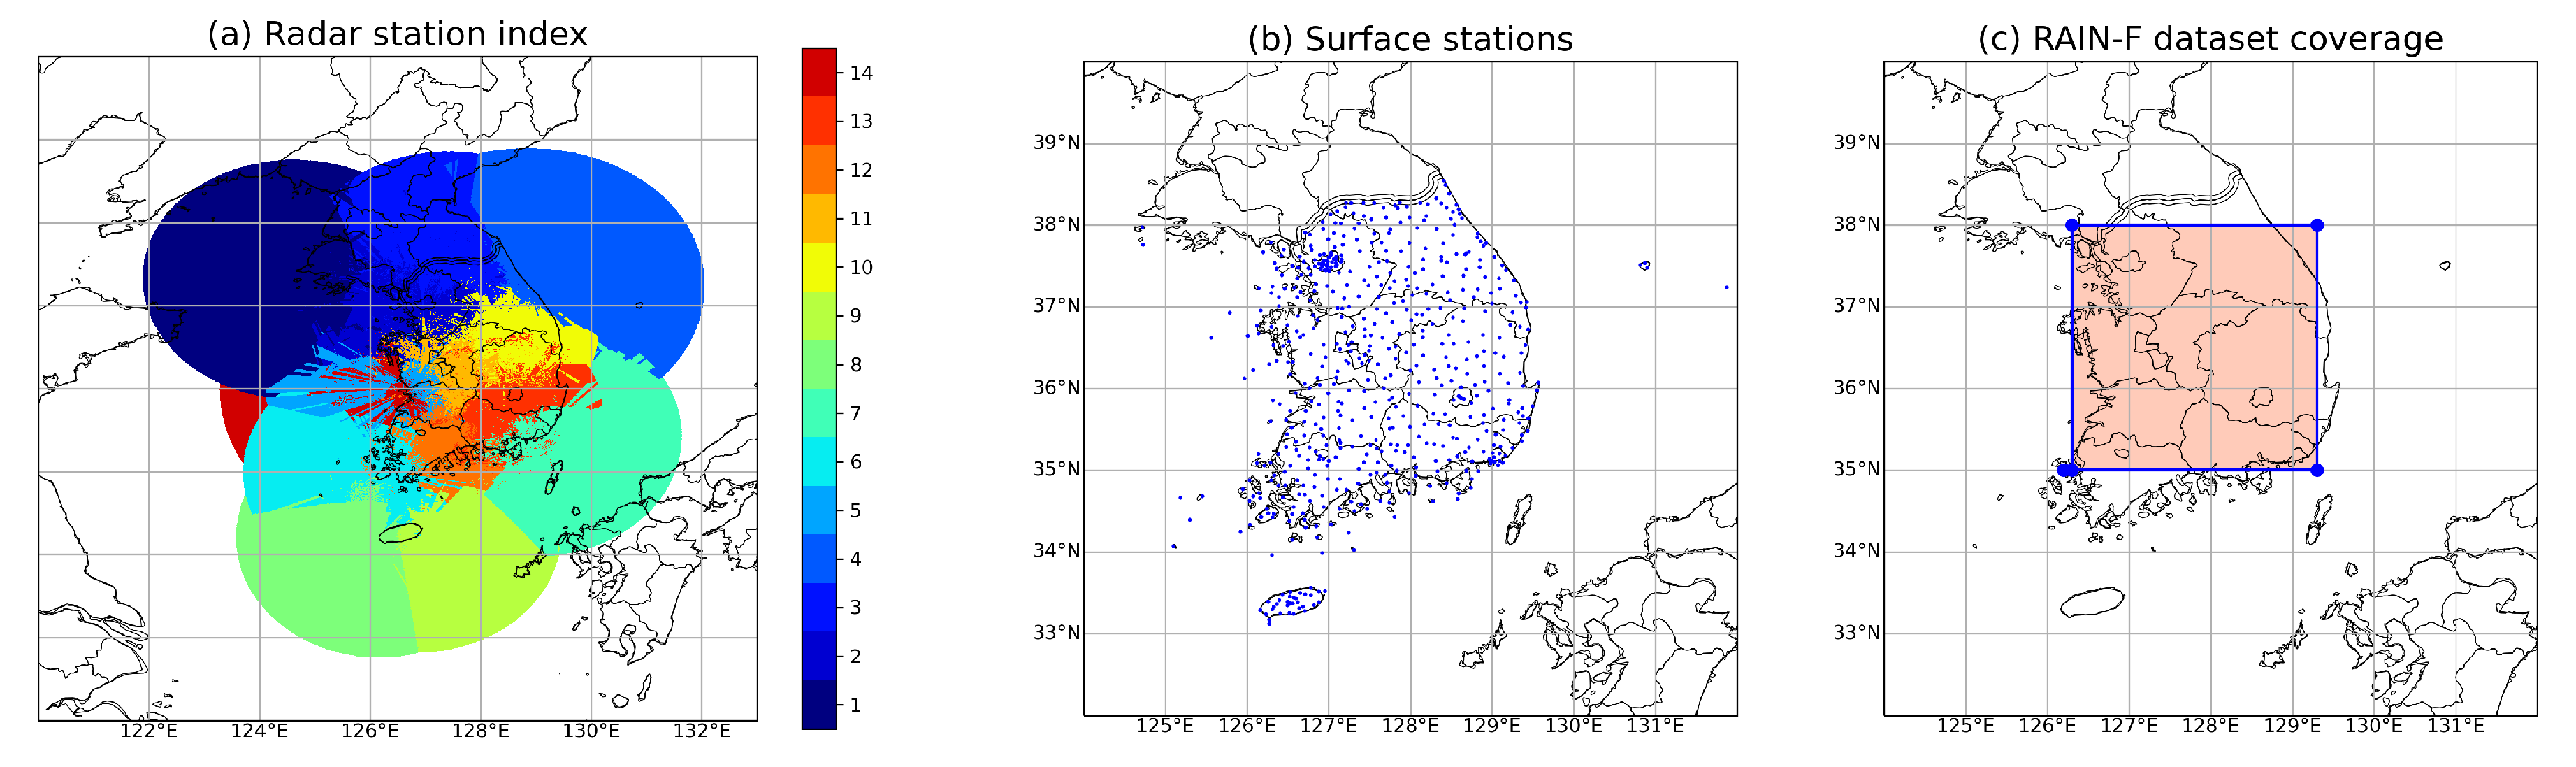
  • The operational radar system over the Korean Peninsula;
  • The surface weather observations provided by Korea Meteorological Administration (KMA);
  • The version 6 of IMERG products from the National Aeronautics and Space Administration (NASA);
  • The Himawari-8 satellite from Japan Meteorological Agency (JMA).

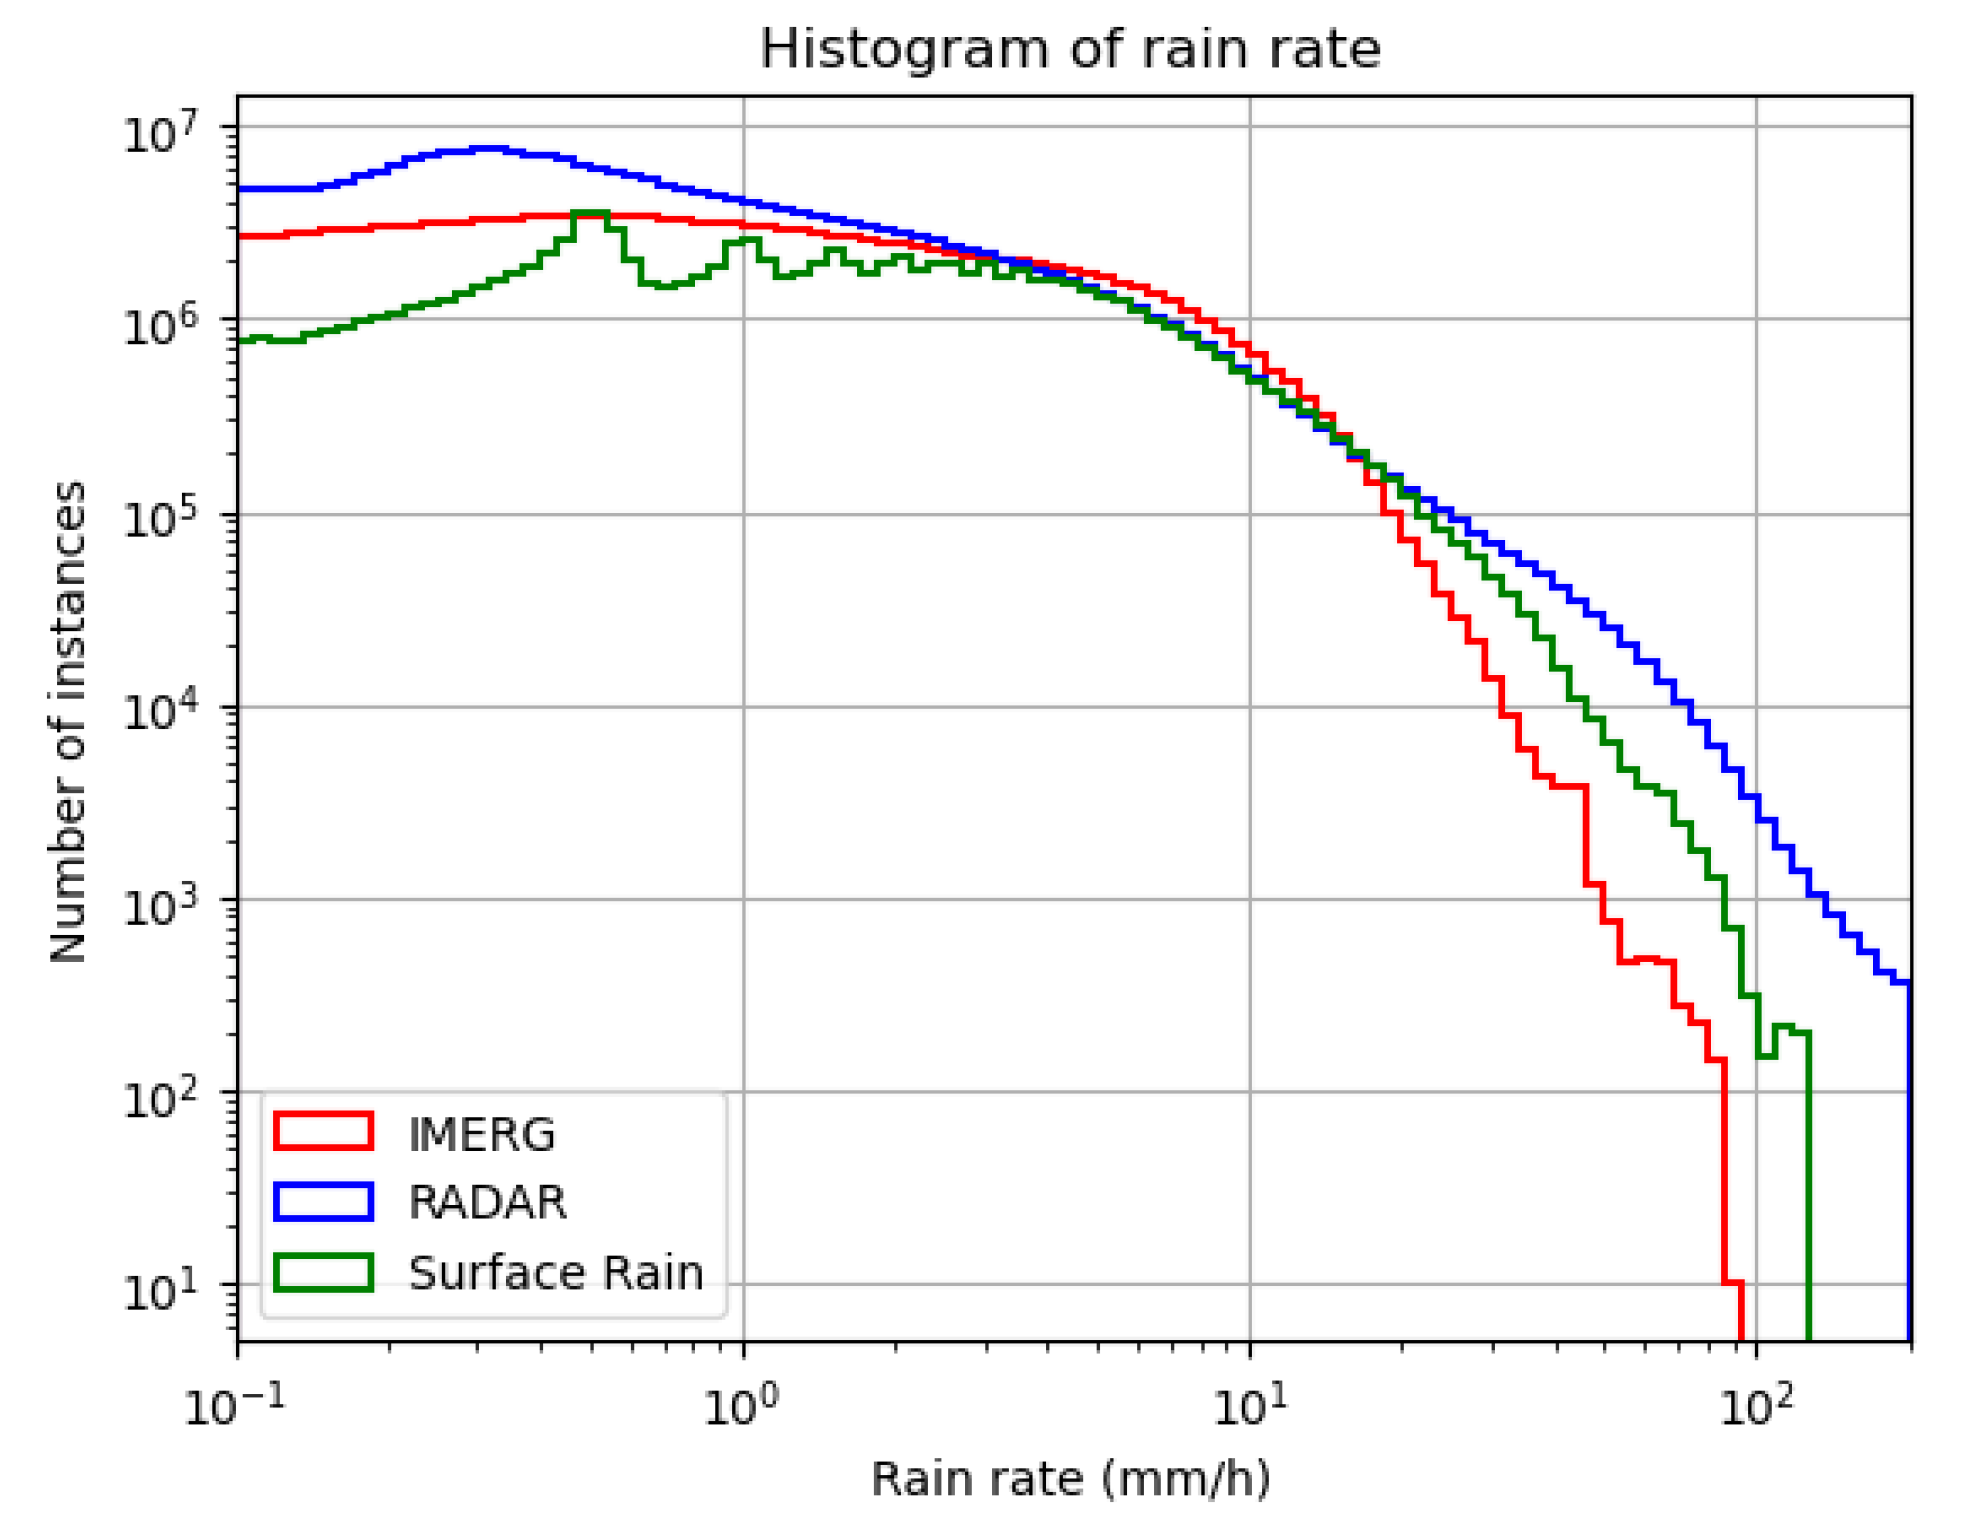
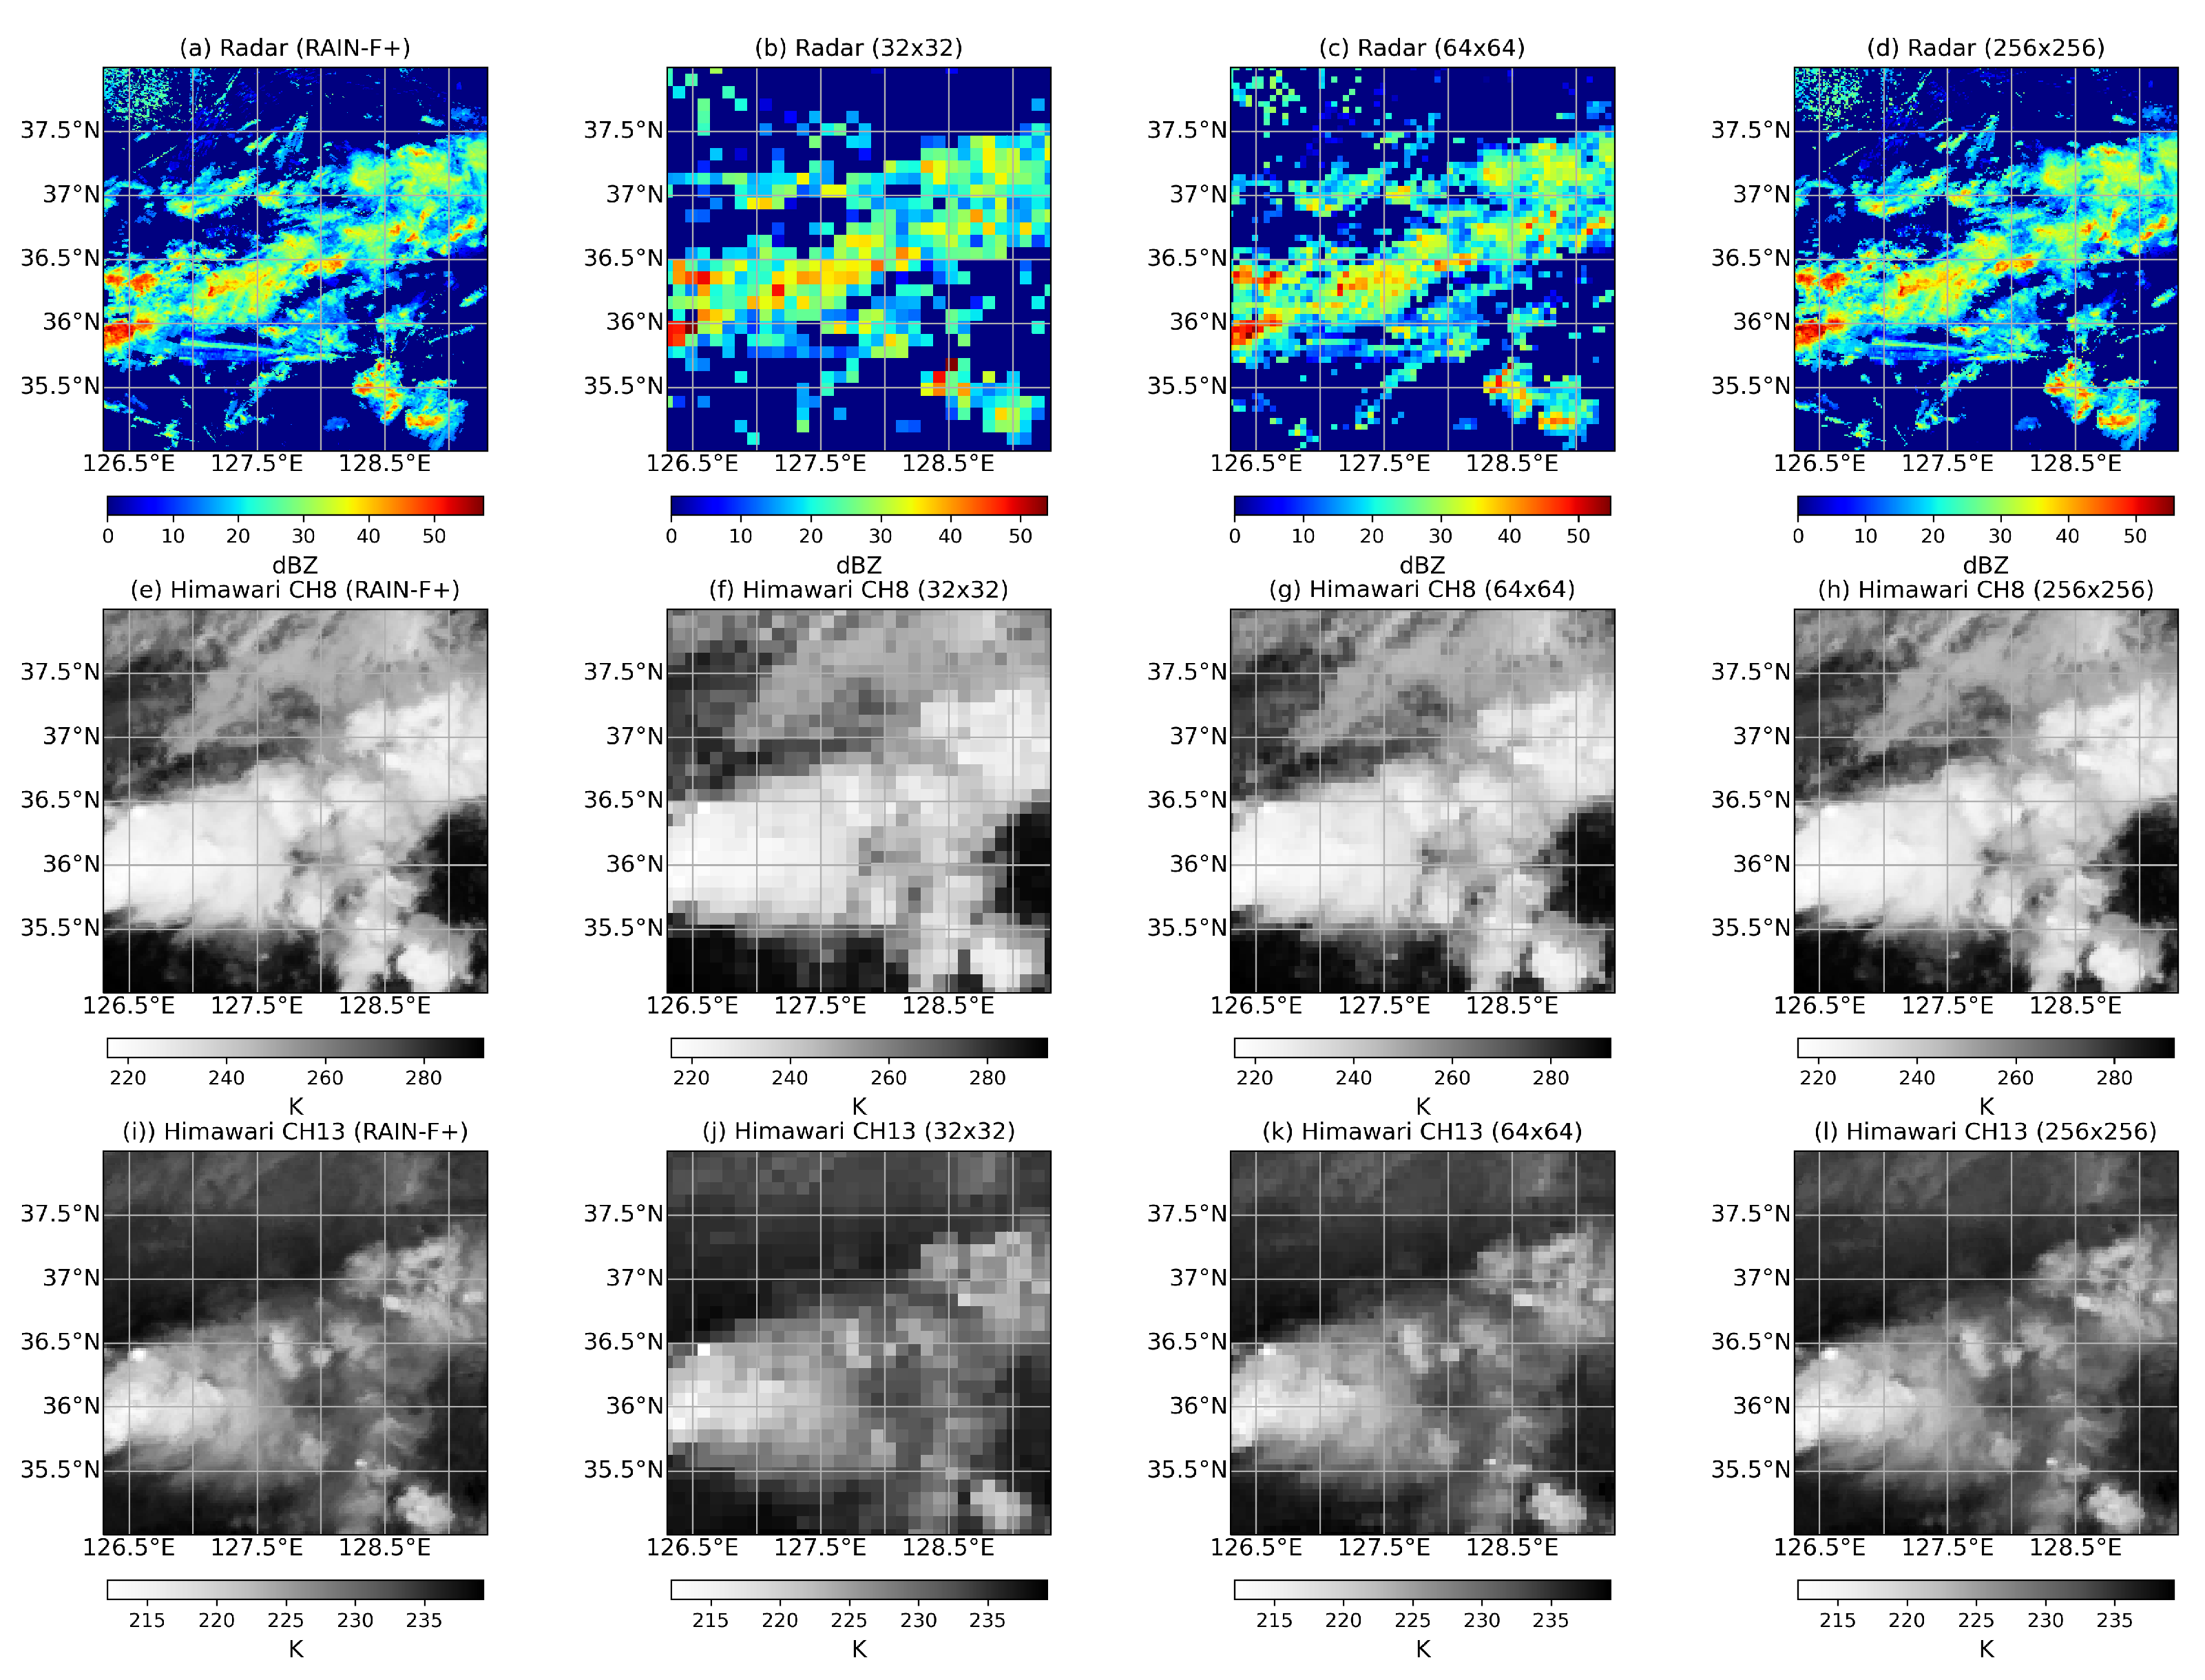
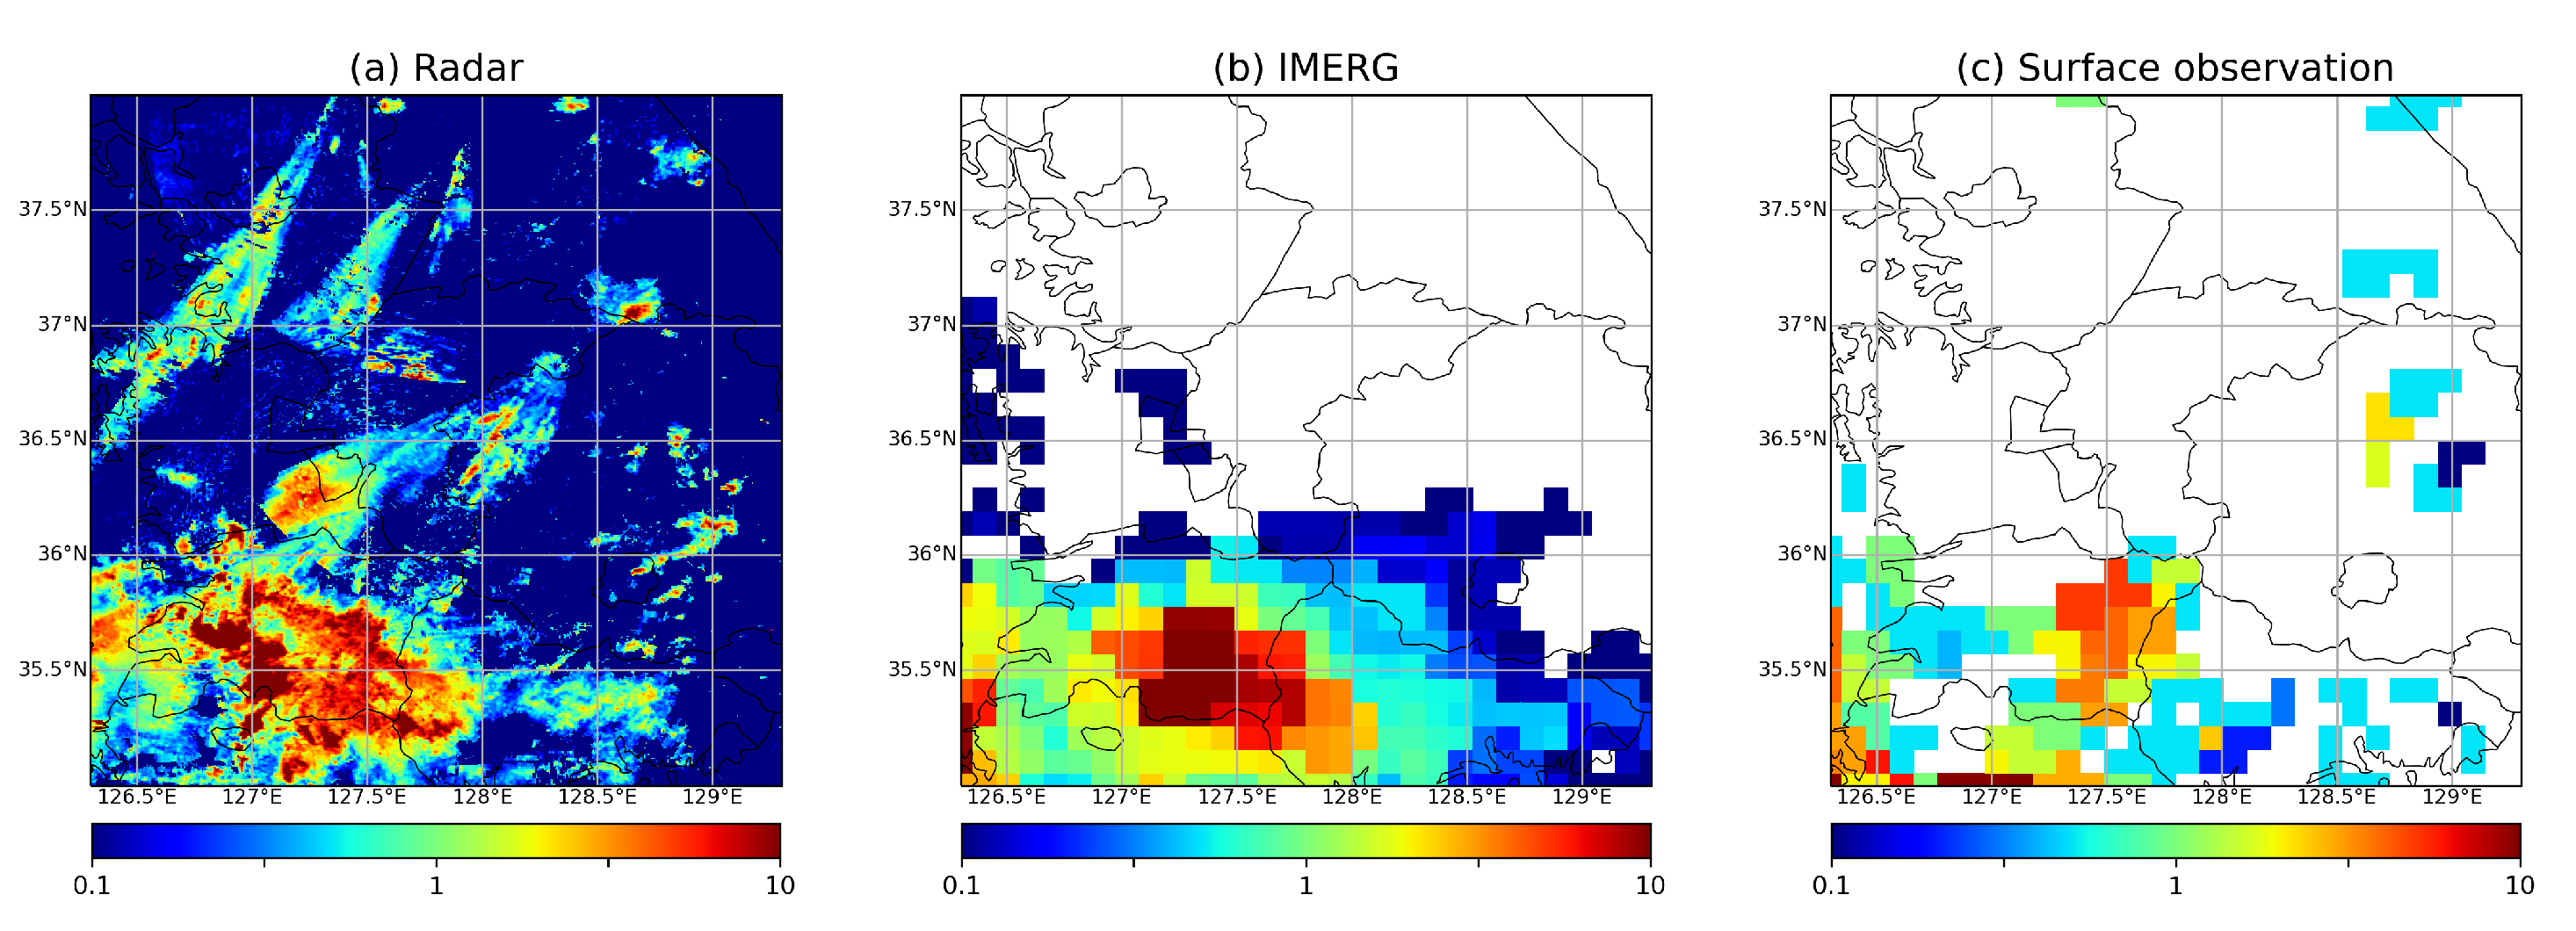
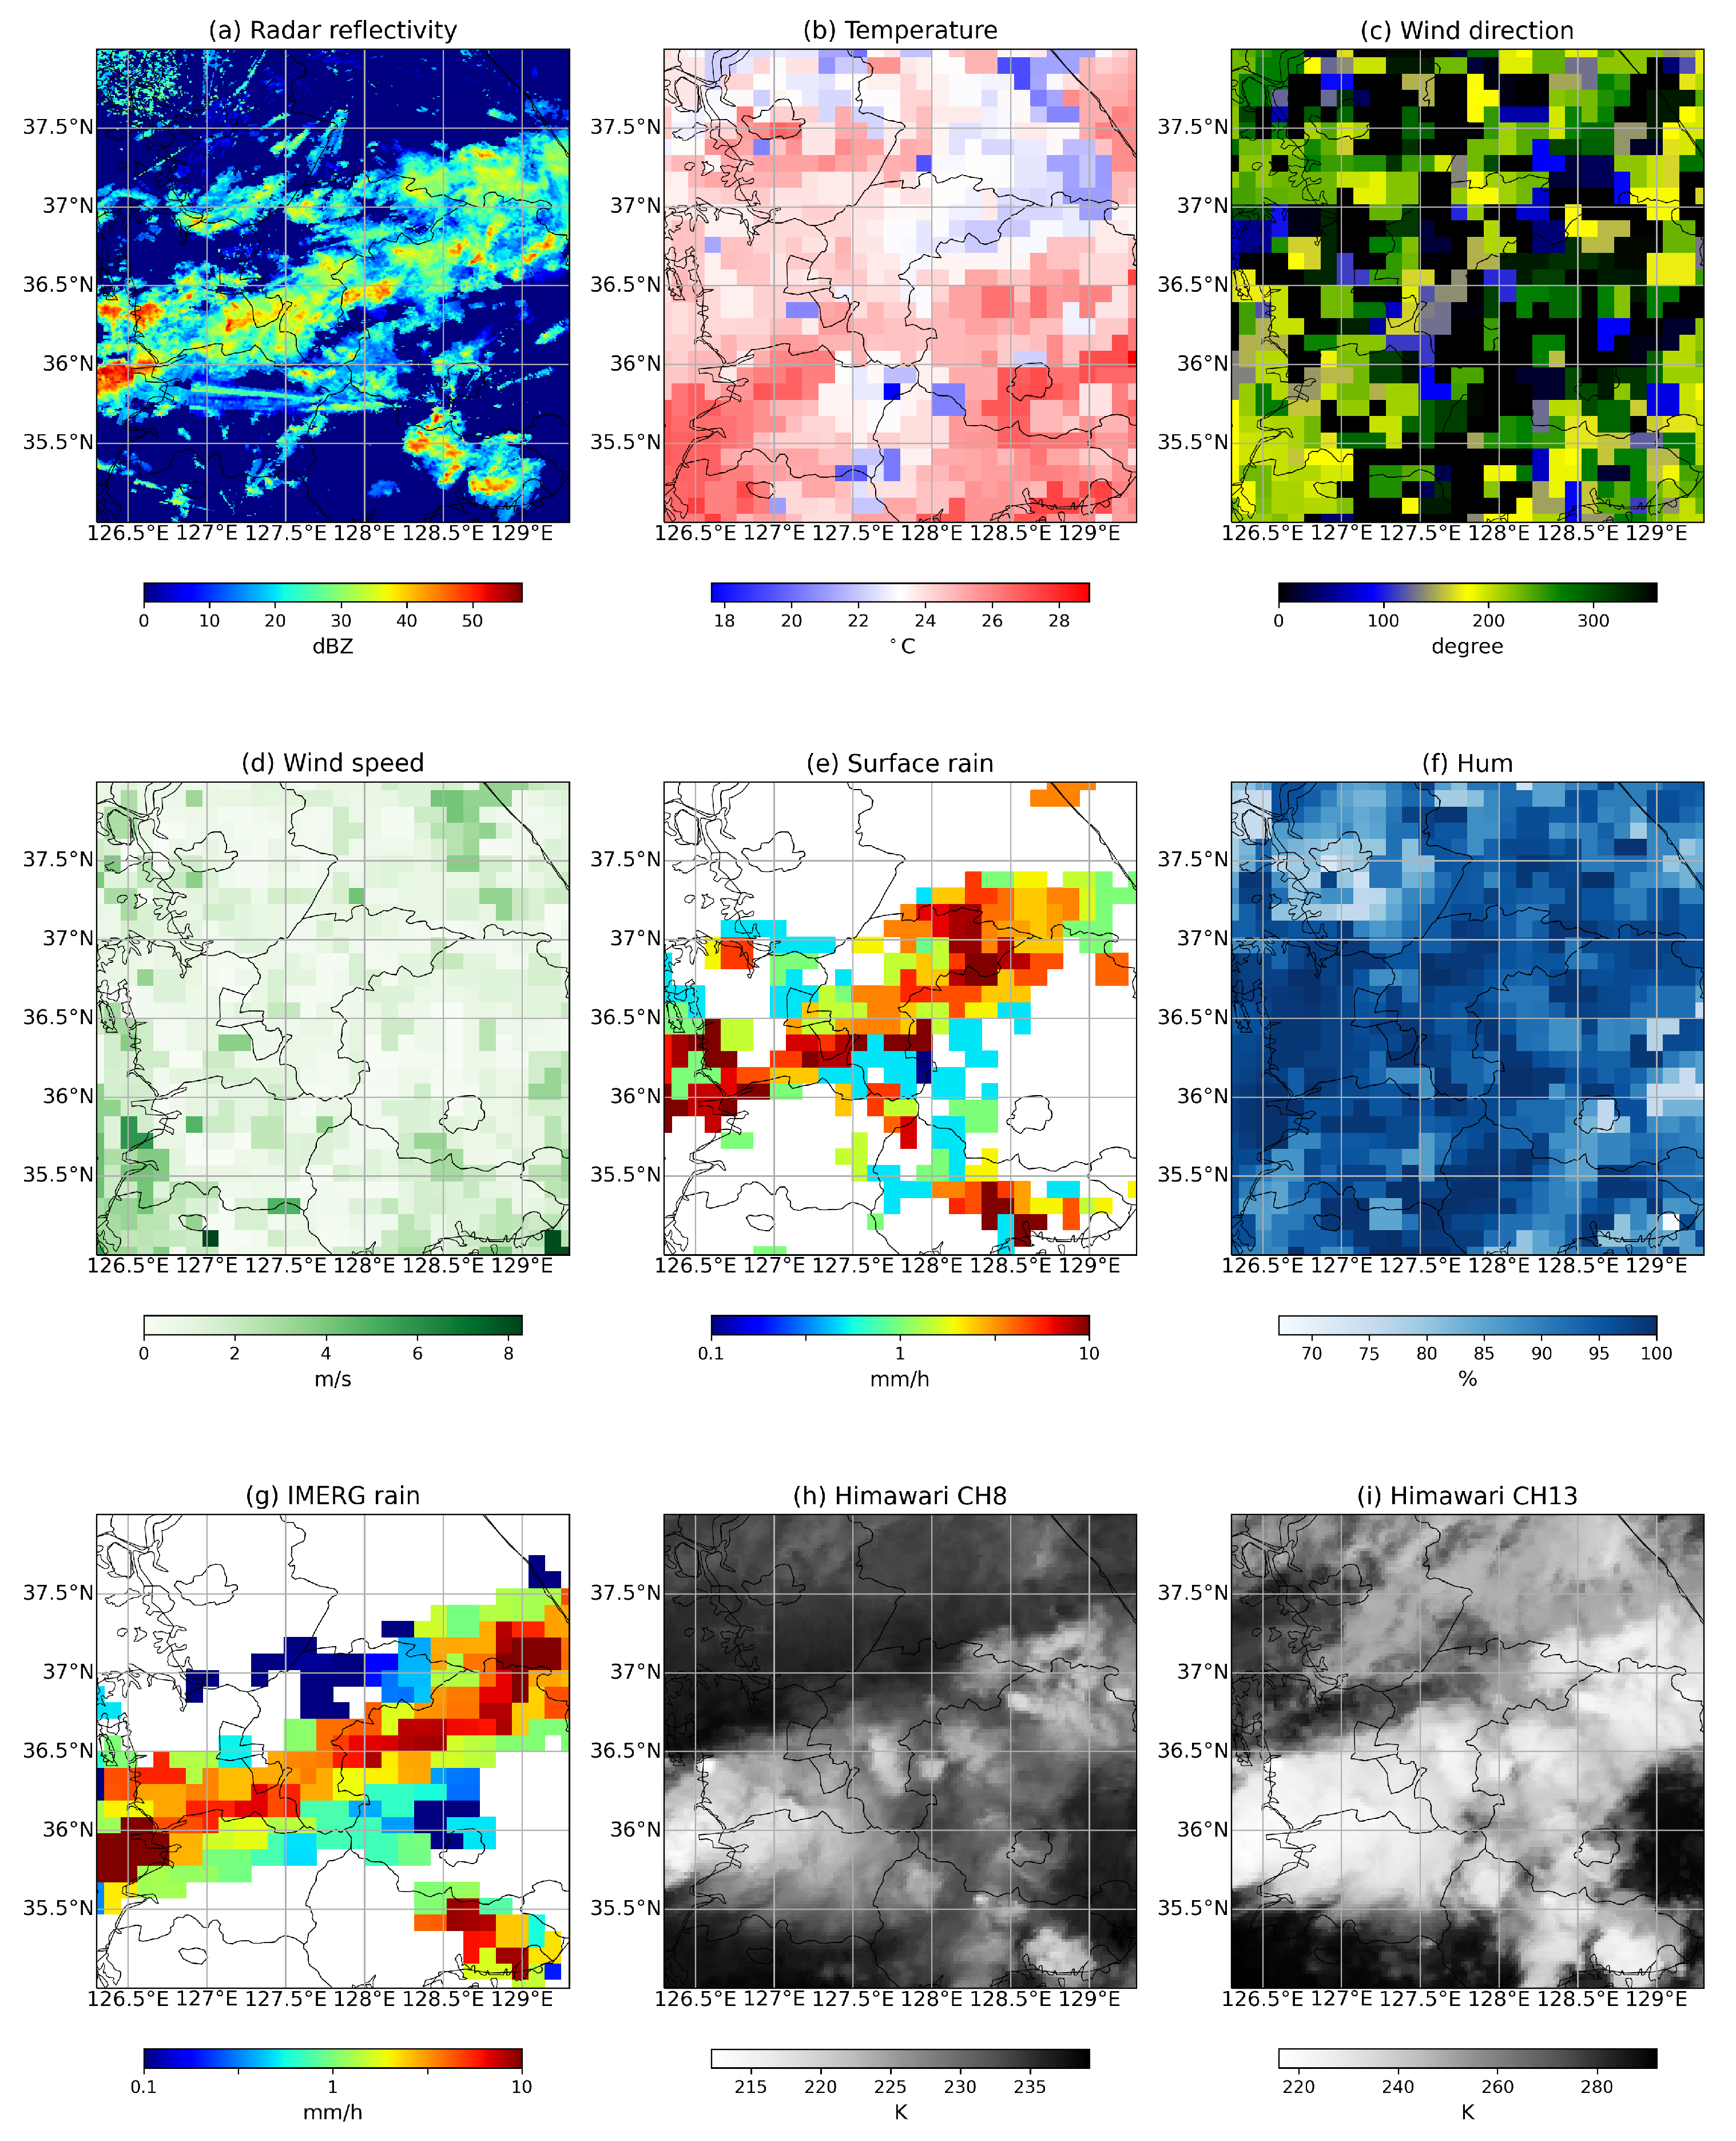
2.1. Radar Observations

A meteorological radar system is primarily designed to measure the precipitation location, intensity, and motion by detecting the signals reflected back to the radar by precipitating particles in the atmosphere. The radar products for this study are provided by KMA. The KMA has operated a weather radar network composed of S-band weather radars. The radar coverage is represented in Figure 1a. In this study, the Hybrid Surface Rainfall (HSR) data are used to train the benchmark model. Moreover, we used HSR products as a reference dataset for model evaluation because the radar observation provides the most accurate precipitation measurements. The HSR developed by [20] is a 2D radar image generated using dual-polarization parameters and the hybrid scan method. The HSR consists of the lowest radar bins that are immune to ground clutter and non-meteorological echoes. The radar reflectivity fields have a spatial resolution of 500 m with 2305 pixels in longitude and 2881 pixels in latitude and a temporal resolution of 5 min.

2.2. AWS and ASOS Observations

The Automatic Weather Station (AWS) and Automatic Surface Observing System (ASOS) are the surface observation stations operated by the KMA. The station locations are in Figure 1b. There are 102 ASOS and 510 AWS stations. As shown in the figure, the AWS and ASOS stations are irregularly located over the land area. The average spatial resolution is approximately 13 km, and the temporal resolution is one minute. The common atmospheric state variables observed from both stations are temperature, wind direction and speed, rain rate, surface pressure, sea level pressure, and humidity. The ASOS has observed more variables such as solar radiation and evaporation quantity. This study only used common variables because we considered AWS and ASOS data as the same surface observation category for the RAIN-F+ dataset. Among the common variables, surface and sea level pressure observations are excluded for the RAIN-F+ dataset because both pressure observation have more than 58% of missing values among the total observations, while the ratio of those from other variables is mostly less than 0.4%. The spatial resolution of RAIN-F+ is 0.1 ° , which is comparable to the approximated average resolution of surface stations. Since surface rain rate is accumulated for every hour, the temporal resolution of surface observation for the RAIN-F+ dataset is one hour.

2.3. IMERG Products

The IMERG is intended to merge and intercalibrate the Global Precipitation Measurement (GPM) satellite constellation [21]. The GPM mission deploys a GPM core satellite led by NASA and the Japanese Aerospace Exploration Agency (JAXA) and 11 microwave satellites from several international partners, including the European Organization for the Exploitation of Meteorological Satellites, Megha-Tropiques satellite provided by the Centre National D’Etudies Spatiales of France, and the Indian Space Research Organisation. Microwave satellites have been used to measure precipitation from space since the 1970s because microwave signatures have physical relations with precipitating particles [22,23,24,25]. The IMERG product provide precipitation measurements with the physical relations on a global scale. The spatial resolution is 0.1 ° , and the temporal resolution is 30 min. The IMERG has three different types of products, ‘Early’, ‘Late’, and ‘Final’, according to their data distribution time. In this study, we used ‘Late’ products for RAIN-F+ data fusion.

2.4. Himawari Products

The Himawari-8 satellite is a geostationary satellite launched in October 2014. The Advanced Himawari Imager (AHI) is a payload of the Himawari satellite with a visible and infrared (IR) sensor of 16 channels. We used Himawari-8 gridded data covering 85 ° E–205 ° E and 60 ° S–60 ° N area distributed by the Center for Environmental Remote Sensing(CEReS), Chiba University, Japan [26,27]. The spatial resolution is 0.02 ° (approximately 2 km), and the temporal resolution is 10 min. Among the 16 channels of AHI, we used Brightness Temperature (TB) from two IR channels of 6.2 µm and 10.4 µm. The channel at 6.2 µm is known for an upper-level water vapor channel, and the channel at 10.4 µm is known for a Window Channel.

2.5. RAIN-F+ Overviews

The RAIN-F+ is a new version for RAIN-F [28,29] that is a Radar, AWS and ASOS, and IMERG Network fusion dataset for rainfall prediction. The geostationary satellite observations are added to the RAIN-F dataset, and pressure observations are excluded. Since the RAIN-F+ dataset includes atmospheric variables and TB products, it can also be used to retrieve atmospheric variables from satellite observations or to predict atmospheric states as well as precipitation. The RAIN-F+ dataset covers the land area over the Korean peninsula, as shown in Figure 1c. The observation data were collected for three years, from 2017 to 2019. In Korea, Jang-Ma and typhoons are the primary factors occurring heavy rainfall in the summer season. During these three years, the number of typhoons that affected the Korean Peninsula numbered three, five, and seven in 2017, 2018, and 2019, respectively. The average precipitation rates from the Jang-Ma are 291.2 mm, 283.0 mm, and 291.1 mm for 2017, 2018, and 2019, respectively. The number of typhoon cases increased while the precipitation rate from Jang-Ma decreased compared with the average annual precipitation from Jang-Ma. Figure 2 showed the histograms of rain rate from IMERG, radar, and surface observations in the RAIN-F+ dataset. The three datasets have a different number of pixels for each rainfall, and the radar product has more pixels for heavy rains greater than 10 mm/h. Since wintertime precipitation over Korea includes the snow, we used the data from spring (April) to fall (October). The one example of the RAIN-F+ dataset at 12 UTC on 30 August 2018 is in Figure 3. Since the four data sources have different spatial and temporal resolutions, coverage, data types, and map projection, it is necessary to unify them. We interpolated them into the gridded 2D images by finding the nearest locations with the temporal resolutions of one hour. The gridded subset image sizes of radar, surface observation, and Himawari are 960 × 960 pixels, 30 × 30 pixels, and 120 × 120 pixels. The size of the IMERG subset image is the same as the surface observations.

3. Methodology

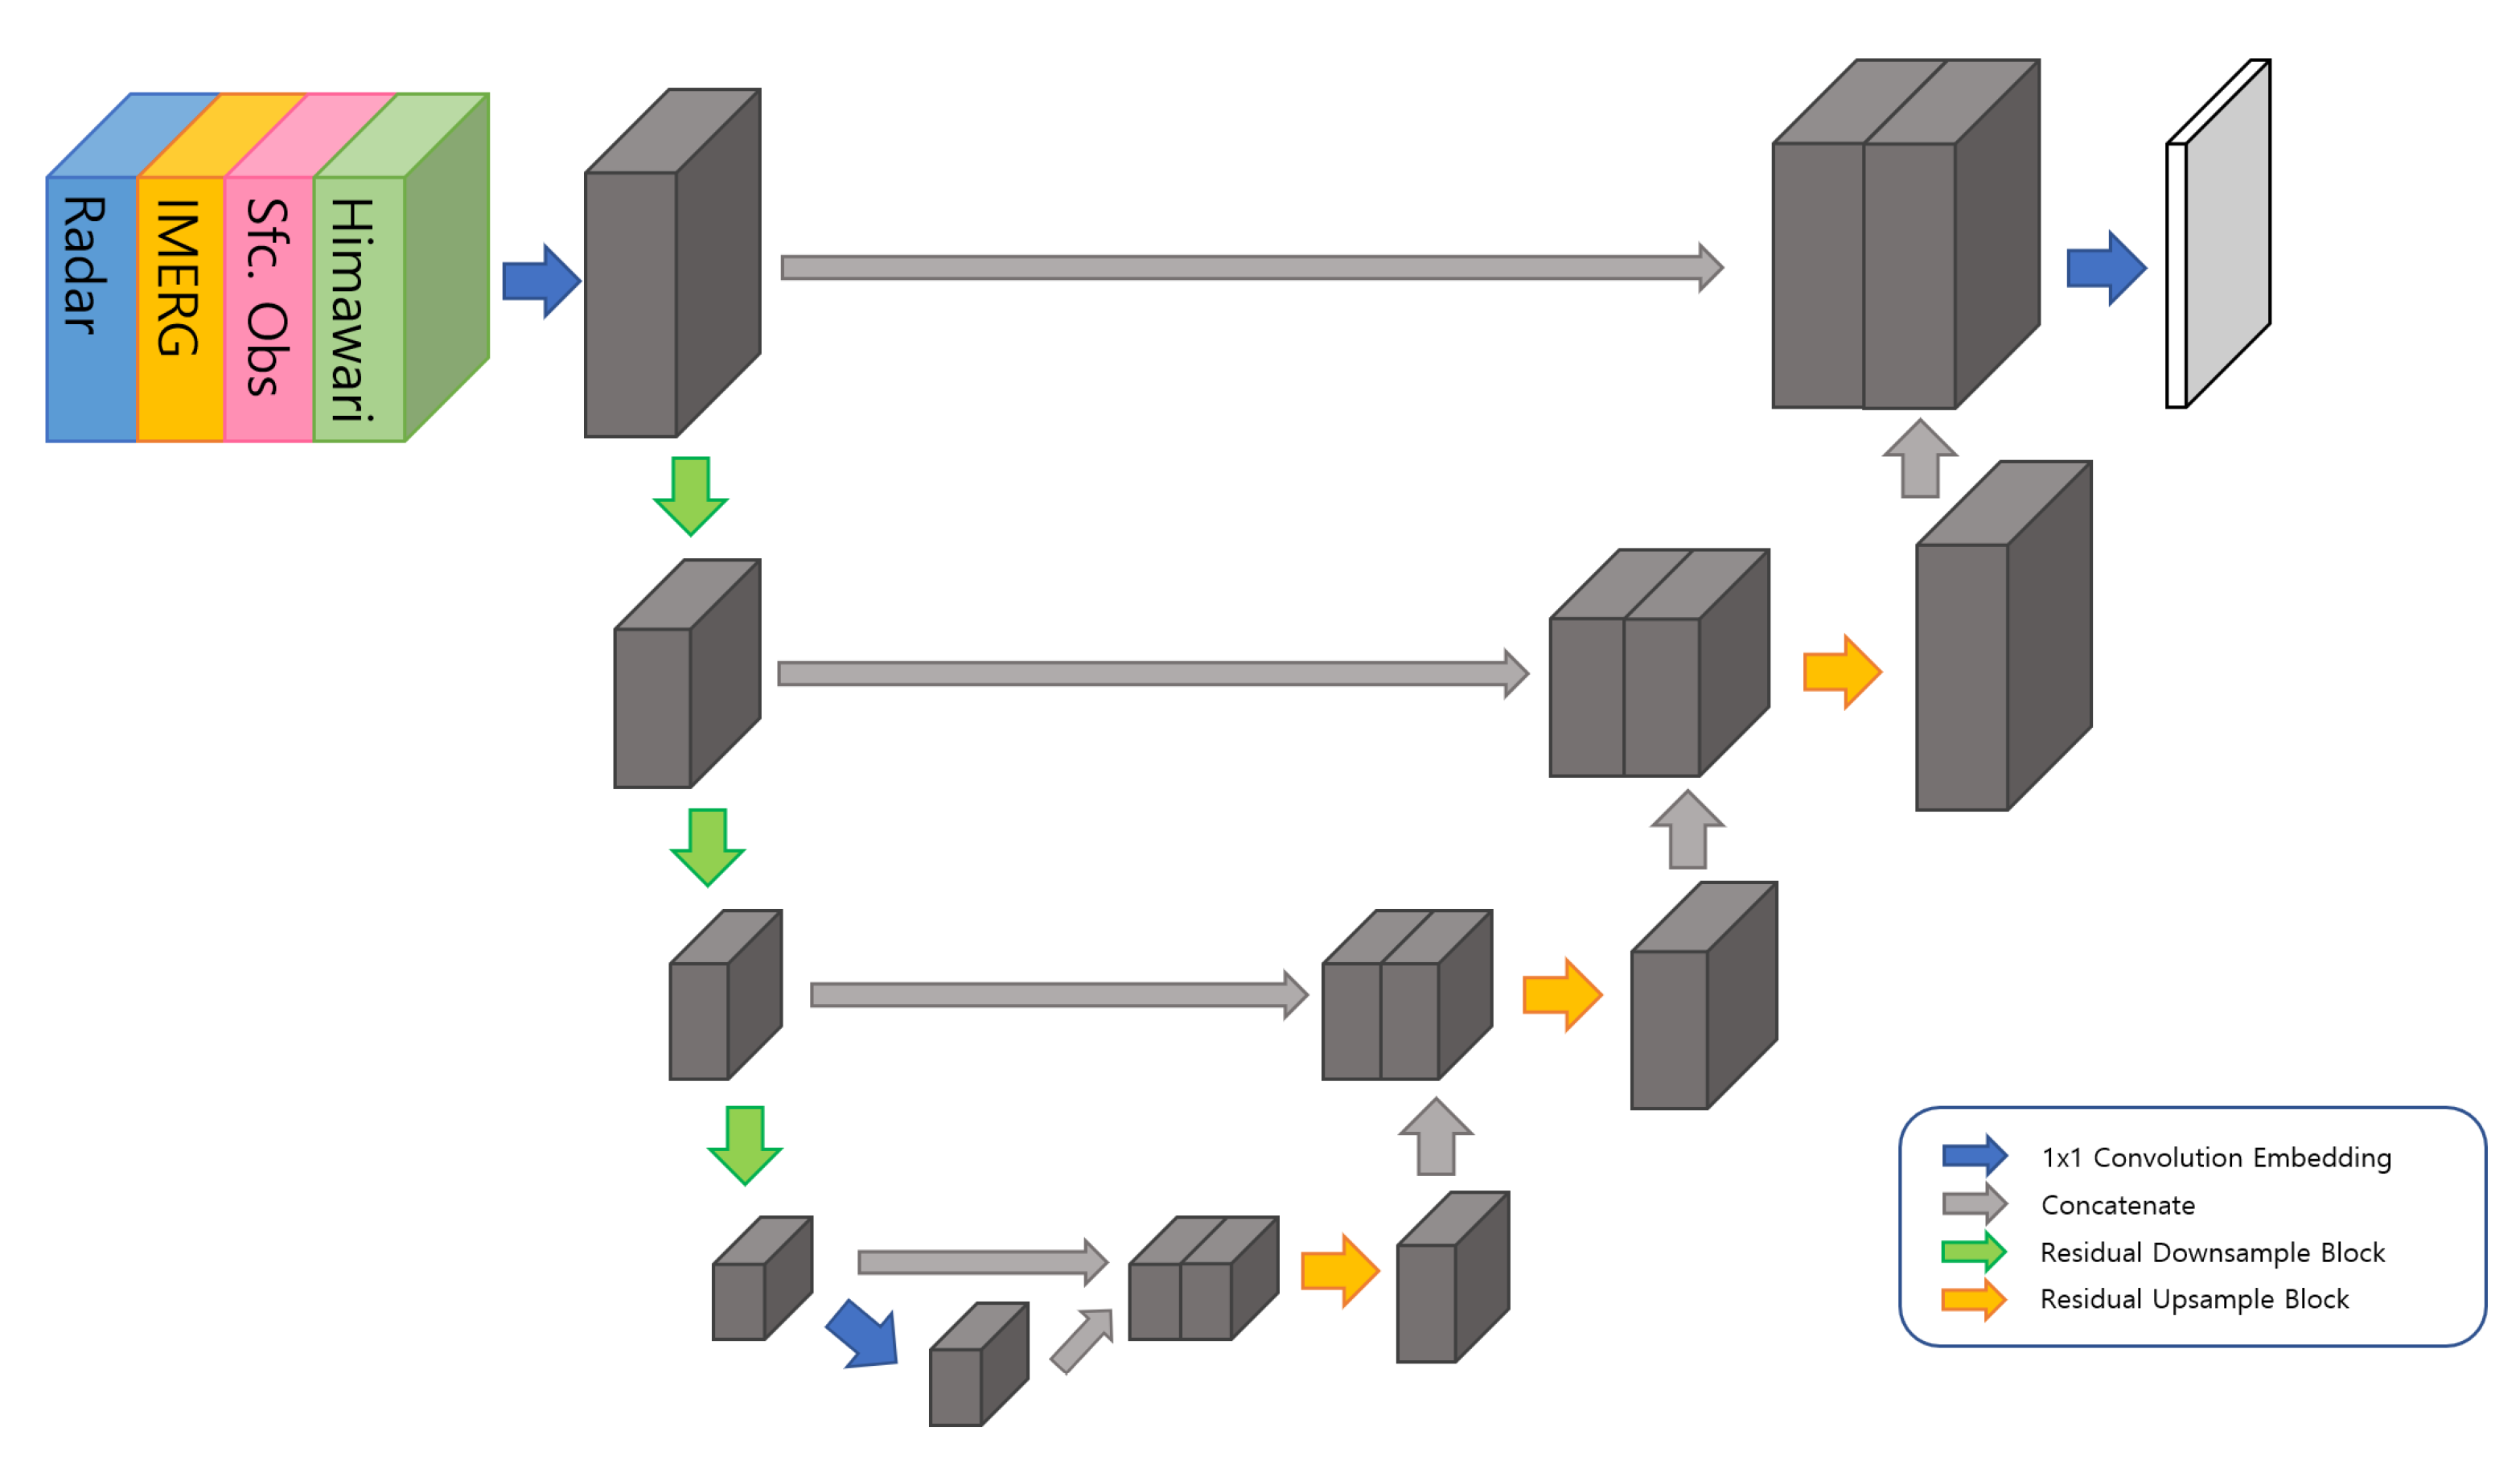
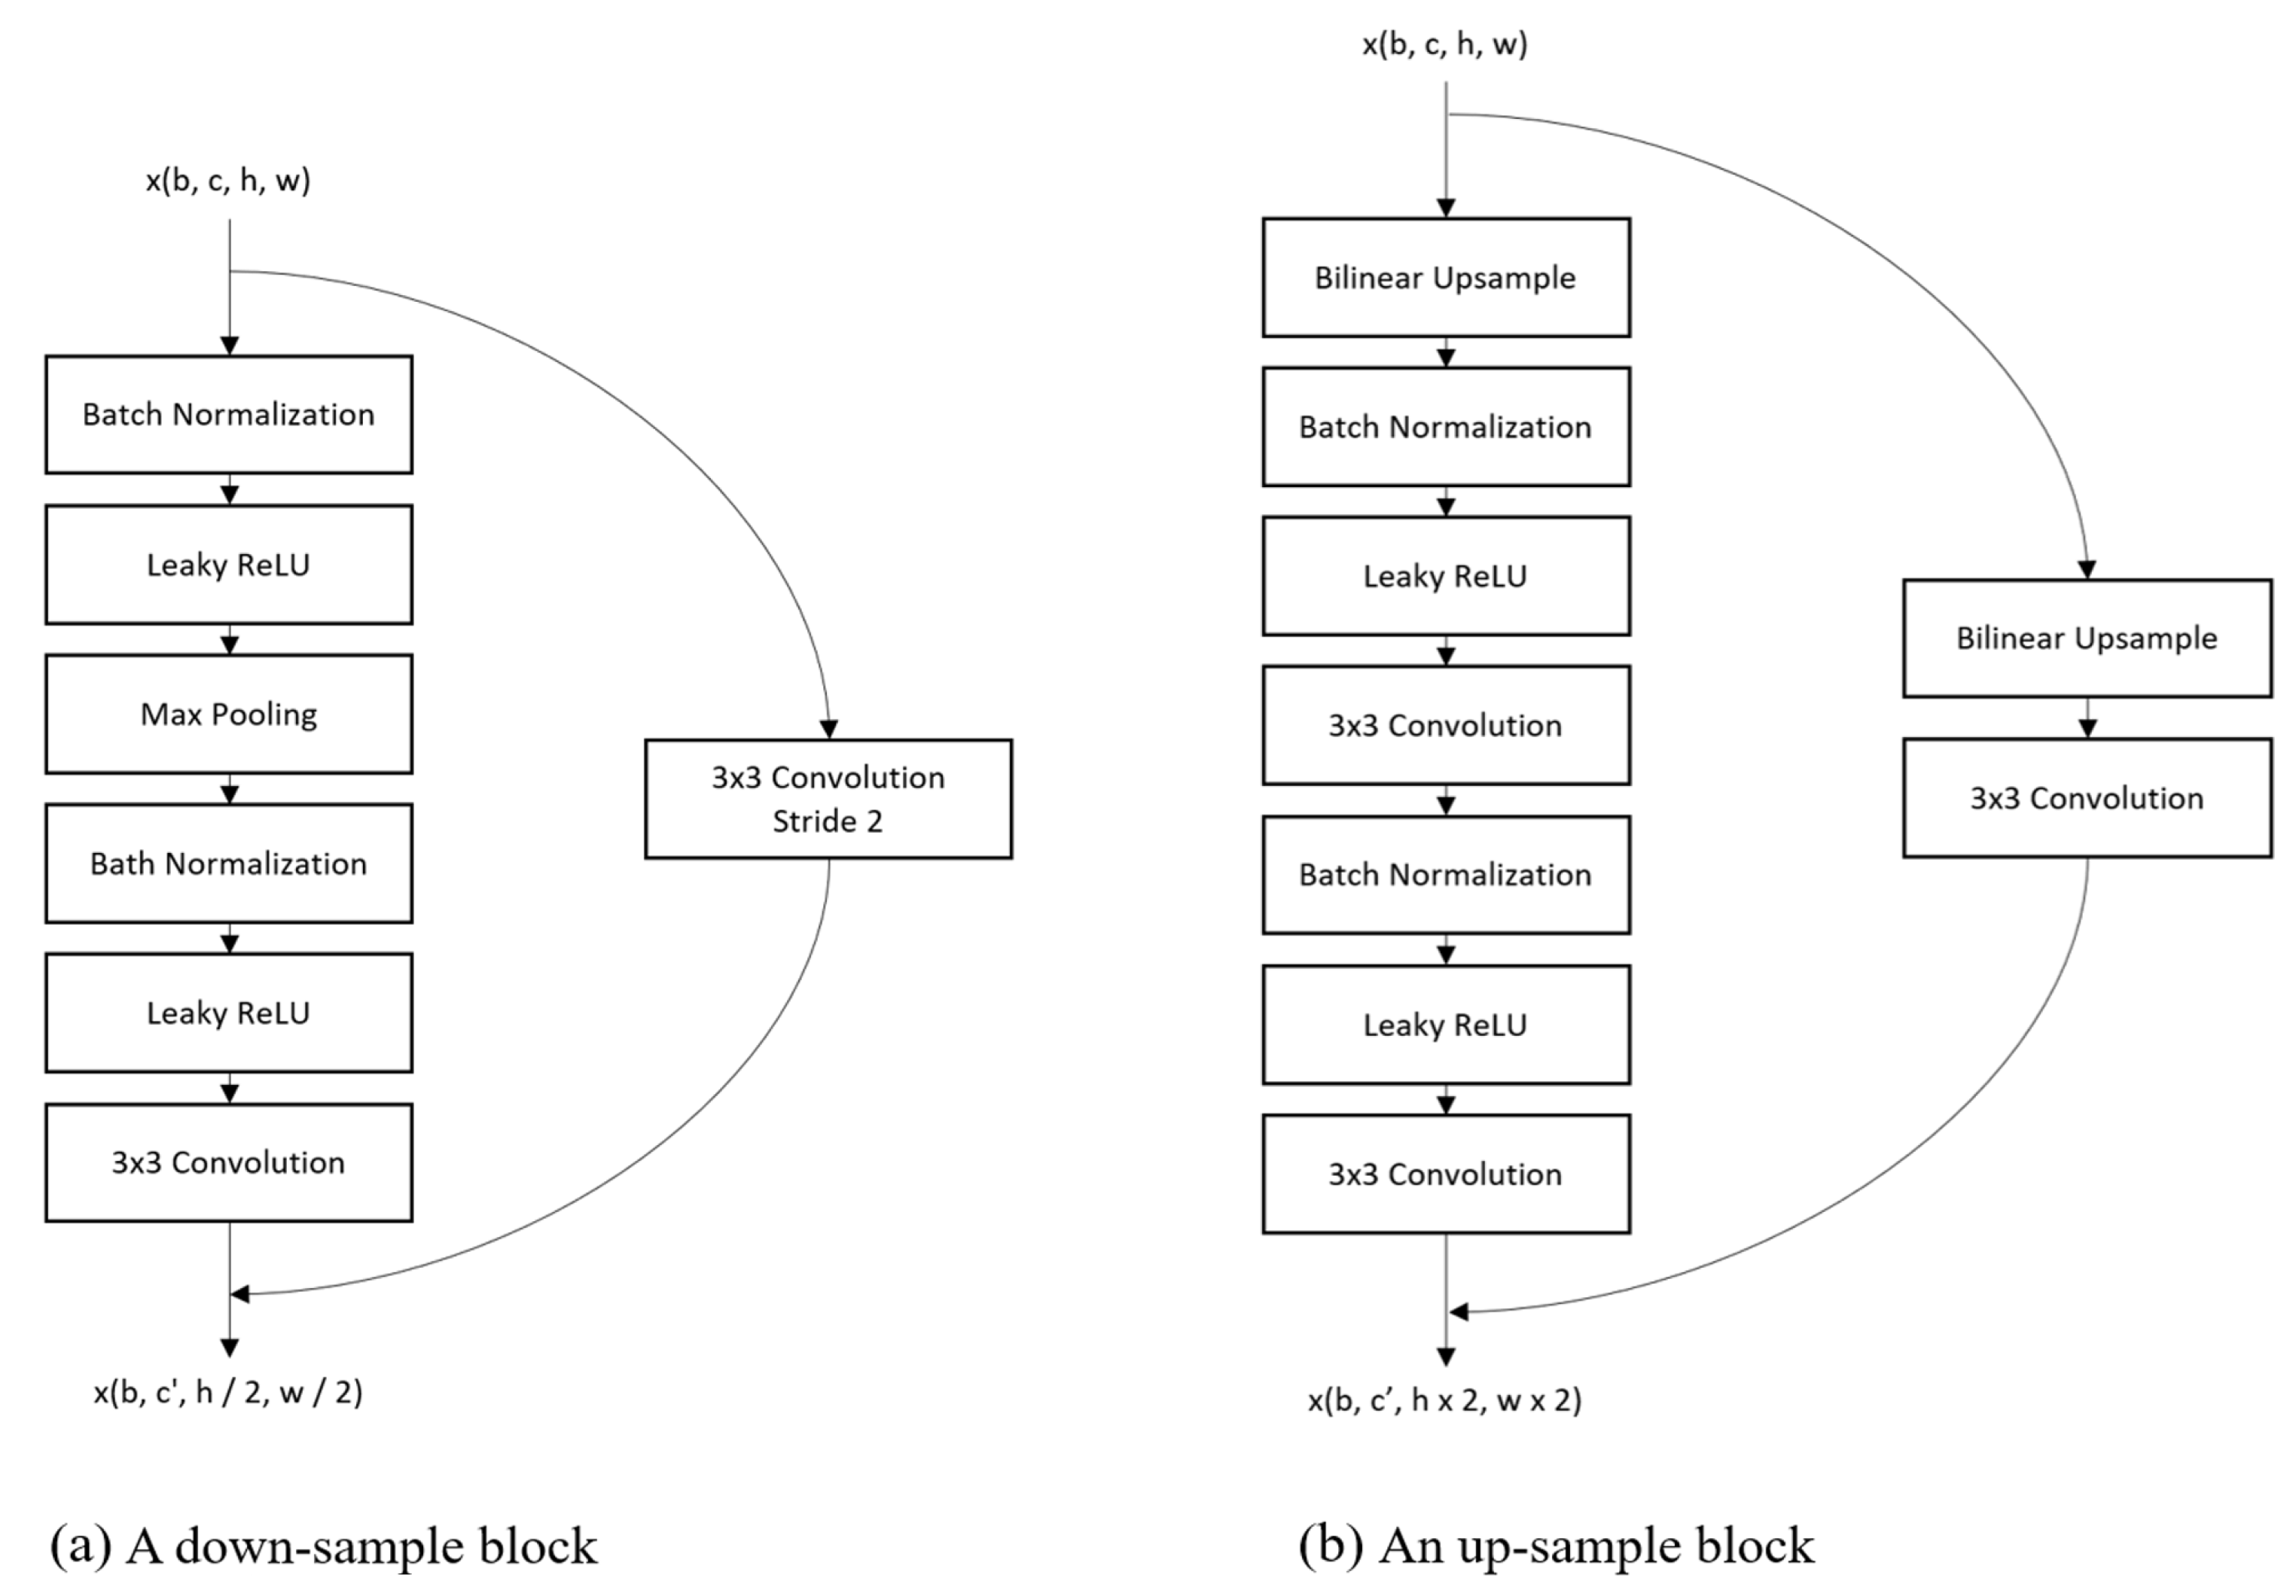
3.1. Model Architecture

The benchmark model for the RAIN-F+ dataset is developed based on the U-Net architecture with residual upsampling and downsampling blocks. The U-Net is firstly developed for a segmentation task for biomedical image [30] and is considered as an efficient deep learning model for precipitation nowcasting in many studies [9,11,19,31]. The proposed model architecture is in Figure 4, and the detailed structure of residual blocks is in Figure 5. The U-Net is a specific encoder-decoder network with a skip connection. The skip connection in the U-Net can handle the spatial information by concatenating the high-resolution information from the downsampling blocks with the low-resolution information from the upsampling blocks using an alternative path to maximize the information between layers. In addition, the residual blocks are applied to train the deeper network effectively and to avoid gradient banishing problem [32]. The model is developed using the open-source deep learning framework, PyTorch.

3.2. Construction of Training and Test Dataset

The integrated nine variable images from multiple sources were used as an input dataset. Since each variable has different spatial resolutions, we resized them into the same resolution with three different types: 256 × 256 (1.3 km), 64 × 64 (5.2 km), and 32 × 32 (10.4 km). The interpolation is conducted based on the nearest interpolation method, and the interpolated images for radar and Himawari-8 images are shown in Figure 6. The surface observations and IMERG have the lowest resolution; the pixel number is only changed after interpolation. The multisource sequential data of the past 3 h are used to predict precipitation for the next one hour. The input data for each variable contain three channels by stacking the time-sequential images. The ‘early fusion’ method is used for multi-modal data fusion, which is introduced in [13,33]. The early fusion method is a simple concatenated based method to extract multi-modal features for training and shows comparative performances. After the temporal image stacking, the nine variables with three channels are concatenated at the starting time of the training process. The output of the model is a single radar reflectivity map one hour later than the last input sequential image at the same resolution as the input data. Since the purpose of the prediction is to know the precipitation rate for the next one hour, we calculated the rain rate from radar reflectivity using the ZR relationship from Marshall–Palmer (MP) equation, expressed as follows:
Z = 200 R 1.6
where Z is radar reflectivity in linear units (mm6/m) and R is the rain rate in mm/h. This ZR relationship is typically used for the radar network over the Korean Peninsula [34]. For the comparisons, the ZR relationship for the convective rain ( Z = 300 R 1.4 ) is tested, and we confirmed that the trends of predicted scores do not show significant differences among the compositions of the dataset. This study does not propose to find the proper ZR relations. Thus, we decided to use the MP equation to calculate the rain rate for this study. The observed data from 2017 to 2018 year are used for the training process, and the data from the 2019 year are used for the validation process. In the training process, the data augmentation techniques are used to multiply the number of training data. Among the augmentation techniques, geometric transformation techniques such as horizontal flip, vertical flip, and combined horizontal and vertical flip are applied, and the pixel value is maintained to keep the physical meaning. The input values except the variables related to the rain rate are normalized within the range of 0 and 1. Since the rain rate distribution is significantly uneven and most rain rate values are concentrated in no-rain and light rain regions, which is close to zero, the rain rate is excluded for normalization.

3.3. Model Evaluation

The loss function for the training process used the SmoothL1Loss in the PyTorch library, which is less sensitive to outliers than mean squared error loss. The SmoothL1Loss can be observed as a combination of L1-Loss and L2-loss. It behaves as a L1-loss when the absolute difference between prediction (P) and true (T) values is high, while it behaves as L2-loss when the difference is close to zero. The equation is expressed as follows.
L o s s = 0.5 × ( P T ) 2 / β , i f | P T | < β | P T | 0.5 × β , o t h e r w i s e .
We used five metrics for model evaluation: mean absolute error (MAE), Pearson product-moment correlation coefficients ( R 2 ), precision, recall, and F1-score. The MAE and R 2 are used for performance evaluations in order to compare the predicted and reference rain rates from the perspective of the rain rate regression problem. The precision, recall, and F1-score are used for the evaluations by measuring a binary-classified result with three different rain rate thresholds, 0.1, 1.0, and 5.0 mm/h. The F1-score is expressed as following:
F 1 = ( 2 × p r e c i s i o n × r e c a l l ) / ( p r e c i s i o n + r e c a l l )
where precision is the ratio of relevant results, while recall is the ratio of correctly classified results among the predicted results. Since the precision-recall trade-off is a well-known problem, F1-score provides a single score considering both precision and recall.

4. Results and Discussion

We conducted eight experiments for three input resolutions to evaluate the fusion dataset depending on the types of fusion dataset for training. Because the weather observations for this study have different spatial resolutions, the effect of other spatial resolutions is examined for the prediction performance of training with the multi-modal information. The best models for each experiment are decided with the trained model with the lowest validation loss within 50 epochs. The evaluation results of each experiment are shown in Table 1, Table 2 and Table 3.
We also evaluated the prediction performance over time steps, and the F1-scores of predicted results are represented in Figure 7. This figure showed that the F1-scores are not significantly different for the prediction results after one or two hours, depending on the fused of the dataset. However, after three hours, the F1-scores with the RAIN-F+ dataset showed better performance among those with other fusion datasets for all input resolutions. This indicates that the multi-modal information could help to improve the prediction performance over time regardless of the resolution. Moreover, the results with an input resolution of 64 × 64 showed slightly better performance for F1-scores of rain rate over 5 mm/h and the prediction results after three hours.
For the comparisons depending on the rain rate thresholds, in Table 1, Table 2 and Table 3, the prediction results with the rain rate greater than 0.1 mm/h are not significantly different depending on the dataset for all input resolutions. However, the scores from the multi-modal dataset for the rain rate greater than 5.0 mm/h showed better performance compared to the results using only the radar dataset. In addition, the maximum scores from the fusion dataset, depending on the rain rate thresholds, have similar values regardless of resolution. It suggests that no trend explains which combination of a fusion dataset has a significant benefit. Therefore, the question of what to fuse is a matter when applying multi-modal information in the training process.
Moreover, we confirmed that the recall scores dropped notably, while precision scores slightly decreased as the greater threshold is used. This means that the false negative increased much more than the false positive. A false negative (positive) is the opposite error where the prediction incorrectly fails to indicate the presence (absence) of rainfall over the threshold. Thus, the rainfall regions in the prediction results are not correctly detected when the rain becomes heavier. This trend can also be found in Figure 8, which shows the three examples of predicted rain maps depending on the fusion dataset and the radar rain map calculated from observed radar reflectivity for three different resolutions. For the references, Figure 9 represents the rain maps from the RAIN-F+ dataset at the same precipitation case with Figure 8. It is confirmed that there are differences among reference rain maps because the resolution and characteristics are different. The Radar and IMERG observations are considered instantaneous measurements. However, the IMERG data are from the GPM mission with the low-Earth orbit satellites that travel and take approximately 90 min to circle the entire Earth in order to measure global precipitation, while radar measures the same region at every observation time. Therefore, the observation times over the same region from radar and the IMERG can be different. Moreover, the rain rate from surface observations is a cumulative value from the past one hour. Among these reference rain observations, this study trained the supervised model with the radar observation as ground truth because the radar observation provides the 2D rain map with the highest resolution. Figure 8 showed that the predicted rain map does not represent the accurate location of heavy rainfall shaded in red color and detailed features of the precipitation system. Compared with the radar observations, the heavy rainfall regions are predicted over the continuous area with blurred features. Blurring is a well-known problem in the image prediction task due to the average process in the loss function. In addition, the resolutions of surface observations, the IMERG, and Himawari products in the RAIN-F+ dataset are lower than radar observations. It may cause additional blurred features of prediction in this study. Among all experiments, the Radar and IMERG dataset results of the examples in Figure 8 showed the most similar patterns with radar observations for heavy rainfall regions.
For all input resolution types, the radar-only dataset shows underestimated prediction results, while the results from the multi-modal dataset show heavier rainfall over the comparative coverage of the area. This trend is also shown in the scatter plots for all validation dataset represented in Figure 10. The scatter plots from the radar-only dataset showed the limitation in predicting rain rate over 10 mm/h for all input resolution types. The scatter plots from the RAIN-F+ dataset are not much different for the various input resolution, while others are considerably varies depending on the resolution.

5. Discussion and Future Work

There are various types of weather observation dataset that provide different characteristics of the atmospheric state. This study is an attempt to use all available weather observation data for precipitation prediction. We generated the RAIN-F+ dataset, which is the fusion dataset from four different types of weather observation related to precipitation. We evaluated the performance of ablation studies with different combinations of a fusion dataset in order to explore the influence of the different modalities. The benchmark model is trained and validated with the radar reflectivity product as reference data because the radar observation provides the most accurate measurements for precipitation. The results showed that the RAIN-F+ dataset still has the limitation to predict rainfall for rain rate over 10 mm/h. It may be caused by the small number of rain rate pixels over 10 mm/h in the training dataset. However, with the multi-modality, there is the possibility to improve the performance comparing with the radar-only dataset, which shows significant underestimation for the rain rate over 10 mm/h. Since the RAIN-F+ dataset provides the atmospheric state variables, including temperature, humidity, wind from surface observations, and radiance with clouds and water vapor information from a geostationary satellite, multi-modal information from RAIN-F+ helps to improve the precipitation prediction performance over time. This result suggested that data fusion for multi-modality is essential for precipitation prediction when applying data-driven approaches. The primary purpose of this study is to introduce the RAIN-F+ dataset and the benchmark model for the fusion dataset. Therefore, we only used the early fusion method for simple approaches and validated the results with only radar observations. In the future, we aim to apply various fusion methods in order to evaluate the performance improvement depending on the combination of the fusion dataset and in order to validate the benchmark model with different precipitation products for the purpose of finding the proper reference data for precipitation. In addition, we will consider integrating the model parameters and the topography information for the next version of the RAIN-F dataset and examine the effect of each parameter for prediction performance depending on the various precipitation system categories.

Author Contributions

All the authors made significant contributions to the work. Y.C., M.B., H.C. and T.J. designed the research. Y.C. analyzed the results. In terms of methodology, K.C., Y.C. and K.C. performed the experiments. Y.C. wrote the paper. M.B., H.C. and K.C. provided suggestions for the preparation and revision of the paper. All authors have read and agreed to the published version of the manuscript.

Funding

This research received no external funding.

Institutional Review Board Statement

Not applicable.

Informed Consent Statement

Not applicable.

Data Availability Statement

The RAIN-F version1 is available on the KISTI DATAON website (https://dataon.kisti.re.kr/, accessed on 7 September 2021), and RAIN-F+ is available upon request from the corresponding author.

Acknowledgments

This study is supported by the National Supercomputing Center with supercomputing resources including technical support (KSC-2020-CRE-0276).

Conflicts of Interest

The authors declare no conflict of interest.

References

  1. Xingjian, S.; Chen, Z.; Wang, H.; Yeung, D.Y.; Wong, W.K.; Woo, W.C. Convolutional LSTM network: A machine learning approach for precipitation nowcasting. In Proceedings of the Advances in Neural Information Processing Systems, Montreal, QC, USA, 7–12 December 2015; pp. 802–810. [Google Scholar]
  2. Chandrasekar, R.; Balaji, C. Sensitivity of tropical cyclone Jal simulations to physics parameterizations. J. Earth Syst. Sci. 2012, 121, 923–946. [Google Scholar] [CrossRef] [Green Version]
  3. Pulkkinen, S.; Chandrasekar, V.; Harri, A.M. Nowcasting of precipitation in the high-resolution Dallas–Fort Worth (DFW) urban radar remote sensing network. IEEE J. Sel. Top. Appl. Earth Obs. Remote Sens. 2018, 11, 2773–2787. [Google Scholar] [CrossRef]
  4. Pulkkinen, S.; Chandrasekar, V.; Harri, A.M. Fully spectral method for radar-based precipitation nowcasting. IEEE J. Sel. Top. Appl. Earth Obs. Remote Sens. 2019, 12, 1369–1382. [Google Scholar] [CrossRef]
  5. Pulkkinen, S.; Chandrasekar, V.; Harri, A.M. Stochastic spectral method for radar-based probabilistic precipitation nowcasting. J. Atmos. Ocean. Technol. 2019, 36, 971–985. [Google Scholar] [CrossRef]
  6. Pulkkinen, S.; Chandrasekar, V.; von Lerber, A.; Harri, A.M. Nowcasting of convective rainfall using volumetric radar observations. IEEE Trans. Geosci. Remote Sens. 2020, 58, 7845–7859. [Google Scholar] [CrossRef]
  7. Radhakrishnan, C.; Chandrasekar, V. CASA Prediction System over Dallas–Fort Worth Urban Network: Blending of Nowcasting and High-Resolution Numerical Weather Prediction Model. J. Atmos. Ocean. Technol. 2020, 37, 211–228. [Google Scholar] [CrossRef]
  8. Sønderby, C.K.; Espeholt, L.; Heek, J.; Dehghani, M.; Oliver, A.; Salimans, T.; Agrawal, S.; Hickey, J.; Kalchbrenner, N. Metnet: A neural weather model for precipitation forecasting. arXiv 2020, arXiv:2003.12140. [Google Scholar]
  9. Trebing, K.; Staǹczyk, T.; Mehrkanoon, S. SmaAt-UNet: Precipitation nowcasting using a small attention-UNet architecture. Pattern Recognit. Lett. 2021, 145, 178–186. [Google Scholar] [CrossRef]
  10. Kumar, A.; Islam, T.; Sekimoto, Y.; Mattmann, C.; Wilson, B. Convcast: An embedded convolutional LSTM based architecture for precipitation nowcasting using satellite data. PLoS ONE 2020, 15, e0230114. [Google Scholar] [CrossRef]
  11. Ayzel, G.; Scheffer, T.; Heistermann, M. RainNet v1. 0: A convolutional neural network for radar-based precipitation nowcasting. Geosci. Model Dev. 2020, 13, 2631–2644. [Google Scholar] [CrossRef]
  12. de Witt, C.S.; Tong, C.; Zantedeschi, V.; De Martini, D.; Kalaitzis, A.; Chantry, M.; Watson-Parris, D.; Bilinski, P. RainBench: Towards Data-Driven Global Precipitation Forecasting from Satellite Imagery. In Proceedings of the AAAI Conference on Artificial Intelligence, Virtual Event, online, 2–9 February 2021; Volume 35, pp. 14902–14910. [Google Scholar]
  13. Hong, D.; Gao, L.; Yokoya, N.; Yao, J.; Chanussot, J.; Du, Q.; Zhang, B. More diverse means better: Multimodal deep learning meets remote-sensing imagery classification. IEEE Trans. Geosci. Remote Sens. 2020, 59, 4340–4354. [Google Scholar] [CrossRef]
  14. Baltrušaitis, T.; Ahuja, C.; Morency, L.P. Multimodal machine learning: A survey and taxonomy. IEEE Trans. Pattern Anal. Mach. Intell. 2018, 41, 423–443. [Google Scholar] [CrossRef] [PubMed] [Green Version]
  15. Zhang, Q.; Yang, L.T.; Chen, Z.; Li, P. A survey on deep learning for big data. Inf. Fusion 2018, 42, 146–157. [Google Scholar] [CrossRef]
  16. Chu, X.; He, J.; Song, H.; Qi, Y.; Sun, Y.; Bai, W.; Li, W.; Wu, Q. Multimodal Deep Learning for Heterogeneous GNSS-R Data Fusion and Ocean Wind Speed Retrieval. IEEE J. Sel. Top. Appl. Earth Obs. Remote Sens. 2020, 13, 5971–5981. [Google Scholar] [CrossRef]
  17. Zhou, K.; Zheng, Y.; Dong, W.; Wang, T. A deep learning network for cloud-to-ground lightning nowcasting with multisource data. J. Atmos. Ocean. Technol. 2020, 37, 927–942. [Google Scholar] [CrossRef]
  18. Miao, K.; Wang, W.; Hu, R.; Zhang, L.; Zhang, Y.; Wang, X.; Nian, F. Multimodal Semisupervised Deep Graph Learning for Automatic Precipitation Nowcasting. Math. Probl. Eng. 2020, 2020. [Google Scholar] [CrossRef]
  19. Li, G.; Choi, Y. HPC cluster-based user-defined data integration platform for deep learning in geoscience applications. Comput. Geosci. 2021, 104868. [Google Scholar] [CrossRef]
  20. Kwon, S.; Jung, S.H.; Lee, G. Inter-comparison of radar rainfall rate using constant altitude plan position indicator and hybrid surface rainfall maps. J. Hydrol. 2015, 531, 234–247. [Google Scholar] [CrossRef]
  21. Huffman, G.J.; Bolvin, D.T.; Braithwaite, D.; Hsu, K.; Joyce, R.; Xie, P.; Yoo, S.H. NASA global precipitation measurement (GPM) integrated multi-satellite retrievals for GPM (IMERG). Algorithm Theor. Basis Doc. Version 2015, 4, 26. [Google Scholar]
  22. Balaji, C.; Krishnamoorthy, C.; Chandrasekar, R. On the possibility of retrieving near-surface rain rate from the microwave sounder SAPHIR of the Megha-Tropiques mission. Curr. Sci. 2014, 587–593. [Google Scholar]
  23. Ramanujam, S.; Chandrasekar, R.; Chakravarthy, B. A new PCA-ANN algorithm for retrieval of rainfall structure in a precipitating atmosphere. Int. J. Numer. Methods Heat Fluid Flow 2011. [Google Scholar] [CrossRef]
  24. Kummerow, C.D.; Randel, D.L.; Kulie, M.; Wang, N.Y.; Ferraro, R.; Joseph Munchak, S.; Petkovic, V. The evolution of the Goddard profiling algorithm to a fully parametric scheme. J. Atmos. Ocean. Technol. 2015, 32, 2265–2280. [Google Scholar] [CrossRef]
  25. Choi, Y.; Shin, D.B.; Kim, J.; Joh, M. Passive Microwave Precipitation Retrieval Algorithm with A Priori Databases of Various Cloud Microphysics Schemes: Tropical Cyclone Applications. IEEE Trans. Geosci. Remote Sens. 2019, 58, 2366–2382. [Google Scholar] [CrossRef]
  26. Takenaka, H.; Sakashita, T.; Higuchi, A.; Nakajima, T. Geolocation correction for geostationary satellite observations by a phase-only correlation method using a visible channel. Remote Sens. 2020, 12, 2472. [Google Scholar] [CrossRef]
  27. Yamamoto, Y.; Ichii, K.; Higuchi, A.; Takenaka, H. Geolocation accuracy assessment of Himawari-8/AHI imagery for application to terrestrial monitoring. Remote Sens. 2020, 12, 1372. [Google Scholar] [CrossRef]
  28. Choi, Y.; Cha, K.; Back, M.; Choi, H.; Jeon, T. RAIN-F: A fusion dataset for rainfall prediction using convolutional neural network. In Proceedings of the IGARSS 2021—2021 IEEE International Geoscience and Remote Sensing Symposium, Brussels, Belgium, 11–16 July 2021. [Google Scholar]
  29. Choi, Y. RAIN-F: Radar-AWS-IMERG Network Fusion Dataset for Precipitation Nowcasting. 2021. Available online: https://dataon.kisti.re.kr/search/view.do?mode=view&svcId=3a75ba8975fcc74572ced9ed5d58a7d1 (accessed on 7 September 2021). [CrossRef]
  30. Ronneberger, O.; Fischer, P.; Brox, T. U-net: Convolutional networks for biomedical image segmentation. In Proceedings of the International Conference on Medical Image Computing and Computer-Assisted Intervention, Munich, Germany, 5–9 October 2015; pp. 234–241. [Google Scholar]
  31. Lebedev, V.; Ivashkin, V.; Rudenko, I.; Ganshin, A.; Molchanov, A.; Ovcharenko, S.; Grokhovetskiy, R.; Bushmarinov, I.; Solomentsev, D. Precipitation nowcasting with satellite imagery. In Proceedings of the 25th ACM SIGKDD International Conference on Knowledge Discovery & Data Mining, Anchorage, AK, USA, 4–8 August 2019; pp. 2680–2688. [Google Scholar]
  32. He, K.; Zhang, X.; Ren, S.; Sun, J. Deep residual learning for image recognition. In Proceedings of the IEEE Conference on Computer Vision and Pattern Recognition, Las Vegas, NV, USA, 27–30 June 2016; pp. 770–778. [Google Scholar]
  33. Audebert, N.; Le Saux, B.; Lefèvre, S. Beyond RGB: Very high resolution urban remote sensing with multimodal deep networks. ISPRS J. Photogramm. Remote Sens. 2018, 140, 20–32. [Google Scholar] [CrossRef] [Green Version]
  34. Yoo, C.; Yoon, J.; Kim, J.; Ro, Y. Evaluation of the gap filler radar as an implementation of the 1.5 km CAPPI data in Korea. Meteorol. Appl. 2016, 23, 76–88. [Google Scholar] [CrossRef] [Green Version]
Figure 1. The observation station location and dataset coverage for (a) KMA radar network, (b) surface observations stations, and (c) the RAIN-F+ dataset.
Remotesensing 13 03627 g001
Figure 2. The number of pixels for each rain rate from IMERG, radar, and surface observations in RAIN-F+ dataset.
Remotesensing 13 03627 g002
Figure 3. The RAIN-F+ dataset examples of nine variables at 12 UTC on 30 August 2018.
Remotesensing 13 03627 g003
Figure 4. The RAIN-F+ benchmark model architecture.
Remotesensing 13 03627 g004
Figure 5. The detailed description of (a) an downsampling block and (b) a upsampling block.
Remotesensing 13 03627 g005
Figure 6. The input images at different resolutions for the radar and Himawari-8 data.
Remotesensing 13 03627 g006
Figure 7. The F1-scores with the rain rate threshold of 0.1 mm/h depending on the fused dataset and the input resolution for the prediction time (R: Radar; I: IMERG; S: Surface observations; H: Himawari).
Remotesensing 13 03627 g007
Figure 8. The examples on 01 UTC 27 July 2019 of prediction results with RAIN-F+ dataset, radar and IMERG fusion dataset, radar only dataset, and reference radar observations depending on the resolution of 32 × 32 (upper row), 64 × 64 (middle row), and 256 × 256 (bottom row).
Remotesensing 13 03627 g008
Figure 9. The reference rain maps on 01 UTC 27 July 2019 of radar, IMERG, and surface observations from RAIN-F+ dataset.
Remotesensing 13 03627 g009
Figure 10. The scatter plots of prediction results depending on the fused data sources and the input resolution of 32 × 32 (upper row), 64 × 64 (middle row), and 256 × 256 (bottom row).
Remotesensing 13 03627 g010
Table 1. Evaluation results for precipitation prediction in next one hour with the resolution of 256 × 256 .
Data SetGreater than 0.1Greater than 1.0Greater than 5.0
MAE ↓ R 2 PrecisionRecall ↑F1-Score ↑Precision ↑Recall ↑F1-Score ↑Precision ↑Recall ↑F1-Score ↑
Ra0.9220.6160.6690.7410.7030.7350.4830.5830.6900.0240.047
Ra+Im0.9070.6270.6600.7420.6990.7090.5340.6090.5380.1310.211
Ra+Sf0.9300.6170.6490.7570.6990.7470.4680.5760.6870.0110.021
Ra+Hi0.9070.6220.6650.7460.7030.7330.5020.5960.7010.0540.100
Ra+Im+Sf0.9110.6220.6400.7680.6980.7600.4760.5860.6310.0590.108
Ra+Im+Hi0.9200.6240.6800.7320.7050.7770.4490.5690.6100.0530.098
Ra+Sf+hi0.9310.6170.6560.7520.7000.7490.4710.5780.6540.0120.023
RAIN-F+0.9140.6210.6470.7620.7000.7630.4770.5870.6270.0350.066
Table 2. Evaluation results for precipitation prediction in next one hour with the resolution of 64 × 64 .
Data SetGreater than 0.1Greater than 1.0Greater than 5.0
MAE ↓ R 2 PrecisionRecall ↑F1-Score ↑Precision ↑Recall ↑F1-Score ↑Precision ↑Recall ↑F1-Score ↑
Ra0.9100.6290.6750.7370.7040.7490.4850.5890.6640.0450.085
Ra+Im0.9180.6240.6340.7660.6940.8100.4080.5420.6580.0250.048
Ra+Sf0.9180.6240.6600.7480.7010.7530.4800.5870.6800.0310.060
Ra+Hi0.9090.6200.6670.7430.7030.7340.5020.5960.6840.0310.060
Ra+Im+Sf0.9100.6240.6450.7600.6970.7400.5000.5970.5020.1160.189
Ra+Im+Hi0.9050.6190.6520.7530.6990.7880.4240.5520.5680.0550.100
Ra+Sf+hi0.9310.6150.6590.7500.7020.7110.5350.6100.6580.0360.068
RAIN-F+0.9060.6230.6540.7490.6980.7220.5230.6070.5230.1410.222
Table 3. Evaluation results for precipitation prediction in next one hour with the resolution of 32 × 32 .
Data SetGreater than 0.1Greater than 1.0Greater than 5.0
MAE ↓ R 2 PrecisionRecall ↑F1-Score ↑Precision ↑Recall ↑F1-Score ↑Precision ↑Recall ↑F1-Score ↑
Ra0.9150.6240.6590.7420.6980.7500.4830.5880.6440.0370.070
Ra+Im0.9050.6200.6600.7450.7000.7500.5020.6020.6610.0410.077
Ra+Sf0.9040.6220.6640.7370.6990.7030.5390.6100.5900.1080.183
Ra+Hi0.9280.6180.6650.7370.7000.7620.4750.5850.6400.0030.006
Ra+Im+Sf0.9070.6230.6620.7430.7000.7410.5040.6000.6580.0610.111
Ra+Im+Hi0.9100.6300.6880.7210.7040.7370.5180.6080.3250.0180.035
Ra+Sf+hi0.9190.6200.6780.7270.7020.7530.4850.5900.6460.0310.059
RAIN-F+0.9080.6300.6550.7460.6980.7730.4760.5890.5710.0830.145
Publisher’s Note: MDPI stays neutral with regard to jurisdictional claims in published maps and institutional affiliations.

