
Learning Rotated Inscribed Ellipse for Oriented Object Detection in Remote Sensing Images


Abstract
:1. Introduction
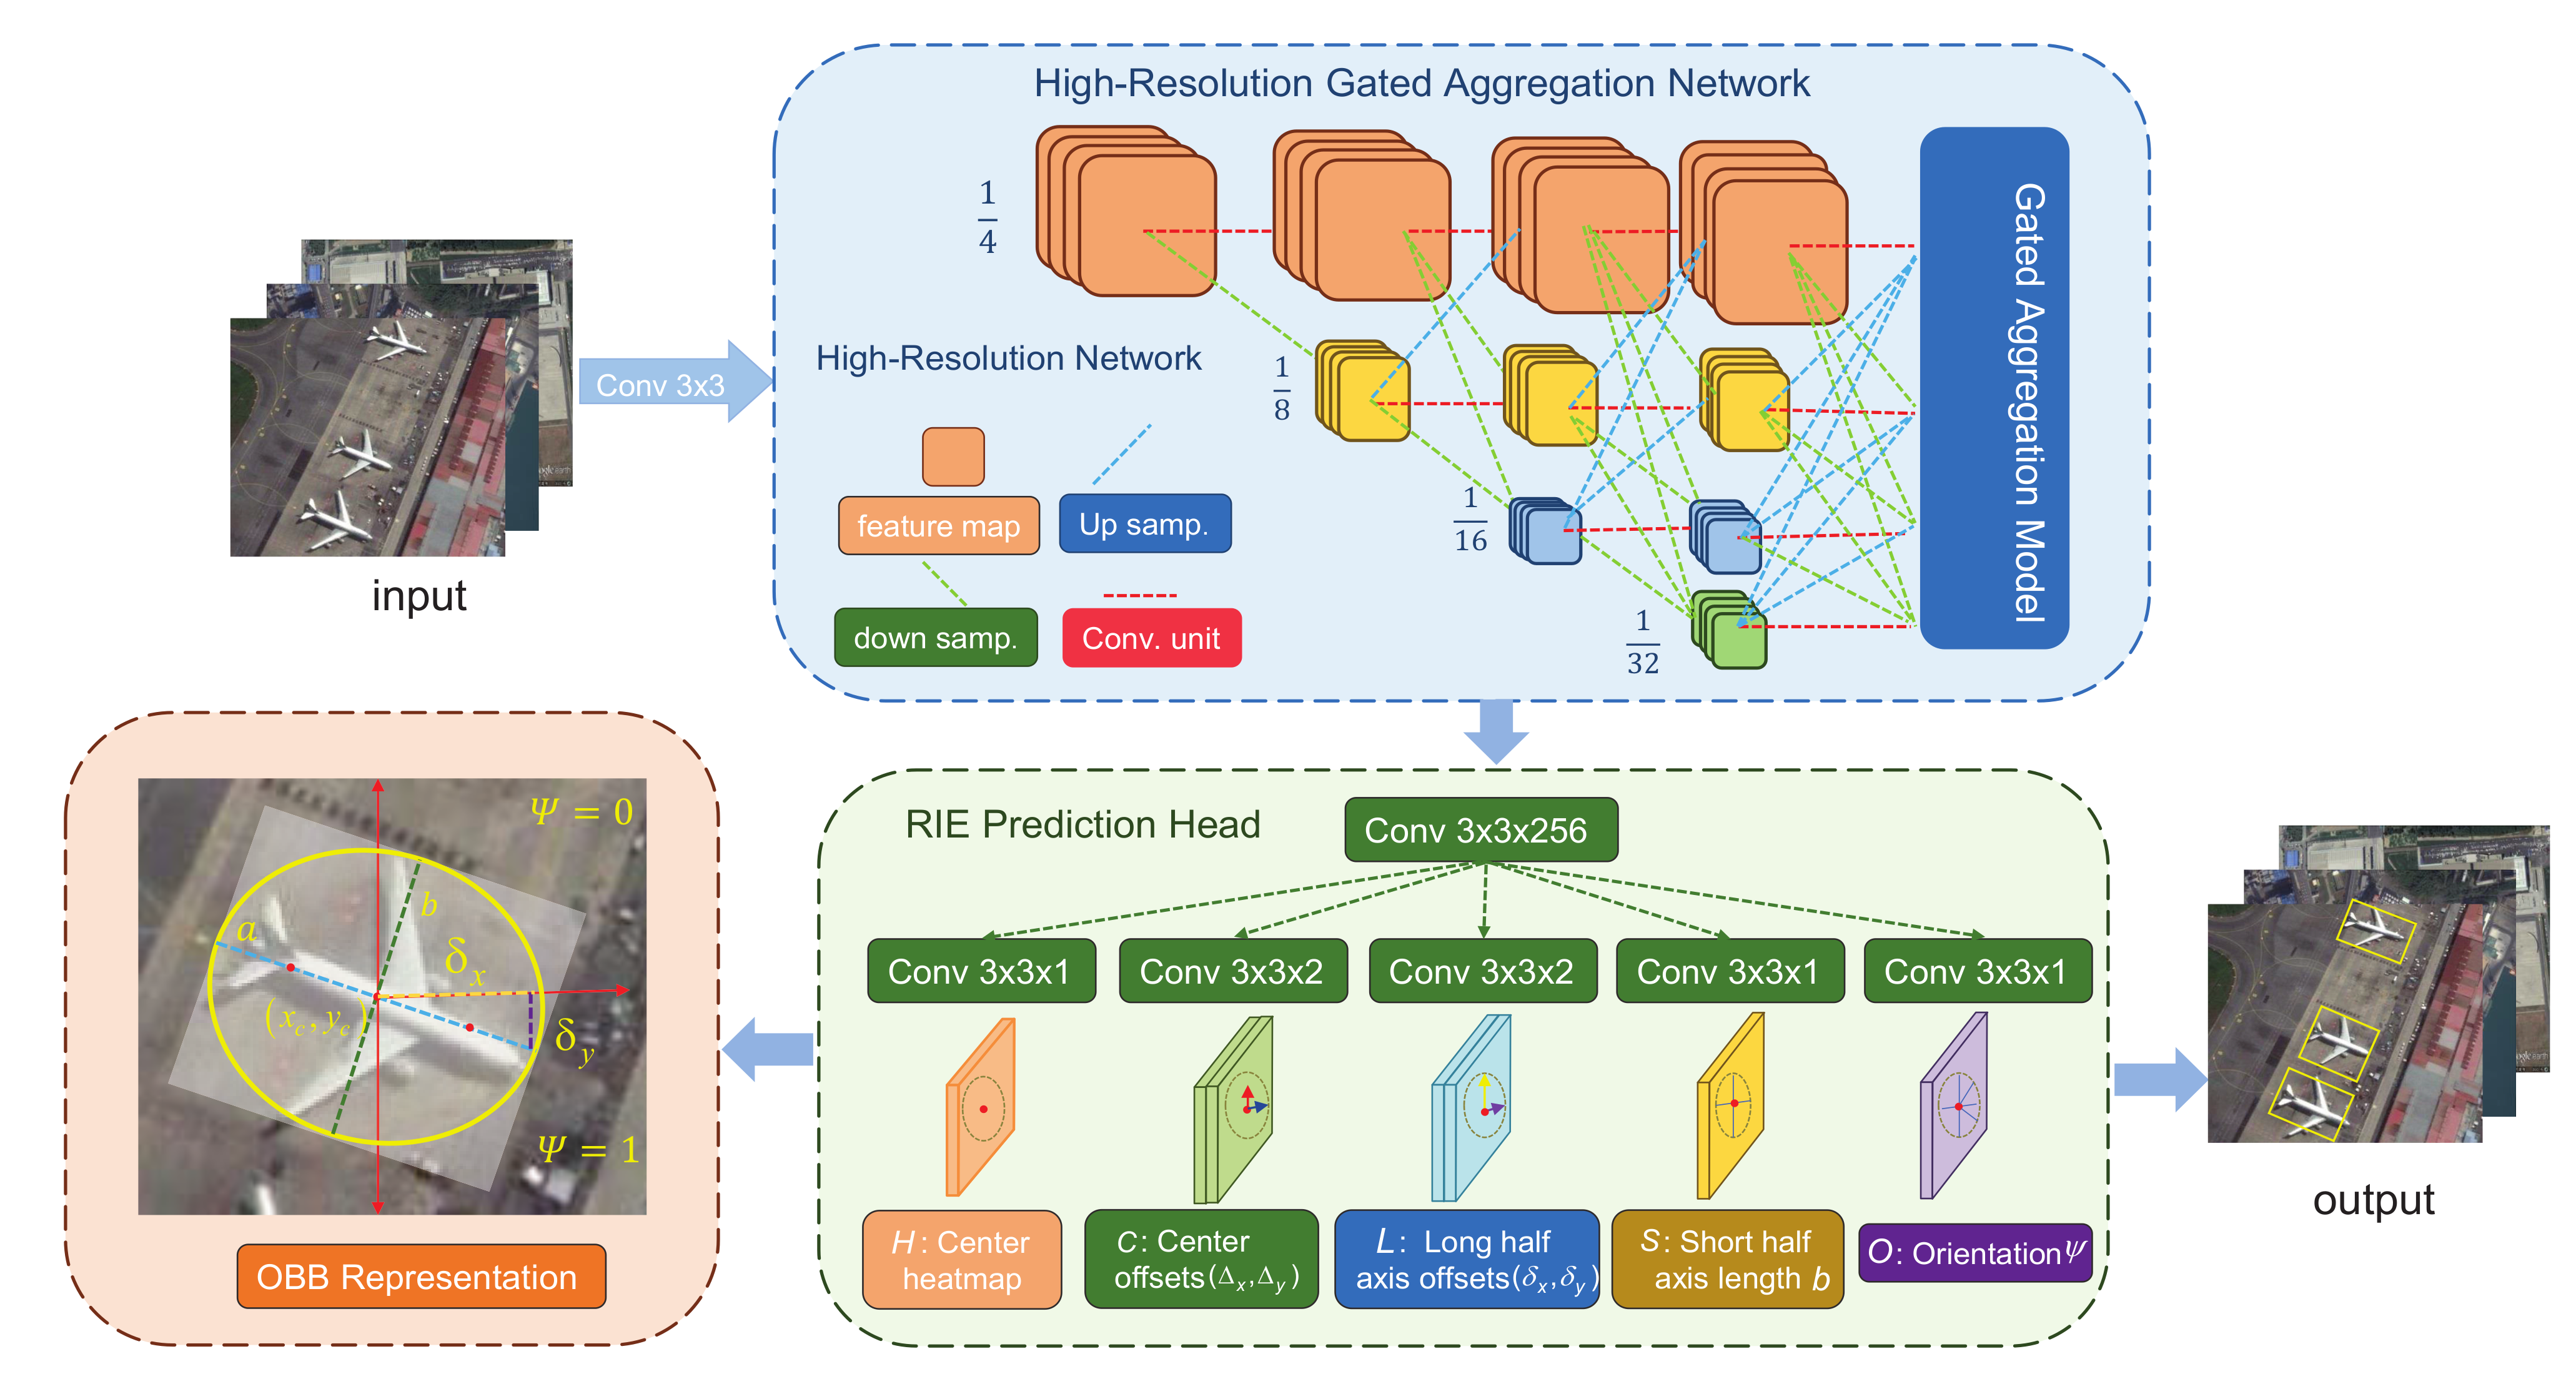
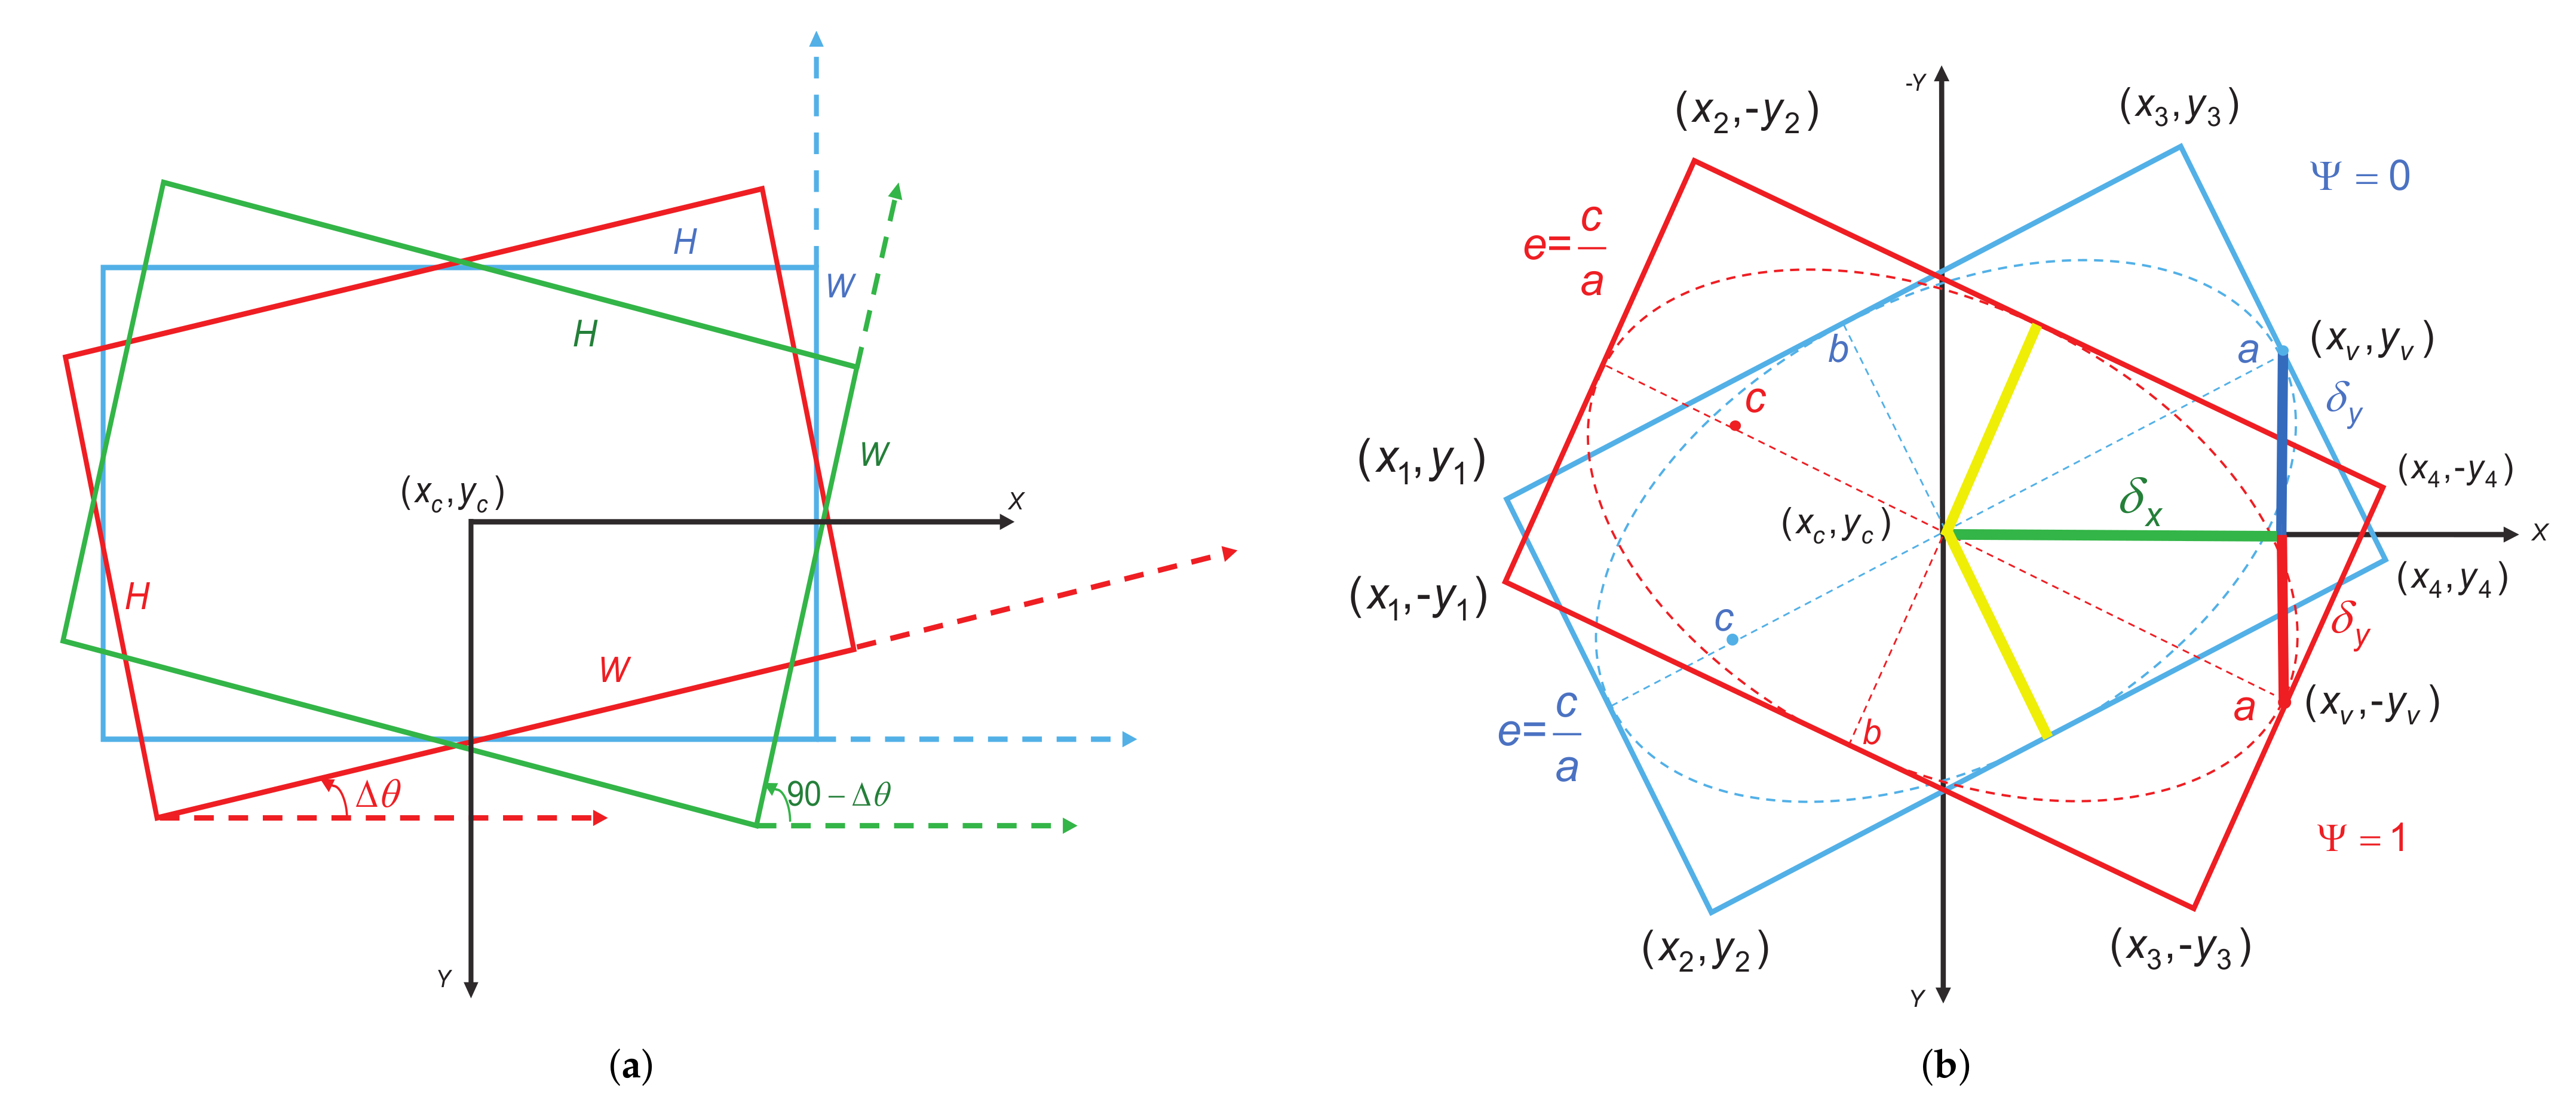
- We introduce a novel center-based OBB representation method called the rotated inscribed ellipse (RIE). As an angle-free OBB definition, the RIE effectively eliminates the angle periodicity and address the boundary case issues;
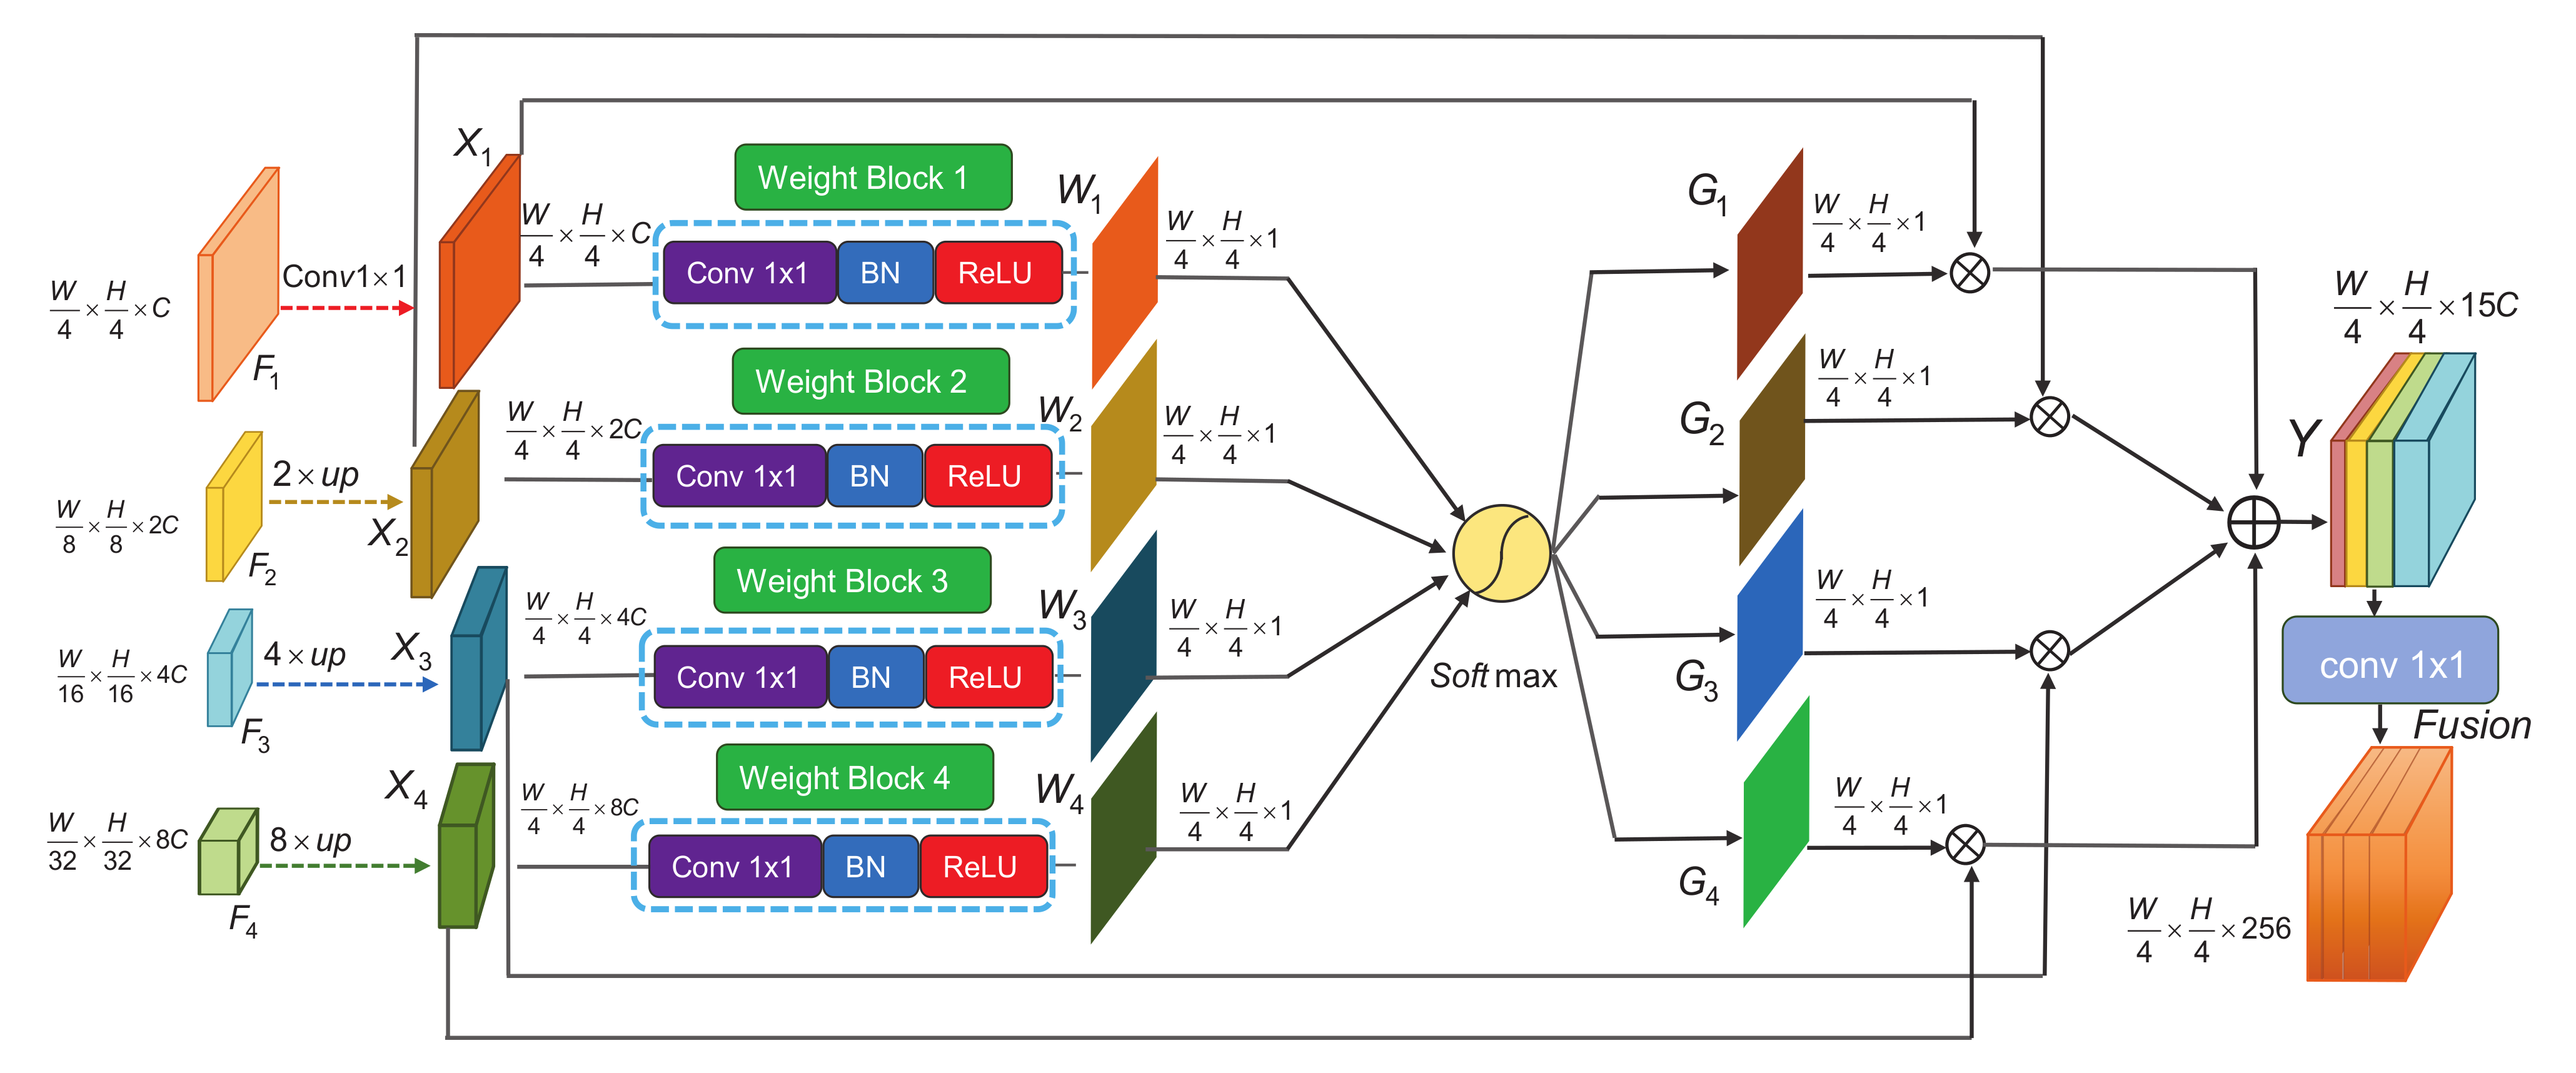
- We design a high-resolution gated aggregation network to capture the objects of interest from complicated backgrounds and integrate different scale features by implementing multi-scale parallel interactions and gated aggregation fusion;
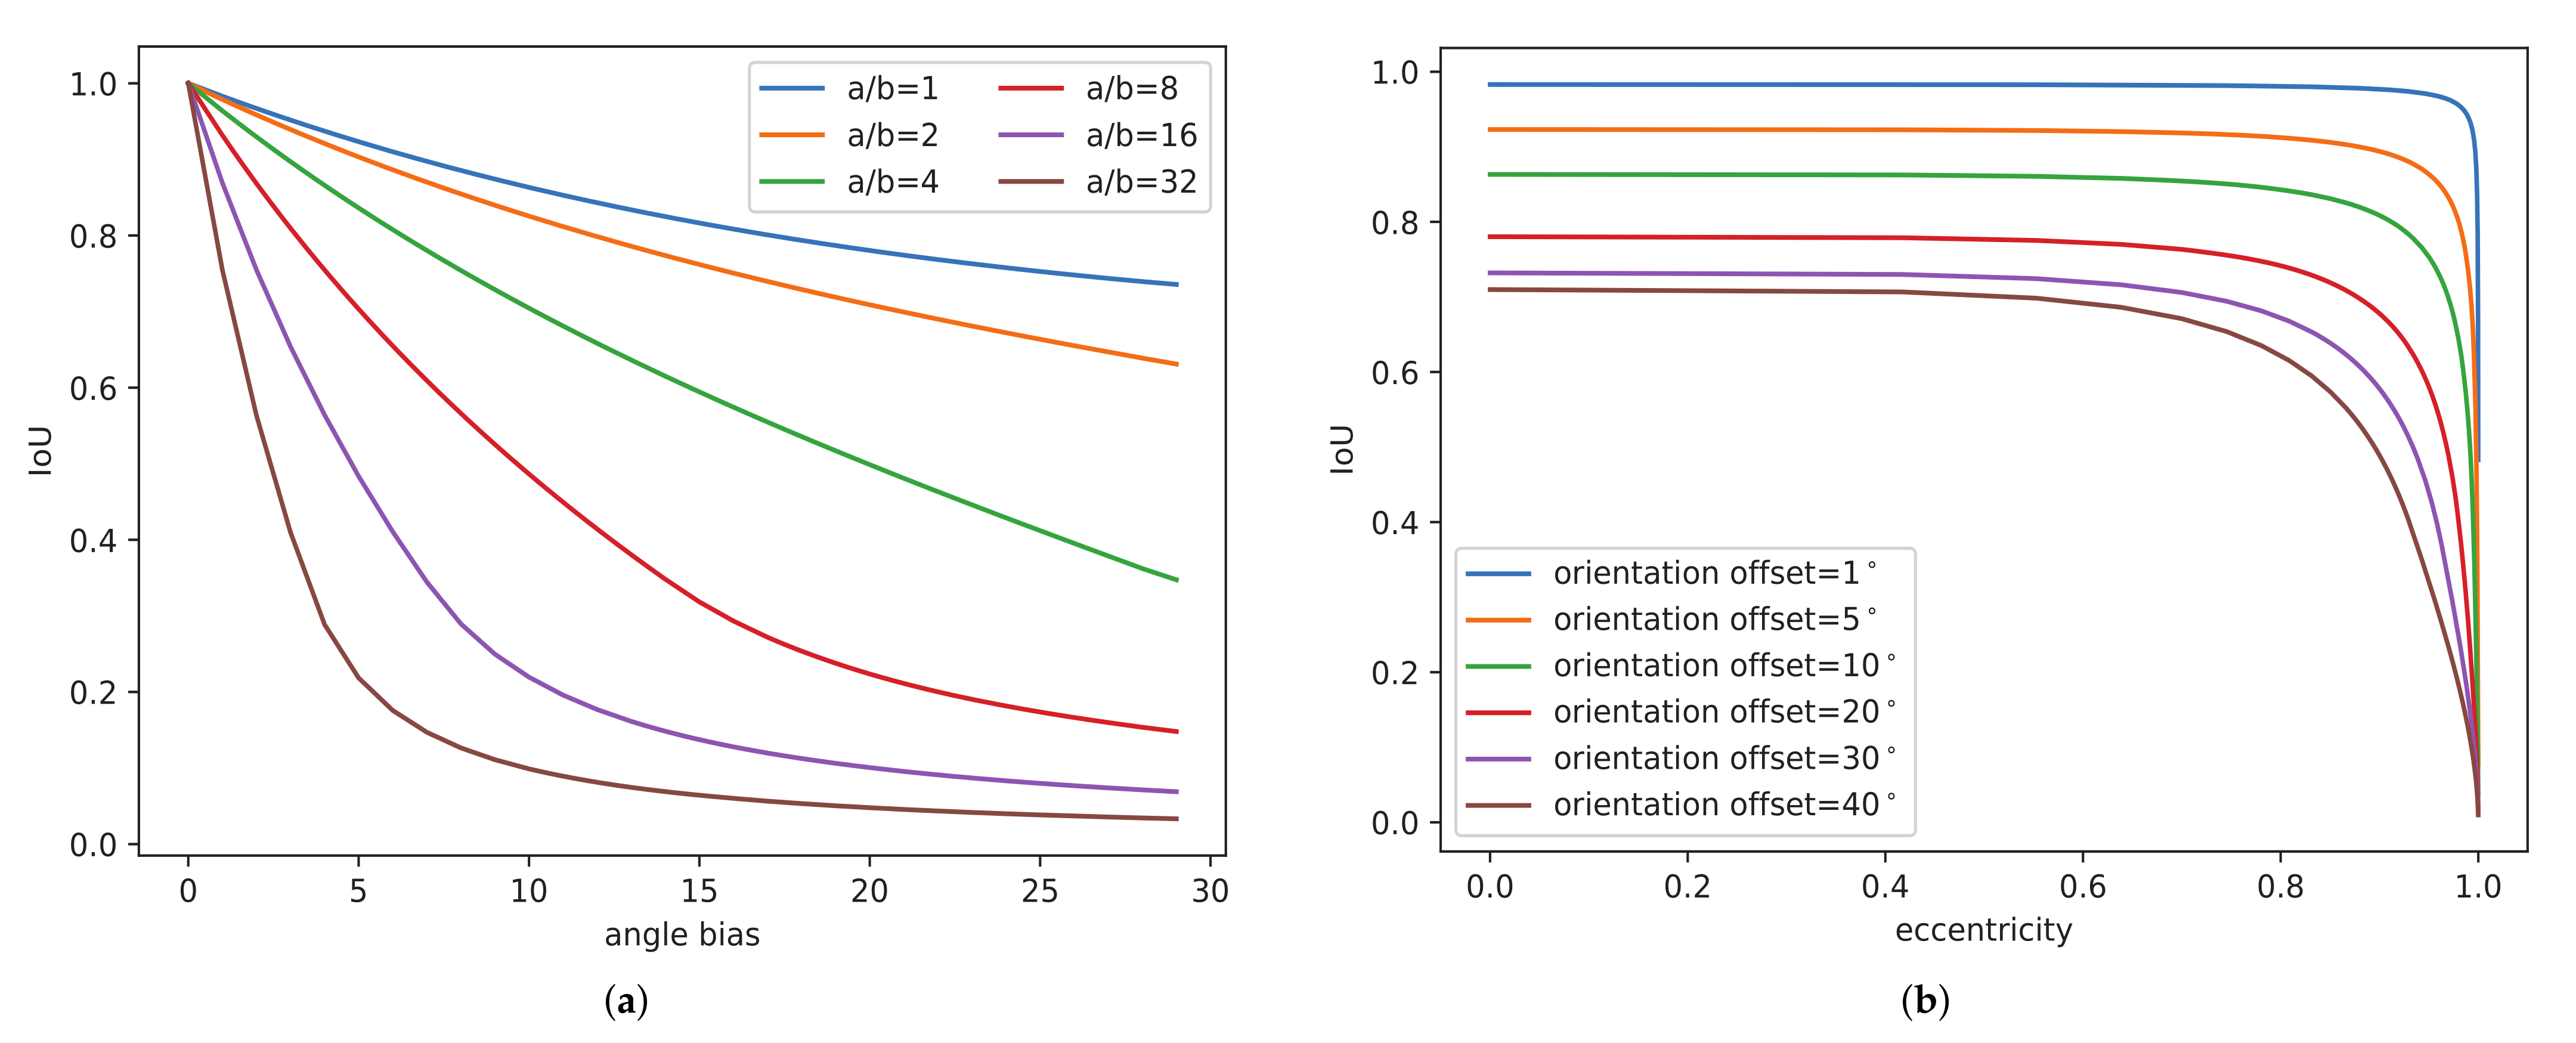
- We propose an eccentricity-wise orientation loss function to fix the sensitivity of the eccentricity of the ellipse to the orientation error and effectively improve the accuracy of the detection of slender oriented objects with large aspect ratios;
- We perform extensive experiments to verify the advanced performance compared with state-of-the-art oriented object detectors on remote sensing datasets.
2. Related Works
2.1. Oriented Object Detection in RSIs
2.2. Anchor-Free Object Detection in RSIs
3. Materials and Methods
3.1. High-Resolution Gated Aggregation Network
3.1.1. High-Resolution Network
3.1.2. Gated Aggregation Model
3.2. Rotated Inscribed Ellipse Prediction Head
3.3. Eccentricity-Wise Orientation Loss
3.4. Loss Functions
4. Experiments and Analysis of the Results
4.1. Datasets
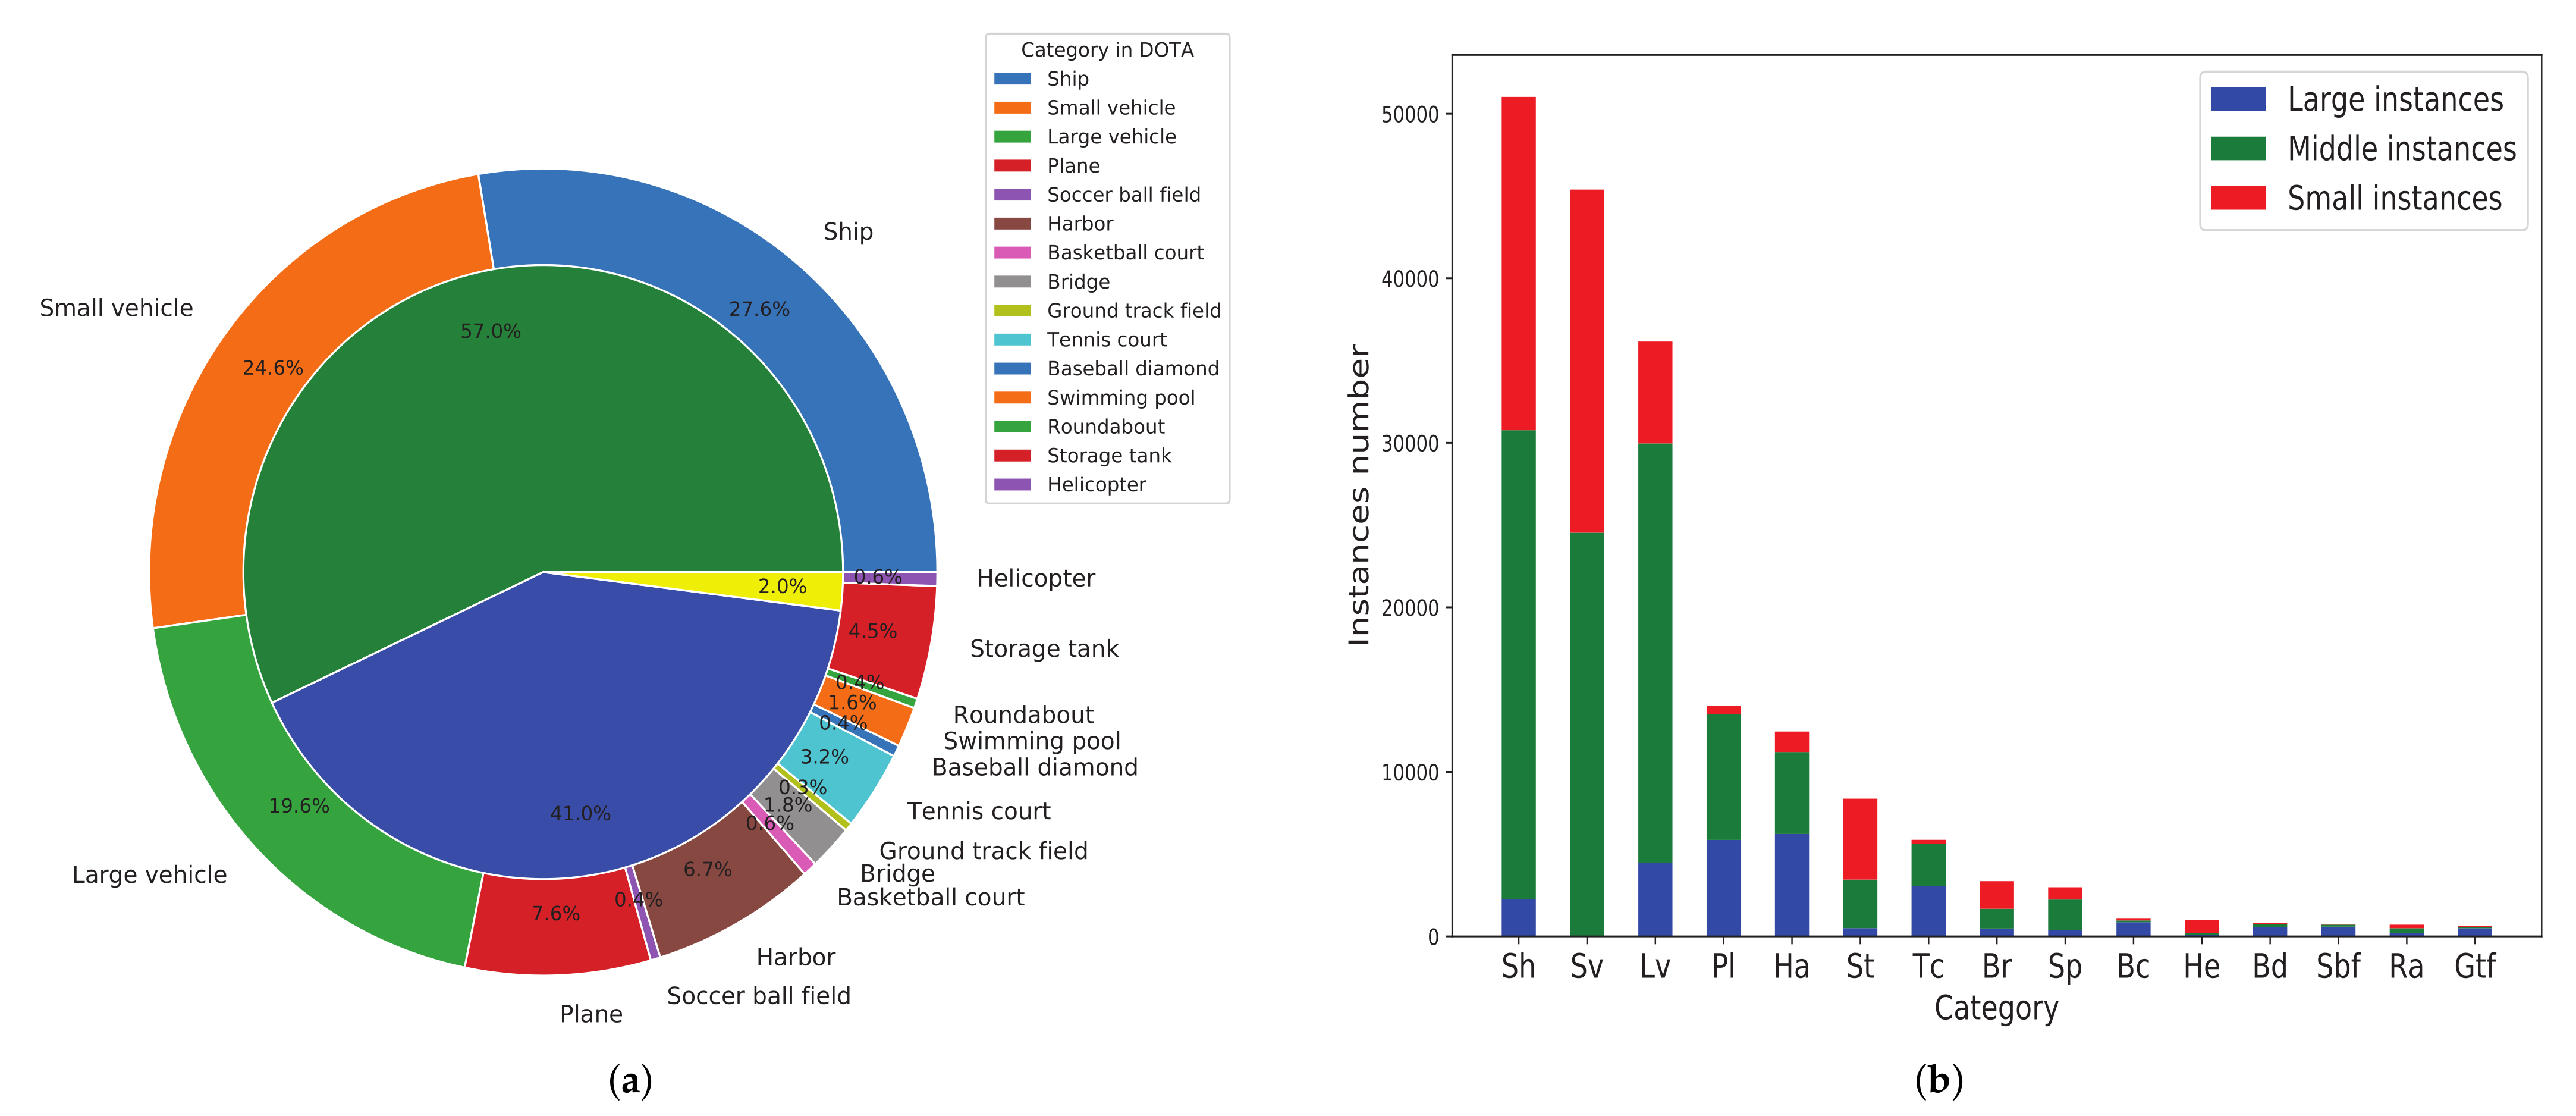
4.1.1. DOTA
4.1.2. HRSC2016
4.2. Evaluation Metrics
4.3. Implementation Details
4.4. Network Inference
4.5. Comparison with State-of-the-Art Methods
4.5.1. Results on DOTA
4.5.2. Results on HRSC2016
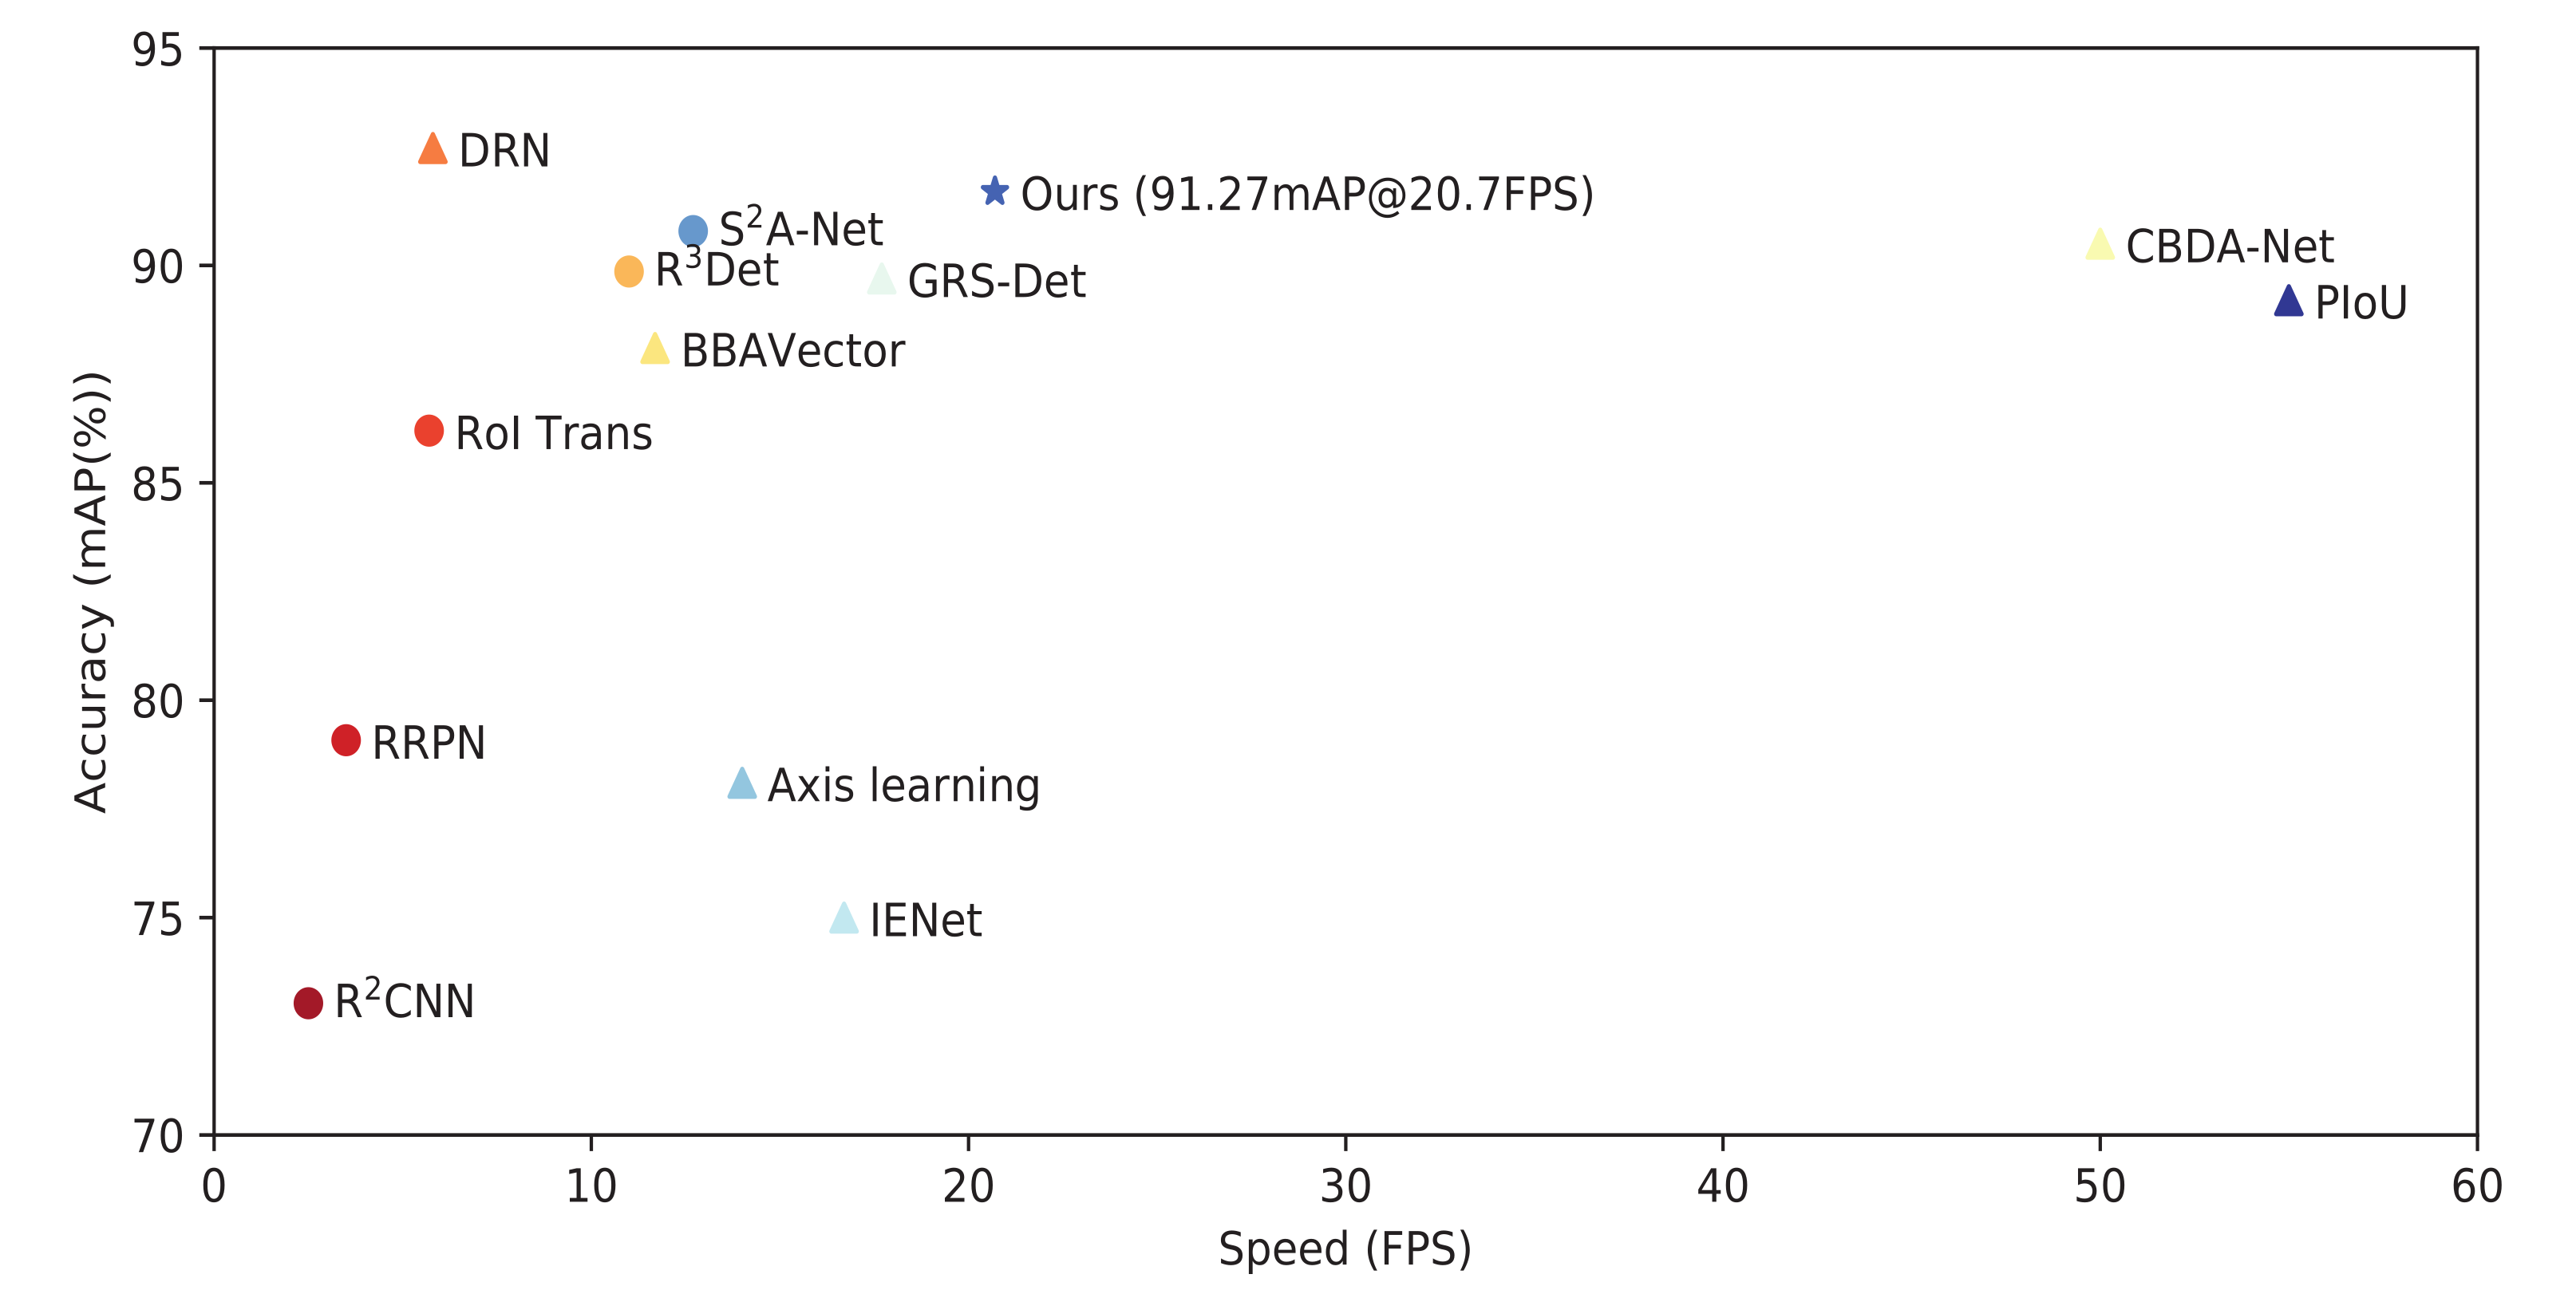
4.6. Accuracy–Speed Trade-Off
4.7. Ablation Study
4.8. Complexity Analysis
4.9. Applications and Limitations
5. Conclusions
Author Contributions
Funding
Institutional Review Board Statement
Informed Consent Statement
Data Availability Statement
Conflicts of Interest
References
- Kamusoko, C. Importance of remote sensing and land change modeling for urbanization studies. In Urban Development in Asia and Africa; Springer: Singapore, 2017. [Google Scholar]
- Ahmad, K.; Pogorelov, K.; Riegler, M.; Conci, N.; Halvorsen, P. Social media and satellites. Multimed. Tools Appl. 2016, 78, 2837–2875. [Google Scholar] [CrossRef]
- Tang, T.; Zhou, S.; Deng, Z.; Zou, H.; Lei, L. Vehicle detection in aerial images based on region convolutional neural networks and hard negative example mining. Sensors 2017, 17, 336. [Google Scholar] [CrossRef] [PubMed] [Green Version]
- Janowski, L.; Wroblewski, R.; Dworniczak, J.; Kolakowski, M.; Rogowska, K.; Wojcik, M.; Gajewski, J. Offshore benthic habitat mapping based on object-based image analysis and geomorphometric approach. A case study from the Slupsk Bank, Southern Baltic Sea. Sci. Total Environ. 2021, 11, 149712. [Google Scholar] [CrossRef]
- Madricardo, F.; Bassani, M.; D’Acunto, G.; Calandriello, A.; Foglini, F. New evidence of a Roman road in the Venice Lagoon (Italy) based on high resolution seafloor reconstruction. Sci. Rep. 2021, 11, 1–19. [Google Scholar]
- Li, S.; Xu, Y.L.; Zhu, M.M.; Ma, S.P.; Tang, H. Remote sensing airport detection based on End-to-End deep transferable convolutional neural networks. IEEE Trans. Geosci. Remote Sens. 2019, 16, 1640–1644. [Google Scholar] [CrossRef]
- Girshick, R. Fast r-cnn. In Proceedings of the IEEE International Conference on Computer Vision, Santiago, Chile, 7–13 December 2015; pp. 1440–1448. [Google Scholar]
- Cai, Z.; Vasconcelos, N. Cascade r-cnn: Delving into high quality object detection. In Proceedings of the IEEE Conference on Computer Vision and Pattern Recognition, Salt Lake City, UT, USA, 18–22 June 2018; pp. 6154–6162. [Google Scholar]
- Ren, S.; He, K.; Girshick, R.; Sun, J. Faster r-cnn: Towards real-time object detection with region proposal networks. IEEE Trans. Pattern Anal. Mach. Intell. 2016, 39, 1137–1149. [Google Scholar] [CrossRef] [Green Version]
- Redmon, J.; Divvala, S.; Girshick, R.; Farhadi, A. You only look once: Unified, real-time object detection. In Proceedings of the IEEE Conference on Computer Vision and Pattern Recognition, Las Vegas, NV, USA, 27–30 June 2016; pp. 779–788. [Google Scholar]
- Liu, W.; Anguelov, D.; Erhan, D.; Szegedy, C.; Reed, S.; Fu, C.; Berg, A.C. Ssd: Single shot multibox detector. In Proceedings of the European Conference on Computer Vision (ECCV), Amsterdam, The Netherlands, 11–14 October 2016; pp. 21–37. [Google Scholar]
- Lin, T.Y.; Goyal, P.; Girshick, R.; He, K.; Dollár, P. Focal loss for dense object detection. In Proceedings of the IEEE International Conference on Computer Vision, Venice, Italy, 22–29 October 2017; pp. 2980–2988. [Google Scholar]
- Law, H.; Deng, J. Cornernet: Detecting objects as paired keypoints. In Proceedings of the European Conference on Computer Vision (ECCV), Munich, Germany, 8–14 September 2018; pp. 734–750. [Google Scholar]
- Duan, K.; Bai, S.; Xie, L.; Qi, H.; Huang, Q.; Tian, Q. Centernet: Keypoint triplets for object detection. In Proceedings of the IEEE International Conference on Computer Vision, Seoul, Korea, 27–28 October 2019; pp. 6569–6578. [Google Scholar]
- Zhou, X.Y.; Zhuo, J.C.; Krahenbuhl, P. Bottom-up object detection by grouping extreme and center points. In Proceedings of the IEEE Conference on Computer Vision and Pattern Recognition, Long Beach, CA, USA, 16–20 June 2019; pp. 850–859. [Google Scholar]
- Huang, L.; Yang, Y.; Deng, Y.; Yu, Y. Densebox: Unifying landmark localization with end to end object detection. arXiv 2015, arXiv:1509.04874. [Google Scholar]
- Kong, T.; Sun, F.; Liu, H.; Jiang, Y.; Li, L.; Shi, J. Foveabox: Beyound anchor-based object detection. IEEE Trans. Image Process. 2020, 29, 7389–7398. [Google Scholar] [CrossRef]
- Tian, Z.; Shen, C.; Chen, H.; He, T. Fcos: Fully convolutional one-stage object detection. In Proceedings of the IEEE International Conference on Computer Vision, Thessaloniki, Greece, 23–25 September 2019; pp. 9627–9636. [Google Scholar]
- Zhou, L.; Wei, H.; Li, H.; Zhao, W.; Zhang, Y.; Zhang, Y. Arbitrary-Oriented Object Detection in Remote Sensing Images Based on Polar Coordinates. IEEE Access 2020, 8, 223373–223384. [Google Scholar] [CrossRef]
- Zhang, X.; Wang, G.; Zhu, P.; Zhang, T.; Li, C.; Jiao, L. GRS-Det: An Anchor-Free Rotation Ship Detector Based on Gaussian-Mask in Remote Sensing Images. IEEE Trans. Geosci. Remote Sens. 2020, 59, 3518–3531. [Google Scholar] [CrossRef]
- Shi, F.; Zhang, T.; Zhang, T. Orientation-Aware Vehicle Detection in Aerial Images via an Anchor-Free Object Detection Approach. IEEE Trans. Geosci. Remote Sens. 2020, 59, 5221–5233. [Google Scholar] [CrossRef]
- Yang, X.; Yan, J. Arbitrary-Oriented Object Detection with Circular Smooth Label. In Proceedings of the 16th European Conference on Computer Vision (ECCV), Glasgow, UK, 23–28 August 2020; pp. 677–694. [Google Scholar]
- Liu, Z.; Hu, J.; Weng, L.; Yang, Y. Rotated region based CNN for ship detection. In Proceedings of the 2017 IEEE International Conference on Image Processing (ICIP), Beijing, China, 17–20 September 2017; pp. 900–904. [Google Scholar]
- Cheng, G.; Zhou, P.; Han, J. Learning Rotation-Invariant Convolutional Neural Networks for Object Detection in VHR Optical Remote Sensing Images. IEEE Trans. Geosci. Remote Sens. 2016, 54, 7405–7415. [Google Scholar] [CrossRef]
- Cheng, G.; Han, J.; Zhou, P.; Xu, D. Learning Rotation-Invariant and Fisher Discriminative Convolutional Neural Networks for Object Detection. IEEE Trans. Geosci. Remote Sens. 2019, 28, 265–278. [Google Scholar] [CrossRef] [PubMed]
- Yang, X.; Sun, H.; Fu, K.; Yang, J.; Sun, X.; Yan, M.; Guo, Z. Automatic Ship Detection in Remote Sensing Images from Google Earth of Complex Scenes Based on Multiscale Rotation Dense Feature Pyramid Networks. Remote Sens. 2018, 10, 132. [Google Scholar] [CrossRef] [Green Version]
- Jiang, Y.; Zhu, X.; Wang, X.; Yang, S.; Li, W.; Wang, H.; Fu, P.; Luo, Z. R2cnn: Rotational region cnn for orientation robust scene text detection. arXiv 2017, arXiv:1706.09579. [Google Scholar]
- Ma, J.; Shao, W.; Ye, H.; Wang, L.; Wang, H.; Zheng, Y.; Xue, X. Arbitrary-oriented scene text detection via rotation proposals. IEEE Trans. Multimed. 2018, 20, 3111–3122. [Google Scholar] [CrossRef] [Green Version]
- Azimi, S.M.; Vig, E.; Bahmanyar, R. Towards multi-class object detection in unconstrained remote sensing imagery. In Proceedings of the Asian Conference on Computer Vision, Perth, WA, Australia, 2–6 December 2018; Springer: Berlin/Heidelberg, Germany, 2018; pp. 150–165. [Google Scholar]
- Ding, J.; Xue, N.; Long, Y.; Xia, G.S.; Lu, Q. Learning RoI transformer for oriented object detection in aerial images. In Proceedings of the IEEE Conference on Computer Vision and Pattern Recognition, Long Beach, CA, USA, 16–20 June 2019; pp. 2849–2858. [Google Scholar]
- Zhang, Z.; Guo, W.; Zhu, S.; Yu, W. Toward arbitrarily oriented ship detection with rotated region proposal and discrimination networks. IEEE Geosci. Remote Sens. Lett. 2018, 15, 1745–1749. [Google Scholar] [CrossRef]
- Zhang, G.; Lu, S.; Zhang, W. Cad-net: A context-aware detection network for objects in remote sensing imagery. IEEE Trans. Geosci. Remote Sens. 2019, 57, 10015–10024. [Google Scholar] [CrossRef] [Green Version]
- Yang, X.; Liu, Q.; Yan, J.; Li, A.; Zhang, Z.; Yu, G. R3det: Refined single-stage detector with feature refinement for rotating object. arXiv 2019, arXiv:1908.05612. [Google Scholar]
- Yang, X.; Yang, J.; Yan, J.; Zhang, Y.; Zhang, T.; Guo, Z.; Sun, X.; Fu, K. Scrdet: Towards more robust detection for small, cluttered and rotated objects. In Proceedings of the IEEE International Conference on Computer Vision, Thessaloniki, Greece, 23–25 September 2019; pp. 8232–8241. [Google Scholar]
- Han, J.; Ding, J.; Li, J.; Xia, G.S. Align Deep Features for Oriented Object Detection. IEEE Trans. Geosci. Remote Sens. 2020. [Google Scholar] [CrossRef]
- Xu, Y.; Fu, M.; Wang, Q.; Wang, Y.; Chen, K.; Xia, G.S.; Bai, X. Gliding vertex on the horizontal bounding box for multi-oriented object detection. IEEE Trans. Pattern Anal. Mach. Intell. 2020, 43, 1452–1459. [Google Scholar] [CrossRef] [Green Version]
- Zhu, Y.; Du, J.; Wu, X. Adaptive Period Embedding for Representing Oriented Objects in Aerial Images. IEEE Trans. Geosci. Remote Sens. 2020, 58, 7247–7257. [Google Scholar] [CrossRef] [Green Version]
- Yang, X.; Hou, L.; Zhou, Y. Dense label encoding for boundary discontinuity free rotation detection. In Proceedings of the IEEE Conference on Computer Vision and Pattern Recognition, Las Vegas, NV, USA, 19–25 June 2016; pp. 15819–15829. [Google Scholar]
- Wu, Q.; Xiang, W.; Tang, R.; Zhu, J. Bounding Box Projection for Regression Uncertainty in Oriented Object Detection. IEEE Access 2021, 9, 58768–58779. [Google Scholar] [CrossRef]
- Liu, Z.; Yuan, L.; Weng, L.; Yang, Y. A high resolution optical satellite image dataset for ship recognition and some new baselines. In Proceedings of the International Conference on Pattern Recognition Applications and Methods, Porto, Portugal, 24–26 February 2017; Volume 2, pp. 324–331. [Google Scholar]
- Liao, M.; Zhu, Z.; Shi, B.; Xia, G.S.; Bai, X. Rotation-Sensitive Regression for Oriented Scene Text Detection. In Proceedings of the IEEE Conference on Computer Vision and Pattern Recognition (CVPR), Salt Lake City, UT, USA, 18–22 June 2018. [Google Scholar]
- Lin, Y.; Feng, P.; Guan, J. Ienet: Interacting embranchment one stage anchor free detector for orientation aerial object detection. arXiv 2019, arXiv:1912.00969. [Google Scholar]
- Xiao, Z.; Qian, L.; Shao, W.; Tan, X.; Wang, K. Axis Learning for Orientated Objects Detection in Aerial Images. Remote Sens. 2020, 12, 908. [Google Scholar] [CrossRef] [Green Version]
- Chen, J.; Xie, F.; Lu, Y.; Jiang, Z. Finding Arbitrary-Oriented Ships From Remote Sensing Images Using Corner Detection. IEEE Geosci. Remote Sens. Lett. 2019, 17, 1712–1716. [Google Scholar] [CrossRef]
- Liu, S.; Zhang, L.; Lu, H.; He, Y. Center-Boundary Dual Attention for Oriented Object Detection in Remote Sensing Images. IEEE Trans. Geosci. Remote Sens. 2021. [Google Scholar] [CrossRef]
- Chen, Z.; Chen, K.; Lin, W.; See, J.; Yu, H.; Ke, Y.; Yang, C. Piou loss: Towards accurate oriented object detection in complex environments. In Proceedings of the European Conference on Computer Vision (ECCV), Glasgow, UK, 23–28 August 2020; pp. 195–211. [Google Scholar]
- Pan, X.; Ren, Y.; Sheng, K.; Dong, W.; Yuan, H.; Guo, X.; Xu, C. Dynamic refinement network for oriented and densely packed object detection. In Proceedings of the IEEE Conference on Computer Vision and Pattern Recognition, Seattle, WA, USA, 14–19 June 2020; pp. 11207–11216. [Google Scholar]
- Wei, H.; Zhang, Y.; Chang, Z.; Li, H.; Wang, H.; Sun, X. Oriented objects as pairs of middle lines. ISPRS J. Photogramm. Remote Sens. 2020, 169, 268–279. [Google Scholar] [CrossRef]
- Wei, H.; Zhang, Y.; Wang, B.; Yang, Y.; Li, H.; Wang, H. X-LineNet: Detecting Aircraft in Remote Sensing Images by a Pair of Intersecting Line Segments. IEEE Trans. Geosci. Remote Sens. 2021, 59, 1645–1659. [Google Scholar] [CrossRef]
- Yi, J.; Wu, P.; Liu, B.; Huang, Q.; Qu, H.; Metaxas, D. Oriented Object Detection in Aerial Images with Box Boundary-Aware Vectors. In Proceedings of the IEEE/CVF Winter Conference on Applications of Computer Vision, Snowmass Village, CO, USA, 1–5 March 2020; pp. 2150–2159. [Google Scholar]
- Wang, J. Deep High-Resolution Representation Learning for Visual Recognition. IEEE Trans. Pattern Anal. Mach. Intell. 2020, 43, 3349–3364. [Google Scholar] [CrossRef] [Green Version]
- Simonyan, K.; Zisserman, A. Very deep convolutional networks for large-scale image recognition. In Proceedings of the International Conference on Learning Representations, San Diego, CA, USA, 7–9 May 2015; pp. 1–14. [Google Scholar]
- He, K.; Zhang, X.; Ren, S.; Sun, J. Deep residual learning for image recognition. In Proceedings of the IEEE Conference on Computer Vision and Pattern Recognition, Las Vegas, NV, USA, 27–30 June 2016; pp. 770–778. [Google Scholar]
- Newell, A.; Yang, K.; Deng, J. Stacked hourglass networks for human pose estimation. In Proceedings of the European Conference on Computer Vision (ECCV), Amsterdam, The Netherlands, 8–16 October 2016; pp. 483–499. [Google Scholar]
- Kendall, A.; Gal, Y.; Cipolla, R. Multi-task learning using uncertainty to weigh losses for scene geometry and semantics. In Proceedings of the IEEE Conference on Computer Vision and Pattern Recognition, Salt Lake City, UT, USA, 18–22 June 2018; pp. 7482–7491. [Google Scholar]
- Xia, G.; Bai, X.; Ding, J.; Zhu, Z.; Belongie, S.; Luo, J.; Datcu, M.; Pelillo, M.; Zhang, L. DOTA: A large-scale dataset for object detection in aerial images. In Proceedings of the IEEE Conference on Computer Vision and Pattern Recognition, Salt Lake City, UT, USA, 18–22 June 2018; pp. 3974–3983. [Google Scholar]
- Liu, Z.; Wang, H.; Weng, L.; Yang, Y. Ship rotated bounding box space for ship extraction from high-resolution optical satellite images with complex backgrounds. IEEE Geosci. Remote Sens. Lett. 2016, 13, 1074–1078. [Google Scholar] [CrossRef]
- Paszke, A.; Gross, S.; Massa, F.; Lerer, A.; Bradbury, J.; Chanan, G.; Killeen, T.; Lin, Z.M.; Gimelshein, N.; Antiga, L. Pytorch: An imperative style, high-performance deep learning library. Adv. Neural Inf. Process. Syst. 2019, 32, 8026–8037. [Google Scholar]
- Kingma, D.P.; Ba, J. Adam: A method for stochastic optimization. arXiv 2014, arXiv:1412.6980. [Google Scholar]
- Xie, S.; Girshick, R.; Dollár, P.; Tu, Z.; He, K. Aggregated residual transformations for deep neural networks. In Proceedings of the IEEE Conference on Computer Vision and Pattern Recognition, Honolulu, HI, USA, 21–26 July 2017; pp. 1492–1500. [Google Scholar]
- Yu, F.; Wang, D.; Shelhamer, E.; Darrell, T. Deep layer aggregation. In Proceedings of the IEEE Conference on Computer Vision and Pattern Recognition, Salt Lake City, UT, USA, 18–22 June 2018; pp. 2403–2412. [Google Scholar]


| Res. | Stage1 | Fusion | Stage2 | Fusion | Stage3 | Fusion | Stage4 | Fusion |
|---|---|---|---|---|---|---|---|---|
| ≡ | ≡ | ≡ | ≡ | |||||
| ≡ | ≡ | ≡ | ≡ | |||||
| ≡ | ≡ | ≡ | ||||||
| ≡ | ≡ |
| Method | Backbone | FPN | PL | BD | BR | GTF | SV | LV | SH | TC | BC | ST | SBF | RA | HA | SP | HC | mAP |
|---|---|---|---|---|---|---|---|---|---|---|---|---|---|---|---|---|---|---|
| Anchor-based | ||||||||||||||||||
| FR-O [56] | ResNet-50 | - | 79.42 | 77.13 | 17.70 | 64.05 | 35.30 | 38.02 | 37.16 | 89.41 | 69.64 | 59.28 | 50.30 | 52.91 | 47.89 | 47.40 | 46.30 | 54.13 |
| R-DFPN [26] | ResNet-101 | 80.92 | 65.82 | 33.77 | 58.94 | 55.77 | 50.94 | 54.78 | 90.33 | 66.34 | 68.66 | 48.73 | 51.76 | 55.10 | 51.32 | 35.88 | 57.94 | |
| CNN [27] | ResNet-101 | - | 80.94 | 65.67 | 35.34 | 67.44 | 59.92 | 50.91 | 55.81 | 90.67 | 66.92 | 72.39 | 55.06 | 52.23 | 55.14 | 53.35 | 48.22 | 60.67 |
| RRPN [28] | ResNet-101 | - | 88.52 | 71.20 | 31.66 | 59.30 | 51.85 | 56.19 | 57.25 | 90.81 | 72.84 | 67.38 | 56.69 | 52.84 | 53.08 | 51.94 | 53.58 | 61.01 |
| ICN [29] | ResNet-101 | 81.40 | 74.30 | 47.70 | 70.30 | 64.90 | 67.80 | 70.00 | 90.80 | 79.10 | 78.20 | 53.60 | 62.90 | 67.00 | 64.20 | 50.20 | 68.20 | |
| RoI Trans [30] | ResNet-101 | 88.64 | 78.52 | 43.44 | 75.92 | 68.81 | 73.68 | 83.59 | 90.74 | 77.27 | 81.46 | 58.39 | 53.54 | 62.83 | 58.93 | 47.67 | 69.56 | |
| CAD-Net [32] | ResNet-101 | 87.80 | 82.40 | 49.40 | 73.50 | 71.10 | 63.50 | 76.70 | 90.90 | 79.20 | 73.30 | 48.40 | 60.90 | 62.00 | 67.00 | 62.20 | 69.90 | |
| Det [33] | ResNet-101 | 89.54 | 81.99 | 48.46 | 62.52 | 70.48 | 74.29 | 77.54 | 90.80 | 81.39 | 83.54 | 61.97 | 59.82 | 65.44 | 67.46 | 60.05 | 71.69 | |
| SCRDet [34] | ResNet-101 | 89.98 | 80.65 | 52.09 | 68.36 | 68.36 | 60.32 | 72.41 | 90.85 | 87.94 | 86.86 | 65.02 | 66.68 | 66.25 | 68.24 | 65.21 | 72.61 | |
| ProjBB [39] | ResNet-101 | 88.96 | 79.32 | 53.98 | 70.21 | 60.67 | 76.20 | 89.71 | 90.22 | 78.94 | 76.82 | 60.49 | 63.62 | 73.12 | 71.43 | 61.69 | 73.03 | |
| Gliding Vertex [36] | ResNet-101 | 89.64 | 85.00 | 52.26 | 77.34 | 73.01 | 73.14 | 86.82 | 90.74 | 79.02 | 86.81 | 59.55 | 70.91 | 72.94 | 70.86 | 57.32 | 75.02 | |
| APE [37] | ResNet-50 | 89.96 | 83.62 | 53.42 | 76.03 | 74.01 | 77.16 | 79.45 | 90.83 | 87.15 | 84.51 | 67.72 | 60.33 | 74.61 | 71.84 | 65.55 | 75.75 | |
| A-Net [35] | ResNet-101 | 88.70 | 81.41 | 54.28 | 69.75 | 78.04 | 80.54 | 88.04 | 90.69 | 84.75 | 86.22 | 65.03 | 65.81 | 76.16 | 73.37 | 58.86 | 76.11 | |
| CSL [22] | ResNeXt101 [60] | 90.25 | 85.53 | 54.64 | 75.31 | 70.44 | 73.51 | 77.62 | 90.84 | 86.15 | 86.69 | 69.60 | 68.04 | 73.83 | 71.10 | 68.93 | 76.17 | |
| Anchor-free | ||||||||||||||||||
| IENet [42] | ResNet-101 | 57.14 | 80.20 | 65.54 | 39.82 | 32.07 | 49.71 | 65.01 | 52.58 | 81.45 | 44.66 | 78.51 | 46.54 | 56.73 | 64.40 | 64.24 | 57.14 | |
| PIoU [46] | DLA-34 [61] | - | 80.90 | 69.70 | 24.10 | 60.20 | 38.30 | 64.40 | 64.80 | 90.90 | 77.20 | 70.40 | 46.50 | 37.10 | 57.10 | 61.90 | 64.00 | 60.50 |
| Axis Learning [43] | ResNet-101 | 79.53 | 77.15 | 38.59 | 61.15 | 67.53 | 70.49 | 76.30 | 89.66 | 79.07 | 83.53 | 47.27 | 61.01 | 56.28 | 66.06 | 36.05 | 65.98 | |
| P-RSDet [19] | ResNet-101 | 89.02 | 73.65 | 47.33 | 72.03 | 70.58 | 73.71 | 72.76 | 90.82 | 80.12 | 81.32 | 59.45 | 57.87 | 60.79 | 65.21 | 52.59 | 69.82 | |
| -DNet [48] | Huorglass-104 | - | 89.20 | 76.54 | 48.95 | 67.52 | 71.11 | 75.86 | 78.85 | 90.84 | 78.97 | 78.26 | 61.44 | 60.79 | 59.66 | 63.85 | 64.91 | 71.12 |
| BBAVectors [50] | ResNet-101 | - | 88.35 | 79.96 | 50.69 | 62.18 | 78.43 | 78.98 | 87.94 | 90.85 | 83.58 | 84.35 | 54.13 | 60.24 | 65.22 | 64.28 | 55.70 | 72.32 |
| DRN [47] | Hourglass-104 | - | 89.71 | 82.34 | 47.22 | 64.10 | 76.22 | 74.43 | 85.84 | 90.57 | 86.18 | 84.89 | 57.65 | 61.93 | 69.30 | 69.63 | 58.48 | 73.23 |
| CBDA-Net [45] | DLA-34 [61] | - | 89.17 | 85.92 | 50.28 | 65.02 | 77.72 | 82.32 | 87.89 | 90.48 | 86.47 | 85.90 | 66.85 | 66.48 | 67.41 | 71.33 | 62.89 | 75.74 |
| RIE * | HRGANet-W48 | - | 89.23 | 84.86 | 55.69 | 70.32 | 75.76 | 80.68 | 86.14 | 90.26 | 80.17 | 81.34 | 59.36 | 63.24 | 74.12 | 70.87 | 60.36 | 74.83 |
| RIE | HRGANet-W48 | - | 89.85 | 85.68 | 58.81 | 70.56 | 76.66 | 82.47 | 88.09 | 90.56 | 80.89 | 82.27 | 60.46 | 63.67 | 76.63 | 71.56 | 60.89 | 75.94 |
| Model | Backbone | Resolution | AP (%) | Parameters |
|---|---|---|---|---|
| BL2 [23] | ResNet101 | - | 69.60 | - |
| CNN [27] | ResNet-101 | 800 × 800 | 73.07 | - |
| RC1&RC2 [40] | VGG-16 | 800 × 800 | 75.70 | - |
| RRPN [28] | ResNet-101 | 800 × 800 | 79.08 | 181.5 MB |
| PN [31] | VGG-16 | - | 79.60 | - |
| RRD [41] | VGG-16 | 384 × 384 | 82.89 | - |
| RoI Trans [30] | ResNet-101-FPN | 512 × 800 | 86.20 | 273.8 MB |
| Det [33] | ResNet-101-FPN | 800 × 800 | 89.26 | 227.0 MB |
| A-Net [35] | ResNet-101-FPN | 512 × 800 | 90.17 | 257.0 MB |
| IENet [42] | ResNet-101-FPN | 1024 × 1024 | 75.01 | 212.5 MB |
| Axis learning [43] | ResNet-101-FPN | 800 × 800 | 78.15 | - |
| BBAVector [50] | ResNet-101 | 608 × 608 | 88.60 | 276.3 MB |
| PIoU [46] | DLA-34 [61] | 512 × 512 | 89.20 | - |
| GRS-Det [20] | ResNet-101 | 800 × 800 | 89.57 | 200.0 MB |
| DRN [47] | Hourglass-104 | 768 × 768 | 92.70 | - |
| CBDA-Net [45] | DLA-34 [61] | - | 90.50 | - |
| RIE | HRGANet-W48 | 800 × 800 | 91.27 | 207.5 MB |
| Model | GAM | ewoLoss | Recall | Precision | F1-Score | HRSC2016 mAP | DOTA mAP |
|---|---|---|---|---|---|---|---|
| Baseline | - | - | 91.76 | 72.81 | 81.19 | 86.15 | 71.89 |
| RIE | - | 🗸 | 93.18 | 78.95 | 85.48 (+4.29) | 88.63 (+2.48) | 73.71 (+1.82) |
| 🗸 | - | 94.21 | 80.33 | 86.72 (+5.53) | 89.90 (+3.75) | 74.83 (+2.94) | |
| 🗸 | 🗸 | 95.11 | 81.78 | 87.94 (+6.75) | 91.27 (+5.12) | 75.94 (+4.05) |
| Dataset | Representation Method | Backbone | mAP (%) |
|---|---|---|---|
| ResNet-101 | 68.87 | ||
| DOTA | Angle-based | HRNet-W48 | 70.36 |
| HRGANet-W48 | 71.46 | ||
| ResNet-101 | 73.28 (+4.41) | ||
| DOTA | RIE-based | HRNet-W32 | 74.15 (+3.79) |
| HRGANet-W48 | 75.94 (+4.48) | ||
| ResNet-101 | 83.40 | ||
| HRSC2016 | Angle-based | HRNet-W48 | 85.60 |
| HRGANet-W48 | 87.47 | ||
| ResNet-101 | 87.63 (+4.23) | ||
| HRSC2016 | RIE-based | HRNet-W48 | 89.90 (+4.30) |
| HRGANet-W48 | 91.27 (+3.80) |
| GAM Architecture | GAM Layers | Parameters | Memory (MB) |
|---|---|---|---|
| Conv1 × 1 | 1 × (1 × 1 × 48) = 48 | ||
| Weight block 1 | BN | 2 | |
| ReLU | 0 | ||
| Conv1 × 1 | 1 × (1 × 1 × 48 × 2) = 96 | ||
| Weight block 2 | BN | 2 | |
| ReLU | 0 | ||
| Conv1 × 1 | 1 × (1 × 1 × 48 × 4) = 192 | ||
| Weight block 3 | BN | 2 | |
| ReLU | 0 | ||
| Conv1 × 1 | 1 × (1 × 1 × 48 × 8) = 384 | ||
| Weight block 4 | BN | 2 | |
| ReLU | 0 | ||
| Fusion | Conv1 × 1 | 256 × (1 × 1 × 48 × 15) = 184,320 | 0.7031 |
| Softmax | softmax function | 0 | 0 |
| total | - | 185,048 | 0.7059 |
Publisher’s Note: MDPI stays neutral with regard to jurisdictional claims in published maps and institutional affiliations. |
© 2021 by the authors. Licensee MDPI, Basel, Switzerland. This article is an open access article distributed under the terms and conditions of the Creative Commons Attribution (CC BY) license (https://creativecommons.org/licenses/by/4.0/).
Share and Cite
He, X.; Ma, S.; He, L.; Ru, L.; Wang, C. Learning Rotated Inscribed Ellipse for Oriented Object Detection in Remote Sensing Images. Remote Sens. 2021, 13, 3622. https://doi.org/10.3390/rs13183622
He X, Ma S, He L, Ru L, Wang C. Learning Rotated Inscribed Ellipse for Oriented Object Detection in Remote Sensing Images. Remote Sensing. 2021; 13(18):3622. https://doi.org/10.3390/rs13183622
Chicago/Turabian StyleHe, Xu, Shiping Ma, Linyuan He, Le Ru, and Chen Wang. 2021. "Learning Rotated Inscribed Ellipse for Oriented Object Detection in Remote Sensing Images" Remote Sensing 13, no. 18: 3622. https://doi.org/10.3390/rs13183622
APA StyleHe, X., Ma, S., He, L., Ru, L., & Wang, C. (2021). Learning Rotated Inscribed Ellipse for Oriented Object Detection in Remote Sensing Images. Remote Sensing, 13(18), 3622. https://doi.org/10.3390/rs13183622