
Geologic Mapping and Age Determinations of Tsiolkovskiy Crater


Abstract
:
1. Introduction
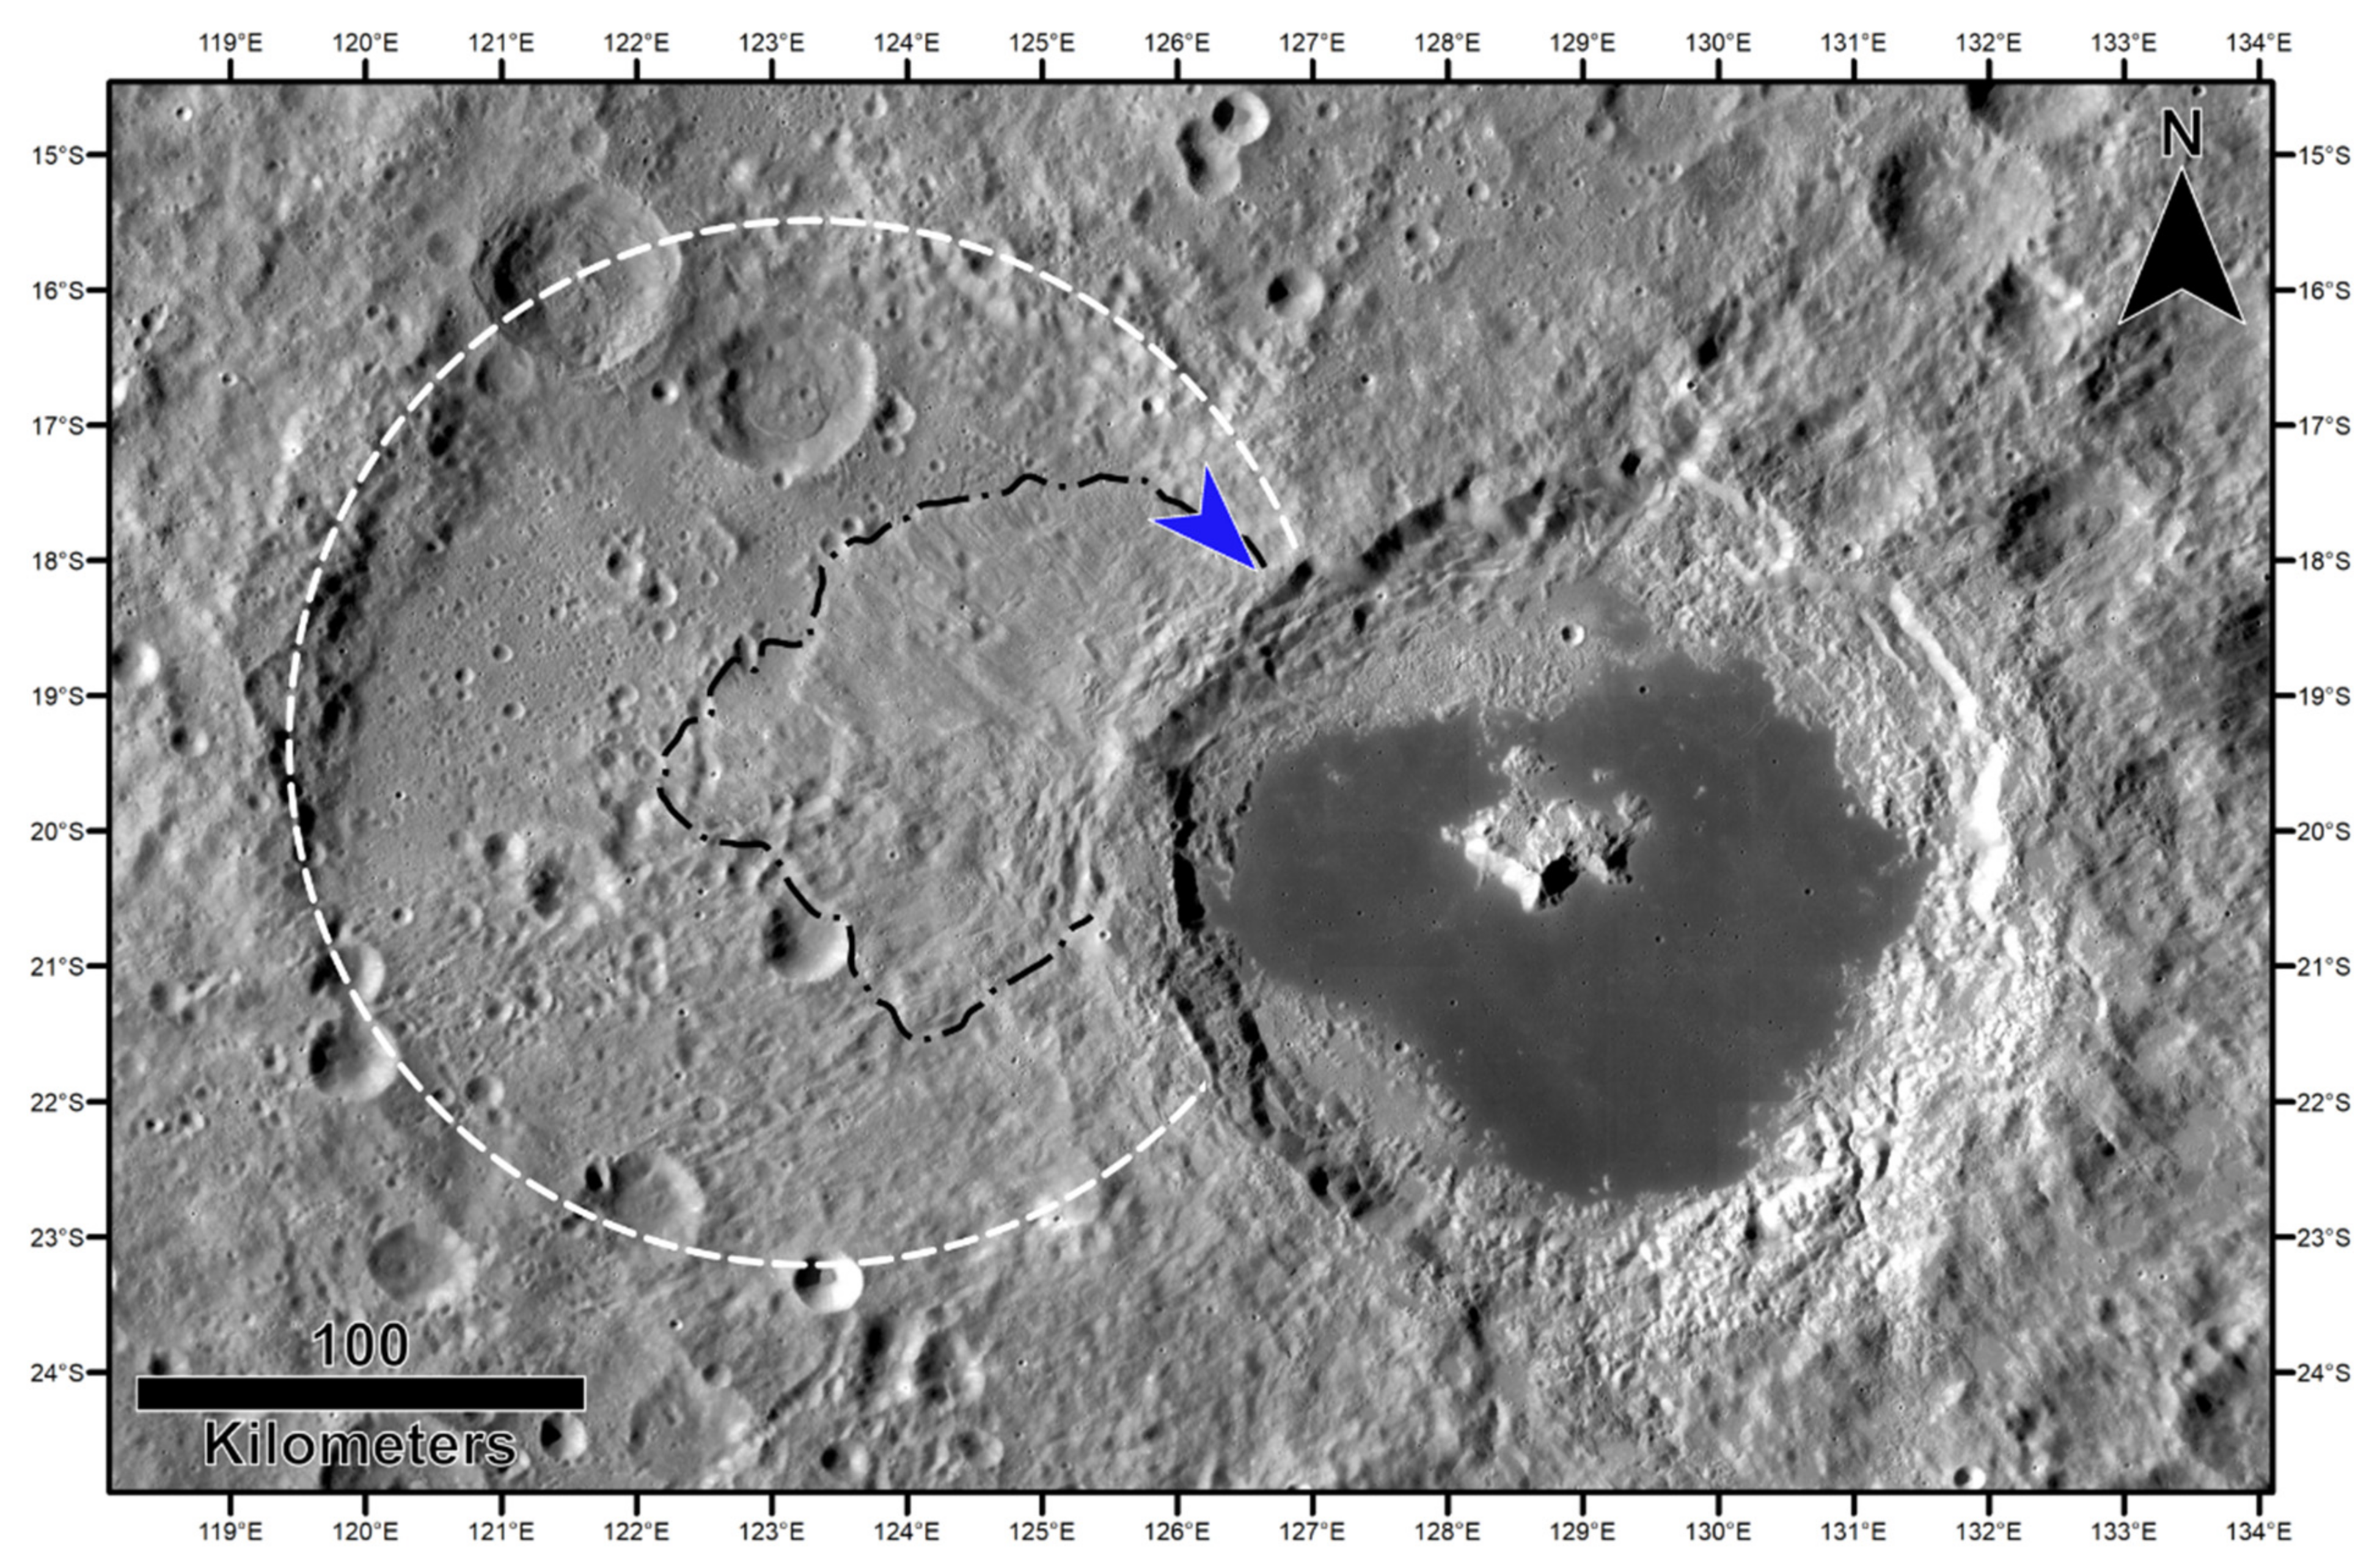
2. Geologic Background of the Tsiolkovskiy Crater
3. Datasets and Methods
3.1. Basemaps
3.2. Mapping Technique
3.3. Age Measurements
4. Results
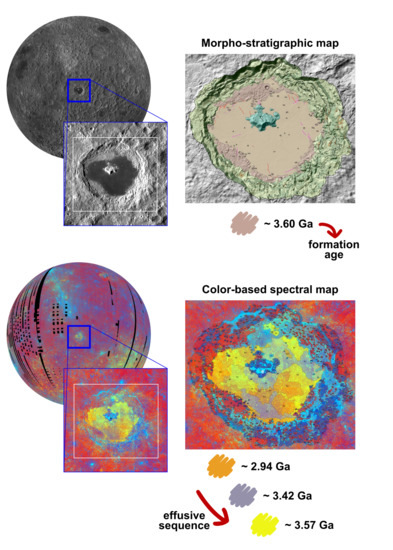
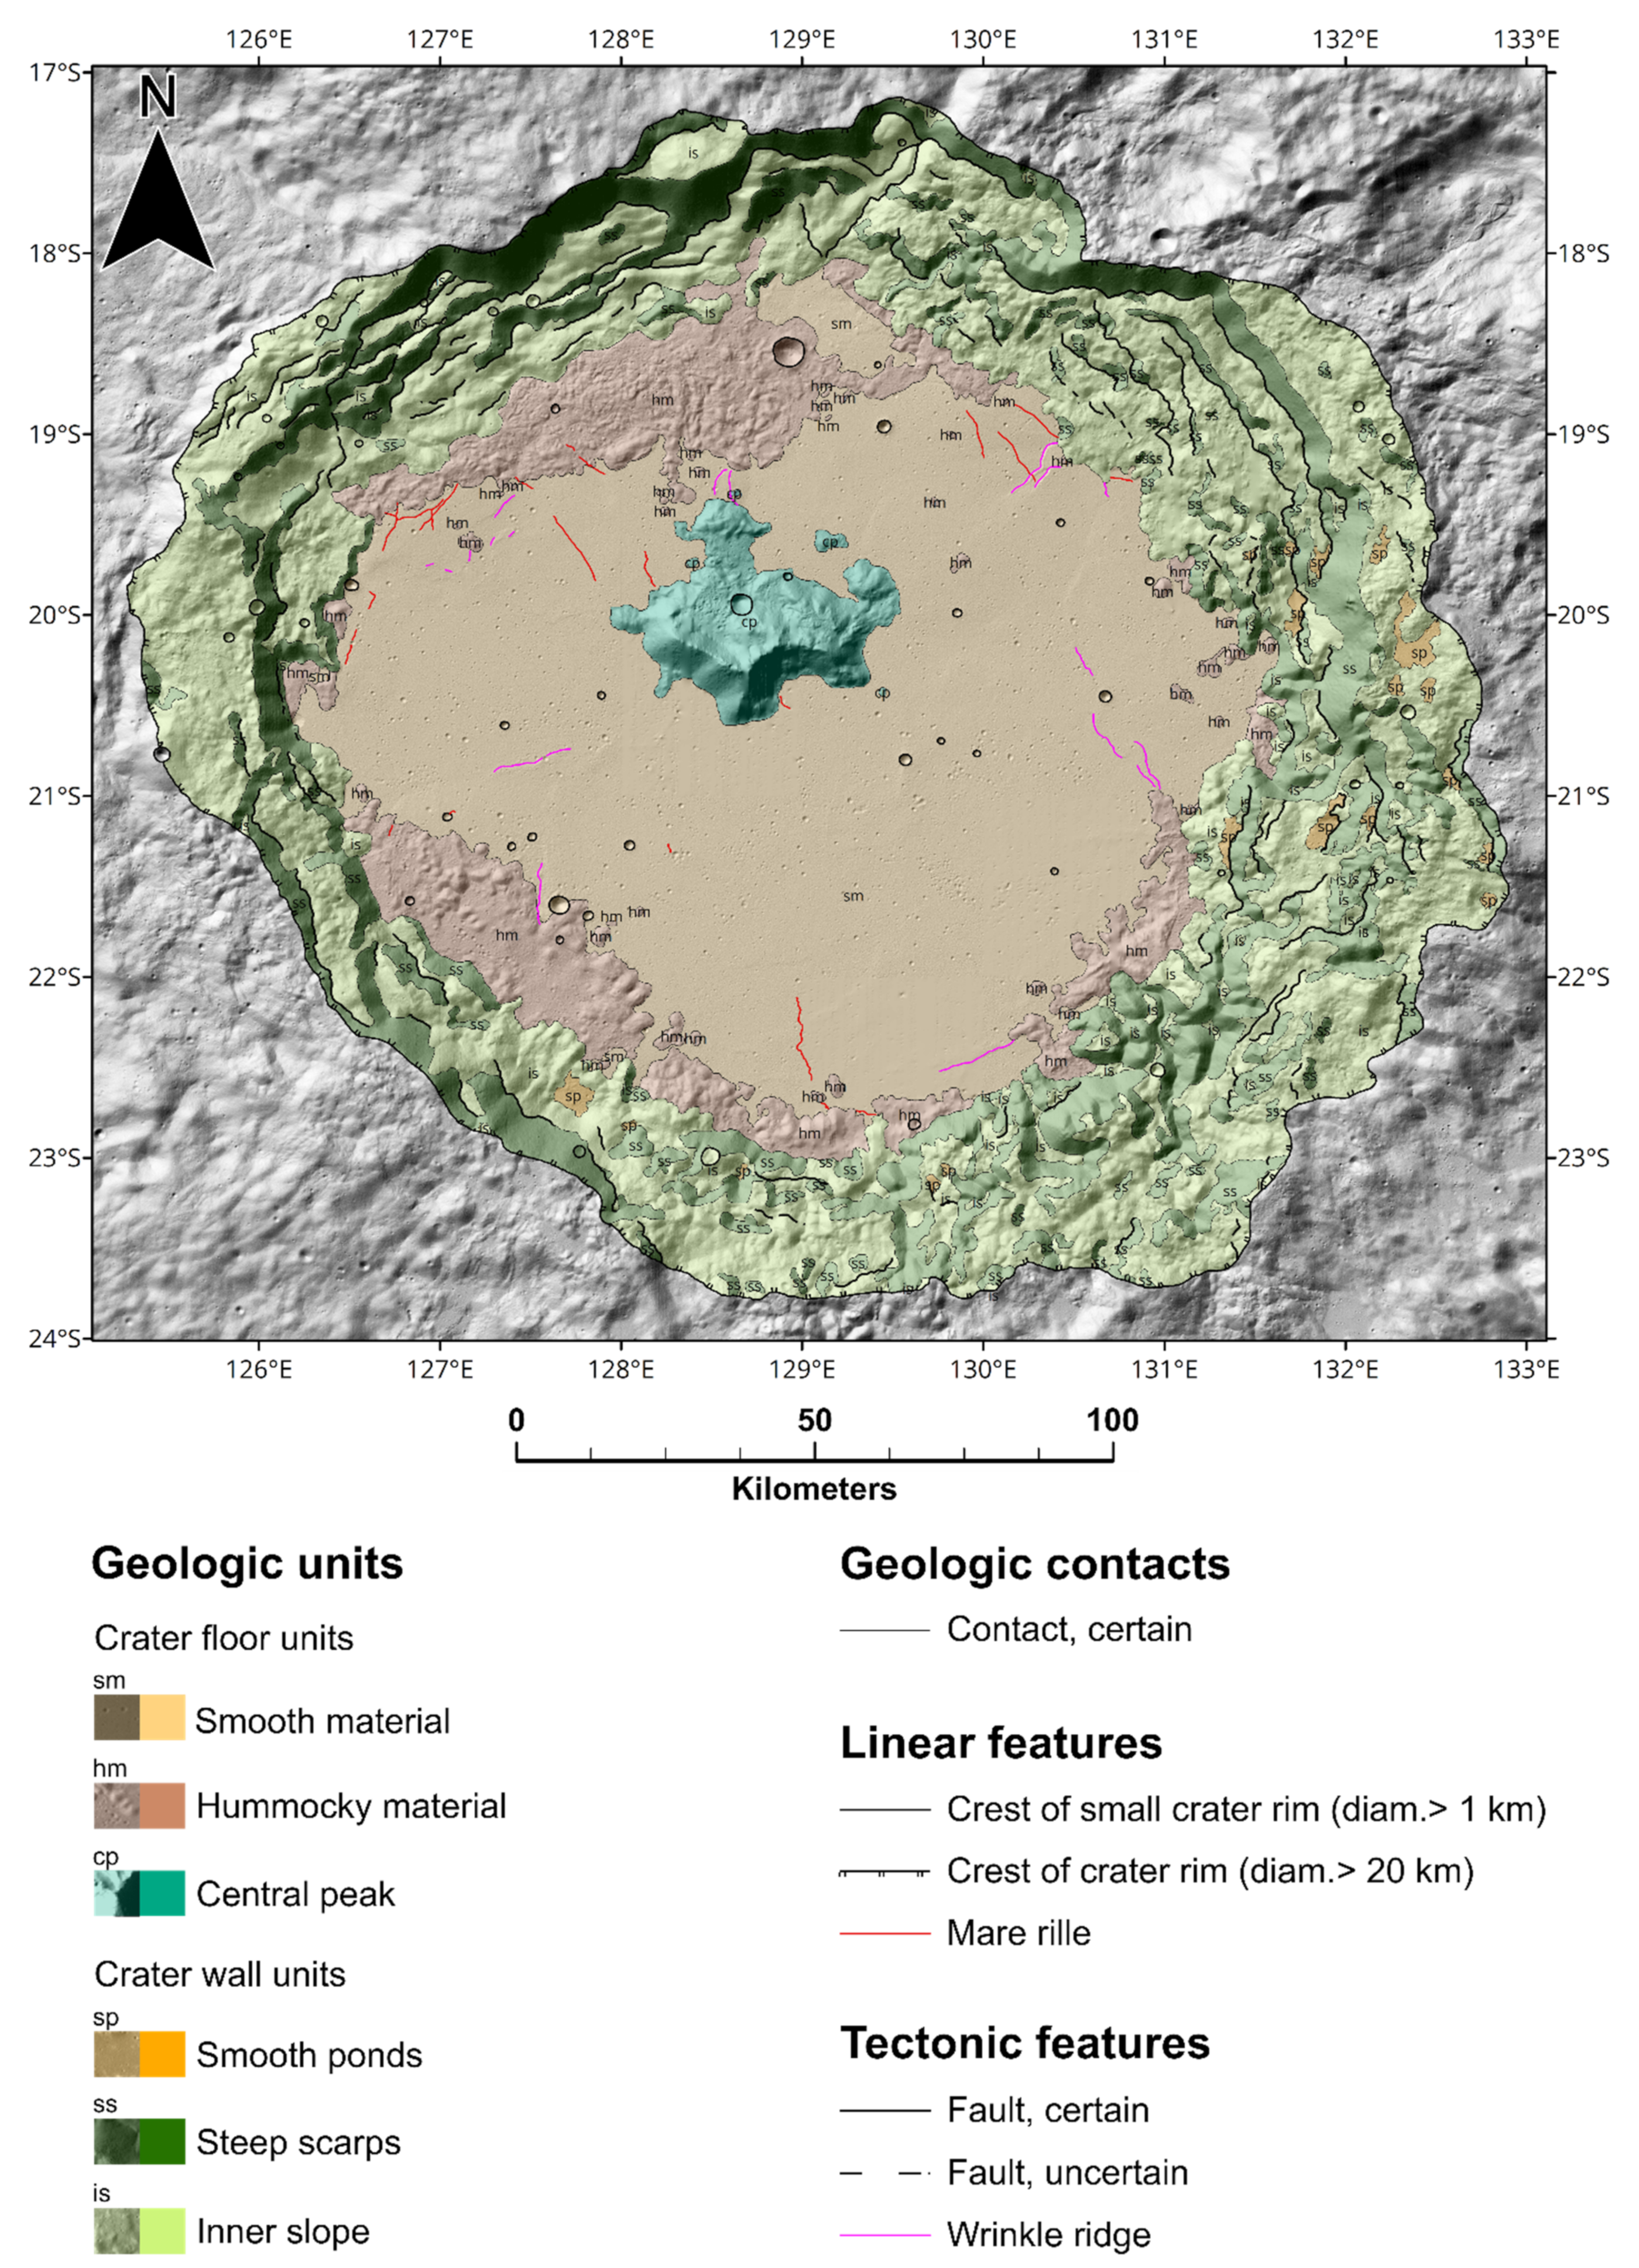
4.1. Morpho-Stratigraphic Map and Formation Age for the Tsiolkovskiy Crater
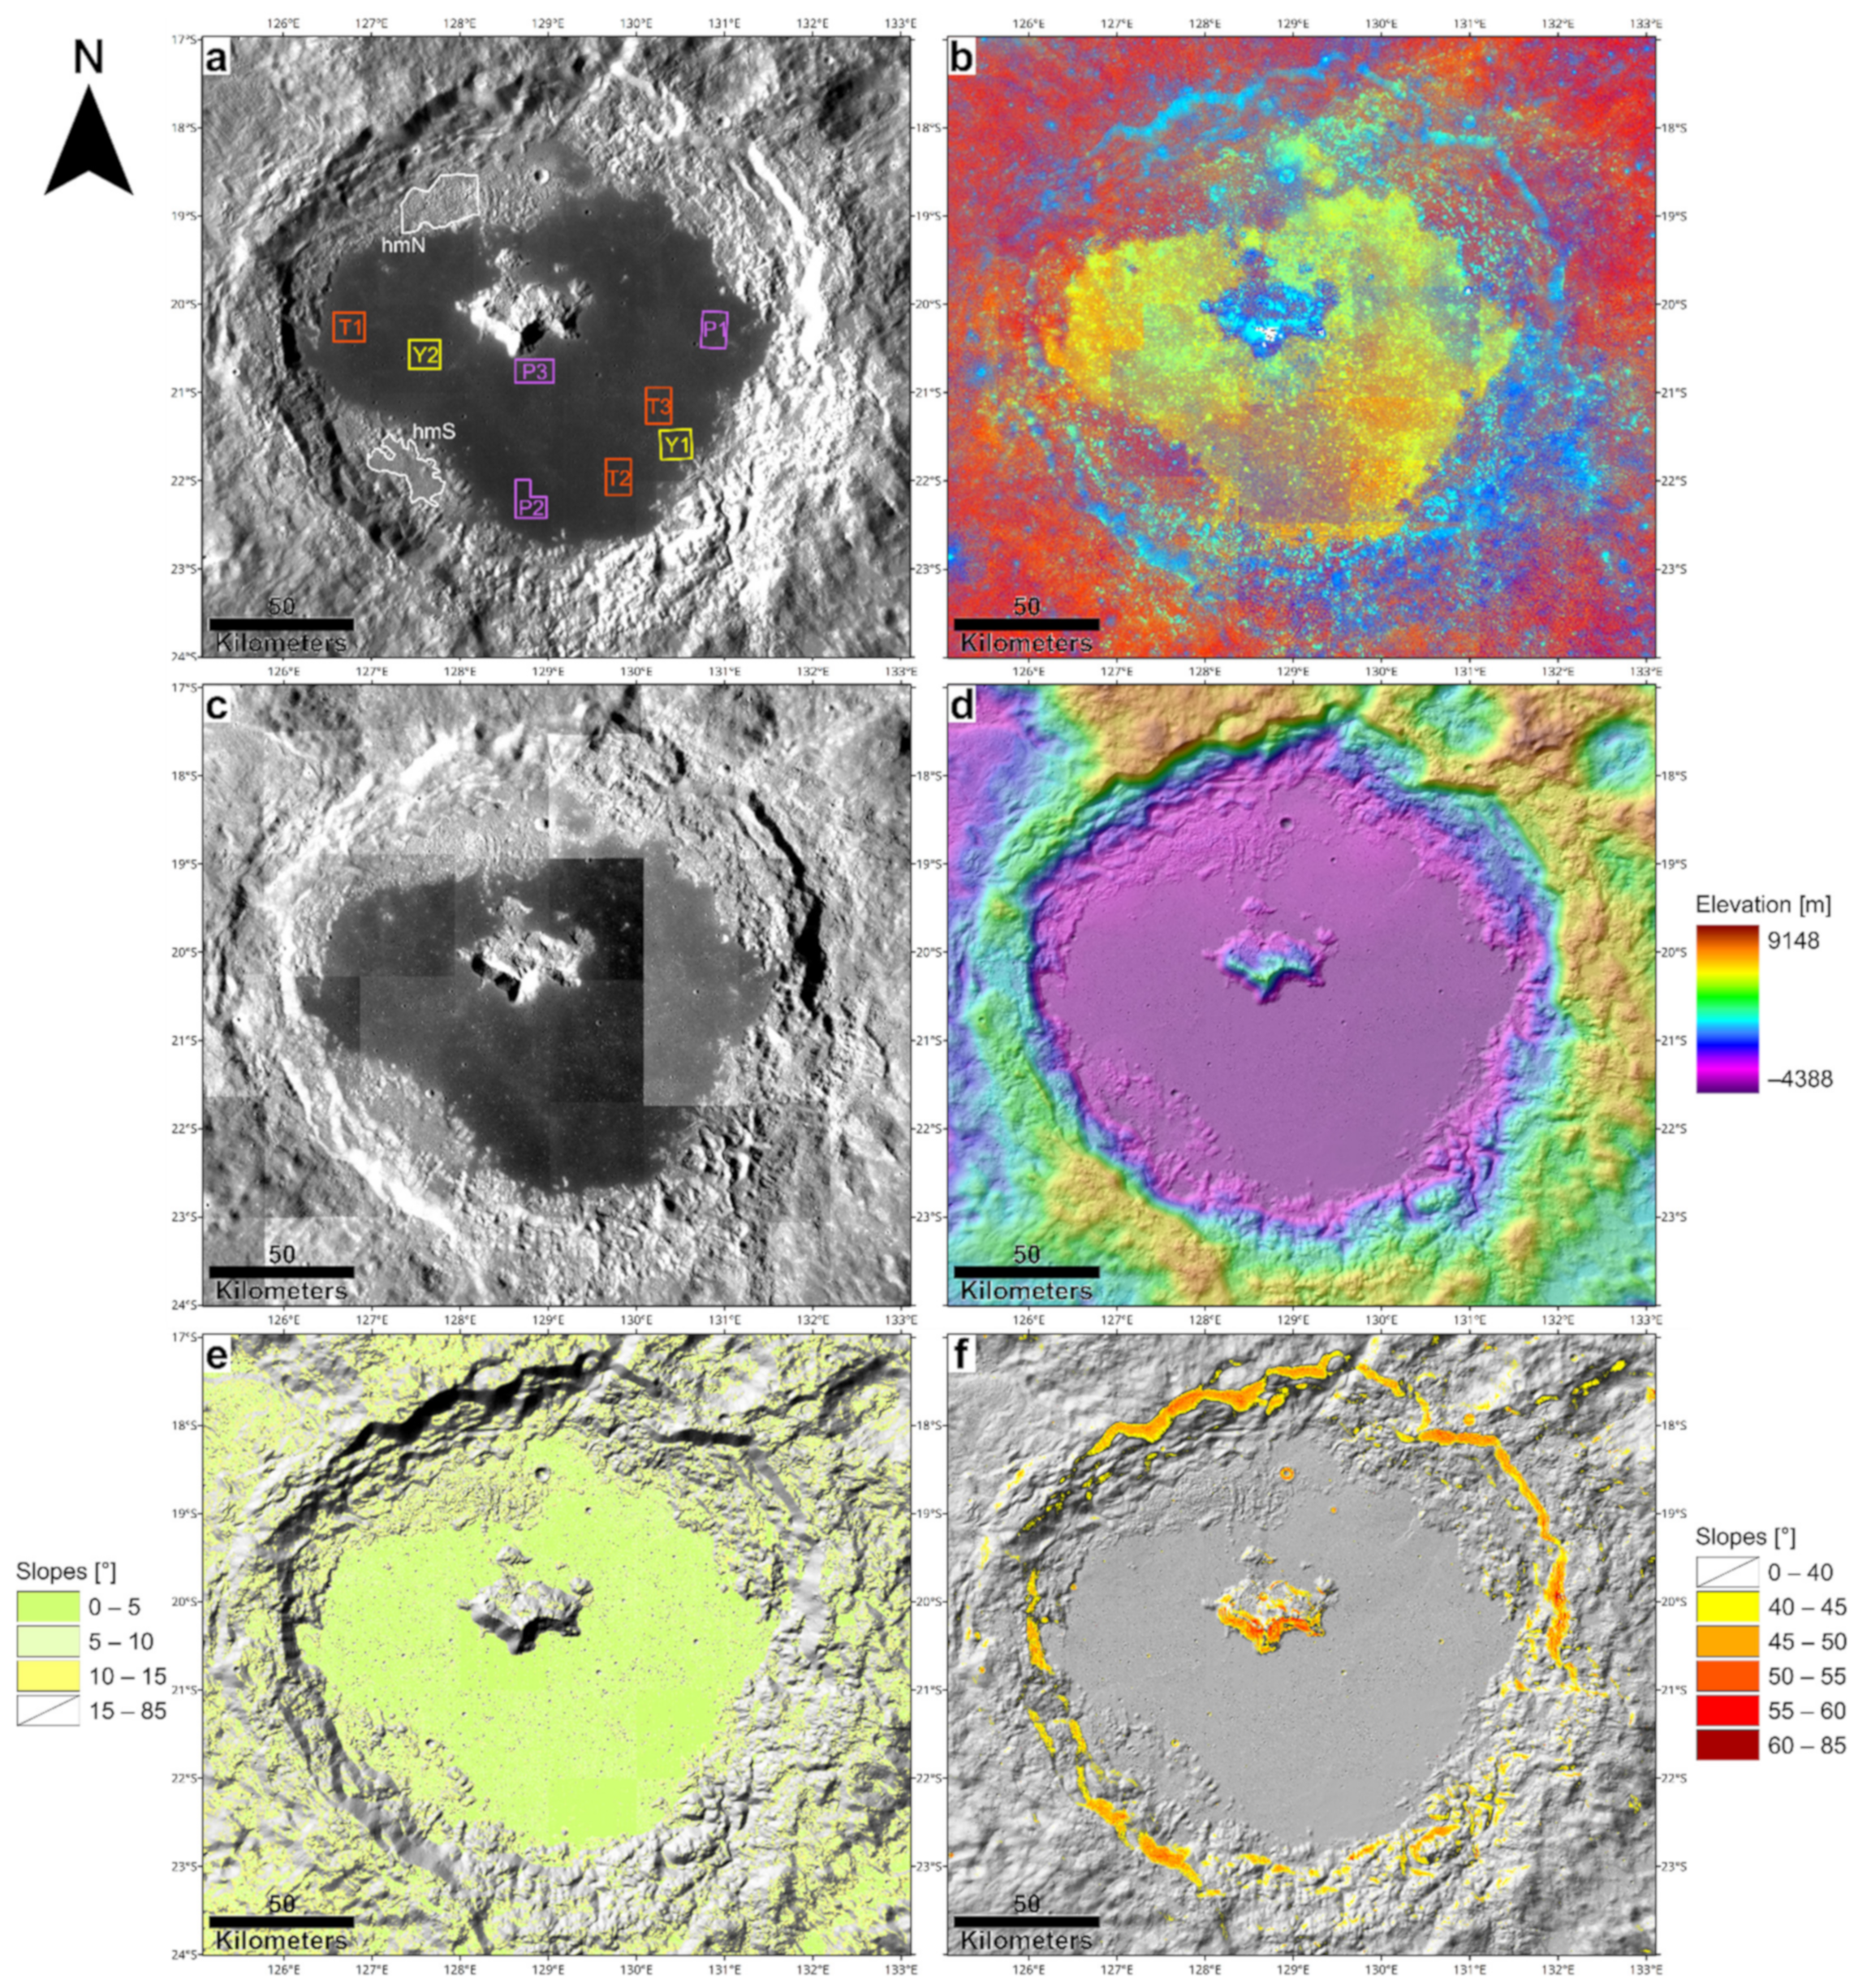
- sm—(floor unit) smooth material: particularly horizontal (mostly < 10°) and dark mare deposit punctured by minor impacts rarely reaching 5 km in diameter; this smooth material presents sharp boundaries with respect to adjacent materials and scattered wrinkle ridges and mare rilles.
- hm—(floor unit) hummocky material: pre-mare material presenting rolling areas and high-standing bulges characterized by rough material reworked during the impact and debris collapsed from the crater walls.
- cp—(floor unit) central peak: exclusively well-preserved and bright central peak morphology rising about 6.5 km above the crater floor.
- sp—(wall unit) smooth ponds: smooth areas interpreted as melt ponds texturally contrasting with the surrounding steep and rough areas.
- ss—(wall unit) steep scarps: exposed steep scarps (collapsed deposits were not included) with slopes > 40°.
- is—(wall unit) inner slope: terraces and scarps < 40° generated by the inward collapse of the crater inner slope during the modification stage.
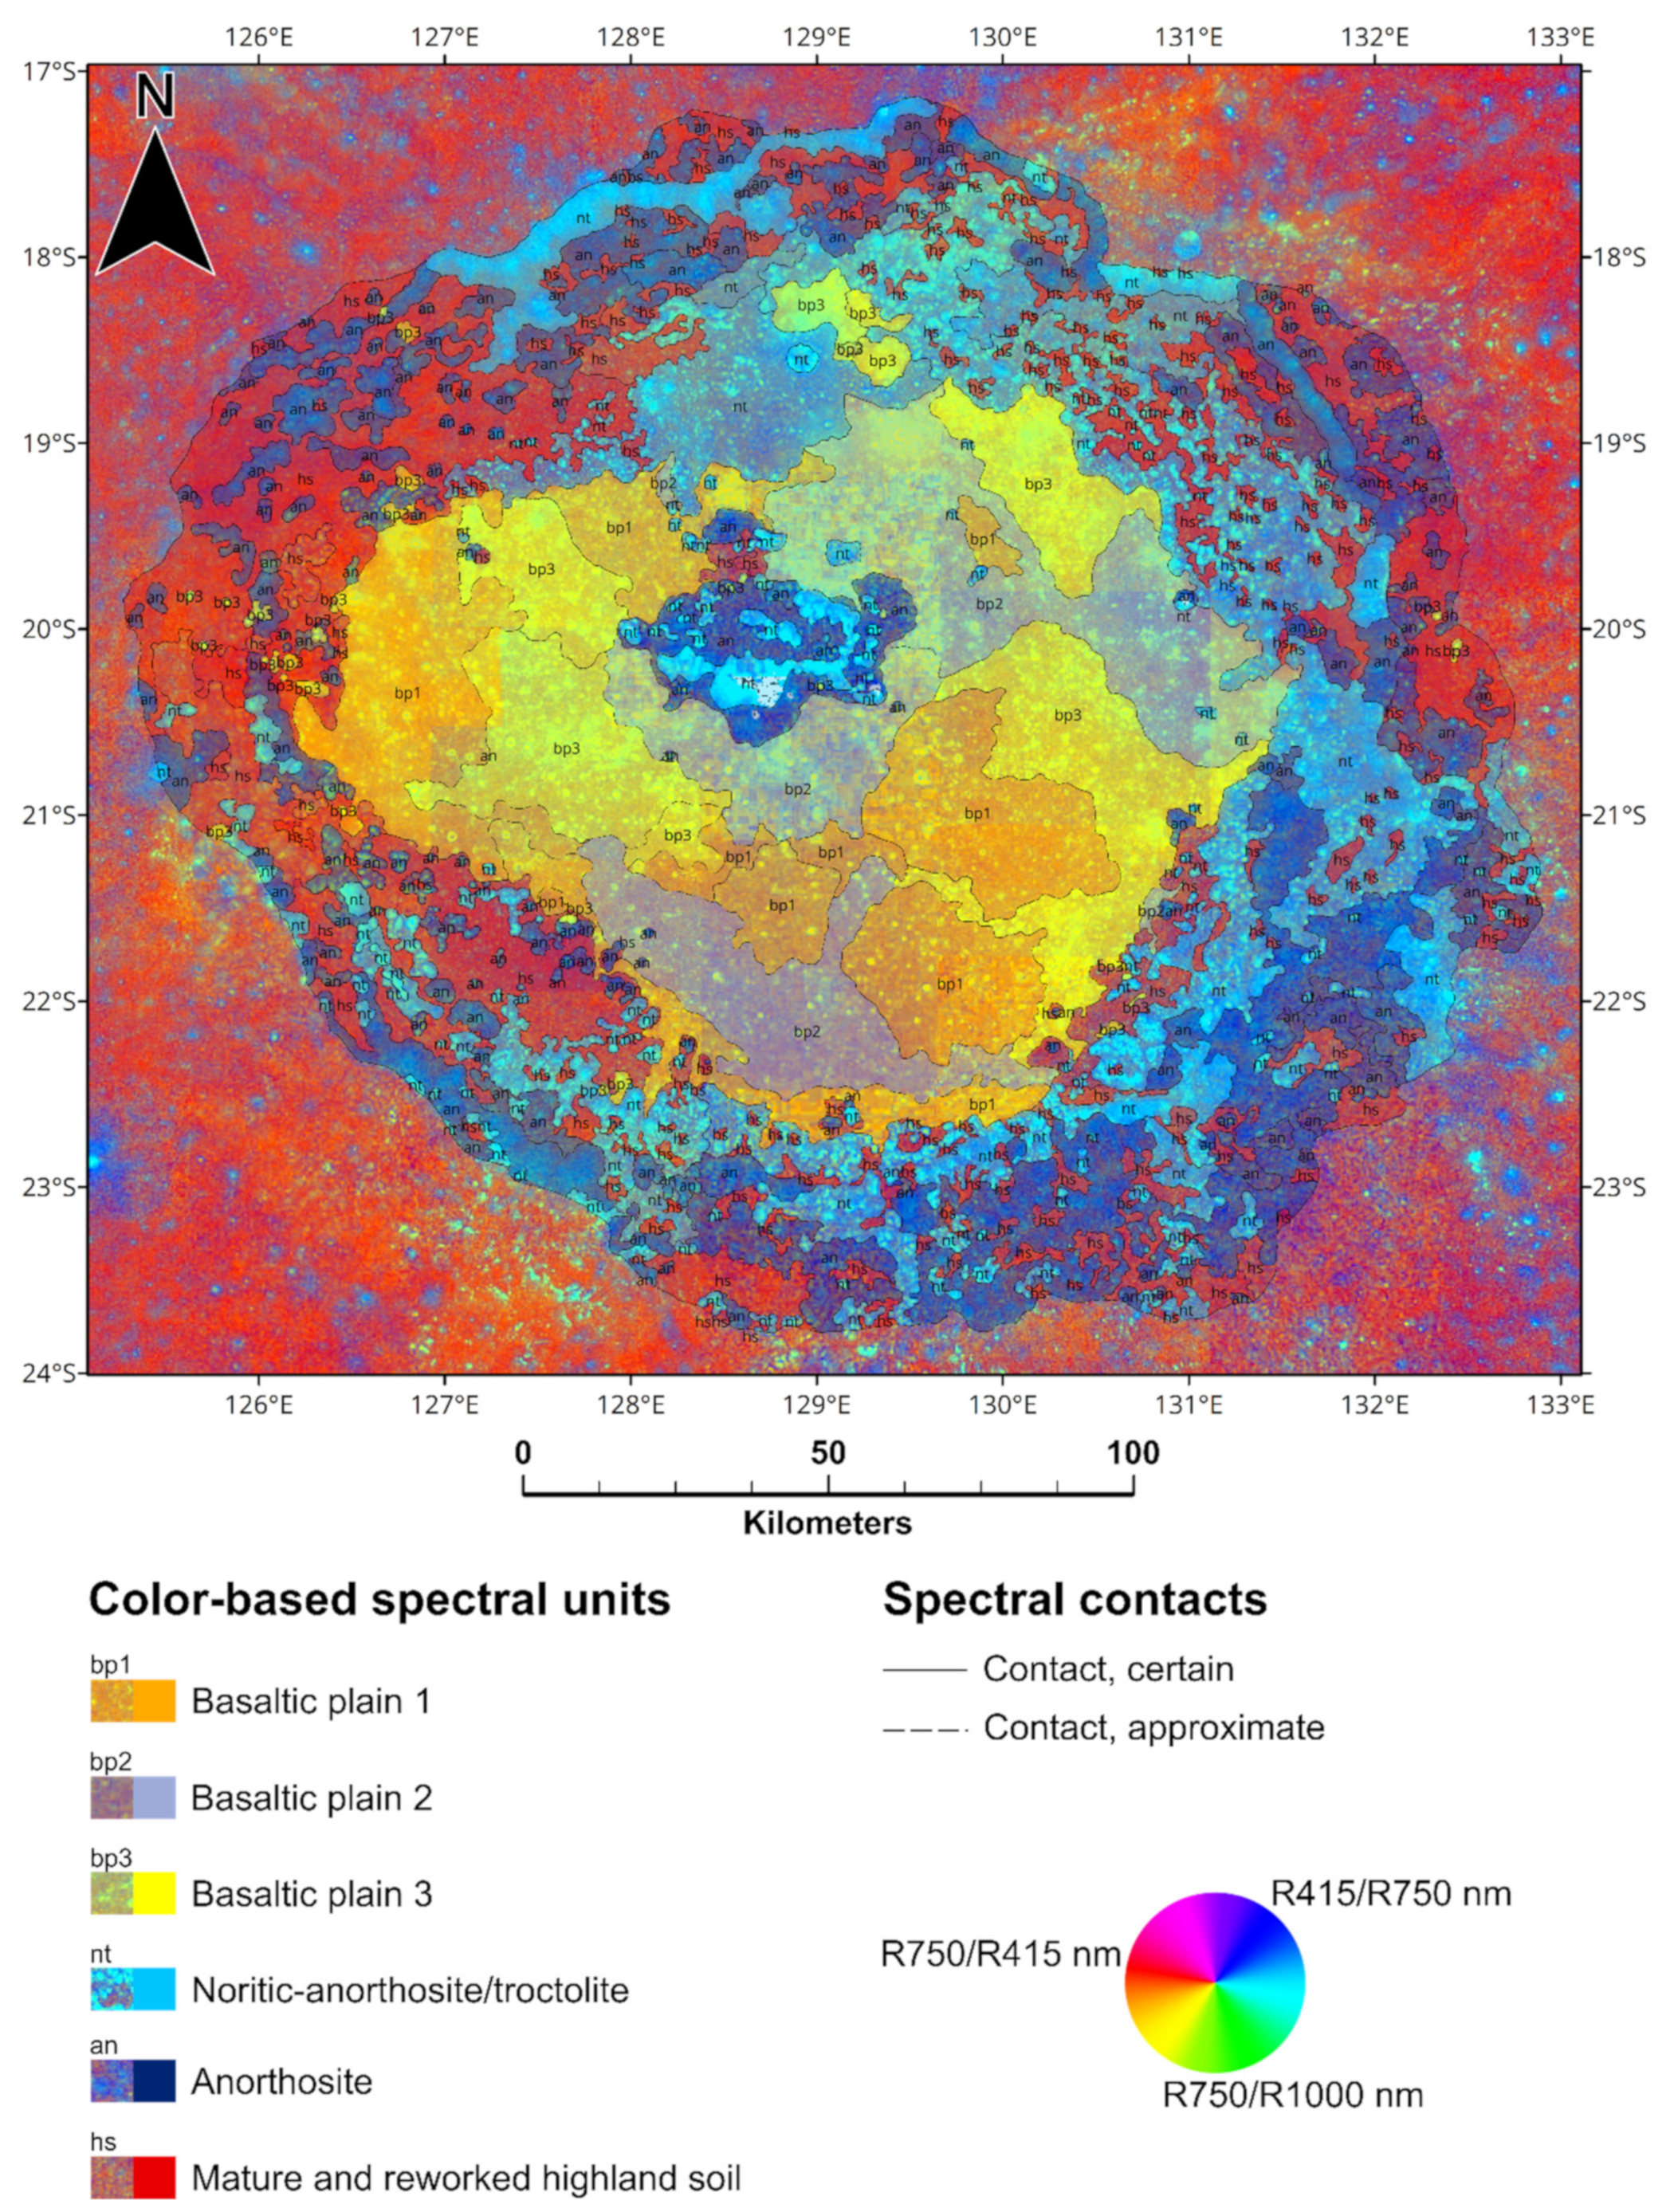
4.2. Color-Based Spectral Map and Age Determinations for the Crater Floor
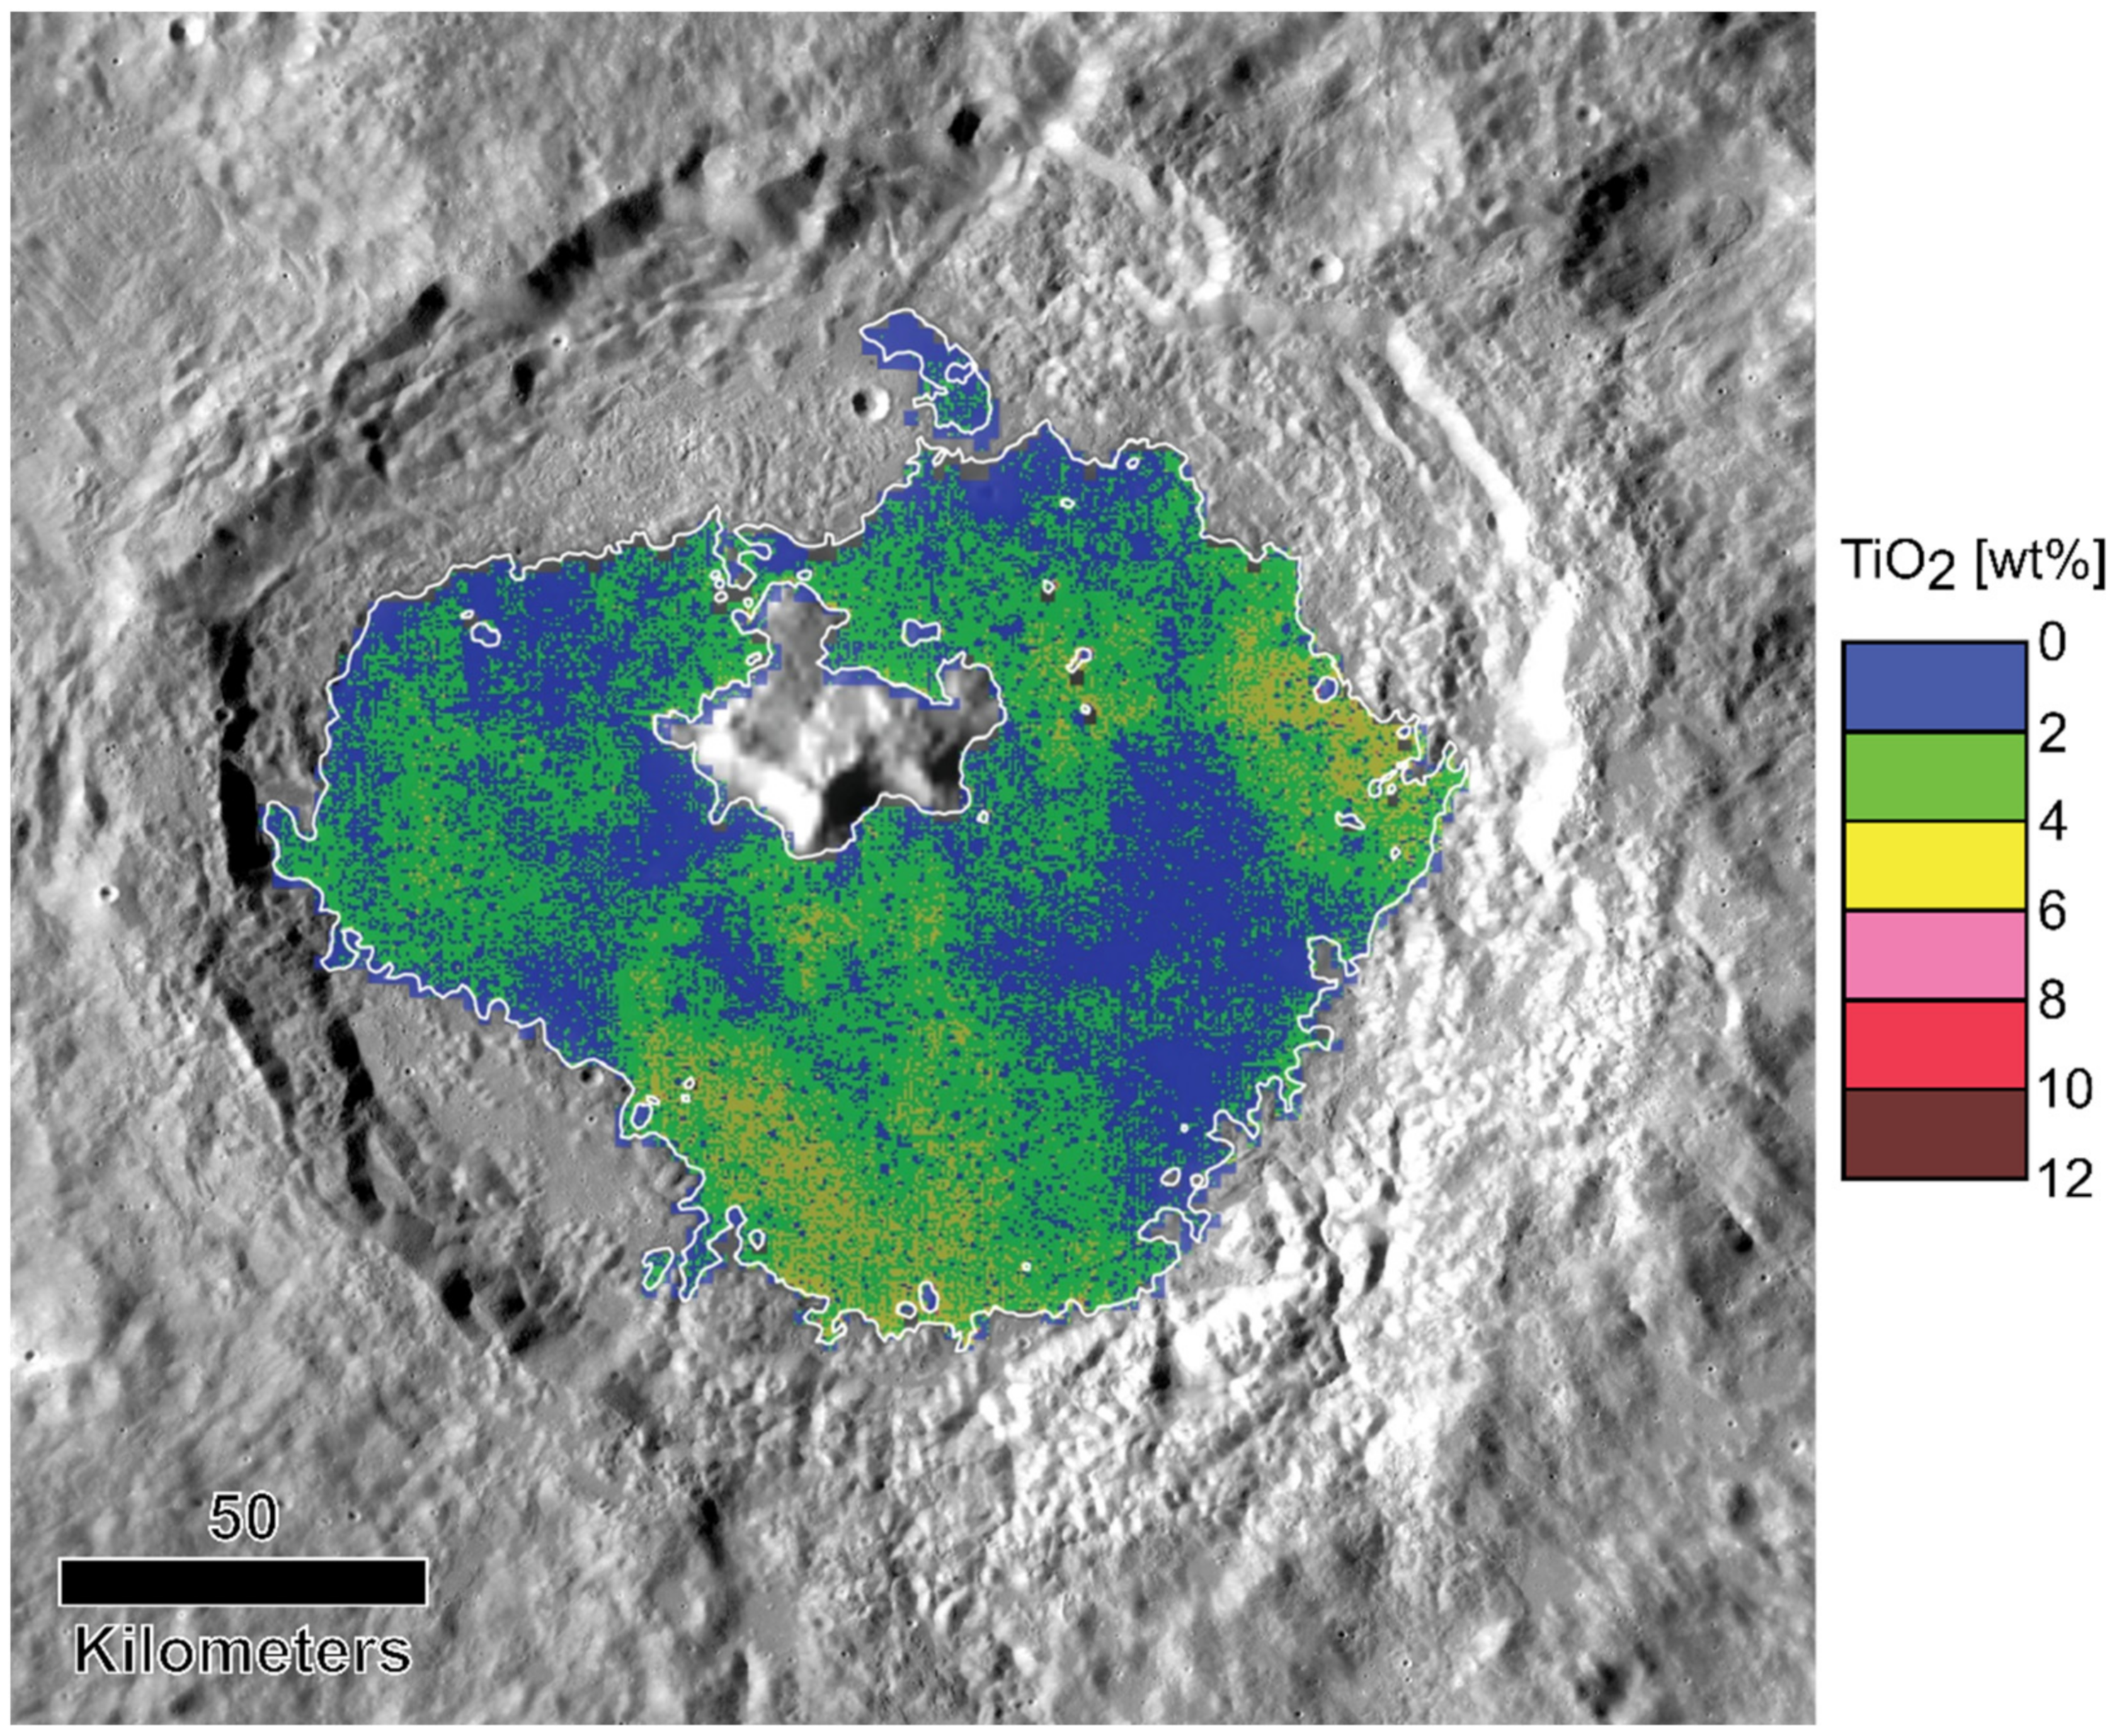
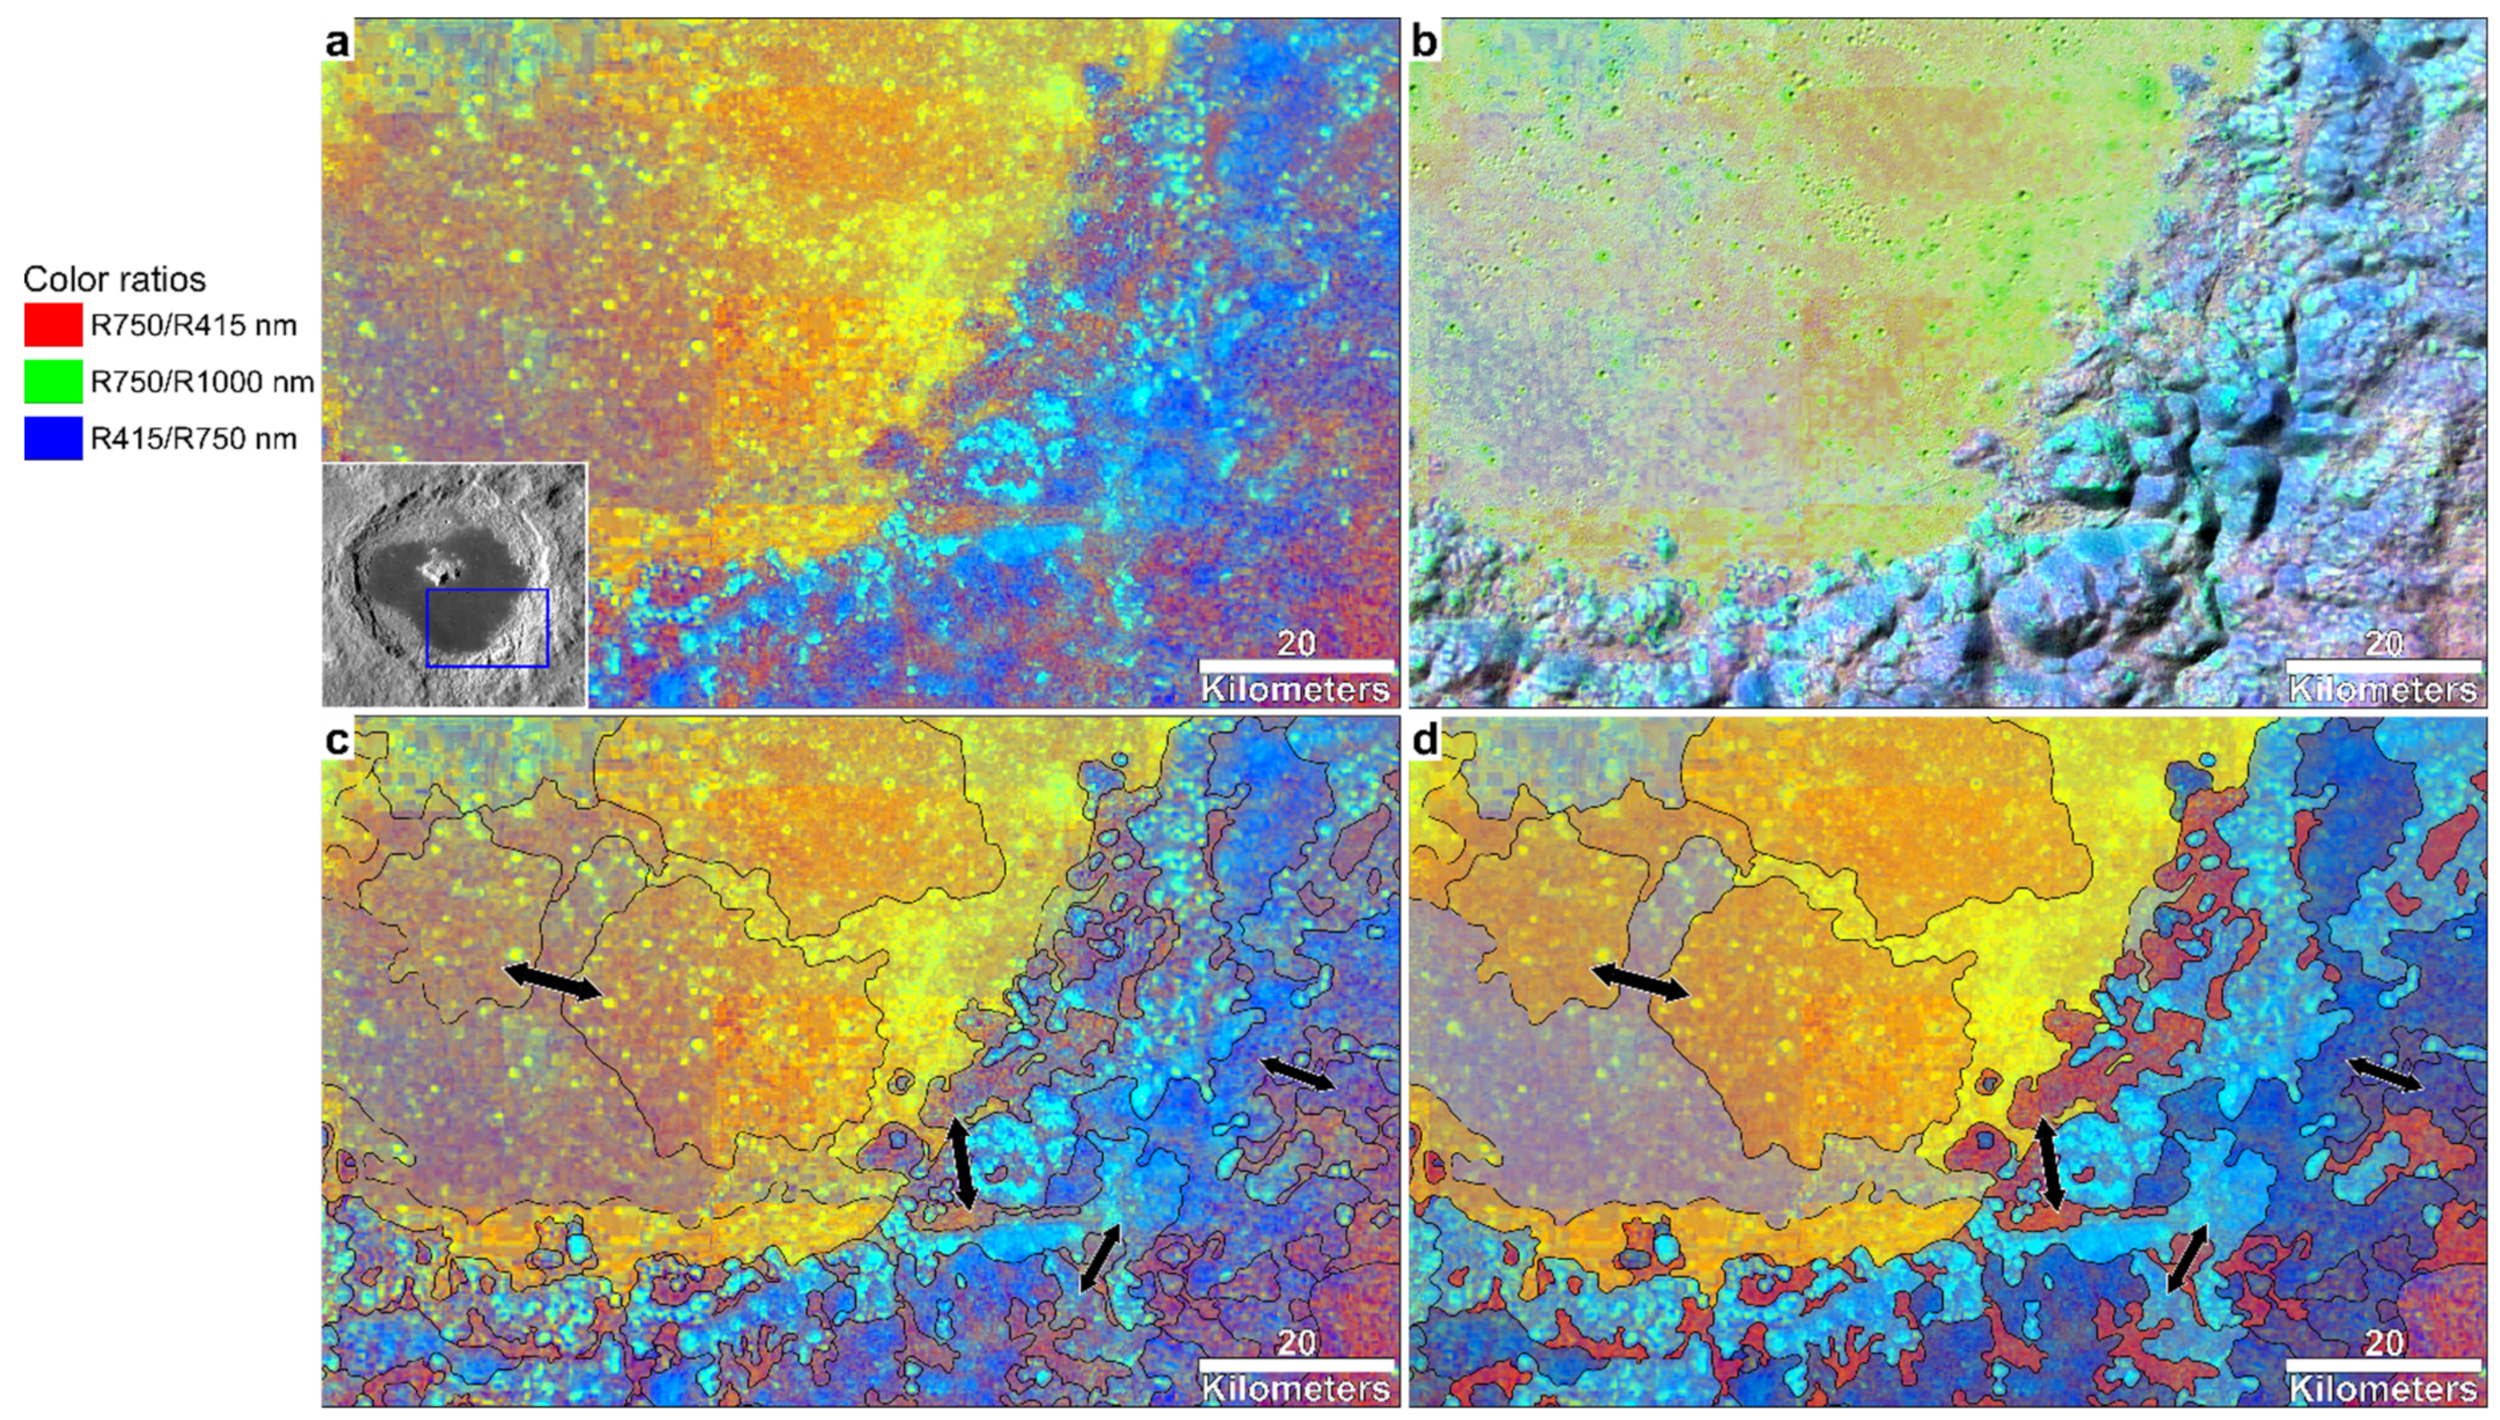
- bp1—basaltic plain 1: localized units with higher 750/415 nm (orange) ratio representative of younger events of lava emplacement, not necessarily indicating a change in composition; even if slight differences in composition cannot be excluded, the variation is more likely attributable to a lower degree of maturity due to a shorter exposition to space weathering.
- bp2—basaltic plain 2: localized units with a higher 415/750 nm (purple-blue) ratio, representative of intermediate events of lava emplacement, older than the bp1 unit and younger than the bp3 unit.
- bp3—basaltic plain 3: average ratios of 750/415 nm and 750/1000 nm (yellow) indicating a high concentration of weathered mafic minerals, indicative of the spectra of older lava emplacements; brighter hues are due to the excavation of fresher iron-bearing materials due to impacts subsequent to the emplacement of the mare infilling (Figure 8).
- nt—noritic-anorthosite/troctolite: average 750/1000 nm and 415/750 nm ratios (cyan) indicating lithologies with minor amounts of Fe-bearing minerals such as noritic anorthosite and troctolite [16].
- an—anorthosite: high 415/750 nm ratio (blue) indicating surfaces with a bright albedo related to a possibly mainly anorthositic composition [16].
- hs—mature and reworked highland soil: high 750/415 nm ratio (red) indicating highland soil with a high glass content due to the reworking of pre-mare materials and to the maturation of the surface materials, associated with prolonged exposure to space weathering.

5. Discussion
6. Conclusions
Supplementary Materials
Author Contributions
Funding
Data Availability Statement
Acknowledgments
Conflicts of Interest
Appendix A

| LROC-NAC Product ID | Mean Resolution (m/pixel) | Incidence Angle (°) |
|---|---|---|
| M146140171LE | 0.61 | 67.75 |
| M146140171RE | 0.61 | 67.85 |
| M1107453852LE | 0.88 | 59.16 |
| M103682642RE | 0.88 | 63.33 |
| M103682642LE | 0.89 | 63.19 |
| M165015246LE | 0.91 | 76.05 |
| M165015246RE | 0.91 | 76.14 |
| M192109542LE | 0.92 | 64.30 |
| M192109542RE | 0.93 | 64.45 |
| M1183978587RE | 0.95 | 62.56 |
| M1183978587LE | 0.96 | 62.41 |
| M1174571696LE | 0.96 | 56.82 |
| M1174571696RE | 0.96 | 56.96 |
| M1218112965LE | 1.12 | 78.49 |
| M1218112965RE | 1.12 | 78.61 |
| M1187511756RE | 1.12 | 81.09 |
| M1202818973LE | 1.17 | 81.30 |
| M1202818973RE | 1.17 | 81.42 |
| M1202797929LE | 1.24 | 81.46 |
| M1202797929RE | 1.24 | 81.59 |
| M1125111804LE | 1.30 | 86.44 |
| M1125111804RE | 1.30 | 86.57 |
| M1126296816LE | 1.30 | 81.65 |
| M1126296816RE | 1.30 | 81.78 |
| M180336439LE | 1.32 | 77.85 |
| M180336439RE | 1.32 | 77.98 |
| M1126303929LE | 1.33 | 82.37 |
| M1126303929RE | 1.34 | 82.52 |
| M1141585968LE | 1.34 | 83.28 |
| M1141585968RE | 1.34 | 83.42 |
| M1095658447LE | 1.35 | 79.75 |
| M1095665593LE | 1.41 | 80.39 |
| M1095665593RE | 1.42 | 80.54 |
| M1155723599LE | 1.44 | 86.48 |
| M1233391551RE | 1.44 | 78.10 |
| M1155723599RE | 1.45 | 86.63 |
| M1233391551LE | 1.46 | 77.95 |
| M1155716479RE | 1.53 | 87.27 |
References
- National Research Council. The Scientific Context for Exploration of the Moon; The National Academies Press: Washington, DC, USA, 2007; ISBN 978-0-309-10919-2. [Google Scholar]
- Tyrie, A. A description of the crater Tsiolkovsky on the lunar far side. Earth Moon Planets 1988, 42, 265–275. [Google Scholar] [CrossRef]
- Gornitz, V. Igneous vs impact processes for the origin of the mare lavas. Moon 1973, 6, 357–379. [Google Scholar] [CrossRef]
- Craddock, R.A.; Greeley, R. Thickness and Volume of Mare Deposits in Tsiolkovsky, Lunar Farside. In Proceedings of the 18th Lunar and Planetary Science Conference, The Woodlands, TX, USA, 16–20 March 1987; Lunar and Planetary Institute: Houston, TX, USA, 1988; pp. 331–337. [Google Scholar]
- Fortezzo, C.M.; Spudis, P.D.; Harrel, S.L. Release of the digital unified global geologic map of the Moon at 1:5,000,000-scale. In Proceedings of the 51st Lunar and Planetary Science Conference, The Woodlands, TX, USA, 16–20 March 2020; Lunar and Planetary Institute: Houston, TX, USA, 2020; p. 2760. [Google Scholar]
- Wilhelms, D.E.; McCauley, J.F. Geologic Map of the Near Side of the Moon; USGS Miscellaneous Investigations Series; USGS Publications Warehouse: Flagstaff, AZ, USA, 1971; Map I-703. [Google Scholar]
- Wilhelms, D.E.; El-Baz, F. Geologic Map of the East Side of the Moon; USGS Miscellaneous Investigations Series; USGS Publications Warehouse: Flagstaff, AZ, USA, 1977; Map I-948. [Google Scholar]
- Scott, D.H.; McCauley, J.F. Geologic Map of the West Side of the Moon; USGS Miscellaneous Investigations Series; USGS Publications Warehouse: Flagstaff, AZ, USA, 1977; Map I-1034. [Google Scholar]
- Stuart-Alexander, D.E. Geologic Map of the Central Far Side of the Moon; USGS Miscellaneous Investigations Series; USGS Publications Warehouse: Flagstaff, AZ, USA, 1978; Map I-1047. [Google Scholar]
- Lucchitta, B.K. Geologic Map of the North Side of the Moon; USGS Miscellaneous Investigations Series; USGS Publications Warehouse: Flagstaff, AZ, USA, 1978; Map I-1062. [Google Scholar]
- Wilhelms, D.E.; Howard, K.A.; Wilshire, H.G. Geologic Map of the South Side of the Moon; USGS Miscellaneous Investigations Series; USGS Publications Warehouse: Flagstaff, AZ, USA, 1979; Map I-1162. [Google Scholar]
- Morse, Z.R.; Osinski, G.R.; Tornabene, L.L.; Neish, C.D. Morphologic mapping and interpretation of ejecta deposits from Tsiolkovskiy crater. Meteorit. Planet. Sci. 2021, 56, 767–793. [Google Scholar] [CrossRef]
- Whitford-Stark, J.L. Geologic studies of the lunar far side crater Tsiolkovsky. In Proceedings of the 13th Lunar and Planetary Science Conference, The Woodlands, TX, USA, 15–19 March 1982; Lunar and Planetary Institute: Houston, TX, USA, 1982; pp. 861–862. [Google Scholar]
- Boyce, J.M.; Mouginis-Mark, P.; Robinson, M. The Tsiolkovskiy crater landslide, the moon: An LROC view. Icarus 2020, 337, 113464. [Google Scholar] [CrossRef]
- Schultz, P.H. Atmospheric effects on ejecta emplacement and crater formation on Venus from Magellan. J. Geophys. Res. 1992, 97, 16183–16248. [Google Scholar] [CrossRef]
- Pieters, C.M.; Tompkins, S. Tsiolkovsky crater: A window into crustal processes on the lunar farside. J. Geophys. Res. Planets 1999, 104, 21935–21949. [Google Scholar] [CrossRef]
- Wilbur, C.L. Volcano-tectonic history of Tsiolkovskij. In Proceedings of the 9th Lunar and Planetary Science Conference, The Woodlands, TX, USA, 13–17 March 1978; Lunar and Planetary Institute: Houston, TX, USA, 1978; pp. 1253–1254. [Google Scholar]
- Mouginis-Mark, P.J.; Boyce, J.M. Mare infilling of Tsiolkovsky crater, the Moon. In Proceedings of the Lunar and Planetary Science XLVIII, The Woodlands, TX, USA, 20–24 March 2017; Lunar and Planetary Institute: Houston, TX, USA, 2017; p. 1206. [Google Scholar]
- Lucey, P.G.; Blewett, D.T.; Taylor, G.J.; Hawke, B.R. Imaging of lunar surface maturity. J. Geophys. Res. 2000, 105, 20377–20386. [Google Scholar] [CrossRef]
- Heather, D.J.; Dunkin, S.K. Crustal stratigraphy of the Al-Khwarizmi-King/Tsiolkovsky-Stark region of the lunar farside as seen by Clementine. Planet Space Sci. 2002, 50, 1311–1321. [Google Scholar] [CrossRef]
- Ohtake, M.; Matsunaga, T.; Haruyama, J.; Yokota, Y.; Morota, T.; Honda, C.; Ogawa, Y.; Torii, M.; Miyamoto, H.; Arai, T.; et al. The global distribution of pure anorthosite on the Moon. Nature 2009, 461, 236–240. [Google Scholar] [CrossRef]
- Lemelin, M.; Lucey, P.G.; Song, E.; Taylor, G.J. Lunar central peak mineralogy and iron content using the Kaguya Multiband Imager: Reassessment of the compositional structure of the lunar crust. J. Geophys. Res. Planets 2015, 120, 869–887. [Google Scholar] [CrossRef]
- Pieters, C.M.; Tompkins, S. Anorthosite and olivine layers of the farside upper crust at Tsiolkovsky. In Proceedings of the 27th Lunar and Planetary Science Conference, The Woodlands, TX, USA, 18–22 March 1996; Lunar and Planetary Institute: Houston, TX, USA, 1996; pp. 1035–1036. [Google Scholar]
- Corley, L.M.; McGovern, P.J.; Kramer, G.Y.; Lemelin, M.; Trang, D.; Gillis-Davis, J.J.; Taylor, G.J.; Powell, K.E.; Kiefer, W.S.; Wieczorek, M.; et al. Olivine-bearing lithologies on the Moon: Constraints on origins and transport mechanisms from M3 spectroscopy, radiative transfer modeling, and GRAIL crustal thickness. Icarus 2018, 300, 287–304. [Google Scholar] [CrossRef]
- Pieters, C.M.; Tompkins, S.; Staid, M.I.; Fischer, E.M. The low-Ti basalts of Tsiolkovsky as seen by Clementine. In Proceedings of the 26th Lunar and Planetary Science Conference, The Woodlands, TX, USA, 13–17 March 1995; Lunar and Planetary Institute: Houston, TX, USA, 1995; pp. 1121–1122. [Google Scholar]
- Wilhelms, D.E. The Geologic History of the Moon, 1st ed.; U.S. Geological Survey Professional Paper; USGS Publications Warehouse: Flagstaff, AZ, USA, 1987; p. 302. [Google Scholar]
- Pasckert, J.H.; Hiesinger, H.; van der Bogert, C.H. Small-scale lunar farside volcanism. Icarus 2015, 257, 336–354. [Google Scholar] [CrossRef]
- Williams, J.-P.; Petro, N.E.; Greenhagen, B.T.; Neish, C. Inferred age of mare fill in Tsiolkovskiy crater: Constraints on the preservation of exterior impact melt deposits. In Proceedings of the 44th Lunar and Planetary Science Conference, The Woodlands, TX, USA, 18–22 March 2013; Lunar and Planetary Institute: Houston, TX, USA, 2013; p. 2756. [Google Scholar]
- Greenhagen, B.T.; Neish, C.D.; Williams, J.-P.; Cahill, J.T.S.; Ghent, R.R.; Hayne, P.O.; Lawrence, S.J.; Petro, N.E.; Bandfield, J.L. Origin of the anomalously rocky appearance of Tsiolkovskiy crater. Icarus 2016, 273, 237–247. [Google Scholar] [CrossRef]
- Robinson, M.S.; Brylow, S.M.; Tschimmel, M.; Humm, D.; Lawrence, S.J.; Thomas, P.C.; Denevi, B.W.; Bowman-Cisneros, E.; Zerr, J.; Ravine, M.A.; et al. Lunar reconnaissance orbiter camera (LROC) instrument overview. Space Sci. Rev. 2010, 150, 81–124. [Google Scholar] [CrossRef]
- Haruyama, J.; Matsunaga, T.; Ohtake, M.; Morota, T.; Honda, C.; Yokota, Y.; Torii, M.; Ogawa, Y. Global lunar-surface mapping experiment using the Lunar Imager/Spectrometer on SELENE. Earth Planets Sp. 2008, 60, 243–255. [Google Scholar] [CrossRef] [Green Version]
- Smith, D.E.; Zuber, M.T.; Jackson, G.B.; Cavanaugh, J.F.; Neumann, G.A.; Riris, H.; Sun, X.; Zellar, R.S.; Coltharp, C.; Connelly, J.; et al. The lunar orbiter laser altimeter investigation on the lunar reconnaissance orbiter mission. Space Sci. Rev. 2010, 150, 209–241. [Google Scholar] [CrossRef]
- Barker, M.K.; Mazarico, E.; Neumann, G.A.; Zuber, M.T.; Haruyama, J.; Smith, D.E. A new lunar digital elevation model from the Lunar Orbiter Laser Altimeter and SELENE Terrain Camera. Icarus 2016, 273, 346–355. [Google Scholar] [CrossRef] [Green Version]
- Tobler, W. Measuring spatial resolution. In Proceedings of the Land Resources Information Systems Conference, 1987. pp. 12–16. Available online: https://www.researchgate.net/profile/Waldo-Tobler/publication/291877360_Measuring_spatial_resolution/links/595ef94ba6fdccc9b17fe8ee/Measuring-spatial-resolution.pdf (accessed on 30 August 2021).
- Tanaka, K.L.; Skinner, J.A.; Hare, T.M. Planetary Geologic Mappers Handbook; USGS Astrogeology Science Center: Flagstaff, AZ, USA, 2011; p. 24. [Google Scholar]
- Kneissl, T.; van Gasselt, S.; Neukum, G. Map-projection-independent crater size-frequency determination in GIS environments—New software tool for ArcGIS. Planet. Space Sci. 2011, 59, 1243–1254. [Google Scholar] [CrossRef]
- Michael, G.G.; Neukum, G. Planetary surface dating from crater size-frequency distribution measurements: Partial resurfacing events and statistical age uncertainty. Earth Planet. Sci. Lett. 2010, 294, 223–229. [Google Scholar] [CrossRef]
- Michael, G.G.; Kneissl, T.; Neesemann, A. Planetary surface dating from crater size-frequency distribution measurements: Poisson timing analysis. Icarus 2016, 277, 279–285. [Google Scholar] [CrossRef]
- Neukum, G.; Ivanov, B.A.; Hartmann, W.K. Cratering records in the inner solar system in relation to the lunar reference system. Space Sci. Rev. 2001, 96, 55–86. [Google Scholar] [CrossRef]
- Michael, G.G.; Platz, T.; Kneissl, T.; Schmedemann, N. Planetary surface dating from crater size-frequency distribution measurements: Spatial randomness and clustering. Icarus 2012, 218, 169–177. [Google Scholar] [CrossRef]
- Pierazzo, E.; Melosh, H.J. Understanding oblique impacts from experiments, observations, and modeling. Annu. Rev. Earth Planet Sci. 2000, 28, 141–167. [Google Scholar] [CrossRef] [PubMed]
- Sato, H.; Robinson, M.S.; Lawrence, S.J.; Denevi, B.W.; Hapke, B.; Jolliff, B.L.; Hiesinger, H. Lunar mare TiO2 abundances estimated from UV/Vis reflectance. Icarus 2017, 296, 216–238. [Google Scholar] [CrossRef]


| Area Name | Area (km2) | No. of Standard Craters | No. of Marked Craters | Fit Diameter Range (m) | Relative Age (Ga) | Relative Age Errors (Ga) |
|---|---|---|---|---|---|---|
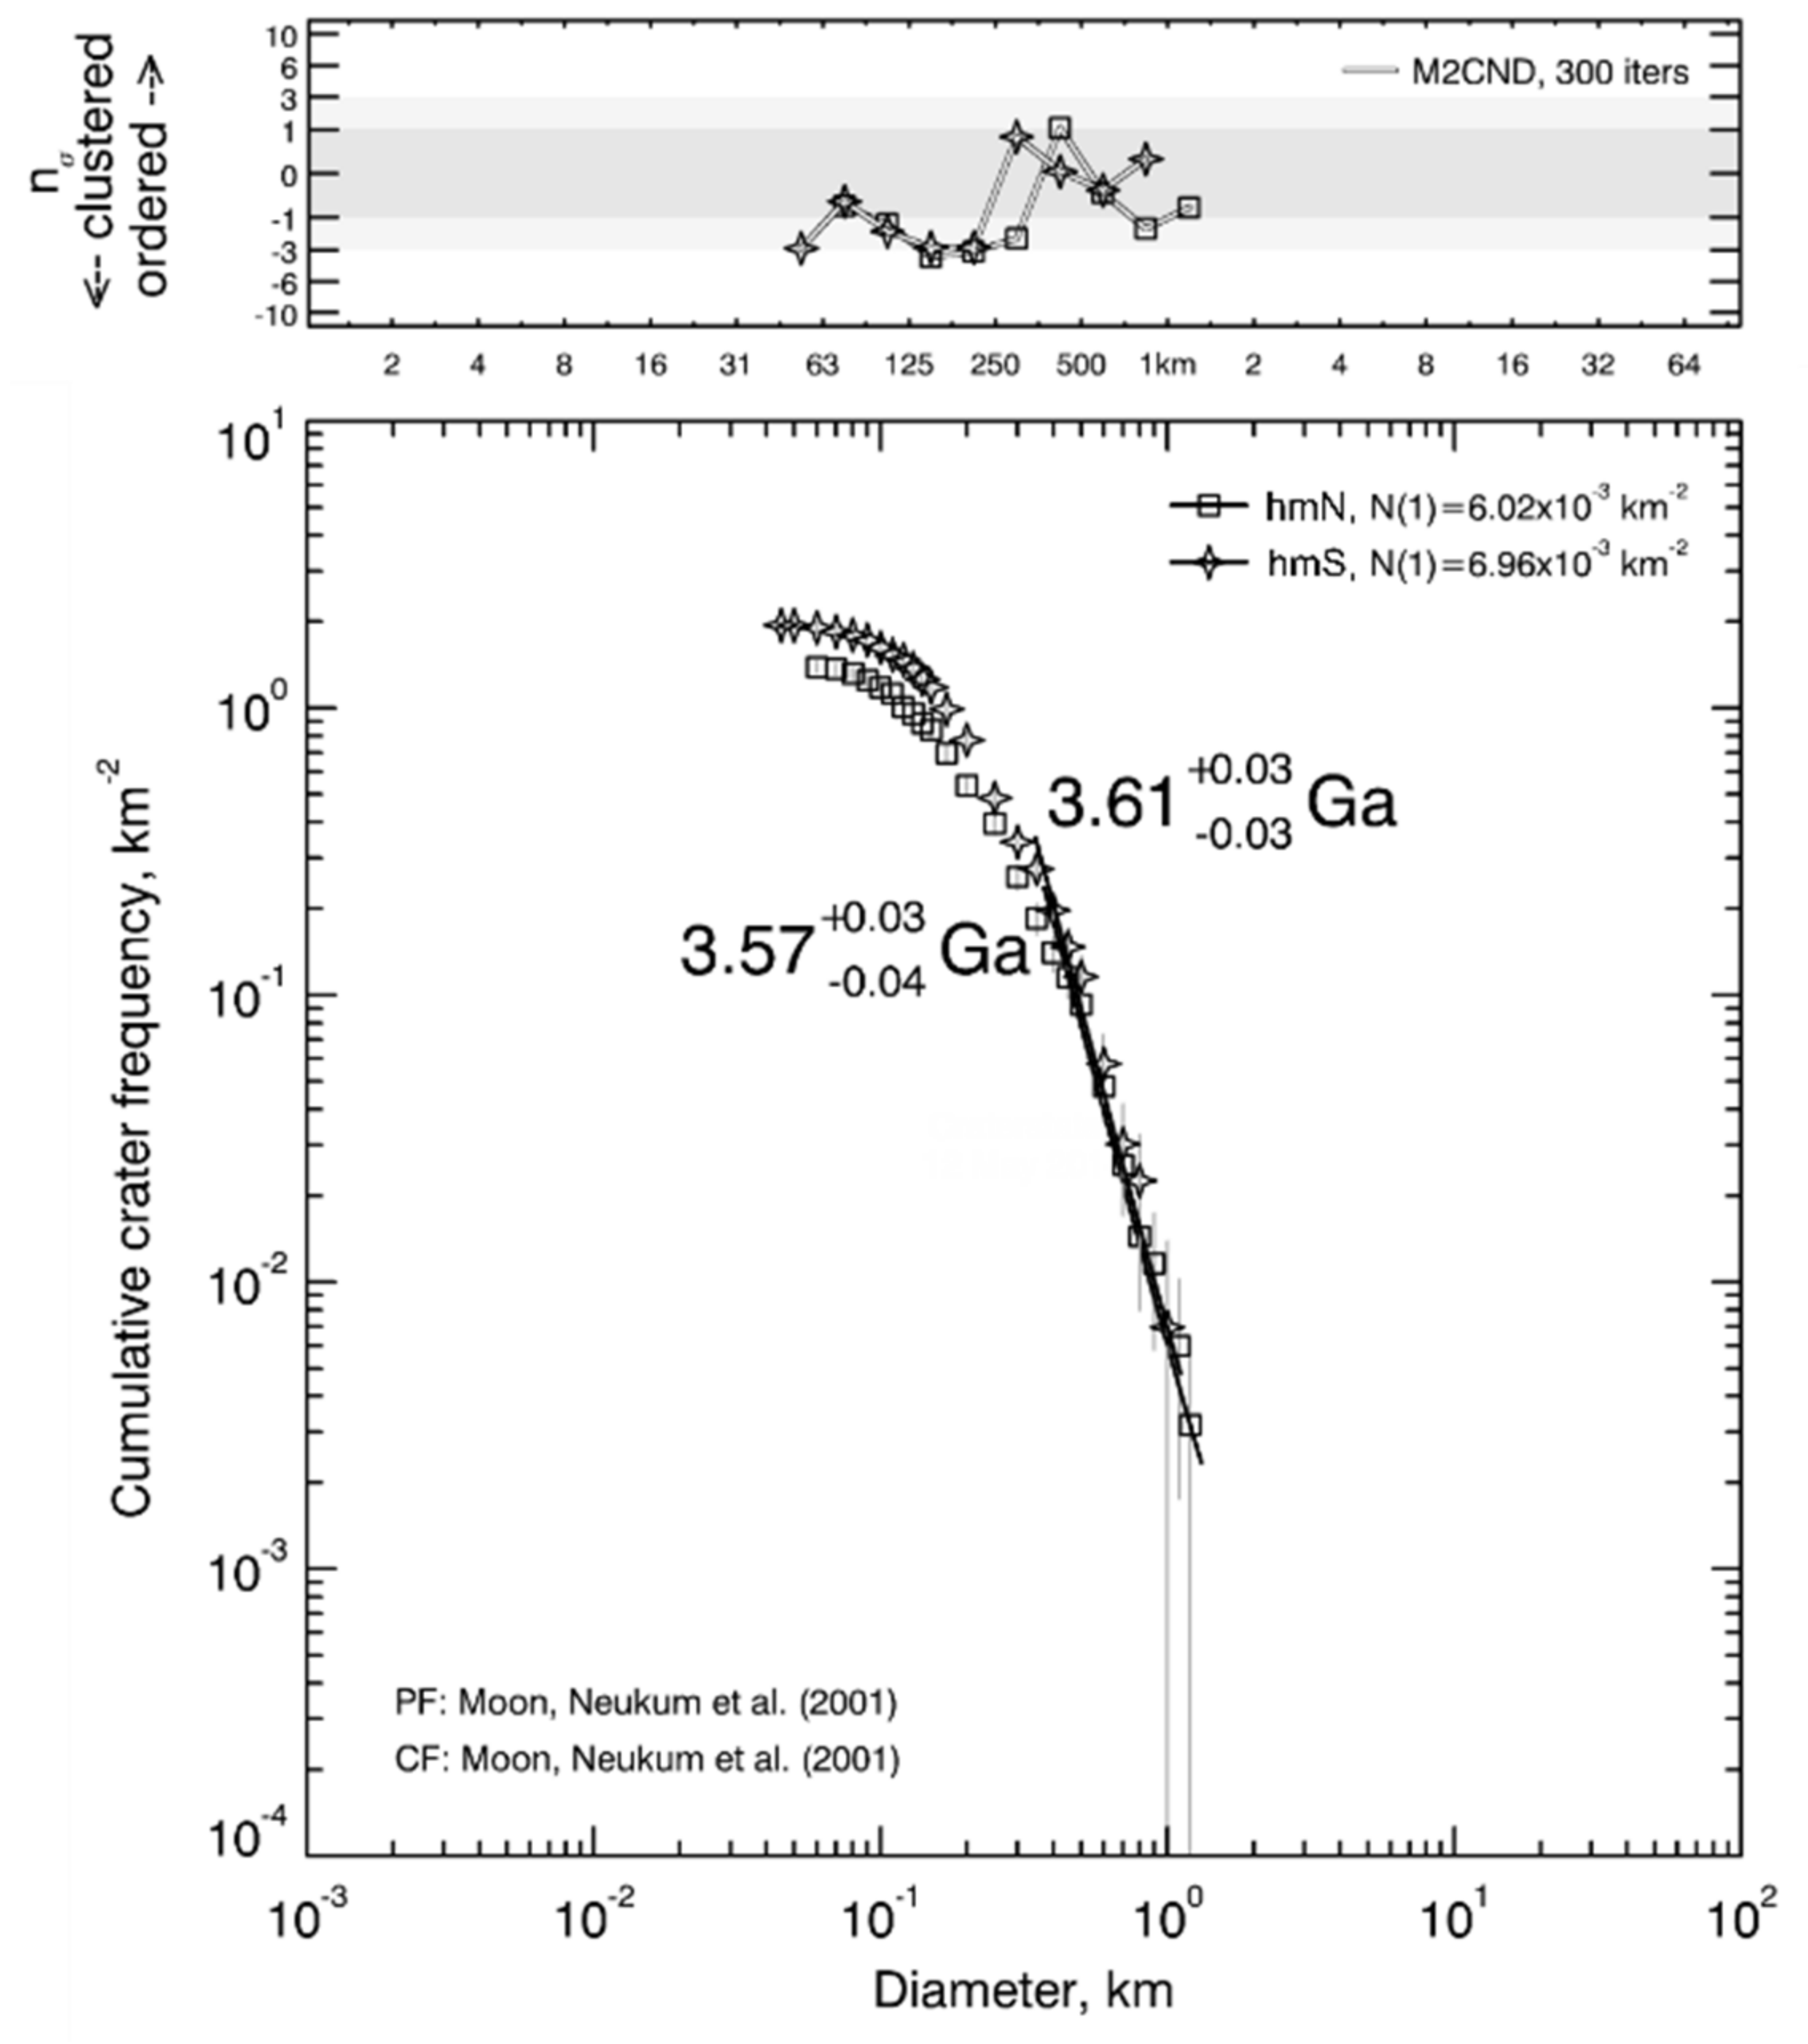
| hmN | 354.44 | 406 | 90 | 60–1300 | 3.57 | +0.03 −0.04 |
| hmS | 260.55 | 392 | 107 | 4–1100 | 3.61 | +0.03 −0.03 |
| T1 | 100.00 | 325 | 14 | 4–800 | 2.98 | +0.24 −0.44 |
| T2 | 99.30 | 413 | 32 | 4–800 | 2.97 | +0.18 −0.28 |
| T3 | 99.30 | 361 | 81 | 5–1000 | 2.88 | +0.15 −0.18 |
| P1 | 99.30 | 447 | 104 | 4–700 | 3.32 | +0.06 −0.09 |
| P2 | 99.99 | 460 | 175 | 4–700 | 3.47 | +0.03 −0.04 |
| P3 | 100.00 | 437 | 38 | 5–800 | 3.46 | +0.03 −0.04 |
| Y1 | 100.00 | 299 | 118 | 5–900 | 3.57 | +0.02 −0.02 |
| Y2 | 100.00 | 431 | 122 | 4–800 | 3.57 | +0.02 −0.02 |
Publisher’s Note: MDPI stays neutral with regard to jurisdictional claims in published maps and institutional affiliations. |
© 2021 by the authors. Licensee MDPI, Basel, Switzerland. This article is an open access article distributed under the terms and conditions of the Creative Commons Attribution (CC BY) license (https://creativecommons.org/licenses/by/4.0/).
Share and Cite
Tognon, G.; Pozzobon, R.; Massironi, M.; Ferrari, S. Geologic Mapping and Age Determinations of Tsiolkovskiy Crater. Remote Sens. 2021, 13, 3619. https://doi.org/10.3390/rs13183619
Tognon G, Pozzobon R, Massironi M, Ferrari S. Geologic Mapping and Age Determinations of Tsiolkovskiy Crater. Remote Sensing. 2021; 13(18):3619. https://doi.org/10.3390/rs13183619
Chicago/Turabian StyleTognon, Gloria, Riccardo Pozzobon, Matteo Massironi, and Sabrina Ferrari. 2021. "Geologic Mapping and Age Determinations of Tsiolkovskiy Crater" Remote Sensing 13, no. 18: 3619. https://doi.org/10.3390/rs13183619
APA StyleTognon, G., Pozzobon, R., Massironi, M., & Ferrari, S. (2021). Geologic Mapping and Age Determinations of Tsiolkovskiy Crater. Remote Sensing, 13(18), 3619. https://doi.org/10.3390/rs13183619