Abstract
Hydrological variable frequency analysis is a fundamental task for water resource management and water conservancy project design. Given the deficiencies of higher distribution features for the upper tail section of hydrological variable frequency curves and the corresponding safer resulting design of water conservancy projects utilizing the empirical frequency formula and Pearson type III function-based curve fitting method, the normal cloud transform algorithm-based model for hydrological variable frequency analysis was proposed through estimation of the sample empirical frequency by the normal cloud transform algorithm, and determining the cumulative probability distribution curve by overlapping calculation of multiple conceptual cloud distribution patterns, which is also the primary innovation of the paper. Its application result in northern Anhui province, China indicated that the varying trend of the cumulative probability distribution curve of annual precipitation derived from the proposed approach was basically consistent with the result obtained through the traditional empirical frequency formula. Furthermore, the upper tail section of the annual precipitation frequency curve derived from the cloud transform algorithm varied below the calculation result utilizing the traditional empirical frequency formula, which indicated that the annual precipitation frequency calculation result utilizing the cloud transform algorithm was more optimal compared to the results obtained by the traditional empirical frequency formula. Therefore, the proposed cloud transform algorithm-based model was reliable and effective for hydrological variable frequency analysis, which can be further applied in the related research field of hydrological process analysis.
1. Introduction
The distribution pattern of hydrological variables, which frequently consists of multiple certainty elements and stochastic factors, is the comprehensive outcome of numerous influencing factors, including meteorological climate, natural geography, human activities, etc. [1,2]. Thus, the distribution characteristic exploration of hydrological variables is known as an effective approach to reveal the response mechanism of various influencing factors on hydrological process evolution [3,4]. Meanwhile, as an important tool to describe the natural characteristics of hydrological process evolution from spatiotemporal variation perspectives based on hydrology, statistics, meteorology, and mathematical principles, hydrological variable frequency analysis primarily concentrates on the exploration of statistical rules of hydrological events and relationship description between hydrological variable distribution and corresponding designed frequency of water conservancy projects [3], and the related research results can provide a reasonable and scientific decision-making basis for the construction of water conservancy projects [5,6].
Overall, hydrological variable frequency analysis consists of research that includes sample selection and data verification, calculation of sample empirical frequency, selection of frequency distribution pattern, parameter estimation of frequency distribution function, verification of frequency distribution function, determination of designed results of the hydrological variable and corresponding uncertainty analysis, etc. [7,8,9], and the calculation of sample empirical frequency and determination of frequency distribution function are the key issues of hydrological variable frequency analysis. Generally, According to the Regulation for calculating design flood of water resources and hydropower projects in China, the hydrological variable frequency curve can be derived through the Pearson III function-based curve-fitting method. Specifically, (1) in terms of the determination of hydrological frequency distribution function, the actual frequency distribution function of a hydrological variable so far still cannot be obtained from the perspective of the hydrological evolution mechanism [7,10]. In practice, based on the selection of a certain type of frequency distribution function and parameter estimation through historical observed data series, the frequency distribution function of hydrological variables can be derived according to the fitting results of the empirical and theoretical frequency of observed historical samples when the curve-fitting error is acceptable, which essentially is an approximate determination approach of the hydrological variable frequency distribution function [7,11]. In particular, the curve-fitting error for the upper and lower tail sections (i.e., external extending parts) of the frequency curve cannot be neglected, because the top tail section of the hydrological frequency curve (corresponding to low occurring possibility) is always related to the occurrence of extreme hydro-meteorological events. (2) As for the calculation of sample empirical frequency of hydrology variables, the estimation results of sample empirical frequency would be different depending on the selection of frequency distribution function [4,11]. Therefore, the sample empirical frequency would be the primary factor that affects the frequency-curve-fitting error, except for the frequency distribution function and curve-fitting principles [12]. Since Hazen first proposed the empirical frequency formula in 1914, many types of calculation formulas of empirical frequency have been reported around the world [7,12]. Afterwards, a great number of works have been carried out focusing on the improvement of the empirical frequency calculation formula of hydrological variables; for instance, V.P. Singh proposed the parameter estimation method of frequency distribution curve, according to the principle of maximum entropy [13,14]. P. Xie constructed the calculation framework of hydrological frequency analysis for inconsistent annual runoff series affected by frequent human activities and climate change [4]. Y. Li summarized the latest research progress of hydrological frequency analysis and application prospects of the probability weighted method, layered Archimedes copulas function, and Bayesian theory in the field of hydrological frequency analysis [15]. M. Zhang proposed the maximum entropy-principle-based method to determine the residual probability distribution function of an annual runoff stochastic model, and recommended the simulation procedures of a pure random series of maximum entropy distribution through rejection method [10]. K. Qin and G. Y. Zhang obtained a frequency distribution curve of stochastic variables through vast scattered historical samples, and then testified the rationality of the frequency-curve-fitting results of stochastic variables [16,17].
To sum up, it could be revealed from the previous studies that the difference of empirical frequency estimation results calculated by different approaches is not obvious for the middle part of the frequency fitting curve, but is quite evident for both sides (especially the top tail section), which will undoubtedly lead to an inaccurate designing outcome of hydrological variables. Therefore, the normal cloud transform algorithm, which primarily concentrates on the quantitative description of the cognitive process of qualitative fuzzy concept by human intelligence, was innovatively introduced in the hydrological frequency analysis field in this study. Specifically, based on the obtained probability density curve of hydrological series through frequency histogram, firstly, the initial probability density curve was transformed into multiple normal cloud distribution patterns with different granularities; then, the probability density curve of hydrological variables was derived through overlaying and merging calculation of a different normal cloud distribution; and, finally, the framework of the normal cloud transform algorithm-based model (CTAM) for hydrological variable frequency analysis was proposed, which was further applied in the frequency-curve-fitting calculation of the annual precipitation variable from different hydrological stations in the northern Anhui province, China. The application results indicated that the frequency-curve-fitting result of annual precipitation in northern Anhui province based on the proposed CTAM model was basically consistent with the calculation result obtained through the traditional empirical frequency formula-based curve-fitting method (EFCF), and the design value of annual precipitation based on the CTAM method was more optimal and reasonable than the corresponding result derived from the EFCF method, especially for low cumulative frequency scenarios, which could provide rigorous basis for the validation of the availability and effectiveness of the proposed CTAM method.
2. Overview of Study Area and Data Collection
The study area is located in the northern Anhui province, which resides on the northern part of the mainstream Huaihe River, with a total area of 42,200 km2. As shown in Figure 1, it is also located on the south borders of Shandong, Henan, and Jiangsu provinces, which are within the hinterland of the central economic zone of China. The drought-affected area in this region is approximately 53% of the total provincial arable land area [18,19,20]. Meanwhile, the northern Anhui province lies in the transitional zone of the subtropical zone and warm temperate zone, with obvious transitional climate characteristics. The southeast wind prevails in spring and summer, and the climate is warm and humid; meanwhile, the northwest wind prevails in autumn and winter, and the climate is cold and dry. The annual average precipitation in this region is about 850 mm. The seasonal allocation and temporal distribution of precipitation vary significantly due to the influence of global climate change, which leads to the alternation of cold and warm seasons and the occurrence of drought disasters more frequently as well in the northern Anhui province.
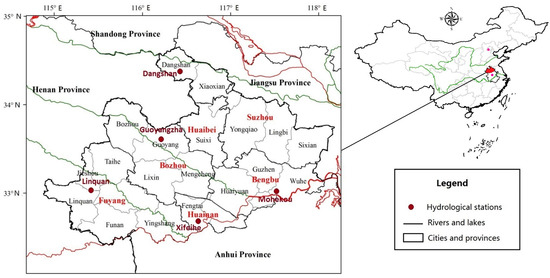
Figure 1.
Distribution of regions and observation sites in northern Anhui province, China.
In addition, the historical annual precipitation data series over the period from 1954 to 2010 of the five hydrological stations in the northern Anhui province (Linquan, Guoyangzha, Dangshan, Xifeihezha, and Mohekou) was downloaded from National Meteorological Information Center, which was also employed to further testify the feasibility and effectiveness of the proposed cloud transform algorithm-based model (CTAM) for hydrological variable frequency analysis.
3. Methodologies
3.1. Cloud Model and Cloud Transform Algorithm
The cloud model, proposed by Chinese scholar D.Y. Li in 1995, is an effective mathematical cognitive tool for the exploration of uncertain transformation mechanisms from a qualitative concept to its quantitative expression, utilizing fuzzy mathematics and probability statistics theories [21]. The cloud model can combine the randomness of a variable sample with the fuzziness of concept recognition, and then realize the natural transformation from a qualitative concept to its quantitative expression [21]. The definition of cloud model can be explained as follows [21,22].
Supposing U to be a universal set denoted by precise sample data and C to be the qualitative concept related to U, if quantitative value x (x ∊ U) is a random sample of the concept C and satisfies x~N (Ex, En’2), En’~N (En, He2), then the membership degree of quantitative value x belonging to concept C is defined as the certainty degree, as follows:
where the distribution of variable x in universal set U is defined as normal cloud, which can be denoted as C (Ex, En, He), and each data point (x, μ(x)) is called cloud drop. Meanwhile, the distribution characteristics of the cloud model are described by three cloud parameters, average Ex is the distribution center of qualitative concept C, which can best represent the properties of the concept C, entropy En is used to represent the fuzziness of concept C, reflecting the range of sample values accepted by concept C, and hyper-entropy He represents the uncertainty of entropy En, revealing the concentration of samples under certain deviation and making cloud drops uniformly distributed on both sides [21,23,24].
As a significant approach of probability statistics, the innovation of Gauss transformation is dividing the probability density function of a random variable into a multiple Gauss distribution, which could provide realization of ideas for the division and overlay of the multi-granularity concept [24]. By statistical transformation using mathematical principles, the cloud transform algorithm can be applied to represent the distribution features of scattered sample series through several cloud distribution patterns [25,26,27]. It is always necessary to describe the qualitative concept from different perspectives; human intelligence could realize logical reasoning from different granularities, and promote the improvement of concept cognition level from lower granularity to higher granularity [24,28,29]. Therefore, the cloud transform process can be essentially deemed as gradual recognition and description of the concept by human intelligence from the actual sample distribution universe [23]. It has been theoretically verified that the probability density function of a hydrological variable can be divided into several normal distributions [7,23,30]. Therefore, the probability density function of a hydrological variable could be described with the combination of multiple normal cloud distribution, denoted as Ci (Exi, Eni, Hei), and each cloud distribution represents a certain discrete qualitative concept [21,24]. Thus, the process of the cloud transform algorithm can be represented as follows:
where g(x) denotes the probability density function of variable x, fi(x) represents the expectation function of scattered normal cloud distribution, corresponding to the qualitative concept of different granularities, i and n denote the serial and total number of scattered normal cloud distribution patterns, ai represents the amplitude coefficient of ith scattered cloud distribution, and δ(x) is the fitting error function, which can be obtained through iterative calculation using the characteristic parameters of scattered cloud distribution [23,24,26]. From the perspective of data mining, the cloud transform calculation can be considered as a gradual extraction process of a more refined concept from the actual sample distribution of a certain attribution of the rough concept. Furthermore, for a certain hydrological variable, the contribution of samples corresponding to a higher peak value of the probability density curve of qualitative concept is more significant than that of the samples corresponding to a lower peak value. Therefore, firstly, the first local maximum value of the probability density curve was considered as the qualitative concept center (which is the average of the normal cloud model). Secondly, samples corresponding to the qualitative concept center were excluded from the original probability density curve, and the next local maximum value could be obtained from the probability density curve derived from the rest of the samples, which could be deemed as the center of the next qualitative concept. Thirdly, the above steps were repeated until the occurring probability of the rest of the samples decreased below a certain threshold value, and, finally the exploration process of the cloud transform algorithm for qualitative concept recognition from the original sample distribution was accomplished [16,17,23]. In the next section of the manuscript, taking the cumulative probability distribution frequency curve fitting of annual precipitation as an example, the calculation process of the cloud transform algorithm is more explicitly explained.
3.2. Calculation Procedures of the CTAM Method for Hydrological Variable Frequency Analysis
Considering the deficiencies of the Pearson type III function-based approach for hydrological frequency analysis and disagreement of different estimation formulas of sample empirical frequency, the CTAM model for annual precipitation frequency-curve-fitting analysis was recommended in this manuscript. More specifically, the realization procedures of the CTAM model for the cumulated distribution frequency-curve-fitting of annual precipitation could be explained as follows [17,23]:
Step 1: Determination of the probability density function g(x) of annual precipitation. Firstly, the observed historical annual precipitation series was sorted from highest to lowest, and the actual distribution interval could be divided into several subintervals with constant step ΔP. Then, the average probability density of each subinterval was obtained through frequency histogram of annual precipitation series, which varied more and more closely to the median probability density when the sample capacity increased and calculation step decreased gradually. Finally, the probability density frequency curve of annual precipitation, denoted as g(x), could be obtained using the median series of different subintervals as the X-axis and corresponding average probability density as the Y-axis.
Step 2: Determination of scattered conceptual cloud distribution of annual precipitation based on the cloud transform algorithm. Firstly, the peak of the probability density frequency curve of annual precipitation g(x) was defined as the center of current scattered conceptual cloud, and the central samples corresponding to the peak value as the average Exi (i was the number of conceptual cloud, i = 1~n) of the current conceptual cloud. Then, starting from the average Exi of the first conceptual cloud distribution, the amplitude coefficient ai of sample variation between the first maximum and closest local minimum on both sides could be determined, and the sample distribution belonging to the current conceptual cloud could be obtained as well when the amplitude coefficient ai was greater than a certain threshold value σ1, otherwise, the local minimum value was updated until the amplitude coefficient ai was greater than threshold value σ1. Finally, the normal backward cloud algorithm without certainty degree could be applied to determine the entropy Eni and hyper-entropy Hei for each scattered conceptual cloud [21,24], by which the corresponding expectation curve could be considered as the probability density function fi(x) of each conceptual cloud [17,24,31].
Step 4: Overlapping calculation of the normal conceptual cloud for annual precipitation probability density function. As indicated from step 1 to step 3, it was evident that numerous computations and adjustments were needed during the determination of a different scattered conceptual cloud and its corresponding probability density function. In addition, through the adjustment of entropy Eni and hyper-entropy Hei for each scattered conceptual cloud, the probability density function curve g(x) of annual precipitation could be obtained when the curve-fitting error of overlapping calculation was lower than a certain threshold value σ2; the overlapping calculation formula of the conceptual cloud could be denoted as follows [24]:
Step 5: Cumulative probability distribution function-curve-fitting analysis of annual precipitation. Theoretically, the integral function form of the probability density function g(x) of annual precipitation is the cumulative probability distribution function. In practice, the cumulative probability distribution function of annual precipitation could be determined according to the frequency-curve-fitting method based on the Pearson type III function through calculation of the empirical frequency of reselected samples through the integral function of probability density function g(x).
Among the above steps, it was crucial for the adjustment of the entropy value of the different conceptual cloud, which could be accomplished by applying a heuristic method [17,32,33]. More explicitly, based on the determination for the average Exi of the current conceptual cloud, the first local minimum value was selected from both the right and left side of median average Exi, and then the amplitude coefficient between the central sample corresponding to the median average Exi and the sample relating to the selected local minimum was also calculated. If the amplitude coefficient was greater than a certain threshold σ1, then the variation range, denoted as Exi, responding to the local minimum value that was closer to the median average value Exi could be considered as the distribution range of current cloud drops, and the samples varying within the interval of [Exi − Exi’, Exi + Exi’] could be considered as the research universe of the current conceptual cloud, and the related entropy Eni and hyper-entropy Hei could be determined using the normal backward cloud algorithm without certainty degree [16,17]. Meanwhile, the parameters of entropy Eni and hyper-entropy Hei also need to be adjusted when the curve-fitting error of the overlapping calculation for the different conceptual cloud was greater than a certain threshold value σ, and the detailed adjusting principles of entropy can be referred from [16,17,21].
4. Results and Discussion
In this section, the proposed CTAM method was further applied in hydrological frequency-curve-fitting analysis of the annual precipitation variable of the five hydrological stations in the northern Anhui province. To be more specific, taking the Guoyangzha station as an example, firstly, the varying range of annual precipitation from 1954 to 2010 was divided into 15 subintervals, with the calculating step of 80 mm, and the histogram of annual precipitation variation was drawn and the average probability density corresponding to each subinterval was determined by counting the number of years with the annual precipitation varying within each subinterval. Then, the probability density curve of historical annual precipitation series was obtained using the median of each subinterval as the X-axis and the average probability density corresponding to each subinterval as the Y-axis. Finally, the derived initial probability density curve of annual precipitation was divided into five normal cloud distribution patterns with different granularities utilizing the cloud transform algorithm. Similarly, the varying ranges of annual precipitation from 1954 to 2010 in Dangshan, Linquan, Mohekou, and Xifeihezha stations were divided into 13, 12, 14, and 12 subintervals, with the calculating steps of 80 mm, 115 mm, 80 mm, and 85 mm, respectively, and the derived probability density curves of annual precipitation corresponding to different stations were divided into 5, 6, 7, and 8 normal cloud distribution patterns. The characteristic parameters and amplitude coefficients of the different cloud distribution patterns in different hydrological stations in northern Anhui province are given in Table 1.

Table 1.
Cloud characteristics of normal conceptual clouds in northern Anhui province, China.
Secondly, the normal cloud-distribution-based conceptual overlaying principle was employed to conduct the conceptual merging calculation of the normal cloud distribution, and then the probability density function curve of annual precipitation for different stations was derived (as shown in Figure 2), by which the ultimate empirical frequency of historical annual precipitation data series for different hydrological stations in northern Anhui province was determined through integral computation. In addition, the correlation coefficient of empirical frequency of historical annual precipitation data series from 1954 to 2011 of the five hydrological stations in northern Anhui province, derived from the traditional empirical frequency formula and cloud transform algorithm, respectively, was above 0.98, which indicated that the empirical frequency series of annual precipitation calculated by the two methods was consistent, and the cloud transform algorithm was also suitable for the determination of the empirical frequency of hydrological variables.
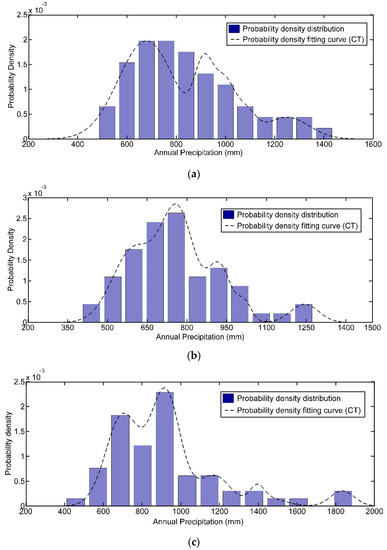
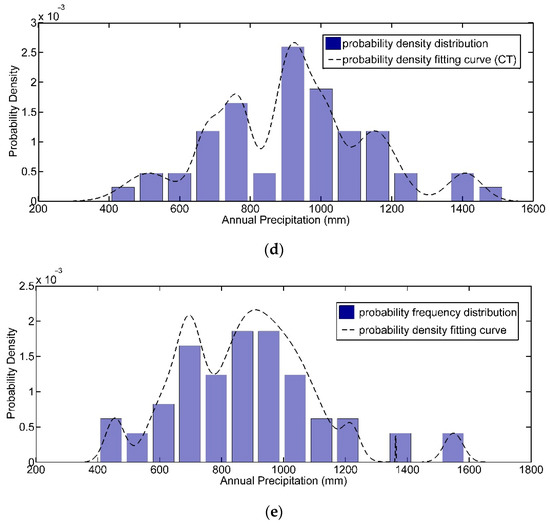
Figure 2.
Distribution of probability density fitting curve of annual precipitation in north Anhui province, China. (a) Guoyangzha Station; (b) Dangshan Station; (c) Linquan Station; (d) Mohekou Station; and (e) Xifeihezha Station.
Finally, the Pearson type III function-based curve-fitting method was applied to determine the cumulative probability distribution frequency curve of annual precipitation, based on the historical empirical frequency determined by cloud transform algorithm from 1954 to 2010 of Guoyangzha, Dangshan, Linquan, Mohekou, and Xifeihezha hydrological stations. The statistical parameters of the cumulative probability distribution frequency curve of annual precipitation, determined by both the traditional empirical frequency formula and cloud transform algorithm, respectively, are shown in Table 2, and the trend of the cumulative probability distribution frequency curve of annual precipitation determined by two approaches is indicated in Figure 3 as well.
Table 2.
Statistical parameters of the annual precipitation frequency curve in northern Anhui province, China.
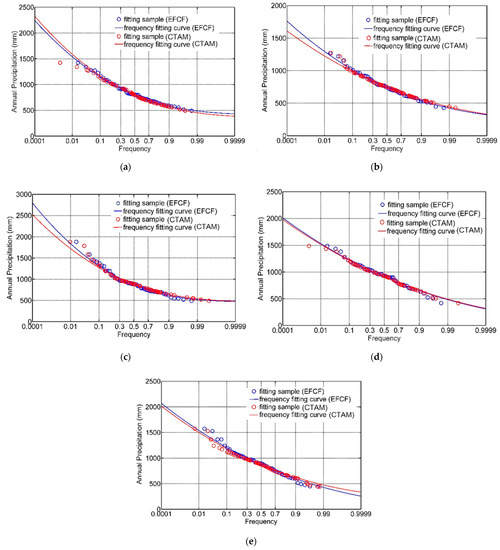
Figure 3.
Frequency distribution fitting curve of annual precipitation in northern Anhui province, China. (a) Guoyangzha Station; (b) Dangshan Station; (c) Linquan Station; (d) Mohekou Station; and (e) Xifeihezha Station.
It can be revealed from Table 2 and Figure 3 that (1) the varying trend of the cumulative probability distribution frequency curve of annual precipitation derived from the traditional empirical frequency formula and cloud transform algorithm, respectively, had better consistency for most of the five hydrological stations in northern Anhui province. (2) Except for the Guoyangzha station, the upper tail section (i.e., when the cumulative frequency was lower than 0.2) of the cumulative probability distribution frequency curve of annual precipitation derived from the cloud transform algorithm varied below the corresponding frequency curve derived from the traditional empirical frequency formula, which was opposite to the varying trend of the lower tail section (i.e., when the cumulative frequency was higher than 0.9) of the cumulative probability distribution frequency curve of annual precipitation, and the fitting value of annual precipitation determined by the two approaches when the cumulative frequency varied within the interval of (0.2, 0.9) was almost uniform, which indicated that the CTAM model for hydrological frequency analysis was capable of avoiding the shortage that the upper tail section of the frequency curve and the corresponding designed value of hydrological series were higher when the cumulative frequency varied lower. Therefore, it was evident that the hydrological frequency analysis result utilizing the peak value principle-based cloud transform algorithm was more reasonable, especially for the two varying tails of the cumulative probability distribution frequency curve, and further discussion for the application feasibility of the cloud transform algorithm in hydrological frequency analysis was carried out in terms of the error of frequency-curve-fitting calculation and frequency analysis of typical returning period in the next section of the manuscript.
4.1. Fitting Error Analysis of Historical Samples
To further testify the feasibility for the application of peak value theory in the field of hydrological frequency analysis, the index of cumulated relative fitting error (CRFE) [11,30], which reveals the cumulated error values of frequency curve fitting analysis, was employed to comparatively analyze the differences of cumulative probability distribution calculation results of the annual precipitation series of the five hydrological stations in northern Anhui province utilizing the traditional empirical frequency formula and CTAM method, respectively, and the CRFE index value and corresponding varying trend of the frequency-curve-fitting calculation of annual precipitation in different hydrological stations utilizing the two approaches are indicated in Table 3.
Table 3.
Cumulated relative fitting error (CRFE) of annual precipitation in northern Anhui province, China.
It can be revealed from Table 3 that, (1) for the frequency-curve-fitting calculation employing the peak value theory-based cloud transform algorithm, the CRFE index value of cumulative probability distribution frequency analysis of annual precipitation in Dangshan station was the highest, at 0.978128, the CRFE index value of the curve-fitting calculation in Guoyangzha station was the lowest, at 0.954421, and the varying trend of the CRFE index utilizing the cloud transform algorithm was consistent with the corresponding trend of the CRFE index employing the traditional empirical frequency formula. (2) The average of CRFE index for cumulative probability distribution frequency analysis of annual precipitation for different stations in northern Anhui province employing the cloud transform algorithm and traditional empirical frequency formula were 0.969176 and 0.977318, respectively, and the CRFE index of cumulative probability distribution frequency analysis of annual precipitation utilizing the cloud transform algorithm was lower than the corresponding CRFE index for different stations in northern Anhui province. (3) The fitting error and varying trend of cumulative probability distribution frequency analysis of annual precipitation utilizing the two approaches were nearly consistent, which preliminarily verified the feasibility and reasonability for the application of the cloud transform algorithm in the field of hydrological frequency analysis.
4.2. Fitting Error Analysis under Typical Returning Period
The frequency fitting calculation of hydrological variables under a typical returning period scenario (especially for the rare probability condition) is a fundamental task for water conservancy project planning and development [7]. To verify the adaptation of the cloud transform algorithm in the application of the hydrological frequency analysis field, the fitting value of annual precipitation under the typical returning period of the five hydrological stations in northern Anhui province was determined utilizing the cloud transform algorithm and traditional empirical frequency formula, respectively, and the index of relative fitting error (RFE) was also applied to reveal the deviation result of calculated values of annual precipitation through the CTAM method from the corresponding values obtained through the EFCF approach [7], as given in Table 4.
Table 4.
Fitting result of annual precipitation for different returning periods in northern Anhui province, China.
It can be concluded from Table 4 that, (1) except for the Guoyangzha station, the fitting value of annual precipitation determined by the cloud transform algorithm was lower than the corresponding annual precipitation fitting value determined by the empirical frequency formula when the typical returning period was lower than 20%. Meanwhile, the lower the typical returning period of annual precipitation, the higher the deviation of the annual precipitation fitting results determined by cloud transform algorithm and traditional empirical frequency formula, respectively, which was consistent with the varying characteristics of the cumulative probability distribution frequency curve of annual precipitation derived from the cloud transform algorithm and traditional empirical frequency formula, respectively. (2) The deviation of annual precipitation fitting results in Linquan station calculated by the two approaches was the most obvious, and the average RFE for the annual precipitation fitting calculation for different typical returning periods was −9.33% in Linquan station, while the deviation of annual precipitation fitting results in Mohekou station calculated by the two approaches was the lowest, and the average RFE for the annual precipitation fitting calculation for different typical returning periods was −0.88% in Mohekou station. (3) Therefore, it was evident that the fitting values of annual precipitation of typical returning period conditions determined by the cloud transform algorithm were lower than the corresponding fitting results through the traditional empirical frequency formula, which indicated that the cloud transform algorithm could be applied as a supplementary tool for annual precipitation fitting calculations, especially under rare probability levels, to avoid the shortage of calculation results through the traditional empirical frequency formula. (4) In addition, it also could be seen that the lower the cumulative probability level, the more evident the uncertainty of the annual precipitation fitting calculation, which revealed that there existed significant uncertainty for the top extending tail section of the hydrological frequency fitting curve as a result of the insufficient historical hydrological series, especially for rare hydrological events data, and this was also the key factor leading to the lower accuracy of hydrological frequency fitting calculation.
4.3. Variation Characteristics Analysis of Annual Precipitation Series
To further explore the spatial distribution characteristics of annual precipitation in the northern Anhui province through the cumulative probability distribution frequency curve of annual precipitation derived from the cloud transform algorithm, firstly, if referring to the classification standard of hydrological year type based on river flow frequency [24], the historical hydrological years of different stations in the northern Anhui province could be divided into five categories based on the variation of annual precipitation frequency p, including wet year (p < 12.5%), partial wet year (12.5% < p ≤ 37.5%), normal year (37.5% < p ≤ 62.5%), partial dry year (62.5% < p ≤ 87.5%), and dry year (p > 87.5%). Then, the estimated value of annual precipitation corresponding to the frequency threshold for a certain hydrological year type could be determined for different stations in northern Anhui province through the cumulative probability distribution frequency curve of annual precipitation derived from the cloud transform algorithm. Finally, the statistical result for the variation of annual precipitation of different stations in northern Anhui province could be obtained, as shown in Table 5.
Table 5.
Statistical dividing standard of types of hydrological year based on annual precipitation in northern Anhui province.
Based on the dividing standard of types of hydrological year indicated in Table 5, it could be revealed that, (1) through 1954 to 2010, the proportion of wet years of Guoyangzha, Dangshan, Linquan, Mohekou, and Xifeihezha stations were 12.28%, 14.04%, 14.04%, 11.32%, and 12.28%, respectively, and the proportion of dry years of the different stations were 7.02%, 12.28%, 14.04%, 13.21%, and 15.79%, respectively. Thus, the difference for the proportion of dry years of different stations in northern Anhui province was obvious, with the maximum of 15.79% in Xifeihezha station and minimum of 7.02% in Guoyangzha station, which indicated that the proportion of dry years in Huainan city, represented by Xifeihezha station, was the highest in northern Anhui province. (2) It has been mentioned that the northern Anhui province lies in the transitional zone of the subtropical zone and warm temperate zone, with obvious transitional climate characteristics, which has resulted in the situation of severe drought hazard evolution in the northern area as compared to the southern area of the study region. In addition, the minimum annual precipitation of a wet year was 958 mm, and the maximum annual precipitation of a dry year was 557 mm in Dangshan hydrological station, located in the northernmost Anhui province, which was consistent with the actual hydrological situation of serious water resource shortage and severe drought loss in historical years in Suzhou city, represented by Dangshan station.
In conclusion, a new hydrological frequency analysis approach based on the cloud transform algorithm was proposed, and its feasibility and reasonability were also testified in terms of hydrological frequency curve fitting calculation in historical years and hydrological variable estimation calculation for typical returning periods, and the application performance of the proposed CTAM approach is affected by many factors, such as the stationarity or variation trend, tail characteristics for the distribution of hydrological variables, the higher regularity for the normal distribution dividing patterns of the hydrological variables, and the high calculation accuracy for the frequency curve fitting analysis. In a word, the proposed CTAM approach can effectively improve the shortages of higher estimation results of hydrological variables for the rare lower frequency scenario utilizing the traditional empirical frequency formula, which can be considered as an effective attempt to extend the application field of cloud theory in hydrological variable frequency analysis.
5. Conclusions
The primary innovation of this study is to introduce the normal cloud transform algorithm in hydrological variable frequency analysis, by which the sample empirical frequency for frequency curve fitting calculation can be determined instead of utilizing the traditional empirical frequency formula. Through theoretical exploration for the establishment of the CTAM model for hydrological frequency analysis and its application research in northern Anhui province, the primary conclusions can be summarized as follows:
- (1)
- The varying trend of the annual precipitation frequency curve derived from CTAM and EFCF methods had better consistency for most of the hydrological stations in northern Anhui province, and the upper tail section of the annual precipitation frequency curve derived from the CTAM model varied below the corresponding frequency curve derived from the EFCF approach, which indicated that the CTAM model was capable of avoiding the shortage of higher distribution of the upper tail section and the larger designed value of hydrological variable leading by the traditional empirical frequency formula.
- (2)
- The annual precipitation frequency analysis result for the five stations utilizing the CTAM model was basically consistent with the corresponding frequency analysis result using the traditional empirical frequency formula, the average of the CRFE index for annual precipitation frequency analysis of different stations employing the CTAM model and EFCF were 0.969176 and 0.977318, respectively, and the fitting error and its varying trend of annual precipitation frequency analysis were nearly consistent.
- (3)
- In terms of spatial distribution of annual precipitation, the proportion of dry years in Huainan city, represented by Xifeihezha station, was the highest in northern Anhui province, and the minimum in wet year and maximum in dry year of annual precipitation were 958 mm and 557 mm, respectively, in Dangshan station, located in the northernmost Anhui province, which was consistent with the actual hydrological situation of serious water resource shortages and severe drought loss in historical years in Suzhou city, represented by Dangshan station.
To summarize, the CTAM model for hydrological frequency analysis is reliable and reasonable, which was testified as an effective attempt to extend the application field of cloud model theory. However, the key for the application of the cloud transform algorithm is how to derive the cloud characteristic parameters from observed sample distribution and realize the overlapping calculation of multiple cloud distribution. Furthermore, too many challenges still exist for the wide application of cloud model theory in hydrological process research, such as the distinct description for the distribution pattern of hydrological variables using cloud model parameters, the scientific explanation for the theoretical mechanism of the conceptual cloud transform process, etc.
Author Contributions
Conceptualization, J.J. and Y.C.; methodology, C.W., S.N. and X.B.; validation, C.W. and Y.Z.; formal analysis, X.B.; investigation, S.N. and L.Z.; data curation, S.N.; writing—original draft preparation, C.W. and X.B.; writing—review and editing, X.B.; supervision, C.W. and J.J.; funding acquisition, S.N. and Y.C. All authors have read and agreed to the published version of the manuscript.
Funding
This research was funded by the National Key Research and Development Program of China (Grant No. 2017YFC1502405), the National Natural Science Foundation of China (Grant No. 51779067 and 51709071), and Fundamental Research Funds for the Central Universities of China (Grant No. JZ2020HGQA0202).
Data Availability Statement
The data presented in this study are available on reasonable from the corresponding author.
Conflicts of Interest
The authors declare no conflict of interest.
References
- Luo, P.P.; Mu, D.R.; Xue, H.; Thanh, N.; Kha, D.; Takara, K.; Nover, D.; Schladow, G. Flood inundation assessment for the Hanoi Central Area, Vietnam under historical and extreme rainfall conditions. Sci. Rep. 2018, 8, 1–6. [Google Scholar] [CrossRef] [PubMed]
- Huo, A.D.; Peng, J.B.; Cheng, Y.X.; Luo, P.P.; Zhao, Z.X.; Zheng, C.L. Hydrological analysis of loess plateau highland control schemes in Dongzhi Plateau. Front. Earth Sci. 2020, 8, 1–14. [Google Scholar] [CrossRef]
- Lyu, J.Q.; Mo, S.H.; Luo, P.P.; Zhou, M.M.; Shen, B.; Nover, D. A quantitative assessment of hydrological responses to climate change and human activities at spatiotemporal within a typical catchment on the Loess Plateau, China. Quat. Int. 2019, 527, 1–11. [Google Scholar] [CrossRef]
- Xie, P.; Chen, G.C.; Xia, J. Hydrological frequency calculation principle of inconsistent annual runoff series under Changing environments. Eng. J. Wuhan Univ. 2005, 38, 6–15. [Google Scholar]
- Zhu, Y.H.; Luo, P.P.; Zhang, S.; Sun, B. Spatiotemporal analysis of hydrological variations and their impacts on vegetation in semiarid areas from multiple satellite data. Remote Sens. 2020, 12, 4177. [Google Scholar] [CrossRef]
- Hong, X.J. Hydrological Drought Indices and Frequency Analysis Methods and Their Applications; Wuhan University: Wuhan, China, 2017. [Google Scholar]
- Song, S.B. Research challenges and suggestions of hydrological frequency calculation. J. Water Resour. Archit. Eng. 2019, 17, 12–18. [Google Scholar]
- Jin, G.Y. Empirical frequency in Hydrological analysis. Hydrology 1994, 1, 1–9. [Google Scholar]
- Jin, G.Y. A review of hydrologic frequency analysis. Adv. Water Sci. 1999, 10, 319–327. [Google Scholar]
- Zhang, M.; Jin, J.L.; Wang, G.Q.; Zhou, R.J. Drought frequency analysis using stochastic simulation with maximum entropy model. J. Hydroelectr. Eng. 2013, 32, 101–106. [Google Scholar]
- Song, S.B.; Kang, Y.; Song, X.Y.; Wang, X.J.; Jin, J.L. Frequency Calculation Principles and Their Application of Single Variable Hydrological Sequence; Science Press: Beijing, China, 2018. [Google Scholar]
- Guo, S.L.; Ye, S.Z. Discussion of empirical frequency in hydrology calculation. J. Wuhan Univ. Hydraul. Electr. Eng. 1992, 25, 38–45. [Google Scholar]
- Singh, V.P. Entropy-Based Parameters Estimation in Hydrology; Kluwer Academic Publishers: London, UK, 1998. [Google Scholar]
- Huang, Z.P.; Sa, D.Y.; Huang, C.X.; Ma, J.J. Study on formulas for calculation of empirical frequency in curve-fitting method. Adv. Sci. Technol. Water Resour. 2002, 5, 69. [Google Scholar]
- Li, Y. Research on New Theory and Application of Hydrologic Frequency Analysis; Xi’an, Northwest A&F University: Xianyang, China, 2013. [Google Scholar]
- Qin, K.; Wang, P. New method of curve fitting based on cloud transform. Comput. Eng. Appl. 2008, 44, 56–74. [Google Scholar]
- Zhang, G.Y. Study on Prediction Interval Estimation and Generation Scheduling Method for Power System with Large-Scale Wind Power Integration; Huazhong University of Science & Technology: Wuhan, China, 2015. [Google Scholar]
- Tian, H.; Li, C.; Zhang, S.Y. The climate change in the Yangtze-Huaihe river valley over the past 50 years. Period. Ocean. Univ. China 2005, 35, 539–544. [Google Scholar]
- Qi, H. Analysis of precipitation changes in Huaibei Plain over last 50 years. Chin. J. Agrometeorol. 2009, 30, 138–142. [Google Scholar]
- Jin, J.L.; Song, Z.Z.; Jiang, S.M.; Zhou, Y.L.; Zhang, M. Spatiotemporal distribution of potential evapotranspiration in Huaibei Plain based on cloud model. South–North Water Transf. Water Sci. Technol. 2017, 15, 25232. [Google Scholar]
- Li, D.Y.; Liu, C.Y. Study on the Universality of the Normal Cloud Model. Engineering Science. Eng. Sci. 2004, 6, 28–34. [Google Scholar]
- Yang, J.; Wang, G.Y.; Pang, Z.L. Acceleration mechanism of cloud transformation based on density peaks. J. Chin. Comput. Syst. 2018, 39, 1299–1304. [Google Scholar]
- Meng, H.; Wang, S.L.; Li, D.Y. Concept extraction and concept hierarchy construction based on cloud transformation. J. Jilin Univ. 2010, 40, 782–787. [Google Scholar]
- Li, D.Y.; Du, Y. Uncertainty Artificial Intelligence; National Defense Industry Press: Beijing, China, 2014. [Google Scholar]
- Du, Y.; Li, D.Y. Concept partition based on cloud and its application to mining association rules. J. Softw. 2001, 12, 196–203. [Google Scholar]
- Ren, J. Linguistic-stochastic multi-criterion decision-making method based on cloud model. Comput. Integr. Manuf. Syst. 2012, 18, 2792–2797. [Google Scholar]
- Hu, B.Q.; Wu, Y.G.; Cheng, T. Research on the Selection of Typical Hydrologic Year with the Cloud Model. China Rural. Water Hydropower 2016, 5, 97–100. [Google Scholar]
- Keyantash, J.A.; Dracup, J.A. An aggregate drought index-assessing drought severity based on fluctuations in the hydrologic cycle and surface water storage. Water Resour. Res. 2004, 40, 1–13. [Google Scholar] [CrossRef] [Green Version]
- Mu, D.R.; Luo, P.P.; Lyu, J.Q.; Zhou, M.M.; Huo, A.D.; Duan, W.L.; Nover, D.; He, B.; Zhao, X.L. Impact of temporal rainfall patterns on flash floods in Hue City, Vietnam. J. Flood Risk Manag. 2020, 14, e12668. [Google Scholar] [CrossRef]
- Hao, L.; Zhang, X.Y.; Liu, S. Risk assessment to China’s agricultural drought disaster in county unit. Nat. Hazards 2012, 61, 785–801. [Google Scholar] [CrossRef]
- Zhang, Y.G.; Li, Y.L. Application of Cloud Model in Logging Curve Hierarchical. Comput. Digit. Eng. 2014, 42, 1613–1616. [Google Scholar]
- Zhou, Z.T.; Guo, B.; Xing, W.X.; Zhou, J.; Xu, Y. Comprehensive evaluation of latest GPM era IMERG and GSMaP precipitation products over mainland china. Atmos. Res. 2020, 246, 1–15. [Google Scholar] [CrossRef]
- Guo, B.; Bian, Y.; Zhang, M.; Su, Y.; Wang, X.X.; Zhang, B.; Wang, Y.; Chen, Q.J.; Wu, Y.R.; Luo, P.P. Estimating socio-economic parameters via machine learning methods using Luojia1-01 nighttime light remotely sensed images at multiple scales of China in 2018. IEEE Access 2021, 99, 1–15. [Google Scholar]
Publisher’s Note: MDPI stays neutral with regard to jurisdictional claims in published maps and institutional affiliations. |
© 2021 by the authors. Licensee MDPI, Basel, Switzerland. This article is an open access article distributed under the terms and conditions of the Creative Commons Attribution (CC BY) license (https://creativecommons.org/licenses/by/4.0/).