Article

Effect of Dust Deposition on Chlorophyll Concentration Estimation in Urban Plants from Reflectance and Vegetation Indexes

School of Environmental and Geographical Sciences, Shanghai Normal University, Shanghai 200234, China
*
Authors to whom correspondence should be addressed.
Remote Sens. 2021, 13(18), 3570; https://doi.org/10.3390/rs13183570
Submission received: 10 August 2021 / Revised: 5 September 2021 / Accepted: 7 September 2021 / Published: 8 September 2021
(This article belongs to the Section Urban Remote Sensing)

Abstract

:
Using reflectance spectroscopy to monitor vegetation pigments is a crucial method to know the nutritional status, environmental stress, and phenological phase of vegetation. Defining cities as targeted areas and common greening plants as research objects, the pigment concentrations and dust deposition amounts of the urban plants were classified to explore the spectral difference, respectively. Furthermore, according to different dust deposition levels, this study compared and discussed the prediction models of chlorophyll concentration by correlation analysis and linear regression analysis. The results showed: (1) Dust deposition had interference effects on pigment concentration, leaf reflectance, and their correlations. Dust was an essential factor that must be considered. (2) The influence of dust deposition on chlorophyll—a concentration estimation was related to the selected vegetation indexes. Different modeling indicators had different sensitivity to dust. The SR705 and CIrededge vegetation indexes based on the red edge band were more suitable for establishing chlorophyll-a prediction models. (3) The leaf chlorophyll concentration prediction can be achieved by using reflectance spectroscopy data. The effect of the chlorophyll estimation model under the levels of “Medium dust” and “Heavy dust” was worse than that of “Less dust”, which meant the accumulation of dust had interference to the estimation of chlorophyll concentration. The quantitative analysis of vegetation spectrum by reflectance spectroscopy shows excellent advantages in the research and application of vegetation remote sensing, which provides an important theoretical basis and technical support for the practical application of plant chlorophyll content prediction.

1. Introduction

In recent years, the ecological environment of cities has been damaged with the acceleration of urbanization. The transportation network, traffic flow, industrial activities, and fossil fuels are sources of severe particulate pollutants in the urban greening environment [1,2]. Dust particles in the air will influence human respiration and gas exchange by blocking pulmonary capillaries, which may cause asthma symptoms such as cough, wheezing, shortness of breath, and chest distress [3,4]. When dust deposits on the leaves of plants, it can block the pores, reduce gas exchange efficiency and water absorption [5,6], and affect the photosynthesis of leaves [7]. Dust accumulation is an abiotic stress factor in plants. However, plants can purify suspended particles in the air to a certain extent, as they are called “urban dust filters” [8,9,10,11]. Dust deposition capacity of plants is the amount of dust deposited within unit leaf area, which can reflect air quality status and can be used as an index to characterize air pollution [12]. Compared with plants in other habitats, urban plants are disturbed and stressed by human activities more often, such as vehicle exhaust, air pollution, and dust pollution [13,14,15,16,17,18]. Some scholars studied the relationship between chlorophyll content of vegetation and dust pollution along highways in the Philippines and found that the chlorophyll content of vegetation exposed to atmospheric particles was significantly reduced [19].
It is necessary to study the effect of dust on vegetation pigment content. The pigment concentration information of plants can be obtained by spectrophotometer and high-performance liquid chromatography [7]. However, the acquisition of temporal and spatial change information of plants is limited. Reflectance spectroscopy technology can better combine pigment concentration and reflectance spectra of vegetation for cross-spatial-scale research. For example, Zulfa et al. [20] and Zhao et al. [21] identified the relationship between hyperspectral data and chlorophyll of mangrove species. Jesús et al. [22] quantified the chlorophyll content of vegetation based on the hyperspectral index. However, there were few studies considering the interference of foliar dust on plant pigment concentration. Shah et al. [23] showed that road sediment could significantly reduce leaf pigment in landscape plant population, and individual responses of plants were variable under different levels of road dust. Shah et al. [24] showed that dust deposition on the roadside could degrade photosynthetic pigments and had broad effects on the growth and development of plants. Prusty et al. [25] conducted a significant negative correlation between dust load and pigment content in the summer and rainy seasons.
The dust deposition can affect optical characteristics and biochemical component characteristics of vegetation leaves. From a physical point of view, dust on the leaf surface will directly affect the reflectance spectroscopy measurements. The reflectance spectrum and spectral characteristic parameters of leaf surface will be different from the results measured from pure leaf surface [26]. From a biochemical point of view, dust deposition on leaf surface will affect photosynthesis and biological parameters of vegetation, especially the chlorophyll content. Brackx et al. [27] assessed the potential of hyperspectral tree leaf reflectance for monitoring traffic related air pollution. This study determined leaf chlorophyll content index (CCI) and made correlation analysis of spectral features. It was clear that dust pollution influenced the optical characteristics of leaves in terms of reflectance. Zajec et al. [28] studied relationships between dust concentration, leaf functional traits, and optical properties. They found that dust altered spectral signatures of hypo-stomatal Fagus sylvatica leaves, mitigated the effect of high air temperatures, stimulated the production of chlorophylls, and reduced the amount of photoprotective compounds. What is more, Zhao et al. [29] demonstrated the importance of extracting feature bands based on the response of plant physical and chemical parameters to dust in his paper. Therefore, dust deposition has different effects on vegetation spectrum and pigment, and there is a complex correlation among them.
In order to estimate vegetation pigment content, many studies [30,31,32,33,34] used reflectance data, converted reflectance data, normalized absorption depth, waveform characteristic parameters, and different hyperspectral indexes. Qi et al. [35] detected sensitive spectral bands and indexes and established regression equations to predict the chlorophyll content of peanut leaves. Many studies also used physical radiative transfer model models to simulate and estimate pigment [36,37,38]. For example, Lunagaria and Patel [39] coupled reflectance spectra with a physical model to accurately retrieve chlorophyll content. At present, a few studies combined the dust factor to retrieve pigment concentration, but all of them had a particular significance. For example, Prajapati and Tripathi [40] evaluated the seasonal variation of dust accumulation on leaves of diverse vegetation and its influence on chlorophyll content. Ma et al. [41] selected vegetation indexes (VIs), the medium resolution imaging spectrometer terrestrial chlorophyll index (MTCI), and the double-difference index (DD) to study the estimation accuracy of chlorophyll content at leaf scale in dusty environments. These perspectives have significantly expanded our thoughts and provided adequate references for selecting vegetation indexes to estimate pigment concentration.
Therefore, in this study, we propose to study the effect of dust on vegetation spectra and establish vegetation pigments regression model through reflectance spectroscopy and vegetation indexes. The research content of this study includes: (1) Comparison of reflectance spectra of urban plants under different dust deposition levels and pigment concentration levels. (2) Correlation analysis of pigment concentration, vegetation reflectance spectrum, and vegetation indexes under different dust deposition levels. (3) Establishment and evaluation of chlorophyll concentration estimation model under different dust deposition levels. The objectives of this study are: (1) to obtain the relationship between dust, pigment contents, and vegetation indexes and (2) to quantify the chlorophyll-a concentration to lay the foundation for future research.
The structure of this paper is as follows: Section 1 summarizes the relevant research and introduces the theme of this study. Section 2 introduces the sources of experimental samples and experimental method methods. Section 3 introduces the results and analysis. Section 4 discusses and expands the results. Section 5 contains conclusions.

2. Materials and Methods

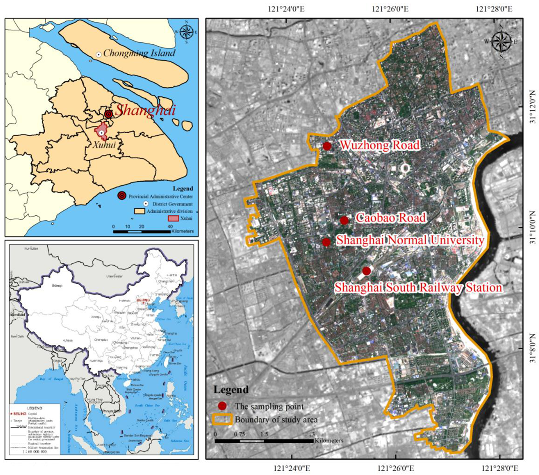
2.1. Sample Collection

The study selected Camellia japonica L., Euonymus japonicus L.Cv., and Photinia serrulata Lindl. as sample species, representing evergreen shrubs or small trees in different functional areas and streets in the Xuhui District of Shanghai. As shown in Figure 1, the sampling sites are distributed in transportation hub, residential area, campus, and streets. These sites include Shanghai South Railway Station, Wuzhong Road, Caobao Road, and Shanghai Normal University. In this study, sample collections were performed under similar conditions referred to former studies [42]. Field sampling conditions include: (1) three days after rainfalls exceeded 15 mm or rainfall intensity reached 10 mm/h; (2) the weather condition was clear and windless during collection; (3) collected from 10:00 a.m. to 14:00 p.m. on an experimental day. Field experiments and laboratory experiments were carried out from June to September in 2016 and 2017 when urban plants could thrive. Field experiments mainly collected leaf samples and collected plant canopy spectrum. The canopy reflectance spectrum can be obtained to compare with leaf reflectance spectrum [43]. The main research object of this study was leaf reflectance spectrum. Sample leaves of three species were collected from healthy plants that all grew towards the sun. In each sample plant, 10–20 leaves were collected from the branches that had contacts with dusts in the east, west, south, north, and middle of the canopy [6,44]. The collected leaves were quickly placed in an incubator with an ice pack to maintain biochemical activity and transferred indoors. Indoor experiments were mainly to measure leaf reflectance spectra, dust deposition amount, and pigment content.

2.2. Data Measurement

2.2.1. Reflectance Spectrum Measurement

FieldSpec3 Spectrometer, a portable spectrometer produced by the American ASD (Analytical Spectral Device, Boulder, CO, USA) company, was used in the experiments, connected with laptops via a wireless network [42]. The band range that the spectrometer could observe was 350–2500 nm. The resolution was 3 nm or 10 nm, and the sample interval was 1.37 nm or 2 nm. The scanning interval of the spectrometer was 0.1 s.
The leaf spectrum measurement was carried out in the darkroom. The spectrum measurement background was a pure black background board to reduce measurement errors. A halogen lamp was used as the light source. Half an hour before collecting leaf spectrum, the experiment used whiteboard calibration to calibrate and optimize the detector lens to make the software enter the reflectance measurement state and measure stably. In the measurement, the whiteboard correction was carried out every 10 min to ensure the accuracy of the detector [45].
Plant Probe detector was used to isolate the random noise of the external environment such as atmosphere and natural light. In the measurement, the leaf clamp of Plant Probe detector clamped the center part of the leaf; the light of the probe was vertically irradiated to the leaves until the stable spectral data was recorded. Measure 10 times for each leaf sample, use ViewSpecPro software to process the spectrum data and take the average value as the actual measured spectrum of the leaf sample [46,47]. When measuring the spectrum of the same leaf sample multiple times, the leaf clamp remained the same position to avoid interference.

2.2.2. Dust Deposition Amount Measurement

In this study, the data of the dust deposition amount was obtained by the method of weight difference [44,48]. Leaves were cleaned with ultra-pure water and dried by absorbent paper. The process of dust deposition amount measurement followed the order of weighing, spectrum measuring, cleaning, reweighing, and spectrum re-measuring [49,50] to ensure the reflectance spectra and weight of leaves before and after dust deposition. Based on similar research [26], the reflectance of clean leaves was higher than that of dusty leaves in 750–1350 nm. Therefore, this study focused on the analysis of leaf reflectance spectrum under different dust deposition.
The instrument used for weighing was a 1/10,000 high precision electronic analytic balance. Whether the leaf was before or after rinsing and wiping, each sample was weighed three times to take the average. The weight of each sample leaf before cleaning was recorded as W1. The weight of the sample leaf after cleaning with ultrapure water, wiping with absorbent paper, and drying was recorded as W2. The mass difference of W1 and W2 was the dust deposition amount Δ M ( Δ M = W 1 W 2 ).
The leaf area (A) was measured combining the punching method and leaf weight ratio. The radius of the punch used in this study was 0.5 cm (r = 0.5 cm). Each cleaned leaf was punched with 10–20 holes. Then the weight of holes (w) could be used to calculate the leaf area (A). The leaf area (A) could be obtained by the ratio of holes’ weight and area (1). Finally, the amount of dust deposition per unit area (M) could be obtained (2), representing the dust deposition capacity per plant species [19]. Depending on the M, the ability of dust deposition could be classified. The calculation formulas are as following:
A = n π r 2 W 2 w
where A is the leaf area; n is the number of holes; r is the radius of the hole; W2 is the weight of the cleaned leaf; w is the weight of n holes in each sample leaf. The unit of concentration of leaf area is m2.
M = Δ M A = W 1 - W 2 A
where M is the dust deposition amount per unit area; Δ M is the dust deposition amount on leaf surface; W1 is the weight of leaf before cleaning. The unit of M is g/m2.

2.2.3. Pigment Concentration Measurement

The pigment determination method was spectrophotometry [51]. An organic solvent (95% ethanol) was used to extract the target pigment, and the absorbance value of the pigment extract was obtained by a spectrophotometer (DU-800 spectrophotometer), and the corresponding pigment content can be calculated. Because the pigment was insoluble in water but soluble in organic solvents, it can be extracted with ethanol organic solvent to obtain the pigment extract. The absorbance of pigment solution can be measured by DU-800 spectrophotometer at 470, 649, and 665 nm. The concentration value of the pigment was calculated according to the given formula [52]. The calculation formulas are as follows:
C a = 13.95 A 665 6.88 A 649
C b = 24.96 A 649 7.32 A 665
C c = ( 1000 A 470 2.05 C a 114.8 C b ) / 245
where Ca is the concentration of chlorophyll-a; Cb is the concentration of chlorophyll-b; Cc is the concentration of carotenoids. The concentration of chlorophyll-a and chlorophyll b is collectively called the chlorophyll concentration, and the concentration of Ca, Cb, and Cc is collectively called the pigment concentration. A470, A649, and A665 are absorbed leaf pigment extracts at 470, 649, and 665 nm, respectively. The unit of concentration of various pigments is mg/L.

2.3. Data Processing

In order to visually analyze the variation of vegetation spectral characteristics with different pigment concentrations and dust deposition, both the pigment concentration and the dust deposition capacity were divided in three grades. The sample pigment concentrations were basically between 5–20 mg/L. According to studies of vegetation pigments [19,40], the pigment concentration was divided into three groups: “Level 1” is 5–10 mg/L; “Level 2” is 10–15 mg/L; “Level 3” is higher than 15 mg/L. Because the selected samples were all shrubs and refer to a large number of dust load measurement studies [10,53,54,55] and the preliminary research foundation of the samples, the dust deposition capacity per plant species was divided into three levels: “Less dust” is 0–1.5 g/m2; “Medium dust” is 1.5–4 g/m2; “Heavy dust” is above 4 g/m2. When performing correlation analysis and establishing estimation models, the samples for each dust deposition level were composed of three tree species to reduce the difference among species. The number of samples for each dust deposition level was the same.
By introducing the spectral data into the Excel, the pigment-related indexes based on the spectrum were then calculated under the above dust deposition levels (Table 1). In some pigment indexes, the red edge (705 nm) was used instead of the original band to construct the red edge index. It aimed to study the influence of the red edge and the correlation between various indexes and vegetation pigment content. The optimal index was then selected for prediction.

2.4. Accuracy Assessment

After the pigment index was established, the SPSS software was used to calculate the correlation between the pigment index and the pigment concentration under different dust deposition levels. This paper selected the Pearson correlation coefficient [66] and the significance level to prove the linear correlation. The range of the correlation coefficient was between −1 and 1. The larger the absolute value, the more significant the linear correlation between the two variables. “p” represented the size of the significance level. When the significance level was less than 0.01, it indicated a significant correlation, which was represented by “**”. Based on the Pearson correlation coefficient and significance level, the index with considerable correlation was selected as the independent variable, and the chlorophyll concentration was chosen as the dependent variable.
The K-fold Cross-Validation (K-CV) was used during this process [6]. In K-fold Cross-Validation, the original sample is randomly partitioned into K subsamples. Within the K subsamples, a single subsample is retained as the validation data for testing the model, and the remaining K−1 subsamples are used as training data. The cross-validation process is then repeated K times (the folds), with each of the K subsamples used exactly once as the validation data. The K results from the folds then can be averaged (or otherwise combined) to produce a single estimation. We employed a 3-fold Cross-Validation (3K-CV). The sample data were randomly classified into three subsamples, and the number of samples in each subsample was approximately equal. The two subsamples were selected as training samples to establish the chlorophyll concentration prediction model, and the remaining subsample was for model validation. The accurate verification of the prediction model was evaluated by three general indexes: Root Mean Square Error (RMSE), Relative Error (RE), and determination coefficient (R2).
The data processing and modeling were completed by Excel, SPSS, and MATLAB R2016b software. The calculation formulas are as follows:
R M S E = i = 1 n ( y i y ^ i ) 2 n
R E = i n y i y ^ i y i n × 100 %
R 2 = ( y ^ i y ¯ ) 2 ( y i y ¯ ) 2
where, y i represents measured values; y ^ i represents measured values predicted values; n is the sample size; y ¯ represents the average of measured values.

3. Results

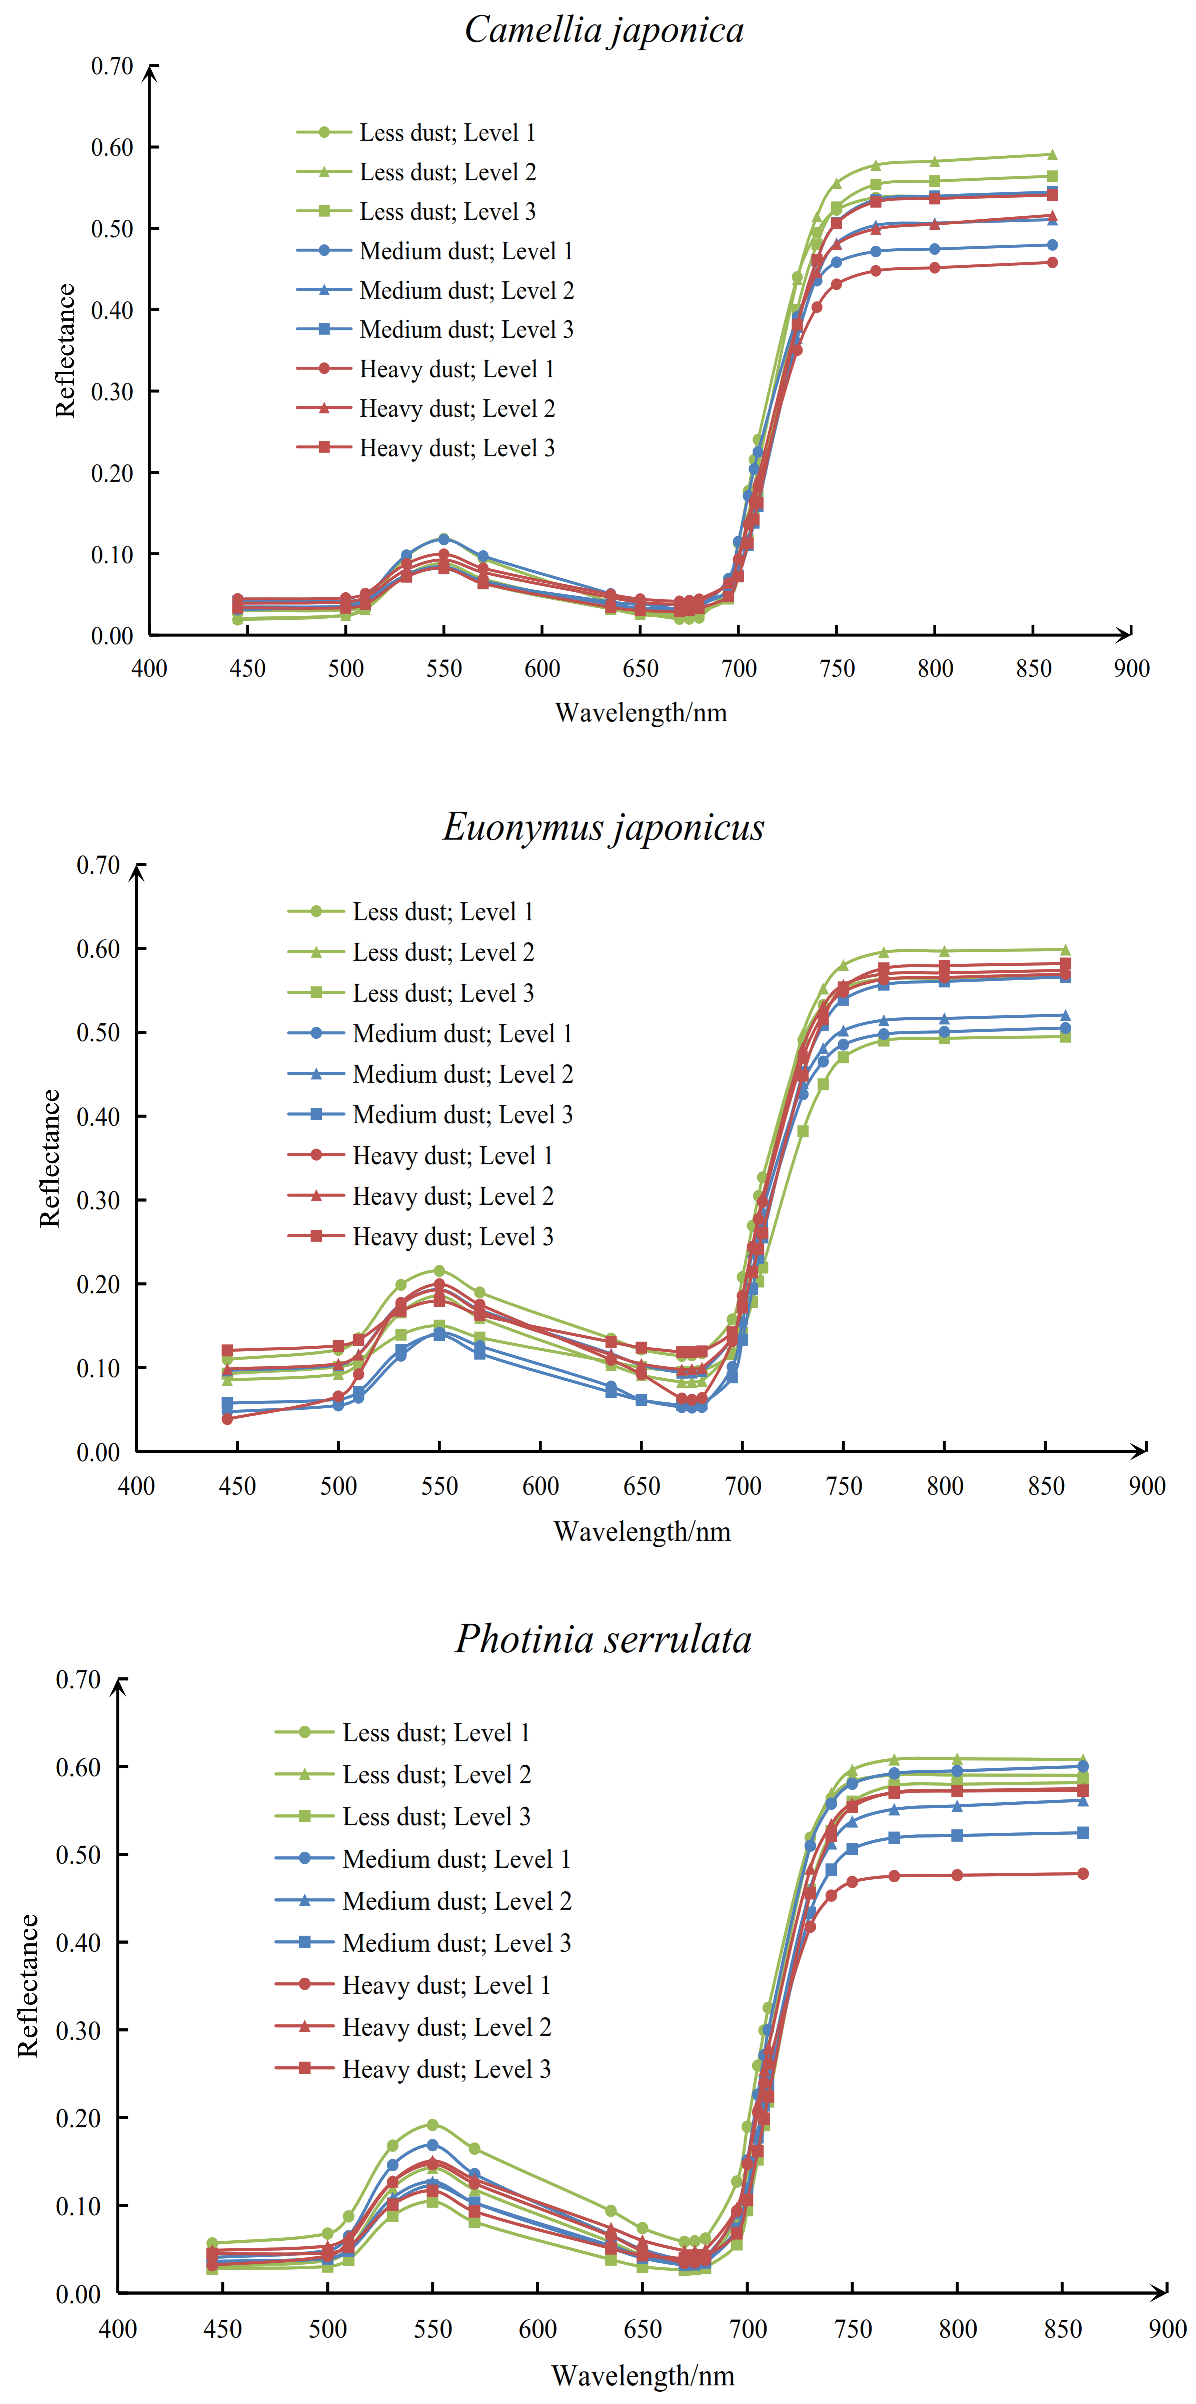
3.1. Influence of Dust Deposition on Reflectance Spectra of Different Pigment Concentrations

Figure 2 showed the reflectance spectra of Camellia japonica, Euonymus japonicus and Photinia serrulata under different dust deposition levels and different pigment levels. Curves of different colors represented different dust deposition levels. Different markers on the curves represented different pigment concentration. The figures mainly showed the curve difference in reflectance spectra, including all the wavelengths that were used to compute all different vegetation indexes. It can be found that the reflectance spectrum was greatly affected by dust deposition and pigment concentrations at 500–650 nm and 750–850 nm. While the reflectance spectrum in the range of 700–740 nm was relatively stable and less affected by dust and pigment concentrations.
In the visible regions, the reflectance spectra of Euonymus japonicus and Photinia serrulata fluctuated greatly due to the change of dust deposition and pigment concentration. The impact on Camellia japonica was relatively small. Meanwhile, under the level of “Less dust”, the reflectance spectrum of vegetation was more affected by the pigment concentration. Take Euonymus japonicus and Photinia serrulata as examples; the reflectance spectrum increased obviously with increased pigment concentration in the range of 450–700 nm, but under the level of “Medium dust” or “Heavy dust”, the spectral variation range of the three selected plant species was small, which showed that the interference of dust could weaken the influence of the pigment on the spectrum.
In some near-infrared regions, the three selected plant species were all significantly affected by dust deposition and pigment concentration. In the level of “Less dust”, the reflectance spectra exhibited trend of first rising, then decreasing with the increase of pigment concentration. It presented that the reflectance spectrum was high under moderate pigment concentration and “Less dust”, but in the level of “Medium dust” and “Heavy dust”, the reflectance of the three tree species presented an order of “Level 3” > “Level 2” > “Level 1”, which showed a trend of increase in spectrum with the rise of pigment concentration. It reflected that leaf dust could easily change the overall trend of reflectance spectrum affected by pigment concentration.

3.2. Correlation Analysis between Pigment Concentration and Vegetation Spectrum

3.2.1. Correlation Analysis between Pigment Concentration and Reflectance Spectrum

The reflectance spectra of leaves varied with the change of vegetation pigment contents. Based on this principle, the pigment content estimation model could be established. In contrast, dust deposition affected the value of vegetation reflectance spectrum, and it also affected the correlation between vegetation pigment concentration and spectrum. Table 2 showed the correlation coefficient results.
All displayed wavelengths were used to establish vegetation indexes. Under three dust deposition levels, all kinds of pigments negatively correlated with each wavelength. Dust deposition did not change negative correlation to positive correlation, but it would increase or decrease the value of the correlation coefficient. With the increase of dust deposition, the correlation coefficients between various pigments and spectrum generally decreased. Among different pigments, the correlation coefficient between spectral bands and chlorophyll-a was relatively higher than other pigments. The correlation coefficient reached the maximum when it was around the red edge (705 nm).

3.2.2. Correlation Analysis between Pigment Concentration and Vegetation Indexes

The dust captured on the leaf surface would affect the reflectance, and the vegetation index used to establish the pigment estimation model would also change accordingly. Table 3 showed correlation coefficients of leaf pigments with different indexes under three dust deposition levels. It could be found that the correlation properties between different pigments and the same index were always positive or negative. For example, pigments were all positively correlated with SR680, SR705, ND680, ND705, mND705, NDVI670, MSR670, MSR705, MC705, RSSRb, PSNDb, G1, and G2, but they were negatively correlated with MC670, MC/OS670, RARSb, and D. But when the dust deposition level increased from “Less dust” to “Heavy dust”, the correlations of some indexes (SR705, ND705, MC705, MSR705, CIrededge) were significantly reduced.
The correlation coefficients between indexes and pigments changed before and after dust deposition, but generally followed a similar rule. Pigments may have high correlation with one index but weak correlation with another. In general, for different pigments, the correlation coefficient followed an order of chlorophyll-a > carotenoids > chlorophyll-b from high to low. Chlorophyll-a (Ca) had the highest correlation coefficient with indexes, especially with SR705, ND705, mND705, MSR705, MC705, CIrededge, G1, and G2. At the same time, indexes mentioned above were mainly constructed around the red edge band.
For chlorophyll-a, the correlation coefficient between chlorophyll-a and a highly correlated index firstly decreased with the increase of dust deposition. When dust deposition continued to increase to the level of “Heavy dust”, the correlation coefficient increased slightly, but the degree of decrease was much higher than that of increase. According to this rule, the chlorophyll-a concentration of shrubs can be estimated by using highly correlated indexes under three dust deposition levels.

3.3. Prediction Model of Leaf Chlorophyll Concentration Based on Red Edge Vegetation Indexes

Considering the influence of dust deposition and the size of the correlation coefficient, it could be found that the correlation coefficients between chlorophyll-a concentration and three indexes (SR705, ND705, and CIrededge) were larger than others, which were all above 0.75. Therefore, this study chose SR705, ND705, and CIrededge as variables to establish linear and multivariate linear regression. Thus, several leaf chlorophyll-a concentration prediction models were obtained for comparison. This research used the 3K-CV method in cross-validation for linear regression analysis. The size of each training subset was set to 50, and the verification subset was set to 25. Finally, the estimation accuracy was analyzed by R2, RMSE, and RE.

3.3.1. Establishment of the Chlorophyll—A Concentration Prediction Model

By taking SR705, ND705, and CIrededge as spectral parameters, chlorophyll-a concentration prediction models under three dust deposition levels were established. The estimation results were shown in Table 4. Among them, the R2 value of the prediction model established under “Less dust” was relatively large, with all values above 0.6, and the accuracy of the model established by the CIrededge index could reach 0.6848. Comparing the results under the three deposition levels, it can be found that the change of the determination coefficient (R2) was consistent with correlation coefficient. The model accuracy was increased first but later declined when the amount of dust deposition increased. Comparing the estimation results of distinctive red-edge indexes, it can be found that the single linear regression established by SR705 or CIrededge had a better prediction effect, while the accuracy of multiple linear regression was slightly lower than that of single index. It did not reflect the advantages of multiple linear regression, but it was still feasible and credible.

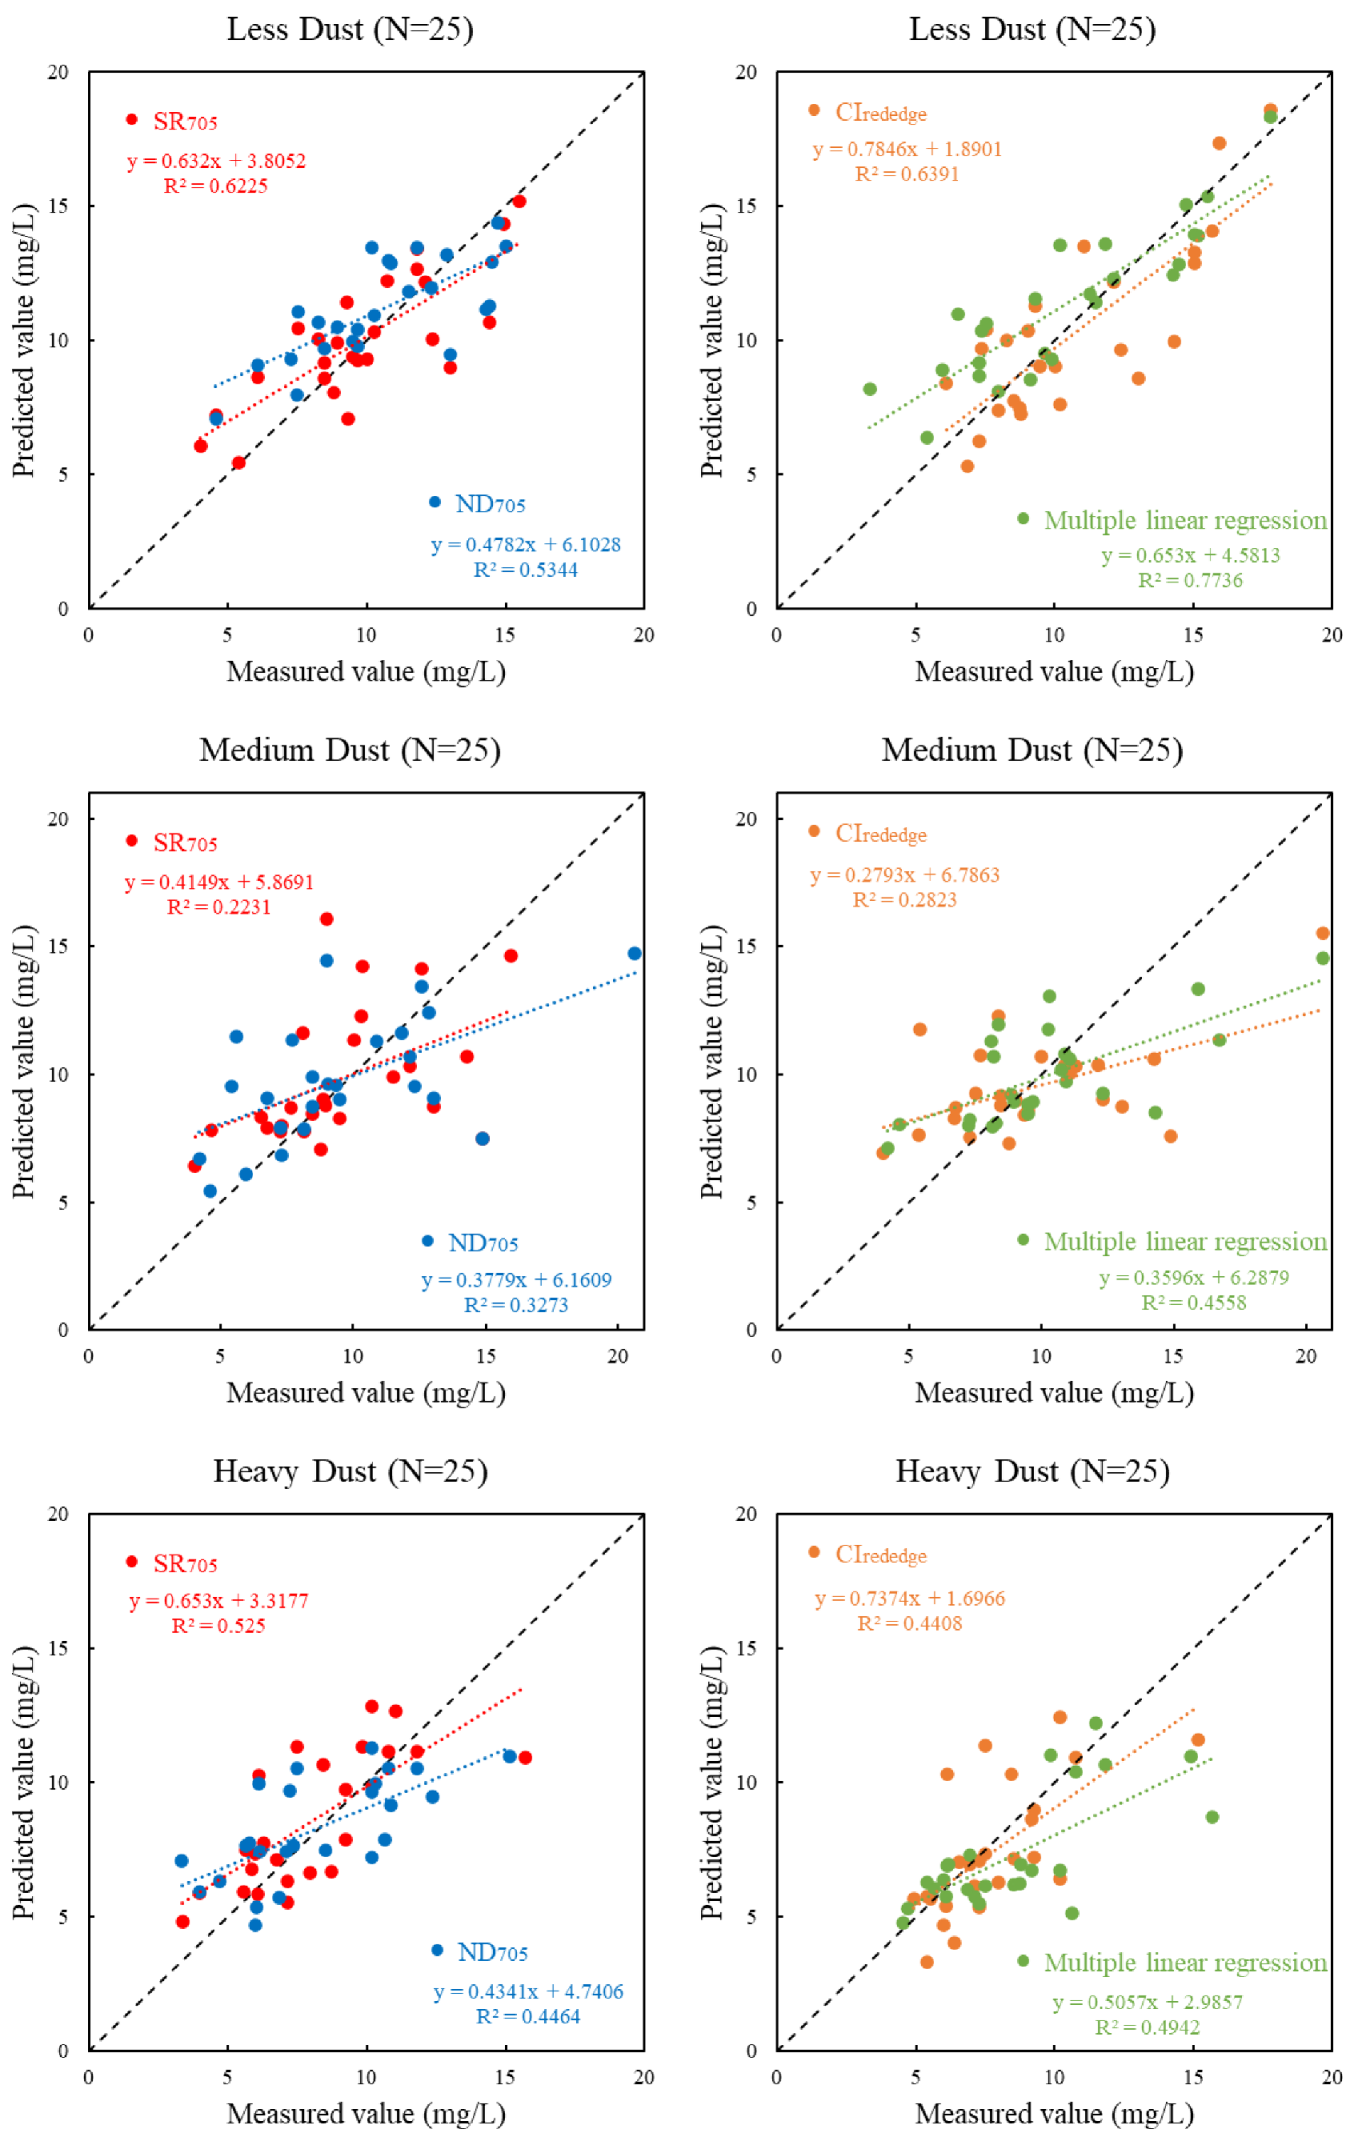
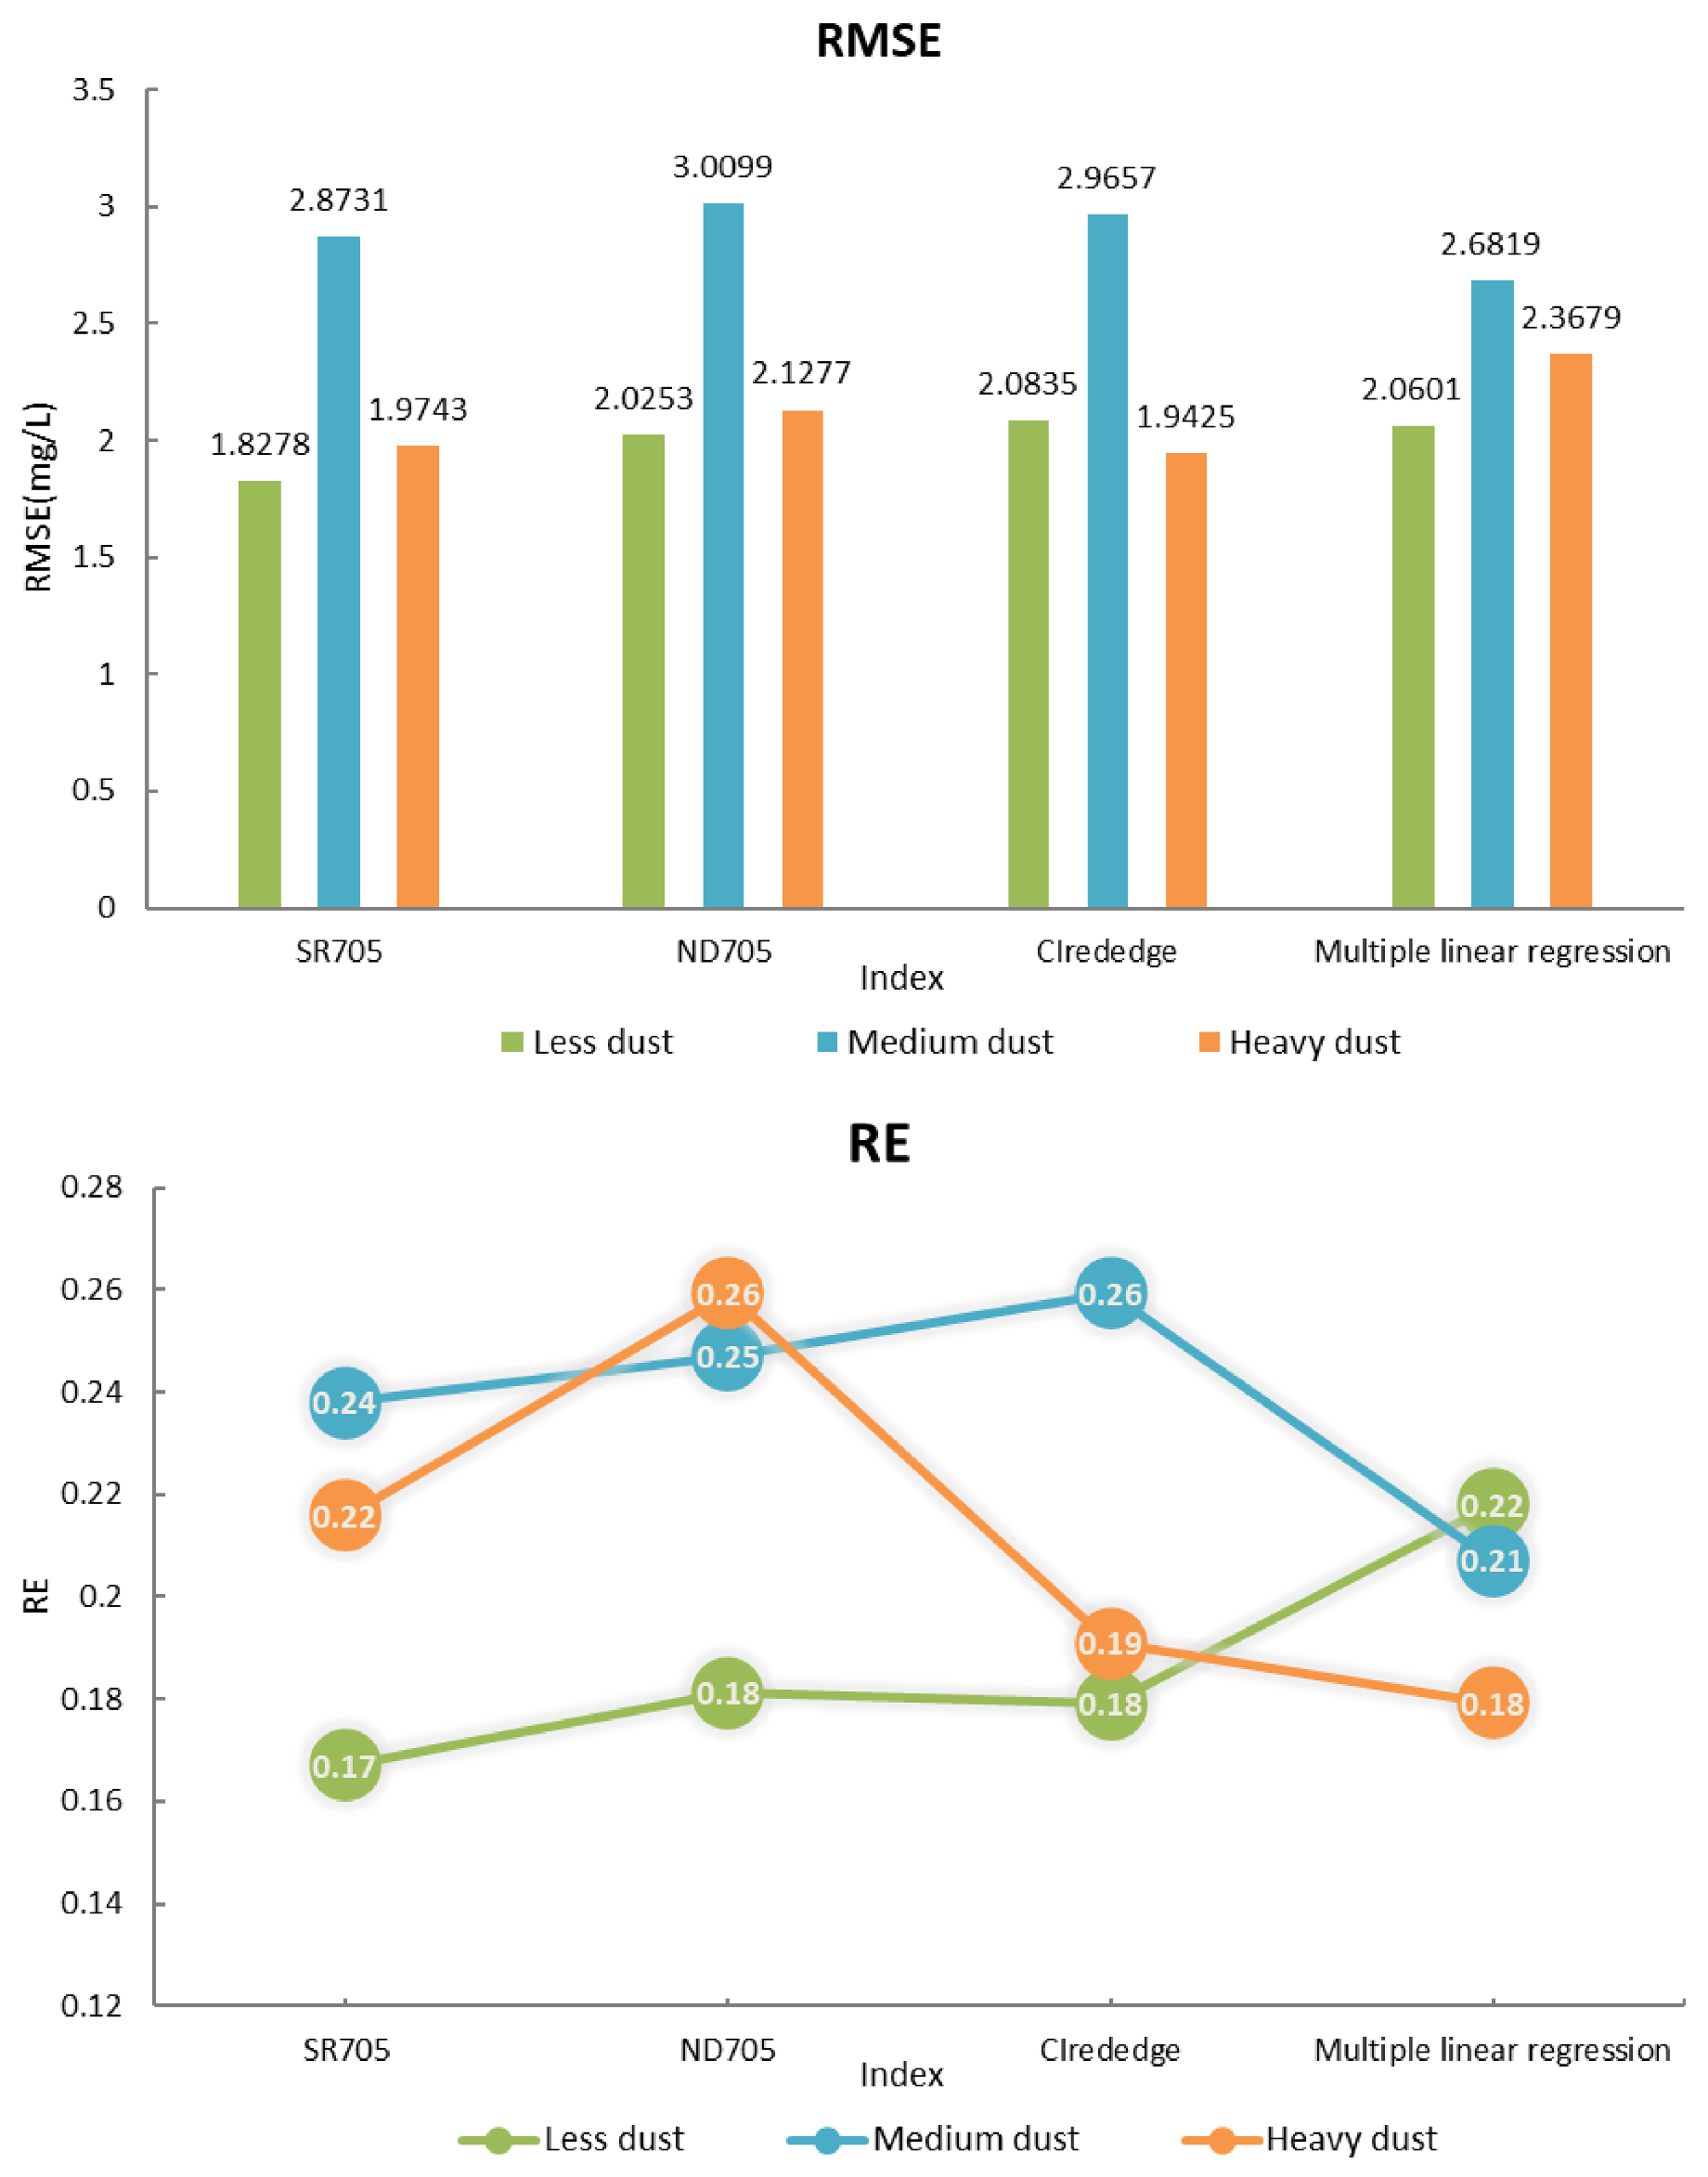
3.3.2. Validation of Chlorophyll—A Concentration Prediction Model

Figure 3 showed the accuracy assessment results. The prediction model established under “Less dust” was relatively reliable and accurate. The R2 of the test regression equations established by SR705 and CIrededge were both above 0.6. The R2 of the test regression equation established by multiple linear regression could reach 0.7736. This indicated that the prediction accuracy of the chlorophyll-a concentration obtained by the multiple linear regression was high. Combining the estimation accuracy and verification accuracy of the multiple linear regression model, multiple linear regression could be used for estimation and simulation of chlorophyll-a under “Less dust”. The R2 of validation regression results under “Medium dust” or “Heavy dust” was lower than that of “Less dust”. The reason may be related to the dust deposition on the leaf surface and the accuracy of the measured data.
Therefore, dust deposition is an essential factor in estimating pigment concentration, which cannot be ignored in data measurement and index selection.

3.4. Influence of Dust Deposition on Pigment Estimation

Root Mean Square Error (RMSE) and Relative Error (RE) were used to test the reliability and applicability of the estimated model. Generally, the smaller the RMSE and RE were, the higher the reliability of the model was.
The results are shown in Figure 4. As far as RMSE was concerned, the influence of dust deposition on three indexes (SR705, ND705, and CIrededge) and a multivariate linear model was similar. With the increase of dust, the RMSE of the regression models will increase first and decrease later. The RMSE under level of “Less dust” was the smallest. That was, the precision under “Less dust” was the highest. The estimation ability under “Medium dust” was weak.
For models established by SR705, ND705, and CIrededge, the RE under “Less dust” were all the smallest, which had strong applicability. However, for the multivariate linear regression model, RE had a significant change. As the amount of dust deposition increased, RE tended to decrease gradually, which was opposite to other model results. This situation showed that multivariate linear regression could improve the accuracy of the estimation model combined with three indexes, but it also had a particular comprehensive effect on prediction. Therefore, in the application of multivariate linear regression, the choice of index should be fully considered.
According to the above results, dust deposition affected the estimation accuracy of chlorophyll-a concentration of urban shrubs. The model based on ND705 was more affected by dust, while the SR705 and CIrededge index were more suitable to establish a prediction model. The degree of decrease or increase of estimation accuracy, RMSE value and RE value were all related to the indexes used to establish the regression model.

4. Discussion

This study achieved chlorophyll-a content estimation with reflectance spectroscopy, which provided a reasonable basis for accurate detection of shrub chlorophyll content. The study constructed optimized vegetation indexes to reduce the dimension of spectral data. It made the research more achievable and accurate. Previous studies [20,21,35] can also estimate chlorophyll concentration, but research objects were mostly single crops or densely covered areas with single vegetation type. Therefore, this study is meaningful to the analysis of urban vegetation growth environment and the estimation of important component parameters. At the same time, the study can further explore the combination of different spectral characteristics to highlight the advantages of vegetation indexes and improve the estimation accuracy and universality of the whole model.
Based on the results, we can explore the possibility and feasibility of combining this work with satellite images and transforming the leaf spectral scale to the canopy spectral scale of satellite remote sensing. However, the corresponding mechanism of canopy spectrum from satellite images is more complex, which can be affected by several factors, such as canopy structure, leaf composition, biochemical parameters and so on. Many scholars used radiative transfer models to simulate vegetation canopy spectrum [36,37,38,67,68]. Studies explored the best predictive model and vegetation indexes and used the converted spectrum to estimate the ecophysiological functioning of vegetation [69]. This study will also focus on these methods. We aim at combining the ground spectral data, dust deposition data, and satellite images to obtain the chlorophyll estimation model and dust deposition level information from the canopy of vegetation. It can provide a basis for the selection of chlorophyll concentration estimation models with different dust deposition levels.
Besides, this research also studied the influence of dust deposition on chlorophyll concentration prediction. Dust was divided into three grades for classification discussion, which had strict requirements on the processing operation and grade definition of the collected data. The dust deposition capacity of different tree species cannot be generalized, and a reasonable judgment standard was needed. The conclusions of this study were based on much-measured data, which were scientific and reliable, but it required further exploration for other tree species. The sample selected in this study was shrub, which made the conclusions not applicable to different vegetation types. Simultaneously, some scholars [41] have researched strictly controlling the amount of dust manually and discussed the influence of definite dust amounts on leaf spectrum and element content, which is also an effective method to study dust deposition.
Last but not least, the influence of dust on pigment concentration should be considered in the high-precision estimation. The selection of vegetation indexes is also crucial. This study provided a theoretical basis for high-precision estimation of pigment concentration by using spectral data. However, because urban vegetation was mainly shrubs that were easy to collect, and research cannot reflect the spatial distribution of chlorophyll content in urban vegetation, there were still some limitations in tree species and spatial analysis. Therefore, in the future, research should expand the sampling tree species, improve the influence level and classification standard of dust deposition, and consider combining spectral data with high-resolution remote sensing images to reflect the advantages of reflectance spectroscopy technology in this field.

5. Conclusions

Based on the leaf spectrum, measured pigment concentration, and dust deposition data of typical shrubs in Shanghai, this paper analyzed the influence of different dust deposition levels on the relationship between pigment concentration, reflectance spectrum, and vegetation index. Based on reflectance spectroscopy, the chlorophyll-a concentration of urban shrub was estimated, and the impact of dust on the estimation accuracy was analyzed. It was a relatively new attempt to analyze the leaf dust stress factors on the quantitative study of plant pigment. It also had significant value in monitoring the growth and pigment changes of urban vegetation with high precision. The conclusions were as follows:
  • Through preliminary guessing, the leaf chlorophyll concentration prediction can be achieved by using reflectance spectroscopy data. After being validated with actual remote sensing data, the appropriate sensitive spectral bands and sensitive vegetation indexes can improve the accuracy of the estimation model.
  • Dust deposition can obviously affect the correlation between vegetation chlorophyll and spectrum. The sensitive spectral bands (680−710 nm) around the red edge had a relatively high negative correlation with the chlorophyll-a concentration, but when the dust deposition level increased to “medium dust” or “heavy dust”, the correlation was significantly reduced. Some sensitive vegetation indexes (SR705, ND705, MC705, MSR705, CIrededge) also showed the same pattern.
  • Dust deposition affected the accuracy of the application of reflectance spectroscopy to chlorophyll concentration estimation. Different sensitive vegetation indexes had different effects. SR705 and CIrededge vegetation indexes were suitable to establish a chlorophyll-a concentration prediction model. The prediction effect under the level of “Less dust” was the best, which also proved that the deposition of dust had a significant interference effect on the estimation of chlorophyll-a concentration.

Author Contributions

Conceptualization, W.L. and D.X.; formal analysis, X.Y.; funding acquisition, W.L.; investigation, X.Y.; methodology, X.Y. and T.S.; software, T.S.; validation, T.S. and Y.S.; visualization, Y.S.; writing—original draft, W.L. and T.S.; writing—review and editing, X.Y. and D.X. All authors have read and agreed to the published version of the manuscript.

Funding

This research was funded by the National Natural Science Foundation of China, grant number 41730642, 41571047 and 41701388.

Data Availability Statement

Data sharing not applicable.

Conflicts of Interest

The authors declare no conflict of interest.

References

  1. Amato-Lourenco, L.F.; Moreira, T.C.L.; de Oliveira Souza, V.C.; Barbosa, F.B.; Saiki, M.; Saldiva, P.; Mauad, T. The influence of atmospheric particles on the elemental content of vegetables in urban gardens of Sao Paulo, Brazil. Environ. Pollut. 2016, 216, 125–134. [Google Scholar] [CrossRef]
  2. Liang, J.; Fang, H.; Zhang, T.; Wang, X.; Liu, Y. Heavy metal in leaves of twelve plant species from seven different areas in Shanghai, China. Urban For. Urban Green. 2017, 27, 390–398. [Google Scholar] [CrossRef]
  3. Gillissen, A.; Gessner, C.; Hammerschmidt, S.; Hoheisel, G.; Wirtz, H. Gesundheitliche Bedeutung inhalierter Stäube. DMW-Dtsch. Med. Wochenschr. 2006, 131, 639–644. [Google Scholar] [CrossRef]
  4. Iwai, K.; Mizuno, S.; Miyasaka, Y.; Mori, T. Correlation between suspended particles in the environmental air and causes of disease among inhabitants: Cross-sectional studies using the vital statistics and air pollution data in Japan. Environ. Res. 2005, 99, 106–117. [Google Scholar] [CrossRef]
  5. Cao, Z.; Wang, Q.; Zheng, C. Best hyperspectral indices for tracing leaf water status as determined from leaf dehydration experiments. Ecol. Indic. 2015, 54, 96–107. [Google Scholar] [CrossRef]
  6. Lin, W.; Li, Y.; Du, S.; Zheng, Y.; Gao, J.; Sun, T. Effect of dust deposition on spectrum-based estimation of leaf water content in urban plant. Ecol. Indic. 2019, 104, 41–47. [Google Scholar] [CrossRef]
  7. Kira, O.; Linker, R.; Gitelson, A. Non-destructive estimation of foliar chlorophyll and carotenoid contents: Focus on informative spectral bands. Int. J. Appl. Earth Obs. Geoinf. 2015, 38, 251–260. [Google Scholar] [CrossRef]
  8. Freer-Smith, P.; Holloway, S.; Goodman, A. The uptake of particulates by an urban woodland: Site description and particulate composition. Environ. Pollut. 1997, 95, 27–35. [Google Scholar] [CrossRef]
  9. Shah, K.; Amin, N.U.; Ahmad, I.; Shah, S.; Hussain, K. Dust particles induce stress, reduce various photosynthetic pigments and their derivatives in ficus benjamina: A landscape plant. Int. J. Agric. Biol. 2017, 19, 1469–1474. [Google Scholar] [CrossRef]
  10. Rai, P.K.; Panda, L.L.S. Dust capturing potential and air pollution tolerance index (APTI) of some road side tree vegetation in Aizawl, Mizoram, India: An Indo-Burma hot spot region. Air Qual. Atmos. Health 2013, 7, 93–101. [Google Scholar] [CrossRef]
  11. Zafra, C.; Temprano, J.; Tejero, I. The physical factors affecting heavy metals accumulated in the sediment deposited on road surfaces in dry weather: A review. Urban Water J. 2016, 14, 639–649. [Google Scholar] [CrossRef]
  12. Ram, S.; Kumar, R.; Chaudhuri, P.; Chanda, S.; Santra, S.; Sudarshan, M.; Chakraborty, A. Physico-chemical characterization of street dust and re-suspended dust on plant canopies: An approach for finger printing the urban environment. Ecol. Indic. 2014, 36, 334–338. [Google Scholar] [CrossRef]
  13. Verrelst, J.; Schaepman, M.; Malenovský, Z.; Clevers, J. Effects of woody elements on simulated canopy reflectance: Implications for forest chlorophyll content retrieval. Remote Sens. Environ. 2010, 114, 647–656. [Google Scholar] [CrossRef] [Green Version]
  14. Blackburn, G.A.; Ferwerda, J.G. Retrieval of chlorophyll concentration from leaf reflectance spectra using wavelet analysis. Remote Sens. Environ. 2008, 112, 1614–1632. [Google Scholar] [CrossRef]
  15. Cheng, T.; Rivard, B.; Sanchez-Azofeifa, A.; Feng, J.; Calvo-Polanco, M. Continuous wavelet analysis for the detection of green attack damage due to mountain pine beetle infestation. Remote Sens. Environ. 2010, 114, 899–910. [Google Scholar] [CrossRef]
  16. Ryu, C.; Suguri, M.; Umeda, M. Multivariate analysis of nitrogen content for rice at the heading stage using reflectance of airborne hyperspectral remote sensing. Field Crop. Res. 2011, 122, 214–224. [Google Scholar] [CrossRef] [Green Version]
  17. Gray, S.B.; Dermody, O.; DeLucia, E.H. Spectral reflectance from a soybean canopy exposed to elevated CO2 and O3. J. Exp. Bot. 2010, 61, 4413–4422. [Google Scholar] [CrossRef] [Green Version]
  18. Zhao, D.; Reddy, K.R.; Kakani, V.G.; Read, J.J.; Koti, S. Canopy reflectance in cotton for growth assessment and lint yield prediction. Eur. J. Agron. 2007, 26, 335–344. [Google Scholar] [CrossRef]
  19. Cabungcag, L.; Madroñal, M.H.; Olila, J.B.A.; Quilatan, D.P.; Galarpe, V.R.K.R. Dust and Chlorophyll Contents of Selected Plant Species Along the Highway in Cagayan de Oro City, Philippines. Adv. Sci. Eng. Med. 2017, 9, 725–730. [Google Scholar] [CrossRef]
  20. Zulfa, A.; Norizah, K.; Hamdan, O.; Zulkifly, S.; Faridah-Hanum, I.; Rhyma, P. Discriminating trees species from the relationship between spectral reflectance and chlorophyll contents of mangrove forest in Malaysia. Ecol. Indic. 2019, 111, 106024. [Google Scholar] [CrossRef]
  21. Zhao, Y.; Yan, C.; Lu, S.; Wang, P.; Qiu, G.Y.; Li, R. Estimation of chlorophyll content in intertidal mangrove leaves with different thicknesses using hyperspectral data. Ecol. Indic. 2019, 106, 105511. [Google Scholar] [CrossRef]
  22. Delegido, J.; Van Wittenberghe, S.; Verrelst, J.; Ortiz, V.; Veroustraete, F.; Valcke, R.; Samson, R.; Rivera, J.P.; Tenjo, C.; Moreno, J. Chlorophyll content mapping of urban vegetation in the city of Valencia based on the hyperspectral NAOC index. Ecol. Indic. 2014, 40, 34–42. [Google Scholar] [CrossRef]
  23. Shah, K.; Amin, N.U.; Ahmad, I.; Ara, G. Impact assessment of leaf pigments in selected landscape plants exposed to roadside dust. Environ. Sci. Pollut. Res. 2018, 25, 23055–23073. [Google Scholar] [CrossRef] [PubMed]
  24. Shah, K.; Amin, N.U.; Ahmad, I.; Ara, G.; Ren, X.; Xing, L. Effects of Chronic Dust Load On Leaf Pigments of the Landscape Plant Murraya Paniculata. Gesunde Pflanz. 2019, 71, 249–258. [Google Scholar] [CrossRef]
  25. Prusty, B.A.K.; Mishra, P.; Azeez, P. Dust accumulation and leaf pigment content in vegetation near the national highway at Sambalpur, Orissa, India. Ecotoxicol. Environ. Saf. 2005, 60, 228–235. [Google Scholar] [CrossRef]
  26. Lin, W.; Sun, Y.; Wang, D.; Li, Y.; Yu, X. Estimation model of dust deposition capacity of common vegetation based on spectral characteristics in Shanghai, China. Sustain. Cities Soc. 2021, 70, 102915. [Google Scholar] [CrossRef]
  27. Brackx, M.; Van Wittenberghe, S.; Verhelst, J.; Scheunders, P.; Samson, R. Hyperspectral leaf reflectance of Carpinus betulus L. saplings for urban air quality estimation. Environ. Pollut. 2017, 220, 159–167. [Google Scholar] [CrossRef]
  28. Zajec, L.; Gradinjan, D.; Klančnik, K.; Gaberščik, A. Limestone dust alters the optical properties and traits of Fagus sylvatica leaves. Trees 2016, 30, 2143–2152. [Google Scholar] [CrossRef]
  29. Zhao, Y.; Lei, S.; Yang, X.; Gong, C.; Wang, C.; Cheng, W.; Li, H.; She, C. Study on Spectral Response and Estimation of Grassland Plants Dust Retention Based on Hyperspectral Data. Remote Sens. 2020, 12, 2019. [Google Scholar] [CrossRef]
  30. Chen, J.M. Evaluation of Vegetation Indices and a Modified Simple Ratio for Boreal Applications. Can. J. Remote Sens. 1996, 22, 229–242. [Google Scholar] [CrossRef]
  31. Nichol, C.J.; Grace, J. Determination of leaf pigment content in Calluna vulgaris shoots from spectral reflectance. Int. J. Remote Sens. 2010, 31, 5409–5422. [Google Scholar] [CrossRef]
  32. Han, Y.; Hao, T.; Li, Z.; Li, Y. Inversion of the fluorescence spectral information of vegetation chlorophyll based on the inverted Gaussian model. J. Quant. Spectrosc. Radiat. Transf. 2019, 242, 106761. [Google Scholar] [CrossRef]
  33. Ali, A.M.; Darvishzadeh, R.; Skidmore, A.; Gara, T.; O’Connor, B.; Roeoesli, C.; Heurich, M.; Paganini, M. Comparing methods for mapping canopy chlorophyll content in a mixed mountain forest using Sentinel-2 data. Int. J. Appl. Earth Obs. Geoinfor. 2019, 87, 102037. [Google Scholar] [CrossRef]
  34. Darvishzadeh, R.; Skidmore, A.; Schlerf, M.; Atzberger, C. Inversion of a radiative transfer model for estimating vegetation LAI and chlorophyll in a heterogeneous grassland. Remote Sens. Environ. 2008, 112, 2592–2604. [Google Scholar] [CrossRef]
  35. Qi, H.; Zhu, B.; Kong, L.; Yang, W.; Zou, J.; Lan, Y.; Zhang, L. Hyperspectral Inversion Model of Chlorophyll Content in Peanut Leaves. Appl. Sci. 2020, 10, 2259. [Google Scholar] [CrossRef] [Green Version]
  36. Zarco-Tejada, P.; Hornero, A.; Beck, P.; Kattenborn, T.; Kempeneers, P.; Hernández-Clemente, R. Chlorophyll content estimation in an open-canopy conifer forest with Sentinel-2A and hyperspectral imagery in the context of forest decline. Remote Sens. Environ. 2019, 223, 320–335. [Google Scholar] [CrossRef]
  37. Xu, M.; Liu, R.; Chen, J.M.; Liu, Y.; Shang, R.; Ju, W.; Wu, C.; Huang, W. Retrieving leaf chlorophyll content using a matrix-based vegetation index combination approach. Remote Sens. Environ. 2019, 224, 60–73. [Google Scholar] [CrossRef]
  38. Lv, J.; Yan, Z.G. Retrieval of Chlorophyll Content from Leaf Reflectance Spectra Using Support Vector Machine. Appl. Mech. Mater. 2014, 602, 2313–2316. [Google Scholar] [CrossRef]
  39. Lunagaria, M.M.; Patel, H.R. Evaluation of PROSAIL inversion for retrieval of chlorophyll, leaf dry matter, leaf angle, and leaf area index of wheat using spectrodirectional measurements. Int. J. Remote Sens. 2018, 40, 8125–8145. [Google Scholar] [CrossRef]
  40. Prajapati, S.K.; Tripathi, B.D. Seasonal Variation of Leaf Dust Accumulation and Pigment Content in Plant Species Exposed to Urban Particulates Pollution. J. Environ. Qual. 2008, 37, 865–870. [Google Scholar] [CrossRef]
  41. Ma, B.; Li, X.; Liang, A.; Chen, Y.; Che, D. Experimental and Numerical Investigation of Dustfall Effect on Remote Sensing Retrieval Accuracy of Chlorophyll Content. Sensors 2019, 19, 5530. [Google Scholar] [CrossRef] [Green Version]
  42. Goetz, A.F.; Vane, G.; Solomon, J.E.; Rock, B.N. Imaging Spectrometry for Earth Remote Sensing. Science 1985, 228, 1147–1153. [Google Scholar] [CrossRef] [PubMed]
  43. Sun, T.; Lin, W.; Li, Y.; Guo, P.; Zeng, Y. Effect of Different Dust Weight Levels on Unban Canopy Reflectance Spectroscopy. Spectrosc. Spectr. Anal. 2017, 37, 2539–2545. [Google Scholar]
  44. Jouraeva, V.A.; Johnson, D.L.; Hassett, J.P.; Nowak, D.J. Differences in accumulation of PAHs and metals on the leaves of Tilia×euchlora and Pyrus calleryana. Environ. Pollut. 2002, 120, 331–338. [Google Scholar] [CrossRef]
  45. Wessman, C.A.; Aber, J.D.; Peterson, D.L.; Melillo, J.M. Foliar analysis using near infrared reflectance spectroscopy. Can. J. For. Res. 1988, 18, 6–11. [Google Scholar] [CrossRef] [Green Version]
  46. Hansen, P.; Schjoerring, J. Reflectance measurement of canopy biomass and nitrogen status in wheat crops using normalized difference vegetation indices and partial least squares regression. Remote Sens. Environ. 2003, 86, 542–553. [Google Scholar] [CrossRef]
  47. Haboudane, D. Hyperspectral vegetation indices and novel algorithms for predicting green LAI of crop canopies: Modeling and validation in the context of precision agriculture. Remote Sens. Environ. 2004, 90, 337–352. [Google Scholar] [CrossRef]
  48. Lu, T.; Lin, X.; Chen, J.; Huang, D.; Li, M. Atmospheric particle retention capacity and photosynthetic responses of three common greening plant species under different pollution levels in Hangzhou. Glob. Ecol. Conserv. 2019, 20, e00783. [Google Scholar] [CrossRef]
  49. Chai, Y.; Zhu, N.; Han, H. Dust removal effect of urban tree species in Harbin. J. Appl. Ecol. 2002, 13, 1121–1126. [Google Scholar] [CrossRef]
  50. Xu, J.H.; Yu, J.T. Air Dustfall Impact on Spectrum of Ficus Microcarpa’s Leaf. Adv. Mater. Res. 2013, 655, 813–815. [Google Scholar] [CrossRef]
  51. Lichtenthaler, H.K. [34] Chlorophylls and carotenoids: Pigments of photosynthetic biomembranes. In Methods in Enzymology; Academic Press: Cambridge, MA, USA, 1987; pp. 350–382. [Google Scholar] [CrossRef]
  52. Hu, B.; Huang, H.; Ji, Y.; Zhao, X.; Qi, J.; Zhang, H.; Zhang, G. Evaluation of the optimum concentration of chlorophyll extract for determination of chlorophyll content by spectrophotometry. Pratacultural Sci. 2018, 35, 1965–1974. [Google Scholar] [CrossRef]
  53. Rai, P.K.; Panda, L.L.S. Leaf dust deposition and its impact on biochemical aspect of some roadside plants in Aizawl, Mizoram, North-east India. Int. Res. J. Environ. Sci. 2014, 3, 14–19. [Google Scholar]
  54. Zhu, J.; Yu, Q.; Zhu, H.; He, W.; Xu, C.; Liao, J.; Zhu, Q.; Su, K. Response of dust particle pollution and construction of a leaf dust deposition prediction model based on leaf reflection spectrum characteristics. Environ. Sci. Pollut. Res. 2019, 26, 36764–36775. [Google Scholar] [CrossRef] [PubMed]
  55. Zhu, J.; Zhang, X.; He, W.; Yan, X.; Yu, Q.; Xu, C.; Jiang, Q.; Huang, H.; Wang, R. Response of plant reflectance spectrum to simulated dust deposition and its estimation model. Sci. Rep. 2020, 10, 15803. [Google Scholar] [CrossRef] [PubMed]
  56. Sims, D.A.; Gamon, J.A. Relationships between leaf pigment content and spectral reflectance across a wide range of species, leaf structures and developmental stages. Remote Sens. Environ. 2002, 81, 337–354. [Google Scholar] [CrossRef]
  57. Rouse, J.W.; Haas, R.H.; Schell, J.A.; Deering, D.W. Monitoring Vegetation Systems in the Great Plains with ERTS. In Proceedings of the Third Earth Resources Technology Satellite-1 Symposium, Washington, DC, USA, 10–14 December 1973; pp. 310–317. [Google Scholar]
  58. Daughtry, C.S.T.; Walthall, C.L.; Kim, M.S.; de Colstoun, E.B.; McMurtrey, J.E. Estimating Corn Leaf Chlorophyll Concentration from Leaf and Canopy Reflectance. Remote Sens. Environ. 2000, 74, 229–239. [Google Scholar] [CrossRef]
  59. Wu, C.; Niu, Z.; Tang, Q.; Huang, W. Estimating chlorophyll content from hyperspectral vegetation indices: Modeling and validation. Agric. For. Meteorol. 2008, 148, 1230–1241. [Google Scholar] [CrossRef]
  60. Merzlyak, M.N.; Gitelson, A.A.; Chivkunova, O.B.; Rakitin, V.Y. Non-destructive optical detection of pigment changes during leaf senescence and fruit ripening. Physiol. Plant. 1999, 106, 135–141. [Google Scholar] [CrossRef] [Green Version]
  61. Penuelas, J.; Filella, I.; Gamon, J. Assessment of photosynthetic radiation-use efficiency with spectral reflectance. New Phytol. 1995, 131, 291–296. [Google Scholar] [CrossRef]
  62. Zhang, P.-F.; Yin, J.-Q.; Bao, A.-M.; Yao, F.; Liu, J.-P. Using hyperspectral indices to measure the effect of mine dust on the growth of three typical desert plants. Guang Pu Xue Yu Guang Pu Fen Xi 2014, 34, 2162–2168. [Google Scholar] [PubMed]
  63. Gitelson, A.A.; Gritz, Y.; Merzlyak, M.N. Relationships between leaf chlorophyll content and spectral reflectance and algorithms for non-destructive chlorophyll assessment in higher plant leaves. J. Plant Physiol. 2003, 160, 271–282. [Google Scholar] [CrossRef] [PubMed]
  64. Gitelson, A.; Merzlyak, M.N. Spectral Reflectance Changes Associated with Autumn Senescence of Aesculus hippocastanum L. and Acer platanoides L. Leaves. Spectral Features and Relation to Chlorophyll Estimation. J. Plant Physiol. 1994, 143, 286–292. [Google Scholar] [CrossRef]
  65. Datt, B. Remote Sensing of Chlorophyll a, Chlorophyll b, Chlorophyll a+b, and Total Carotenoid Content in Eucalyptus Leaves. Remote Sens. Environ. 1998, 66, 111–121. [Google Scholar] [CrossRef]
  66. Pearson, K. Notes on the History of Correlation. Biometrika 1920, 13, 25–45. [Google Scholar] [CrossRef]
  67. Gutman, G.; Skakun, S.; Gitelson, A. Revisiting the use of red and near-infrared reflectances in vegetation studies and numerical climate models. Sci. Remote Sens. 2021, 4, 100025. [Google Scholar] [CrossRef]
  68. Gitelson, A.; Arkebauer, T.; Viña, A.; Skakun, S.; Inoue, Y. Evaluating plant photosynthetic traits via absorption coefficient in the photosynthetically active radiation region. Remote Sens. Environ. 2021, 258, 112401. [Google Scholar] [CrossRef]
  69. Inoue, Y.; Guérif, M.; Baret, F.; Skidmore, A.; Gitelson, A.; Schlerf, M.; Darvishzadeh, R.; Olioso, A. Simple and robust methods for remote sensing of canopy chlorophyll content: A comparative analysis of hyperspectral data for different types of vegetation. Plant Cell Environ. 2016, 39, 2609–2623. [Google Scholar] [CrossRef] [Green Version]
Figure 1. Study area and sample locations.
Remotesensing 13 03570 g001
Figure 2. Reflectance spectra of species under different dust deposition and pigment concentration.
Remotesensing 13 03570 g002
Figure 3. Verification of different chlorophyll-a concentration prediction models under three dust deposition levels.
Remotesensing 13 03570 g003
Figure 4. Variation diagram of RMSE and RE of prediction models under different dust deposition levels.
Remotesensing 13 03570 g004
Table 1. Pigment related index information.
IndexFormulaSource
SR680R800/R680Sims and Gamon [56]
SR705R750/R705Sims and Gamon [56]
mSR705(R705 − R445)/(R705 + R445)Sims and Gamon [56]
ND680(R800 − R680)/(R800 + R680)Sims and Gamon [56]
ND705(R750 − R705)/(R750 + R705)Sims and Gamon [56]
mND705(R750 − R705)/(R750 + R705−2 R445)Sims and Gamon [56]
NDVI670(R800 − R670)/(R800 + R670)Rouse et al. [57]
MSR670[(R800/R670) − 1]/sqrt[(R800/R670) + 1]Chen [30]
MC670[(R700 − R670) − 0.2 × (R700 − R550)](R700/R670)Daughtry et al. [58]
MC/OS670[(R700 − R670) − 0.2 × (R700 − R550)](R700/R670)/[(1 + 0.16)(R800 − R670)/(R800 + R670 + 0.16)]Daughtry et al. [58]
MSR705[(R750/R705) − 1]/sqrt
R750/R705) + 1]
Wu et al. [59]
MC705R750 − R705) − 0.2 × (R750 − R550)
R750/R705)
Wu et al. [59]
MC/OS705[(R750 − R705) − 0.2 × (R750 − R550)](R750/R705)/[(1 + 0.16)(R750 − R705)/(R750 + R705 + 0.16)]Wu et al. [59]
PRI(R531 − R570)/(R531 + R570)Wu et al. [59]
SIPI(R800 − R445)/(R800 − R680)Merzlyak et al. [60]
PSRI(R680 − R500)/R750Penuelas et al. [61]
RARSaR675/R700Zhang et al. [62]
RSSRbR800/R635Zhang et al. [62]
PSNDb(R800 − R635)/(R800 + R635)Zhang et al. [62]
RARSbR675/R650 × R700Zhang et al. [62]
CIrededge(R770/R710) − 1Gitelson et al. [63]
CRIrededge(R510)−1 − (R730)−1 × R770Gitelson et al. [63]
G1(R800 − R700)/(R800 + R700)Gitelson and Merzlyak [64]
D(R860/R708)(R700)Datt [65]
G2(R750 − R800)/((R695 − R740) − 1)Gitelson et al. [63]
Table 2. The correlation coefficient between leaf pigment and reflectance spectrum under three dust deposition levels.
Wave-Length (nm)Less Dust (N = 75)Medium Dust (N = 75)Heavy Dust (N = 75)
CaCbCCcPigmentCaCbCCcPigmentCaCbCCcPigment
445−0.507 **−0.380 **−0.486 **−0.303 **−0.498 **−0.381 **−0.212−0.332 **−0.312 **−0.352 **−0.371 **−0.321 **−0.382 **−0.204−0.386 **
500−0.548 **−0.374 **−0.507 **−0.358 **−0.526 **−0.437 **−0.249 *−0.383 **−0.333 **−0.401 **−0.465 **−0.355 **−0.458 **−0.287 *−0.470 **
510−0.577 **−0.370 **−0.523 **−0.395 **−0.546 **−0.494 **−0.280 *−0.432 **−0.376 **−0.452 **−0.542 **−0.371 **−0.513 **−0.368 **−0.535 **
531−0.634 **−0.360 **−0.553 **−0.469 **−0.585 **−0.588 **−0.331 **−0.514 **−0.463 **−0.540 **−0.667 **−0.390 **−0.600 **−0.504 **−0.639 **
550−0.651 **−0.370 **−0.568 **−0.470 **−0.599 **−0.600 **−0.346 **−0.528 **−0.442 **−0.550 **−0.679 **−0.39 *−0.609 **−0.505 **−0.648 **
570−0.648 **−0.374 **−0.568 **−0.460 **−0.597 **−0.593 **−0.344 **−0.523 **−0.411 **−0.539 **−0.669 **−0.397 **−0.605 **−0.482 **−0.639 **
635−0.605 **−0.374 **−0.542 **−0.413 **−0.566 **−0.524 **−0.302 **−0.461 **−0.337 **−0.471 **−0.577 **−0.389 **−0.543 **−0.379 **−0.564 **
650−0.572 **−0.372 **−0.521 **−0.381 **−0.542 **−0.473 **−0.272 *−0.416 **−0.308 **−0.426 **−0.522 **−0.379 **−0.504 **−0.330 **−0.520 **
670−0.541 **−0.368 **−0.501 **−0.355 **−0.519 **−0.395 **−0.224−0.346 **−0.271 *−0.357 **−0.449 **−0.362 **−0.451 **−0.258 *−0.458 **
675−0.537 **−0.364 **−0.496 **−0.354 **−0.515 **−0.386 **−0.216−0.337 **−0.275 *−0.350 **−0.447 **−0.362 **−0.449 **−0.257 *−0.456 **
680−0.537 **−0.361 **−0.495 **−0.358 **−0.514 **−0.385 **−0.213−0.335 **−0.284 *−0.349 **−0.455 **−0.366 **−0.456 **−0.266 *−0.464 **
695−0.641 **−0.376 **−0.565 **−0.455 **−0.593 **−0.556 **−0.316 **−0.487 **−0.372 **−0.501 **−0.635 **−0.403 **−0.586 **−0.435 **−0.614 **
700−0.678 **−0.385 **−0.592 **−0.483 **−0.623 **−0.593 **−0.344 **−0.523 **−0.390 **−0.536 **−0.691 **−0.410 **−0.624 **−0.485 **−0.658 **
705−0.688 **−0.399 **−0.604 **−0.473 **−0.633 **−0.595 **−0.355 **−0.528 **−0.383 **−0.540 **−0.703 **−0.411 **−0.632 **−0.494 **−0.667 **
708−0.683 **−0.405 **−0.604 **−0.453 **−0.630 **−0.585 **−0.356 **−0.523 **−0.373 **−0.533 **−0.697 **−0.409 **−0.628 **−0.489 **−0.662 **
710−0.675 **−0.409 **−0.601 **−0.437 **−0.625 **−0.576 **−0.355 **−0.517 **−0.366 **−0.527 **−0.690 **−0.406 **−0.622 **−0.485 **−0.656 **
730−0.474 **−0.354 **−0.453 **−0.206−0.454 **−0.405 **−0.268 *−0.372 **−0.297 **−0.385 **−0.554 **−0.353 **−0.512 **−0.415 **−0.543 **
740−0.330 **−0.283 *−0.333 **−0.091−0.325 **−0.282 *−0.184−0.258 *−0.257 *−0.276 *−0.490 **−0.332 **−0.462 **−0.379 **−0.491 **
750−0.227 *−0.231 *−0.246 *−0.014−0.232 *−0.192−0.122−0.174−0.22−0.194−0.452 **−0.321 **−0.433 **−0.354 **−0.460 **
770−0.16−0.201−0.1910.042−0.173−0.13−0.084−0.118−0.187−0.138−0.427 **−0.316 **−0.415 **−0.334 **−0.440 **
800−0.153−0.202−0.1880.052−0.169−0.124−0.082−0.114−0.179−0.133−0.423 **−0.317 **−0.413 **−0.329 **−0.437 **
860−0.15−0.208−0.1890.061−0.168−0.118−0.083−0.11−0.169−0.128−0.421 **−0.320 **−0.414 **−0.326 **−0.437 **
Note: (1) ** p < 0.01 (both tailed test), * p < 0.05 (both tailed test); N is the number of samples. (2) Ca is the concentration of chlorophyll-a; Cb is the concentration of chlorophyll-b; Cc is the concentration of carotenoids; C is the sum of Ca and Cb; pigment is the sum of the concentration of Ca, Cb, and Cc.
Table 3. The correlation coefficient between leaf pigment and vegetation indexes under three dust deposition levels.
IndexLess Dust (N = 75)Medium Dust (N = 75)Heavy Dust (N = 75)
CaCbCCcPig-MentCaCbCCcPig-MentCaCbCCcPig-Ment
SR6800.477 **0.325 **0.441 **0.316 **0.458 **0.313 **0.1640.268 *0.1770.271 *0.473 **0.387 **0.478 **0.2260.476 **
SR7050.816 **0.460 **0.710 **0.593 **0.749 **0.643 **0.418 **0.586 **0.327 **0.582 **0.736 **0.377 **0.637 **0.502 **0.673 **
mSR7050.0110.1410.073−0.070.058−0.124−0.123−0.1320.034−0.112−0.0660.120.015−0.142−0.013
ND6800.541 **0.334 **0.485 **0.404 **0.511 **0.370 **0.1910.316 **0.241 *0.324 **0.415 **0.320 **0.409 **0.234 *0.416 **
ND7050.786 **0.419 **0.673 **0.596 **0.715 **0.637 **0.378 **0.566 **0.352 **0.568 **0.718 **0.359 **0.617 **0.500 **0.654 **
mND7050.779 **0.374 **0.648 **0.614 **0.694 **0.607 **0.367 **0.542 **0.312 **0.539 **0.732 **0.304 **0.600 **0.543 **0.647 **
NDVI6700.546 **0.342 **0.491 **0.398 **0.517 **0.380 **0.2020.327 **0.230 *0.333 **0.411 **0.317 **0.406 **0.228 *0.411 **
MSR6700.516 **0.347 **0.476 **0.343 **0.494 **0.350 **0.1830.299 **0.1980.302 **0.453 **0.359 **0.452 **0.2240.453 **
MC670−0.468 **−0.163−0.360 **−0.406 **−0.395 **−0.493 **−0.291 *−0.437 **−0.350 **−0.452 **−0.453 **−0.098−0.329 **−0.445 **−0.382 **
TC/OS670−0.682 **−0.339 **−0.573 **−0.527 **−0.611 **−0.618 **−0.356 **−0.544 **−0.424 **−0.560 **−0.731 **−0.339 **−0.616 **−0.581 **−0.668 **
MC/OS670−0.540 **−0.204−0.423 **−0.461 **−0.462 **−0.618 **−0.356 **−0.544 **−0.424 **−0.560 **−0.731 **−0.339 **−0.616 **−0.581 **−0.668 **
MSR7050.808 **0.444 **0.698 **0.598 **0.739 **0.644 **0.403 **0.581 **0.339 **0.579 **0.730 **0.371 **0.631 **0.502 **0.667 **
MC7050.799 **0.406 **0.675 **0.643 **0.723 **0.596 **0.395 **0.548 **0.262 *0.536 **0.598 **0.288 *0.508 **0.360 **0.530 **
TC/OS705−0.779 **−0.439 **−0.678 **−0.567 **−0.716 **−0.661 **−0.421 **−0.599 **−0.383 **−0.603 **−0.724 **−0.410 **−0.644 **−0.511 **−0.681 **
MC/OS7050.766 **0.375 **0.640 **0.636 **0.690 **−0.661 **−0.421 **−0.599 **−0.383 **−0.603 **−0.724 **−0.410 **−0.644 **−0.511 **−0.681 **
PRI0.437 **0.310 **0.411 **0.1370.404 **0.244 *0.2150.248 *−0.1490.1960.1880.1420.184−0.0310.162
SIPI−0.314 **0.033−0.175−0.439 **−0.2260.0220.0230.0240.1750.052−0.328 **−0.179−0.289 *−0.236 *−0.307 **
PSRI0.353 **0.289 *0.349 **0.1790.353 **0.438 **0.280 *0.398 **0.375 **0.421 **0.179−0.0170.1040.2220.136
RARSa0.073−0.0650.0130.1040.0270.265 *0.1980.253 *0.1050.245 *0.045−0.159−0.0470.145−0.016
RSSRb0.649 **0.410 **0.585 **0.435 **0.610 **0.511 **0.306 **0.455 **0.274 *0.455 **0.609 **0.382 **0.560 **0.372 **0.579 **
PSNDb0.631 **0.362 **0.552 **0.471 **0.584 **0.534 **0.296 **0.465 **0.310 **0.470 **0.556 **0.341 **0.508 **0.368 **0.530 **
RARSb−0.663 **−0.394 **−0.587 **−0.469 **−0.616 **−0.558 **−0.319 **−0.490 **−0.385 **−0.505 **−0.607 **−0.410 **−0.572 **−0.388 **−0.592 **
CIrededge0.813 **0.471 **0.714 **−0.567 **0.749 **0.633 **0.422 **0.583 **0.306 **0.575 **0.737 **0.362 **0.630 **0.507 **−0.668 **
CRIrededg0.565 **0.372 **0.517 **0.390 **0.539 **−0.113−0.052−0.094−0.338 **−0.1430.1080.130.129−0.1670.086
G10.753 **0.393 **0.640 **0.587 **0.683 **0.632 **0.361 **0.554 **0.372 **0.561 **0.696 **0.360 **0.603 **0.491 **0.640 **
D−0.465 **−0.316 **−0.430 **−0.279 *−0.442 **−0.364 **−0.203−0.317 **−0.321 **−0.340 **−0.593 **−0.417 **−0.567 **−0.428 **−0.595 **
G20.713 **0.306 **0.576 **0.589 **0.623 **0.634 **0.378 **0.563 **0.400 **0.574 **0.511 **0.1830.405 **0.425 **0.448 **
Note: (1) ** p < 0.01 (both tailed test), * p < 0.05 (both tailed test); N is the number of samples. (2) Ca is the concentration of chlorophyll-a; Cb is the concentration of chlorophyll-b; Cc is the concentration of carotenoids; C is the sum of Ca and Cb; pigment is the sum of the concentration of Ca, Cb, and Cc.
Table 4. Spectral models of chlorophyll-a concentration prediction.
Dust Deposition ConditionIndexRegression EquationR2
Less dustSR705y = 3.5774 *SR705 − 0.99450.6689
ND705y = 30.5050 *ND705 − 4.92570.6552
CIrededgey = 6.0072 *CIrededge + 1.65740.6848
SR705 + ND705 + CIrededgey = 0.9905 + 3.9483 *SR705−6.5772 *ND705
+ 0.3109 *CIrededge
0.6379
Medium dustSR705y = 3.3428 *SR705 − 1.12780.5115
ND705y = 29.6969 *ND705 − 5.58910.4551
CIrededgey = 4.3246 *CIrededge + 3.28810.4653
SR705 + ND705 + CIrededgey = −1.3681 + 0.7468 *SR705 + 14.6317 *ND705
+ 0.6737 *CIrededge
0.3915
Heavy dustSR705y = 4.3232 *SR705 − 3.45670.5653
ND705y = 26.2446 *ND705 − 3.71360.5476
CIrededgey = 7.103 *CIrededge − 0.07950.4408
SR705 + ND705 + CIrededgey = −6.7285 + 15.8466 *SR705 − 36.6609 *ND705
− 10.6375 *CIrededge
0.5486
Publisher’s Note: MDPI stays neutral with regard to jurisdictional claims in published maps and institutional affiliations.

