
Quality Analysis of Direct Georeferencing in Aspects of Absolute Accuracy and Precision for a UAV-Based Laser Scanning System


Abstract
:1. Introduction
1.1. Motivation
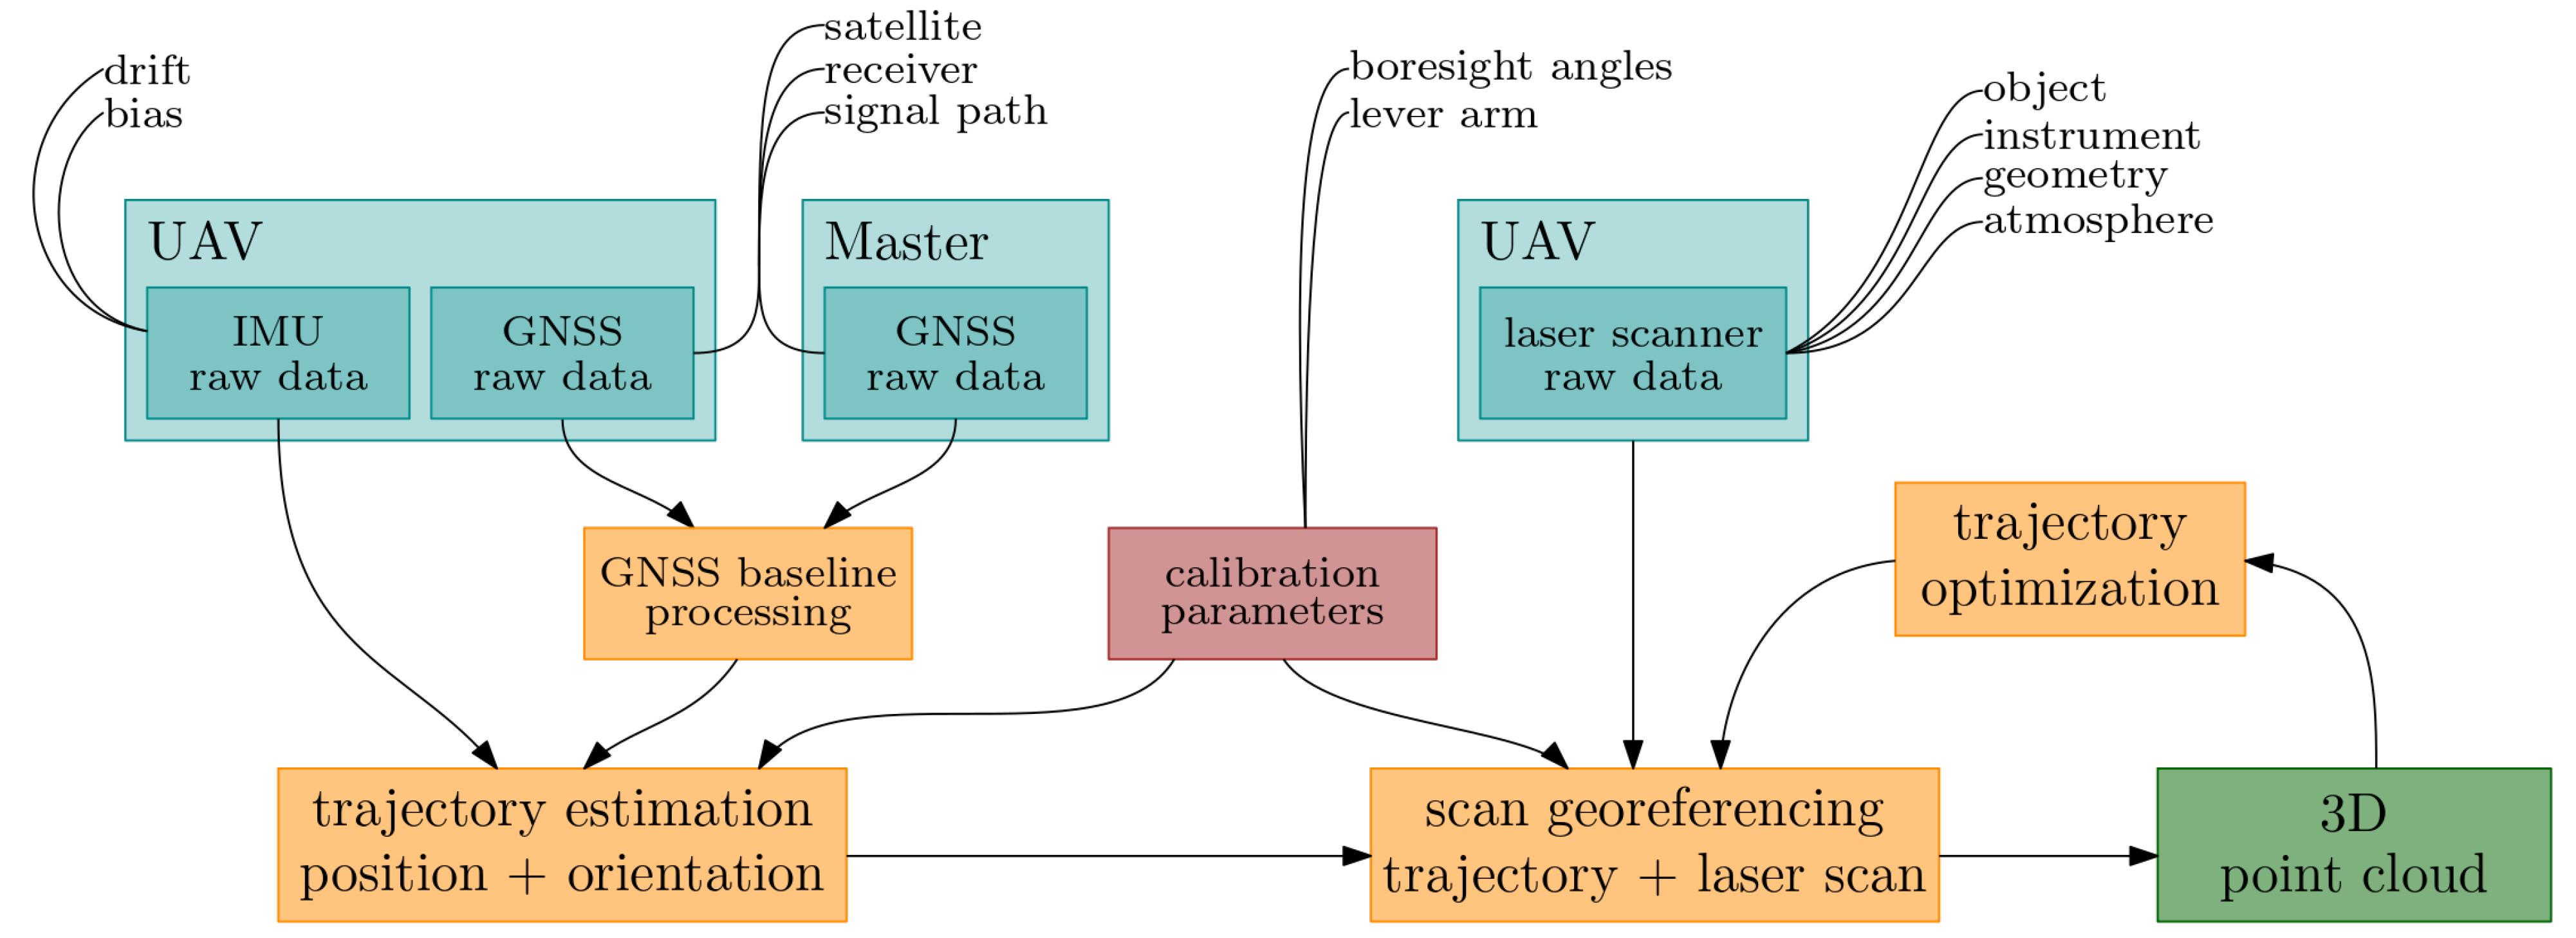
1.2. Methodology of UAV-Based Laser Scanning
1.3. Related Work
1.4. Research Scope
2. Materials and Methods
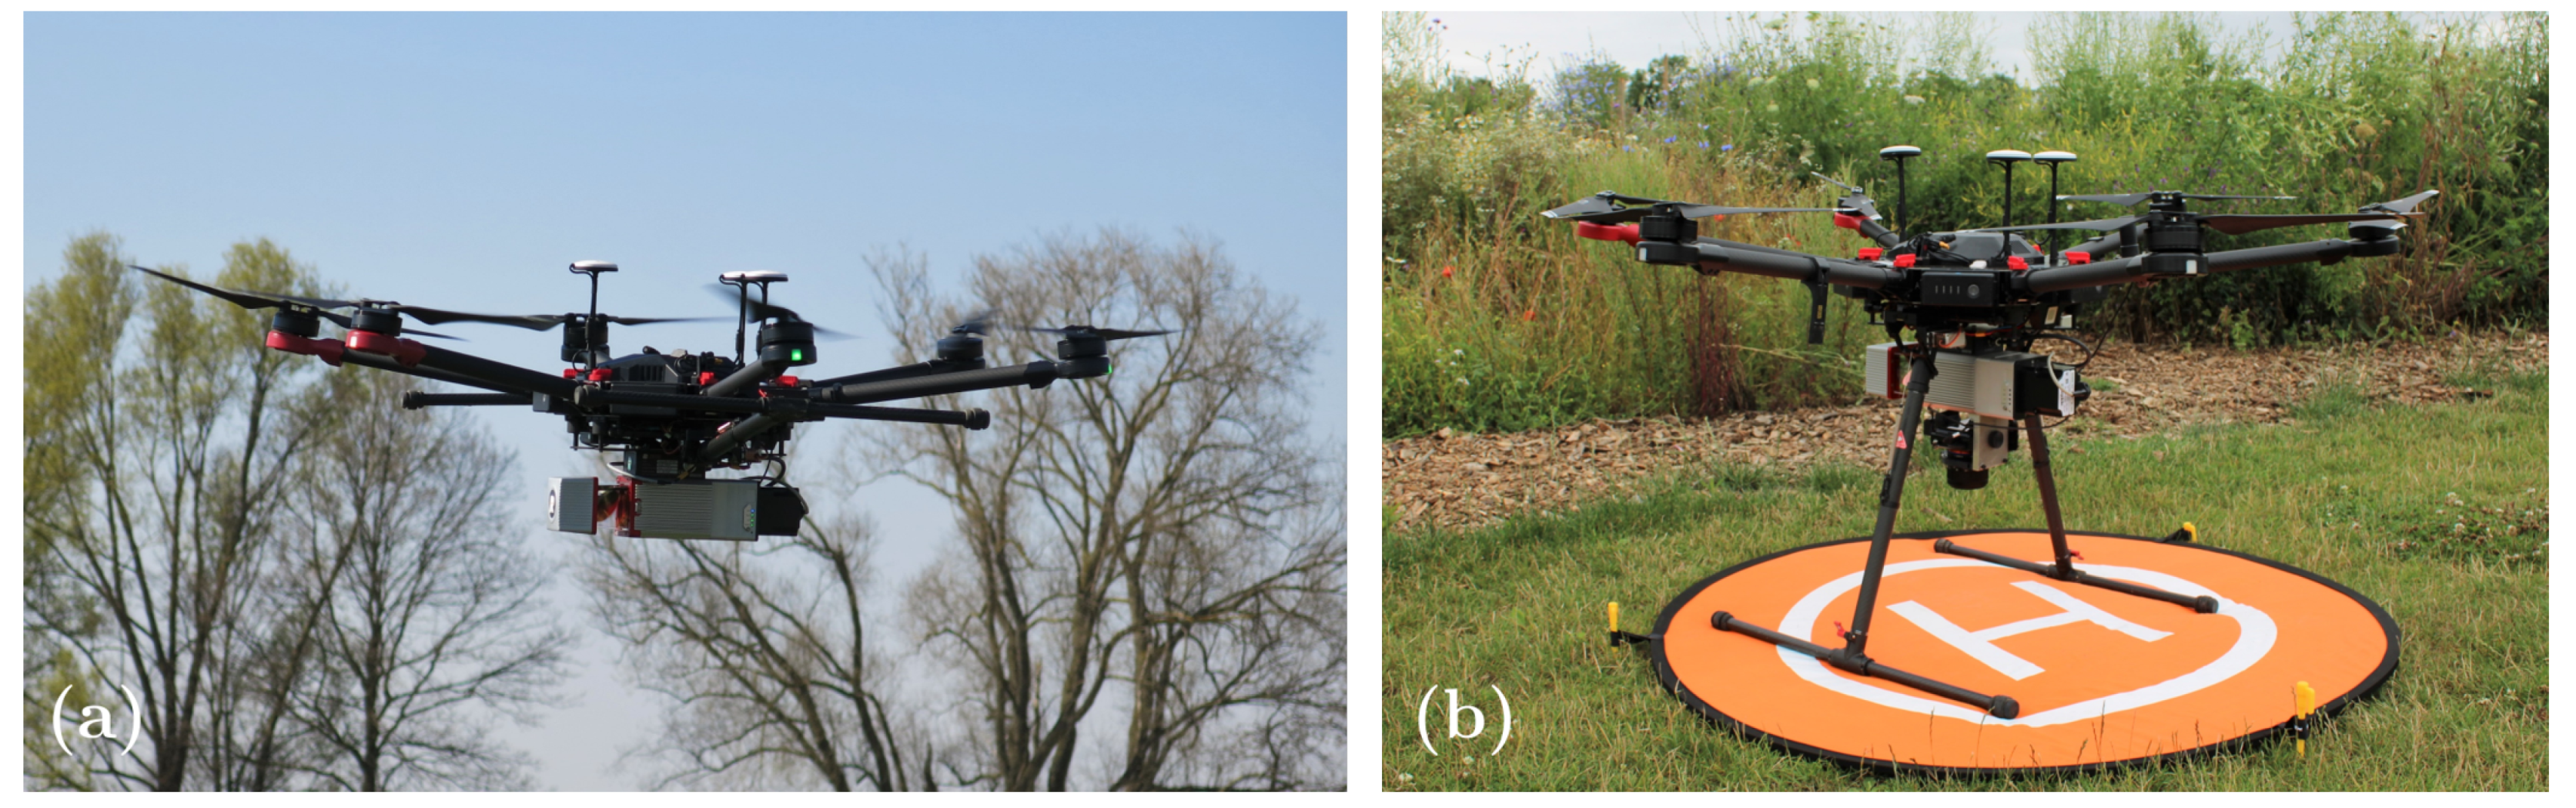
2.1. UAV-Based Laser Scanning System
2.2. Evaluation Strategy
- (1)
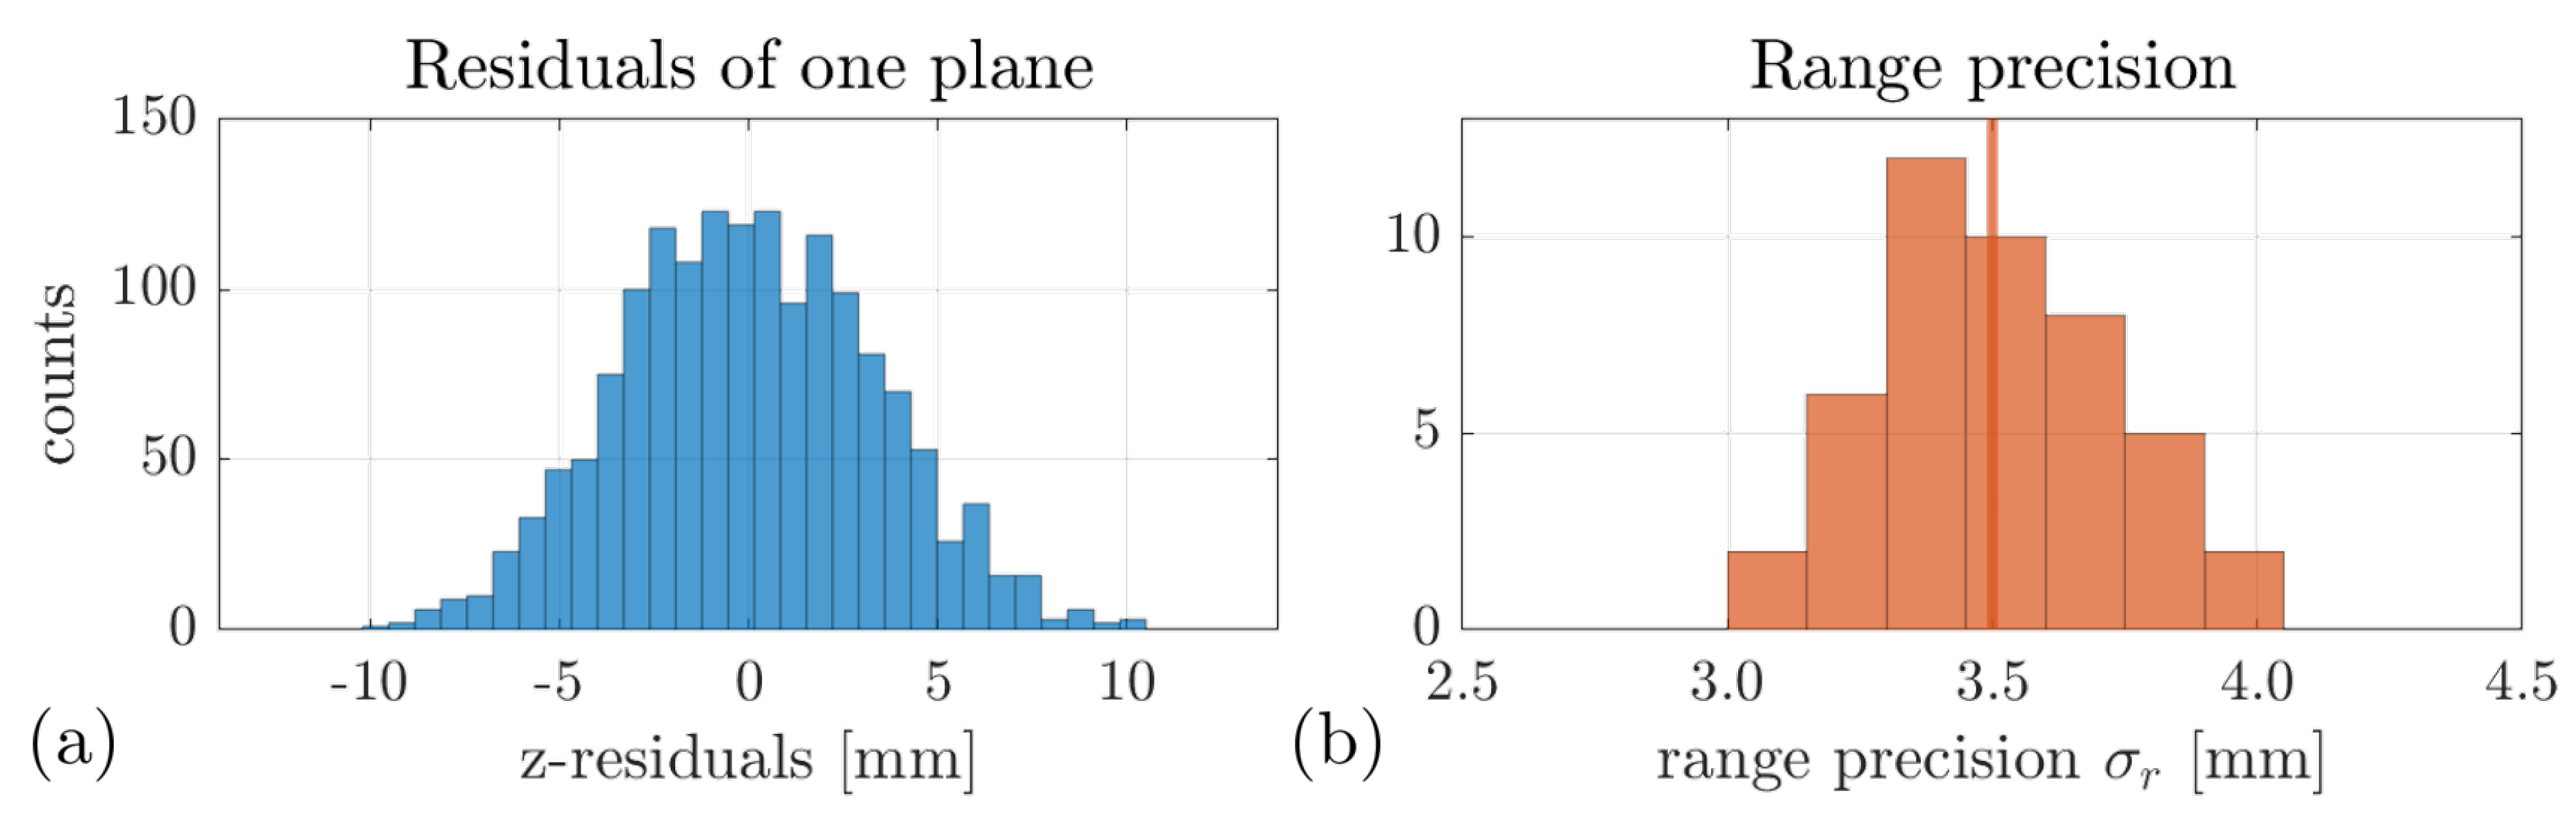
- NoiseThe noise level is analyzed based on different parts of the resulting point clouds. This parameter primarily gives a quantification of the noise of the laser scanner measurements (included in Equation (1)) and an understanding of how much it contributes to the error budget of the system. The noise evaluation parameter is based on a plane fit and the corresponding residuals. Therefore, planar objects with good reflective properties are necessary with an appropriate scan geometry. The noise level is investigated only at the given flight height without a detailed evaluation of the systematic dependence with increasing distance to the object.
- (2)
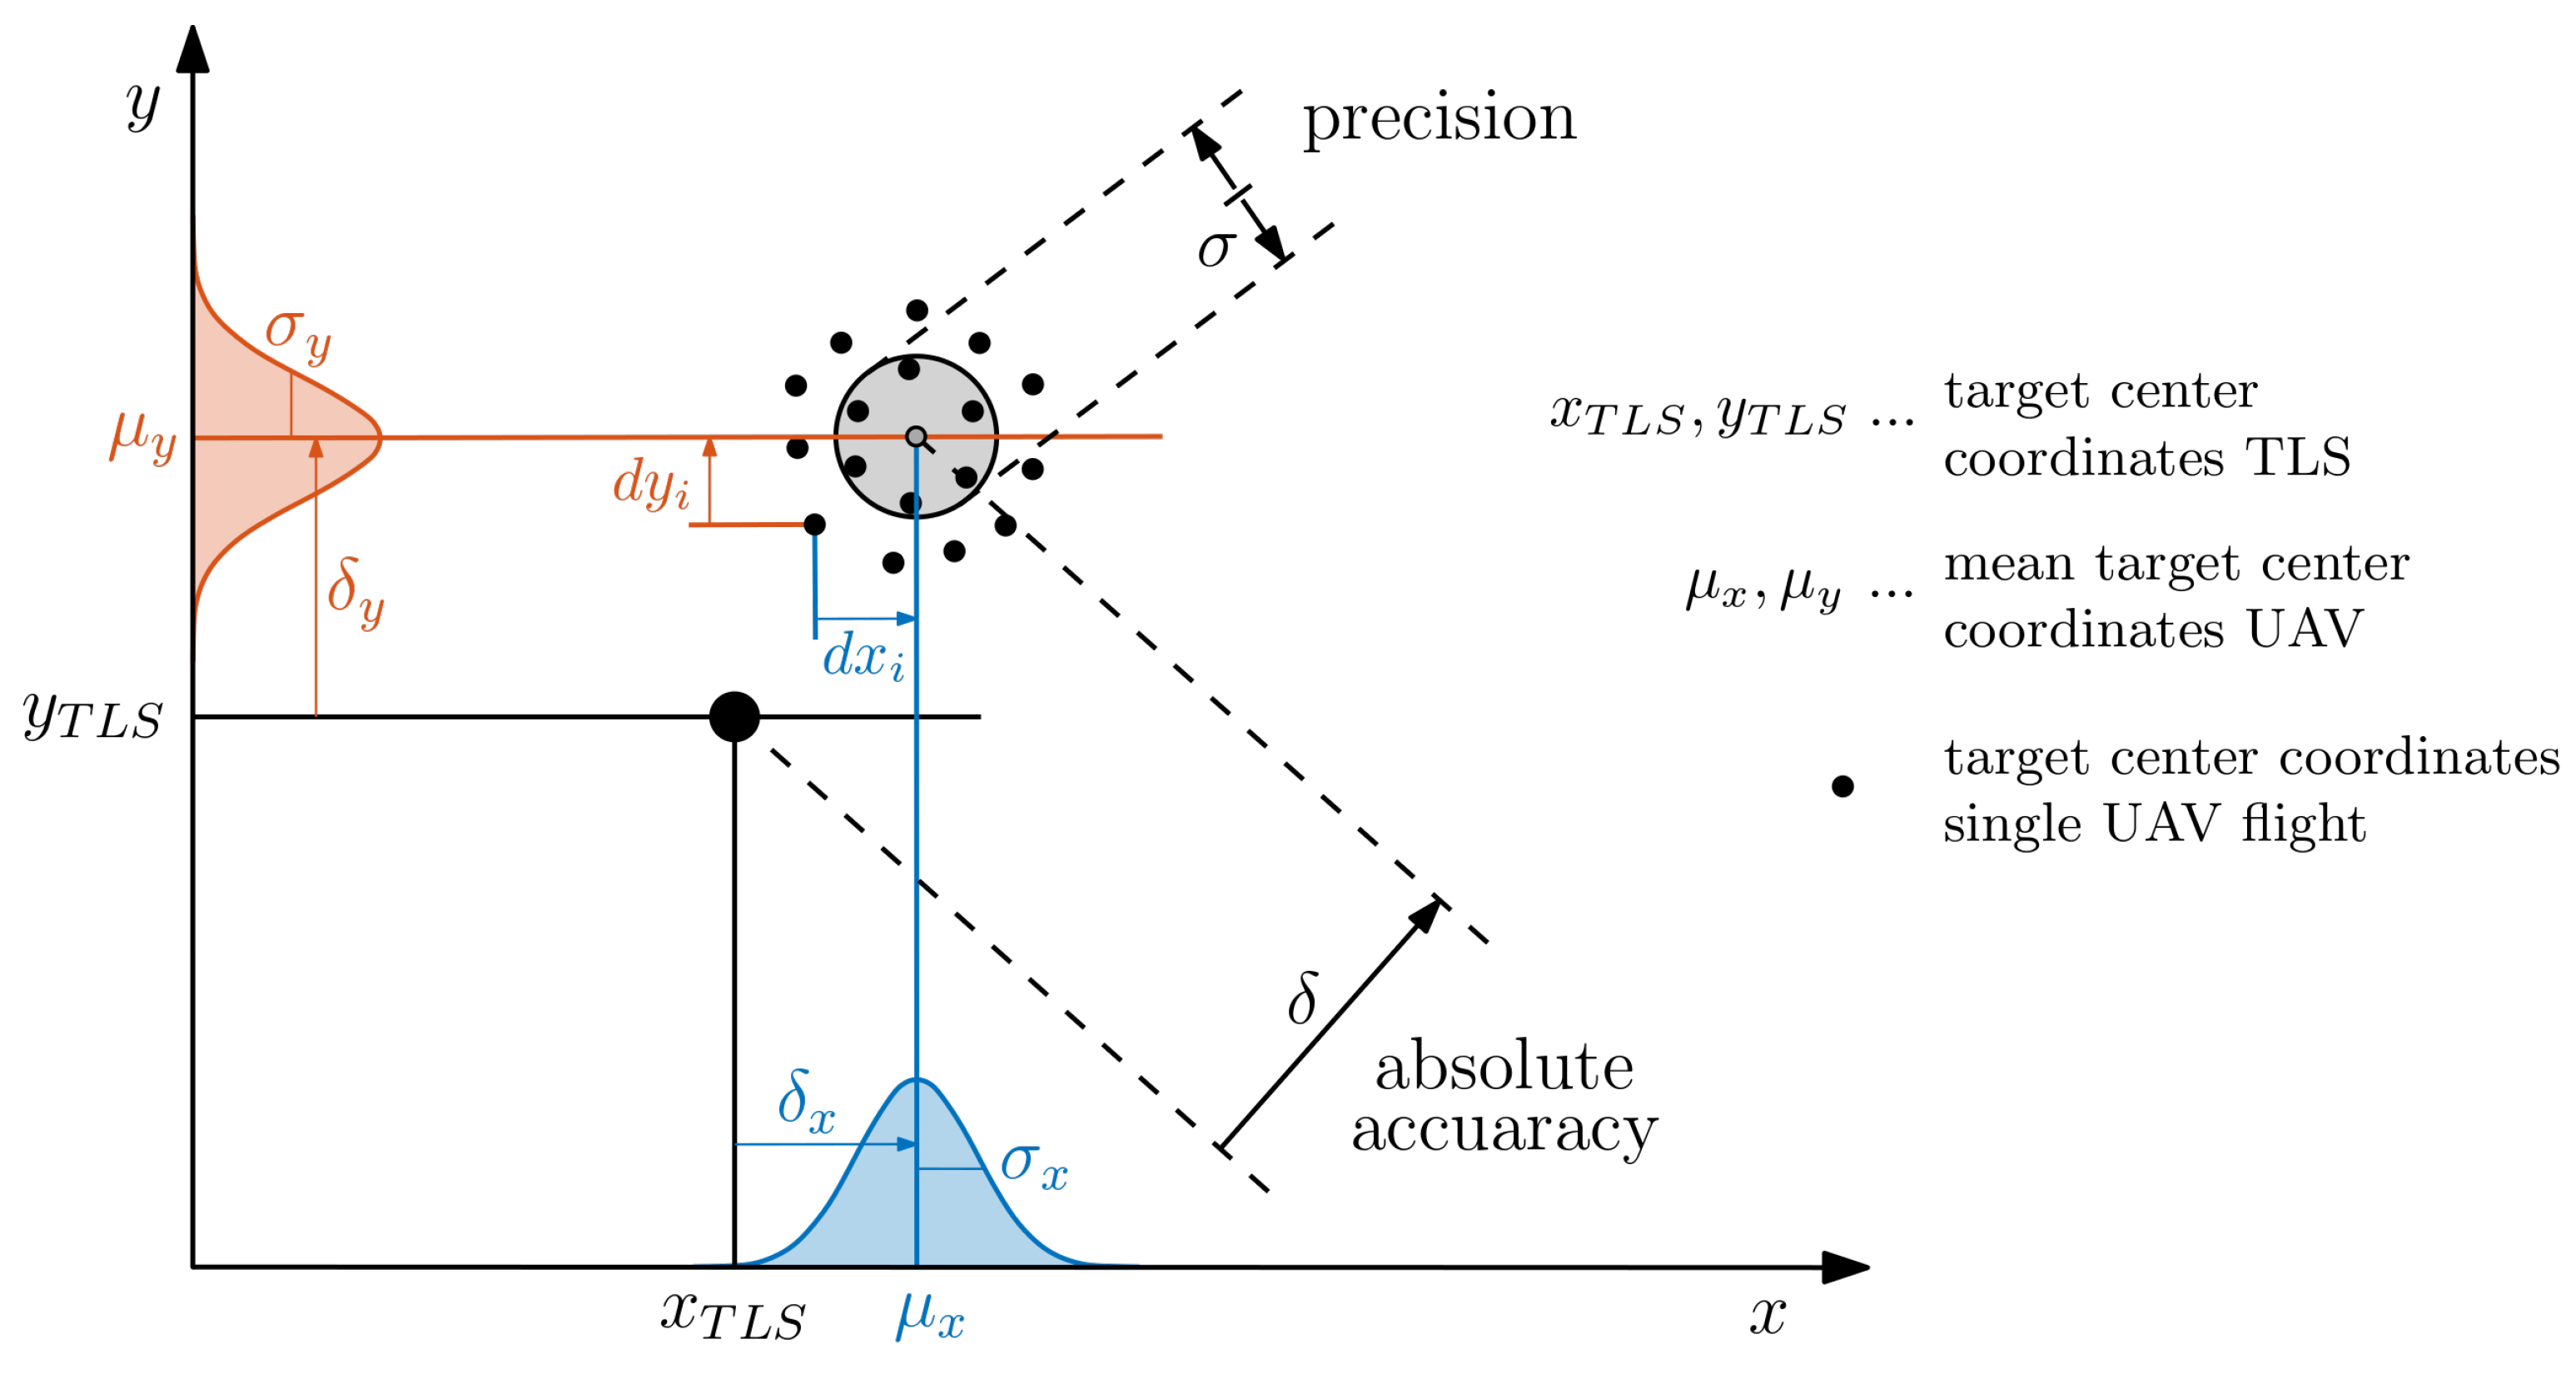
- Absolute accuracyThe absolute accuracy is the main part of this study. For this, the UAV-based laser scanning point clouds are analyzed in comparison to a georeferenced point cloud measured with TLS. This evaluation is supposed to determine the absolute accuracy of the system in the vertical and horizontal direction using a point-based evaluation approach. Since the accuracy in the vertical direction is in most cases lower than in the horizontal direction [41], a special focus is given on the height component. Besides the point-based evaluation, the orientation of the point cloud in the global reference frame is analyzed using a parameter-based approach. Concerning the parameters in Equation (1), trajectory estimation, laser scanner and system calibration are evaluated simultaneously in this investigation.
- (3)
- PrecisionAdditionally, the precision is evaluated with repeated measurements using the same flight plan for each repetition, spread over several hours. This approach is intended to indicate the precision of the system and, in particular, its performance under changing GNSS conditions and constellations. This investigation uses point-based as well as parameter-based evaluation strategies.
- (4)
- GNSS master stationThis aspect examines the importance of the GNSS master station used for the trajectory estimation of the UAV. In principle, there are different possibilities of master raw data which are used for the relative GNSS processing. The analysis provides a result of the impact of different master stations on the point cloud’s accuracy and a recommendation for the application of UAV-based laser scanning in practice.
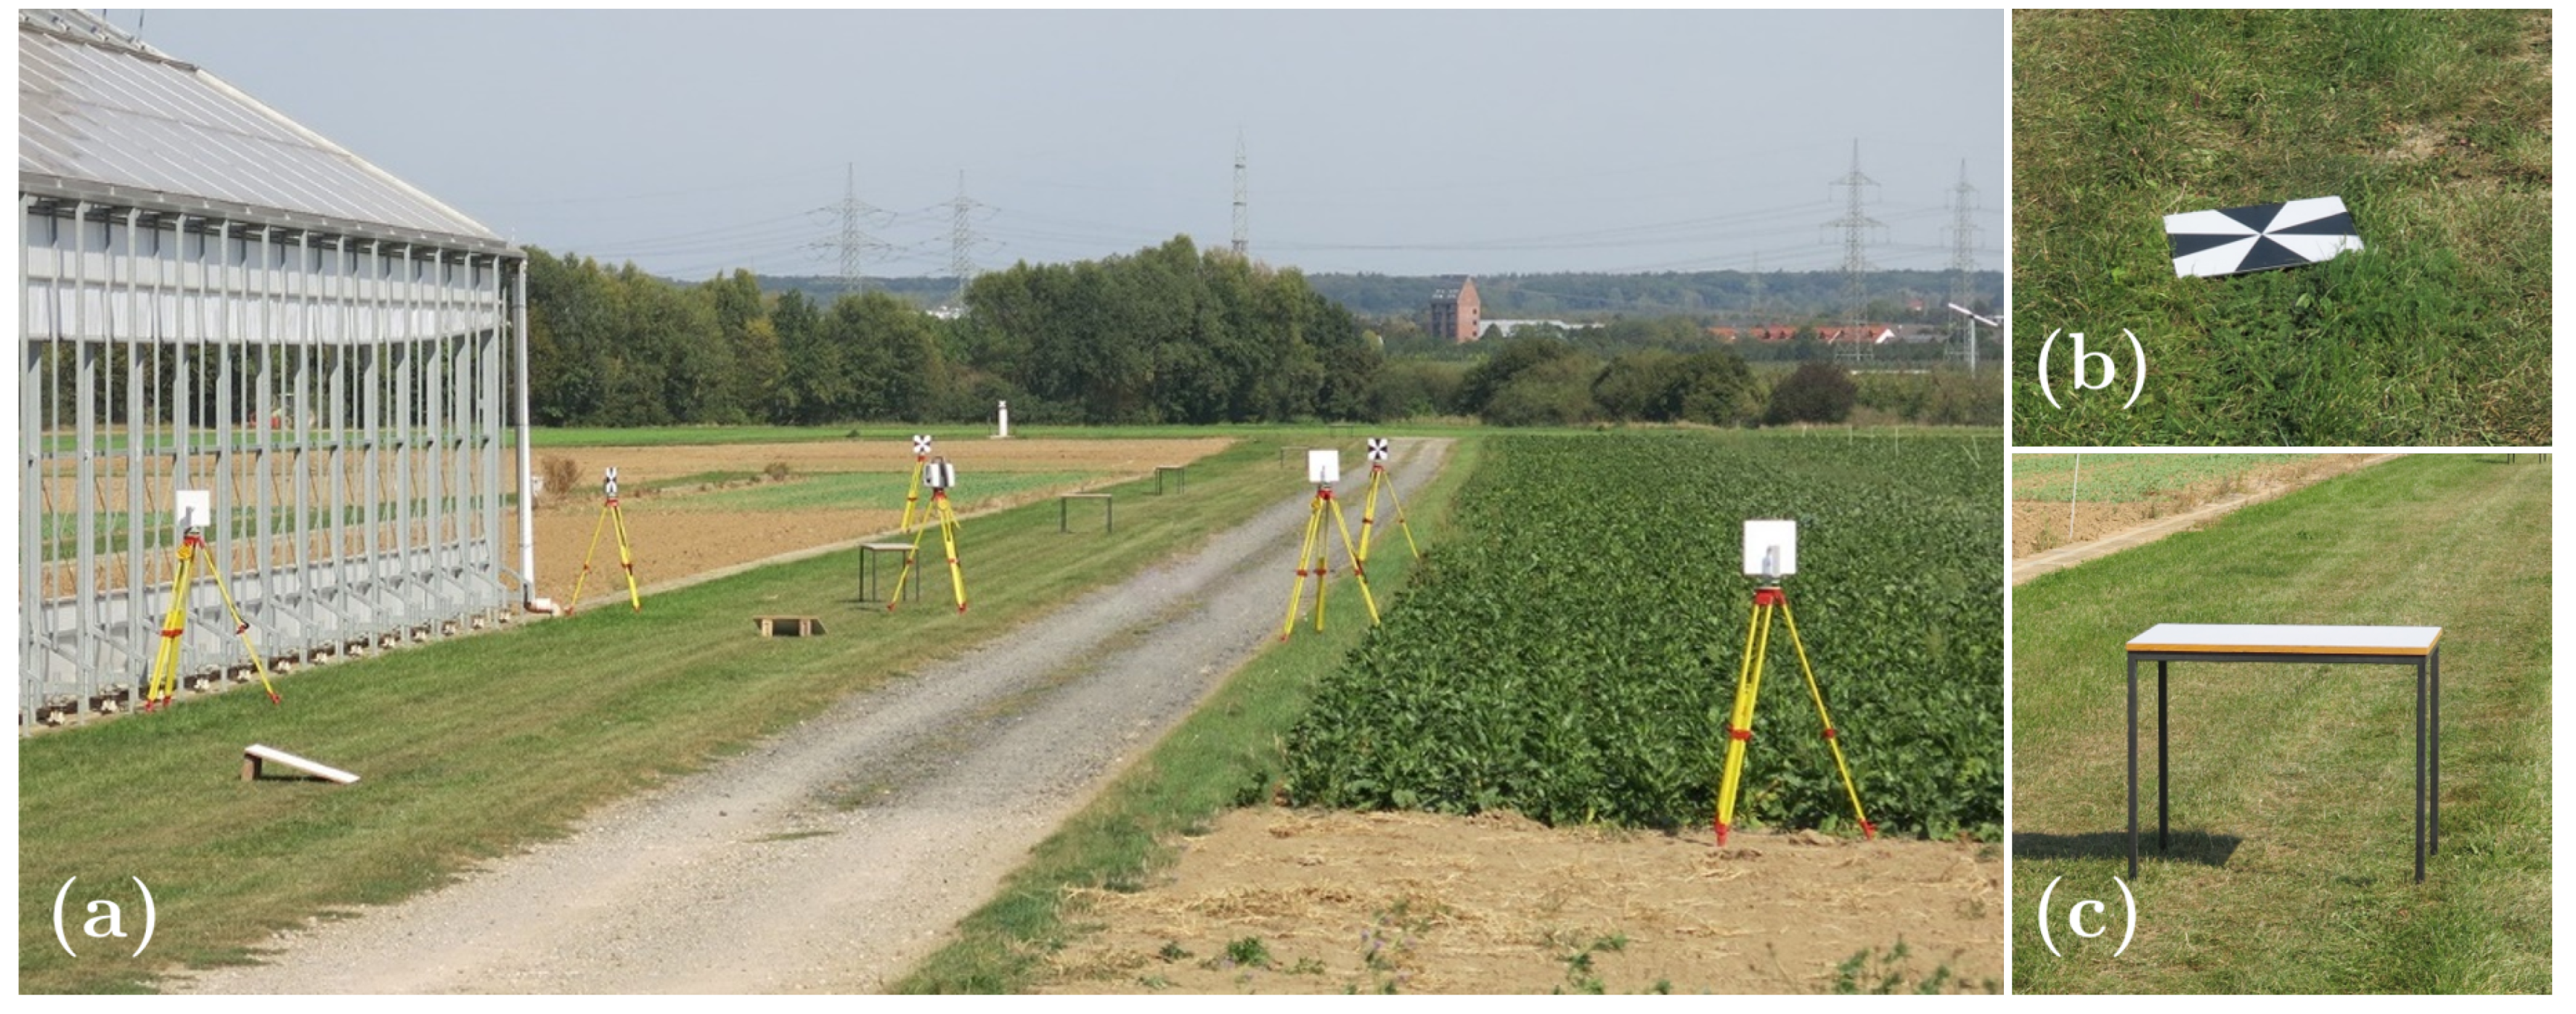
2.3. Data Acquisition and Reference Point Cloud
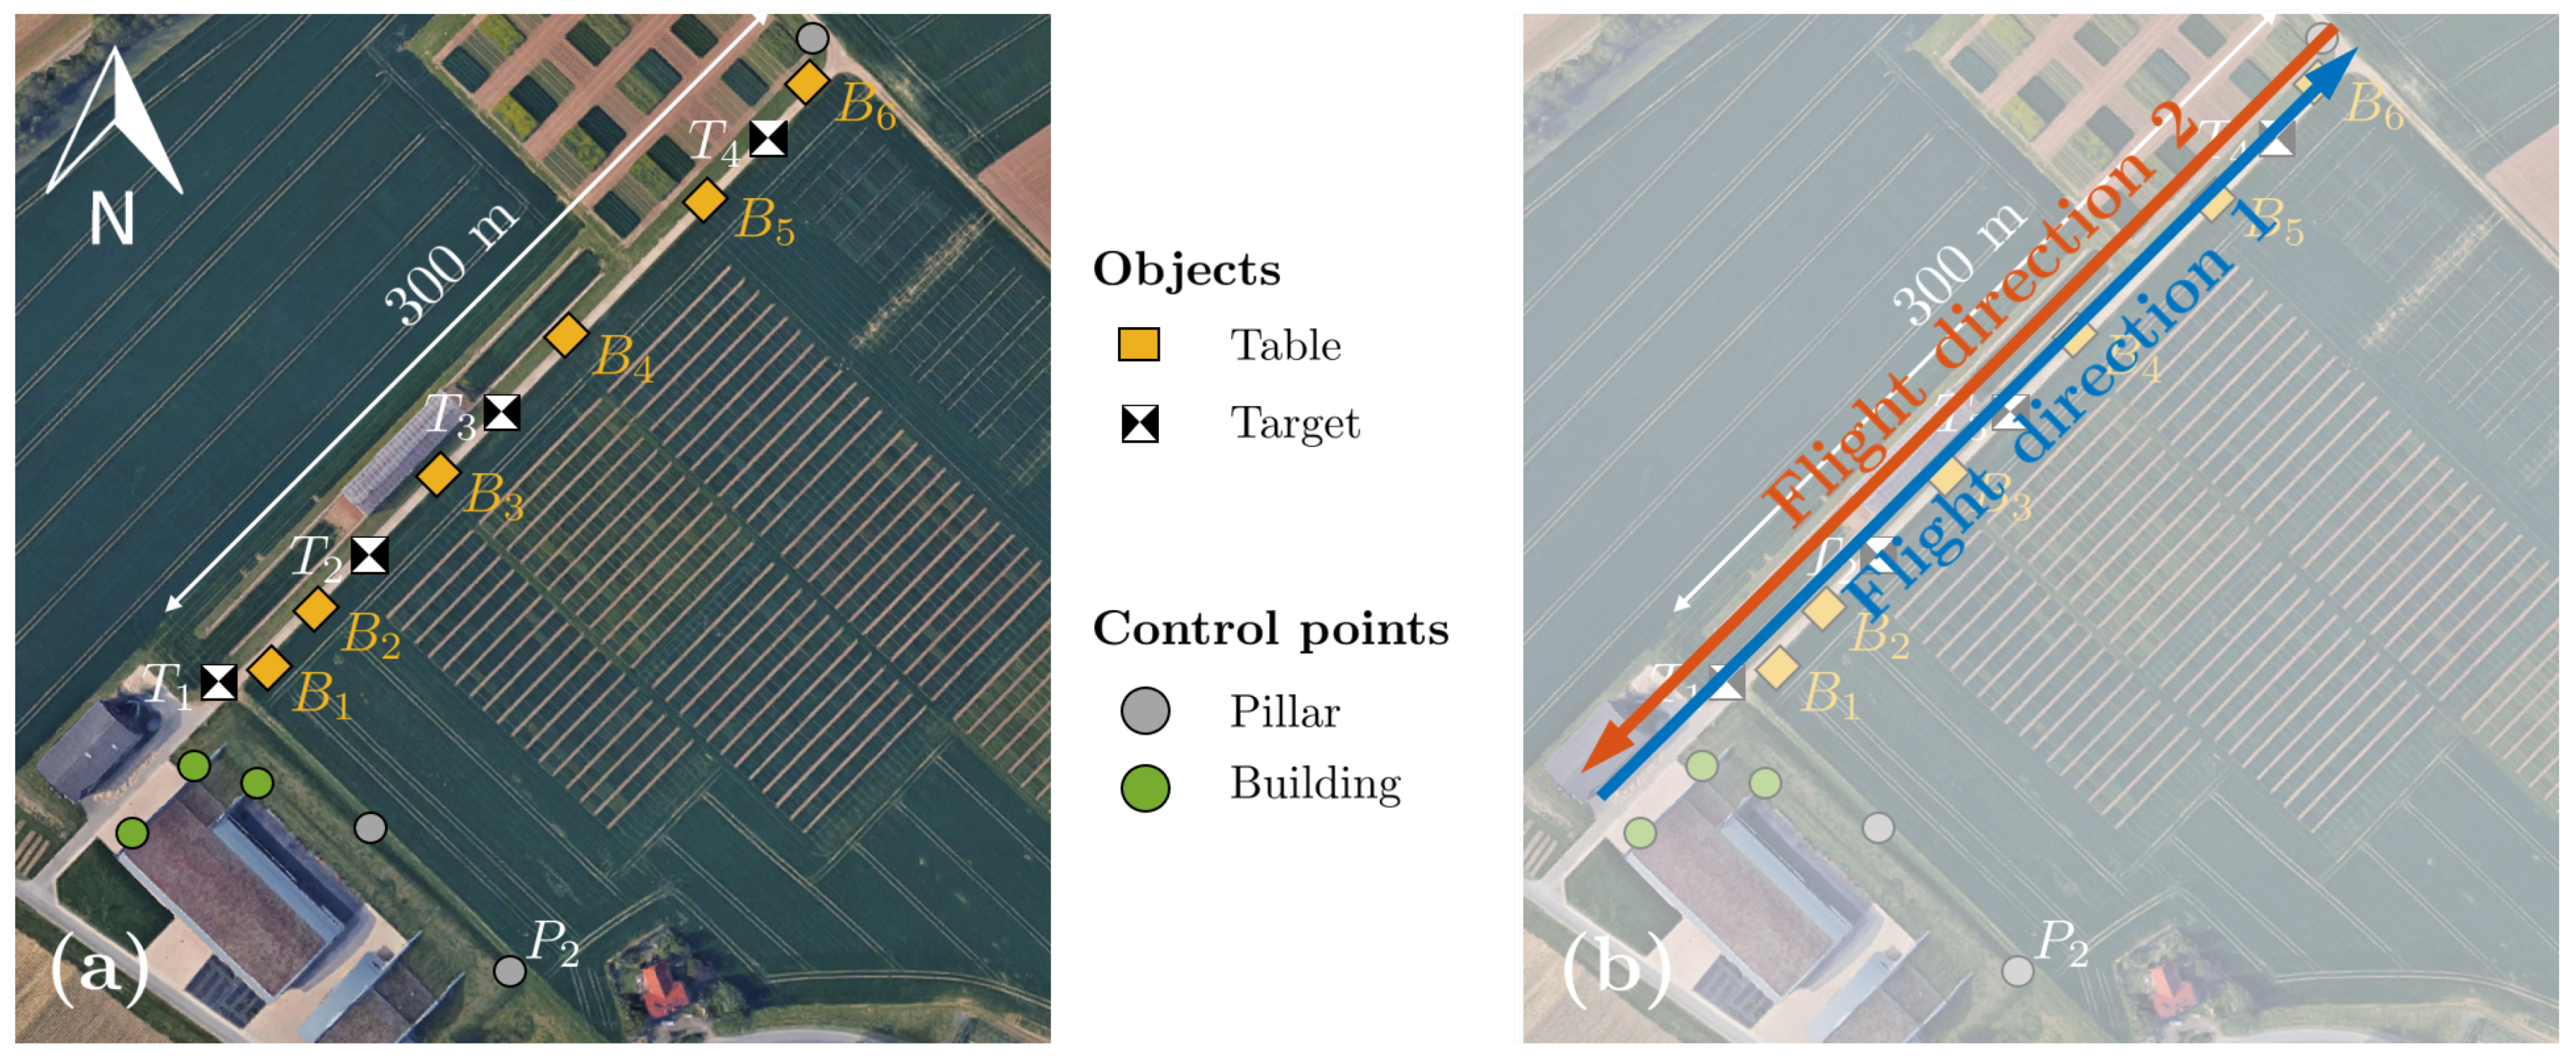
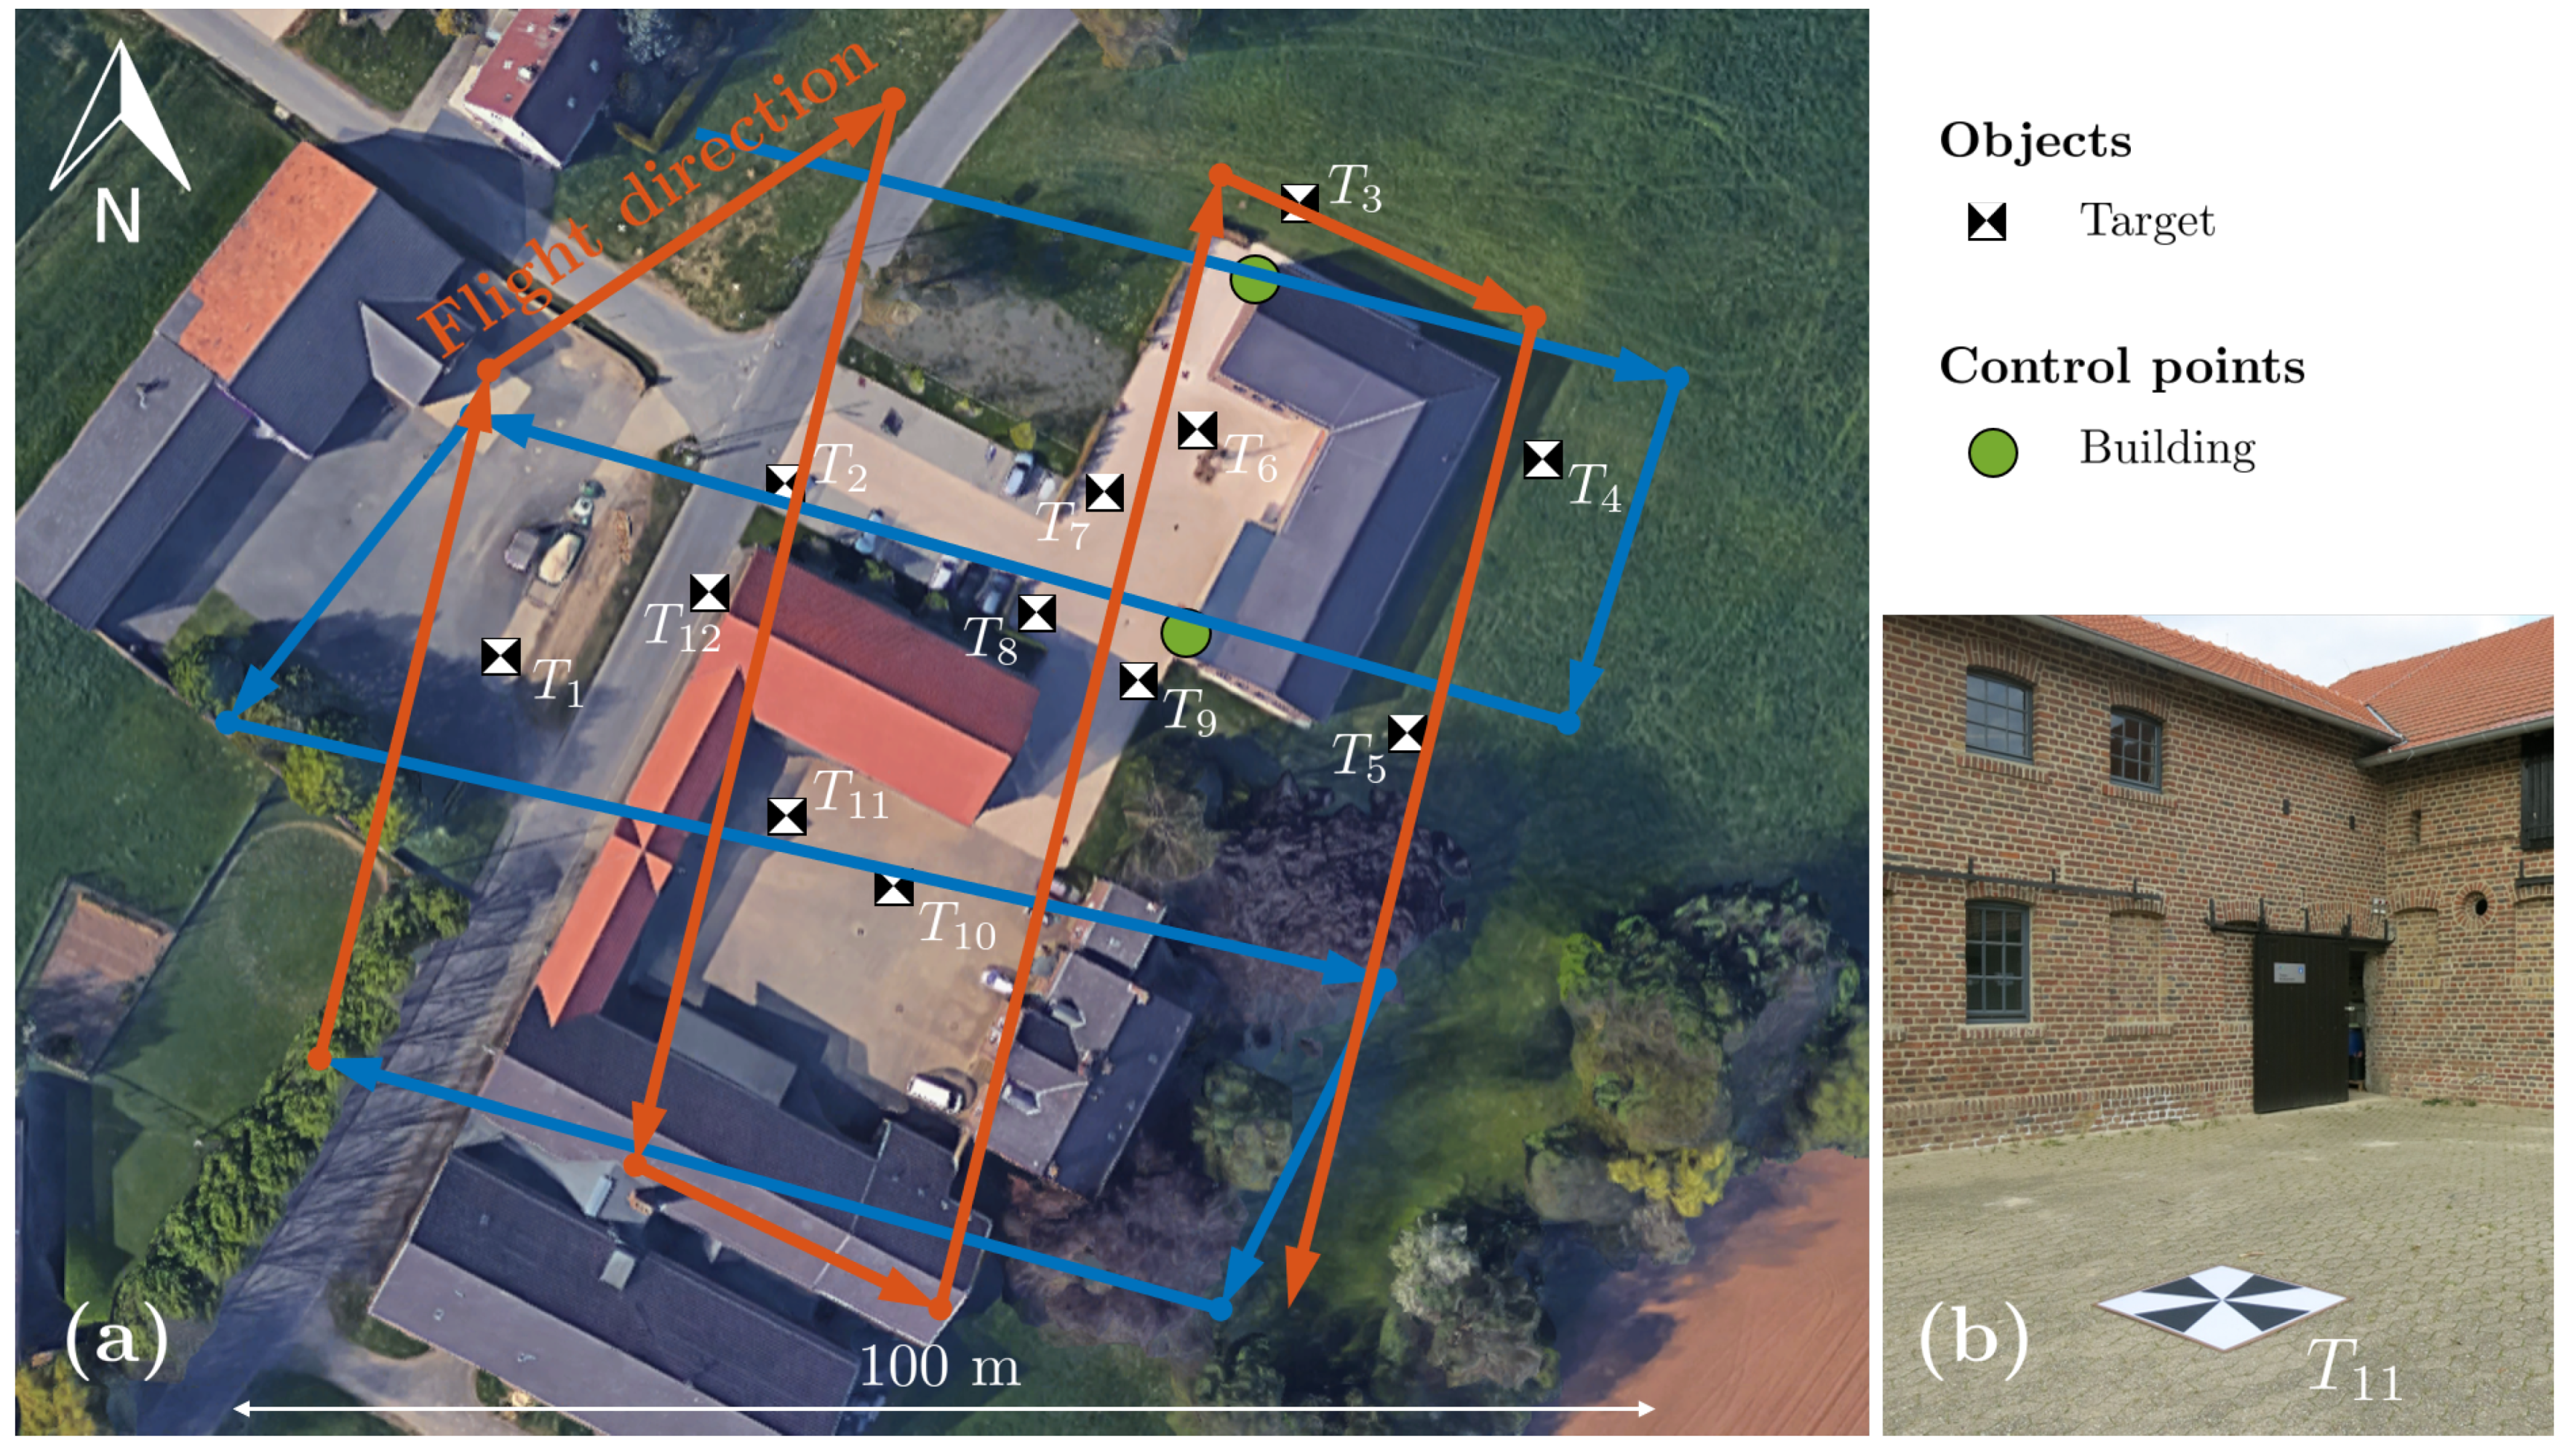
2.3.1. Study Areas and Objects
2.3.2. Reference Point Cloud from Terrestrial Laser Scanning
2.3.3. UAV-Based Laser Scanning Measurements and Processing
3. Results
3.1. Experiment (1): Noise for Single Strip Measurements
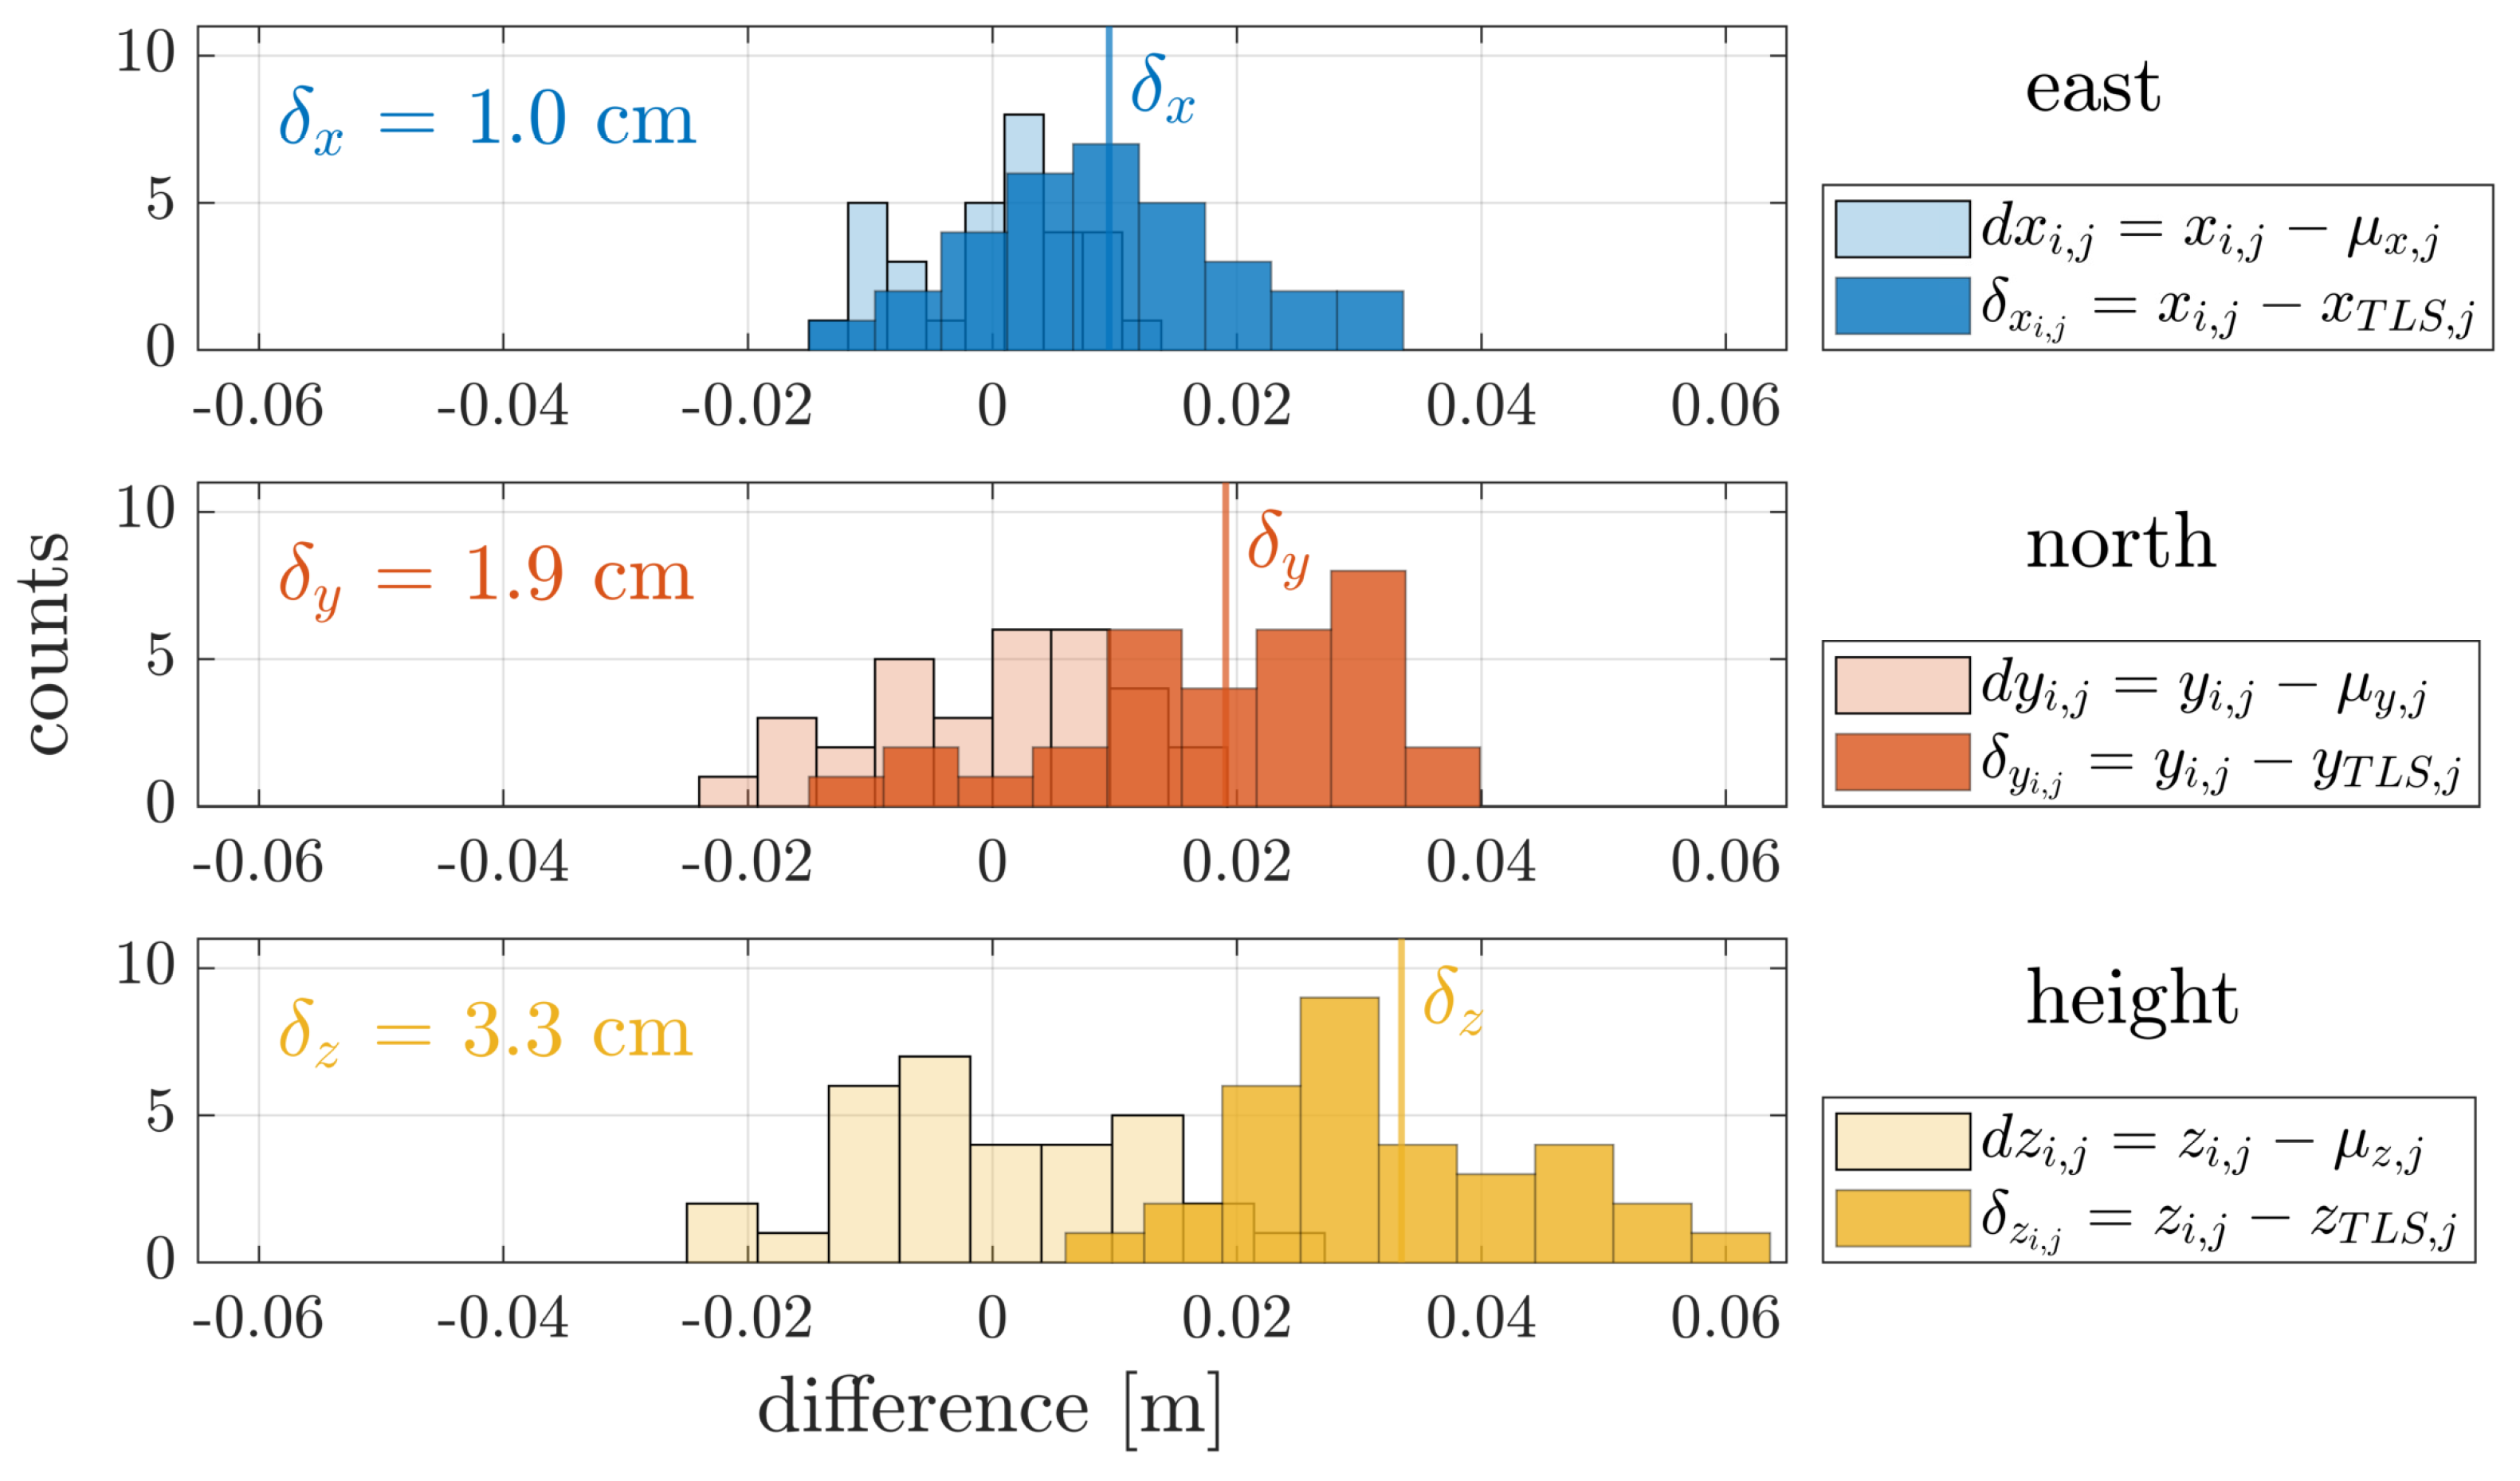
3.2. Experiment (2): Point-Based Absolute Accuracy and Precision for Single Strip Measurements
3.3. Experiment (3): Parameter-Based Absolute Accuracy for Single Strip Measurements
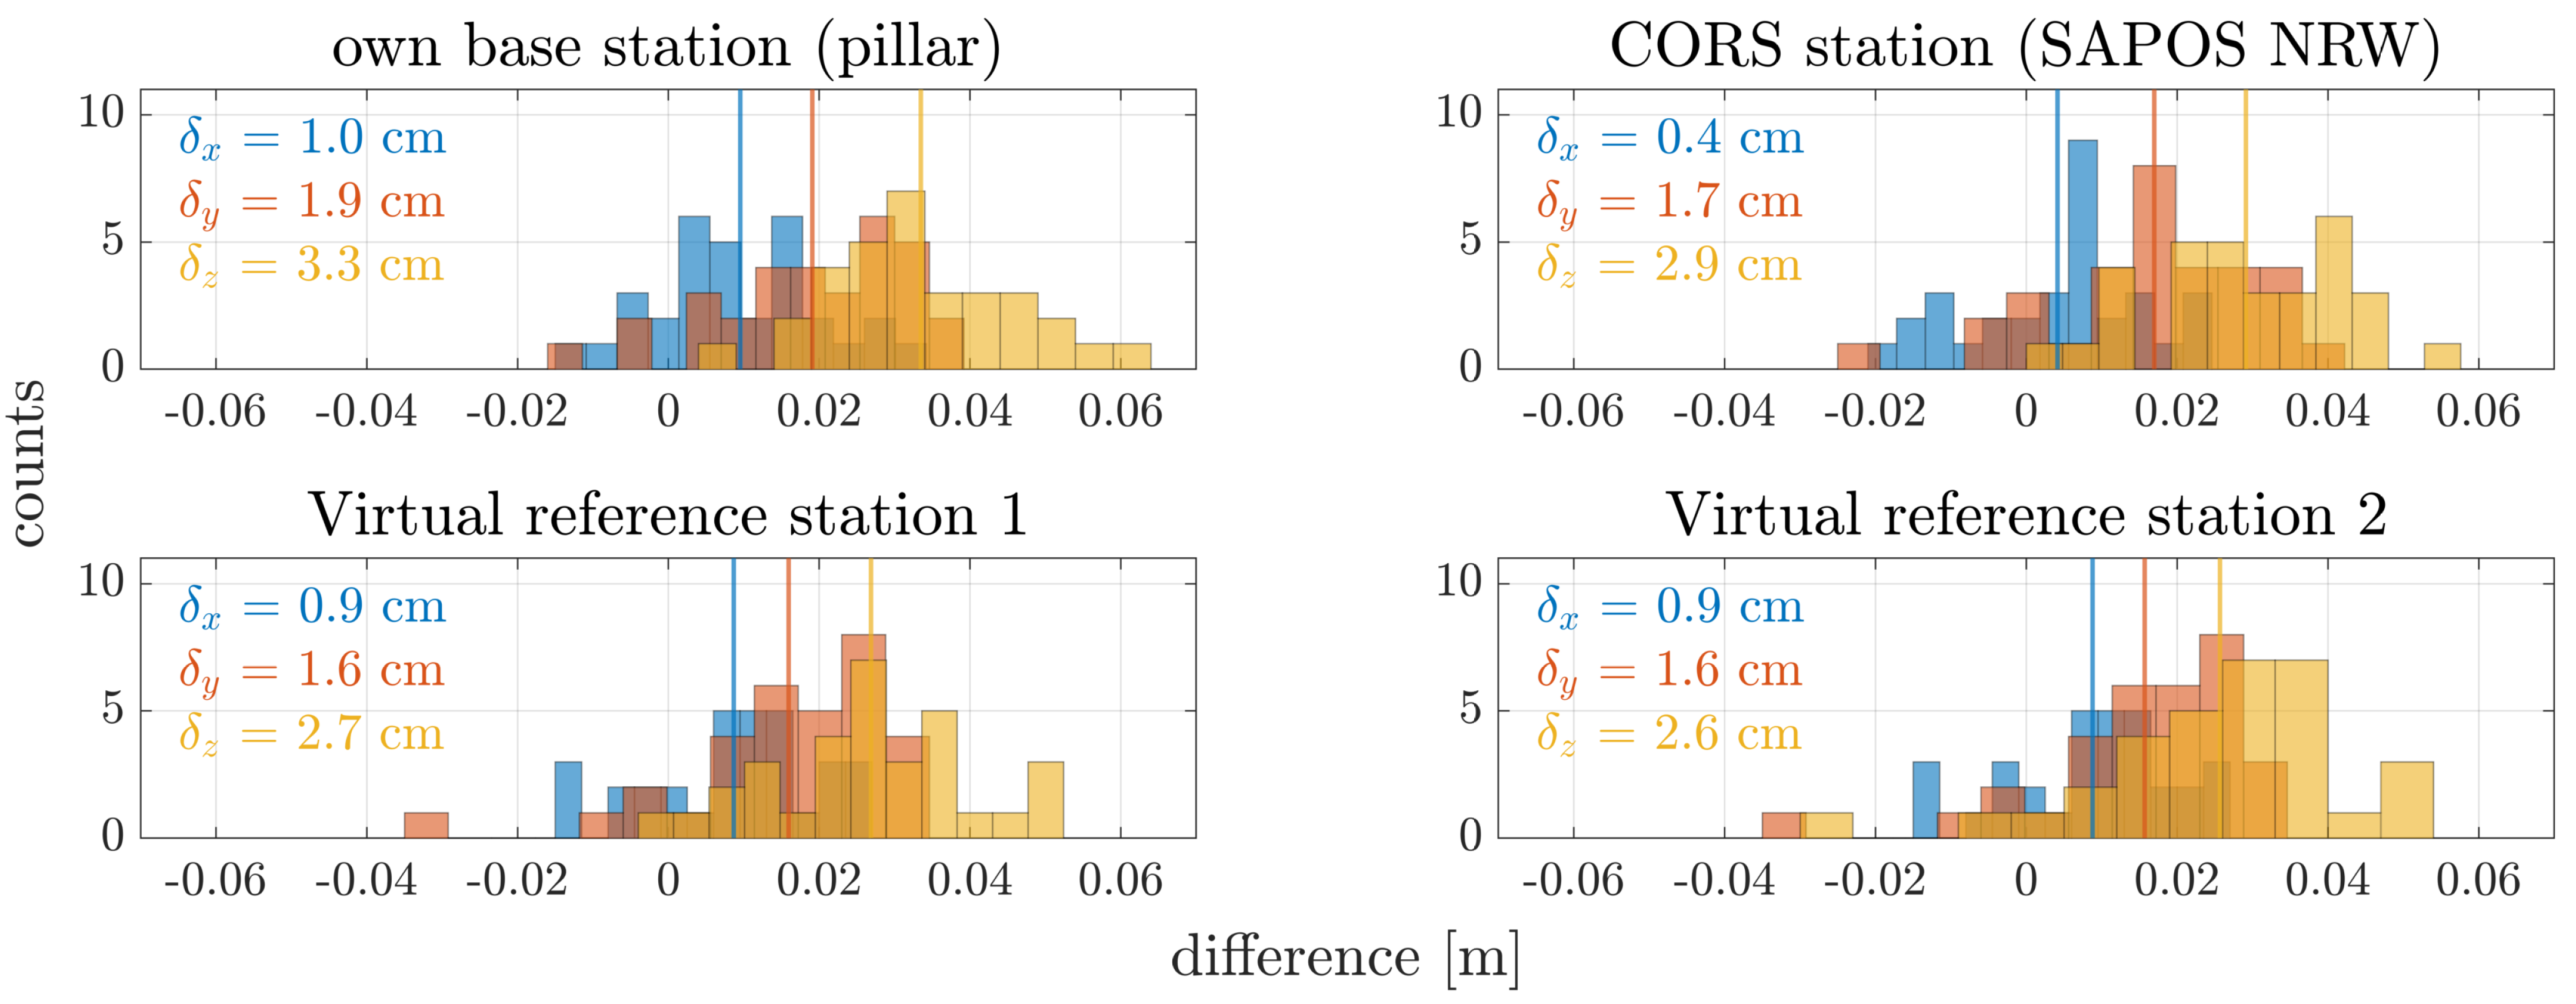
3.4. Experiment (4): GNSS Master Station
3.5. Experiment (5): Point-Based Absolute Accuracy and Precision for Multiple Strip Measurements
3.6. Experiment (6): Parameter-Based Absolute Accuracy for Multiple Strip Measurements
4. Conclusions and Outlook
- (1)
- The first parameter describing the noise and therefore the range precision of the laser scanner resulted in 0.4 cm for the flight height of 10 m for the single strip measurements and 0.6 cm for the flight height of 25 m for the multiple strip measurements. With the second data set, the performance of RiPRECISION is evaluated as well, which performs a proper alignment of several strips from the cross-flight pattern.
- (2)
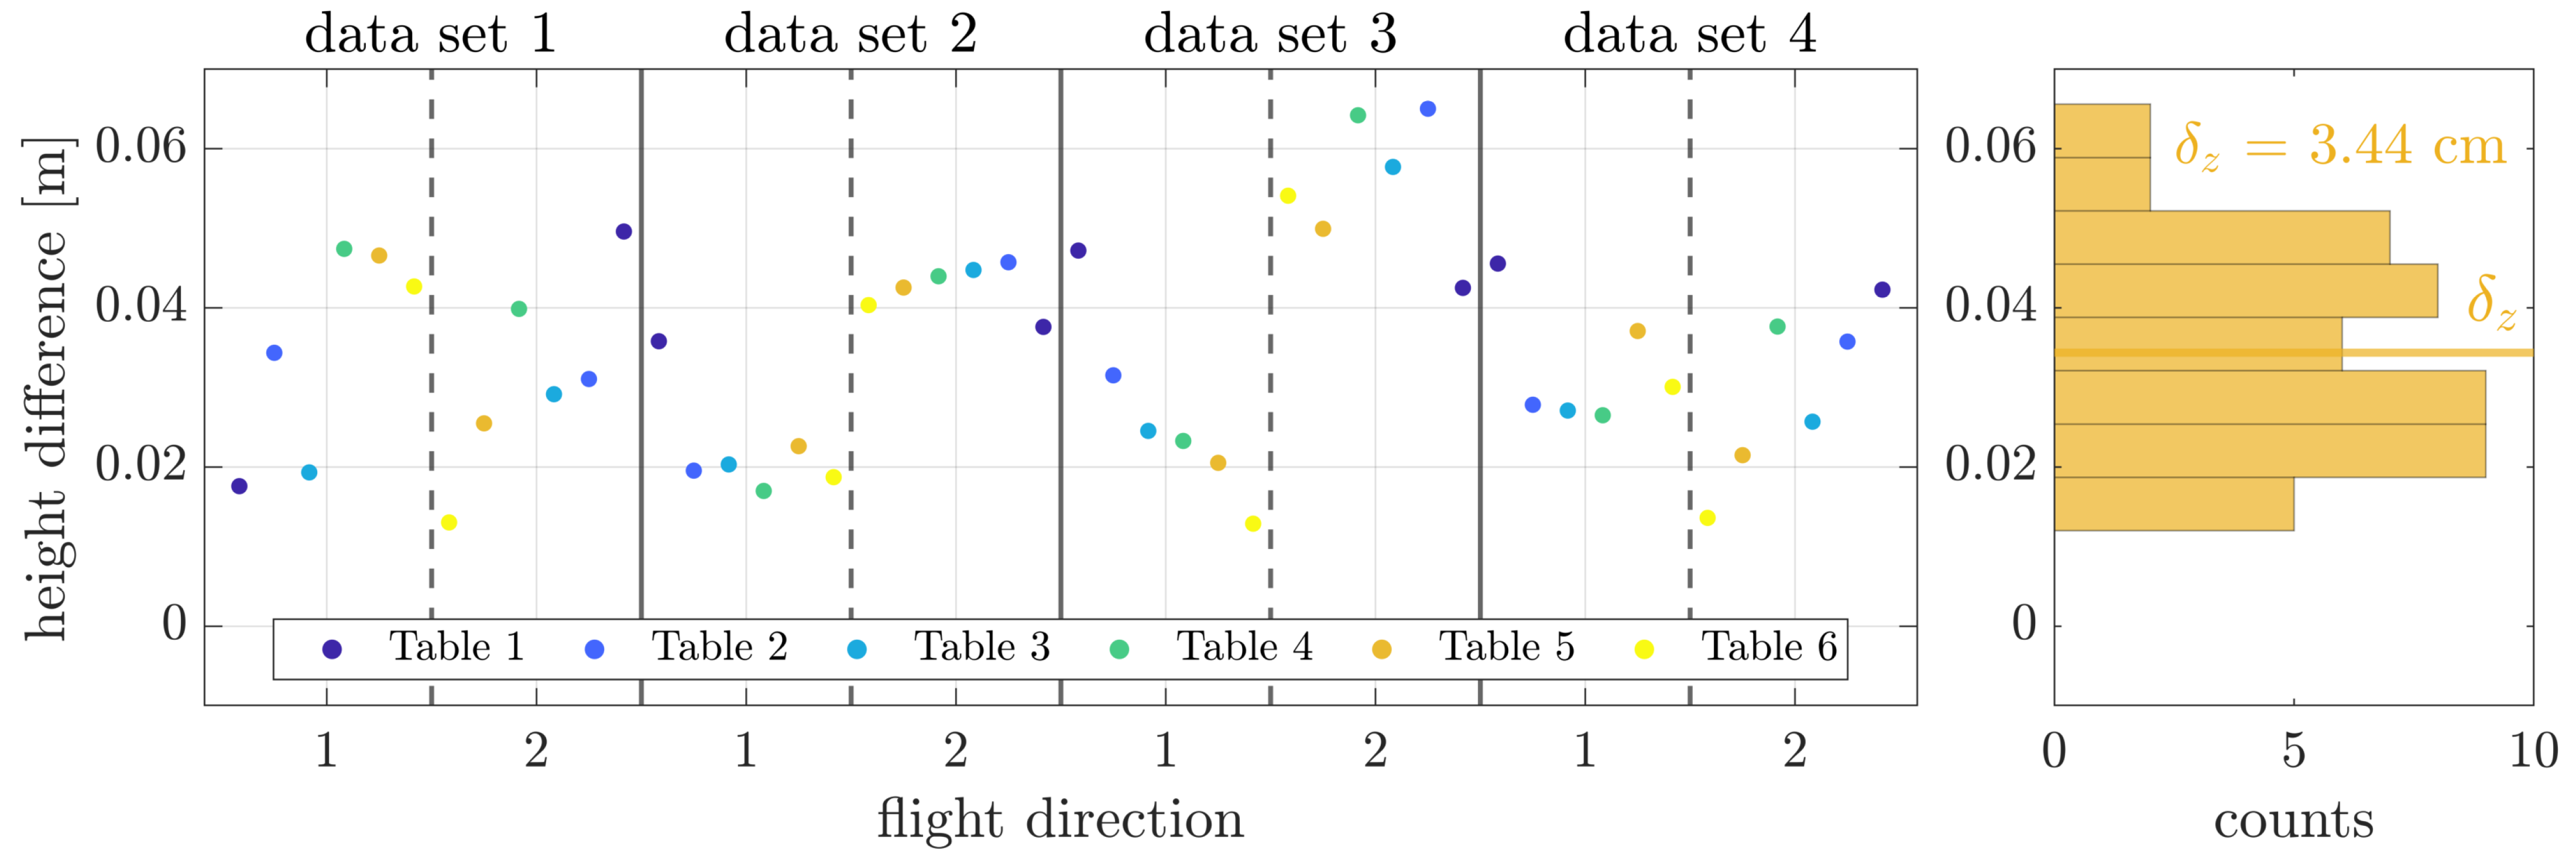
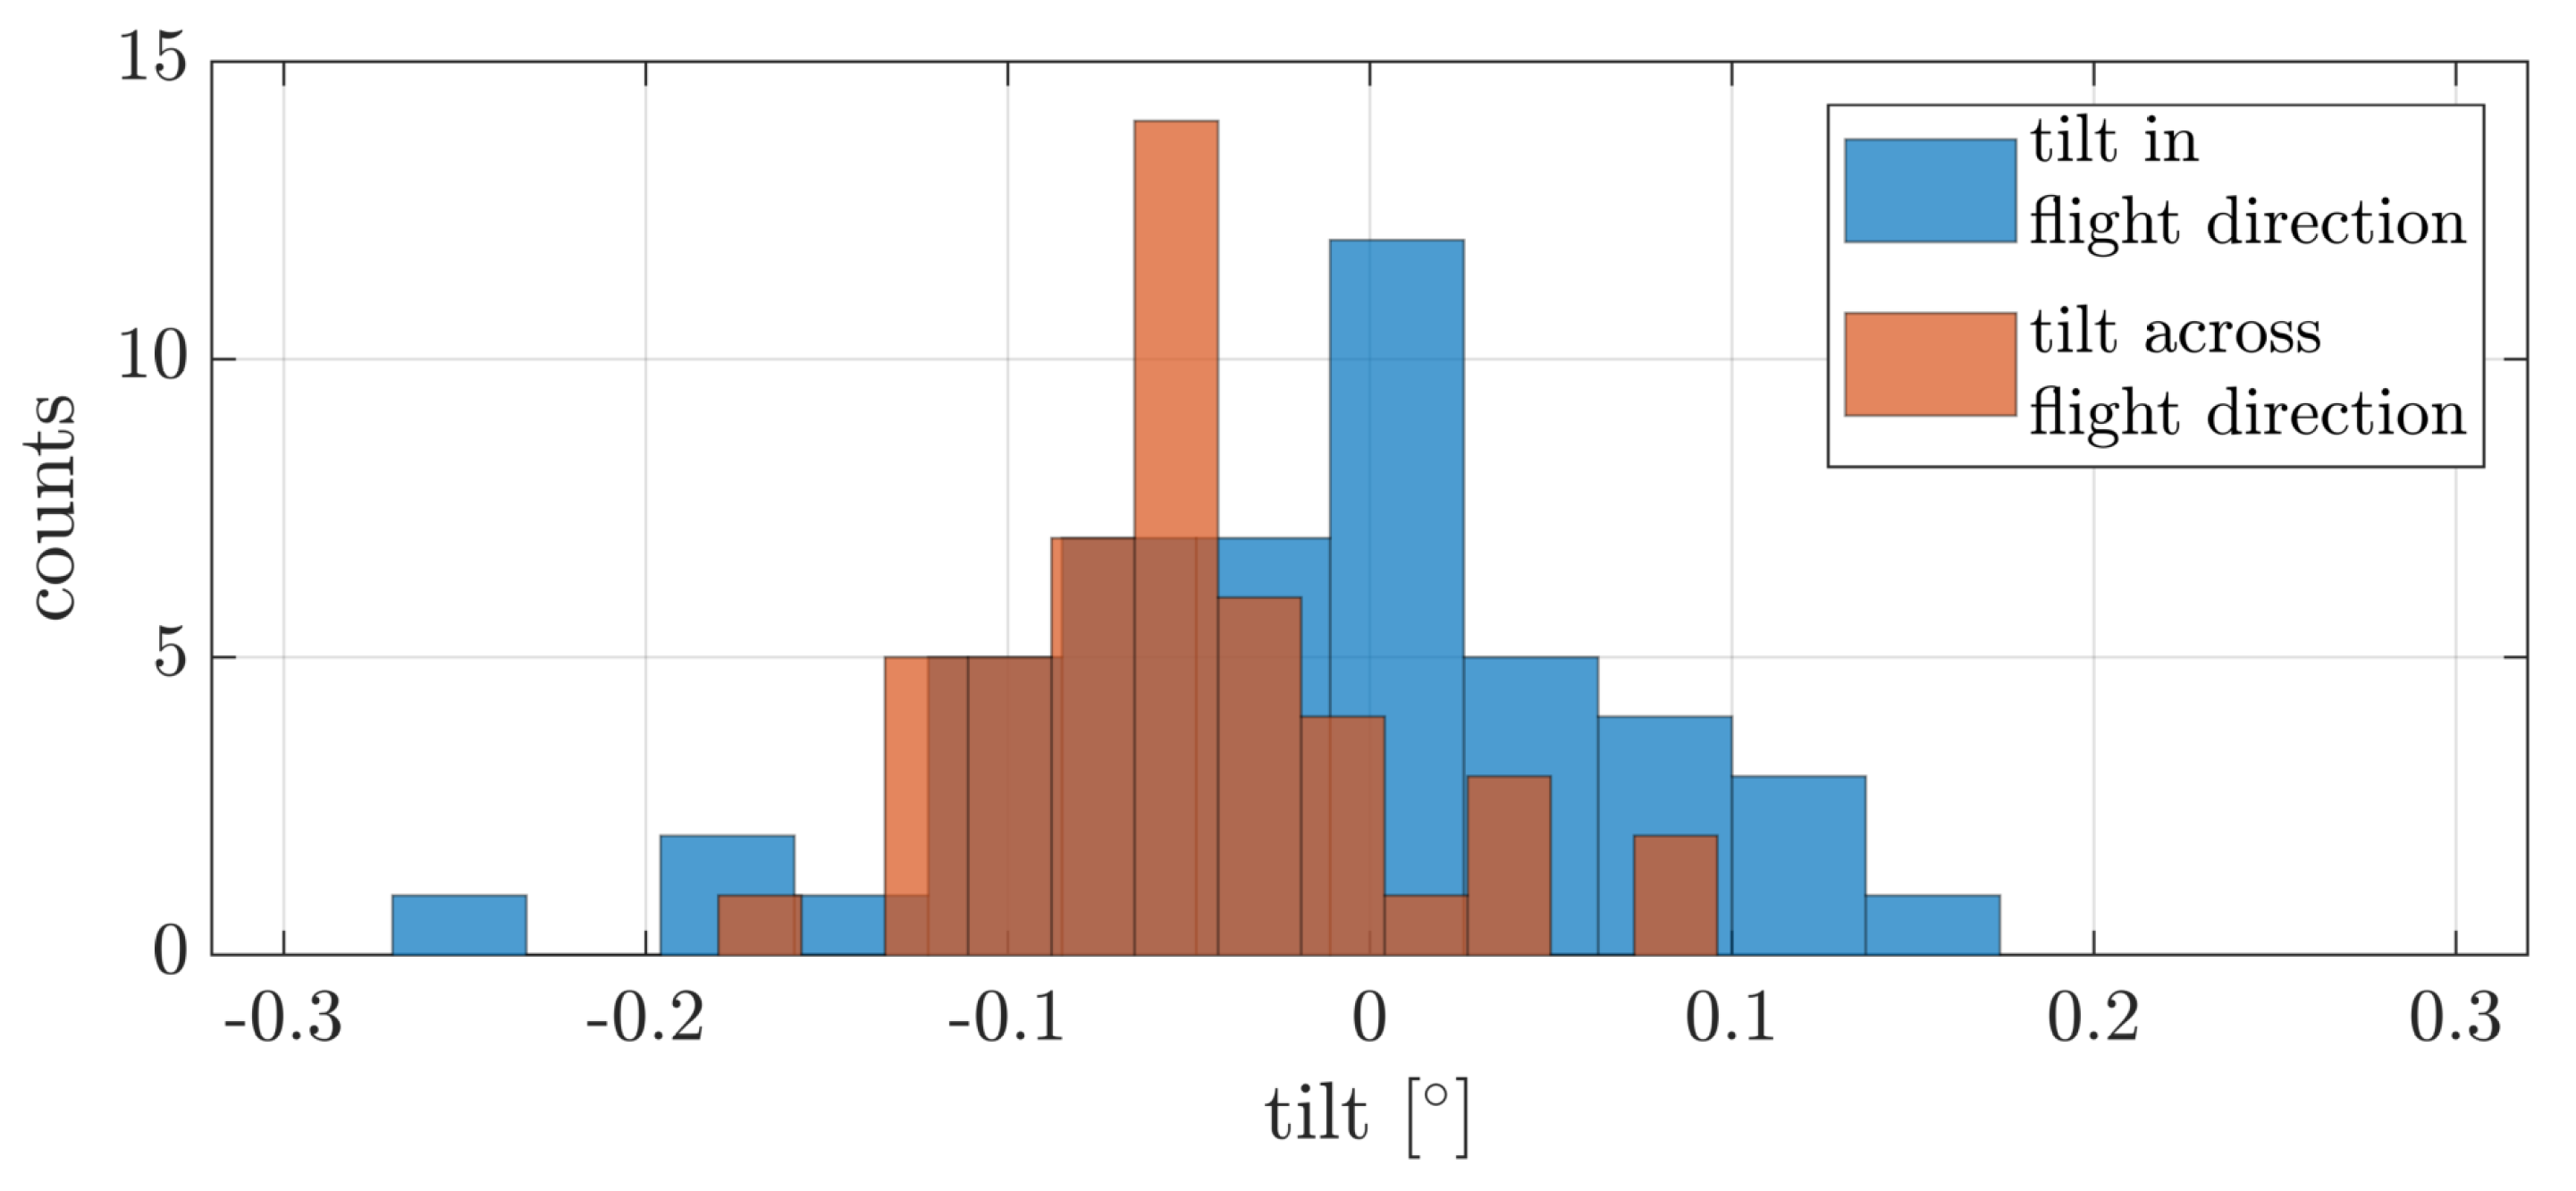
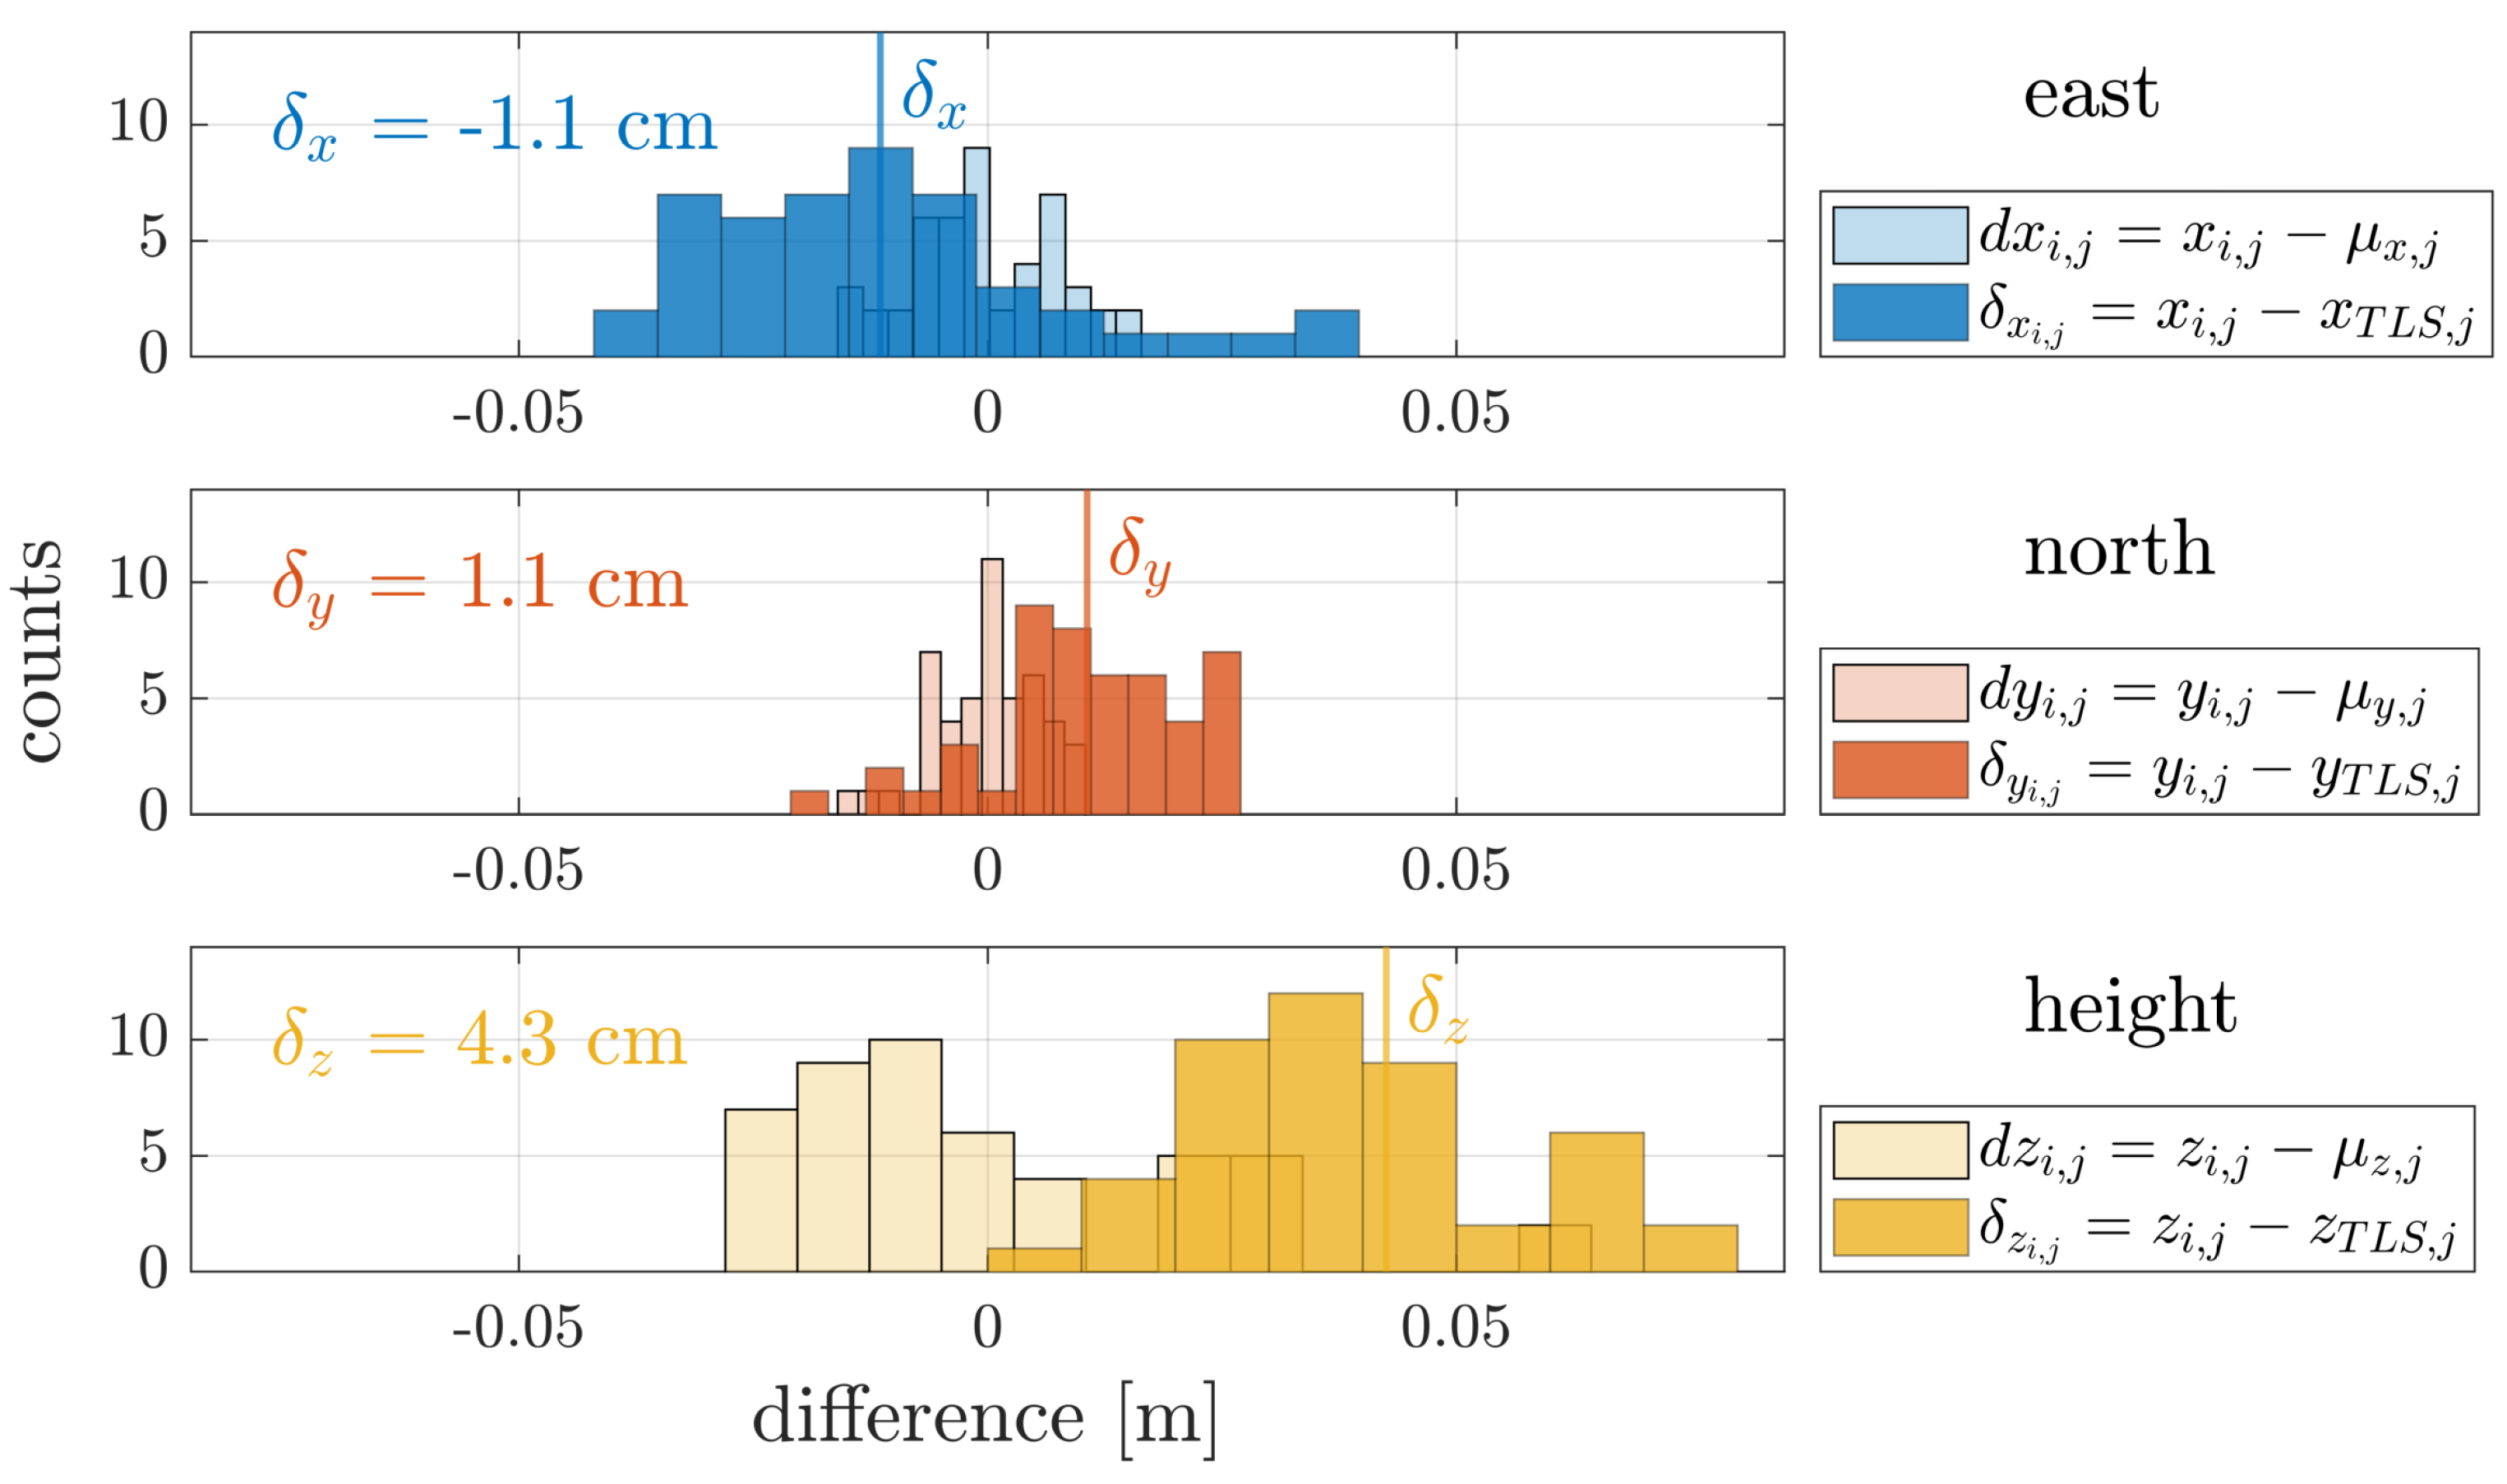
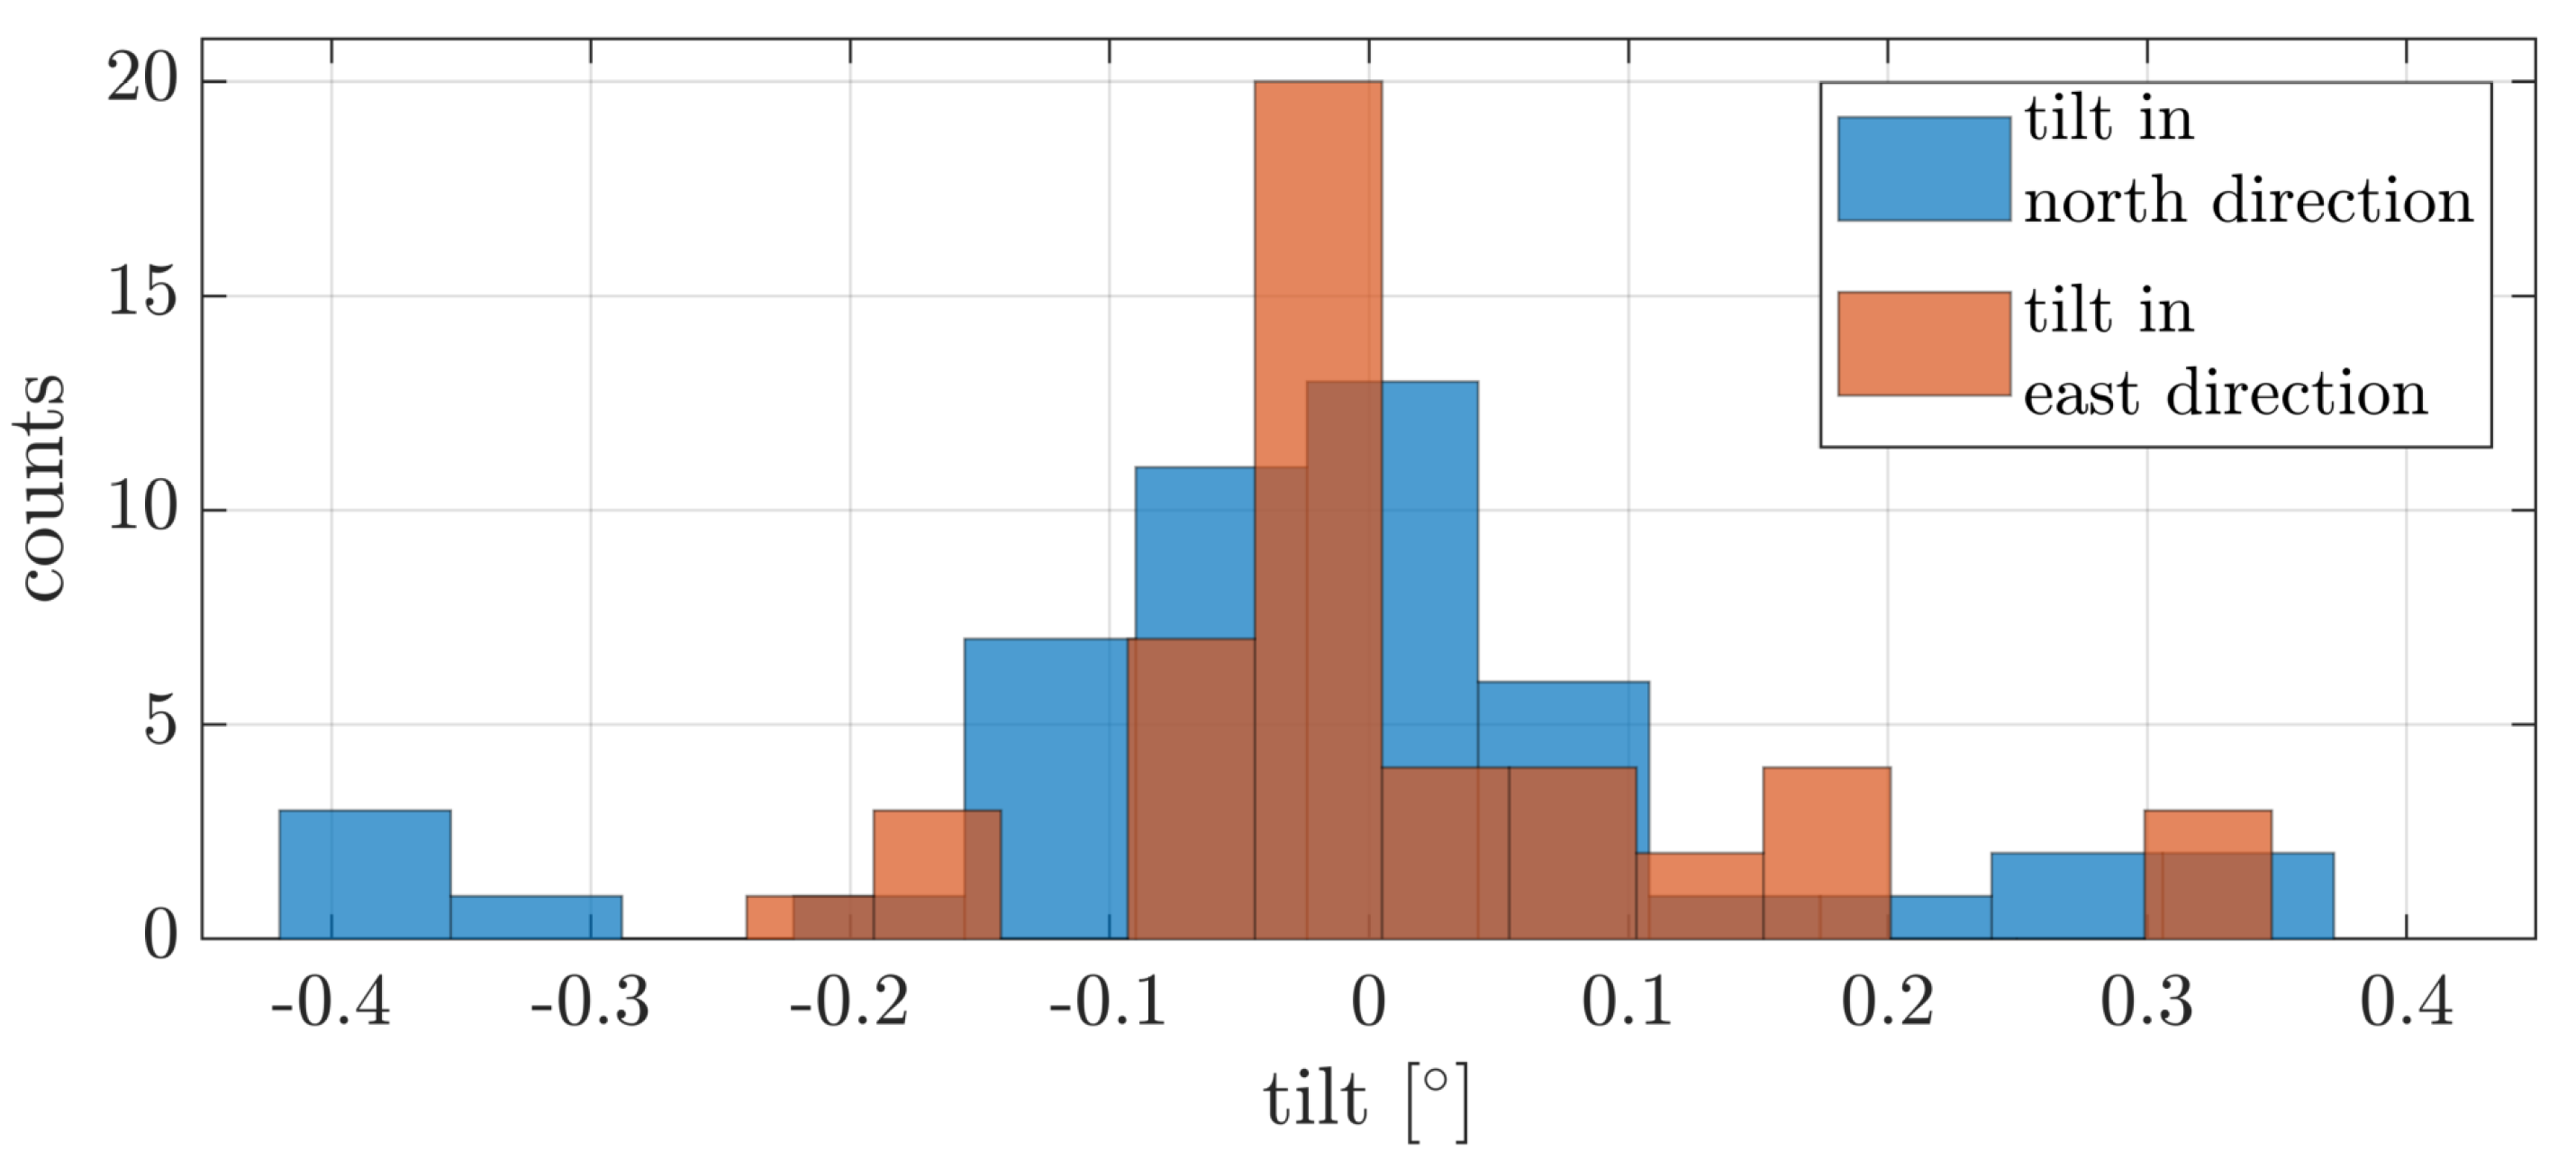
- The absolute accuracy using the target-based evaluation for four separated flights was given with 0.9 cm in east, 1.9 cm in north and 3.4 cm in height direction for the single strip measurements. The additional focus to the vertical direction using table heights provided nearly the identical height offset of 3.4 cm with a RMSE of 1.3 cm. The results for the multiple strip measurements are consistent with everything concluded from the first data set with a mean difference in the horizontal direction around 1 cm and in vertical direction around 4 cm. The additional parameter-based evaluation was performed for the two different study areas and the tilts between estimated planes are always within the noise level of the point cloud and no systematic effects are observed.
- (3)
- The precision of the UAV system resulted in a standard deviation of 0.7 cm for the east, 1.1 cm for the north and 1.2 cm for height direction. The system provides excellent results over the whole study area for the single strip measurements. The same analysis resulted in a precision of 0.8 cm in the east, 0.5 cm in the north and 2.1 cm in height direction for the multiple strip measurements.
- (4)
- The impact of different master stations is assessed by the use of an own master station, a CORS station and two different VRS. The output of the performed point-based evaluation leads to nearly identical results for the four different GNSS data sets and therefore the conclusion, that strategy should be chosen, which is easiest to handle for the user. Overall, the VRS and the CORS station have shown good results considering the mean absolute difference and are therefore an appropriate alternative for the processing.
Author Contributions
Funding
Conflicts of Interest
References
- Heinz, E.; Eling, C.; Klingbeil, L.; Kuhlmann, H. On the applicability of a scan-based mobile mapping system for monitoring the planarity and subsidence of road surfaces–Pilot study on the A44n motorway in Germany. J. Appl. Geod. 2020, 14, 39–54. [Google Scholar] [CrossRef]
- Coops, N.C.; Tompalski, P.; Goodbody, T.R.; Queinnec, M.; Luther, J.E.; Bolton, D.K.; White, J.C.; Wulder, M.A.; van Lier, O.R.; Hermosilla, T. Modelling lidar-derived estimates of forest attributes over space and time: A review of approaches and future trends. Remote Sens. Environ. 2021, 260, 112477. [Google Scholar] [CrossRef]
- Guimarães, N.; Pádua, L.; Marques, P.; Silva, N.; Peres, E.; Sousa, J.J. Forestry remote sensing from unmanned aerial vehicles: A review focusing on the data, processing and potentialities. Remote Sens. 2020, 12, 1046. [Google Scholar] [CrossRef] [Green Version]
- Shahmoradi, J.; Talebi, E.; Roghanchi, P.; Hassanalian, M. A Comprehensive Review of Applications of Drone Technology in the Mining Industry. Drones 2020, 4, 34. [Google Scholar] [CrossRef]
- Guan, H.; Li, J.; Cao, S.; Yu, Y. Use of mobile LiDAR in road information inventory: A review. Int. J. Image Data Fusion 2016, 7, 219–242. [Google Scholar] [CrossRef]
- Hu, T.; Sun, X.; Su, Y.; Guan, H.; Sun, Q.; Kelly, M.; Guo, Q. Development and Performance Evaluation of a Very Low-Cost UAV-Lidar System for Forestry Applications. Remote Sens. 2021, 13, 77. [Google Scholar] [CrossRef]
- Shan, J.; Toth, C.K. Topographic Laser Ranging and Scanning: Principles and Processing; CRC Press: Boca Raton, FL, USA; London, UK; New York, NY, USA, 2018. [Google Scholar]
- Stöcker, C.; Nex, F.; Koeva, M.; Gerke, M. Quality assessment of combined IMU/GNSS data for direct georeferencing in the context of UAV-based mapping. Int. Arch. Photogramm. Remote. Sens. Spat. Inf. Sci. 2017, 42, 355. [Google Scholar] [CrossRef] [Green Version]
- Groves, P.D. Principles of GNSS, Inertial, and Multisensor Integrated Navigation Systems, 2nd ed.; Artech House: Boston, MA, USA; London, UK, 2013. [Google Scholar]
- Vosselman, G.; Maas, H.G. Airborne and Terrestrial Laser Scanning; Whittles Publishing: Dunbeath, Scotland, 2010. [Google Scholar]
- Heinz, E.E. Beiträge zur Kalibrierung und Evaluierung von Multisensorsystemen für Kinematisches Laserscanning. Ph.D. Thesis, University of Bonn, Bonn, Germany, 2021. [Google Scholar]
- Baltsavias, E.P. Airborne laser scanning: Basic relations and formulas. ISPRS J. Photogramm. Remote Sens. 1999, 54, 199–214. [Google Scholar] [CrossRef]
- Pilarska, M.; Ostrowski, W.; Bakuła, K.; Górski, K.; Kurczyński, Z. The potential of light laser scanners developed for unmanned aerial vehicles-the review and accuracy. Int. Arch. Photogramm. Remote Sens. Spat. Inf. Sci. 2016, 42, 87–95. [Google Scholar] [CrossRef] [Green Version]
- Glennie, C. Rigorous 3D error analysis of kinematic scanning LIDAR systems. J. Appl. Geod. 2007, 1, 147–157. [Google Scholar] [CrossRef]
- Habib, A.; Bang, K.I.; Kersting, A.P.; Lee, D.C. Error budget of LiDAR systems and quality control of the derived data. Photogramm. Eng. Remote Sens. 2009, 75, 1093–1108. [Google Scholar] [CrossRef]
- Vennegeerts, H. Objektraumgestützte kinematische Georeferenzierung für mobile-mapping-systeme. Ph.D. Thesis, Fachrichtung Geodäsie und Geoinformatik der Leibniz-University, Hanover, Germany, 2011. [Google Scholar]
- Tulldahl, H.M.; Bissmarck, F.; Larsson, H.; Grönwall, C.; Tolt, G. Accuracy evaluation of 3D lidar data from small UAV. In Electro-Optical Remote Sensing, Photonic Technologies, and Applications IX; International Society for Optics and Photonics: Bellingham, WA, USA, 2015; Volume 9649, p. 964903. [Google Scholar]
- Mandlburger, G.; Pfennigbauer, M.; Schwarz, R.; Flöry, S.; Nussbaumer, L. Concept and Performance Evaluation of a Novel UAV-Borne Topo-Bathymetric LiDAR Sensor. Remote Sens. 2020, 12, 986. [Google Scholar] [CrossRef] [Green Version]
- Hesse, C. Hochauflösende Kinematische Objekterfassung mit terrestrischen Laserscannern. Ph.D. Thesis, Leibniz-University, Fachrichtung Geodäsie und Geoinformatik, Hanover, Germany, 2008. [Google Scholar]
- Kukko, A.; Kaartinen, H.; Hyyppä, J.; Chen, Y. Multiplatform mobile laser scanning: Usability and performance. Sensors 2012, 12, 11712–11733. [Google Scholar] [CrossRef] [Green Version]
- Lim, S.; Thatcher, C.A.; Brock, J.C.; Kimbrow, D.R.; Danielson, J.J.; Reynolds, B. Accuracy assessment of a mobile terrestrial lidar survey at Padre Island National Seashore. Int. J. Remote Sens. 2013, 34, 6355–6366. [Google Scholar] [CrossRef]
- Barber, D.; Mills, J.; Smith-Voysey, S. Geometric validation of a ground-based mobile laser scanning system. ISPRS J. Photogramm. Remote. Sens. 2008, 63, 128–141. [Google Scholar] [CrossRef]
- Kaartinen, H.; Hyyppä, J.; Kukko, A.; Jaakkola, A.; Hyyppä, H. Benchmarking the performance of mobile laser scanning systems using a permanent test field. Sensors 2012, 12, 12814–12835. [Google Scholar] [CrossRef] [Green Version]
- Schlichting, A.; Brenner, C.; Schön, S. Bewertung von Inertial/GNSS-Modulen mittels Laserscannern und bekannter Landmarken. PFG Photogramm. Fernerkundung Geoinf. 2014, 1, 5–15. [Google Scholar] [CrossRef]
- Pentek, Q.; Kennel, P.; Allouis, T.; Fiorio, C.; Strauss, O. A flexible targetless LiDAR–GNSS/INS–Camera calibration method for UAV platforms. ISPRS J. Photogramm. Remote Sens. 2020, 166, 294–307. [Google Scholar] [CrossRef]
- Tucci, G.; Visintini, D.; Bonora, V.; Parisi, E.I. Examination of indoor mobile mapping systems in a diversified internal/external test field. Appl. Sci. 2018, 8, 401. [Google Scholar] [CrossRef] [Green Version]
- Gräfe, G. Kinematische Anwendungen von Laserscannern im Straßenraum. Ph.D. Thesis, University der Bundeswehr München, Fak. für Bauingenieur-und Vermessenswesen, Hanover, Germany, 2009. [Google Scholar]
- Toschi, I.; Rodríguez-Gonzálvez, P.; Remondino, F.; Minto, S.; Orlandini, S.; Fuller, A. Accuracy evaluation of a mobile mapping system with advanced statistical methods. Int. Arch. Photogramm. Remote Sens. Spat. Inf. Sci. 2015, 40, 245. [Google Scholar] [CrossRef] [Green Version]
- Haala, N.; Peter, M.; Kremer, J.; Hunter, G. Mobile LiDAR mapping for 3D point cloud collection in urban areas—A performance test. Int. Arch. Photogramm. Remote Sens. Spat. Inf. Sci 2008, 37, 1119–1127. [Google Scholar]
- Glira, P.; Pfeifer, N.; Mandlburger, G. Rigorous Strip adjustment of UAV-based laserscanning data including time-dependent correction of trajectory errors. Photogramm. Eng. Remote Sens. 2016, 82, 945–954. [Google Scholar] [CrossRef] [Green Version]
- Vosselman, G. Analysis of planimetric accuracy of airborne laser scanning surveys. Int. Arch. Photogramm. Remote Sens. Spat. Inf. Sci. 2008, 37, 99–104. [Google Scholar]
- Fuad, N.; Ismail, Z.; Majid, Z.; Darwin, N.; Ariff, M.; Idris, K.; Yusoff, A. Accuracy evaluation of digital terrain model based on different flying altitudes and conditional of terrain using UAV LiDAR technology. In Proceedings of the IOP Conference Series: Earth and Environmental Science, 9th IGRSM International Conference and Exhibition on Geospatial & Remote Sensing (IGRSM 2018), Kuala Lumpur, Malaysia, 24–25 April 2018; Volume 169, p. 012100. [Google Scholar]
- Brede, B.; Lau, A.; Bartholomeus, H.M.; Kooistra, L. Comparing RIEGL RiCOPTER UAV LiDAR derived canopy height and DBH with terrestrial LiDAR. Sensors 2017, 17, 2371. [Google Scholar] [CrossRef]
- Dalla Corte, A.P.; Rex, F.E.; Almeida, D.R.; Sanquetta, C.R.; Silva, C.A.; Moura, M.M.; Wilkinson, B.; Zambrano, A.M.; Cunha Neto, E.M.; Veras, H.F.; et al. Measuring individual tree diameter and height using GatorEye High-Density UAV-Lidar in an integrated crop-livestock-forest system. Remote Sens. 2020, 12, 863. [Google Scholar] [CrossRef] [Green Version]
- Cao, L.; Liu, H.; Fu, X.; Zhang, Z.; Shen, X.; Ruan, H. Comparison of UAV LiDAR and digital aerial photogrammetry point clouds for estimating forest structural attributes in subtropical planted forests. Forests 2019, 10, 145. [Google Scholar] [CrossRef] [Green Version]
- Kucharczyk, M.; Hugenholtz, C.H.; Zou, X. UAV–LiDAR accuracy in vegetated terrain. J. Unmanned Veh. Syst. 2018, 6, 212–234. [Google Scholar] [CrossRef]
- Torresan, C.; Berton, A.; Carotenuto, F.; Chiavetta, U.; Miglietta, F.; Zaldei, A.; Gioli, B. Development and performance assessment of a low-cost UAV laser scanner system (LasUAV). Remote Sens. 2018, 10, 1094. [Google Scholar] [CrossRef] [Green Version]
- Ltd., S.D.T.C. DJI Matrice 600 Pro. 2019. Available online: https://www.dji.com/matrice600-pro/info#downloads (accessed on 21 April 2021).
- GmbH, R.L.M.S. RIEGL miniVUX-SYS. 2020. Available online: http://www.riegl.com/uploads/tx_pxpriegldownloads/RIEGL_miniVUX-SYS_Datasheet_2020-10-05_01.pdf (accessed on 21 April 2021).
- Corporation, A. APX-20 UAV. 2020. Available online: https://www.applanix.com/products/dg-uavs.htm#specs-and-brochures (accessed on 21 April 2021).
- GmbH, R.L.M.S. RIEGL miniVUX-2UAV. 2021. Available online: http://www.riegl.com/uploads/tx_pxpriegldownloads/RIEGL_miniVUX-2UAV_Datasheet_2021-04-06.pdf (accessed on 21 April 2021).
- Janßen, J.; Medic, T.; Kuhlmann, H.; Holst, C. Decreasing the uncertainty of the target center estimation at terrestrial laser scanning by choosing the best algorithm and by improving the target design. Remote Sens. 2019, 11, 845. [Google Scholar] [CrossRef] [Green Version]
- Schmitz, B.; Holst, C.; Medic, T.; Lichti, D.D.; Kuhlmann, H. How to Efficiently Determine the Range Precision of 3D Terrestrial Laser Scanners. Sensors 2019, 19, 1466. [Google Scholar] [CrossRef] [Green Version]
- Niemeier, W. Ausgleichungsrechnung: Statistische Auswertemethoden; Walter de Gruyter: Berlin, Germany; New York, NY, USA, 2008. [Google Scholar]


| Errors | |
|---|---|
| Trajectory estimation | Errors in position and orientation-sensor platform |
| System calibration | error in lever arm (GNSS antenna and IMU) |
| error in lever arm (laser scanner and IMU) | |
| bore-sight angle error between IMU body and laser scanner | |
| Laser scanner | range measurement error |
| object characteristics | |
| atmospheric refraction | |
| Miscellaneous errors | time synchronisation |
| sensor mounting rigidity |
| Accuracy | Values |
|---|---|
| trajectory estimation-position vertical | <0.10 [m] |
| trajectory estimation-position horizontal | <0.05 [m] |
| trajectory estimation-roll & pitch | 0.015 [deg] |
| trajectory estimation-heading | 0.035 [deg] |
| laser scanner | 0.015 [m] |
| Single Strip | Multiple Strip | |
|---|---|---|
| flight repetitions | 4 | 4 |
| flight height [m] | 10 | 25 |
| flight speed [m/s] | 1 | 3 |
| laser scanner line speed [lps] | 55 | |
| avg. point distance [m] | ||
| point density [pts/m] | 2495 | 333 |
| GNSS | Baseline Length [km] | |
|---|---|---|
| Own master station (pillar) | GPS/GLO/GAL/BDS | 1 |
| Virtual Reference Station 1 (VRS1) | GPS/GLO/GAL/BDS | 1 |
| Virtual Reference Station 2 (VRS2) | GPS/GLO/GAL/BDS | 2 |
| CORS station (SAPOS NRW) | GPS/GLO/GAL/BDS | 16 |
| Mean Absolute Difference [cm] | Root Mean Square Error [cm] | |||||
|---|---|---|---|---|---|---|
| Own master station (pillar) | ||||||
| Virtual Reference Station 1 (VRS1) | ||||||
| Virtual Reference Station 2 (VRS2) | ||||||
| CORS station (SAPOS NRW) | ||||||
Publisher’s Note: MDPI stays neutral with regard to jurisdictional claims in published maps and institutional affiliations. |
© 2021 by the authors. Licensee MDPI, Basel, Switzerland. This article is an open access article distributed under the terms and conditions of the Creative Commons Attribution (CC BY) license (https://creativecommons.org/licenses/by/4.0/).
Share and Cite
Dreier, A.; Janßen, J.; Kuhlmann, H.; Klingbeil, L. Quality Analysis of Direct Georeferencing in Aspects of Absolute Accuracy and Precision for a UAV-Based Laser Scanning System. Remote Sens. 2021, 13, 3564. https://doi.org/10.3390/rs13183564
Dreier A, Janßen J, Kuhlmann H, Klingbeil L. Quality Analysis of Direct Georeferencing in Aspects of Absolute Accuracy and Precision for a UAV-Based Laser Scanning System. Remote Sensing. 2021; 13(18):3564. https://doi.org/10.3390/rs13183564
Chicago/Turabian StyleDreier, Ansgar, Jannik Janßen, Heiner Kuhlmann, and Lasse Klingbeil. 2021. "Quality Analysis of Direct Georeferencing in Aspects of Absolute Accuracy and Precision for a UAV-Based Laser Scanning System" Remote Sensing 13, no. 18: 3564. https://doi.org/10.3390/rs13183564
APA StyleDreier, A., Janßen, J., Kuhlmann, H., & Klingbeil, L. (2021). Quality Analysis of Direct Georeferencing in Aspects of Absolute Accuracy and Precision for a UAV-Based Laser Scanning System. Remote Sensing, 13(18), 3564. https://doi.org/10.3390/rs13183564