Article

Detecting the Responses of CO2 Column Abundances to Anthropogenic Emissions from Satellite Observations of GOSAT and OCO-2

1
Key Laboratory of Digital Earth Science, Aerospace Information Research Institute, Chinese Academy of Sciences, Beijing 100094, China
2
University of Chinese Academy of Sciences, Beijing 100049, China
3
Joint Institute for Regional Earth System Science & Engineering (JIFRESSE), University of California, Los Angeles, CA 90095, USA
4
Division of Geological and Planetary Sciences, California Institute of Technology, Pasadena, CA 91125, USA
*
Author to whom correspondence should be addressed.
Remote Sens. 2021, 13(17), 3524; https://doi.org/10.3390/rs13173524
Submission received: 25 July 2021 / Revised: 2 September 2021 / Accepted: 3 September 2021 / Published: 5 September 2021
(This article belongs to the Section Urban Remote Sensing)

Abstract

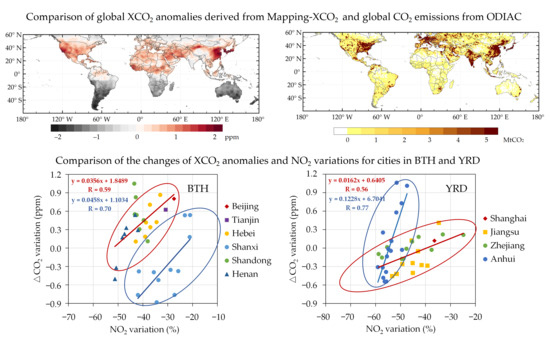
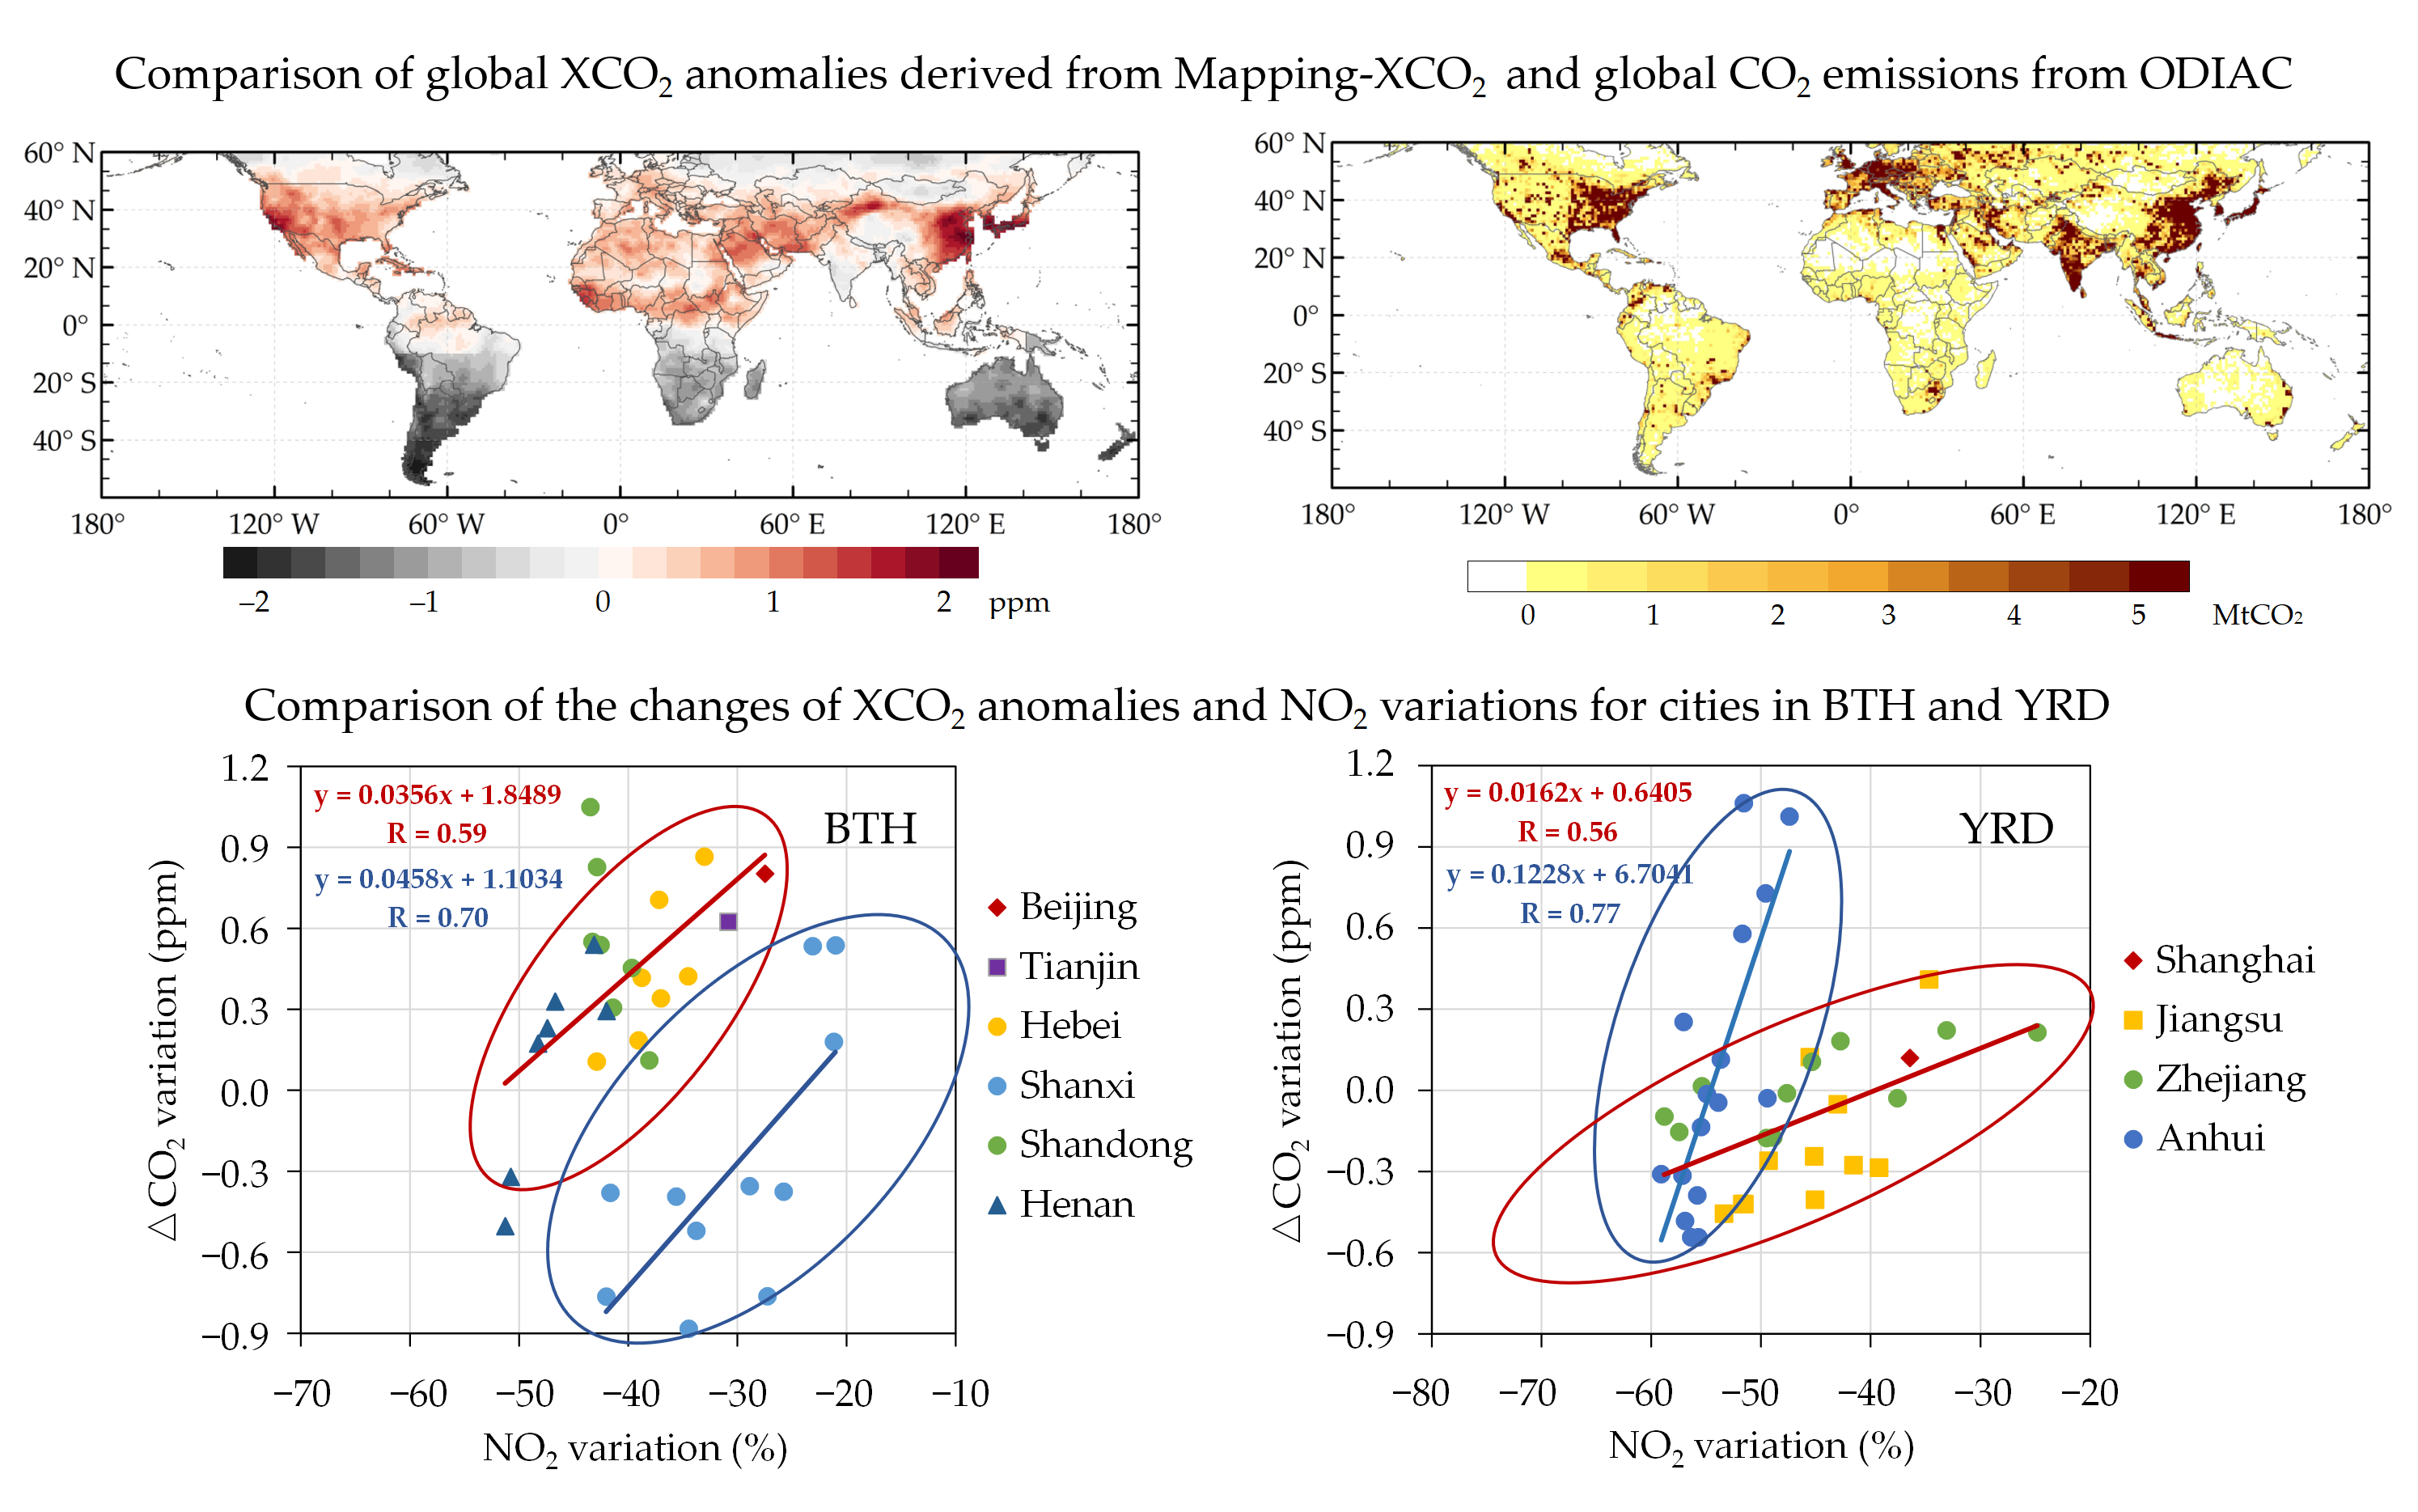
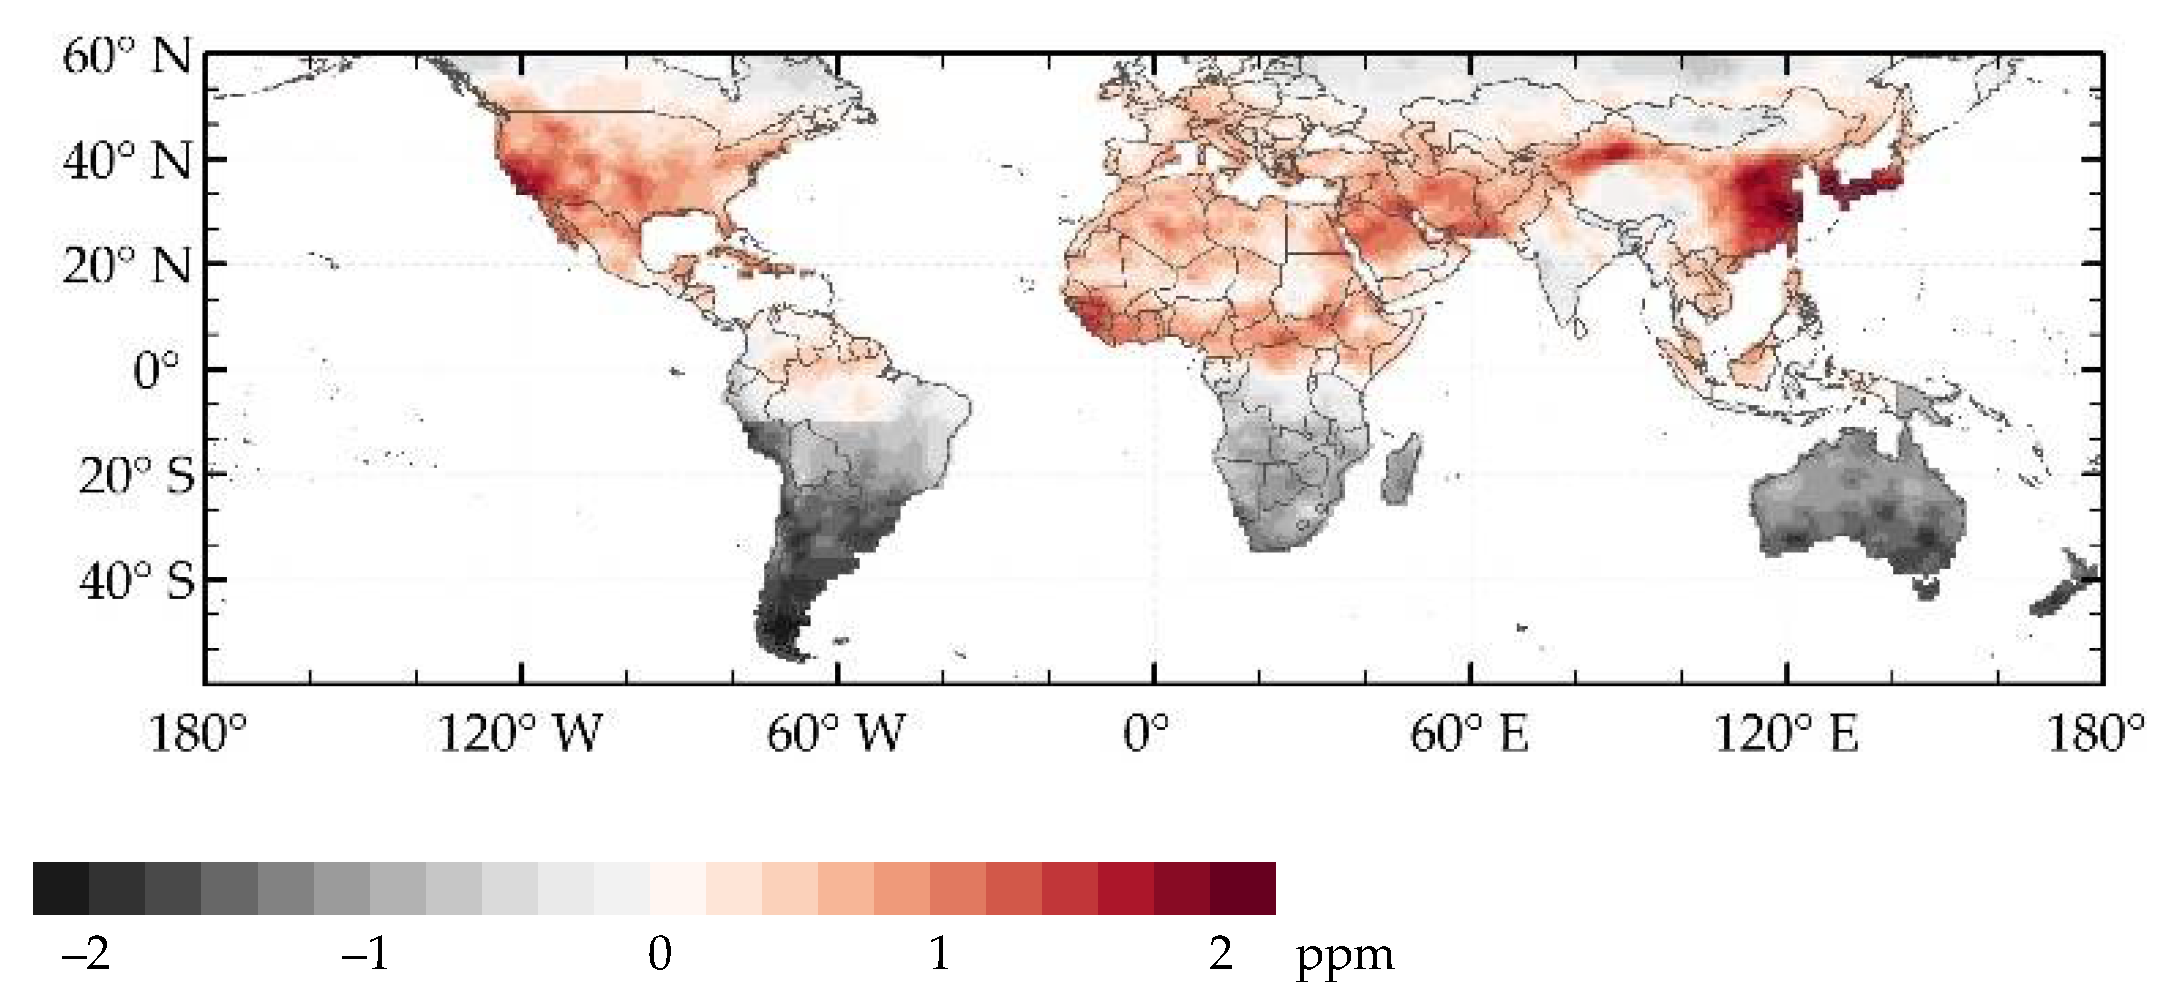
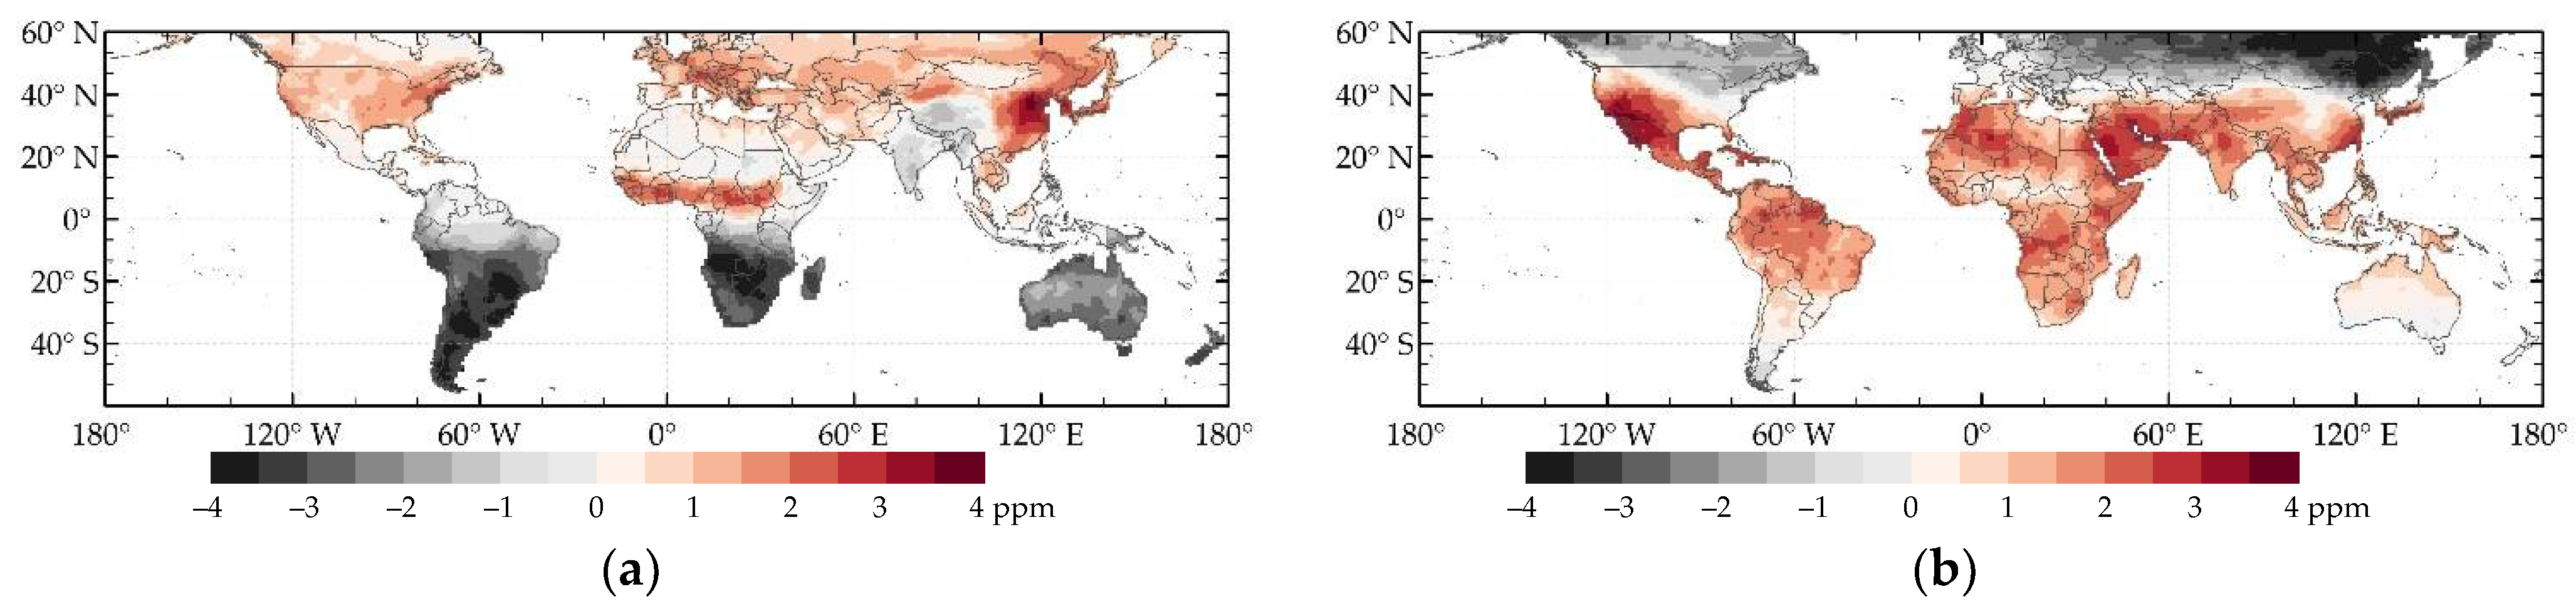
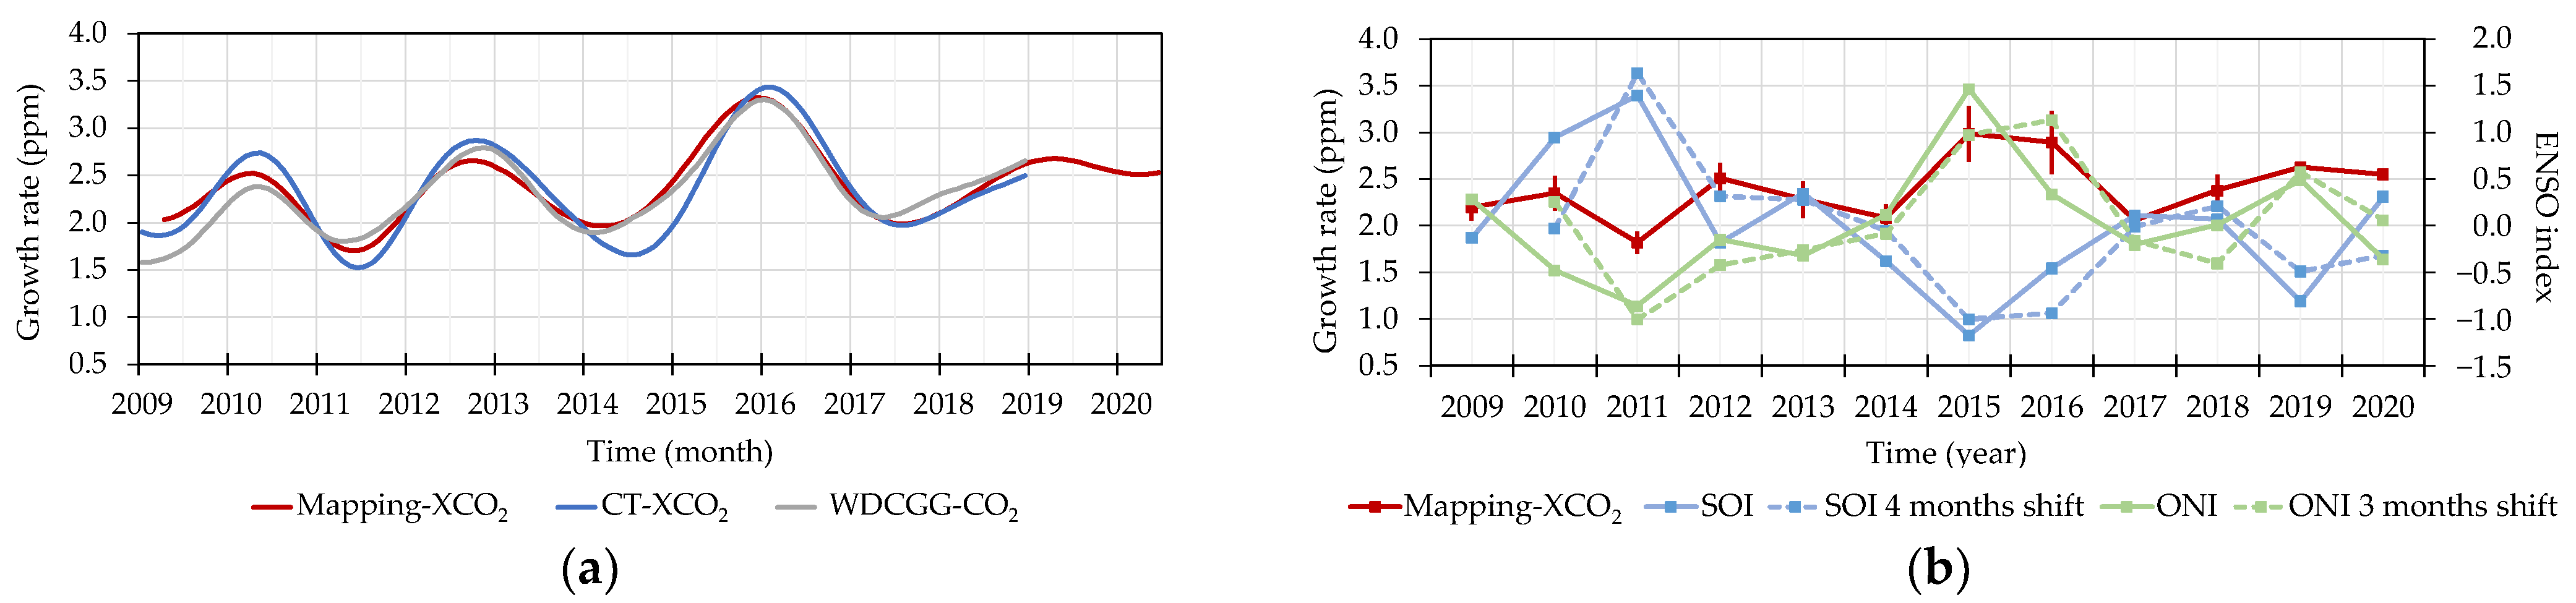
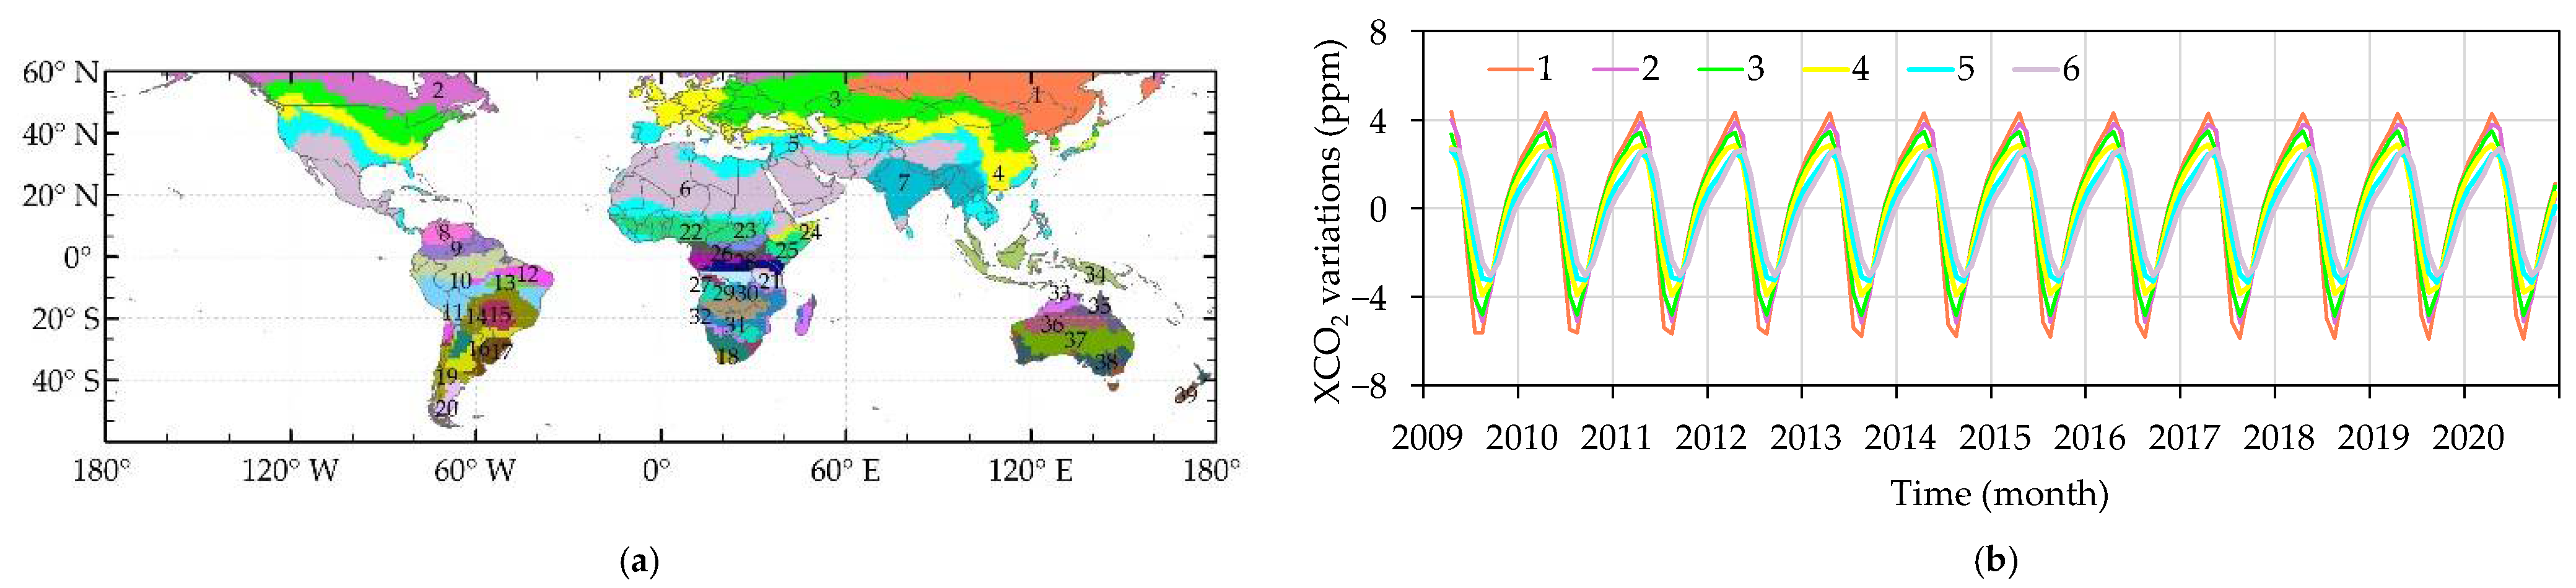
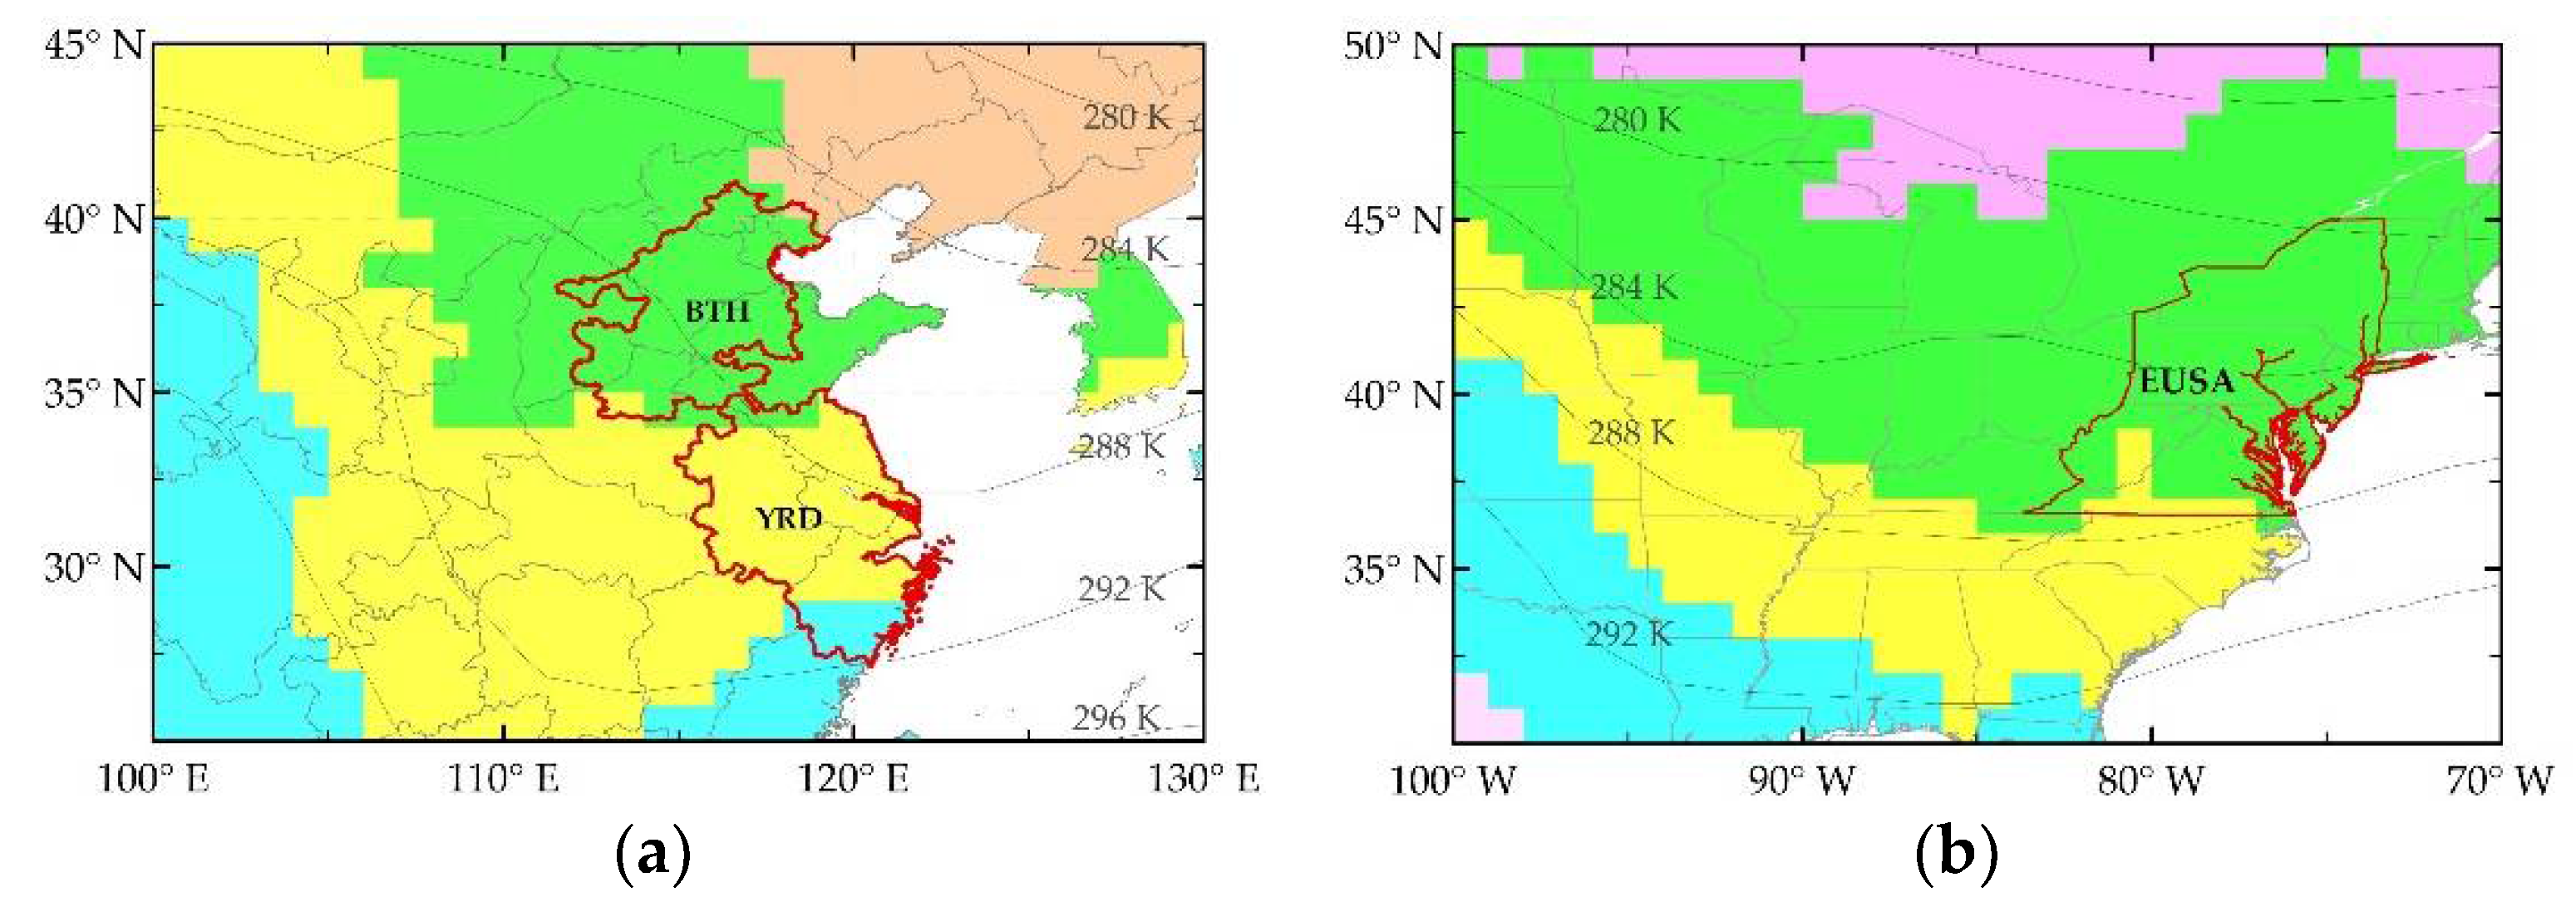
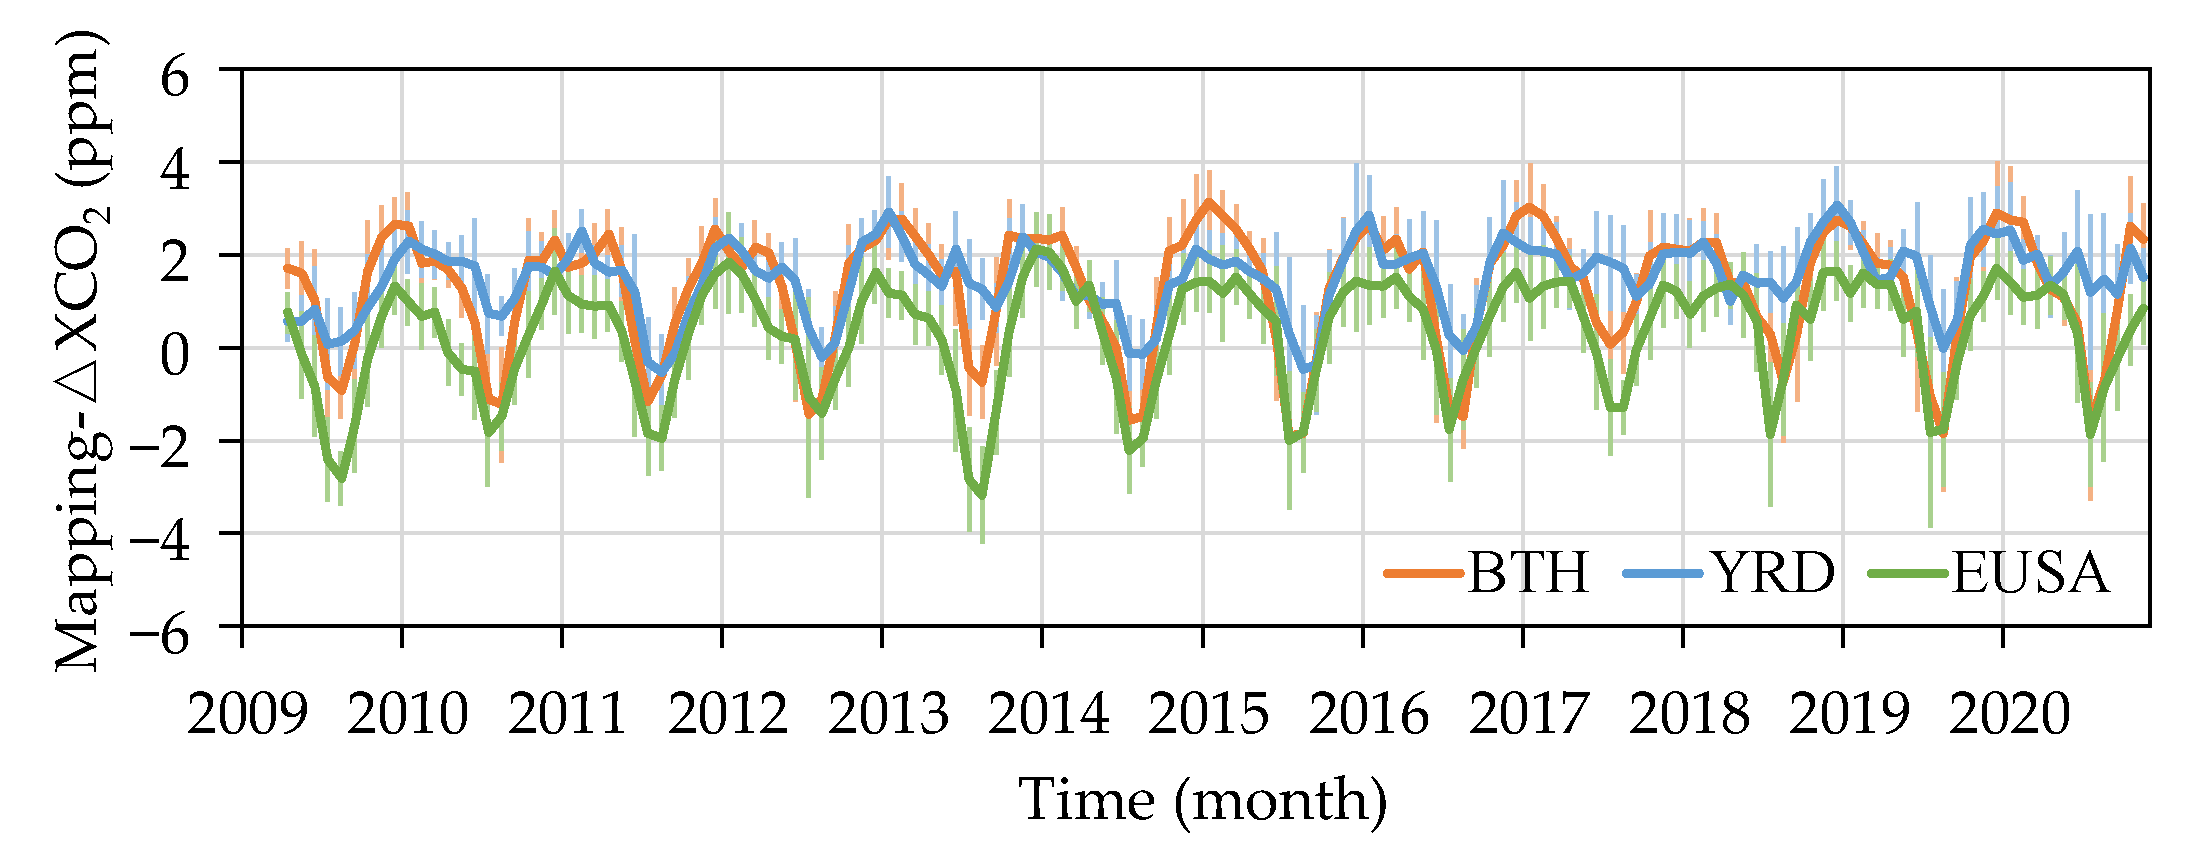
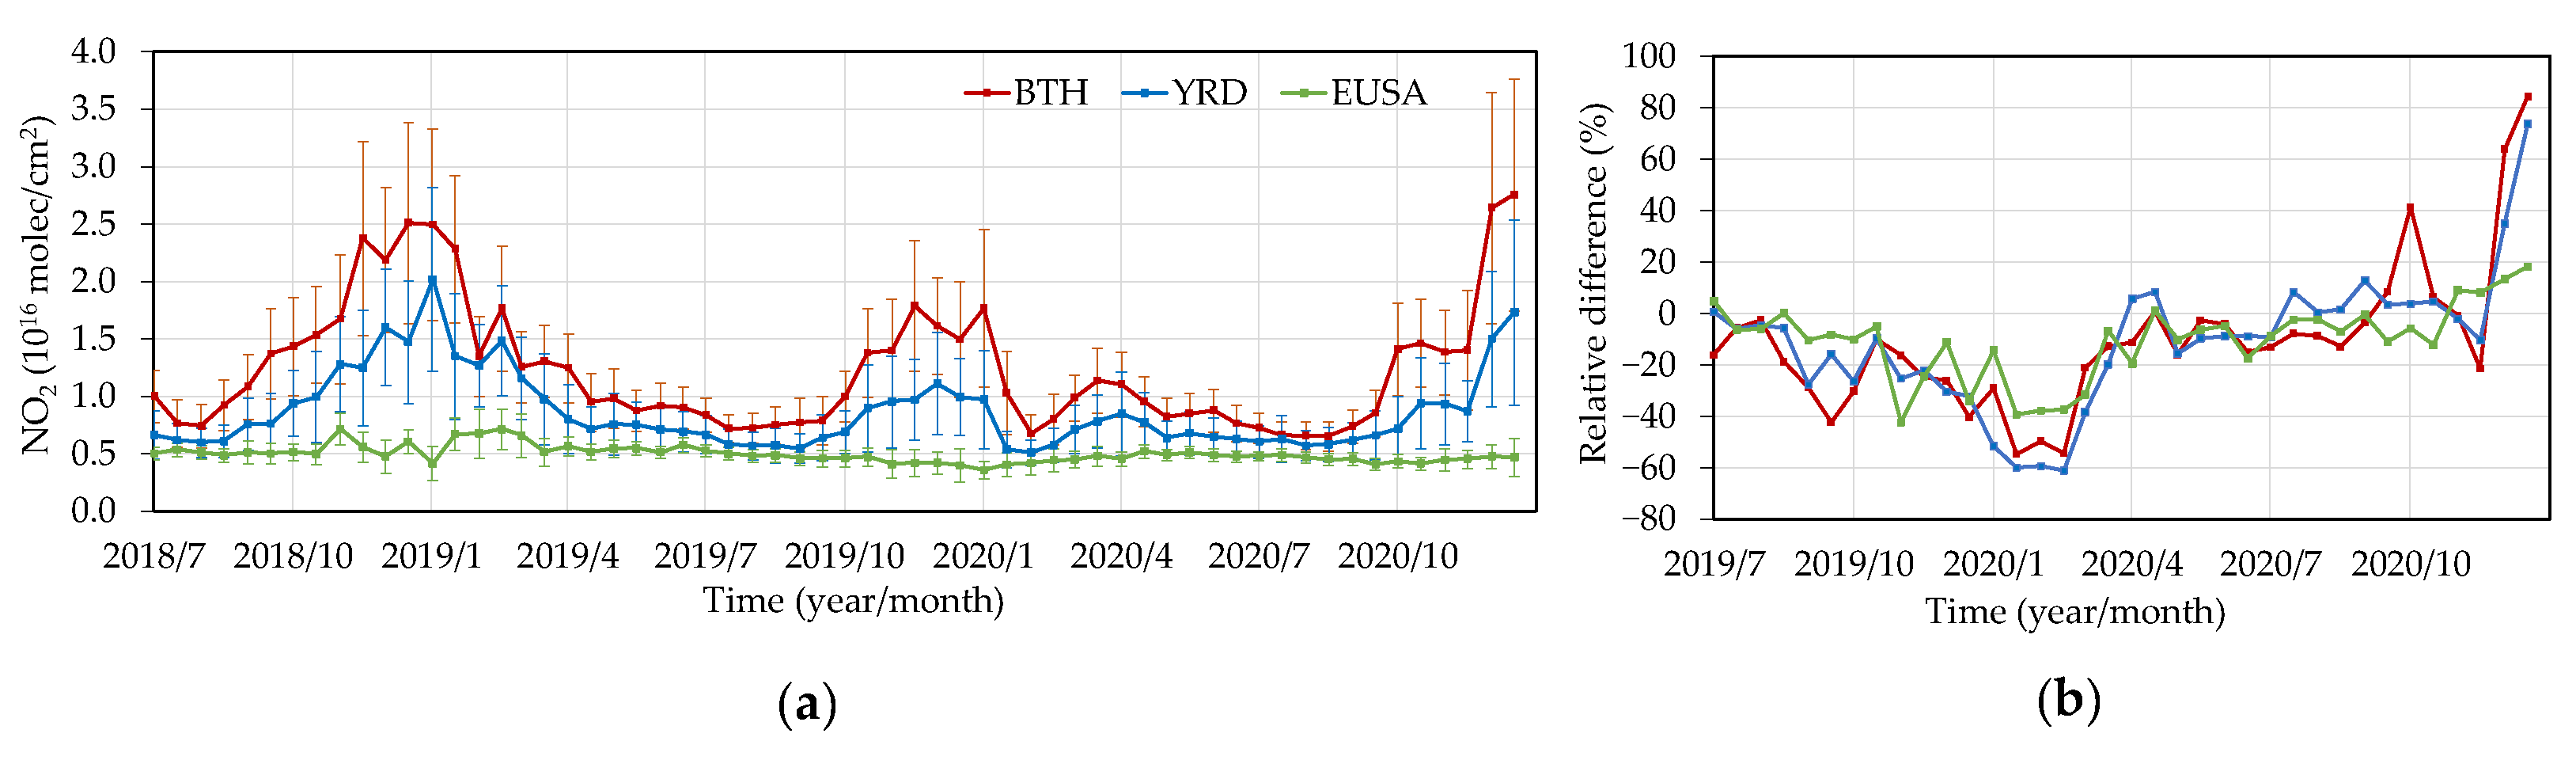
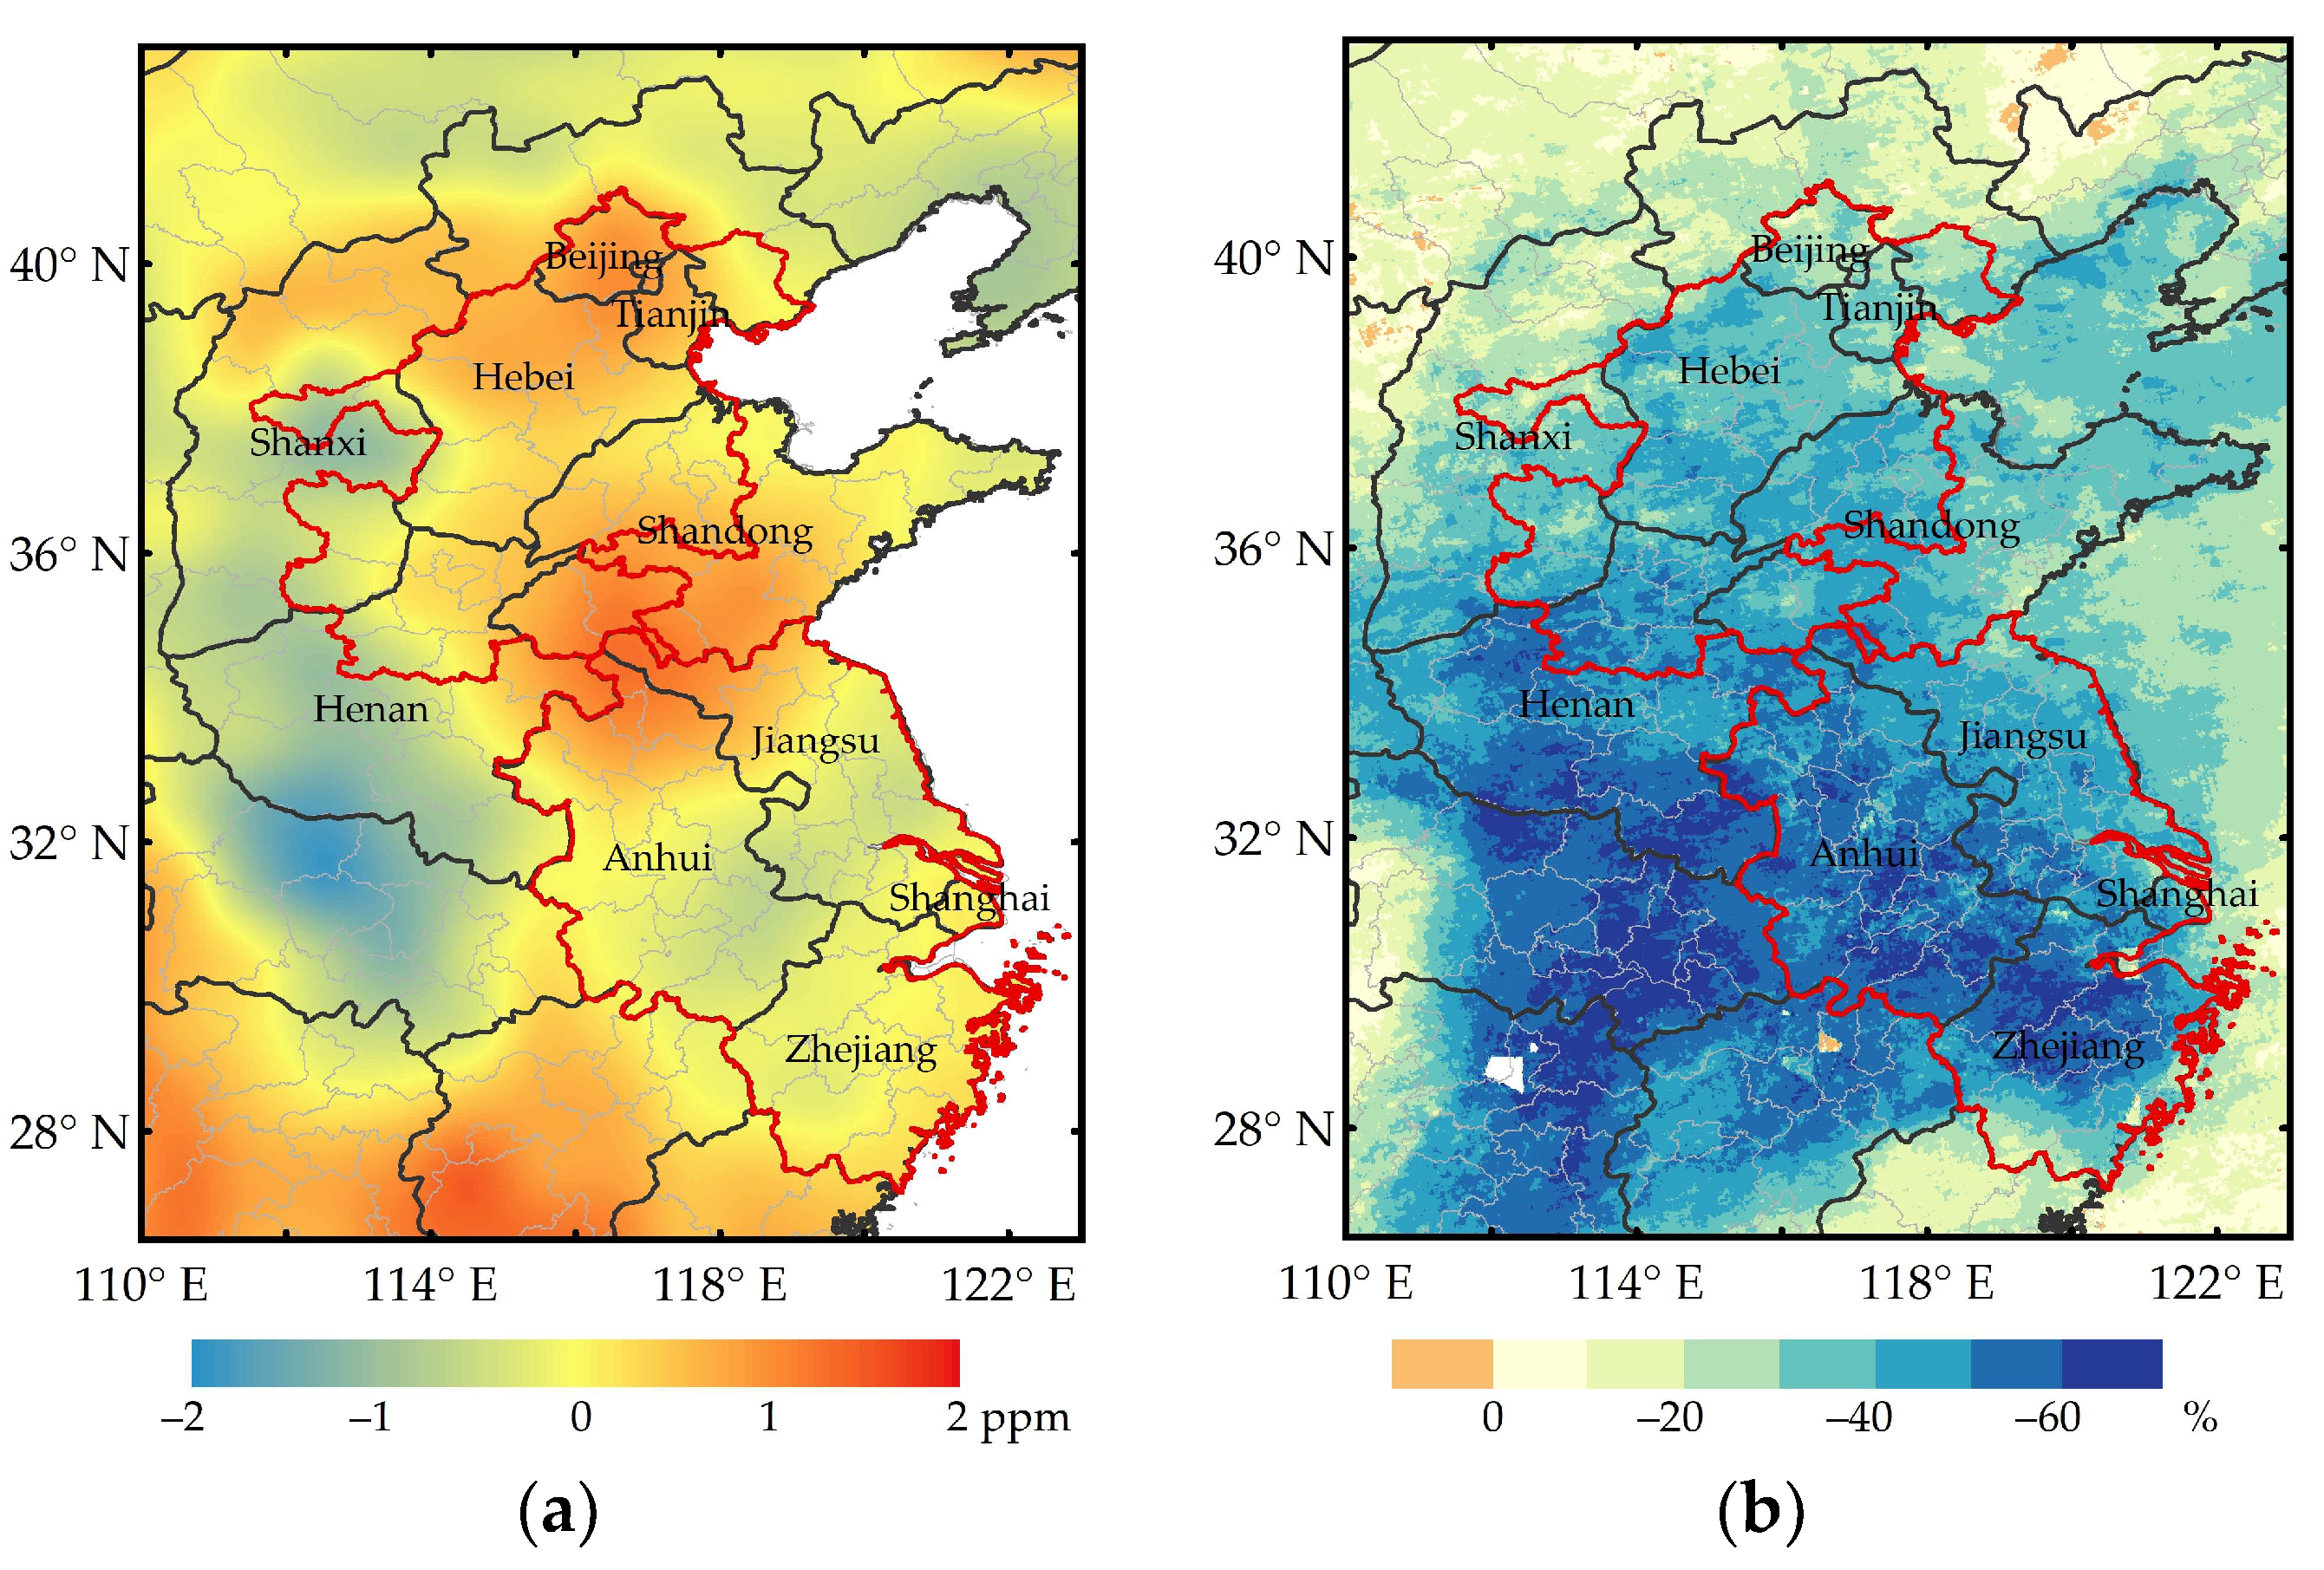
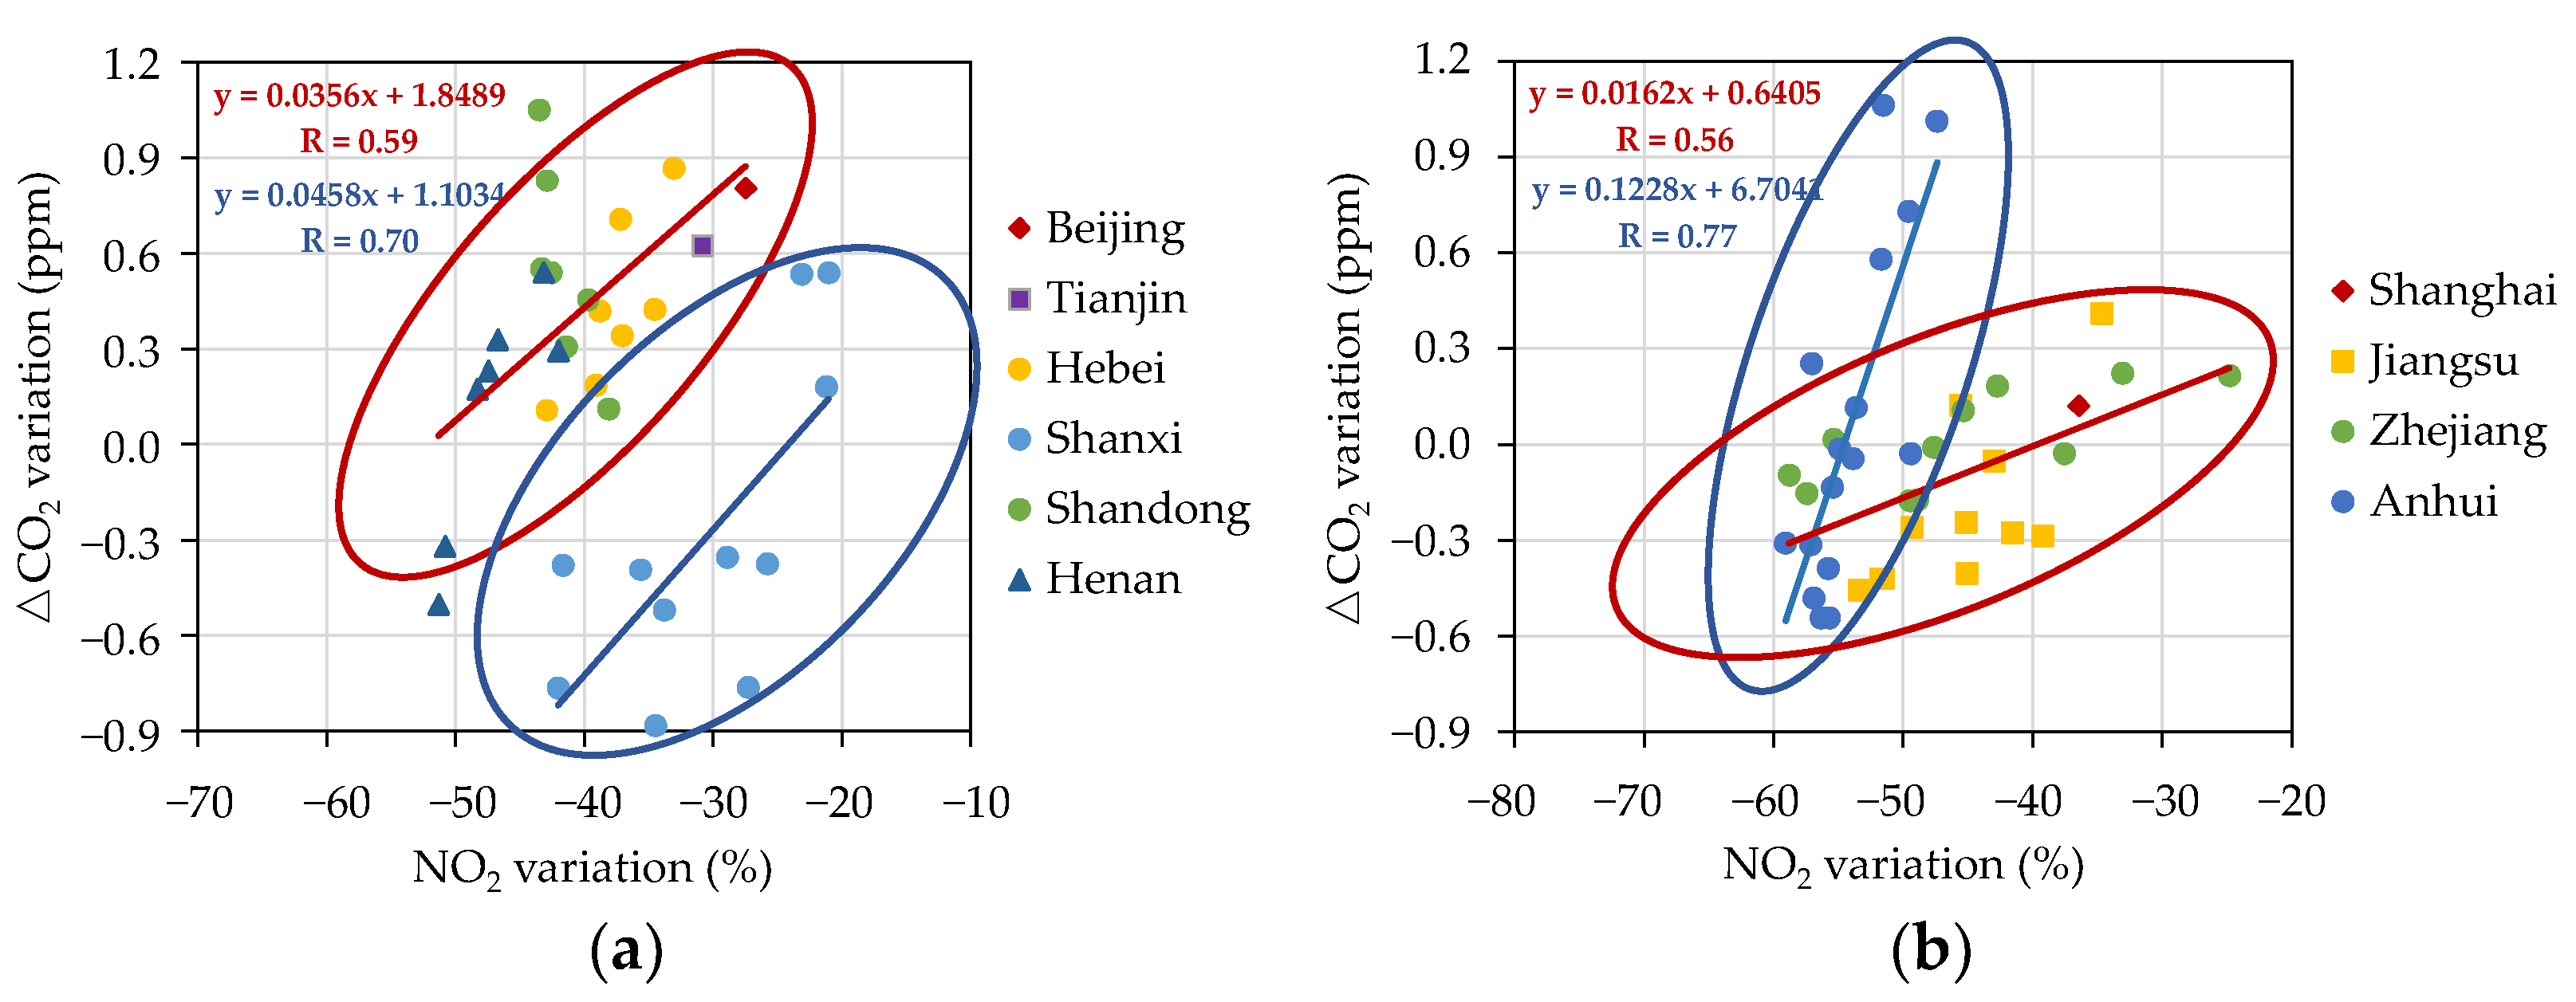
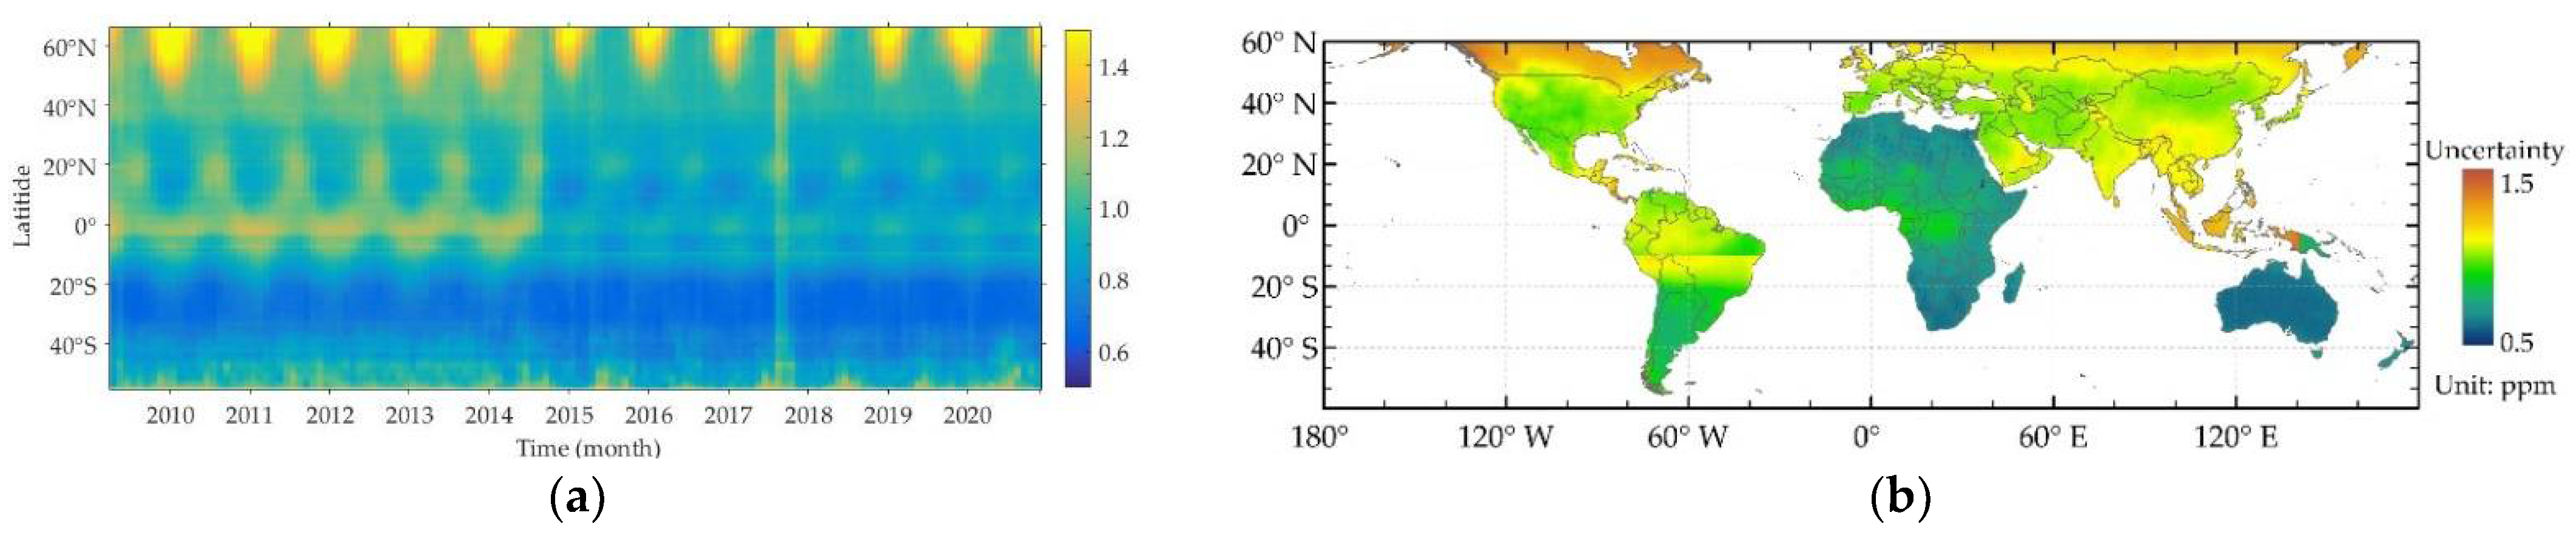
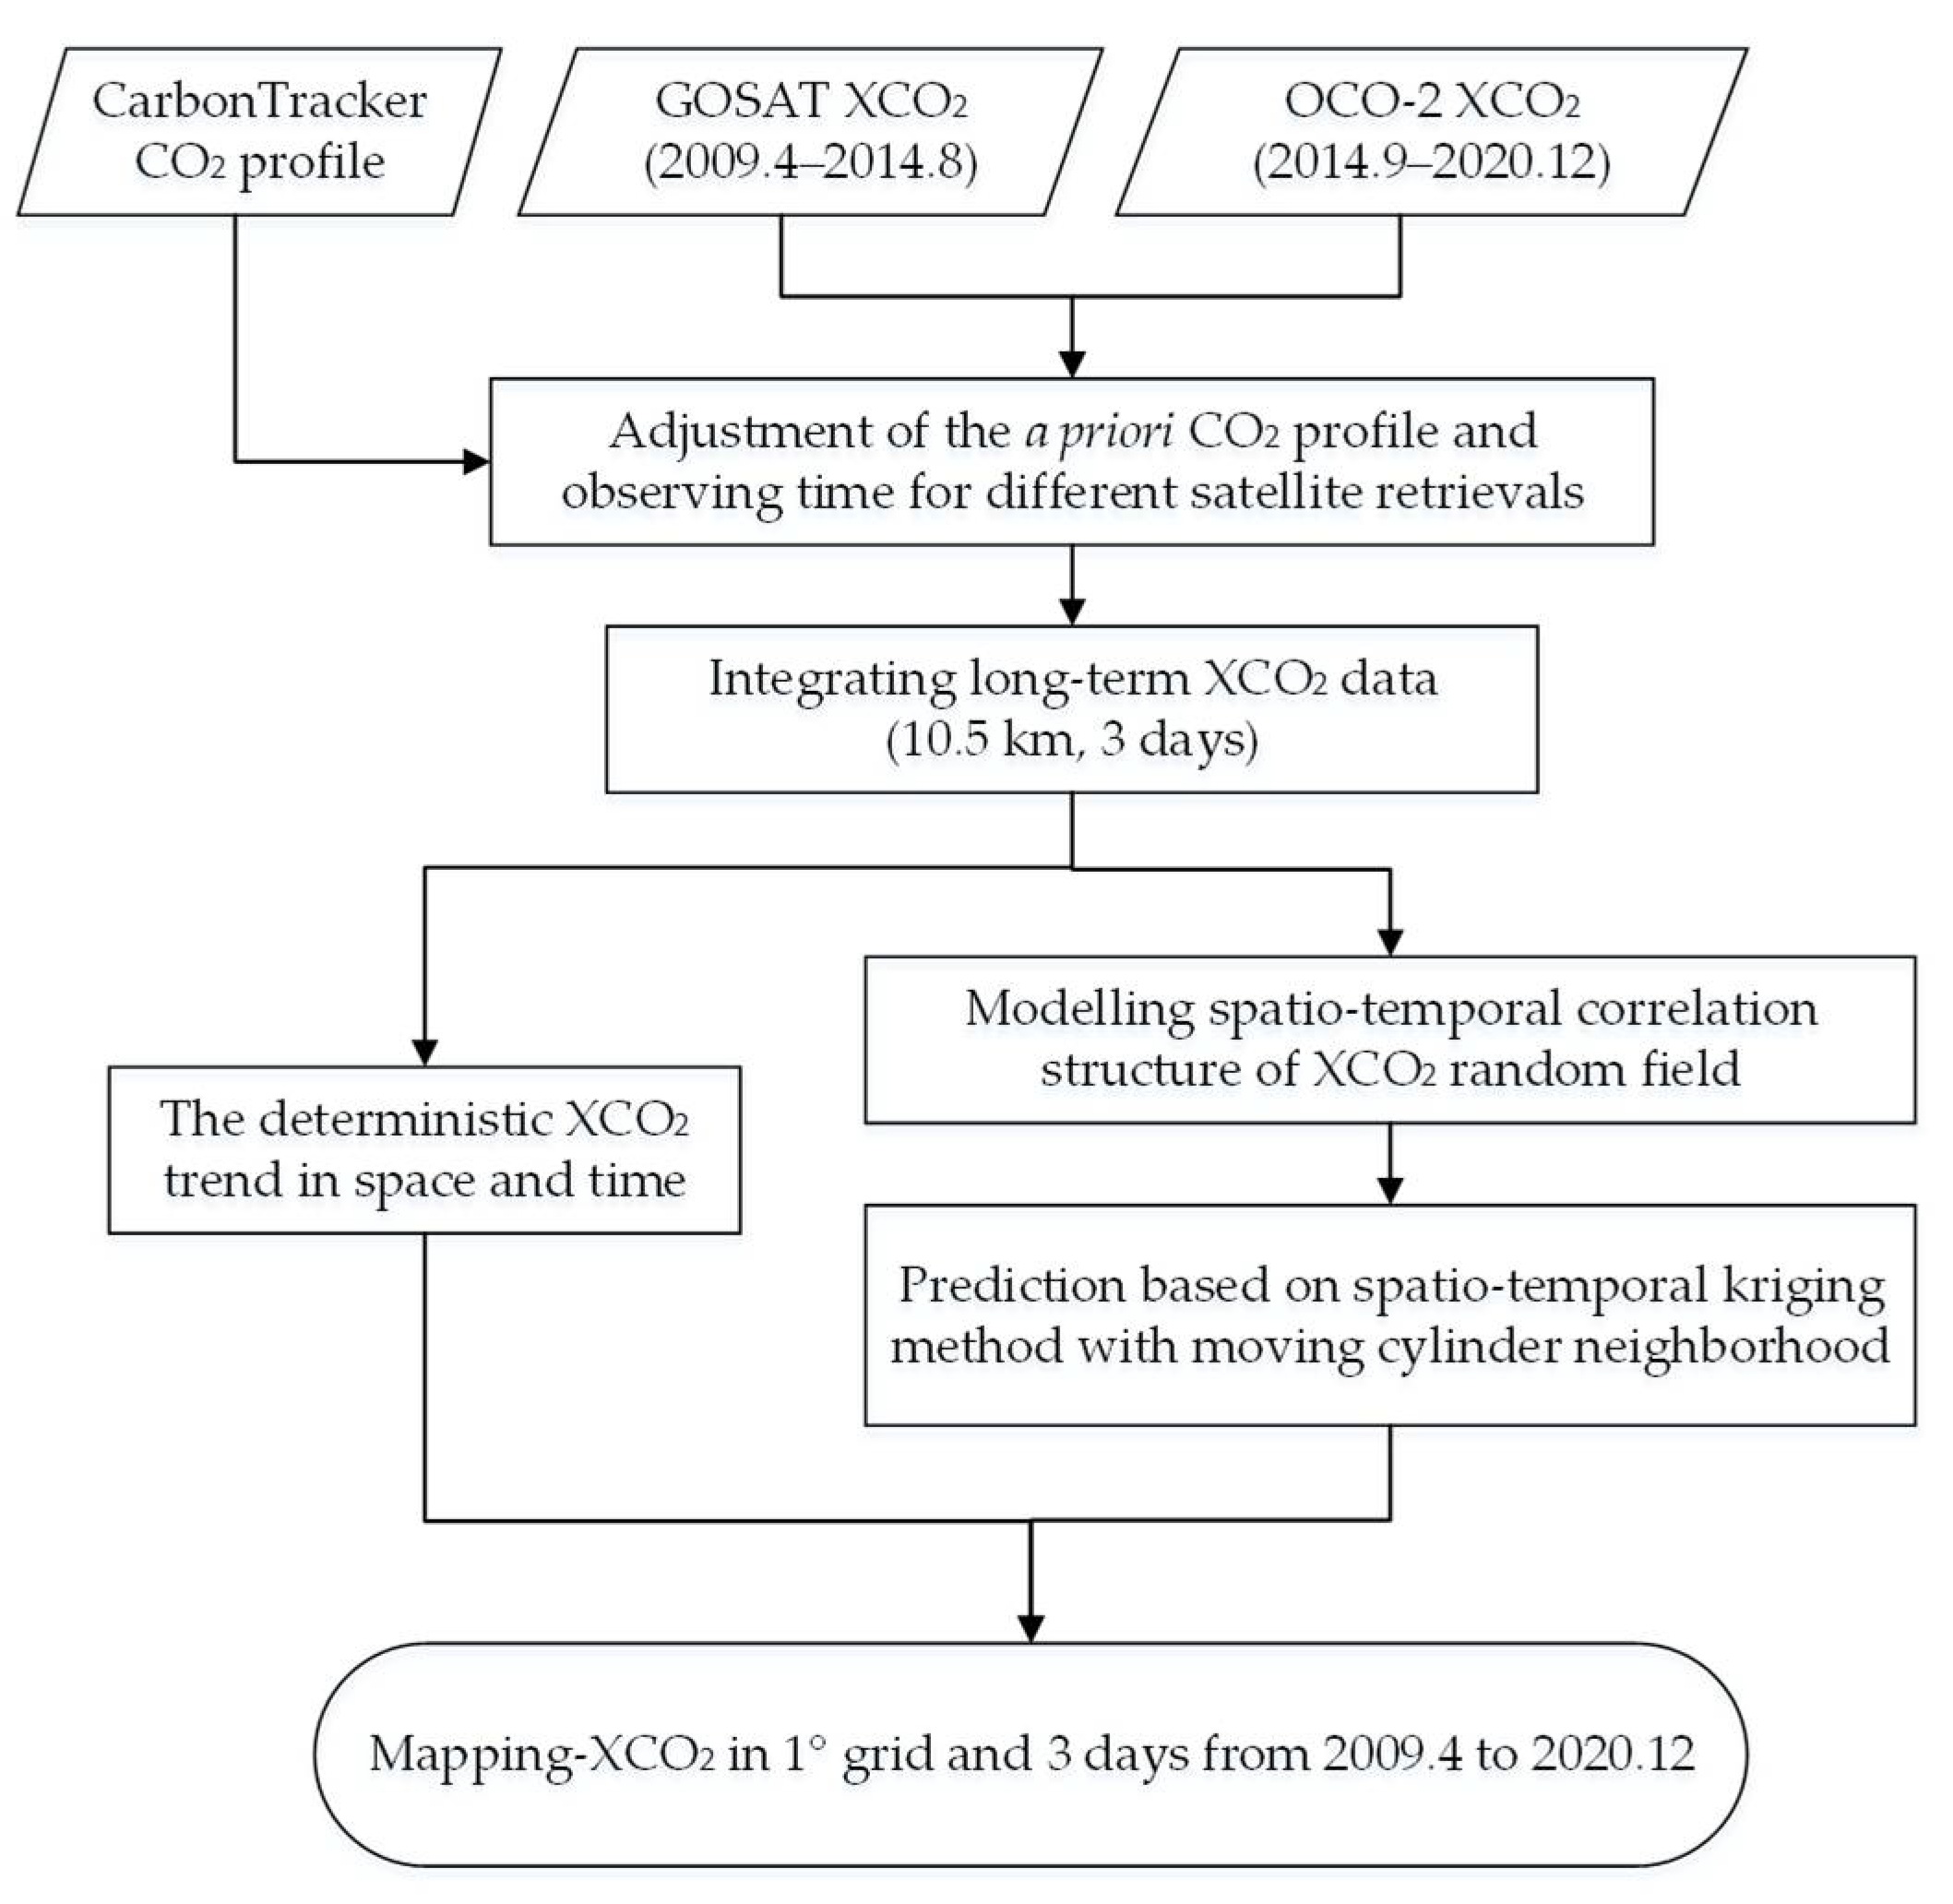
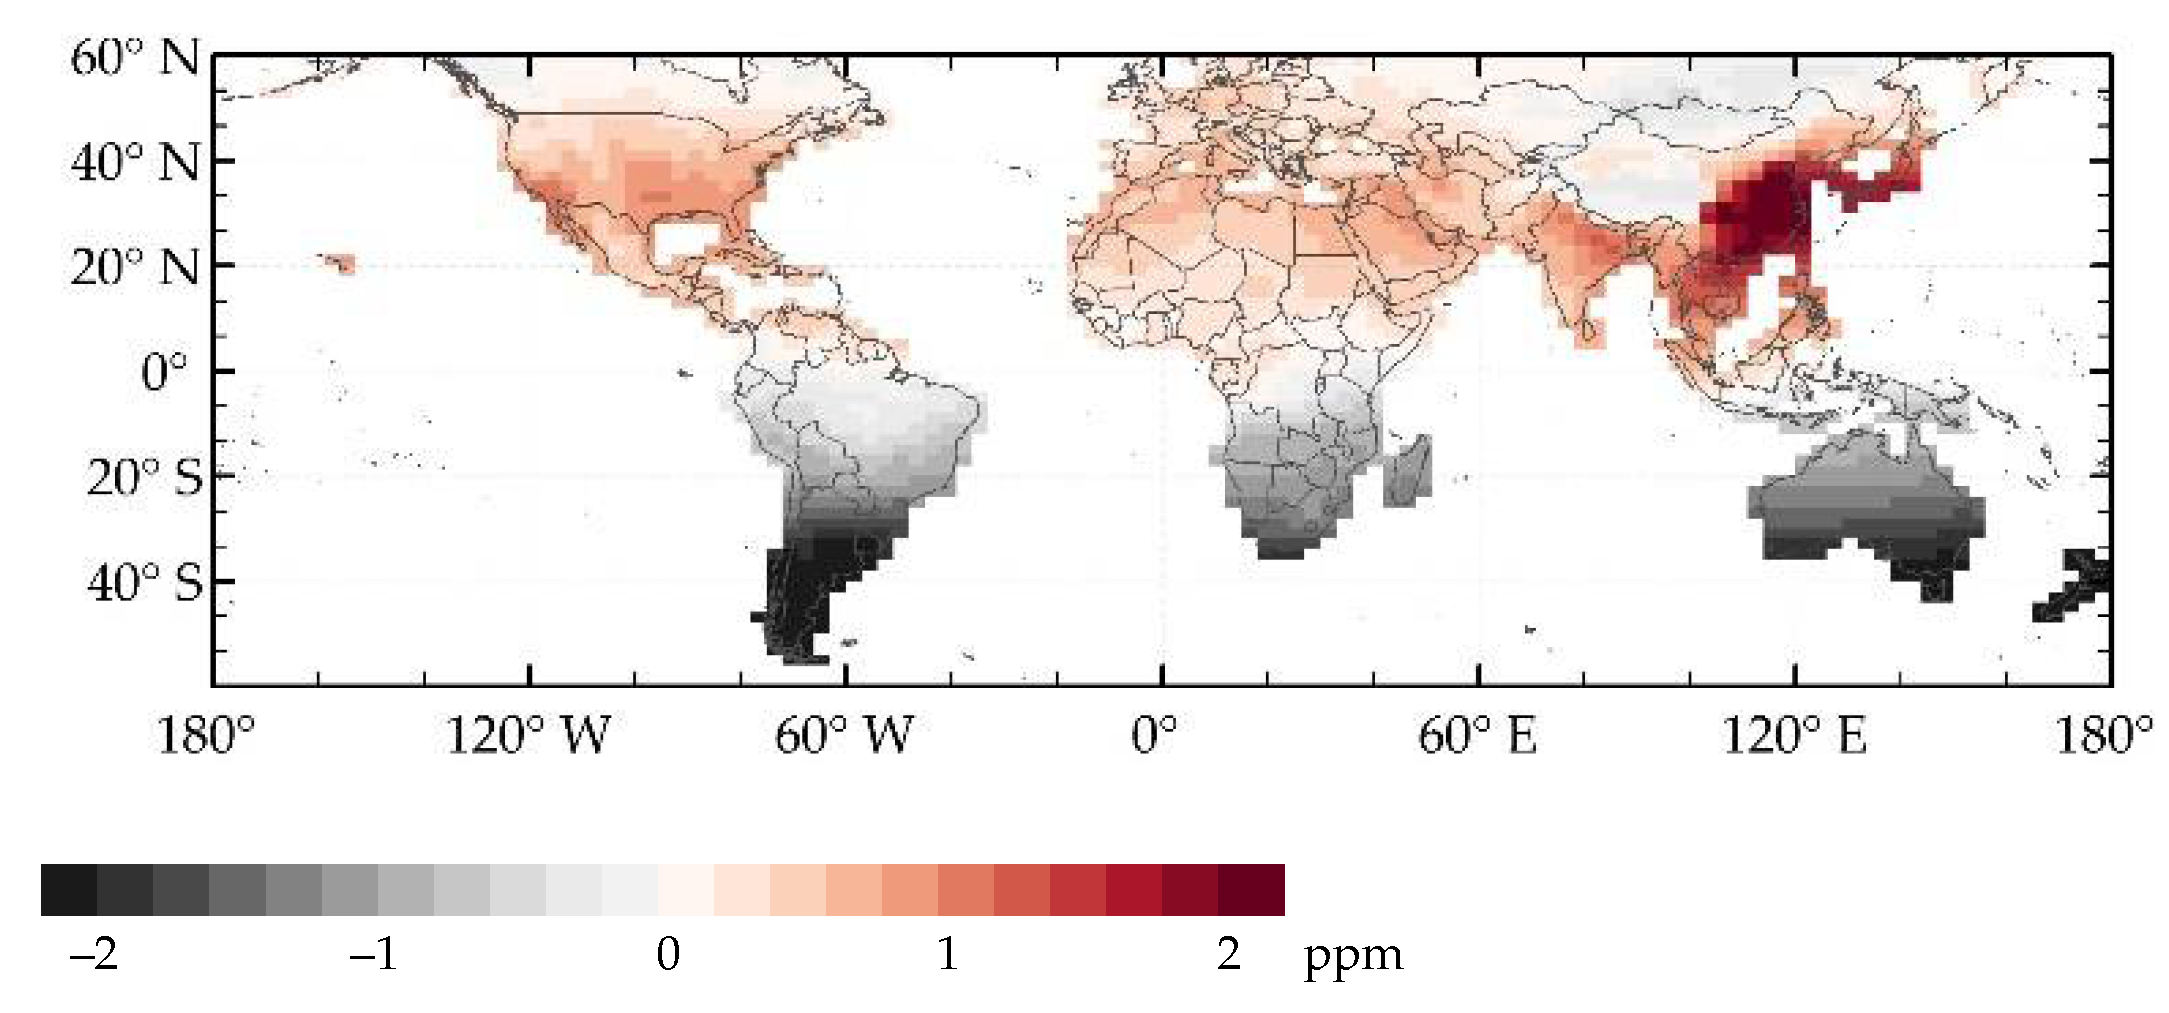
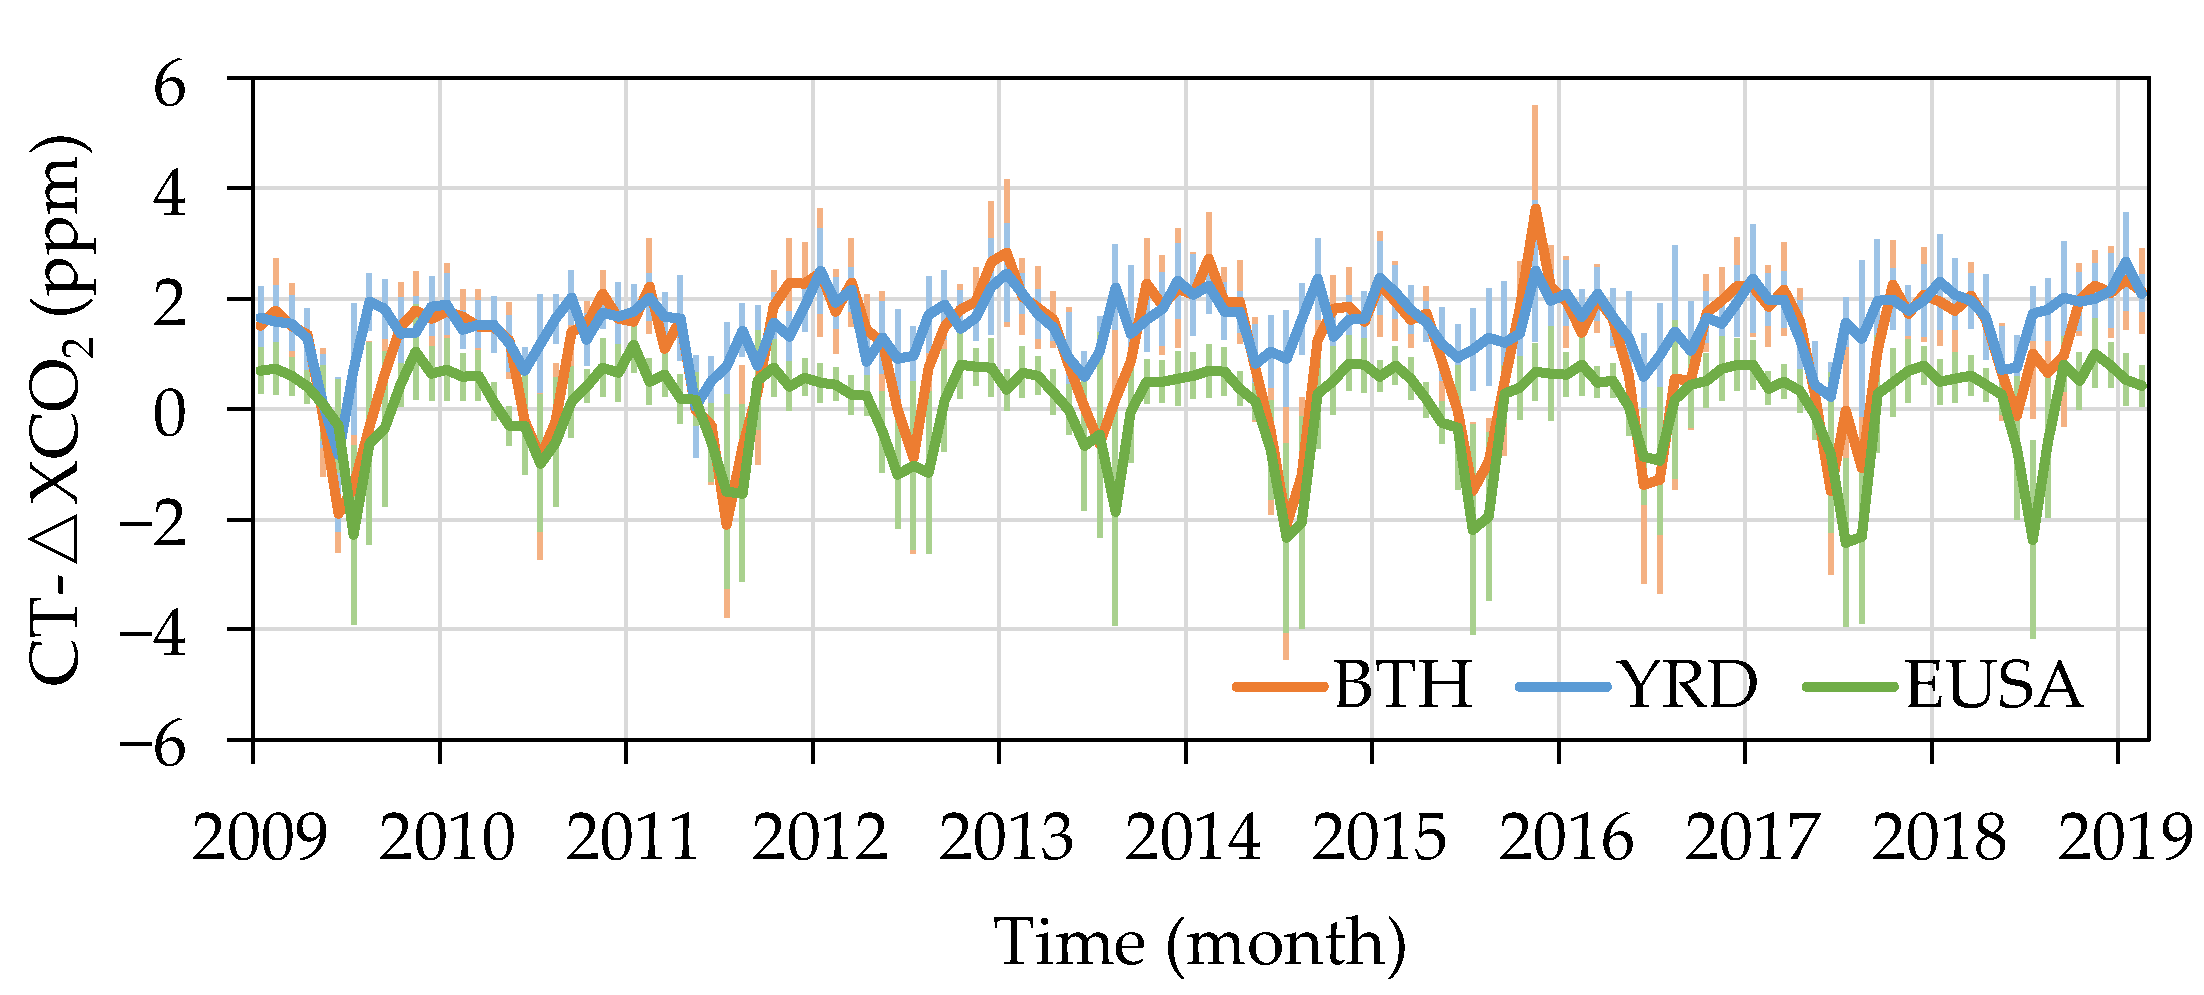
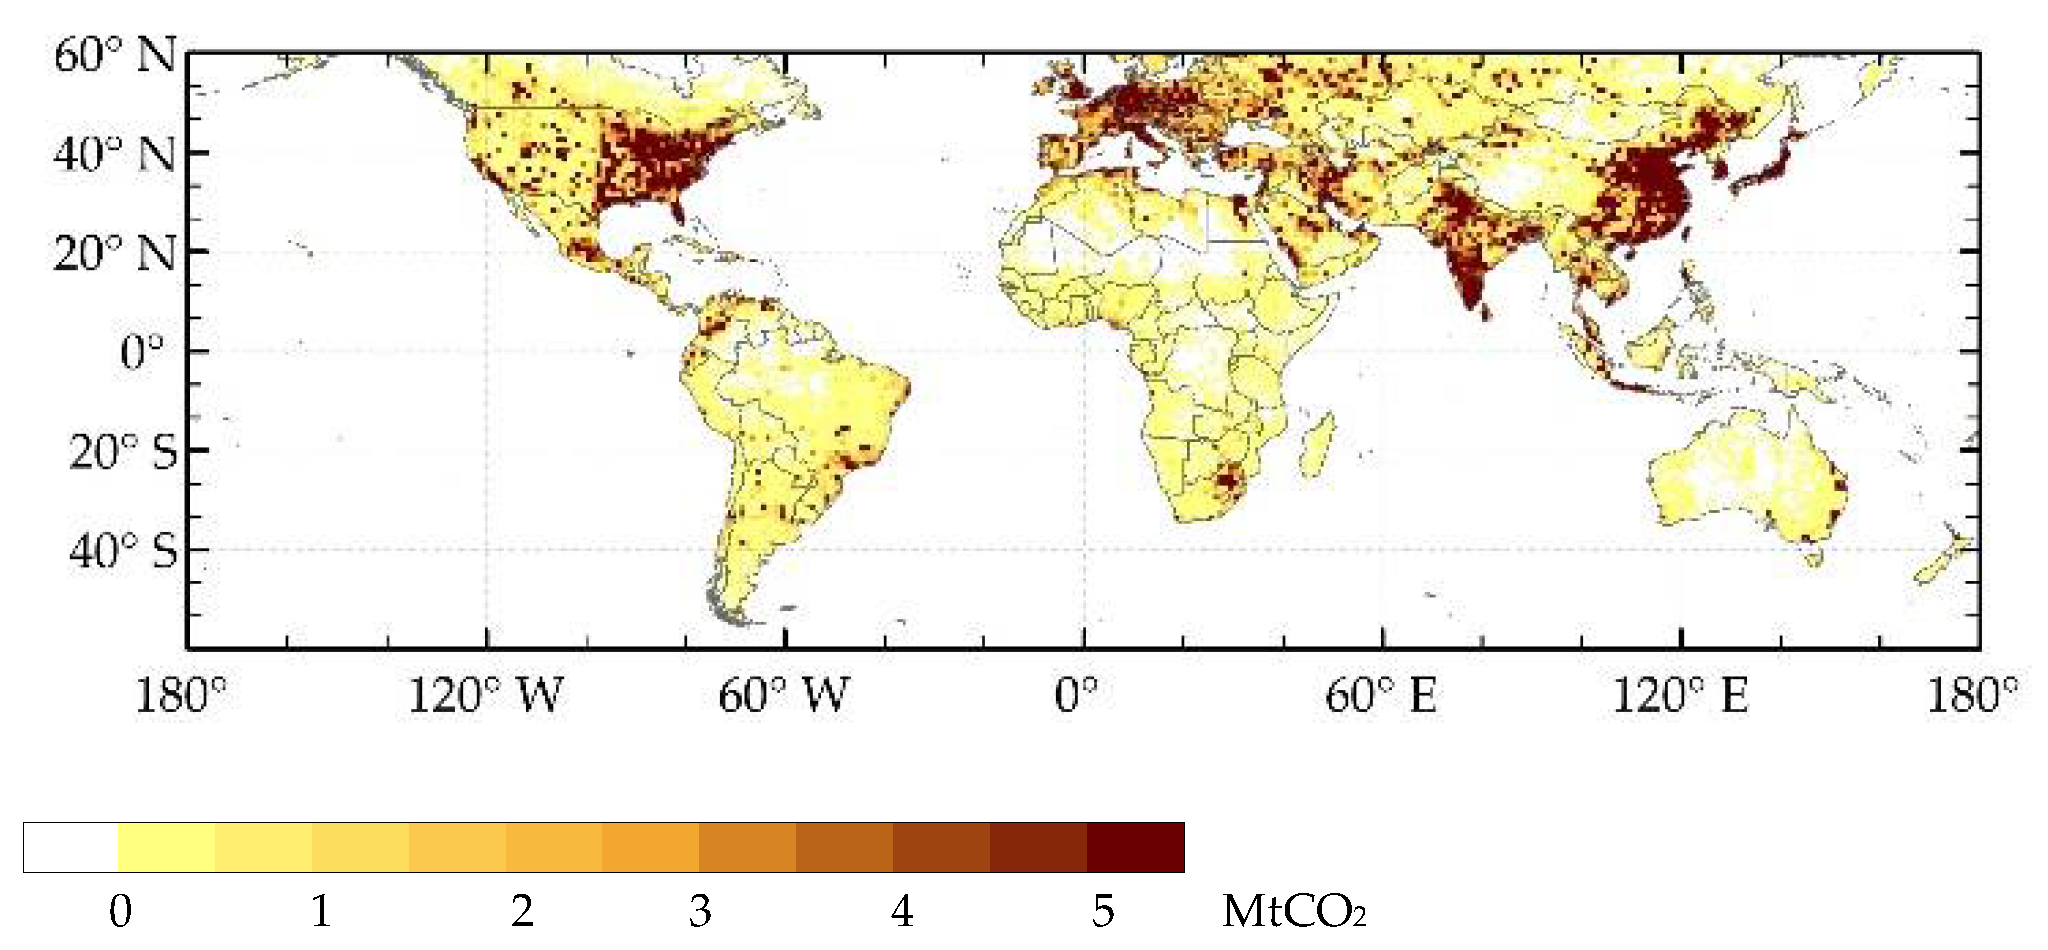
The continuing increase in atmospheric CO2 concentration caused by anthropogenic CO2 emissions significantly contributes to climate change driven by global warming. Satellite measurements of long-term CO2 data with global coverage improve our understanding of global carbon cycles. However, the sensitivity of the space-borne measurements to anthropogenic emissions on a regional scale is less explored because of data sparsity in space and time caused by impacts from geophysical factors such as aerosols and clouds. Here, we used global land mapping column averaged dry-air mole fractions of CO2 (XCO2) data (Mapping-XCO2), generated from a spatio-temporal geostatistical method using GOSAT and OCO-2 observations from April 2009 to December 2020, to investigate the responses of XCO2 to anthropogenic emissions at both global and regional scales. Our results show that the long-term trend of global XCO2 growth rate from Mapping-XCO2, which is consistent with that from ground observations, shows interannual variations caused by the El Niño Southern Oscillation (ENSO). The spatial distributions of XCO2 anomalies, derived from removing background from the Mapping-XCO2 data, reveal XCO2 enhancements of about 1.5–3.5 ppm due to anthropogenic emissions and seasonal biomass burning in the wintertime. Furthermore, a clustering analysis applied to seasonal XCO2 clearly reveals the spatial patterns of atmospheric transport and terrestrial biosphere CO2 fluxes, which help better understand and analyze regional XCO2 changes that are associated with atmospheric transport. To quantify regional anomalies of CO2 emissions, we selected three representative urban agglomerations as our study areas, including the Beijing-Tian-Hebei region (BTH), the Yangtze River Delta urban agglomerations (YRD), and the high-density urban areas in the eastern USA (EUSA). The results show that the XCO2 anomalies in winter well capture the several-ppm enhancement due to anthropogenic CO2 emissions. For BTH, YRD, and EUSA, regional positive anomalies of 2.47 ± 0.37 ppm, 2.20 ± 0.36 ppm, and 1.38 ± 0.33 ppm, respectively, can be detected during winter months from 2009 to 2020. These anomalies are slightly higher than model simulations from CarbonTracker-CO2. In addition, we compared the variations in regional XCO2 anomalies and NO2 columns during the lockdown of the COVID-19 pandemic from January to March 2020. Interestingly, the results demonstrate that the variations of XCO2 anomalies have a positive correlation with the decline of NO2 columns during this period. These correlations, moreover, are associated with the features of emitting sources. These results suggest that we can use simultaneously observed NO2, because of its high detectivity and co-emission with CO2, to assist the analysis and verification of CO2 emissions in future studies.
Keywords: Mapping XCO2; anthropogenic emission; GOSAT; OCO-2; NO2 columns Mapping XCO2; anthropogenic emission; GOSAT; OCO-2; NO2 columns
Graphical Abstract