Article

Quality Evaluation of Digital Twins Generated Based on UAV Photogrammetry and TLS: Bridge Case Study

1
Centre for Infrastructure Engineering, Western Sydney University, Penrith, NSW 2751, Australia
2
Department of Information Engineering and Computer Science, University of Trento, 38123 Trento, Italy
*
Author to whom correspondence should be addressed.
Remote Sens. 2021, 13(17), 3499; https://doi.org/10.3390/rs13173499
Submission received: 13 July 2021 / Revised: 19 August 2021 / Accepted: 30 August 2021 / Published: 3 September 2021
(This article belongs to the Special Issue Bridge Monitoring Using Remote Sensors)

Abstract

:
In the current modern era of information and technology, emerging remote advancements have been widely established for detailed virtual inspections and assessments of infrastructure assets, especially bridges. These technologies are capable of creating an accurate digital representation of the existing assets, commonly known as the digital twins. Digital twins are suitable alternatives to in-person and on-site based assessments that can provide safer, cheaper, more reliable, and less distributive bridge inspections. In the case of bridge monitoring, Unmanned Aerial Vehicle (UAV) photogrammetry and Terrestrial Laser Scanning (TLS) are among the most common advanced technologies that hold the potential to provide qualitative digital models; however, the research is still lacking a reliable methodology to evaluate the generated point clouds in terms of quality and geometric accuracy for a bridge size case study. Therefore, this paper aims to provide a comprehensive methodology along with a thorough bridge case study to evaluate two digital point clouds developed from an existing Australian heritage bridge via both UAV-based photogrammetry and TLS. In this regard, a range of proposed approaches were employed to compare point clouds in terms of points’ distribution, level of outlier noise, data completeness, surface deviation, and geometric accuracy. The comparative results of this case study not only proved the capability and applicability of the proposed methodology and approaches in evaluating these two voluminous point clouds, but they also exhibited a higher level of point density and more acceptable agreements with as-is measurements in TLS-based point clouds subjected to the implementation of a precise data capture and a 3D reconstruction model.

Graphical Abstract

1. Introduction

Bridge infrastructures are among the most expensive and vital components of the road/transport networks that need to be durable and healthy during their lifetime. Over the years, as the bridge is used and exposed to environmental effects, the health of the structure can deteriorate due to various conditions such as over loadings, material aging, and the corrosion of the environment. Therefore, if the process of deterioration is not greatly monitored or regularly maintained, this situation can disrupt the normal operation and service of the infrastructure. However, in some critical situations, any negligence in choosing a reliable and accurate monitoring and maintenance system may result in irrepealable structural damages, catastrophes, and future costs [1]. The collapse of Taiwans’ Nanfang’ao bridge in 2019 [2], and the Morandi bridge collapse in 2018 in Italy [3] are some of the recent instances of catastrophe due to a lack of accurate monitoring and maintenance systems. Therefore, records of any structural deficiency and changes in the construction phases to the original as-designed plans and maintenance actions are valuable pieces of information that need to be accurately retained for future reference. However, amassing this amount of information regularly is a time-consuming and expensive task, especially if the bridge is long with high altitude elements and data collection is performed by a limited number of on-site inspectors manually. According to the National Bridge Inspection Standards (NBIS) introduced in 1971 [4], the development of bridge defects, measurements of changes in the geometry, and the overall health condition of the bridge infrastructure need to be monitored through visual/manual inspections in the frequency of a two year cycle. This process involves elements of subjectivity and is considerably influenced by the inspectors’ experience. Given the time and money involved in obtaining the manual on-site bridge inspections, the need to develop modern, efficient, and reliable methods of inspection is established [5,6,7,8].
Over time, advanced technologies such as photogrammetry and laser scanning have widely developed a reputation as methods/tools that are capable of extracting rapid and precise three-dimensional (3D) digital representations of the object, known as a digital twin, without direct contact [9,10,11]. During this time, researchers have mainly focused on adopting these advanced remote techniques to mitigate the consequences of costly and unsafe methods of manual and direct bridge inspections to satisfy the needs for a modern/computerized, remote, safer, more cost-effective, more accurate, and less distributive bridge inspections. Unmanned Aerial Vehicle (UAV)-based photogrammetry [9,10], and Terrestrial Laser Scanning (TLS) [11], are among the common methods used to overcome the challenges involved with manual bridge inspection. The outcome of using these state-of-the-art technologies is a detailed computer-based digital twin as a point cloud that can be virtually revisited any time for data collection, analysis, and measurements [12]. In the case of bridge engineering, the application of these remote technologies not only enables safer and more accurate and reliable works but also decreases the overall inspection time and costs.
Camera-based bridge inspection methods using permanent analog cameras mounted on the critical points of the bridge structure were among the primary solutions that significantly attracted bridge engineers due to the fact that travel to the bridge site for inspection is not needed [13]. This method was further developed by Jahanshahi et al. [14], who proposed an imagery-based system that enabled the use of camera-based images to make a reliable comparison between the current and former conditions of the bridge structure. Along with the successful application of the camera-based inspection method, and in order to make this method more practical and efficient, cameras were mounted on mobile vehicles such as Unmanned Aerial Vehicles (UAVs), commonly known as drones [15]. Nowadays, several research studies have emphasized the valuable benefit of using UAV-based photogrammetry as a reliable robot method for bridge inspection, documentation, and surface evaluation [16,17]. In UAV-based photogrammetry, high-resolution aerial images are taken remotely from different viewpoints of the proposed object, and then a 3D point cloud is generated based on further post-processing techniques using matched key points through Structure from Motion (SfM) or Multi View Stereropsis (MVS) algorithms [18]. In a critical review study, Remondino et al. [19] evaluated the performance of various image-based algorithms when dealing with large and complex data sets in regards to accuracy and data quality. The results of this study for an SfM-based lighthouse data set in a Ground Control Point (GCP) analysis indicated a 50 mm and 31 mm accuracy in terms of mean and standard deviation, respectively. In a bridge inspection case study, Seo et al. [20] investigated the capabilities of drones and their effectiveness in activities related to bridge inspection. Following this research, an efficient bridge inspection method was presented and tested for an inspection of a three-span timber bridge in the USA. The result showed the acceptable usage of drone-based photogrammetry as an efficient bridge inspection method capable of identifying a variety of surface damages such as corrosion, spalling, cracking, etc. However, drones are designed to be controlled by the Global Positioning System (GPS), and the failure or weakness of GPS signals in some places such as the bridge underneath is a concern that needs to be considered by the drone pilot. In another study, Abolhasannejad et al. [21] evaluated the application of UAV-based photogrammetry for bridge deformation measurements and proposed an image motion correction algorithm to tackle the camera motions during image data acquisition. In another effort, Pan et al. [22] presented a semi-automated algorithm for extracting a 3D digital model of a bridge via UAV-based photogrammetry and evaluated this method for an existing heritage bridge case study in China. In a similar strategy, Chen, et al. [13] proposed a bridge inspection procedure using UAV-based photogrammetry for 3D model reconstruction and the subsequent virtual inspection and damage detection.
The new technology of Terrestrial Laser Scanning (TLS) is another common approach for the rapid and precise collection of spatial information from an object’s surface [11]. However, unlike traditional surveying methods that only capture the specific individual points of the targeted object one after another, TLS constantly captures each detail of the entire scene with the accurate position for each point and stores the data points in a 3D coordinate system, namely the x, y, z, associated with attributions such as colour. Thousands of data points, each corresponding to different locations of the exposed object, can be amassed to create a digital representation of the object, often called a point cloud. Therein, (TLS) presents an alternative to manual onsite inspections in the realm of built structures as it is capable of capturing the accurate geometry of complex structures such as bridges within a short time frame [23]. In the case of bridge engineering, this advanced technology has the potential to be used in a variety of applications in terms of as-built/as-is digital model development, quality inspection, structural assessment, and management [11,24]. As an initiative, Fuchs et al. [25] were among the first researchers who suggested the application of the laser system as a 3D coordinate mapping instrument for the inspection and assessment of highway bridges in the USA. In this research study, the capabilities of the laser system were assessed based on several laboratories and in-field evaluations for measuring global rotations on a girder bridge and bridge deflections under static load. Following this research strategy, Tang et al. [26] reviewed the capabilities of TLS in the 3D model development of bridges and also in the detection of accurate measurements for geometric features of bridges such as vertical clearance, etc. [27]. In another effort, Mizoguchi, et al. [28] utilized the acquired TLS-based point cloud for a quantities evaluation of the deficiency of the components such as the level of scaling, spalling, and rate of section loss caused by corrosion, etc. Moreover, Minehane, et al. [29] utilized the TLS-based bridge point cloud for the structural assessment of a bridge in the UK. In another research study, Gyetvai et al. [30] introduced an algorithm for identifying actual cross-sections of a bridge in Ireland with wrought-iron components. The successful implementation of this algorithm in reconstructing member cross-sections and the overall geometric dimensions proved the valuable benefit of TLS in conducting geometric inspections and structural assessments. In a recent research study, Gawronek and Makuch [31] utilized TLS measurements to assess the vertical deformation of a truss bridge under a static load in Poland. The result of this practical research indicated a ±3 mm maximum deviation in the vertical deflection measurement analysis. Similar studies were also carried out using TLS concerning the as-built model development as a basis for a reliable structural assessment of a bridge [32,33,34,35,36].
Nowadays, the possibility of twinning an existing asset with an accurate digital counterpart using these state-of-the-art technologies with the aim of health monitoring and the management of civil infrastructure assets has become a strong demand among asset managers and structural engineers [11,15]. Providing such a detailed source of information as a digital model and the application of Artificial Intelligence (AI) enables automation in various aspects of 3D model reconstruction, geometric identification [35,37], quantitative management, and progress tracking [26,38], as well as damage quality inspection and structural assessment [30,31,32,39]. Moreover, this offers the possibility of using low-cost, remote, rapid, and precise computer visions compared to direct inspections and identifications.

Aims and Objectives

State-of-the-art technologies such as UAV-based photogrammetry and TLS have benefits related to the rapid, precise, and voluminous collection of remote data. However, the definition of generating a well-detailed as-built model for a bridge case study can be varied in terms of the quality, integrity, and the geometric accuracy of the point clouds. Although a limited number of research studies have investigated the level of geometric accuracy for different point clouds generated [40,41,42,43], the research is still lacking a reliable methodology for evaluating and comparing the quality of the bridge size point clouds. Therefore, this research study aims to provide a systematic methodology as a pathway for engineers to evaluate and compare the quality of such voluminous datasets subjected to the implementation of a detailed data capture, quality inspection, and precise 3D model reconstruction. To this end, a range of general and specific approaches are proposed to be used for quality, consistency, and the accurate evaluations of such bridge size point clouds (see Section 3). Following the research, the soundness of the proposed methodology is proved in form of a real bridge case study by evaluating and comparing two available point clouds generated based on both UAV-based photogrammetry and TLS for a heritage bridge named the McKanes Falls Bridge in New South Wales (NSW), Australia. The summarized objectives of this research study are listed below:
  • Developing a systematic methodology for quality evaluation and the comparison of bridge size point clouds.
  • Proposing ranges of general and specific evaluation approaches.
  • Proving the soundness of the proposed methodology and approaches by evaluating and comparing two point clouds for a bridge case study.

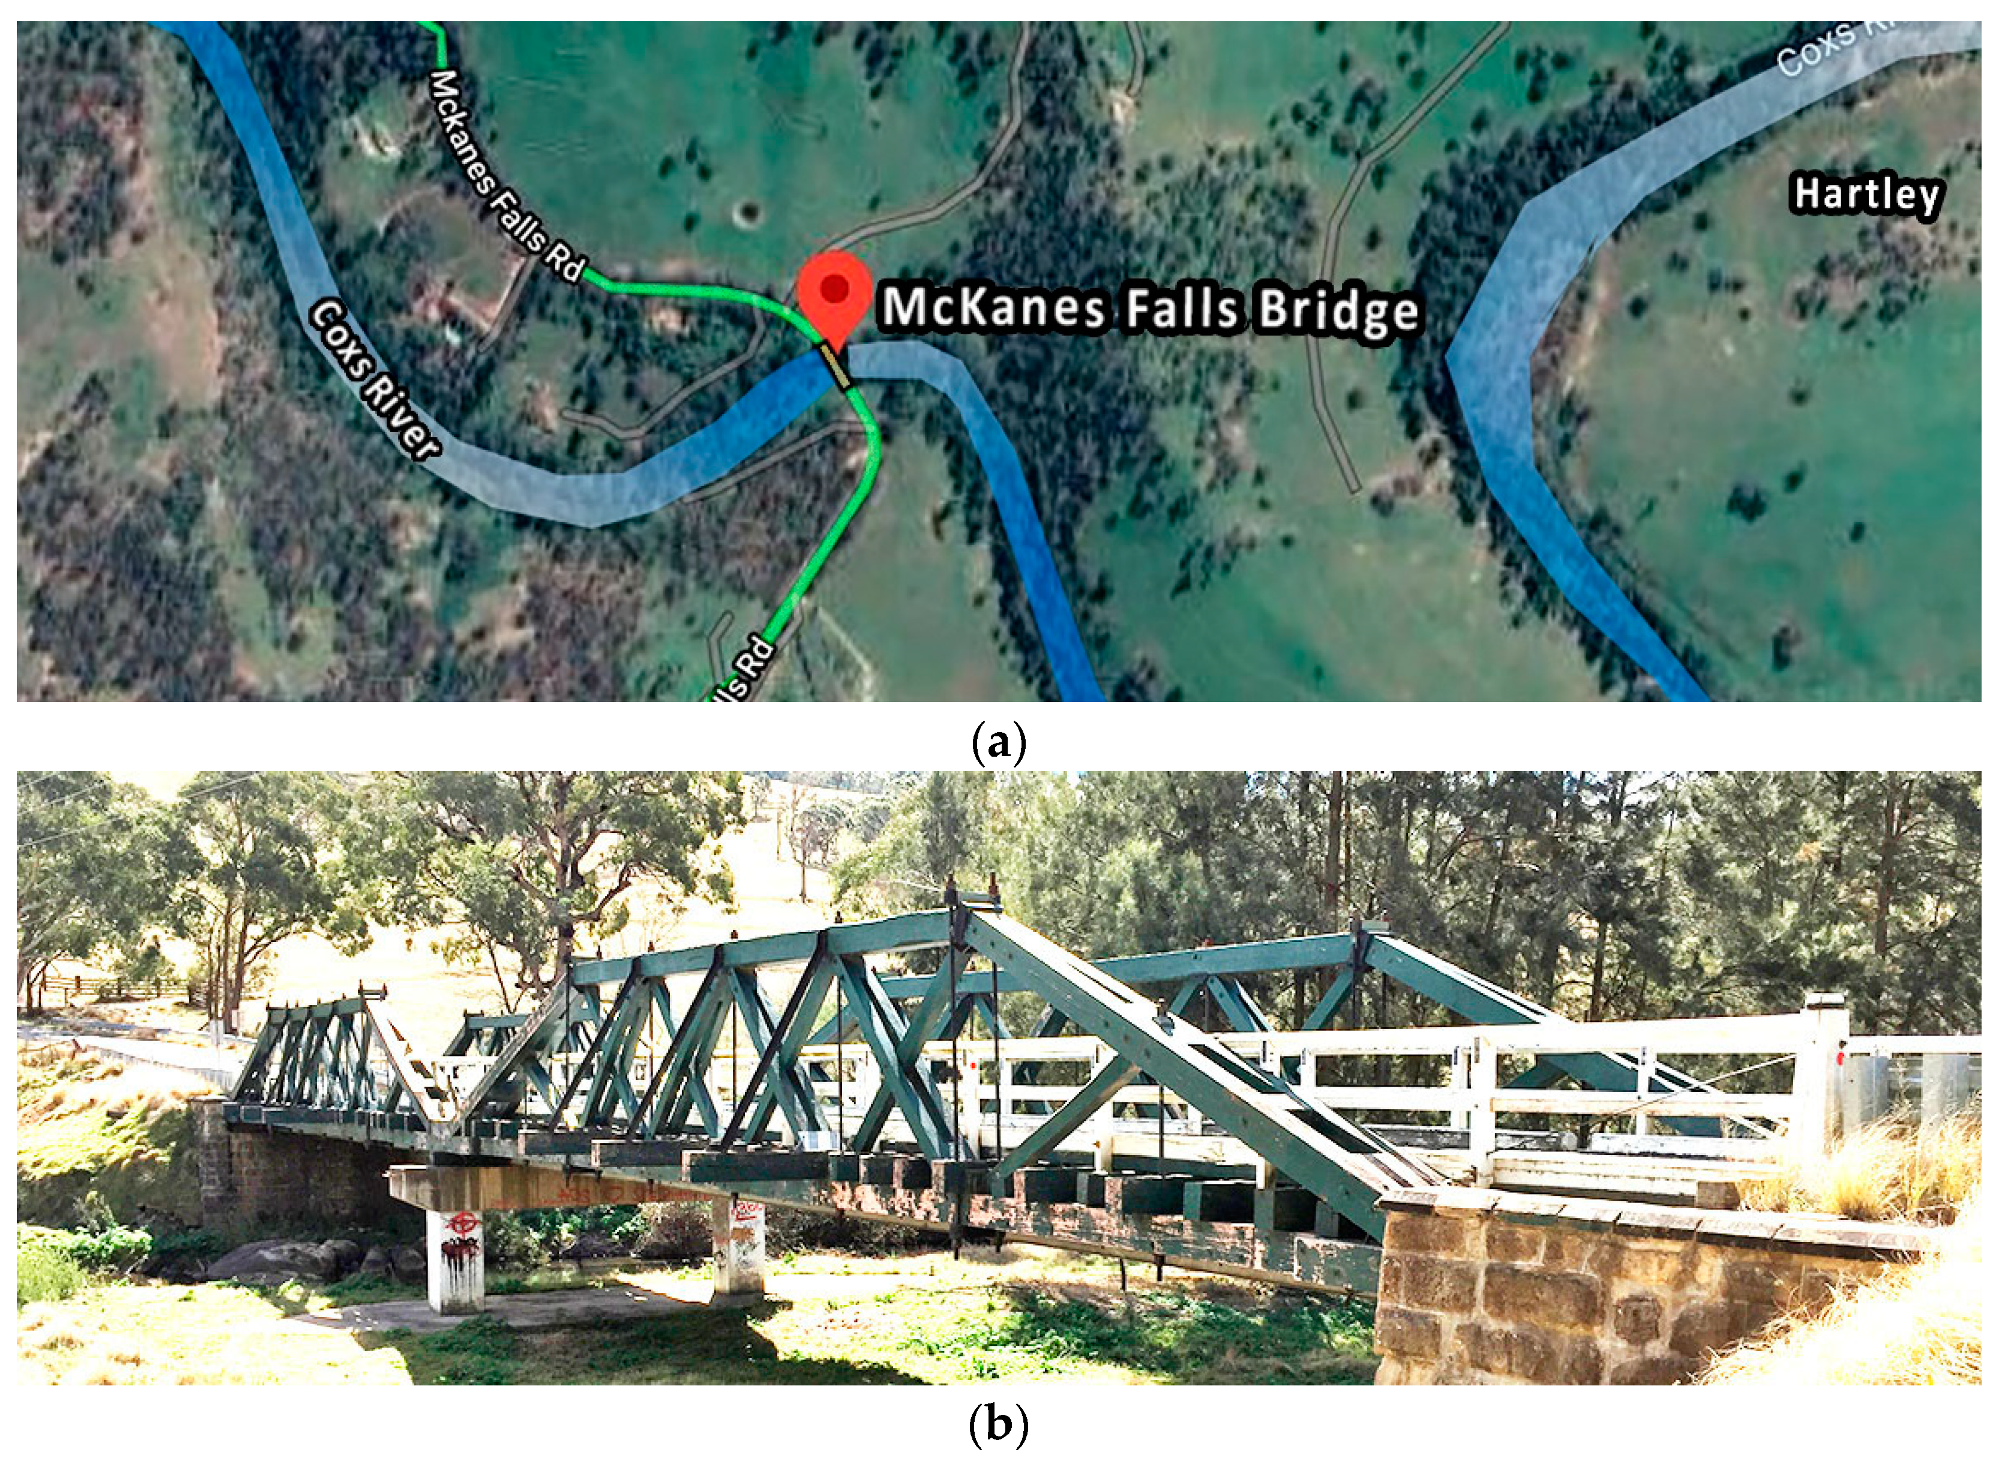
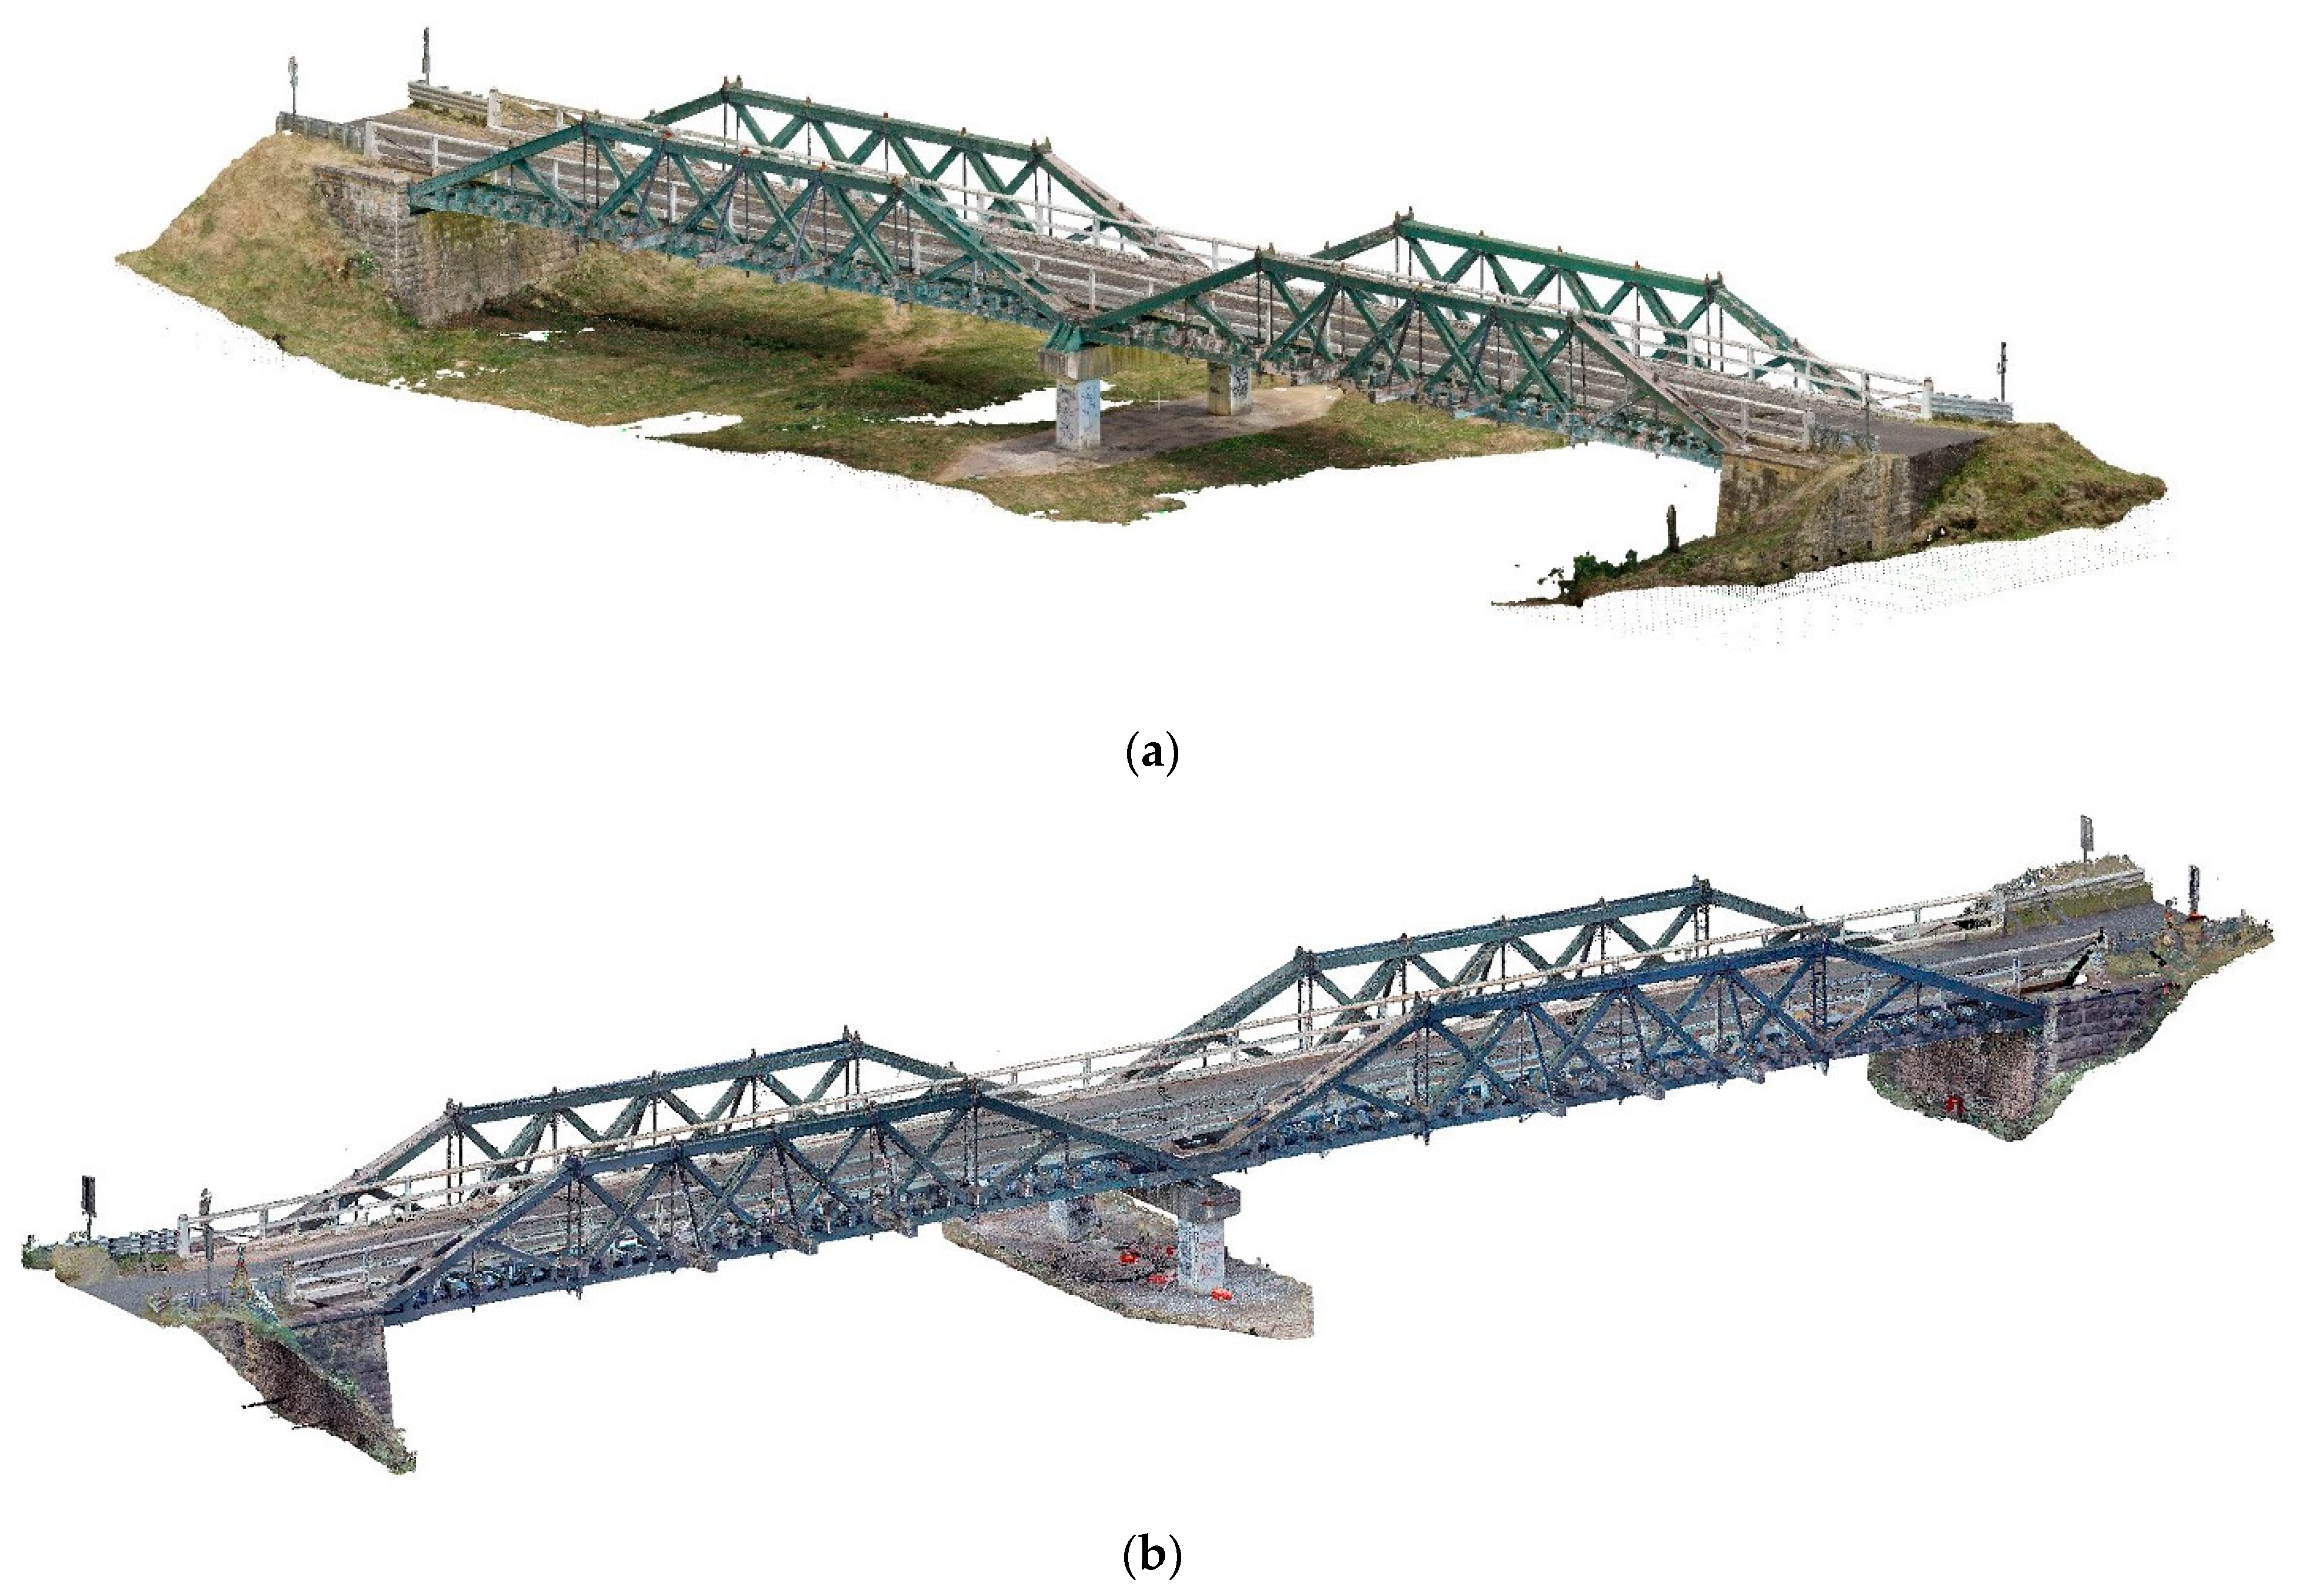
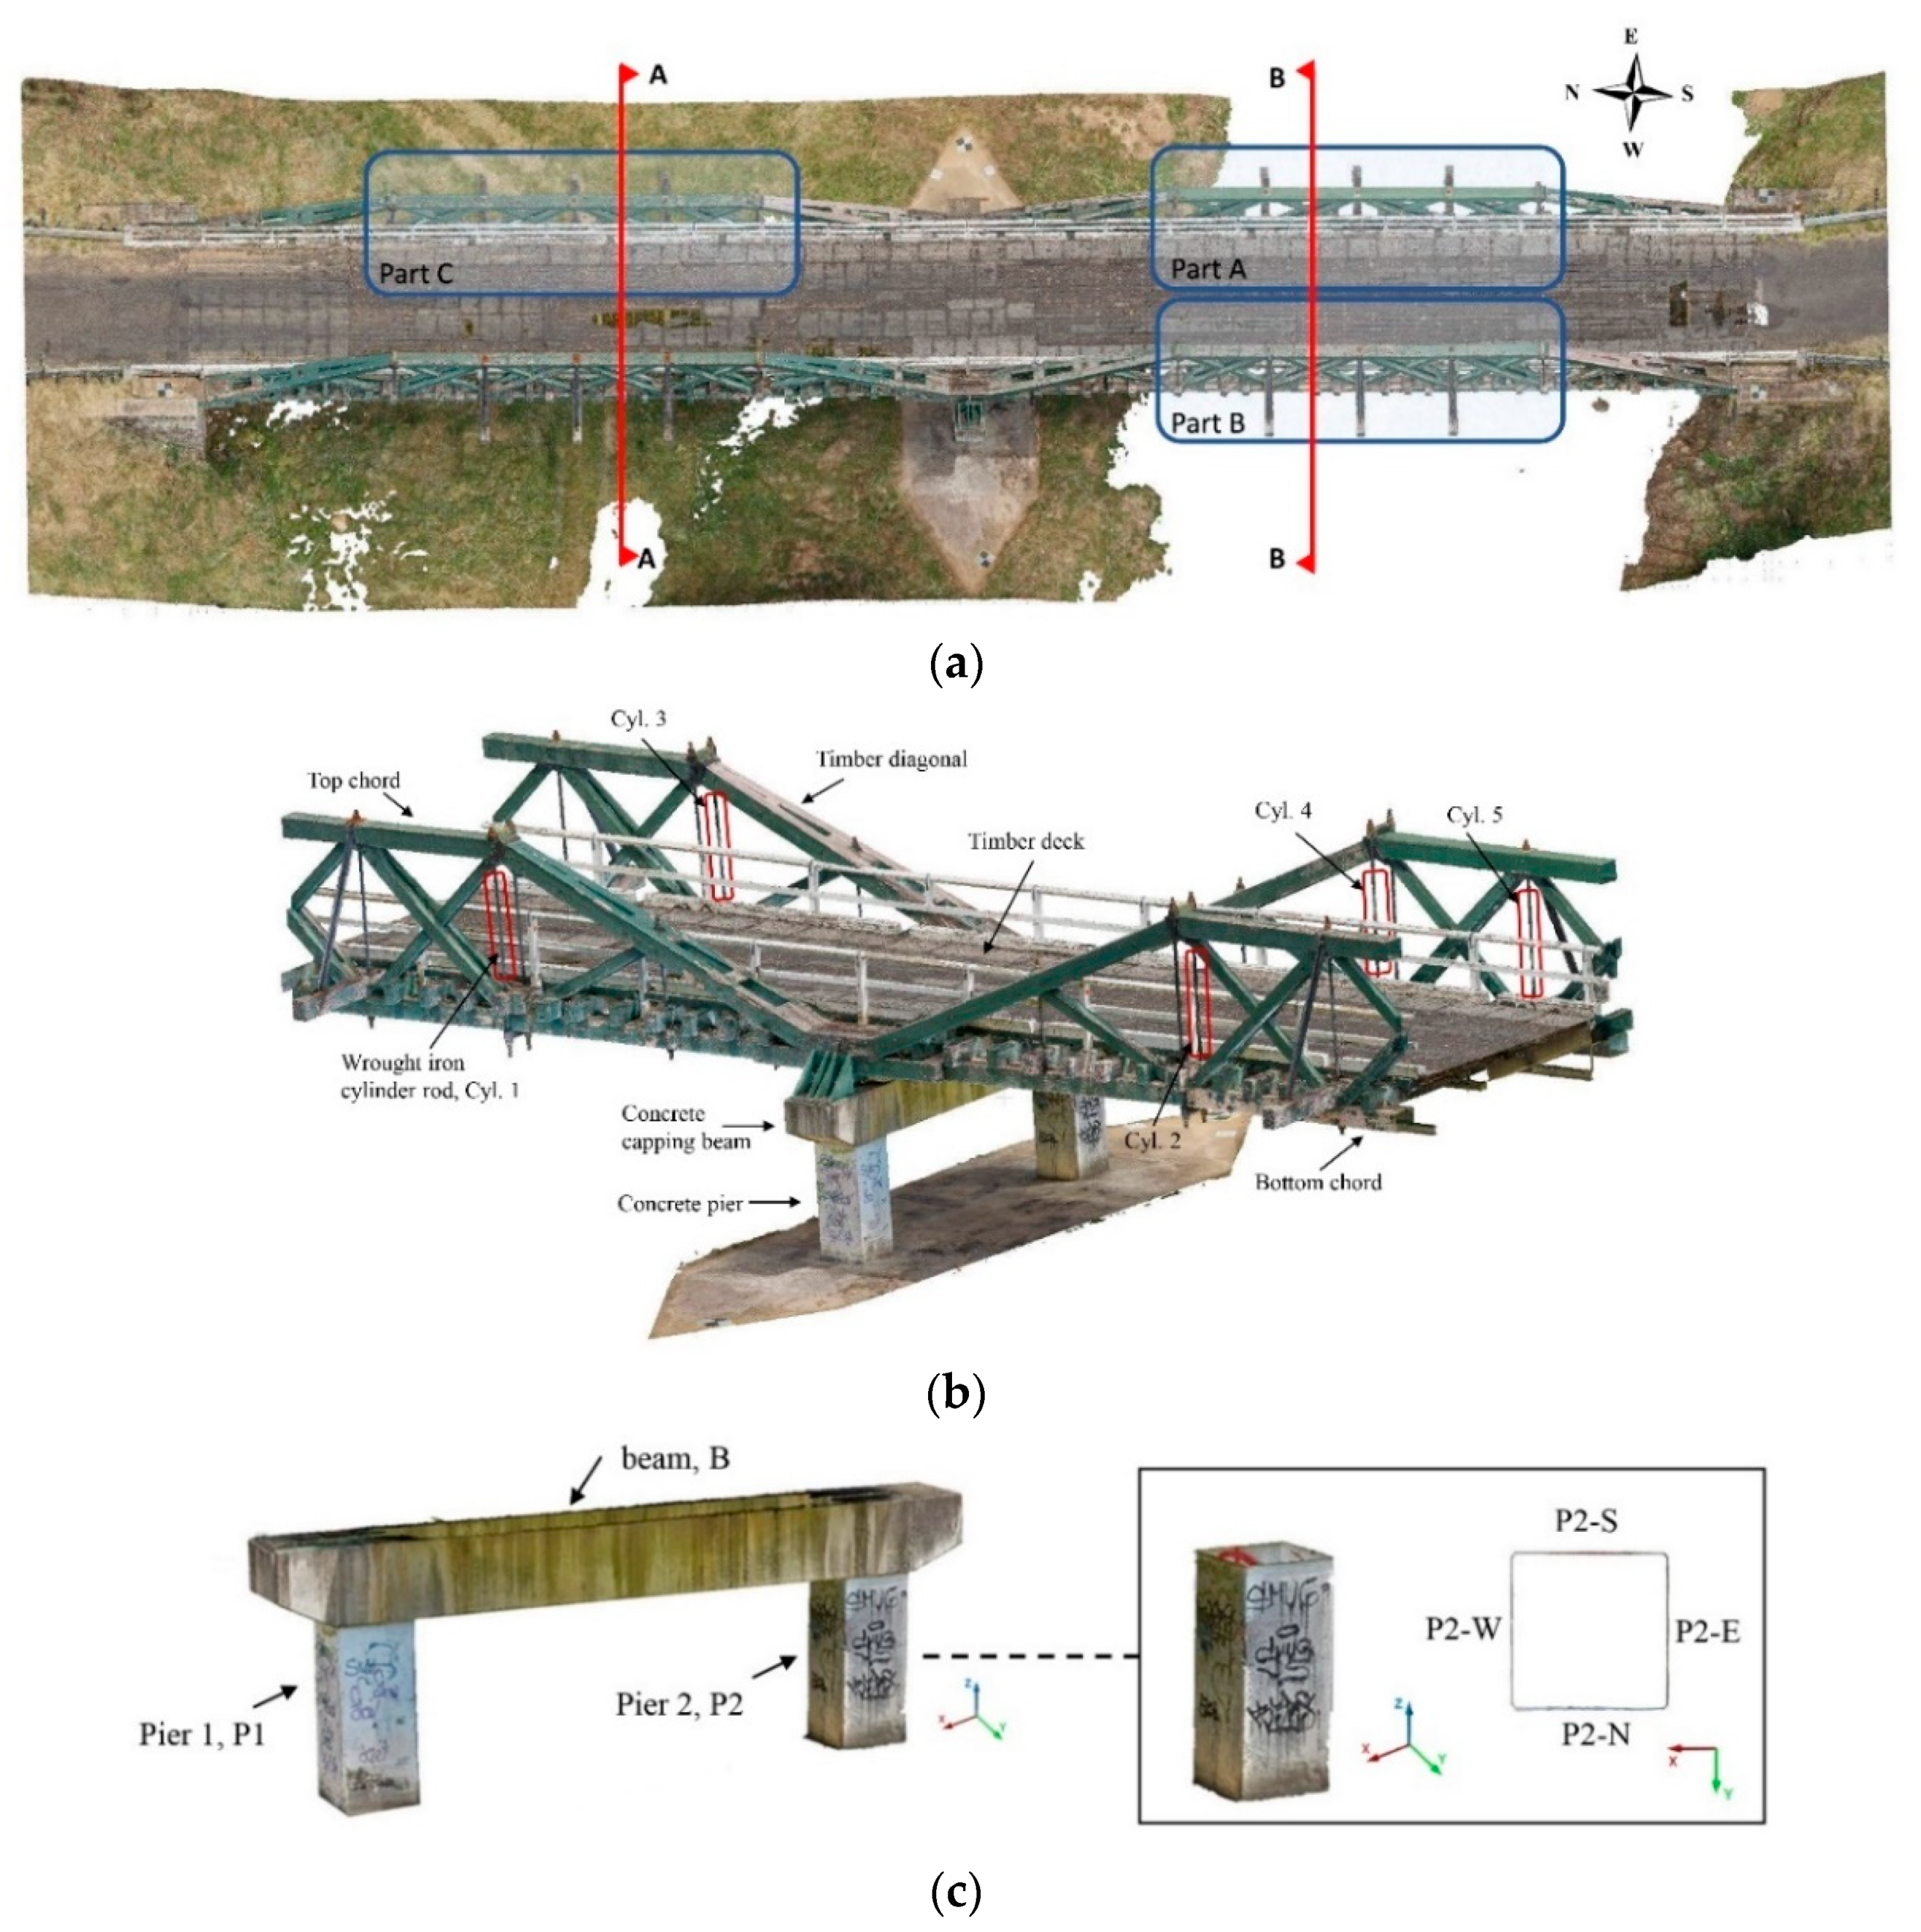
2. Bridge Case Study

In order to demonstrate the proposed evaluations and comparisons, two field studies using UAV and TLS were performed to collect the point clouds for a heritage-listed bridge named the McKanes Falls Bridge over the Coxs river, located in the city of Lithgow, New South Wales (NSW), Australia, Figure 1. This timber truss bridge is among the four remaining McDonald style bridges in NSW built in 1893 and was registered as a cultural heritage site in 2000. The bridge structure consists of two timber truss spans of 27 m in length supported by sandstone masonry abutments at each end and a concrete pier at the center. The central pier of the bridge was originally constructed by stone; however, it was replaced by a reinforced concrete pier following a severe flood in 1986 [44]. The bridge’s roadway is about 4.5 m in width and does not have a footway for pedestrians. The bridge deck is comprised of lateral timber beams supported by several longitudinal girders.
This research study is defined as part of an asset management project for upgrading the existing bridge with a stronger, safer, and more reliable structure while preserving a similar appearance and similar aspects as the original. This upgrading project includes restoring the critical timber components, strengthening the bridge structure using new steel and timber elements, reinforcing the existing foundation and abutments with concrete to increase the bridge’s load-bearing capacity and ductility [45,46,47,48], and allowing safe use by vehicles up to the General Mass Limit (GML) standard [49]. Therefore, after conducting preliminary investigations, risk assessments, and some site surveys by experienced engineers and the research group, possible flight plans for UAV and scan positioning for TLS were evaluated and prepared. These strategies were defined in such a way as to collect sufficient data with complete coverage of the whole bridge. In the following, a summary of the data capture using both UAV and TLS methods is presented.
Figure 1. McKanes Falls Bridge: (a) Bridge satellite view, (b) Bridge status in 2019 [49].
Remotesensing 13 03499 g001

2.1. UAV Photogrammetry Survey

The McKanes Falls Bridge was surveyed using a close-range photogrammetry technique by capturing high-resolution images from different sides of the bridge. The bridge survey was carried out by employing the Sony Alpha 7R digital 36 megapixels digital camera consisting of a 35 mm full-frame lens mounted on the Intel® Falcon 8+ UAV system. This UAV system, as it is state-of-the-art technology, is designed to be lightweight, quick, easy to operate, able to support a flight and camera stabilizer technology for challenging environments and harsh weathers such as a strong wind, and a V-frame body that offers a wide range of unobstructed views for data capture. Moreover, the control centre of this technology has the ability to be programmed based on the predesigned flight plan while automatically setting up the flight speed of the drones, the altitude, and the required images from various positions, and also the overlap of the images to provide the desired result within the shortest flight time.
The predesigned flight plan was defined for the control center of the UAV system to include two take-offs, capturing both sides of the bridge from south to north each in three paths with angles ranging from 0 to 45 degrees, and one take off observing the bridge overhead along the bridge length, all with offset distances of less than 20 m. Moreover, to obtain additional details and to well-document the blind spot of the bridge, several handheld images were also taken from different locations such as the bridge underneath.
Regarding the post-processing phase, the Structures from Motion (SfM) image processing technique coupled with a Dense Multi-View Stereo (DMVS) were employed to convert the captured images into a 3D point cloud using ContextCapture software [50]. During this process, the point cloud was generated based on the attached coordinates of each image obtained from the UAV Post Processed Kinematic (PPK) system and considering the high-resolution setting in a geo-referenced system. The final bridge point cloud containing more than 349 million colorized data points is shown in Figure 2a.

2.2. TLS Survey

In another field test, the McKanes Falls Bridge was surveyed/scanned utilizing the Leica ScanStation P40 terrestrial laser scanner. This laser unit offers a great versatility of features including long-range scanning (up to 270 m away from the unit), fast rating data acquisition (about 1 million points per second), various ranges of resolution/accuracy (up to 0.8 mm at 10 m), and a wide field of view 360° × 320° along with a low range of noise. This unit is equipped with an integrated positioning system that improves post-processing procedures and allows real-time on-site registrations [51].
Scans were performed from more than 50 scan stations including multiple positions around the bridge sides, the deck, and the bridge underneath in line with the predesigned scan plan, considering close positions with an offset less than 20 m away from the bridge. Normal resolution (6.3 mm @ 10 m), normal quality settings, and the capture of High Dynamic Range (HDR) images were considered as the data collection settings of the laser unit in each scan station.
TLS-based scan data generally contain an amount of redundant data and a range of noise points which can affect the 3D model reconstruction, measurements, and other related inspection purposes. In this regard, pre-processing filters were applied to the acquired data and then clean data sets were registered/matched and colorized in post-processing procedures using Leica Cyclone software [51]. The outcome as a bridge point cloud with more than 1590 million points was also geo-referenced according to the geographic coordinate system, as shown in Figure 2b.

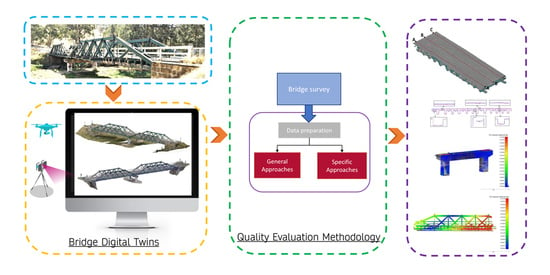
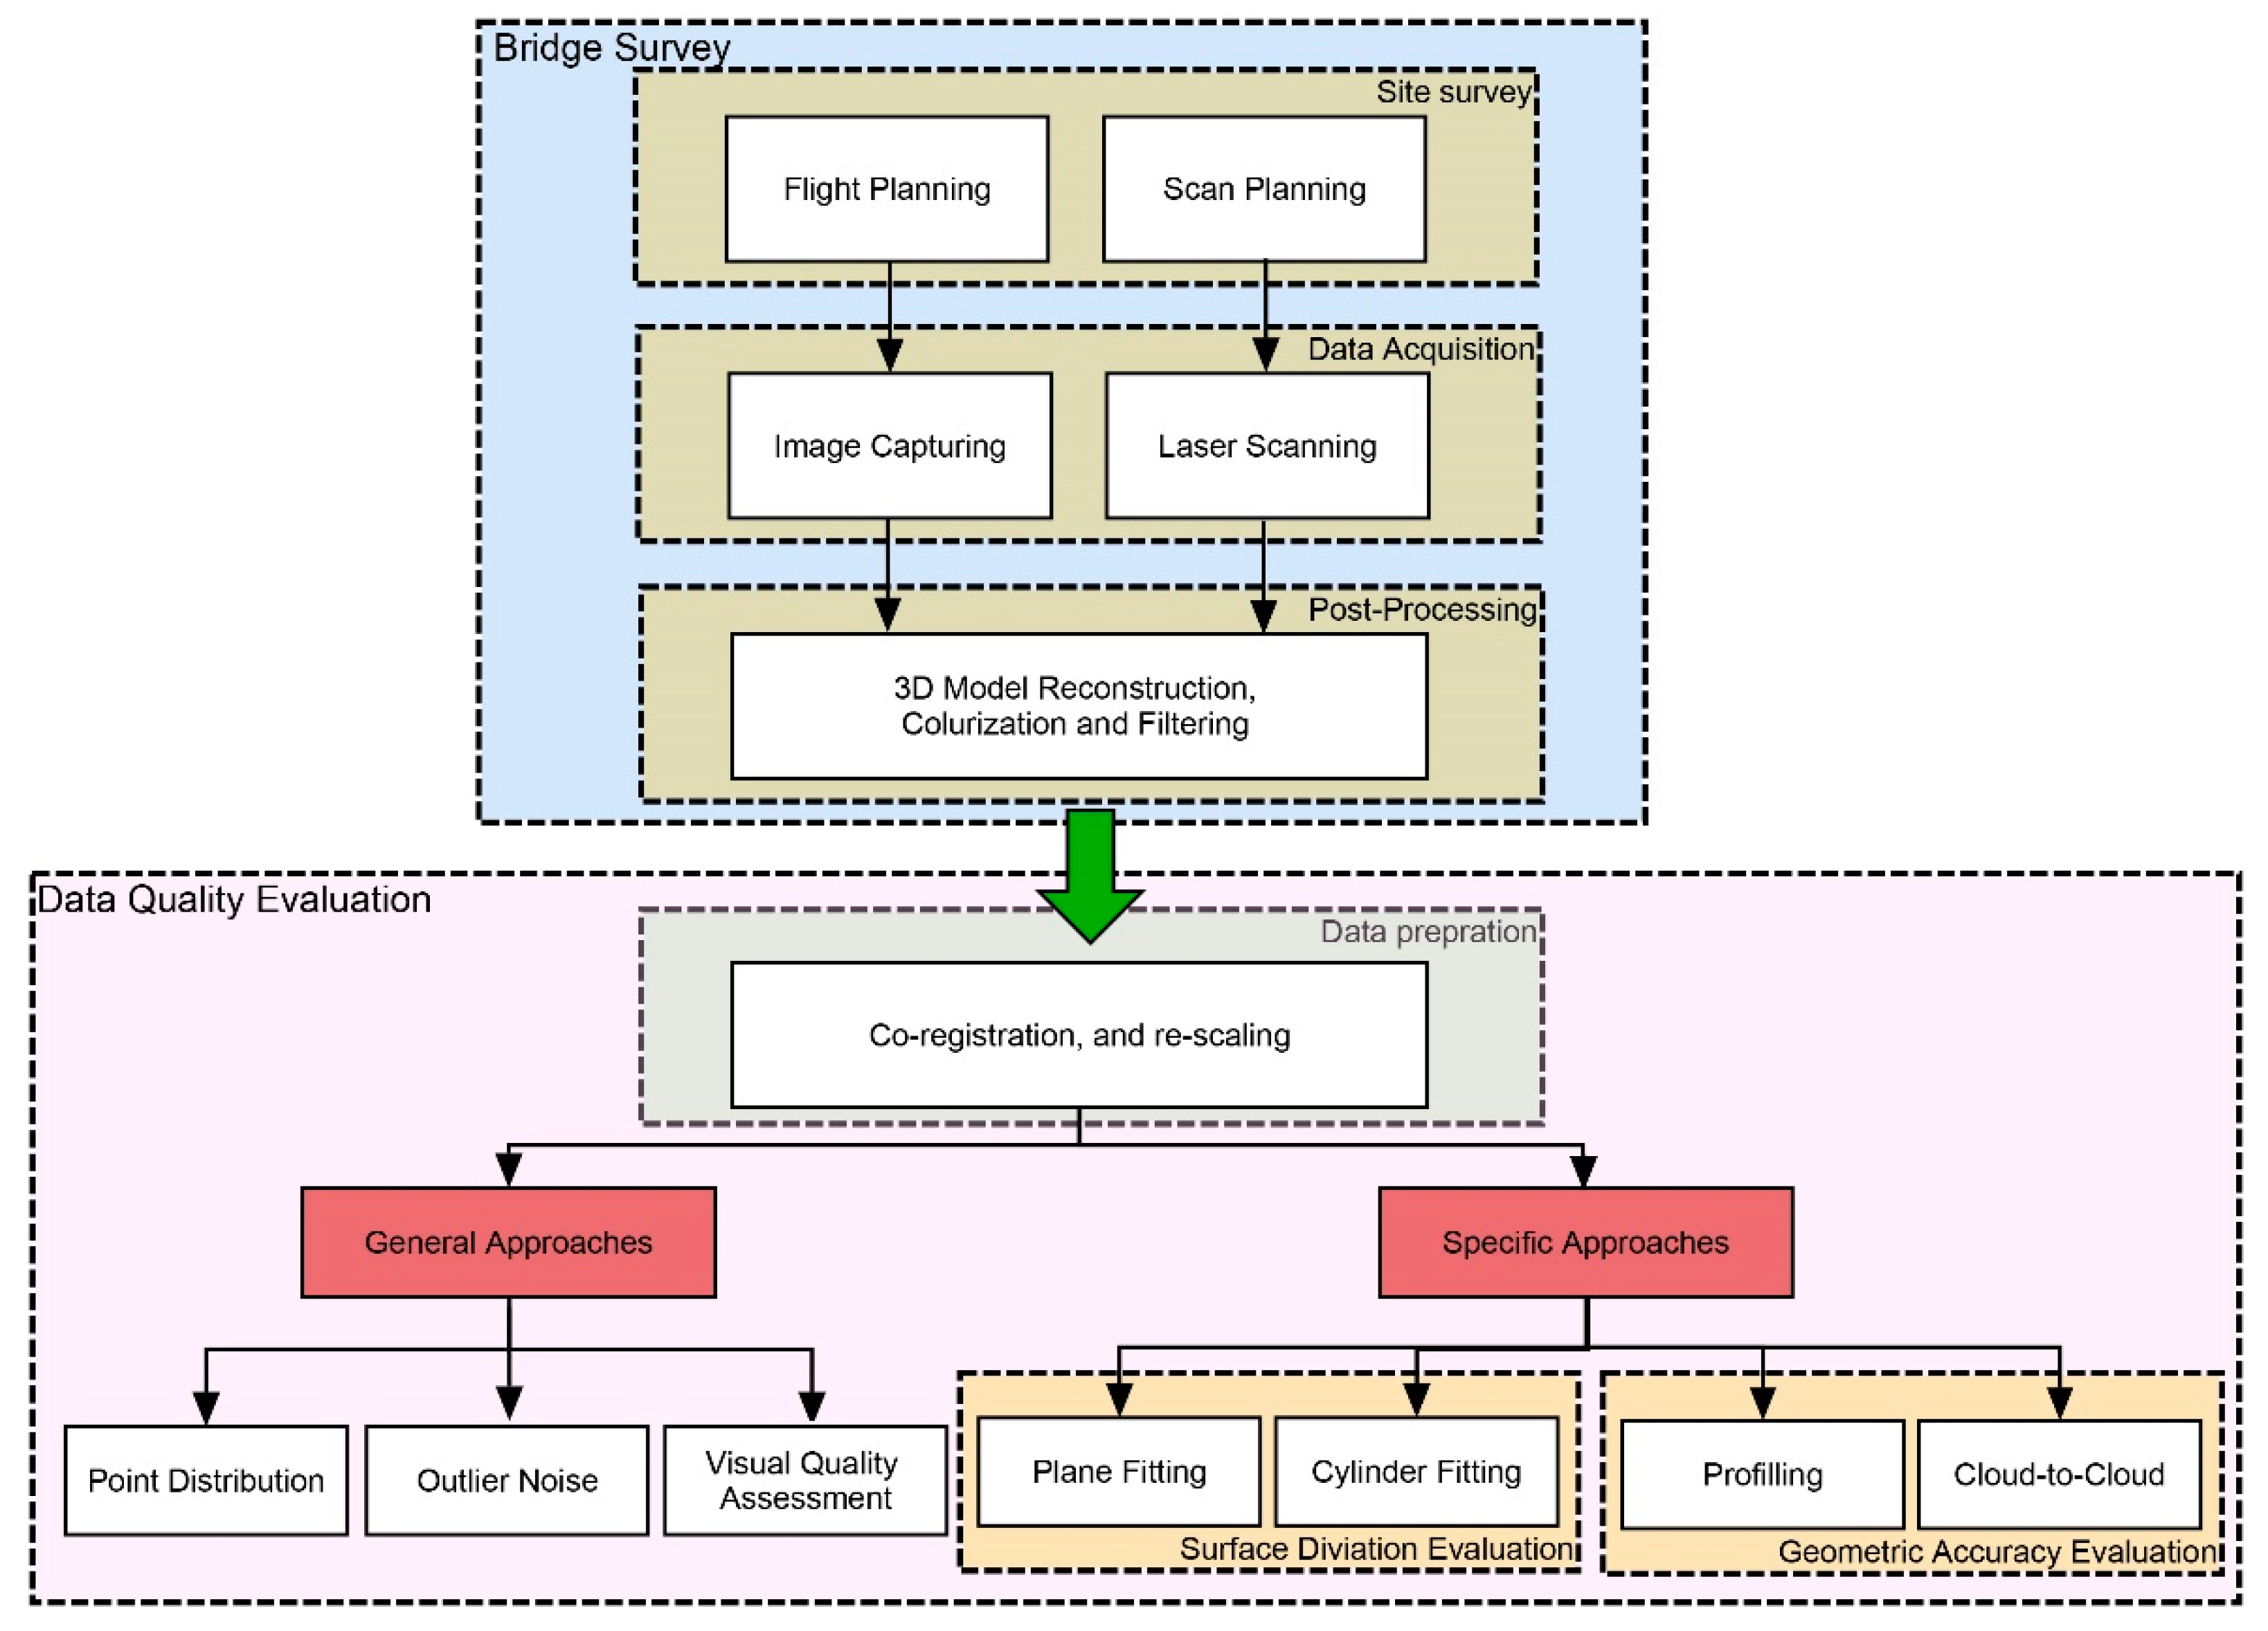
3. Quality Evaluation Methodology

According to the literature study presented, state-of-the-art emerging technologies such as UAV-based photogrammetry and laser scanning each have their advantages in the case of bridge monitoring and as-is model reconstruction; however, some considerations/concerns can negatively affect their implementation in generating a precise and qualitative as-is 3D model. The weakness or absence of the GPS signal, calibration degradation, inaccurate or insufficient surveying targets, and the failure of image matchings in case of UAV-based photogrammetry [10]; and diffusion or poor laser beam reflection, degradation of laser unit’s calibration, a lack of surveying targets, and the choice of unstable laser positions in the case of TLS are among the concerns that can be triggered to produce low-quality point clouds and some defects such as a noisy data set with a non-uniform points density and an inaccurate geometric position [11].
Despite the growing popularity and common application of these advanced technologies in terms of inspection and monitoring, there is still a lack of information related to the assessment of the quality and the evaluation of the occurrence of common defects for such a massive data set based on a specific standard or criteria. However, the VDI/VDE 2643 BLATT 3 guidelines [52] have been initiated to provide various approaches for the quality evaluation of measuring 3D objects in terms of accuracy and potential errors. Following this research, considering the approaches presented in the aforementioned guidelines and some general/well-known error metrics, a systematic methodology is presented. Moreover, as a real case bridge case study, the quality of the McKane Falls Bridge point clouds is evaluated and compared using the proposed approaches/methods. The methodology of this research is presented in Figure 3. This methodology would be useful for bridge surveyors to achieve a systematic and reliable methodology for data quality evaluation of the generated point clouds.
As illustrated in Figure 3, the framework is divided into two main subsections of bridge survey and data quality evaluation. The bridge survey involved three tasks including site survey, data acquisition, and post-processing to achieve a well-detailed 3D model. This subsection is not the main concern of this study; however, a summary of the McKane Falls bridge case study as a survey using both TLS and UAV methods is presented in Section 2. In this study, a series of approaches are presented in the data quality evaluation subsection to be considered for evaluating the possible defects of the generated 3D point clouds. Data preparation, as the first step of data quality evaluation, refers to the definition of both the point clouds compared in a similar coordinate system. In some circumstances, the generated point clouds are captured, registered, and aligned in different local coordinate systems and scales which may lead to an unacceptable/unfair comparison. Therefore, the generated point clouds need to be co-registered and re-scaled based on similar conditions. In this regard, one of the point clouds can be considered as the reference data set and the other point cloud becomes co-registered and re-scaled by transforming the data points to improve the alignment. Let us assume that Xp, Yp, and Zp are the 3D coordinates of a point, (1 ≤ pP, P is the number of points), that needs to be transformed. The transition of this point to Xj, Yj, and Zj (1 ≤ jP) can be calculated by Equation (1).
[ X j Y j Z j ] = R · S [ X p Y p Z p ] + [ T x T y T z ]
where R is the rotation matrix based on α, β, and γ as rotation angles along the X, Y, and Z axes, respectively, as given in Equation (2); S is the scale matrix as given in Equation (3); and Tx, Ty, and Tz are translations along the X, Y, and Z axes, respectively.
R = R x · R y · R z = [ c o s α s i n α 0 s i n α c o s α 0 0 0 1 ] · [ c o s β 0 s i n β 0 1 0 s i n β 0 c o s β ] · [ 1 0 0 0 c o s γ s i n γ 0 s i n γ c o s γ ]
S = [ S x 0 0 0 S y 0 0 0 S z ]
In order to minimize the differences between the point clouds, the Iterative Closest Point (ICP) algorithm needs to be applied to refine the alignments [53]. This algorithm is based on a search for pairs of the nearest corresponding points in two datasets. Once both point clouds become well-aligned in a similar coordinate system, other steps of data quality evaluation can be performed. Following these steps, some well-known error metrics including Standard Deviation (STD), STD Error, Root Mean Square Error (RMSE), and Mean Absolute Error (MAE) are used and are presented in Equations (4), (6) and (7), respectively.
S T D = 1 M 1 i = 1 M ( D i D ¯ ) 2
where M is the number of observed data points of the sample, D i is the distance value of each point to the corresponding reference point or surface, and D ¯ is the average value of the distance that can be calculated by Equation (5).
D ¯ = 1 M ( D 1 + D 2 + + D i )
S T D   E r r o r = S T D M
R M S E = 1 M i = 1 M ( D i ) 2
M A E = 1 M i = 1 M | D i |

3.1. General Approaches

An evaluation of points distribution and the outlier noise, and conducting visual quality assessments are among the most reliable general approaches for evaluating the consistency of the acquired data points and the surveying instrument/equipment.
Having insufficient points in a low volume density may cause some defects regarding future investigation and analysis related to the surface generation, as-is model reconstructions, and proper interpretations for a reliable inspection [54]. Therefore, evaluating the points distribution can be considered as a valuable approach based on the number of the collected points per unit area of the object surface.
Generated point clouds usually contain outlier noises that refer to deviant/abnormal data points which are different from the remaining data [55,56]. Although normal noises can be defined as redundant data with minor distance errors, outlier noises are defined as a broader concept that includes discordant data with considerable errors that may arise from false point measurements and reconstruction faults within the point cloud generation process. The edges of the objects are among the most susceptible areas prone to this error either in photogrammetry or laser scanning [55,57,58]. The outlier noise evaluation can give us valuable information concerning the methods and systems relied on. The outlier noise can be filtered by establishing a noise removal algorithm or a threshold to control the maximum distance errors. As suggested by Chen et al. [13], this threshold, α , can be defined based on Equation (9).
α = λ + 2 β
where λ is the mean distance error and β is the standard deviation.
Damage quantification and a visual quality assessment of the generated point clouds is another approach for a quality evaluation of the point clouds referring to the amount of agreement between the extracted damaged area from the data set and the existing damage in on-site inspections.

3.2. Specific Approaches

Surface deviation and geometric accuracy evaluations are among the specific approaches/concepts adopted from the VDI/VDE 2643 guidelines [52,59,60] for assessing the quality and precision of 3D measuring systems. In the following, these two approaches are described.

3.2.1. Surface Deviation Evaluation

In theory, the captured texture of an object with a smooth surface is expected to be presented in a layer of points without thickness; however, this is not the reality, and the surface is generally quantified by points with a deviation from its ideal form. In surface metrology, the amount of deviation demonstrates the level of noise obtained and can generally show the reliability of the surveying equipment and system in terms of generating a precise as-is/built 3D model [52]. Therefore, it is recommended that this evaluation be conducted based on some surface deviation evaluation methods/criteria, such as plane fitting, cylinder fittings, etc. The plane fitting evaluation refers to the measurement of the spatial distribution of the object’s points to their best-fitted plane. This process is performed based on defining a fitted plane using the Least Squares Fitting (LSF) algorithm [61,62]. Considering a plane equation in 3D Euclidean space, Equation (10), the LSF algorithm is a regression analysis that can find an approximate solution for the plane equation by minimizing the sum of the squares of the normal distance values, S, for each point to the corresponding reference point on the approximate plane, D i , as shown in Equations (11) and (12) [63].
a ( x i x 0 ) + b ( y i y 0 ) + c ( z i z 0 ) = 0
where, a, b, and c are defined as the normal vectors of the plane, and x 0 , y 0 , z 0 are the positions of the points in a 3D X-Y-Z coordinate system.
S u m = i = 1 m D i 2
where, D i , is defined as follows:
D i = | a ( x i x 0 ) + b ( y i y 0 ) + c ( z i z 0 ) | a 2 + b 2 + c 2
In a similar strategy, considering the surface equation and using the LSF algorithm, the best-fitted plane can be estimated.

3.2.2. Geometric Accuracy Evaluation

The methodology of using the extracted point clouds as a basis for a detailed quality inspection of infrastructures, especially bridges, has been widely established. However, the capability of employing these data for evaluating different levels of inspections has remained a key problem. Depending on the importance of the project, identifying various surface damages and deformations generally requires a high Level of Detail (LoD) inspection; however, a lower LoD is enough for geometry measurement purposes. Therein, with an eye on having a geometrically accurate evaluation for the generated point clouds, this study recommends three methods of point-to-point, profiling, and cloud-to-cloud comparison between the generated point clouds.
The point-to-point comparison refers to the measurement of the relative distances between a few recognizable feature pairs in different data sets. As presented by Koutsoudis et al. [64], this criterion with a comprehensive view can be used to evaluate the level of noise, the scaling error, and the level of geometric accuracy for the generated point clouds. However, this method can be extended by evaluating the relative distance between some fitted planes, known as a plane-to-plane comparison, for a more reliable geometry accuracy evaluation.
Evaluating and comparing the extracted cross-sectional profile of an object in the different data sets, known as profiling, can be considered as a valuable source of data for extending the geometric accuracy evaluations. The cross-sectional profile refers to the two-dimensional linear shape of a 3D object sliced perpendicularly. In the profiling method, the corresponding spatial distribution of the extracted cross-sectional profiles can be evaluated and compared overall or for different subsections of an object.
The Cloud-to-Cloud (C2C) comparison refers to the measurement of the nearest neighboring distance between the reference points in a point cloud and their corresponding points in another dataset, using the Hausdorff distance algorithm [65,66]. However, this algorithm is less sensitive to low dense point clouds and could yield unexpected results. A local modelling strategy is an improved form of this method that is generally faster and could yield more reliable results for clouds with a more constant density. The local modelling strategy can compute a local model around the nearest point so as to approximate a surface and obtain a better estimation of the real distance. This surface can be defined based on various algorithms such as LSF, triangulation, or the quadric function [67].

4. Results

In this section, in order to further investigate the application of the proposed methodology, the quality of the McKanes Falls Bridge point clouds captured/scanned via UAV-based photogrammetry and TLS are evaluated and compared. Concerning the first step of data preparation, both point clouds were evaluated to ascertain whether they were registered in an exact coordinate system with similar scales. To evaluate this concern, a detailed geometric accuracy analysis was performed, as presented in Section 4.2, and the results were used for the minor rescaling of the UAV-based point cloud based on the TLS data set. Moreover, considering the TLS data was set as the benchmark, the rescaled UAV-based data set was also co-registered to the TLS data set to make both the point clouds ready and to prepare for a reliable relative quality evaluation. Handling these point clouds containing such a massive amount of data was only possible by segregating the data sets into smaller objects/parts before feeding them into the computer system and software for further analysis. Therefore, two cross-sections passing through the bridge spans, shown in Figure 4, were used to segregate the middle part of the bridge with its components as the intended surveying objects. This part contains concrete piers, a capping concrete beam, parts of the bottom and top timber chords, the timber deck and diagonals, and wrought iron cylinder rods. As shown in Figure 4b, four sides of each concrete pier, two sides of the capping beam, parts of the iron cylinder rods, parts of the bridge deck, and the trusses were analyzed using the proposed methodology.

4.1. General Approaches

4.1.1. Points Distribution

Based on the aforementioned methodology, the distribution of the points generated via both the UAV photogrammetry and the TLS were evaluated and compared by calculating the density of the points per area on the selected object’s surfaces after applying the statistical outlier removal algorithm in CloudCompare software [56,68]. Table 1 presents the result of this evaluation considering the surfaces of the bridge piers and the beam, shown in Figure 4c, as the intended surveying objects.
According to Table 1, the average density of the point cloud generated via TLS was calculated as 39 points per square centimeter (P/cm2) while this amount was roughly half of the density calculated for similar surfaces generated based on UAV photogrammetry. In some instances, such as planes P1-S and P2-S, the results demonstrated more than a 50% difference in terms of the point cloud density which indicates a denser and more reliable point cloud using TLS with the aims of 3D model reconstruction and inspection.

4.1.2. Outlier Noise

Considering the filtering method presented in Section 3.1 and Equation (9), the TLS point cloud was aligned with the UAV data using the ICP algorithm [53], and the outlier noise level for TLS data point was calculated, shown in Table 2. This calculation was conducted for three different segregations of the bridge named parts A, B, and C including parts of the timber truss and bridge deck, shown in Figure 4a. Figure 5 presents the outlier noise points in a red color after this evaluation was conducted for parts A and C. The result of this evaluation shows an average outlier noise level of 2.36% for TLS data points based on the referenced UAV data set. Although this amount of noise level is quite normal for a bridge size point cloud captured by TLS, the evaluations indicated less outlier noise for the UAV data in the case of the McKanes Falls Bridge inspection.

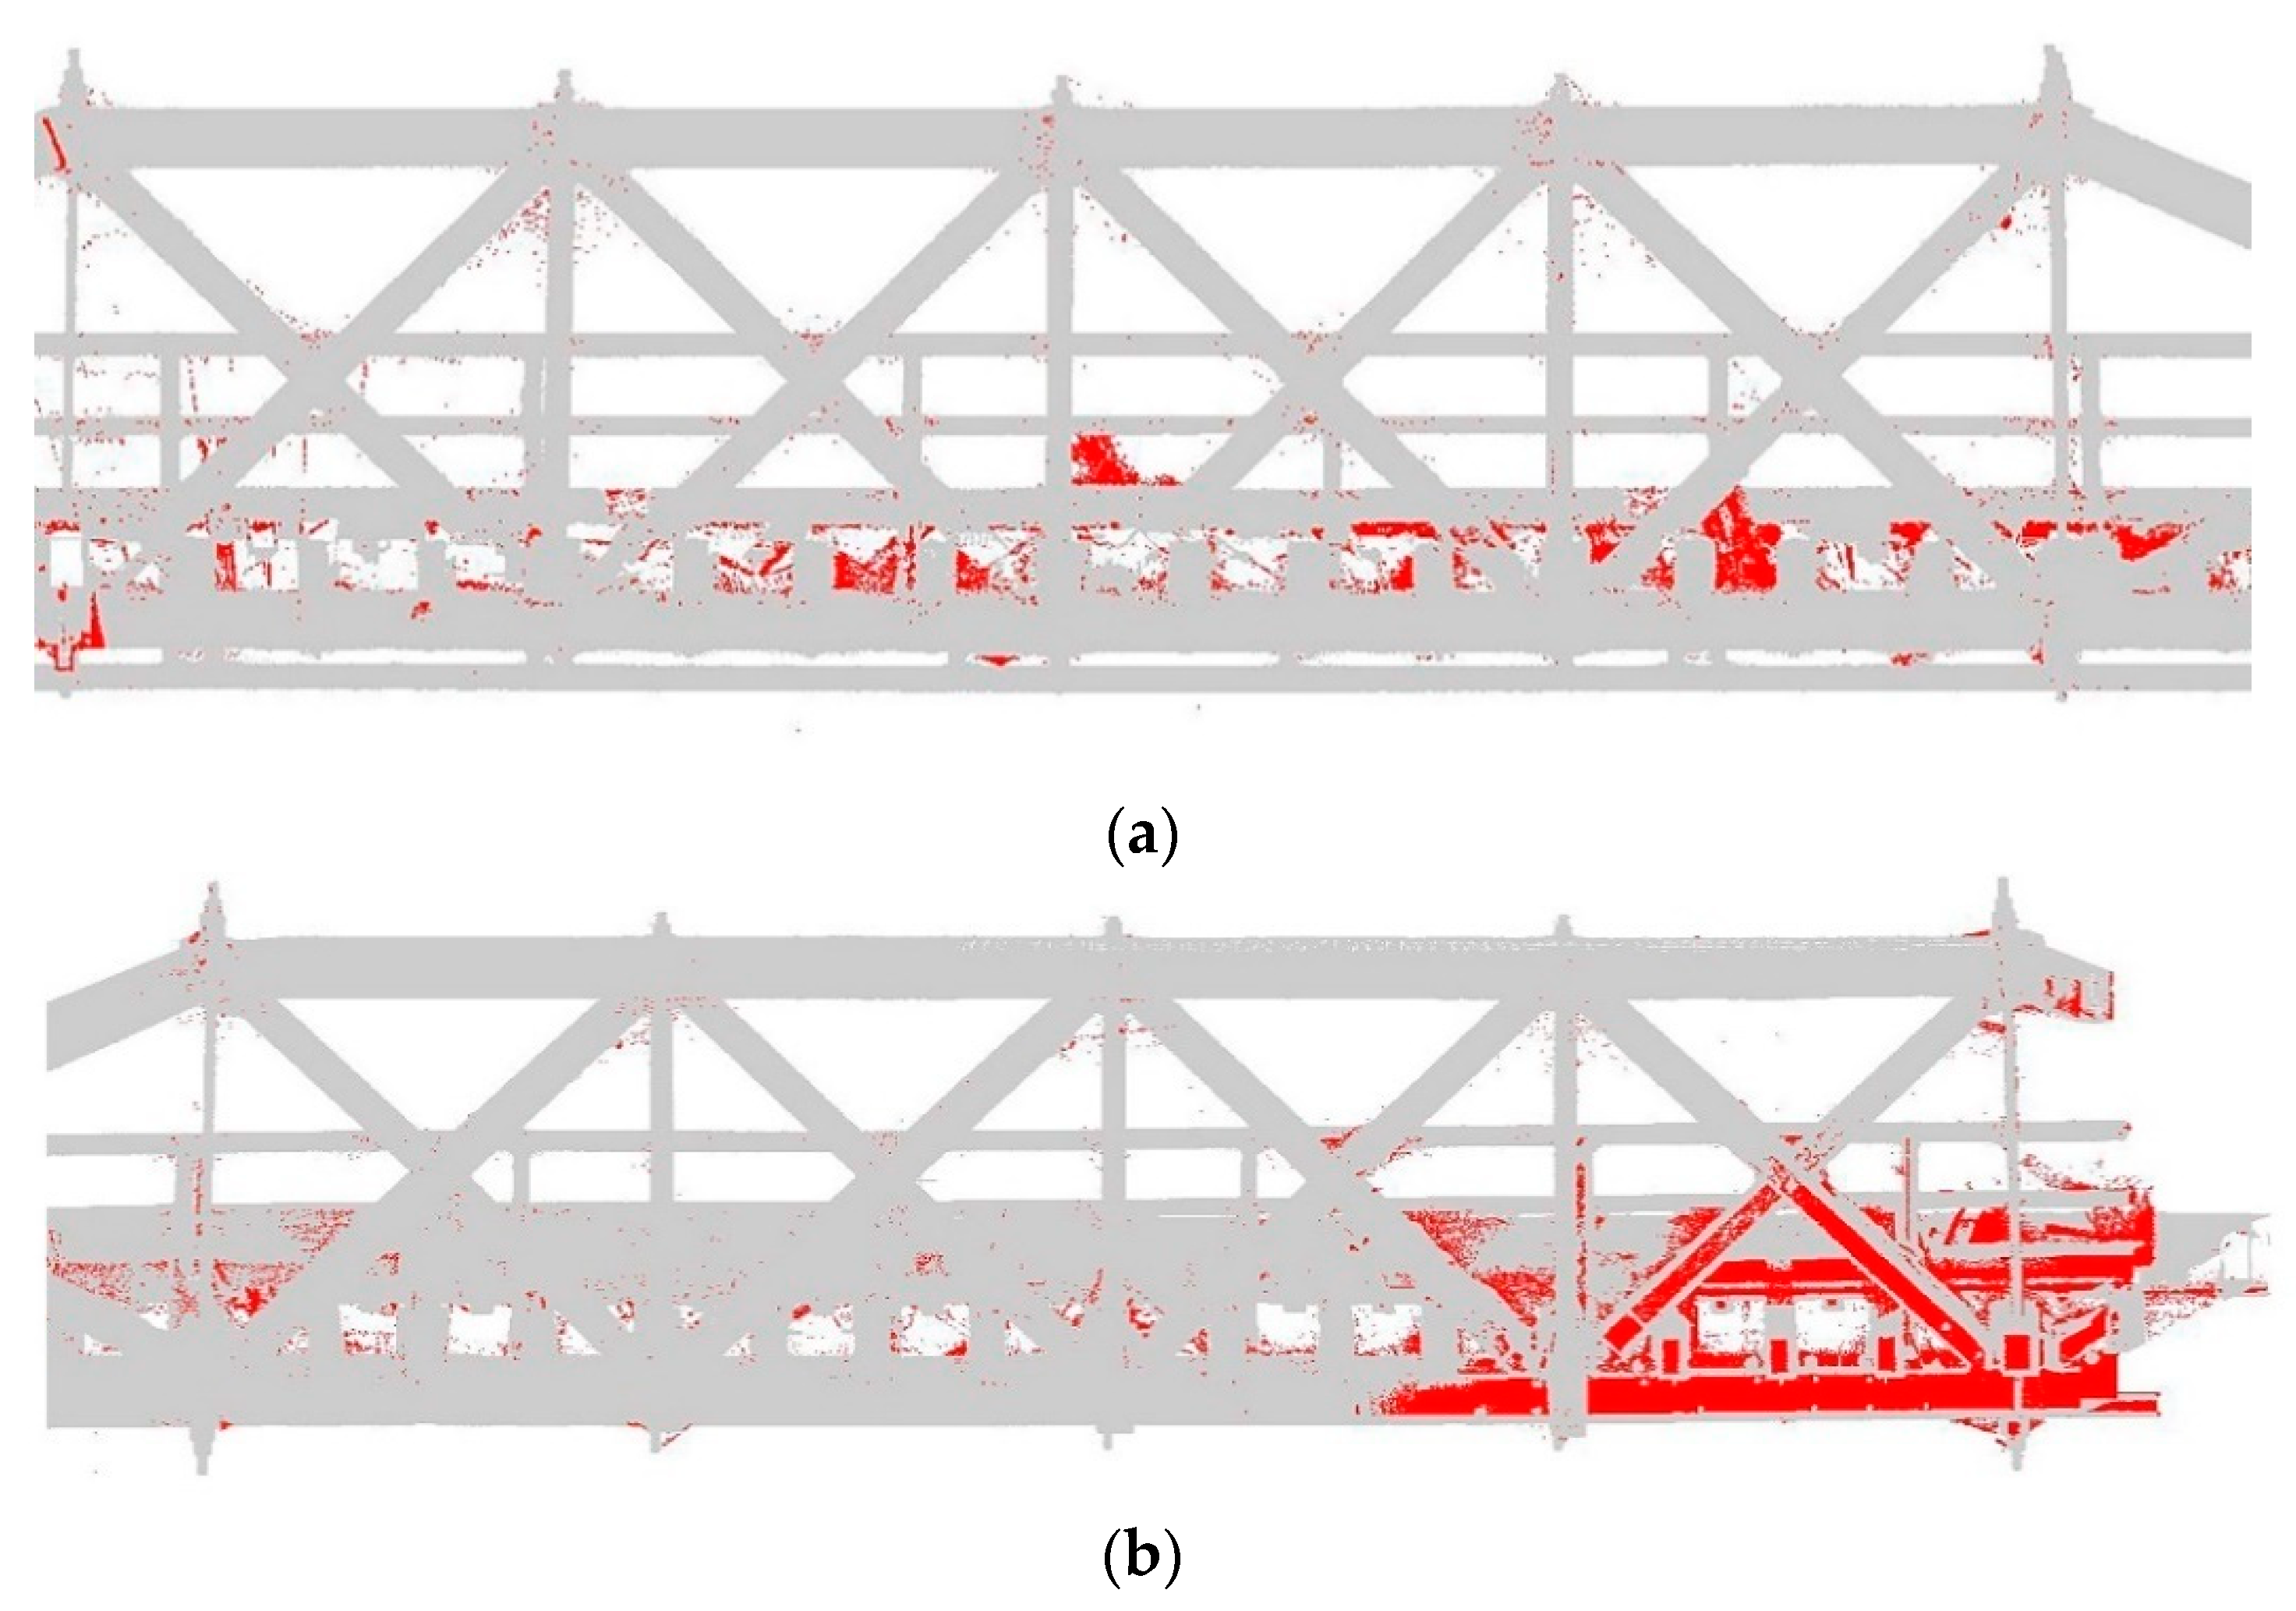
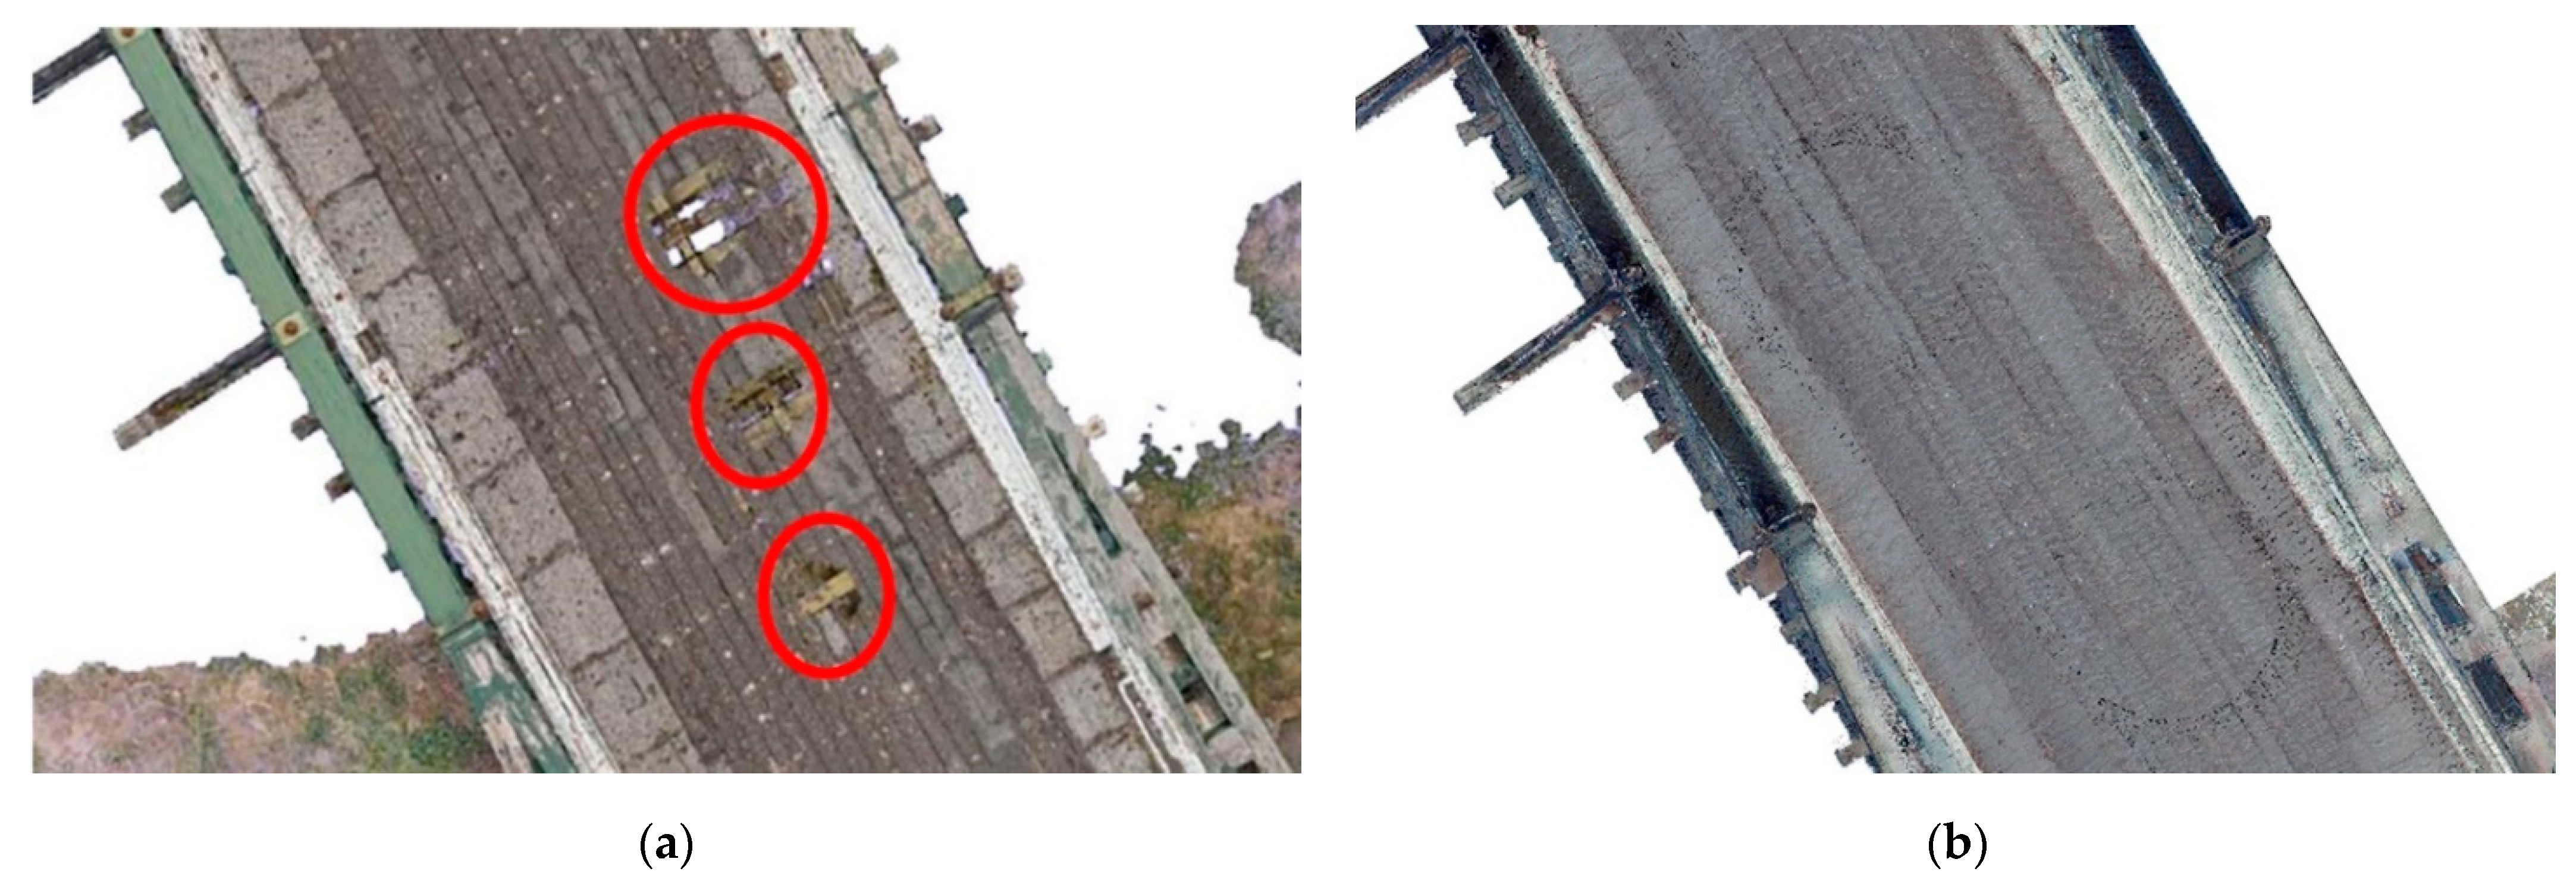
4.1.3. Visual Quality Assessment

During the initial check of the generated point clouds, some missing/incomplete data were observed on the UAV data set. In order to further evaluate this issue, the generated TLS point cloud was revisited on the computer by an expert engineer using CloudCompare software. As shown in Figure 6, it was observed that some locations/areas of the bridge deck were not well reconstructed in the UAV data set while these areas were completely reconstructed in the TLS point cloud. In UAV-based photogrammetry and the following reconstruction procedures, the missing/incomplete data issue was inevitably caused by a poor overlapping of the images or the extraction of an insufficient number of features during the registration/matching process [69]. However, in the case of laser scanning, the shadowing effect caused by beam obstruction could be the origin [70].

4.2. Specific Approaches

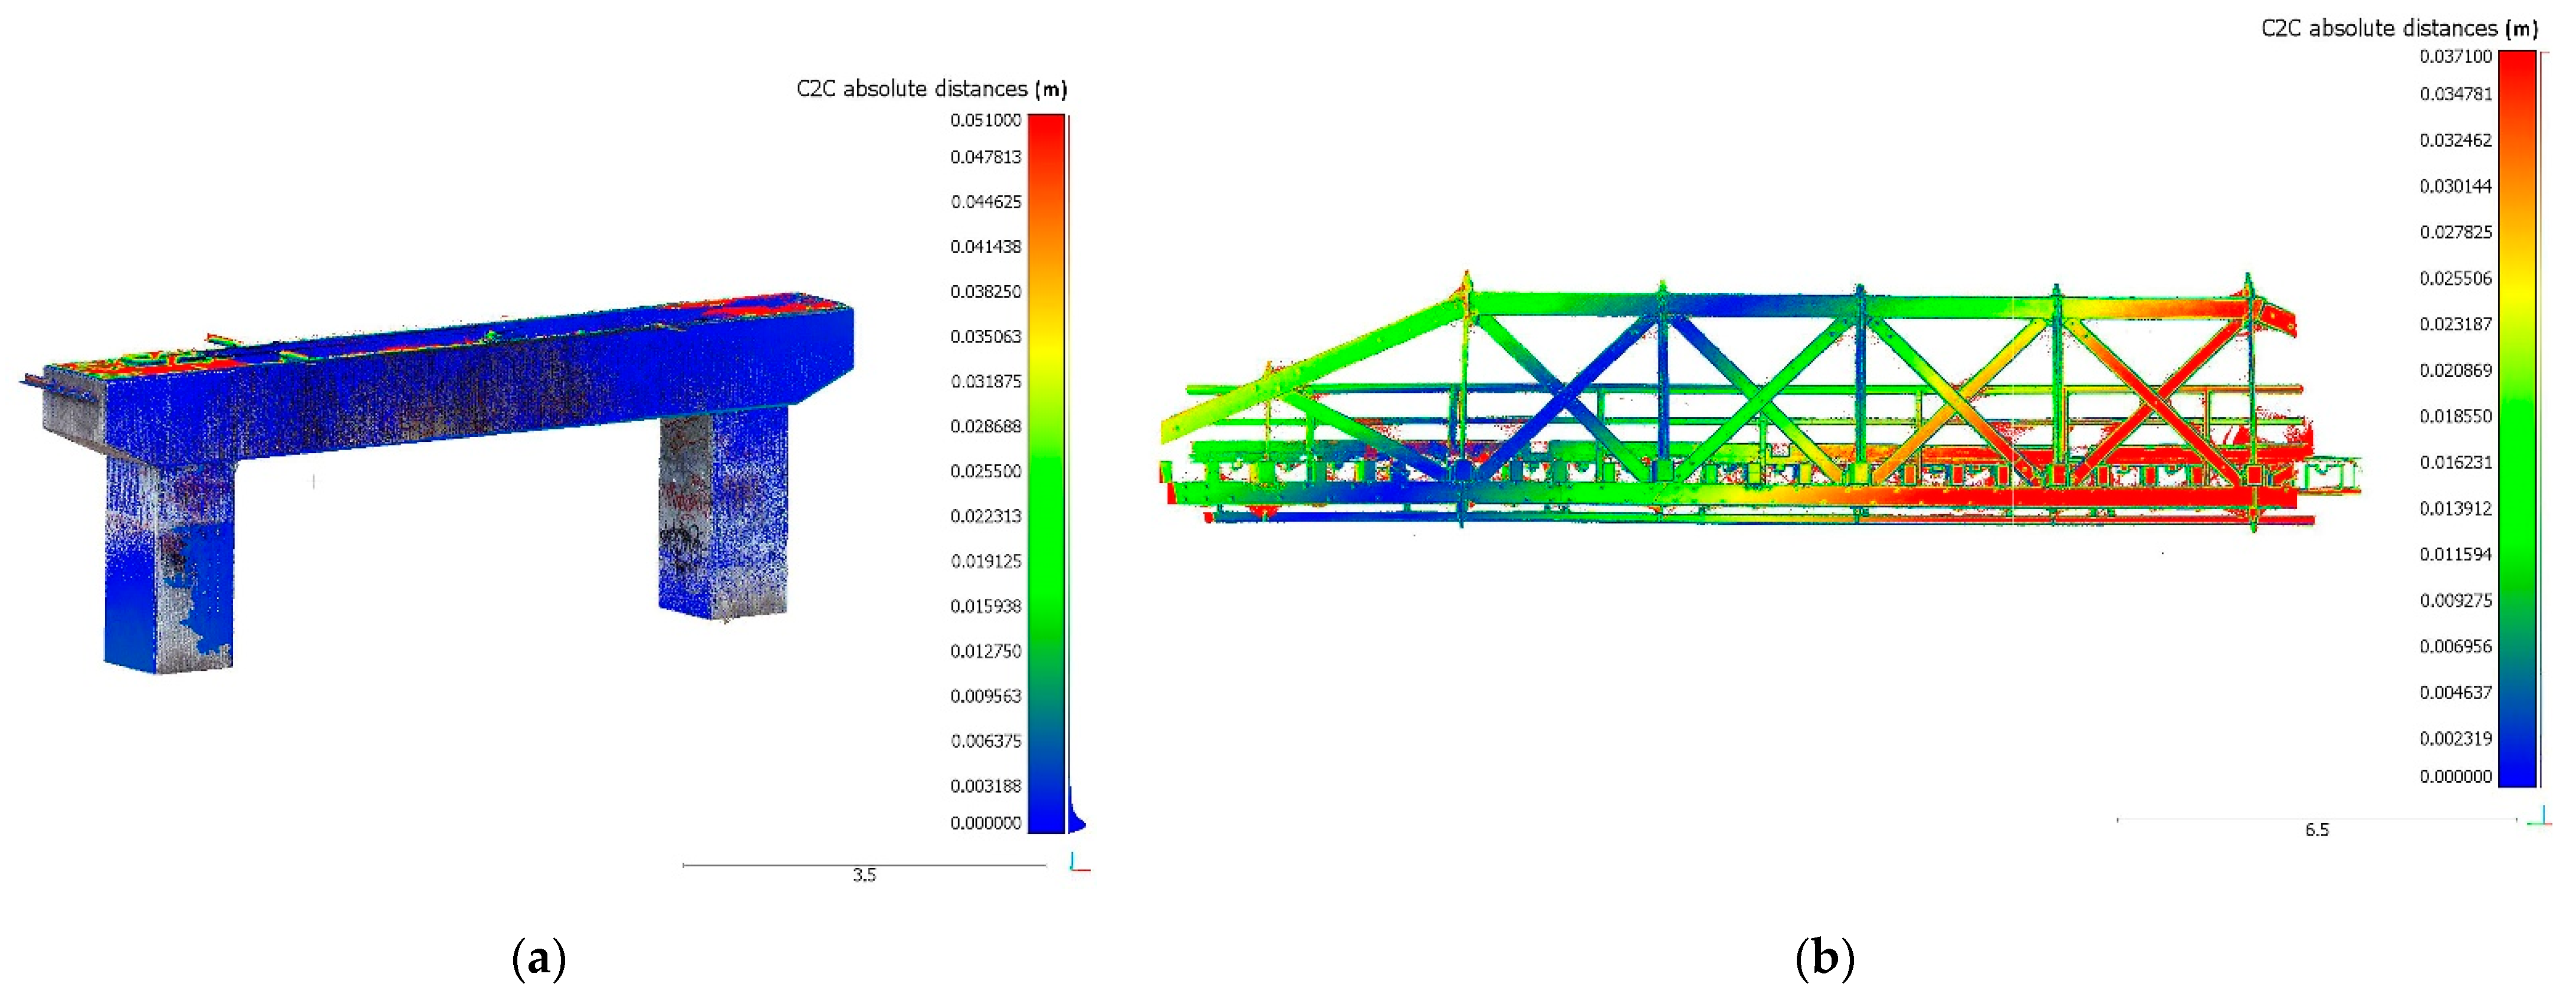
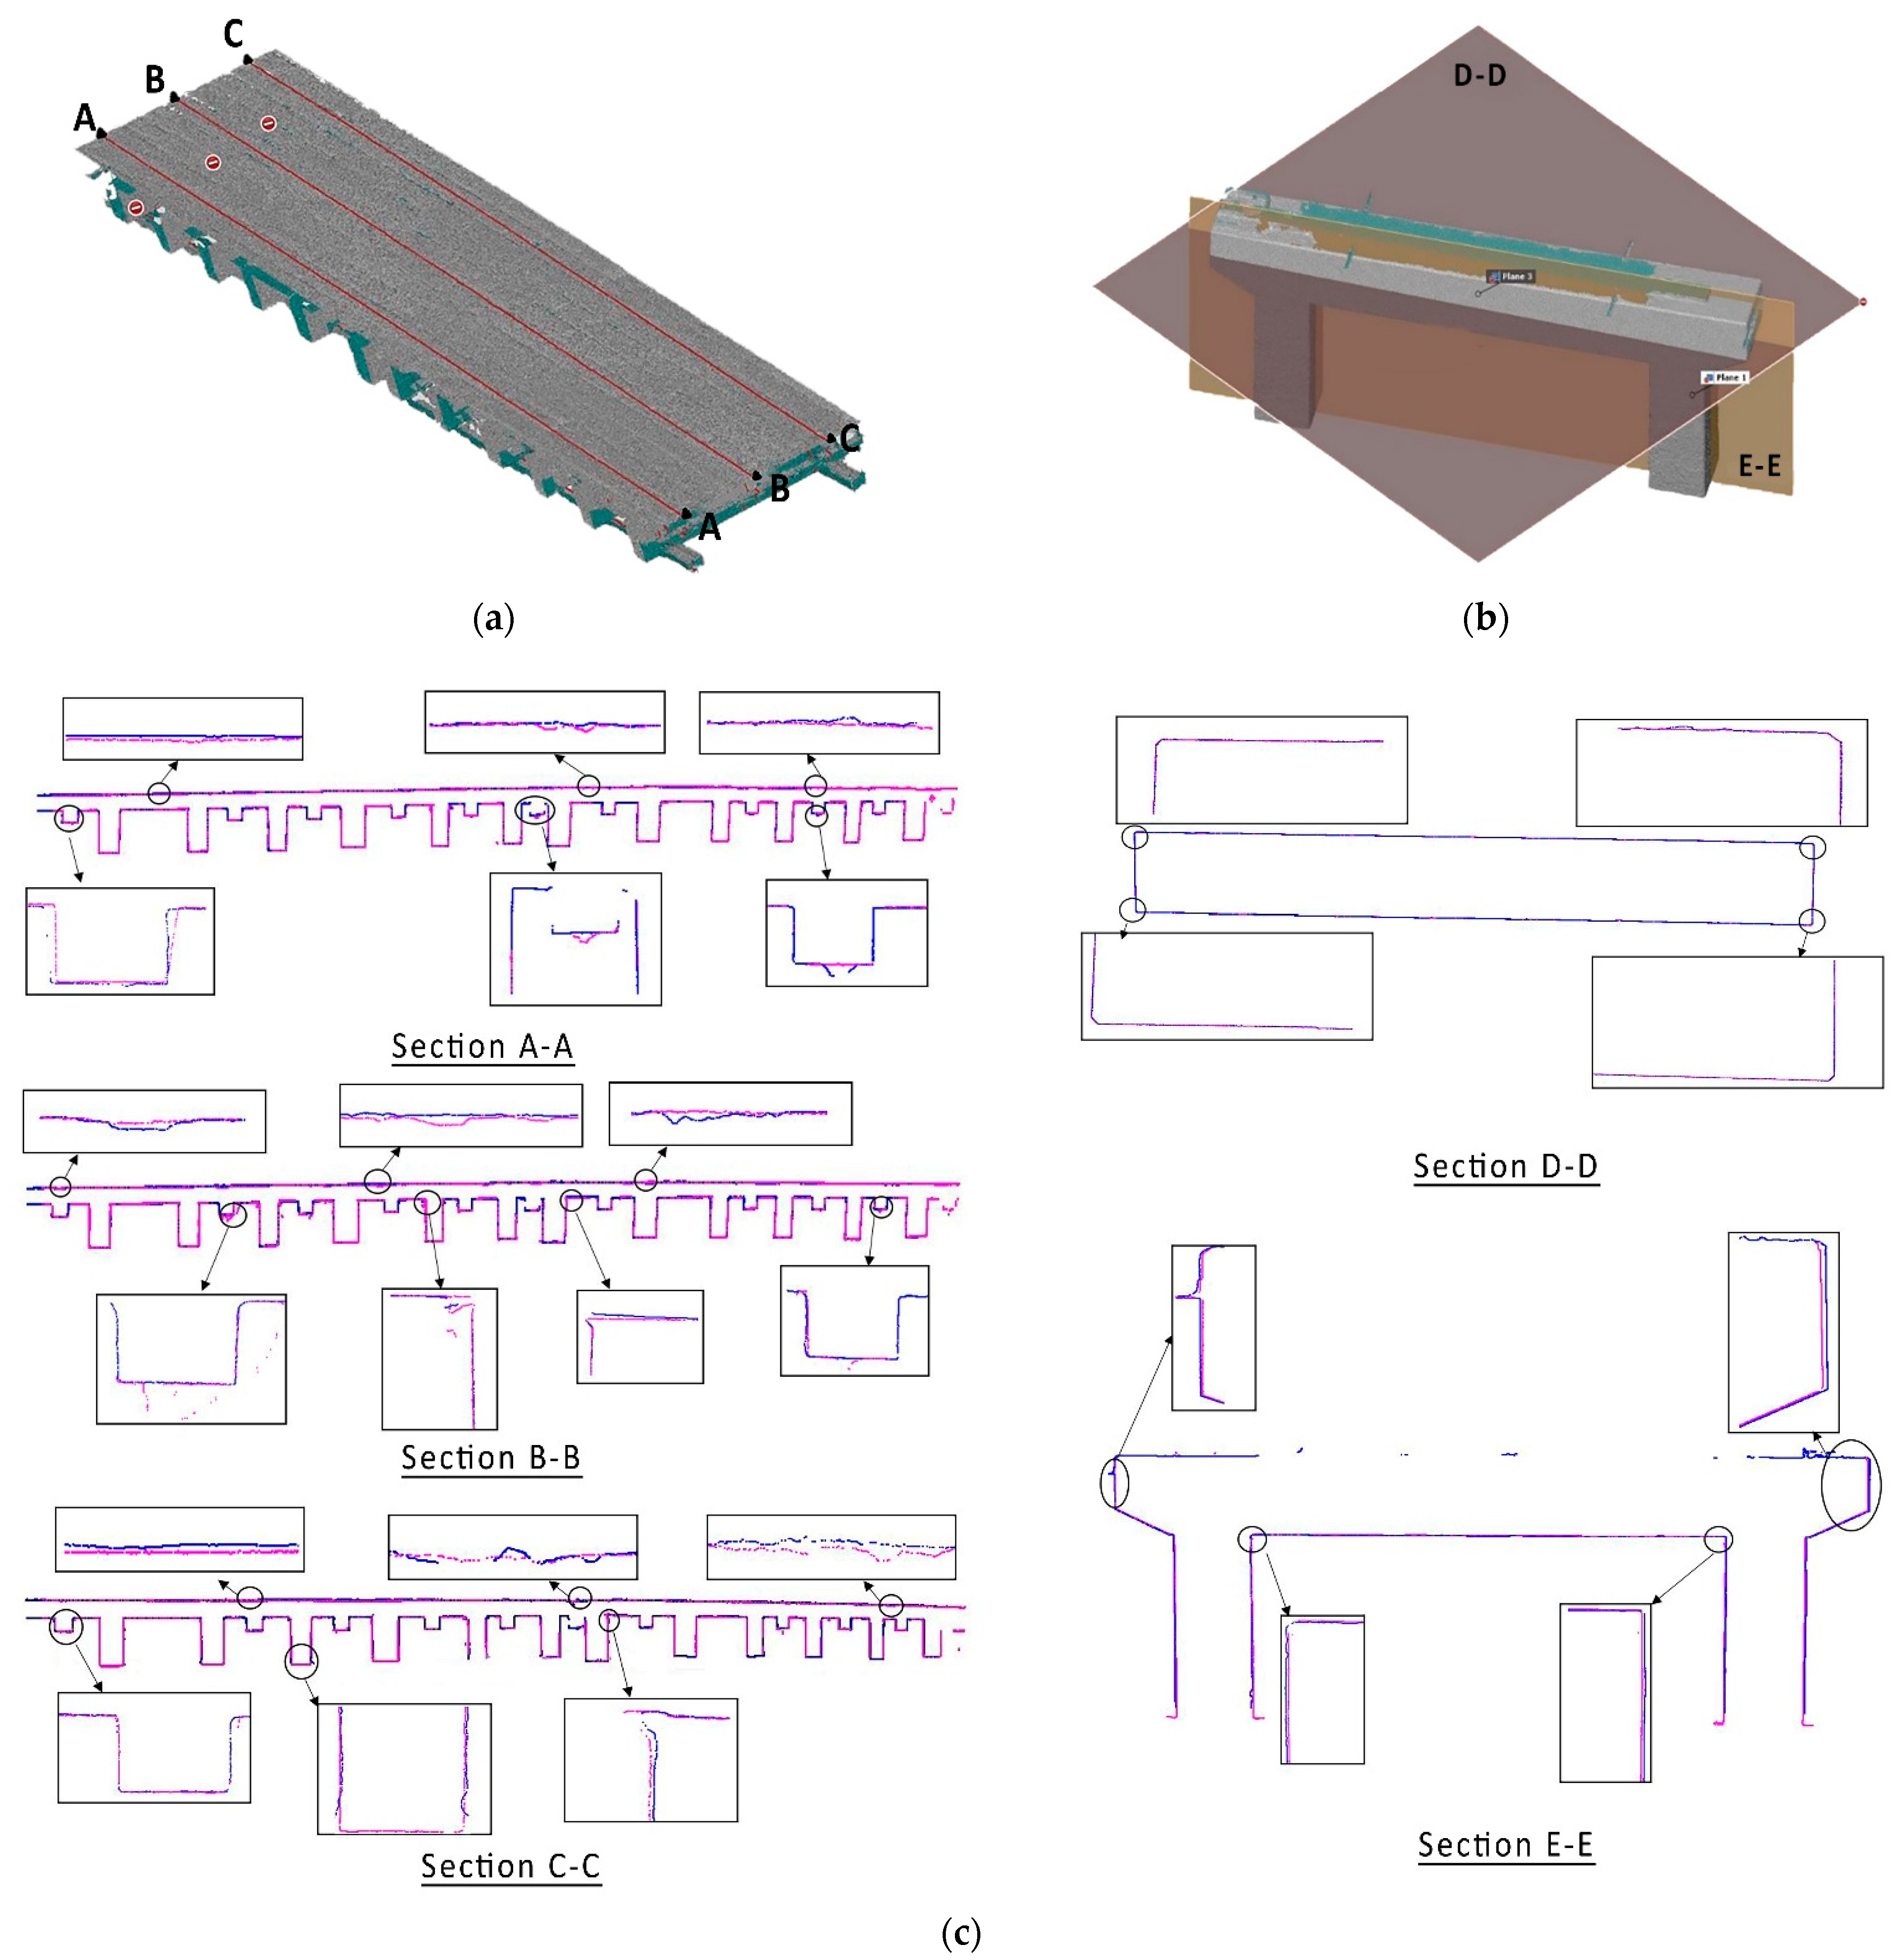
4.2.1. Surface Deviation Evaluation

As previously mentioned, it is recommended that the measurement of the spatial distribution of the generated points is conducted based on surface deviation analysis methods. In this study, all sides of the bridge piers and two sides of the beam were analyzed based on the proposed methodology by defining the best-fitted plane and evaluating the spatial distribution of the points in both data sets using well-known error metrics such as STD, RMSE, etc. The result of this evaluation is presented in Table 3.
As shown in Table 3, the average standard deviation (STD) and the Root Mean Square Error (RMSE) for the UAV data were 1.80 mm and 1.96 mm, respectively. These amounts were calculated as 1.62 mm for the TLS data set. This indicated an almost similar level of noise for both data sets. Individual comparisons also indicated a greater performance using TLS in terms of generating precise 3D models.
In another effort, this evaluation was extended to measure the reliability of using these two surveying methods to generate small-size components. In this regard, five cylinder rods (Cyl.), shown in Figure 4b, were evaluated based on the surface deviation analysis by fitting the best cylinder surface to the object’s points. Then, the spatial distribution of the points to these surfaces using well-known metric errors such as STD, RMSE and MAE was calculated. The result of this evaluation is presented in Table 4.
According to Table 4, the average results of the STD and the RMSE for the UAV data set showed values greater than 4 mm while these amounts were calculated as less than 3.4 mm for the TLS data points. However, the maximum distance obtained for the TLS data set shows a larger value than the UAV data points by a millimeter. This indicates a higher noise level for the TLS data while showing a greater performance in terms of geometric accuracy subjected to a 3D model reconstruction of the small-sized object.

4.2.2. Geometric Accuracy Evaluation

Adopting the method presented by Koutsoudis et al. [64], the geometric accuracy of both point clouds were evaluated and compared using the point-to-point comparison referring to the measurement of the relative distances between the specific points in each data set. This method was also extended to be more reliable by measuring the relative distances between several fitted planes. In this study, considering the intended surveying object presented in Figure 4c, the average relative distances between the best-fitted planes of the bridge piers were measured by selecting several corresponding points on their facing planes. Then, the results were compared with the as-is measurements captured by traditional survey equipment. The results of this comparison, shown in Table 5, were later used for data preparation and the re-scaling of the raw point clouds. As presented in Table 5, this evaluation shows greater scaling errors for the UAV data set than the TLS-based scaling errors in comparison to the reference as-is measurements.
According to the acceptable agreement between the geometric accuracy of the TLS data and as-is measurements, presented in Table 5, the TLS data set was used as the reference data in the preparation phase and the UAV data were rescaled and co-registered based on the TLS data. The successful completion of this phase was further verified by conducting the proposed geometric accuracy evaluation and calculating the mean distance, standard error, and uncertainty of the measurements for both point clouds in more than 10 iterations. The result of this verification, shown in Table 6, provided the standard error up to 0.01 mm difference and uncertainty of 0.016% in measurements from the TLS data set.
In another effort, the segmented bridge deck and piers, shown in Figure 4b, were inspected using the profiling method. In this regard, both point clouds were converted into polygon meshes (triangle mesh models) using the GOM Inspect computer software [71] considering similar settings and parameters. Following this research, several cross-sectional profiles of the bridge deck and piers, shown in Figure 7a,b, were extracted and evaluated. In Figure 7c, the red lines present the TLS-based cross-sectional profile while the blue lines show the linear paths of the UAV-based point clouds.
The result of the profiling comparison, presented in Table 7, showed the maximum and average distances, STD and RMSE, between the generated cross-sectional profiles in both point clouds. Considering the cross-sectional profiles of the deck, the average distance between the two point clouds was less than 7.27 mm; however, this amount was 0.82 mm on section D-D and 10.17 mm on section E-E for the bridge pier cross-sectional profiles. Moreover, the STD and RMSE were less than 6.97 mm and 7.53 mm, respectively. This indicated an acceptable agreement between the generated point clouds; however, some minor defects might have occurred due to self-shadowing, a lack of beam reflection or reflection loss in the laser scanning, or matching issues in the UAV photogrammetry.
The last evaluation involved the analysis of the Cloud-to-Cloud (C2C) distances based on the local modelling strategy for two different parts of the bridge using various algorithms of LSF, triangulation, quadric surface function and nearest neighbor. The results of this evaluation are presented in Figure 8 and Table 8. In order to further clarify the results, the deviation analysis is presented based on color scales with distance values in meters from blue to red. Points with blue colors have the closest distance; however, the points with red colors are located away in both point clouds.
According to Table 8, the comparison of bridge piers point clouds shows the average distances were less than 4.5 mm using all local modelling methods; however, this amount was less than 8.5 mm for part C, which means a lower precision in the point clouds’ coordination/matching considerably due to the structural complexity of the part C as the intended surveying object. Moreover, the resulting STD values had differences with average distances values calculated, showing the different level of noises in the generated point clouds.

5. Discussion

The proposed methodology of this research study contains two series of general and specific approaches to evaluate the consistency, quality, and precision of the generated bridge size point clouds. This methodology was further verified and evidenced via comparisons of two available bridge point clouds generated/scanned from a bridge named McKanes Falls Bridge using both UAV and TLS.
In the case of the McKanes Falls Bridge evaluation, the results of the general approaches indicated a denser TLS-based point cloud. Denser point clouds generally possess a higher number of points representing the objects’ surface thereby improving the level of accuracy for precise damage identifications and Level of Detail (LoD) in terms of as-is/as-built 3D model reconstructions. Moreover, the result of the visual quality assessment showed some missing/incomplete data in the UAV-derived point cloud which could be caused by a poor overlapping of the images captured or the definition of an insufficient number of features in the matching process. However, the outlier noise evaluations demonstrated less outlier noise for the UAV-based point cloud.
The results of the specific approaches indicated an almost similar level of noise for both the TLS and UAV-based data points; however, individual comparisons and other factors showed the greater performance of using TLS in terms of detailed 3D model reconstruction. The result of the geometric accuracy evaluations showed scaling errors in millimeters for TLS; however, the UAV-based data point exhibited a centimeter level of agreement with the as-is measurements. In terms of UAV photogrammetry, scaling errors may be a result of the inaccurate definition of the Ground Control Points (GPCs) or some issues related to vehicle settings and the post-processing procedures. Thus, surveying aspects of a bridge inspection such as selecting a suitable surveying plan, data acquisition, and post-processing techniques can affect a qualitative point cloud generation which deserves future investigations. After serving TLS data point as the reference data and rescaling the UAV data point, the result of profiling and cloud-to-cloud comparisons showed acceptable agreement with minor defects between both point clouds.
Overall, the results of the McKanes Falls Bridge case study proved the capabilities of the proposed methodology in data quality evaluation of such voluminous point clouds. It is clear that both UAV-based photogrammetry and TLS have their own advantages and drawbacks. Compared to the traditional inspection method, UAV-based photogrammetry possesses clear advantages regarding its flexibility in the level of geometric accuracy, accessibility to high altitude areas, inspection safety, cost-effectiveness, and reasonable inspection time. However, TLS also offers various levels of point density with range based geometric accuracy suitable for detailed inspections while taking longer surveying and post-processing times. Therefore, selecting the suitable bridge inspection method and technology may rely on other considerations such as intended surveying object, available budget, the required Level of Detail (LoD), site accessibility and project significance.

6. Conclusions

With respect to bridge inspection and monitoring, this research study introduced a comprehensive methodology for a reliable quality analysis of digital point clouds generated via various techniques such as imagery acquisition and laser scanning subjected to the implantation of a detailed 3D reconstruction model. In this regard, a range of general and specific data evaluation approaches was proposed to evaluate and compare such voluminous point clouds in terms of points distribution, outlier level of noise, data completeness, surface deviation, and geometric accuracy evaluation. The proposed methodology and approaches were further verified and proved by evaluating and comparing two available bridge point clouds captured/scanned via UAV photogrammetry and Terrestrial Laser Scanning (TLS) from a heritage bridge named McKanes Falls Bridge located in NSW, Australia.
The comparative results of this case study exhibited the capability and applicability of the proposed methodology and evaluation approaches which led to a reliable and acceptable/fair data quality evaluation and comparison. In the case of the McKanes Falls Bridge inspection, the results of the proposed methodology and approaches showed a higher level of points density, a more acceptable agreement with the as-is measurements, and normal levels of outlier and general noise using TLS. However, considering similar surveying objects and evaluations, the results exhibited some missing data and greater scaling errors with a lower geometric accuracy for the UAV-based point cloud. This indicates that TLS can offer significant advantages in the level of geometric accuracy while having a high level of point density which are important considerations in terms of the precise 3D model reconstruction for detailed quality inspections of the bridges. However, concerns remain including the implementation time, the high equipment cost and the limited/restricted access of TLS, which can all be compensated by using UAV-based photogrammetry techniques.
According to the presented study, future research should focus on the assessment of the surveying aspects of bridge inspections such as data acquisition/collection, surveying plans and post-processing procedures which can affect qualitative point clouds generation.

Author Contributions

Conceptualization, M.M., M.R., V.M., A.K., Y.Y. and B.S.; Data curation, M.M.; Formal analysis, M.M., V.M. and A.K.; Funding acquisition, M.R. and B.S.; Methodology, M.M., M.R., V.M., A.K., Y.Y. and B.S.; Project administration, M.R.; Resources, M.R. and B.S.; Software, M.M., V.M. and A.K.; Supervision, M.M. and B.S.; Validation, M.M., V.M. and Y.Y.; Visualization, M.M.; Writing—original draft, M.M.; Writing—review and editing, M.M., M.R., V.M., A.K., Y.Y. and B.S. All authors have read and agreed to the published version of the manuscript.

Funding

This research received no external funding.

Institutional Review Board Statement

Not applicable.

Informed Consent Statement

Not applicable.

Data Availability Statement

Upon a reasonable request from the corresponding author.

Acknowledgments

The authors would like to acknowledge the administrative and technical supports of Transport for New South Wales (TfNSW), Australia, and greatly appreciate the valuable advice of Houman Hatamian, Syed F. Nowmani, and Bradley Edwards in this research study.

Conflicts of Interest

The authors declare no conflict of interest.

References

  1. Rashidi, M.; Hoshyar, A.N.; Smith, L.; Bijan, S.; Siddique, R. A comprehensive taxonomy for structure and material deficiencies, preventions and remedies of timber bridges. J. Build. Eng. 2021, 34, 101624. [Google Scholar] [CrossRef]
  2. Horgan, R. Fatal Taiwan Bridge Collapse Is Latest Example of Maintenance Failings. Available online: https://www.newcivilengineer.com/latest/fatal-taiwan-bridge-collapse-is-latest-example-of-maintenance-failings-07-10-2019/ (accessed on 1 June 2021).
  3. Calvi, G.M.; Moratti, M.; O’Reilly, G.J.; Scattarreggia, N.; Monteiro, R.; Malomo, D.; Calvi, P.M.; Pinho, R. Once upon a Time in Italy: The Tale of the Morandi Bridge. Struct. Eng. Int. 2019, 29, 198–217. [Google Scholar] [CrossRef]
  4. Mohiuddin, A.K. Inspection, Rating and Health Monitoring Techniques; McGraw-Hill Education: New York, NY, USA, 2010. [Google Scholar]
  5. Chen, Q.; Jiang, W.; Meng, X.; Jiang, P.; Wang, K.; Xie, Y.; Ye, J. Vertical Deformation Monitoring of the Suspension Bridge Tower Using GNSS: A Case Study of the Forth Road Bridge in the UK. Remote Sens. 2018, 10, 364. [Google Scholar] [CrossRef] [Green Version]
  6. Kwiatkowski, J.; Anigacz, W.; Beben, D. Comparison of Non-Destructive Techniques for Technological Bridge Deflection Testing. Materials 2020, 13, 1908. [Google Scholar] [CrossRef]
  7. Villarino, A.; Riveiro, B.; Martínez-Sánchez, J.; Gonzalez-Aguilera, D. Successful Applications of Geotechnologies for the Evaluation of Road Infrastructures. Remote Sens. 2014, 6, 7800–7818. [Google Scholar] [CrossRef] [Green Version]
  8. Pourzeynali, S.; Zhu, X.; Ghari Zadeh, A.; Rashidi, M.; Samali, B. Comprehensive Study of Moving Load Identification on Bridge Structures Using the Explicit Form of Newmark-β Method: Numerical and Experimental Studies. Remote Sens. 2021, 13, 2291. [Google Scholar] [CrossRef]
  9. Feroz, S.; Abu Dabous, S. UAV-Based Remote Sensing Applications for Bridge Condition Assessment. Remote Sens. 2021, 13, 1809. [Google Scholar] [CrossRef]
  10. Dorafshan, S.; Maguire, M. Bridge inspection: Human performance, unmanned aerial systems and automation. J. Civ. Struct. Health Monit. 2018, 8, 443–476. [Google Scholar] [CrossRef] [Green Version]
  11. Rashidi, M.; Mohammadi, M.; Sadeghlou Kivi, S.; Abdolvand, M.M.; Truong-Hong, L.; Samali, B. A Decade of Modern Bridge Monitoring Using Terrestrial Laser Scanning: Review and Future Directions. Remote Sens. 2020, 12, 3796. [Google Scholar] [CrossRef]
  12. Opoku, D.-G.J.; Perera, S.; Osei-Kyei, R.; Rashidi, M. Digital twin application in the construction industry: A literature review. J. Build. Eng. 2021, 40, 102726. [Google Scholar] [CrossRef]
  13. Chen, S.; Laefer, D.F.; Mangina, E.; Iman Zolanvari, S.M.; Byrne, J. UAV Bridge Inspection through Evaluated 3D Reconstructions. J. Bridge Eng. 2019, 24, 05019001. [Google Scholar] [CrossRef] [Green Version]
  14. Jahanshahi, M.R.; Masri, S.F.; Sukhatme, G.S. Multi-image stitching and scene reconstruction for evaluating defect evolution in structures. Struct. Health Monit. 2011, 10, 643–657. [Google Scholar] [CrossRef] [Green Version]
  15. Rashidi, M.; Samali, B. Health Monitoring of Bridges Using RPAs. In EASEC16. Lecture Notes in Civil Engineering; Wang, C.M., Dao, V., Kitipornchai, S., Eds.; Springer: Singapore, 2021; Volume 101, pp. 209–218. [Google Scholar] [CrossRef]
  16. Dorafshan, S.; Thomas, R.J.; Coopmans, C.; Maguire, M. A Practitioner’s Guide to Small Unmanned Aerial Systems for Bridge Inspection. Infrastructures 2019, 4, 72. [Google Scholar] [CrossRef] [Green Version]
  17. Dorafshan, S.; Thomas, R.J.; Maguire, M. Fatigue Crack Detection Using Unmanned Aerial Systems in Fracture Critical Inspection of Steel Bridges. J. Bridge Eng. 2018, 23, 04018078. [Google Scholar] [CrossRef]
  18. Szeliski, R. Computer Vision: Algorithms and Applications; Springer: London, UK, 2011. [Google Scholar]
  19. Remondino, F.; Del Pizzo, S.; Kersten, T.P.; Troisi, S. Low-Cost and Open-Source Solutions for Automated Image Orientation—A Critical Overview. In Progress in Cultural Heritage Preservation, Proceedings of the 4th International Conference, EuroMed 2012, Limassol, Cyprus, 29 October–3 November 2012; Springer: Berlin/Heidelberg, Germany, 2012; pp. 40–54. [Google Scholar]
  20. Seo, J.; Duque, L.; Wacker, J. Drone-enabled bridge inspection methodology and application. Autom. Constr. 2018, 94, 112–126. [Google Scholar] [CrossRef]
  21. Abolhasannejad, V.; Huang, X.; Namazi, N. Developing an Optical Image-Based Method for Bridge Deformation Measurement Considering Camera Motion. Sensors 2018, 18, 2754. [Google Scholar] [CrossRef] [PubMed] [Green Version]
  22. Pan, Y.; Dong, Y.; Wang, D.; Chen, A.; Ye, Z. Three-Dimensional Reconstruction of Structural Surface Model of Heritage Bridges Using UAV-Based Photogrammetric Point Clouds. Remote Sens. 2019, 11, 1204. [Google Scholar] [CrossRef] [Green Version]
  23. Riveiro, B.; Lindenbergh, R. Laser Scanning: An Emerging Technology in Structural Engineering; CRC Press: Boca Raton, FL, USA, 2019; p. 270. [Google Scholar]
  24. Truong-Hong, L.; Laefer, D.F. Laser scanning for bridge inspection. In Laser Scanning: An Emerging Technology in Structural Engineering; CRC Press: Boca Raton, FL, USA, 2019; pp. 189–214. [Google Scholar]
  25. Fuchs, P.A.; Washer, G.A.; Chase, S.B.; Moore, M. Applications of Laser-Based Instrumentation for Highway Bridges. J. Bridge Eng. 2004, 9, 541–549. [Google Scholar] [CrossRef]
  26. Tang, P.; Akinci, B.; Garrett, J. Laser Scanning for Bridge Inspection and Management. In Proceedings of the IABSE Symposium: Improving Infrastructure Worldwide, Weimar, Germany, 19–21 September 2007; pp. 17–24. [Google Scholar]
  27. Tang, P.; Akinci, B. Automatic execution of workflows on laser-scanned data for extracting bridge surveying goals. Adv. Eng. Inform. 2012, 26, 889–903. [Google Scholar] [CrossRef]
  28. Mizoguchi, T.; Koda, Y.; Iwaki, I.; Wakabayashi, H.; Kobayashi, Y.; Shirai, K.; Hara, Y.; Lee, H.-S. Quantitative scaling evaluation of concrete structures based on terrestrial laser scanning. Autom. Constr. 2013, 35, 263–274. [Google Scholar] [CrossRef]
  29. Minehane, M.j.; O’Donovan, R.; Ruane, K.D.; O’Keeffe, B. The Use of 3D Laser Scanning Technology for Bridge Inspection and Assessment. In Proceedings of the Civil Engineering Research in Ireland, CERI, Belfast, Northen Ireland, 28–29 August 2014. [Google Scholar]
  30. Gyetvai, N.; Truong-Hong, L.; Laefer, D.F. Laser scan-based structural assessment of wrought iron bridges: Guinness Bridge, Ireland. Proc. Inst. Civ. Eng. Eng. Hist. Herit. 2018, 171, 76–89. [Google Scholar] [CrossRef] [Green Version]
  31. Gawronek, P.; Makuch, M. TLS Measurement during Static Load Testing of a Railway Bridge. ISPRS Int. J. Geo-Inf. 2019, 8, 44. [Google Scholar] [CrossRef] [Green Version]
  32. Conde-Carnero, B.; Riveiro, B.; Arias, P.; Caamaño, J.C. Exploitation of geometric data provided by laser scanning to create FEM structural models of bridges. J. Perform. Constr. Facil. 2016, 30, 04015053. [Google Scholar] [CrossRef]
  33. Ziolkowski, P.; Szulwic, J.; Miskiewicz, M. Deformation Analysis of a Composite Bridge during Proof Loading Using Point Cloud Processing. Sensors 2018, 18, 4332. [Google Scholar] [CrossRef] [Green Version]
  34. Mill, T.; Ellmann, A.; Kiisa, M.; Idnurm, J.; Idnurm, S.; Horemuž, M.; Aavik, A. Geodetic monitoring of bridge deformations occurring during static load testing. Balt. J. Road Bridge Eng. 2015, 10, 17–27. [Google Scholar] [CrossRef] [Green Version]
  35. Laefer, D.F.; Truong-Hong, L. Toward automatic generation of 3D steel structures for building information modelling. Autom. Constr. 2017, 74, 66–77. [Google Scholar] [CrossRef]
  36. Javidan, M.M.; Kim, J. Fuzzy-based method for efficient seismic performance evaluation of structures with uncertainty. Comput. Aided Civ. Infrastruct. Eng. 2021. [Google Scholar] [CrossRef]
  37. Kim, H.; Kim, C. Deep-Learning-Based Classification of Point Clouds for Bridge Inspection. Remote Sens. 2020, 12, 3757. [Google Scholar] [CrossRef]
  38. Rashidi, M.; Ghodrat, M.; Samali, B.; Mohammadi, M. Decision Support Systems. In Management of Information Systems; IntechOpen: London, UK, 2018. [Google Scholar] [CrossRef] [Green Version]
  39. Yu, Y.; Rashidi, M.; Samali, B.; Mohammadi, M.; Nguyen, A. Computer vision-based classification of cracks on concrete bridges using machine learning techniques. In Proceedings of the 10th International Conference on Structural Health Monitoring of Intelligent Infrastructure, SHMII 10, Porto, Portugal, 30 June–2 July 2021. [Google Scholar]
  40. Lu, R.; Rausch, C.; Bolpagni, M.; Brilakis, I.; Haas, C.T. Geometric Accuracy of Digital Twins for Structural Health Monitoring; IntechOpen: London, UK, 2020. [Google Scholar] [CrossRef]
  41. Kubota, S.; Ho, C.; Nishi, K. construction and usage of three-dimensional data for road structures using terrestrial laser scanning and uav with photogrammetry. In Proceedings of the 36th International Symposium on Automation and Robotics in Construction (ISARC), Banff, AB, Canada, 21–24 May 2019; pp. 136–143. [Google Scholar]
  42. Moon, D.; Chung, S.; Kwon, S.; Seo, J.; Shin, J. Comparison and utilization of point cloud generated from photogrammetry and laser scanning: 3D world model for smart heavy equipment planning. Autom. Constr. 2019, 98, 322–331. [Google Scholar] [CrossRef]
  43. Mohammadi, M.; Rashidi, M.; Mousavi, V.; Karami, A.; Yu, Y.; Samali, B. Case study on accuracy comparison of digital twins developed for a heritage bridge via UAV photogrammetry and terrestrial laser scanning. In Proceedings of the 10th International Conference on Structural Health Monitoring of Intelligent Infrastructure, SHMII 10, Porto, Portugal, 30 June–2 July 2021. [Google Scholar]
  44. Fraser, D. Nomination for McKanes Falls Bridge over Cox’s River Near Lithgow, NSW as an Historic Engineering Marker; Engineers Australia: Sydney, Australia, 2001. [Google Scholar]
  45. Gorji Azandariani, M.; Rousta, A.M.; Mohammadi, M.; Rashidi, M.; Abdolmaleki, H. Numerical and analytical study of ultimate capacity of steel plate shear walls with partial plate-column connection (SPSW-PC). Structures 2021, 33, 3066–3080. [Google Scholar] [CrossRef]
  46. Mohammadi, M.; Kafi, M.A.; Kheyroddin, A.; Ronagh, H.R.; Rashidi, M. Experimental and Numerical Investigation of Innovative Composite Buckling-Restrained Fuse. ACMSM25 Lect. Notes Civ. Eng. 2020, 37, 113–121. [Google Scholar] [CrossRef]
  47. Javidan, M.M.; Kim, J. Steel hysteretic column dampers for seismic retrofit of soft first story structures. Steel Compos. Struct. 2020, 37, 259–272. [Google Scholar] [CrossRef]
  48. Gorji Azandariani, M.; Gholhaki, M.; Kafi, M.A.; Zirakian, T. Study of effects of beam-column connection and column rigidity on the performance of SPSW system. J. Build. Eng. 2021, 33, 101821. [Google Scholar] [CrossRef]
  49. Roads and Maritime Services. McKanes Bridge Upgrade, Review of Environmental Factors; NSW Roads and Maritime Services: Sydney, Australia, 2019; p. 2.
  50. Bentley Systems Company. ContextCapture Software; Bentley Systems Company: Exton, PA, USA, 2021. [Google Scholar]
  51. Leica Geosystems Company. Leica ScanStation P50/P40/P30, Laser Scanner User Manual; Leica Geosystems Company: Heerbrugg, Switzerland, 2018. [Google Scholar]
  52. Verein Deutscher Ingenieure; Verband Der Elektrotechnik. VDI/VDE 2634 BLATT 3, Optical 3D-Measuring Systems—Multiple View Systems Based on Area Scanning; Engl. VDI/VDE-Gesellschaft Mess- und Automatisierungstechnik: Düsseldorf, Germany, 2008. [Google Scholar]
  53. Besl, P.J.; McKay, N.D. A method for registration of 3-D shapes. IEEE Trans. Pattern Anal. Mach. Intell. 1992, 14, 239–256. [Google Scholar] [CrossRef]
  54. Huang, H.; Li, D.; Zhang, H.; Ascher, U.; Cohen-Or, D. Consolidation of unorganized point clouds for surface reconstruction. ACM Trans. Graph. 2009, 28, 1–7. [Google Scholar] [CrossRef] [Green Version]
  55. Salgado, C.M.; Azevedo, C.; Proença, H.; Vieira, S.M. Noise Versus Outliers. In Secondary Analysis of Electronic Health Records; Springer International Publishing: Cham, Switzerland, 2016; pp. 163–183. [Google Scholar]
  56. Karami, A.; Menna, F.; Remondino, F. Investigating 3d Reconstruction Of Non-Collaborative Surfaces Through Photogrammetry And Photometric Stereo. Int. Arch. Photogramm. Remote Sens. Spat. Inf. Sci. 2021, 43, 519–526. [Google Scholar] [CrossRef]
  57. Uchida, T.; Hasegawa, K.; Li, L.; Adachi, M.; Yamaguchi, H.; Thufail, F.I.; Riyanto, S.; Okamoto, A.; Tanaka, S. Noise-robust transparent visualization of large-scale point clouds acquired by laser scanning. ISPRS J. Photogramm. Remote Sens. 2020, 161, 124–134. [Google Scholar] [CrossRef]
  58. Wang, Y. Outlier Formation and Removal in 3D Laser Scanned Point Clouds. Ph.D. Thesis, The University of British Columbia, Vancouver, BC, Canada, 2014. [Google Scholar]
  59. Verein Deutscher Ingenieure; Verband Der Elektrotechnik. VDI/VDE 2634 BLATT 2, Optical 3D-Measuring Systems—Optical Systems Based on Area Scanning; Engl. VDI/VDE-Gesellschaft Mess- und Automatisierungstechnik: Düsseldorf, Germany, 2012. [Google Scholar]
  60. Hosseininaveh Ahmadabadian, A.; Karami, A.; Yazdan, R. An automatic 3D reconstruction system for texture-less objects. Robot. Auton. Syst. 2019, 117, 29–39. [Google Scholar] [CrossRef]
  61. Essa, K.S. New fast least-squares algorithm for estimating the best-fitting parameters due to simple geometric-structures from gravity anomalies. J. Adv. Res. 2014, 5, 57–65. [Google Scholar] [CrossRef] [Green Version]
  62. Mousavi, V.; Khosravi, M.; Ahmadi, M.; Noori, N.; Haghshenas, S.; Hosseininaveh, A.; Varshosaz, M. The performance evaluation of multi-image 3D reconstruction software with different sensors. Measurement 2018, 120, 1–10. [Google Scholar] [CrossRef]
  63. Rabbani, T. Automatic Reconstruction of Industrial Installations Using Point Clouds and Images; NCG, Nederlandse Commissie Voor Geodesie, Netherlands Geodetic Commission: Delft, The Netherlands, 2006. [Google Scholar]
  64. Koutsoudis, A.; Vidmar, B.; Ioannakis, G.; Arnaoutoglou, F.; Pavlidis, G.; Chamzas, C. Multi-image 3D reconstruction data evaluation. J. Cult. Herit. 2014, 15, 73–79. [Google Scholar] [CrossRef]
  65. Rockafellar, R.T.; Wets, R.J.-B. Variational Analysis; Springer: Berlin/Heidelberg, Germany, 1998; p. 736. [Google Scholar]
  66. Ahmadabadian, A.H.; Yazdan, R.; Karami, A.; Moradi, M.; Ghorbani, F. Clustering and selecting vantage images in a low-cost system for 3D reconstruction of texture-less objects. Measurement 2017, 99, 185–191. [Google Scholar] [CrossRef]
  67. Ahmad Fuad, N.; Yusoff, A.R.; Ismail, Z.; Majid, Z. Comparing the performance of point cloud registration methods for landslide monitoring using mobile laser scanning data. Int. Arch. Photogramm. Remote Sens. Spat. Inf. Sci. 2018, 42, 11–21. [Google Scholar] [CrossRef] [Green Version]
  68. Girardeau-Montaut, D. CloudCompare Software; 2006; Available online: https://www.danielgm.net/cc/ (accessed on 1 June 2021).
  69. Mousavi, V.; Varshosaz, M.; Remondino, F. Using Information Content to Select Keypoints for UAV Image Matching. Remote Sens. 2021, 13, 1302. [Google Scholar] [CrossRef]
  70. Gärtner, H.; Wagner, B.; Heinrich, I.; Denier, C. 3D-laser scanning: A new method to analyze coarse tree root systems. For. Snow Landsc. Res. 2009, 82, 95–106. [Google Scholar]
  71. GOM Gmbh Company. Gom Inspect Suite Software; GOM Gmbh Company: Braunschweig, Germany, 2020; Available online: https://www.gom.com/en/products/gom-suite/gom-inspect-pro?gclid=EAIaIQobChMI_43d-Z3f8gIVSteWCh2ltQ9MEAAYAyAAEgKGd_D_BwE (accessed on 1 June 2021).
Figure 2. Generated McKanes Falls Bridge point cloud based on: (a) UAV photogrammetry, (b) TLS.
Remotesensing 13 03499 g002
Figure 3. Bridge Surveying procedures and the methodology of the data quality evaluation.
Remotesensing 13 03499 g003
Figure 4. Bridge components and the intended surveying objects; (a) Bridge top view and cross-section, (b) Selected components, (c) Intended surveying objects and parameters.
Remotesensing 13 03499 g004
Figure 5. Outlier noise evaluation for (a) Part A, (b) Part C.
Remotesensing 13 03499 g005
Figure 6. Visual quality assessment; (a) UAV data versus, (b) Laser data.
Remotesensing 13 03499 g006
Figure 7. The inspected cross-sectional profiles of the bridge; (a) Bridge deck, (b) Piers, (c) Cross-sectional profiles and details, blue lines: UAV data, red lines: TLS.
Remotesensing 13 03499 g007
Figure 8. C2C distance comparison for; (a) pier, (b) part C.
Remotesensing 13 03499 g008
Table 1. Evaluation of the points distribution and density.
PlaneSelected Area (m2)UAV-Based PhotogrammetryTLS
Number of PointsDensity (P/cm2)Number of PointsDensity (P/cm2)
P1-N2.12504,01324921,01143
P1-W2.11504,90224606,97529
P1-S2.00104,23551,056,90553
P1-E1.99374,667191,014,99851
P2-N2.03482,90624904,12045
P2-W1.97471,90724730,03937
P2-S2.04336,24016976,52948
P2-E1.96442,19423575,41029
B-N4.631,153,831252,334,75250
B-S5.281,123,15221962,80518
Average2.61549,805211,008,35539
Table 2. The results of the outlier noise evaluation.
Reference Objects Partλ′ (mm)β′ (mm)α′ (mm)Number of PointsNumber of Outlier PointsOutlier Noise (%)
A0.507.9016.30226,257,8065,328,3712.35%
B0.397.1314.70249,620,4013,896,5741.56%
C2.0020.0042.00156,609,2794,991,1373.18%
Average2.36%
Table 3. Surface deviation analysis using the plane fitting method, Unit: mm.
PlaneUAV Based PhotogrammetryTLS
STDMean DistanceMax
Distance
RMSEMAESTDMean DistanceMax
Distance
RMSEMAE
P1-N2.130.597.933.132.471.370.138.541.371.10
P1-W1.670.337.861.671.081.160.078.731.1610.00
P1-S1.350.207.961.352.301.770.308.501.771.20
P1-E2.600.407.922.602.021.920.208.401.921.60
P2-N1.280.198.181.281.001.360.128.681.361.00
P2-W1.500.108.081.501.001.550.158.401.551.20
P2-S2.320.308.062.301.701.310.108.801.311.00
P2-E1.960.208.071.961.601.940.108.801.941.60
B-N1.970.1014.101.901.472.110.1317.002.131.95
B-S1.900.1014.341.901.491.670.4120.771.671.30
Average1.800.259.251.961.611.620.1710.661.621.29
Table 4. Surface deviation analysis using the cylinder fitting method, Unit: mm.
PlaneUAV Based PhotogrammetryTLS
STDMean DistanceMax
Distance
RMSEMAESTDMean DistanceMax
Distance
RMSEMAE
Cyl. 13.601.503.004.002.002.700.605.402.802.20
Cyl. 23.901.405.005.504.003.500.295.103.532.60
Cyl. 33.902.555.104.703.004.400.105.223.562.40
Cyl. 43.451.204.003.600.263.000.124.803.302.40
Cyl. 55.000.804.805.404.003.202.304.904.003.20
Average4.001.494.004.602.603.360.685.103.402.60
Table 5. Geometry accuracy and scaling error evaluation.
UAV (mm)TLS (mm)As-Is (mm)UAV Scaling Error (mm)TLS Scaling Error (mm)
P1-N to P1-S941.7910.2908.133.62.1
P1-W to P1-E944.1910.5907.936.22.6
P2-N to P2-S942.5911.2909.033.52.2
P2-W to P2-E939.8911.5910.129.71.4
Table 6. Verification and geometry accuracy evaluation (Unit: mm).
Number of IterationP1-E to P2-WP1-W to P2-E
UAVTLSUAVTLS
15479.15479.57300.07298.9
25472.15471.07301.07293.6
35478.35479.27299.97298.6
45479.05478.77301.57301.5
55474.75476.47299.67300.5
65474.55474.27301.07298.4
75472.65473.37297.37302.0
85471.25472.47293.47301.1
95472.75472.57300.97302.3
105475.65475.47309.47302.6
115472.85472.07301.47309.0
Average 5474.85474.97300.57300.7
STD 32.93.83.7
Standard error0.90.891.141.13
MAE51514850
Uncertainty in measurement5470 ± 45470 ± 3.57300 ± 77300 ± 7
Uncertainty (%)0.0160.0160.0160.016
Table 7. Profiling comparison (Unit: mm).
Cross-Sectional ProfilesMax Distance Average Distance STD RMSE
Sec A-A15.443.114.103.61
Sec B-B14.213.293.943.62
Sec C-C19.797.276.977.13
Sec D-D6.230.820.480.65
Sec E-E17.4310.174.897.53
Table 8. C2C distance computations.
Local Modelling MethodNumber of
Neighboring Points
PierPart C
Average Distance (mm)STD (mm)Average Distance (mm)STD (mm)
Least square plane62.083.835.8310.03
122.414.206.6110.86
Triangulation62.979.518.1315.54
122.919.398.0715.52
Quadric function62.184.106.1610.99
122.454.416.8011.56
Nearest neighbor-3.089.548.2415.54
Publisher’s Note: MDPI stays neutral with regard to jurisdictional claims in published maps and institutional affiliations.

