Article

DGANet: A Dilated Graph Attention-Based Network for Local Feature Extraction on 3D Point Clouds

1
Key Laboratory of Geological and Evaluation of Ministry of Education, China University of Geosciences, Wuhan 430074, China
2
Department of Geography and Information Engineering, China University of Geosciences, Wuhan 430074, China
3
National Engineering Research Center of Geographic Information System, Wuhan 430074, China
*
Author to whom correspondence should be addressed.
Remote Sens. 2021, 13(17), 3484; https://doi.org/10.3390/rs13173484
Submission received: 1 August 2021 / Revised: 31 August 2021 / Accepted: 1 September 2021 / Published: 2 September 2021

Abstract

:
Feature extraction on point clouds is an essential task when analyzing and processing point clouds of 3D scenes. However, there still remains a challenge to adequately exploit local fine-grained features on point cloud data due to its irregular and unordered structure in a 3D space. To alleviate this problem, a Dilated Graph Attention-based Network (DGANet) with a certain feature for learning ability is proposed. Specifically, we first build a local dilated graph-like region for each input point to establish the long-range spatial correlation towards its corresponding neighbors, which allows the proposed network to access a wider range of geometric information of local points with their long-range dependencies. Moreover, by integrating the dilated graph attention module (DGAM) implemented by a novel offset–attention mechanism, the proposed network promises to highlight the differing importance on each edge of the constructed local graph to uniquely learn the discrepancy feature of geometric attributes between the connected point pairs. Finally, all the learned edge attention features are further aggregated, allowing the most significant geometric feature representation of local regions by the graph–attention pooling to fully extract local detailed features for each point. The validation experiments using two challenging benchmark datasets demonstrate the effectiveness and powerful generation ability of our proposed DGANet in both 3D object classification and segmentation tasks.

Graphical Abstract

1. Introduction

Accurate and real-time geographic information plays a critical role in the research of remote sensing. With the rapid development of remote sensing technology and equipment upgrades, the classical 2D spatial data represented by maps and images has failed to meet the needs of people’s cognition of realistic 3D space and geological research. In particular, the representative active 3D acquisition system, such as mobile laser scanning (MLS), has the advantages of quickly acquiring real-time and high-precision ground information [1] and modeling the geometric structure of terrestrial objects in the form of 3D lidar point cloud data. It is noteworthy that 3D point cloud data provides a simple and intuitive geometric representation of 3D objects, which has become one of the most common data sources in the field of remote sensing and has been increasingly applied in a wide variety of real-world applications [2], such as 3D city modeling [3], forestry monitoring [4], and land cover and land use mapping [5]. Currently, due to the insufficient automatic potential mining of 3D point cloud data, the practical application of 3D point cloud data is immature and lacks corresponding theory and methods. Thus, many researchers are granting more attention to 3D point cloud analysis and processing; the local feature extraction on 3D point clouds has become the key and difficult point in this field. Since it is expensive and laborious to interpret point clouds of 3D scenes based on handcrafted features extracted by manually designed algorithms, there has been a promising way to automatically extract features on point clouds by using deep-learning-based methods. However, point clouds are sparsely and unevenly distributed in 3D scenes, and different scanned objects in the same scene are usually irregular in shape and size and may suffer serious incompletion caused by the scanning angles or occlusion. As such, these objective factors will complicate the local feature extraction of point clouds. Therefore, it is still a challenge to extract local, high-quality features from 3D point cloud data.
In recent years, deep-learning-based methods have achieved automatic and efficient feature extraction on point clouds with their advances in feature learning and the capacity for parameter sharing [6], which have shown extraordinary performance in various tasks such as 3D object classification [7,8,9] and segmentation [10,11,12]. Unlike the regular pixels in 2D images, 3D point clouds are composed of a series of unorganized points in a non-Euclidean space. Typical 2D convolution is unable to be directly operated on 3D point clouds due to its irregular and sparse structure [13]. To this end, PointNet [14] takes the lead work in directly processing original point clouds. It applies the Multi-Layer Perceptron (MLP) and the simple symmetric function on each point to extract global features, but it neglects to capture the local structural features to enhance the local feature representation of point clouds. The following PointNet++ [15] improved the architecture of PointNet by constructing a hierarchical neural network with a series of sampling and grouping operations on point clouds to extract both global and local features. However, whether it is PointNet++ or other later PointNet-based networks, it is noteworthy that the feature aggregation, which aims to capture the global feature on the local region, is normally implemented by the max-pooling operation as shown in Figure 1a. This only focuses on capturing the most important features among neighbors and fails to consider the other geometric local correlations between the central point and its neighbors in the local region. With the successful application of deep learning to non-Euclidean data processing, graph convolution network (GCN) [16] has attracted much more attention in recent years. Motivated by the design of the graph-based structure, Dynamic Graph CNN (DGCNN) [17] constructs a graph-like region for each point and introduces a new point convolution module dubbed EdgeConv to aggregate neighboring features in local graphs. It does this by concatenating the features of the central node with its corresponding edge features, followed by the max-pooling operation as shown in Figure 1b. Although the DGCNN realizes the utilization of the relationship between the central point and its neighbors and guarantees each corresponding neighborhood point associated with the central point, the final feature aggregation on a local graph is also achieved by a simple max-pooling operation. This aggregates the detailed information on a relatively small range of local regions, thus limiting the network to access more fine-grained local features.
In addition, as we know, adjacent points belonging to the same category possess similar characteristics in the local region of point clouds, and such similarity between them will become closer as their spatial distance shrinks. This kind of geometric peculiarity is one of the most distinguishable characteristics of point clouds. Hence, researching how to expand the range of the receptive information of each point by considering its spatial–geometric relation towards neighbors is key to helping the network model capture more local features of each point in the local region. However, most deep-learning-based methods [14,15,16,17] mentioned above are unable to efficiently leverage the spatial dependencies between points making the network to conduct the local feature extraction with a larger receptive field. Moreover, the differences of spatial–geometric features between each point and its corresponding neighbors also need to be taken into account when extracting the local detailed feature on point clouds.
To address the above problems, we propose a Dilated Graph Attention-based Network (DGANet) for local feature extraction on point clouds. The key idea of DGANet is using a designed dilated graph-like structure to construct a local region for each point and applying a novel offset–attention mechanism to the local feature extraction on point clouds. Specifically, we construct a local dilated graph for each point and design a dilated graph attention module (DGAM). By embedding a novel offset–attention mechanism, the DGAM is able to learn more local features of point clouds with their long-range dependency and capture the most useful local geometric details of each point across other long-range neighbors by using the attention pooling as shown in Figure 1c. These strategies enlarge the range of the receptive information of each point and enrich the local feature information, thus allowing the final aggregated features to better represent the local region of point clouds. In our experiments, the proposed DGANet achieves state-of-the-art performance on two challenging point cloud datasets, including ModelNet40 [7] for 3D object classification and ShapeNet part [18] for part segmentation. The key contributions of our work are summarized as follows:
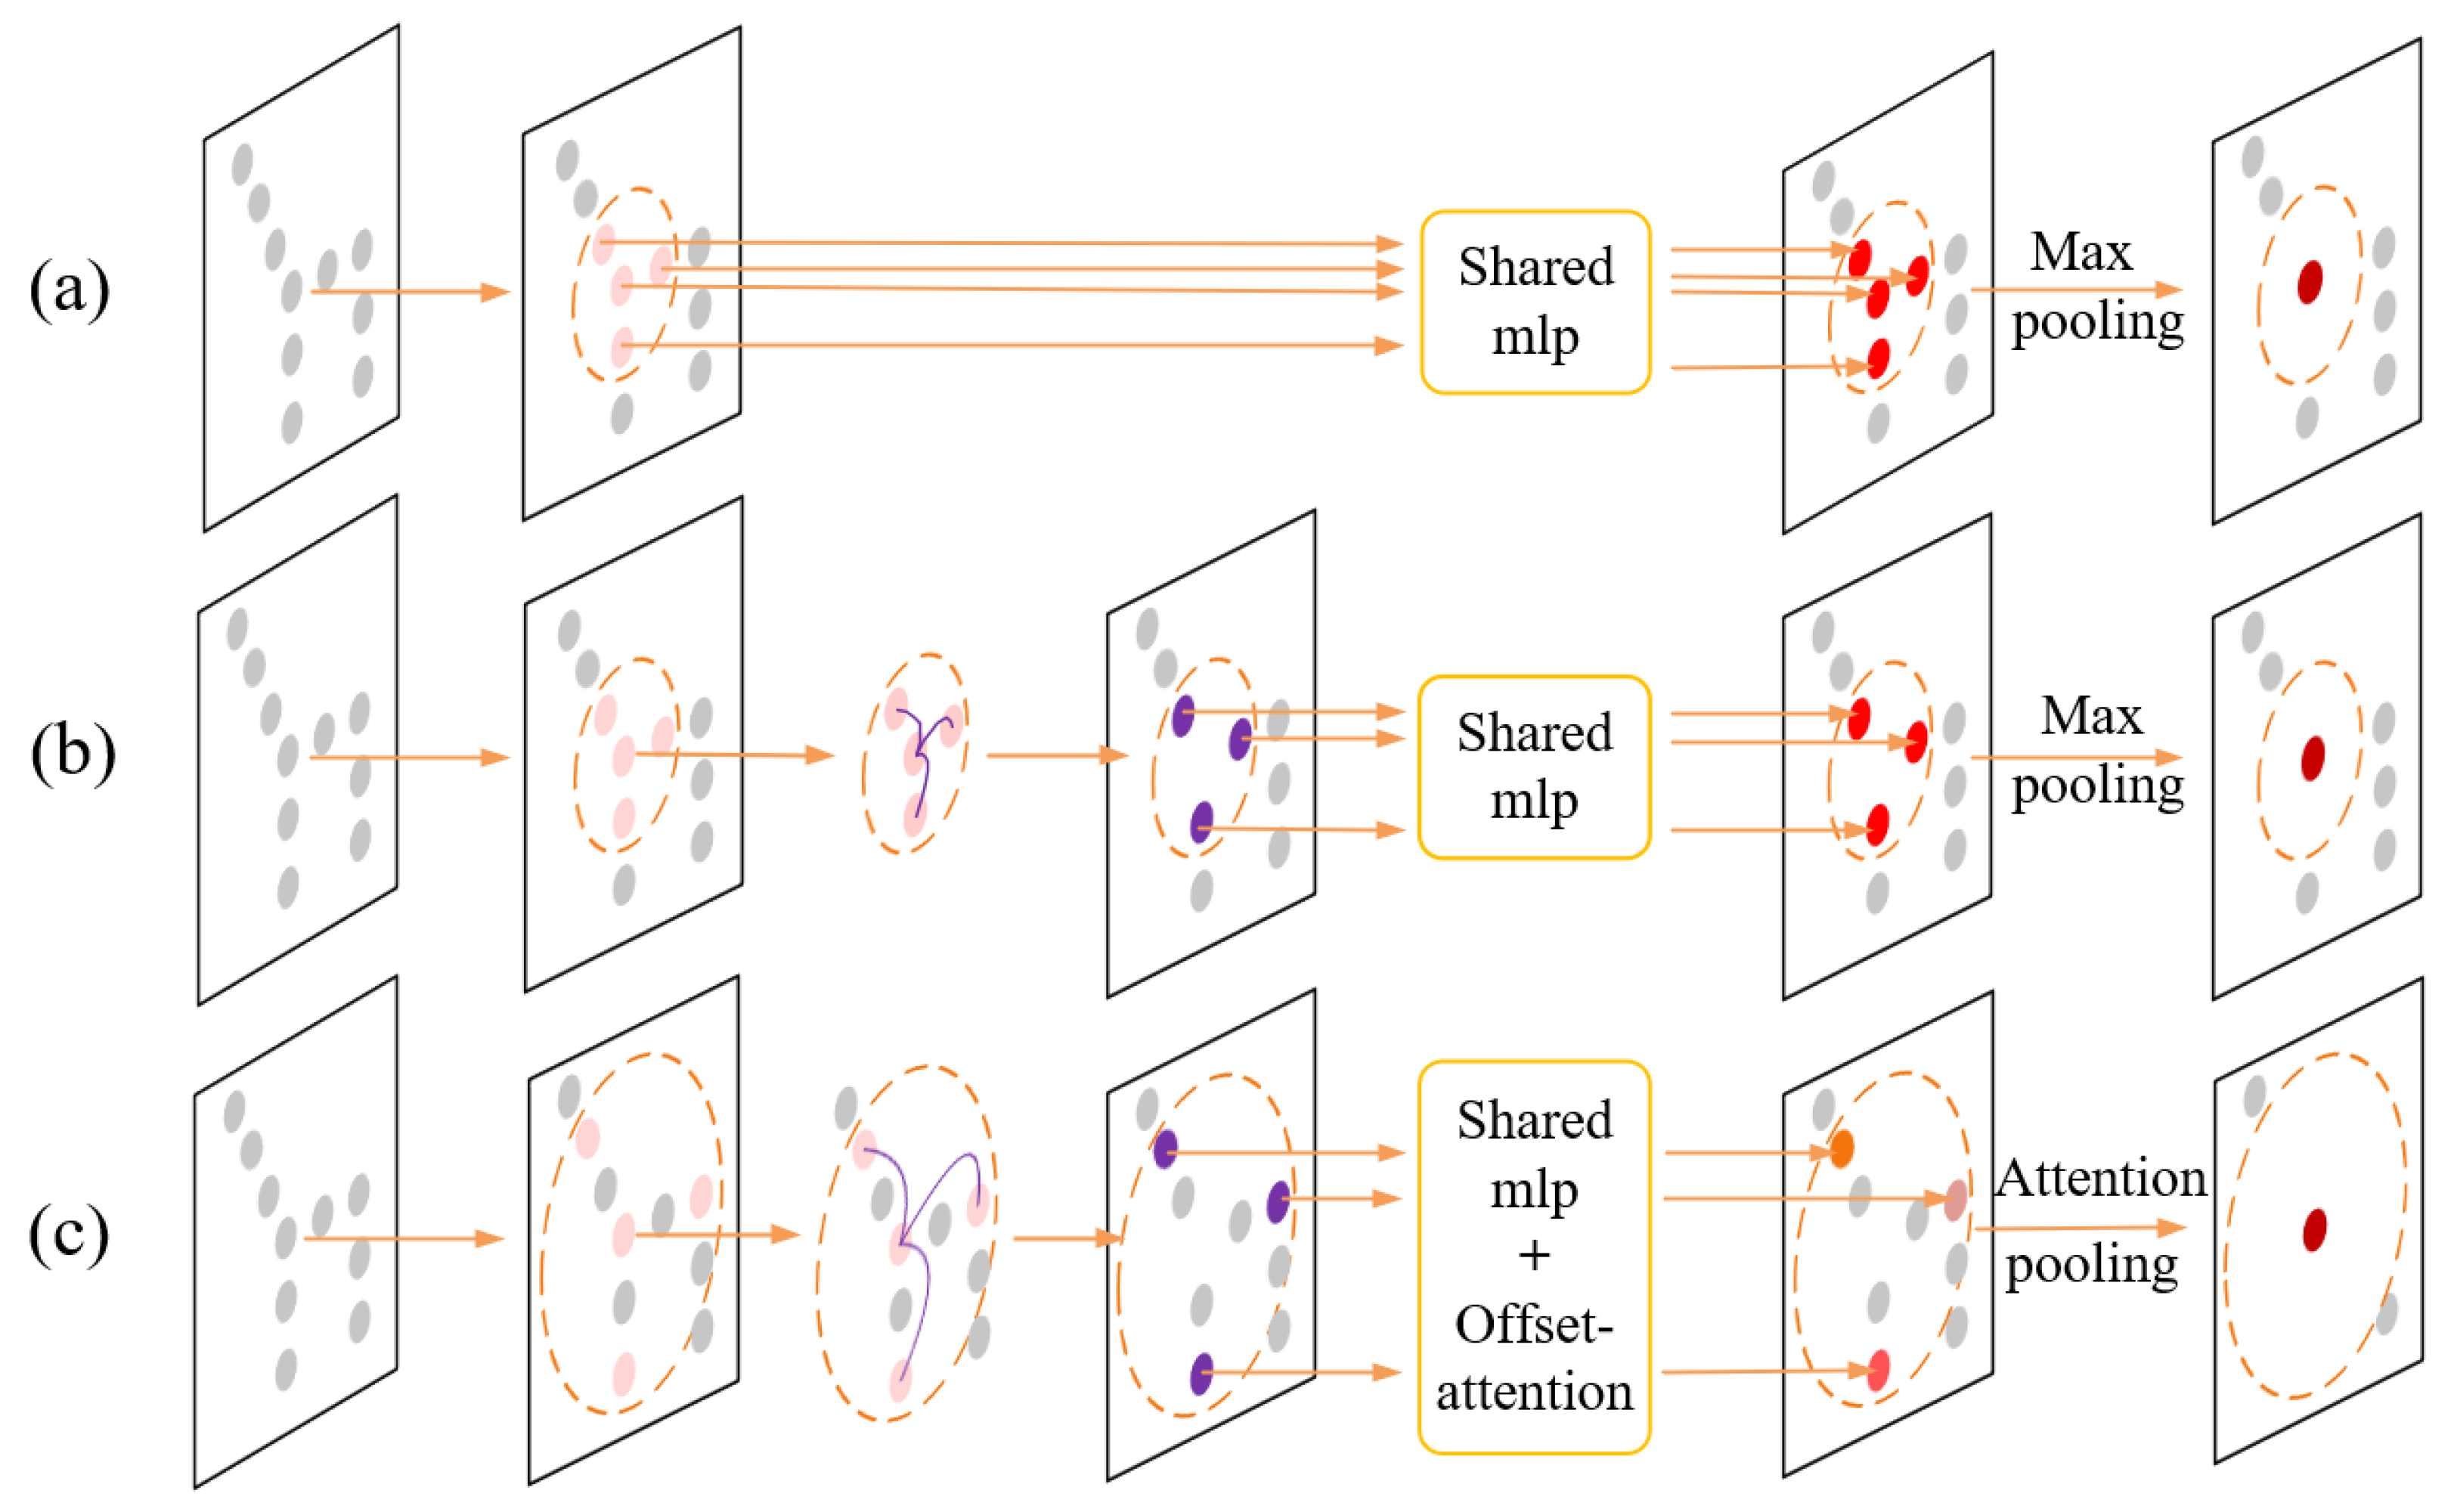
  • We utilize an improved k-nearest neighbor (K-NN) search algorithm to construct a local dilated graph for each point, which models the long-range geometric correlation between each point and its neighbors to help the point neural network learn more local features of each point with a larger receptive field when conducting the convolution operation.
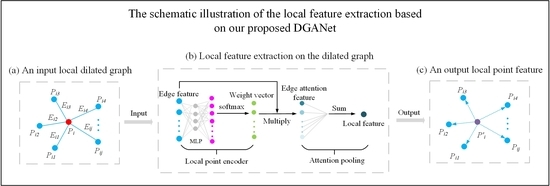
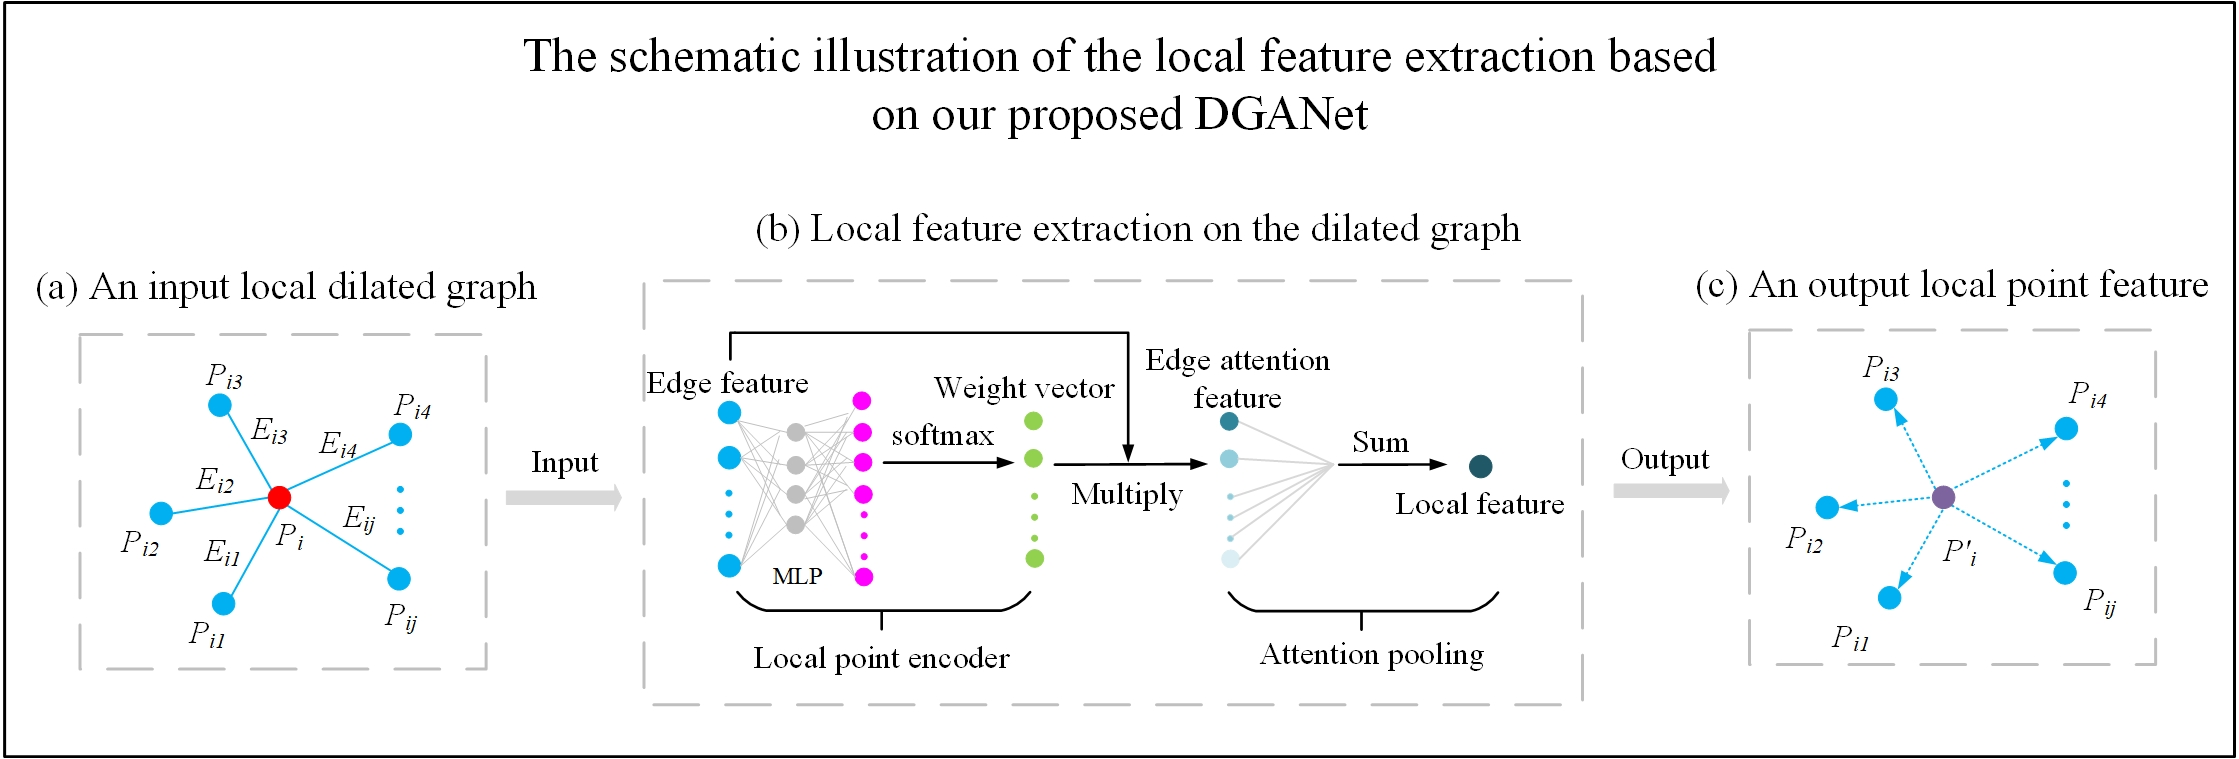
  • We embed an offset–attention mechanism into a designed module called dilated graph attention module (DGAM), which can dynamically learn local discriminative attention features on the constructed dilated graph-like data, and employ a graph attention pooling to aggregate the most significant features and better capture the local geometric details of each point.
  • We propose a novel DGANet for local feature extraction on point clouds and carry out extensive experiments on two competitive benchmark datasets. The experimental results demonstrate that our method achieves considerable performance and outperforms several existing state-of-the-art methods in both 3D object classification and segmentation tasks.
The remainder of this paper is organized as follows: Section 2 describes previous related works. Section 3 introduces an overview of the proposed method and illustrates the difference between our method and other existing methods. Section 4 presents the experiments and the comprehensive discussion of results, as well as the corresponding ablation studies. Section 5 draws the conclusion.

2. Related Work

Recent deep-learning-based methods for extracting features from point clouds can be roughly divided into the following five categories: projection-based methods, voxel-based methods, point-based methods, graph-based methods, and attention-based methods.

2.1. Projection-Based Methods

Projection-based methods [19,20,21] project or flatten 3D point clouds into a collection of 2D views so that the standard convolution used in 2D CNNs can be applied to the converted data for feature extraction. Kalogerakis et al. propose a deep network for part segmentation of 3D shapes by employing a novel projective layer to aggregate output features from multiple views [22]. Le et al. introduce a view pooling procedure to aggregate the extracted features generated by the CNNs across each view for 3D mesh segmentation [23]. Nevertheless, these methods inevitably cause geometric information loss during the projection.

2.2. Voxel-Based Methods

Alternatively, point clouds can be presented as regular 3D volumetric grids [24,25] so that the 3D convolution can be utilized as the same as 2D convolution. VoxNet [12] convert the point clouds into volumetric occupancy grids which can be processed by the 3D CNNs to predict categories of objects. However, it usually consumes a large amount of memory and requires high computational resources to apply the 3D convolution on such sparely-occupied volumetric grids for a high-resolution output. To reduce the computational consumption of sparse voxel grids, Hůlková et al. ingeniously transform 3D point clouds into 2D raster images to efficiently reduce the computational time of the 3D point clouds classification for highway documentation [26]. Kd-Tree [27] and Octree [28] are used, respectively, to construct two efficient partition structures for the alternative representations of point clouds but they rely on the subdivisions of volumetric grids rather than the geometric structure of point clouds.

2.3. Point-Based Methods

Encouraged by the PointNet [14] and PointNet++ [15], many recent approaches construct powerful reasoning modules for the feature extraction of each point. PointCNN [29] introduces a X-convolution to weight and permutes the input point clouds for local feature learning. PointConv [30] applies a kernelized density estimation to the 3D convolution on point clouds. It is worth noting that the above point-based methods often use the simple max-pooling operation to capture the most critical part of local features. Although this kind of symmetric operation guarantees the permutation–invariance of point clouds, the geometric correlation between the reference point and its neighbors within the local region are ignored.

2.4. Graph-Based Methods

Unlike the point-based methods, instead of directly utilizing a discrete point as input, graph-based methods construct a graph-like local region for each point and then feed the graph data into a designed network. PointGCN [31] builds a local graph for each point based on its k nearest neighbors and utilizes global pooling and multi-resolution pooling to exploit global and local features. RGCNN [32] constructs the graph for each point by concentrating all nearby points and integrating a graph–signal smoothness into the loss function to regularize the feature learning process. DGCNN [17] designs a graph-based convolution, namely EdgeCov, which allows the network to learn the geometric information for local feature extraction by dynamically updating the graph. In the constructed graph, the edges between the points are calculated for building the topology of the graph. However, it is still challenging to efficiently extract local features on the diverse graph topologies of point cloud data.

2.5. Attention-Based Methods

Recently, the attention mechanism has drawn much attention in deep learning, especially in computer vision, as it allows the neural network to focus on the important parts of input data and facilitates critical feature learning to improve the performance of networks. Thus, some researchers are attempting to apply the attention mechanism in point cloud analysis and processing tasks. Liang et al. [33] propose an attention-based K-NN module to aggregate neighboring information for each point. Wang et al. [34] design an attention-based convolution kernel to adapt to the various structures of local graphs for feature extraction on point clouds. Feng et al. [35] introduce a local attention–edge convolution (LAE-Conv) to learn the neighboring features on the local graph which then feeds the learned edge features to a point-wise spatial attention module to capture global dependencies in the feature dimension. Although the attention mechanism has been proved efficient in the above attention-based methods, they fail to consider the geometric discrepancy between each point and its long-range neighbors in the feature dimension for capturing local detailed features.
The aforementioned methods have a common limitation that they are unable to exploit local, fine-grained features by utilizing the long-range geometric information between points and inherent discrepancies between point features. To fill this gap, we propose a novel point neural network (DGANet) that sufficiently captures local detailed features by embedding a novel offset–attention mechanism into the designed DGAM that considers the long-range dependency and geometric difference between each connected point pair within the constructed local dilated graph.

3. Methods

In this section, we first present the general framework of our proposed network model for the 3D object classification and segmentation tasks. Next, we introduce the spatial transformation embedding used to solve the transformation–invariance problem by applying a learnable 3 × 3 transformation matrix to the 3D coordinates of each input point. Then, we show the details of the local dilated graph which establishes the long-range geometric correlations between each point and its neighborhood points. Finally, we illustrate the designed DGAM aimed at efficiently learning fine-grained features of the constructed local dilated graph built from the transformed point cloud set.

3.1. Network Architecture

Our proposed DGANet network can be applied to various point cloud analysis and processing tasks, including 3D object classification and segmentation. As shown in Figure 2, the architecture of DGANet incorporates the encoder part, the classification part, and the segmentation part, respectively. Each block in the figure represents a feature with size of N × C, where N represents the number of the output points and C represents the number of output feature channels of each point, and different colors represent different kinds of point features.
The encoder part aims to realize the semantic encoding of point features by transforming input points into a higher dimensional feature space, which enables the network to learn the local features on point clouds for the subsequent classification and segmentation tasks. The encoder part starts by transforming the input point coordinates (x, y, z) into the point feature (N × 3), where N is the number of input points and 3 is the number of feature dimensions, and then the input points are successively fed into a spatial transformation embedding and three stacked, dilated graph attention modules, each of which produces an DGAM feature (N × C). This is followed by a shared multilayer perceptron (MLP) layer which concatenates all preceding DGAM features as inputs to generate the final output feature (N × 1024).
The classification part presented in the middle of the whole architecture is utilized to classify the input points (N × 3) into NC object categories at object-level. Firstly, the point feature (N × 1024) generated by the encoder is processed by the max-pooling operation to achieve a global feature (1 × 1024). Next, the global feature is successively fed into two shared multi-layer perceptron (MLP) layers to predict the classification score of the point cloud belonging to NC object categories. The convolutional kernel size of the two shared MLP layers are 512 and 256, respectively, and the final classification result is determined by the category with the maximal score.
The task of the segmentation part is to segment each input point into Ns object categories at the point-level, which includes the semantic segmentation and part segmentation. The repeated global feature (N × 1024) and the three combined DGAMs feature are concatenated and then fed into two shared multilayer perceptron (MLP) layers to predict the pointwise segmentation score belonging to Ns object categories. The convolutional kernel size of the two shared MLP layers are 512 and 256, respectively, and the final segmentation result is also determined by the category with the maximal score.

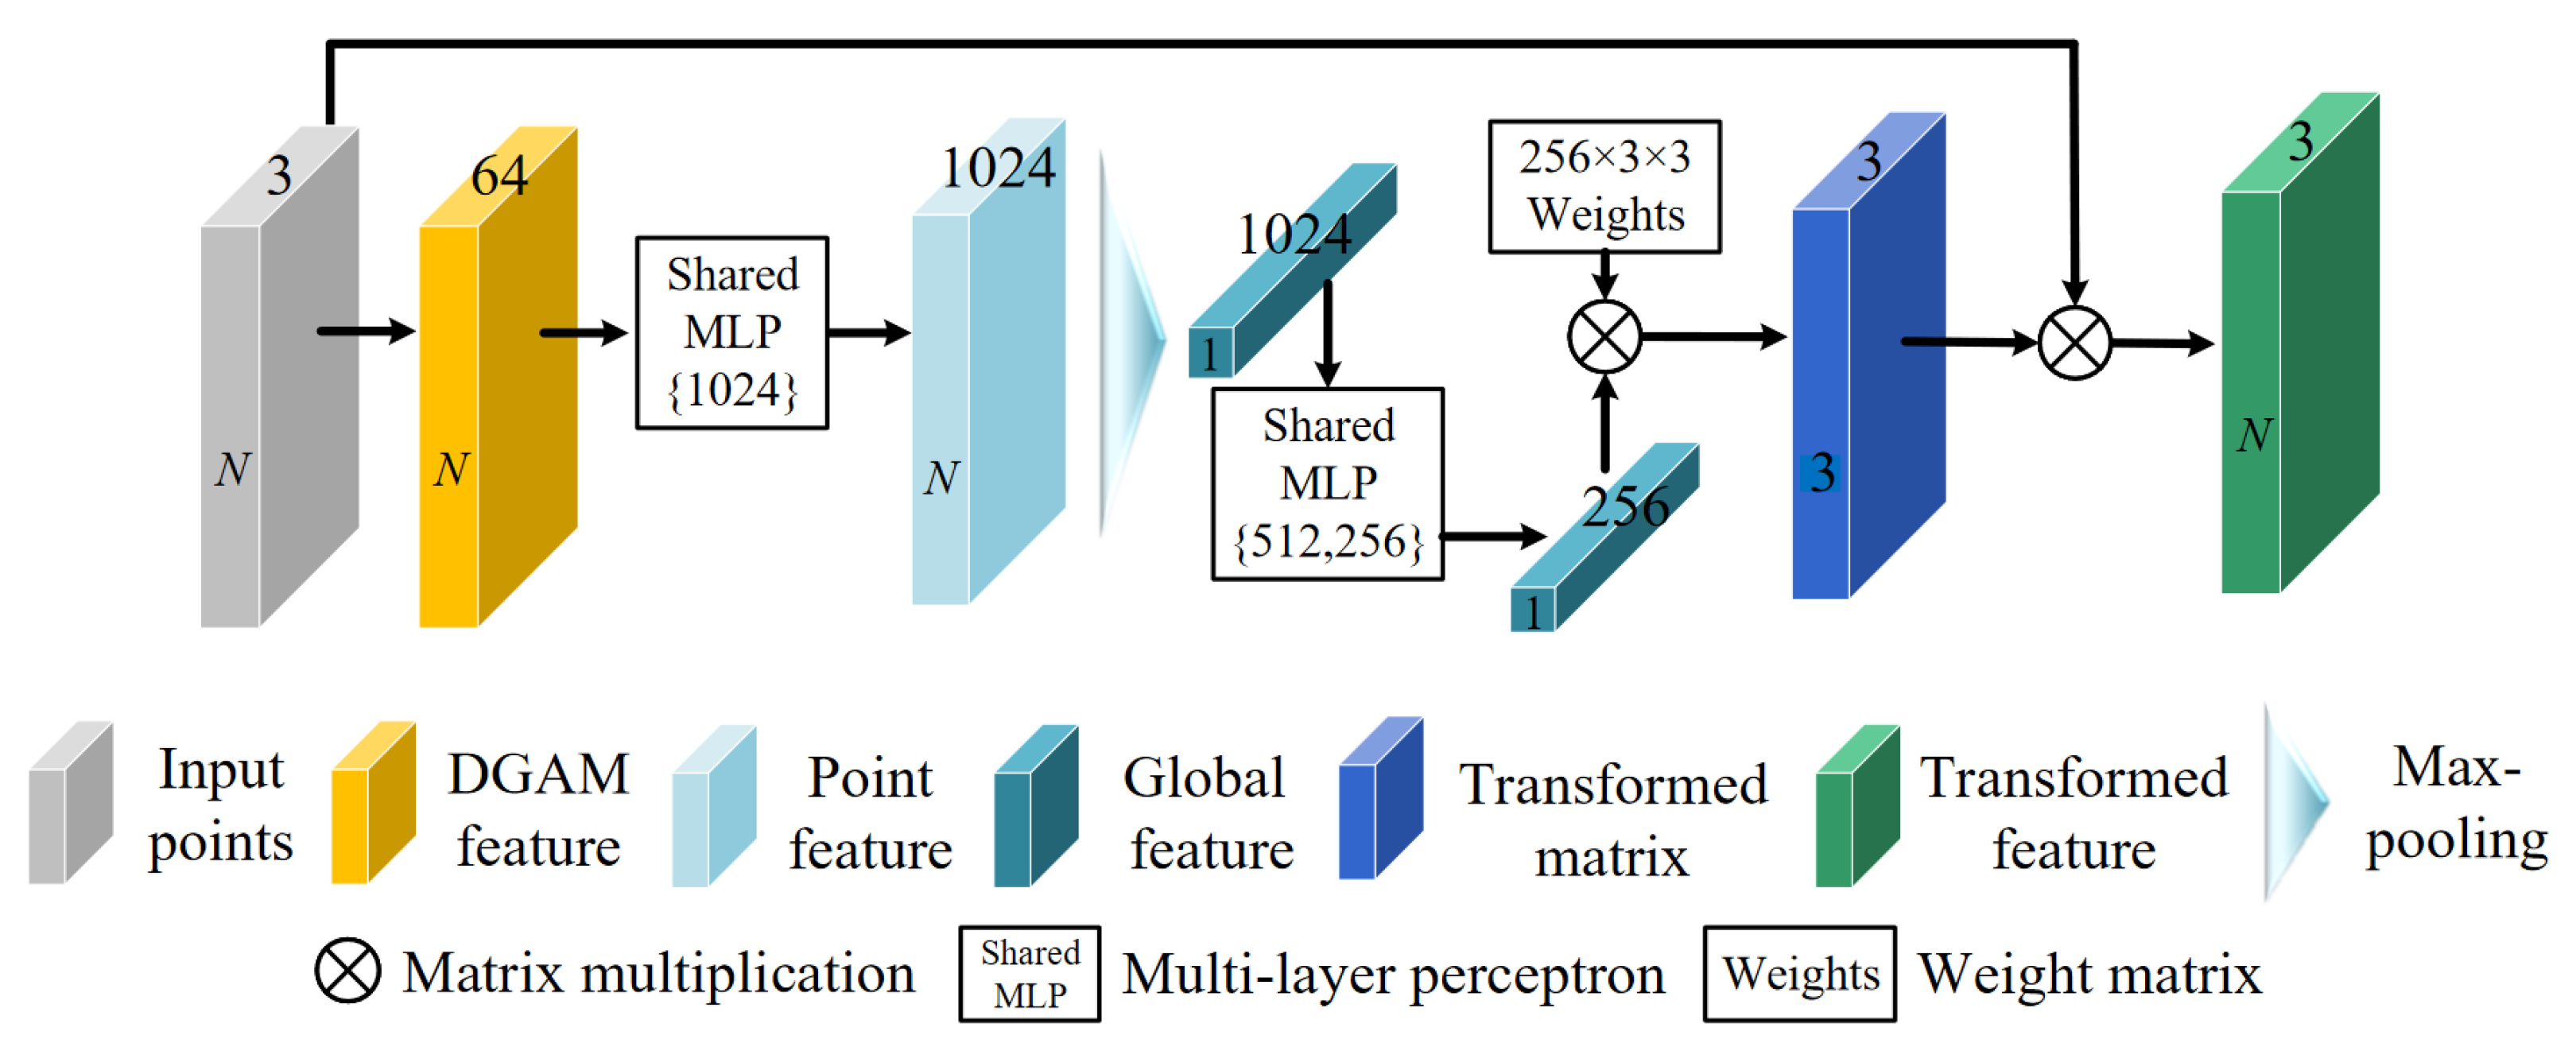
3.2. Spatial Transformation Embedding

The spatial transformation embedding presented in Figure 2 aims to help the network align the input point set in a normative space, which guarantees a vantage spatial position posture for the local feature learning. Figure 3 shows the details of the spatial transformation embedding. We first use a dilated graph module (DGAM) followed by shared MLP layers to process the input point cloud set to generate a point feature (N × 1024). We then utilize a max-pooling operation and two shared MLP layers to achieve the global feature. Finally, we employ a 3 × 3 initial weight matrix to learn the transform coefficient from the extracted global feature and multiply this with the input point set to generate the final transformed point feature (N × 3).

3.3. Local Dilated Graph Construction

The local dilated graph is an efficient geometric representation of 3D point clouds. It incorporates the idea of dilation convolution [33] on the local graph to robustly utilize the long-range points for the neighboring feature embedding of each point. As shown in Figure 4, it is different from the construction of the local graph (left) as a dilated scope rate d is introduced into the construction of the local dilated graph (right) to allow the central point to connect with its long-range neighbors. This enables the network to capture local features of each point with the long-range dependency towards its neighbors. The colored circles with labels inside represent different point clouds and each neighboring point is sorted by its distance from the central point in the graph. The construction of the local dilated graph mainly includes the following two major steps: dilated K-NN search and edge calculation.

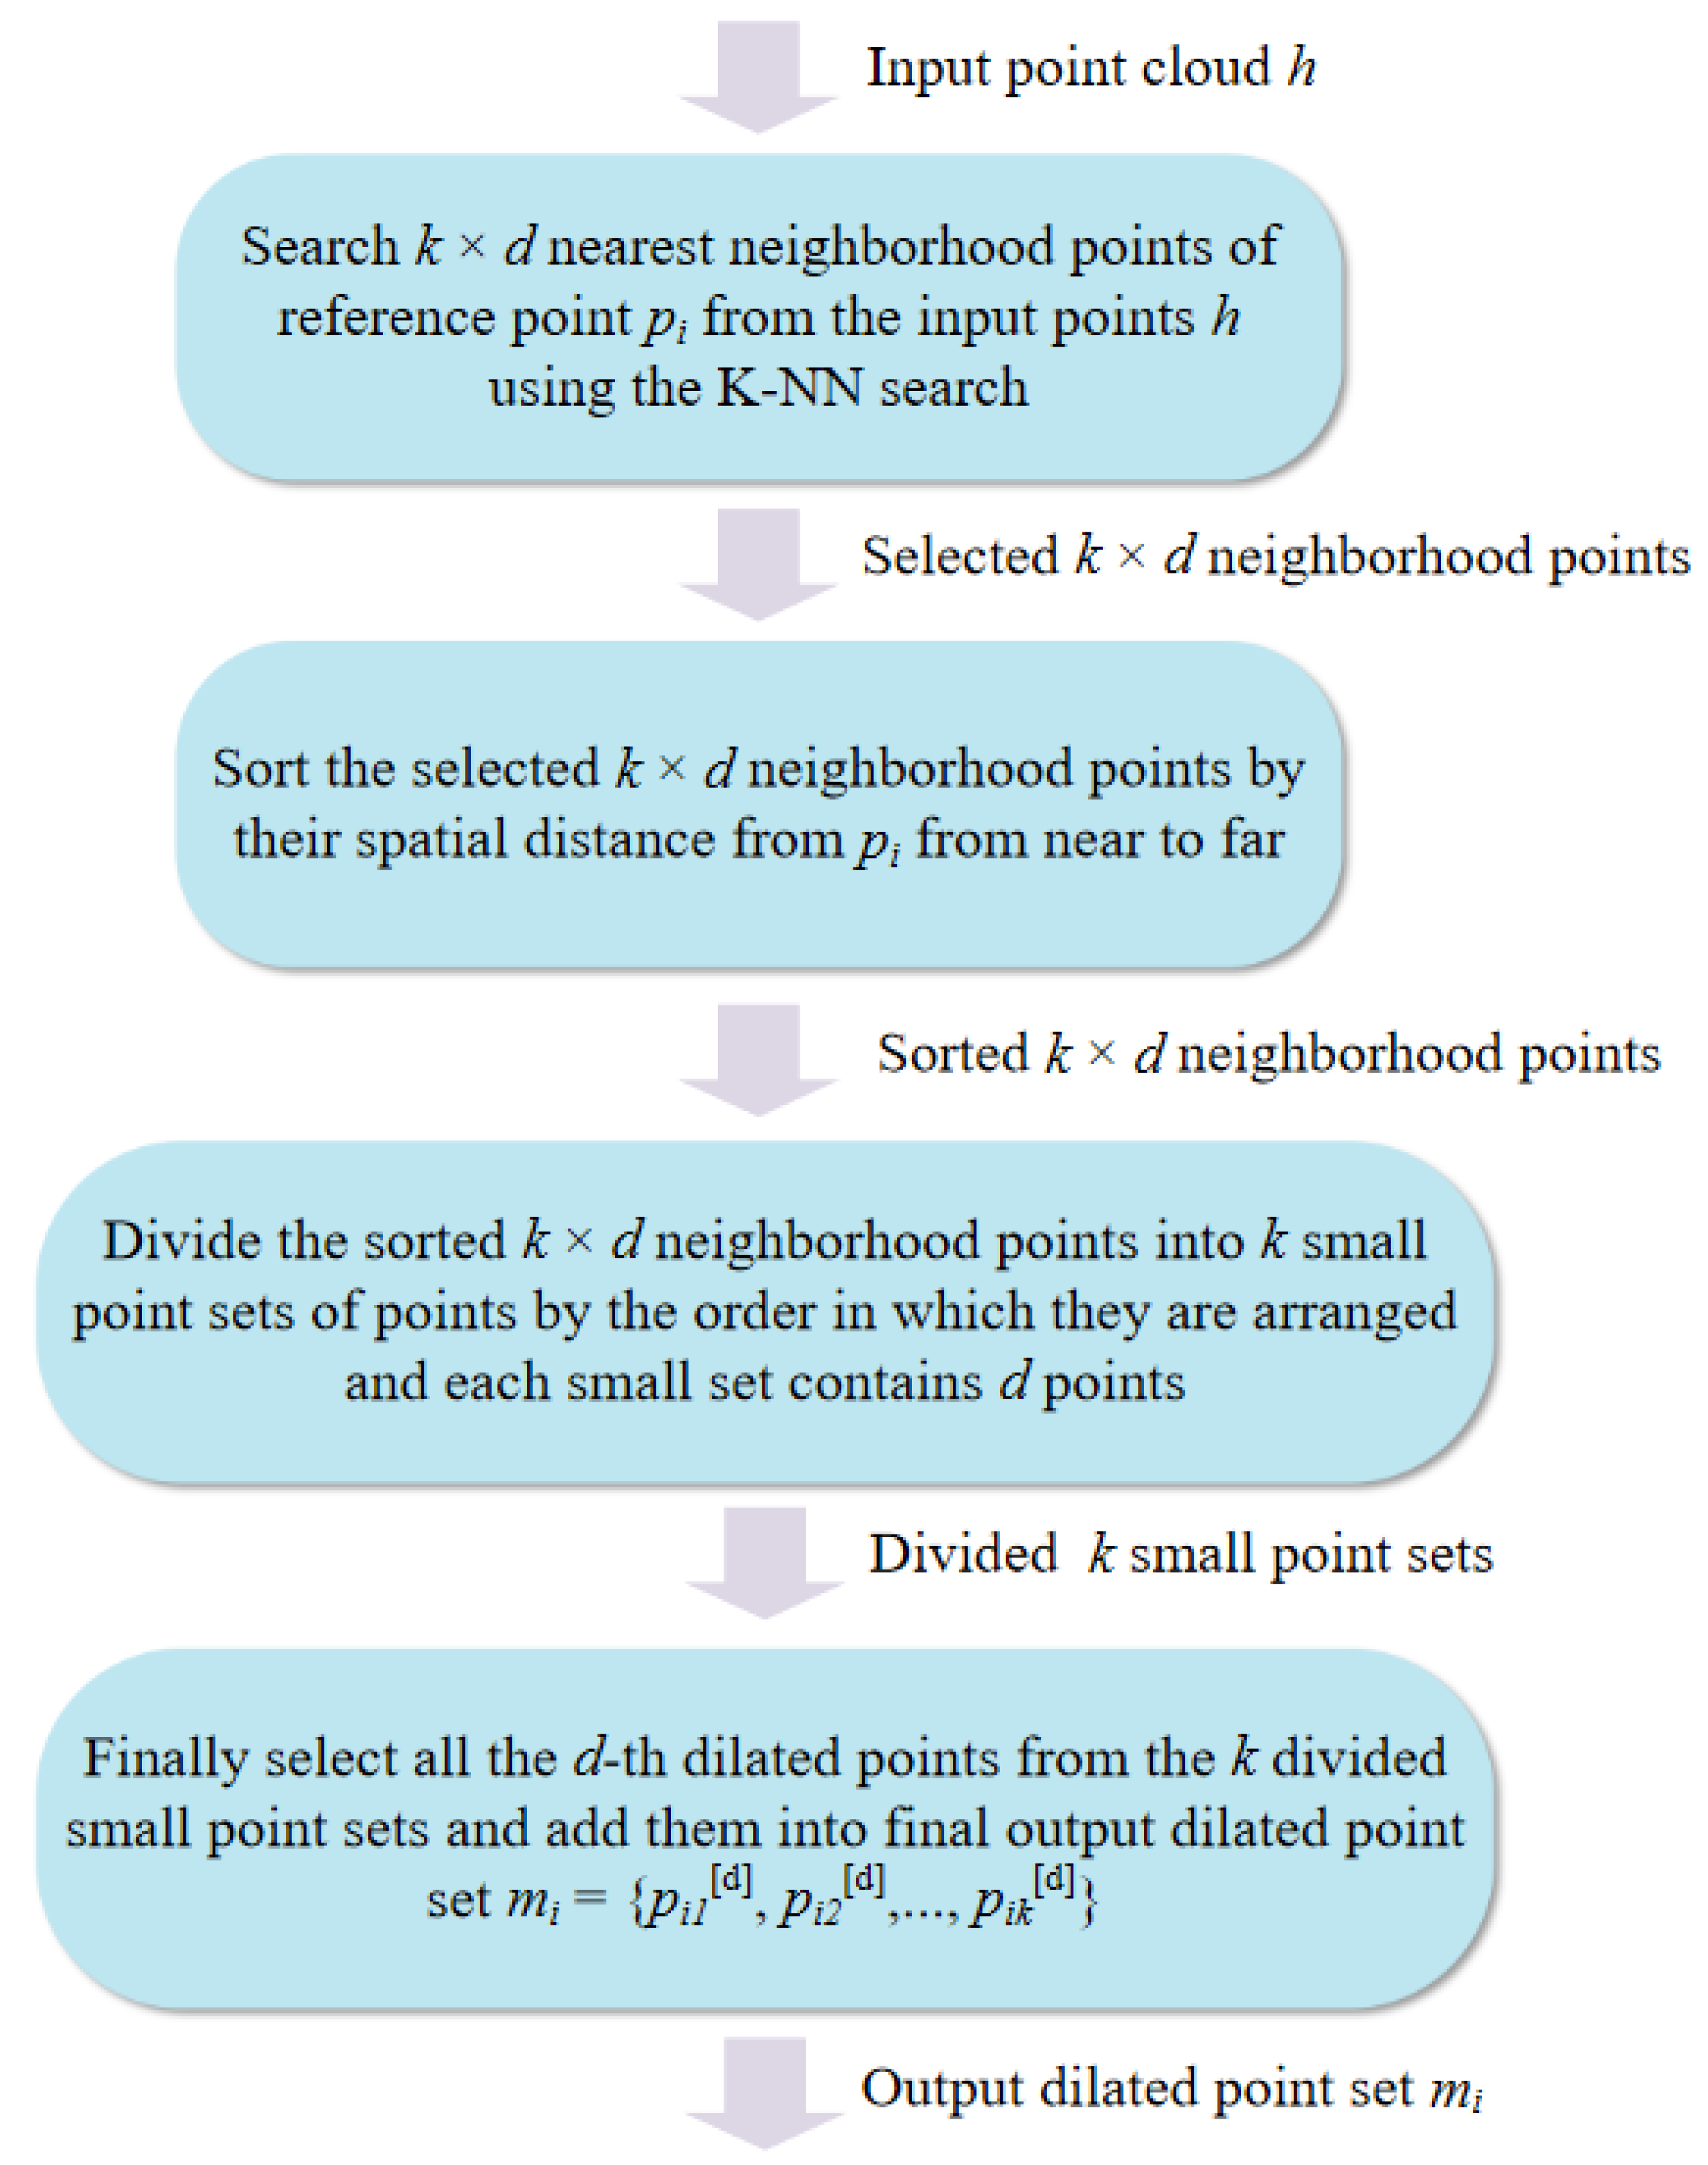
3.3.1. Dilated K-NN Search

In most graph-based methods [17,31,32,33], the K-NN is often used to search for the k-nearest neighborhood points around the central point at a limited scope for the construction of the local graph. It is incapable of integrating long-range geometric correlations in a restricted space, thus limiting the geometric representation of the local points and helping the point network capture more local features. To this end, we design a dilated K-NN search based on the K-NN and explain it in Figure 5. As shown in Figure 5, suppose the input points h = {p0, p1, ..., pn} with pi ϵ RC, where n represents the number of points and C represents the feature dimension of each point. The point pi = {xi, yi, zi} is represented by its 3D coordinates, hence the C = 3. The goal is to select k dilated points mi = {pi1[d], pi2[d], …, pik[d]} in the dilated scope d to calculate the edges of the next step.

3.3.2. Edge Calculation

Each point pi and its dilated points mi denote a local dilated graph Gd = (Vd, Ed), where Vd = {pi, mi} and Ed = {ei1[d], ei2[d], …, eik[d]}. The Vd and Ed represent a set of vertices and edges, respectively. We endeavor to construct the local dilated graph Gd of each point pi with its multi-scope neighboring points mi for the representation of geometric correlations between local point clouds. The edges of the local dilated graph can be formulated using the general mathematical operation between the central point and its dilated points in a 3D local coordinate space. Each edge in the dilated graph Gd can be calculated as follows:
e i j = ( p i j [ d ] p i )   | |   p i
where || denotes the concatenation operation, pij[d] denotes the j-th dilated point of the central point pi in the dilated scope d, and k denotes the selected number of the dilated neighborhood points. To make the edge features efficiently learnable and avoid gradient vanishing during the edge convolution, we utilize the concatenation operation to fuse the central point with the edge in feature dimension to enhance the edge feature. This inspiration comes from DGCNN [17].

3.4. Dilated Graph Attention Module

The designed DGAM is constructed to capture the local feature of the central point on the local dilated graph by attending to its neighboring points. By building the local dilated graph and embedding the offset–attention mechanism, the DGAM enables the network to establish long-range geometric correlations between each point and its neighbors and preserve more geometric information to enrich local feature representation, which is conducive to the local fine-grained feature extraction. As shown in Figure 6, each DGAM contains two shared MLP layers with output size of C’. The DGAM processes the input point feature (N × C) to generate the output aggregated feature (N × C’) through the following three major steps: the local dilated graph construction mentioned above, the dilated edge attention convolution (DEACov), and graph attention pooling (GAP).

3.4.1. Dilated Edge Attention Convolution

Given an input set of local points h = {pi, pi1, pi2, …, pik}, h ϵ RC, where pi is the central point, and other points {pi1, pi2, …, pik} are its k dilated neighbors. We consider a constructed local dilated graph Gd = (Vd, Ed) and its directed edges Ed = {ei1[d], ei2[d], …, eik[d]}. Denote F = {f1, f2, …, fn} as a set of input–edge features and each feature fi ϵ RC is associated with a corresponding graph edge, where C is the number of feature dimensions. The designed DEACov aims to learn a function g: RC → RK to transform the input–edge features into a new set of edge features F’ = {f’1, f’2, …, f’n} with f’i ϵ RK.
In order to capture fine-grained features in the local dilated graph, we embed a novel offset–attention mechanism into the DEACov to help the network focus on learning the discriminative feature between the attentional and inattentional edges.
Firstly, we calculate the attention–weight feature of each edge as follows:
α i = a ( e i j [ d ] )   j ( 1 , 2 , ,   k ) = a ( { ( p i j [ d ] p i )   | |   p i } ) j ( 1 , 2 , ,   k )
where αi = {αi1, αi2, …, αik} ϵ RK represents the attention–weight feature vector of k constructed edges of the central point, eij[d] ϵ RC represents the j-th edge of the central point, and d represents the dilated scope rate which is used to adjust the receptive field of the constructed dilated graph. ||, eij[d], pij[d] and pi are the same as mentioned above, and the mechanism a can be implemented by using a single multilayer perceptron (MLP), which can be formulated as follows:
a ( e i j [ d ] )   j ( 1 , 2 , ,   k ) = M a ( e i j [ d ] )   j ( 1 , 2 , ,   k )
where Ma: RC → RK represents the shared multilayer perceptron (shared MLP) layer which realizes the mapping of input–edge features into higher-level features. Eij[d] is same as mentioned above.
Then, to properly assign the attention weight to each edge of central point pi, we utilize the Softmax function to normalize the obtained edge attention coefficients. Each edge attention score can be normalized as follows:
α i u = e x p   ( α i u ) j = 1 k e x p   ( α i j )
where α′iu represents the attention score of each edge and αiu represents the u-th unnormalized edge–attention weight of the attentional weight vector αi.
Finally, we introduce the offset operation to calculate the offset (difference) between the attentional and inattentional edge by way of the element-wise subtraction in the feature dimension, followed by a shared MLP layer and fused with inattentional edge, the offset–attention edge can be formulated as follows:
e i u = M a ( α i u α i u   α i u ) + α i u
where + and − represent the element-wise addition and subtraction in the feature dimension, respectively, and αiu and α’iu represent the attention–weight feature of the edge eiu[d] and its corresponding attention score, respectively. Ma and * are the same as mentioned above.

3.4.2. Graph Attention Pooling

To improve the efficiency of local feature aggregation, we utilize a max-pooling operation on all edge–attention features of the constructed local dilated graph as our graph attention pooling (GAP), which identifies and aggregates the most important geometric features across all corresponding neighbors at the central point for the local feature extraction. This aggregation operation not only guarantees the permutation invariance of the unordered points, but also captures the most important geometric features with the long-range dependency between each point and its neighbors.
Therefore, the final output of our designed DEACov can be formulated as follows:
S = i = 1 N S i = i = 1 N   M a x ( e i j ) j { 1 , 2 , , k }
where S and Si represent the significant features of input local points and reference point pi, respectively, and e’ij represents the j-th enhanced edge of pi.
To further illustrate the capability of our designed DGAM, we visualize its process of local feature extraction. In Figure 7, colored points represent the different point features and the dotted circles represent the receptive field of each point in the local region. As seen from Figure 7, the DGAM is able to significantly increase the receptive field of each input point for capturing the wider range of neighboring information.

3.5. Comparison with Existing Methods

In this section, we theoretically illustrate the details of our proposed method and compare our attention point network to other state-of-the-art networks. We firstly explain how the point network extracts the local feature for the representation of local regions and then we discuss the difference between the existing methods and our proposed method.
Given an input point pi which selects k local points near it, we define the local feature function of the reference point pi as follows:
f ( p i ) = g ( { h ( p i ,   p i j ) } j ( 1 , 2 , , k ) )
where g(.) is a symmetric function, h(.) is a non-linear function, and pij is the j-th corresponding neighboring point of reference point pi.
PointNet [12] has not achieved the local feature extraction; it operates on the input points individually and captures the most significant point features by using the max-pooling operation. Hence, the local feature function can be described as follows:
f ( p i ) = m a x ( { m l p ( p i ) } j ( 1 , 2 , , k ) )
where max(.) represents the max-pooling operation and mlp(.) represents the multilayer perceptron used to learn the point feature.
Extended from the PointNet, PointNet++ [13] conducts the local feature extraction by associating each reference point pi and its corresponding neighboring point pij. Thus, the local feature function in PointNet++ can be denoted as follows:
f ( p i ) = m a x ( { m l p ( p i ,   p i j ) } j ( 1 , 2 , , k )
where max(.), mlp(.), pi, and pij are the same as mentioned above.
DGCNN [15] employs K-NN to construct an efficient graph-like region for representing the local points and processes by concatenating each reference point pi and its corresponding edge (pijpi). The local feature function can be defined as follow:
f ( p i ) = m a x ( { m l p ( p i ,   p i j p i ) } j ( 1 , 2 , , k ) )
where max(.), mlp(.), pi, and pij are the same as mentioned above.
Significantly, in the local graph constructed by the DGCNN, the contribution coefficient of each edge to the reference point is equal to 1. LAE-Cov [33] introduces the attention mechanism to properly assign neighboring edges contribution coefficients according to the spatial distance of neighbors from the reference point. The local feature function can be defined as follows:
f ( p i ) = s u m ( { α i j m l p ( p i j ) } j ( 1 , 2 , , k ) )
where sum(.) represents a pointwise summation operation, α’ij represents the attentional score of j-th edge (pijpi) of the reference point pi, and mlp(.) and pij are the same as mentioned above.
Our proposed DGANet is different from the aforementioned existing methods. The main characteristic of our proposed DGANet is reflected on two aspects. Firstly, rather than using the normal K-NN search algorithm to build the local region fed into the network, we utilize an improved dilated K-NN search algorithm to construct a local dilated graph with the consideration of long-range dependency between the reference point and its corresponding neighbors. Secondly, we introduce a novel offset–attention mechanism embedded into the designed DGAM to conduct the edge feature learning on the constructed dilated graph by considering the difference between the attentional and the inattentional edge features. Subsequently, the graph attention pooling is leveraged to aggregate all the learned edge features. This is the most important geometric feature to achieve the local fine-grained feature extraction on point clouds. Thus, the local feature function of the reference point pi in our DGANet can be defined as follows:
f ( p i ) = m a x ( { m l p 2 ( m l p 1 ( p i j p i ) α i j m l p 1 ( p i j p i ) ) + m l p 1 ( p i j p i ) } j ( 1 , 2 , , k ) )
where max(.), mlp(.), pi, and pij are the same as mentioned above.
In summary, the key differences of our method from previous works lie in the dilated K-NN search used to establish the long-range correlation between each point and its neighbors and the offset–attention mechanism introduced to focus on the geometric difference between two connected points and their long-range dependency.

4. Experiments

In this section, we carry out extensive experiments to evaluate the proposed DGANet on two challenging benchmark datasets for various tasks, including 3D object classification and part segmentation. We then discuss the results and conduct ablation studies of network variations and different hyper-parameter settings as well as compare the performance of our network with respect to existing state-of-the-art methods.

4.1. Classification on the ModelNet40 Dataset

4.1.1. Dataset

The ModelNet40 [7] dataset is a classical point benchmark which contains 12,311 meshed CAD models manually annotated with semantic point labels from 40 categories including airplane, car, desk, and so on. The dataset was divided into 9843 models used for training and 2468 models used for testing. To keep the consistency of the input data for the network training, each model was normalized in a unit sphere space and uniformly sampled into 1024 points from the mesh surface. It is worth noting that we only use the coordinates (x, y, z) of input points; other original point attributes are abandoned. During the stage of network training, we augmented the input data by randomly rotating and scaling, as well as jittering, the point location.

4.1.2. Task and Metrics

To verify the effectiveness of our proposed DGANet on the ModelNet40 dataset for the 3D object classification task, we select the classification part of the DGANet as a classification sub-network to carry out the extensive experiments in a consistent environment and we choose several classical point classification methods to compare with our proposed method. The classification performance of tested methods is quantitatively evaluated with the following metrics: mean per-class accuracy (mA) and overall accuracy (OA). Furthermore, the number of network parameters and the floating-point operations (FLOPs) are typically selected to quantify the space complexity and time complexity of our method with other compared methods. The metrics of mean per-class accuracy (mA) and overall accuracy (OA) can be calculated as follows:
m A = i = 1 c m A i N c ,     m A i = N ( T P ) i N i
O A = i = 1 n N ( T P ) i N T
where mAi represents the mean accuracy of the category i, N(TP)i and Ni represent the number of 3D meshed models that correctly classified into category i and the number of 3D meshed models belonging to category i, respectively, and Nc and NT represent the number of categories and number of total 3D meshed models, respectively.

4.1.3. Implementation Details

Our proposed network was implemented on the open Tensorflow framework and trained on the NVIDIA GTX2080Ti GPU. During the training stage, we used the classification part of our proposed framework as illustrated in Figure 7. The model was optimized by the Adam [36] algorithm with the momentum set to 0.9, the batch size set to 16, and the learning rate initially set to 0.001 and decayed every 200 k steps with a decay rate of 0.7. It took 250 epochs to train our classification sub-network and we chose the trained model with the best score of overall accuracy.

4.1.4. Results and Discussion

The quantitative evaluations of the ModelNet40 dataset are shown in Table 1. Our proposed DGANet with the powerful ability for local feature learning obtains the considerable score in mA (89.4%) and OA (92.3%), which are 3.7% and 3.5% improvements, respectively, compared with that of the PointNet. It demonstrates higher overall accuracy for tested CAD models, with approximately half of the parameters of the PointNet, and outperforms the DGCNN by 0.4% for overall accuracy with fewer computational costs. It also outperformed most of the compared methods as well, demonstrating that our proposed method has achieved the best overall performance in the classification task considering accuracy and complexity among the compared state-of-the art methods.
We can observe from Table 1 that the compared 3DShapeNet obtains a relatively worse result. This is due to the limitation of the voxel grid method which loses detailed information when representing 3D models. Meanwhile, the voxel-based methods like VoxNet, Kc-Net, and Kd-Net also suffer the same problem and will also consume extra computational resources when conducting the convolution calculation on the empty voxel grid. It is noteworthy that the SpiderCNN achieves the highest score in OA (92.4%) due to its multi-scale hierarchical architecture and designed SpiderConv operation. The satisfying results that our network has achieved mainly owe to the following factors. To begin with, we use an improved K-NN search algorithm to expand the construction range of the local graph for each point. Compared with the normal K-NN employed by the DGCNN, the dilated K-NN enables the network to learn more local discriminative geometric features of each point with a larger receipt field on the constructed graph-like local region. Additionally, the designed dilated graph attention module (DGAM) is efficient in attaching different importance to the discrepancy features between each point and its neighboring points. Specifically, we use a novel offset–attention mechanism to explore the geometric feature difference between the central point and its corresponding edges on the local dilated graph, thus allowing the network to distinguish the category of each point with the help of the learned edge attention features. Finally, we utilize graph attention pooling to aggregate the most significant learned edge features from neighboring points to better exploit the details of local regions of point clouds. In fact, our graph attention pooling considers all the local neighborhood features by aggregating the attention-weighted features of neighbors as the most significant local feature for each input point. As a result, our network shows a powerful ability to fully extract local fine-grained features and yields a considerable classification result compared to other developed state-of-the-art methods.

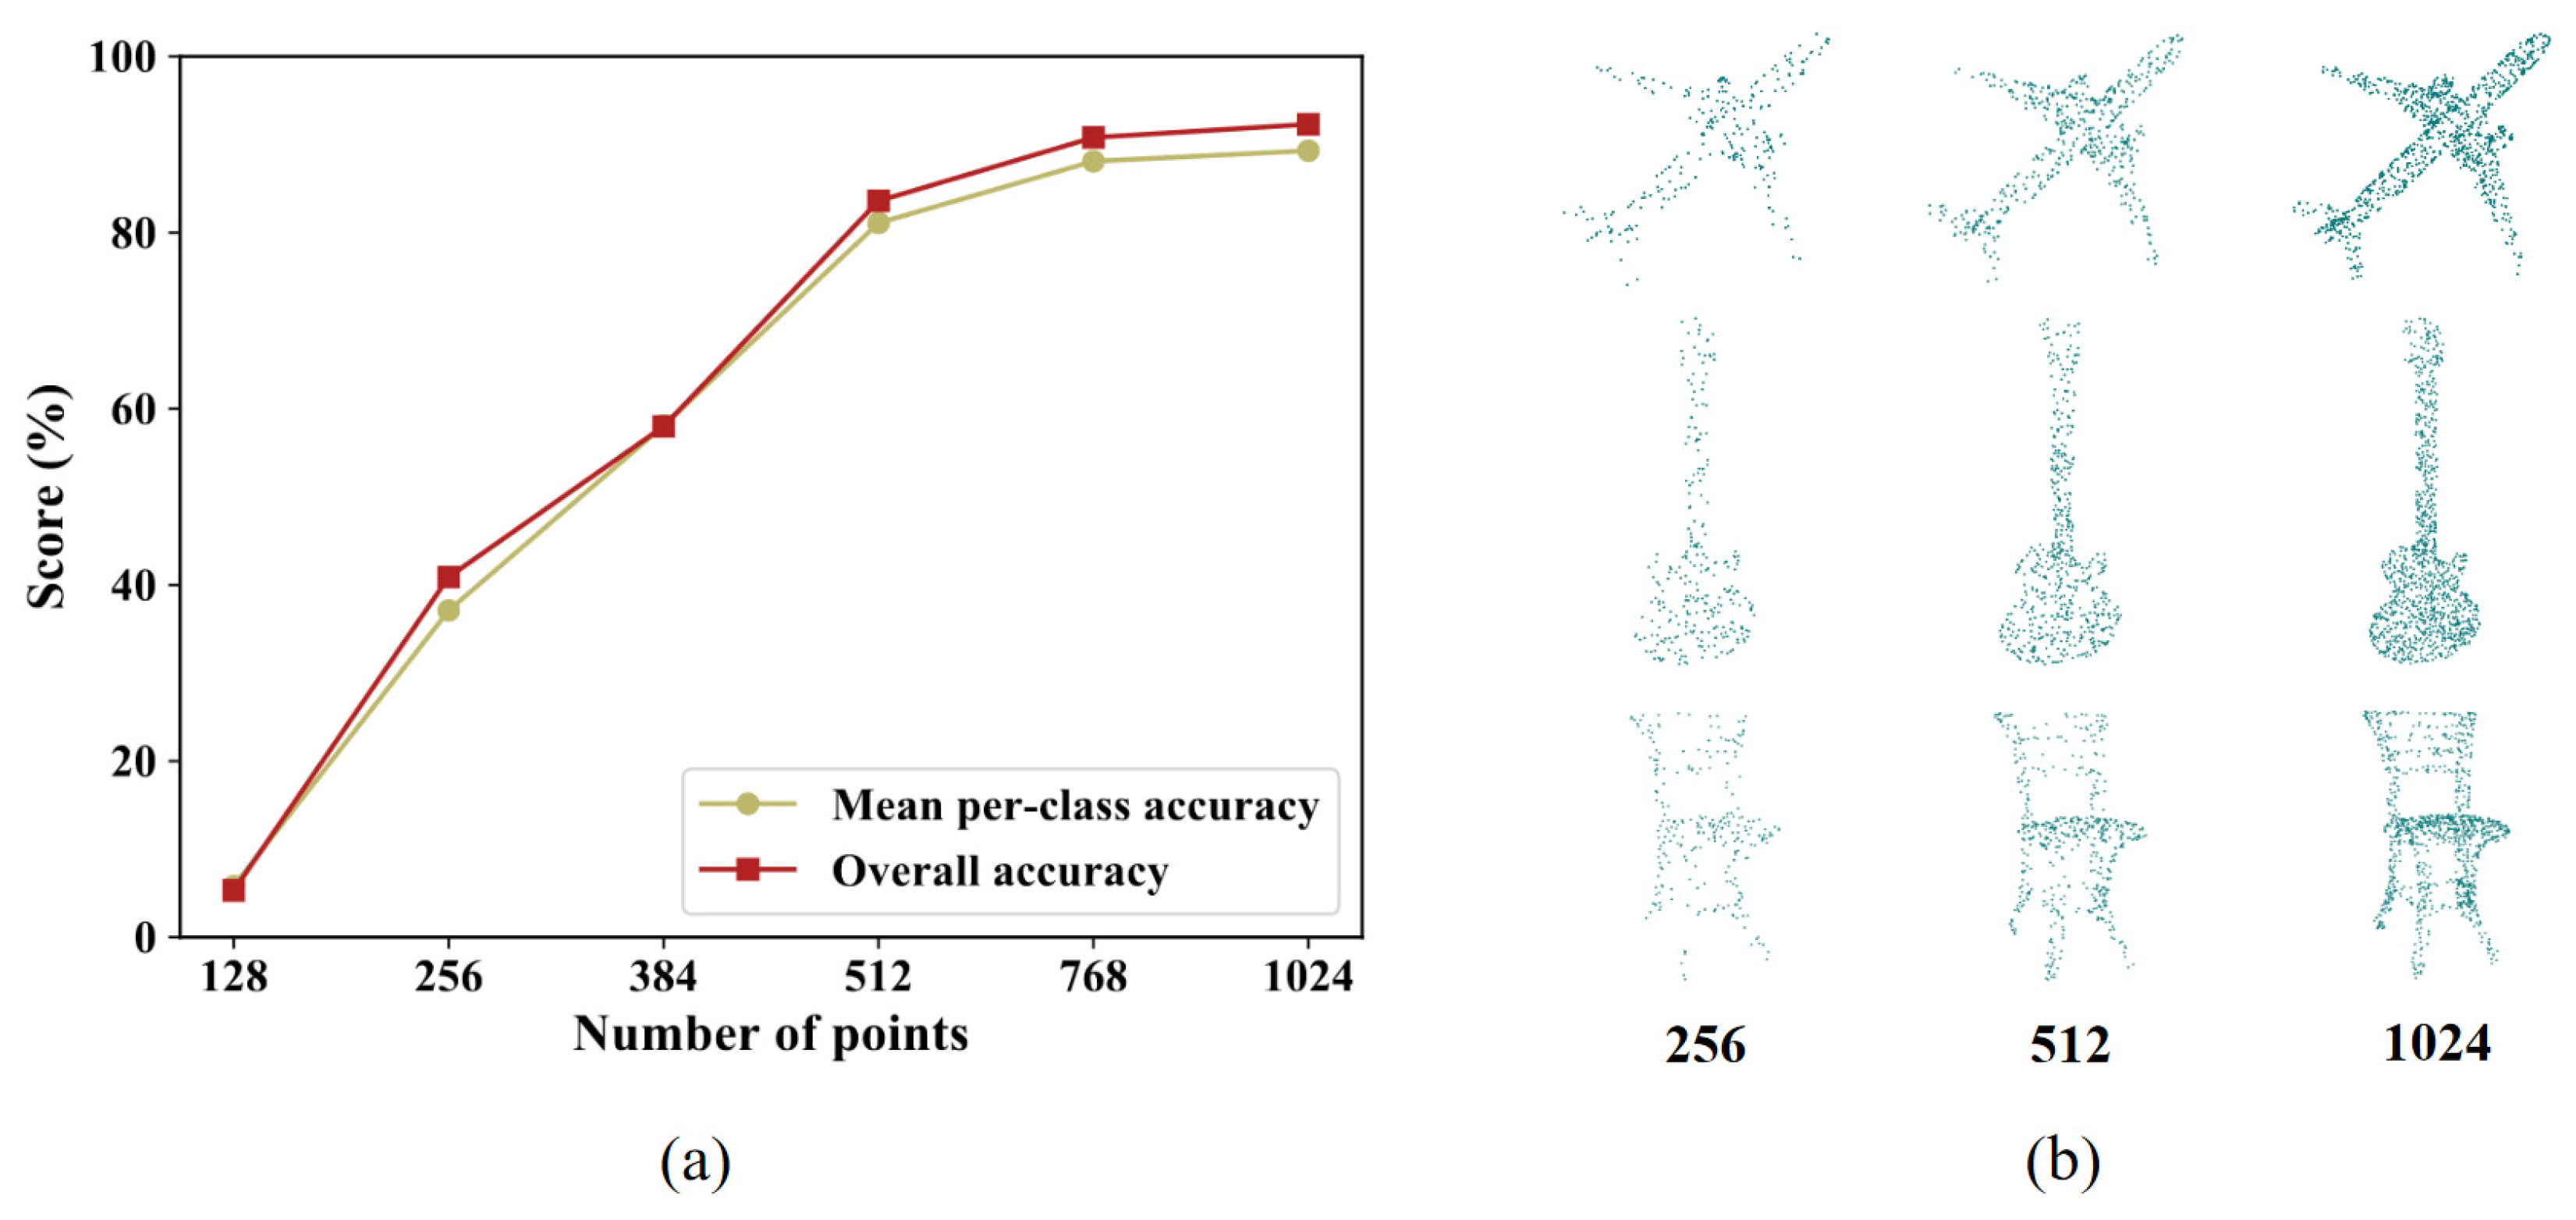
4.1.5. Ablation Studies and Analysis

To further investigate the effectiveness of our proposed method, we conduct supplemental ablation experiments with different hyper-parameter settings on our classification sub-network on the ModelNet40 dataset.
Firstly, we experiment with different numbers of nearest neighbors, k, and dilated scope rates, d. Limited by the GPU memory, we do not experiment with all possible k and d. During the training model, we uniformly set the number of input points to 1024 and set the batch size to 16 when k is 20 and 8 when k is 30. The other training parameter settings are consistent with the above experiment.
Table 2 shows the quantitative evaluation of the classification results. We can observe that the score of the OA presents a trend of increasing first and then decreasing with the increase in k and d. Our proposed classification sub-network achieves the highest score of 89.4% on mA and 92.3% on OA, respectively, when k = 20 and d = 2. Thus, we set the k to 20 and d to 2 in the following ablation experiments.
We note that when constructing a local graph of point clouds with a small number of neighbors (k of 10) and a dilated scope rate (d of 1), our proposed network fails to extract sufficient local detailed point features from a small receptive field of convolution operation on the constructed graph-like data. In addition, setting k to 10 and d to 5 makes learning useful local features from a large receptive field difficult for the network, thus causing a lower score on mA and OA. Furthermore, compared with the normal K-NN search method, when the number of neighbors is set to 10, we also observe that the dilated K-NN, which establishes the long-range correction between the reference point and its dilated neighbors, enlarges the receptive field of the network and promotes the local feature learning on a certain range of local regions. This therefore helps the network capture more useful, detailed information and achieve higher scores of mA and OA. Significantly, excessive k or d values will lead to a decrease in the performance of the network due to the introduction of redundant, useless point features when constructing the local graph for each point. Hence, an appropriate setting of k and d is particularly important in the performance of the point neural network.
In addition, we further verify the robustness of our classification sub-network by changing the number of input points during testing. Our network was trained on 1024 points with the number of neighbors, k, at 20. After model training, we used the trained network model to predict test samples with random input dropout.
As illustrated in Figure 8, within 1024 input points, we can observe that the denser the input points, the better the performance of our network. Even with half of the input points, our network still performs stably and robustly. When the number of input points are reduced to less than 512, the performance of our network degenerates dramatically due to the lack of neighboring feature embedding for each input point. Simultaneously, our network obtains considerable overall performance. This is because of the dilated graph-like region we construct for each input point and the novel attention mechanism we embed that our network uses to capture more significant features of local points to boost the performance of the network as the input points decrease. In addition, with respect to the other hyper-parameter setting of the network architecture, such as the dimensionality of the output feature vectors, we set the number of the output feature dimension of our graph attention pooling operation to 1024, which is actually a symmetrical function like the max-pooling operation used in the compared PointNet [14] and DGCNN [17]. This aims to preserve more point features from the unordered input point set and thus efficiently overcome the permutation invariance problem of 3D point cloud data and improve the performance of network.

4.2. Part Segmentation on the ShapeNet Part Dataset

4.2.1. Dataset

The ShapeNet part [18] dataset is a richly annotated, large-scale dataset of 3D shapes collected by Stanford University et al. It provides semantic category labels for the parts of models, index number of each model, as well as other planned annotations. The dataset is composed of 16,881 CAD models from 16 categories. Each shaped model is annotated with 50-part classes and labeled with less than 6 parts. We divided the dataset into 14,007 models used for training and 2847 models for testing, and uniformly sampled 2048 points from each training model.

4.2.2. Task and Metrics

To validate the impact of our proposed DGANet on the ShapeNet part dataset for the part segmentation task, we take the segmentation part of the DGANet as a segmentation sub-network to conduct the experiments in a consistent environment. Several mainstream segmentation methods are typically selected to make a comparison with our proposed method. The part segmentation performance is evaluated with the part-average Intersection-over-Union (pIoU) and overall accuracy (OA). The metric of the overall accuracy (OA) is calculated the same as mentioned above, and the part-average Intersection-over-Union (pIoU) can be calculated as follows:
p I o U = i = 1 c I o U i N c ,           I o U i = N ( T P ) i N ( T P ) i + N ( F P ) i + N ( F N ) i
where IoUi represents the averaged IoUs for all parts that fall into the same category I, N(TP)i represents the number of 3D models belonging to the category i and the parts of each 3D model that are correctly classified into their corresponding part categories, N(FP)i represents the number of 3D models belonging to category i and the wrong parts of each 3D model that are wrongly classified into correct part categories, N(FN)i represents the number of 3D models belonging to category i and the correct parts of each 3D model that are wrongly classified into wrong part categories, and Nc represents the number of categories for all 3D models.

4.2.3. Implementation Details

For the part segmentation task, the training process of our semantic segmentation sub-network is similar to the process in the above classification task except for the network used for the semantic segmentation. The number of neighbors is set to 20 and the dilated d set to 2, the learning rate decays every 300 k with a decay rate of 0.7, and the batch size is set to 8 due to GPU memory-size limitations. Finally, it took approximately 150 epochs to cover our semantic segmentation network.

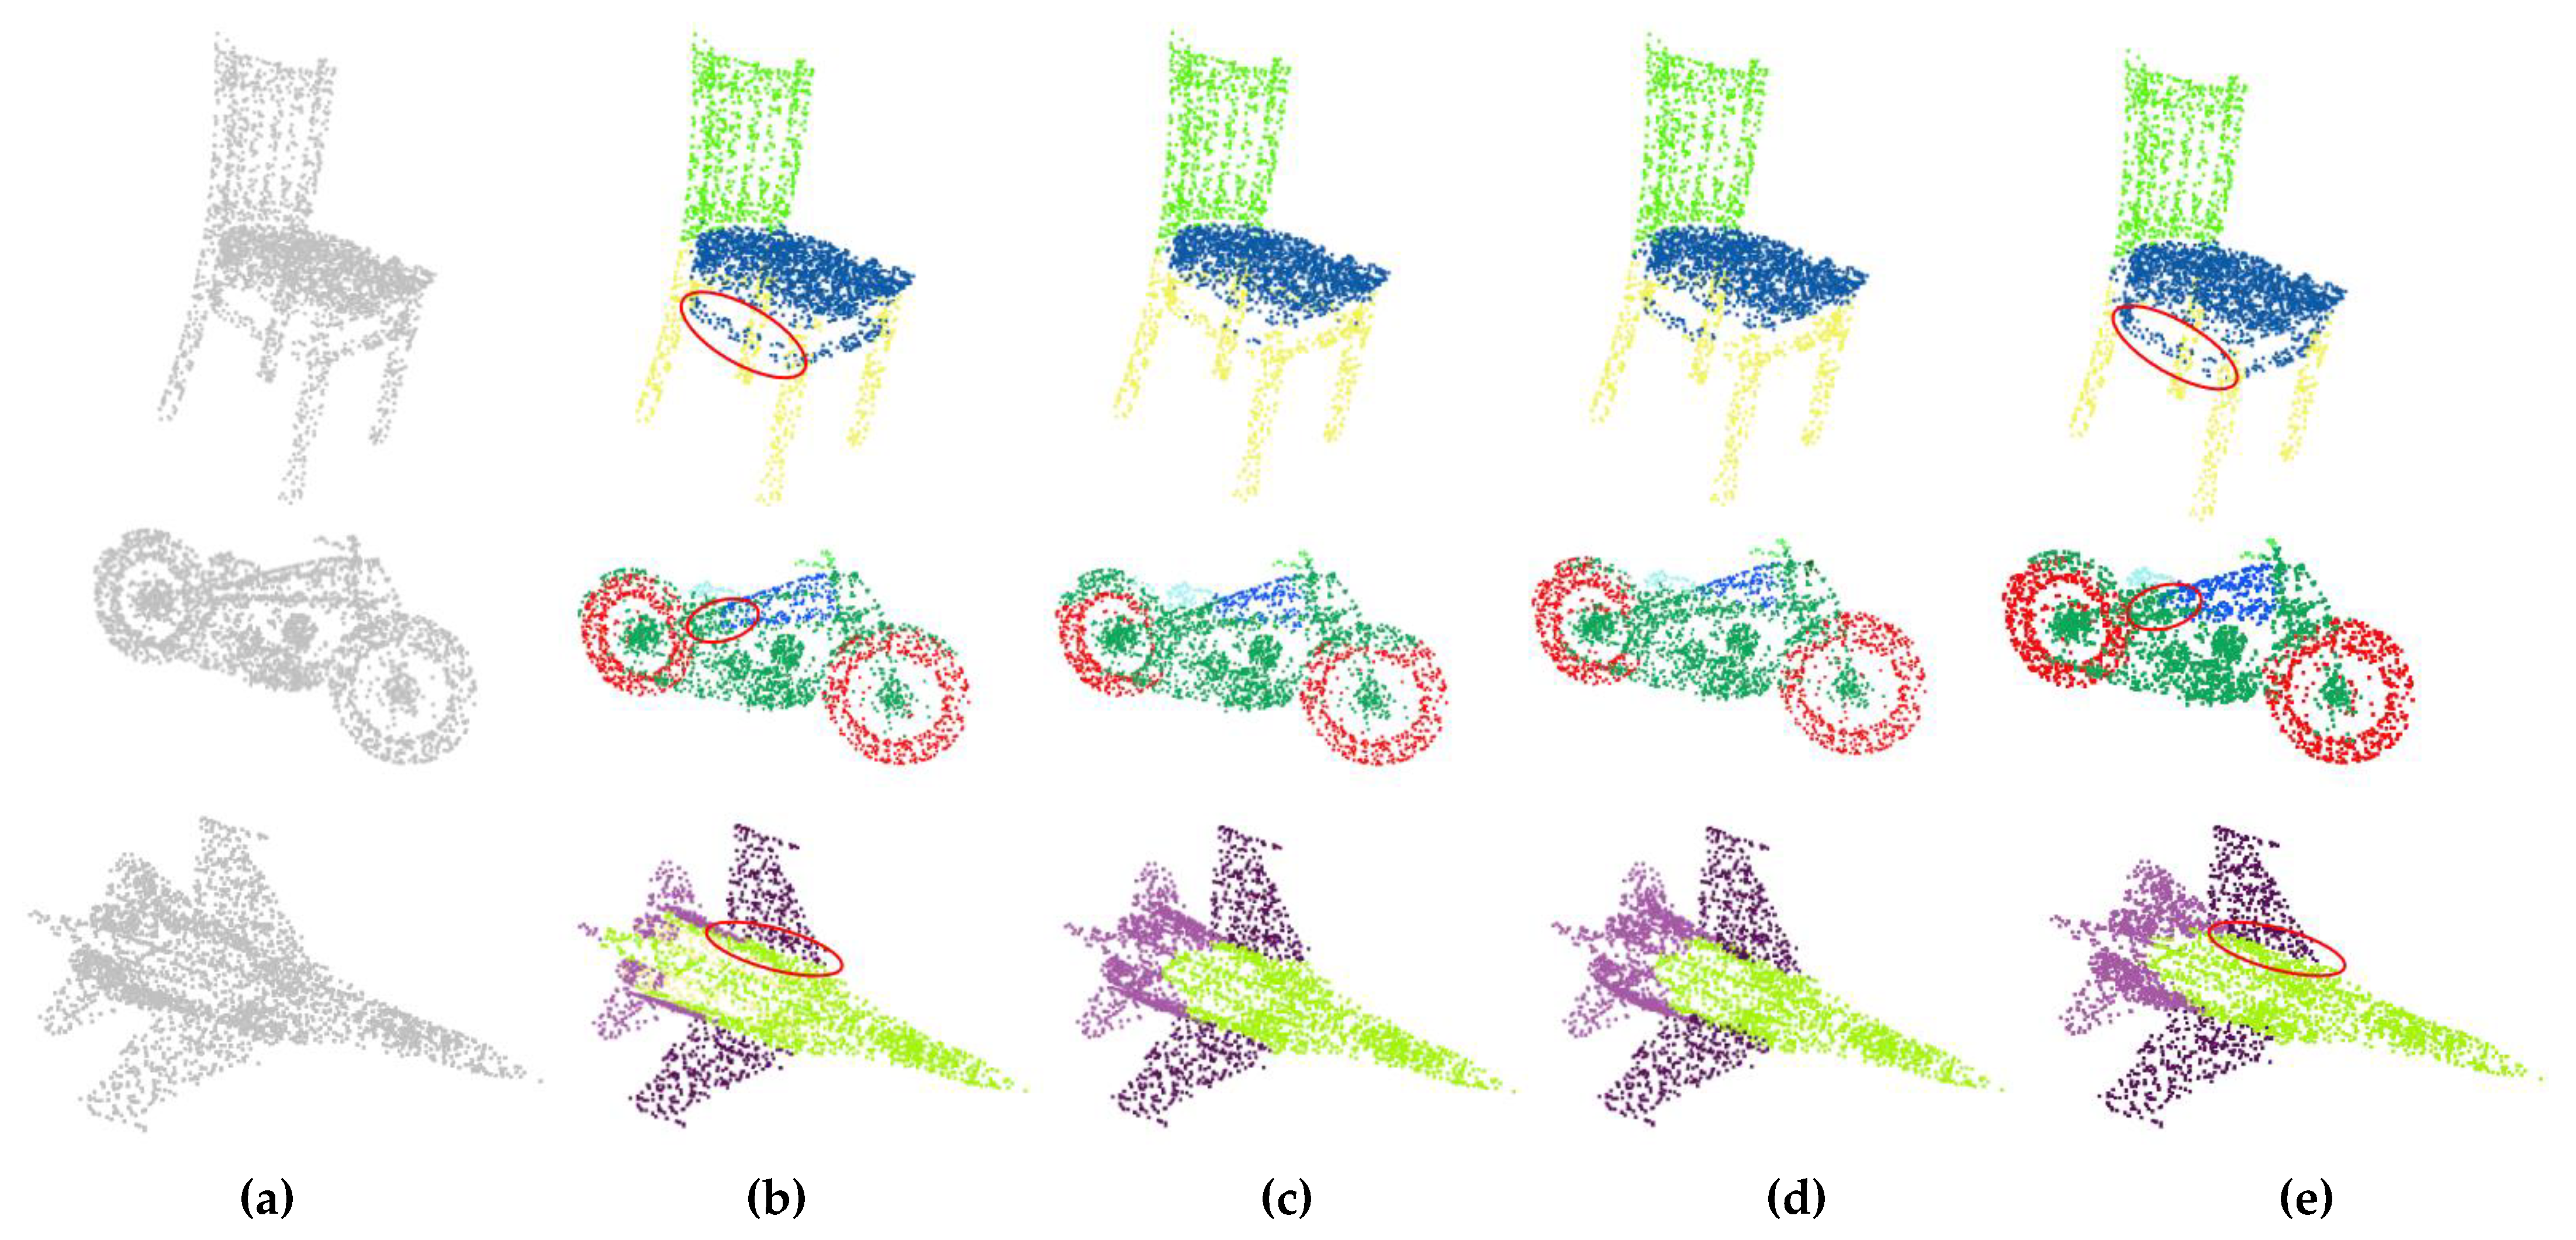
4.2.4. Results and Discussion

Table 3 shows the quantitative comparisons of different part segmentation networks. As seen in Table 3, our network obtains a considerable score in pIoU (85.2%), which reaches the approximate performance of other compared state-of-the-art methods. The experimental results demonstrate that our proposed method has the capacity to fully capture the local fine-grained features for the part segmentation of 3D objects. In fact, our network and the SPGN obtain the best scores in most of the categories for part–segmentation compared to the PointNet and DGCNN. SpiderCNN has no best score in any category, although the part–average IoU is slightly higher than our network. It is also worth mentioning that SPGN obtains the best performance in part segmentation tasks due to the introduction of the similarity matrix which represents the similarity of each pair of points in the embedded feature space to improve the performance of point cloud segmentation.
Figure 9 shows the representative visual part segmentation results of the tested methods. Some detailed areas are marked by red oval circles. We can observe from the first row that the compared PointNet fails to discriminate the circled local points of support bars of the chair and misclassifies them as the support feet of the chair. The compared DGCNN also suffers misclassification and insufficient performance when segmenting the circled points of support bars of the chair. In contrast, our network is able to accurately segment the support bars of the chair on both sides and the part segmentation result is more consistent with the ground truth label. From the second and third rows, with respect to the part segmentation of the motorcycle and the fighter aircraft, we also note that our network achieves relatively accurate and smooth boundaries, especially at the body of the motorcycle and the wing of the fighter aircraft as shown in the marked areas which highlight the detailed segmentation results of some local points of tested 3D objects. Specifically, when segmenting the parts of the motorcycle, the compared PointNet and DGCNN fail to segment the boundary points between the body and head of the motorcycle and achieve a blurry boundary. Simultaneously, when segmenting the parts of the fighter aircraft, the compared PointNet and DGCNN also fail to distinguish the boundary point between the body and wing of the fighter aircraft and achieve a coarse boundary. Therefore, seen from the visual-part segmentation results, it is obvious that our proposed method works better in the feature extraction of the local points and can better segment the parts of 3D objects than the compared methods.
The main reason for the considerable part segmentation results achieved by our network relates to how deep neural networks directly work on point clouds. Their way of constructing local regions and conducting the convolution operation on local points are critical steps that directly impact the local feature extraction of point clouds and, therefore, the segmentation results. By using the designed dilated K-NN search method, we can construct a dilated graph-like local region for each input point by utilizing the long-range geometric dependency between the reference point and its neighbors, thus allowing the proposed network to extract more local, detailed information to better segment small objects. Furthermore, the geometric difference between each point and its corresponding neighbors can be considered by embedding a novel offset–attention mechanism into the designed dilated graph attention module (DGAM). Our network is able to capture the discriminative geometric features on local points to further improve the identification ability of boundary points. Therefore, our proposed network can obtain better performance in the part segmentation task.

4.2.5. Ablation Studies and Analysis

We perform an ablation study on the different components of the proposed DGANet to explore the influence of various component choices made in the DGANet. We choose the ShapeNet part dataset as a test benchmark to compare different options.
In order to investigate the effect of the designed spatial transformation embedding (STE) and dilated graph attention module (DGAM) on the point cloud segmentation’s overall accuracy, the STE and DGAM were selectively removed in the proposed DGANet to conduct the ablation experiment. According to the different component choices, we designed four kinds of comparative networks, namely, network A (not using STE and DGAM), network B (only using STE), network C (only using DGAM), and our proposed network (using both STE and DGAM). In addition, we set the number of neighbors, k, to 20 and dilated scope, d, to 2 when training the network model. Instead of the DGAM, we use the normal K-NN and the shared MLP layer to construct the network and make the contrast experiments. The STE is an embedding block which can be removed from the network without any effect on the network training.
The quantitative evaluation of the part segmentation results of our network with different components is shown in Table 4. We can observe that when both the STE and DGAM are removed from our network, network A achieves the lowest pIoU score (83.7%), while network B, which only uses STE, and network C, which only uses DGAM, both achieve higher pIoU scores than the compared network A. It is worth noting that our proposed network obtains the best performance and shows a considerable increase in pIoU (1.8%) compared to network A.
Compared to the segmentation results of network A, which does not use both STE and DGAM, network B, network C, and our proposed network have achieved better performance in the part segmentation task. It is obvious that both the designed STE and DGAM have improved performances compared to the proposed network. The main advantage of the STE lies in its powerful ability to deal with the transformation–invariance problem of the input points, thus better helping the network to efficiently learn the significant point features. Furthermore, the DGAM is able to capture the most significant features in the local region. As a result, our network takes full advantage of combining them together to extract more local, fine-grained features for each input point and obtains robust and considerable overall performance.

5. Conclusions

In this paper, we proposed a novel point network (DGANet) for local feature extraction on 3D point clouds. The proposed DGANet is built on the stacked dilated graph attention modules (DGAM) which enable the network to efficiently learn the local neighboring representation by utilizing the long-range dependencies provided by the constructed local dilated graph-like region for each input point. In the designed DGAM, the offset–attention mechanism is integrated to help the network focus on significant fine-grained features. It is therefore capable of tackling the deficient local geometric representation and lack of details found in other methods. In addition, by using graph attention pooling, the DGAM is able to preserve more local discriminative features and enhance the network’s robustness. The proposed DGANet has been evaluated on two challenging point cloud datasets and achieved a considerable performance in both 3D object classification and segmentation tasks. In particular, the proposed DGANet shows a considerable 92.3% overall accuracy in the classification task of the ModelNet40 dataset and 94.3% overall accuracy in the part segmentation task of the ShapeNet part dataset. Our proposed network can be used on many other lidar point cloud datasets as well, which shows the great potential in information extraction of 3D lidar point clouds for many applications in the field of remote sensing, such as land cover classification and urban infrastructure mapping. The experimental results demonstrate that our proposed DGANet not only has the capability to fully extract local features on point clouds with consideration of the important long-range relations in the local regions, especially when extracting detailed geometric features, but also shows the efficiency in the graph computation of local points and the understanding of their geometric relationship. Moreover, extensive ablation experiments using two challenging benchmarks further verify the effectiveness and powerful generation ability of the proposed DGANet.
In the future, we will continue to focus on the refinement of the network architecture for local feature extraction on point clouds. Research on how to further enhance the feature representation of local points by fusing 2D image features with 3D point features will also be pursued. Moreover, when training the network model on different point cloud benchmarks, the refinement of the loss function has the potential to improve the quality of local feature extraction for 3D object classification and segmentation tasks. Therefore, in future research, we will design and realize a 2D feature integrated point network with an improved loss function to yield more accurate and complete local feature extraction results on point clouds.

Author Contributions

J.W. and Q.Q. proposed the network architecture design and the framework of extracting local features on point clouds. J.W., Z.Z. and D.Y. performed the experiments and analyzed the data. J.W. wrote and revised the paper. Q.Q., Y.X. and Z.X. provided valuable advice for the experiments and writing. All authors have read and agreed to the published version of the manuscript.

Funding

This study is funded by National Natural Science Foundation of China (42001340 U1711267, 41671400), Open Fund of Key Laboratory of Urban Land Resources Monitoring and Simulation, and Ministry of Natural Resources (KF-2020-05-068).

Institutional Review Board Statement

Not applicable.

Informed Consent Statement

Not applicable.

Data Availability Statement

Publicly available datasets were analyzed in this study. The datasets can be found here: http://modelnet.cs.princeton.edu/ (accessed on 31 July 2021) and https://www.shapenet.org/ (accessed on 31 July 2021).

Acknowledgments

The authors thank the Stanford University for providing the experimental datasets. The authors also thank all editors and reviewers for their helpful comments and suggestions.

Conflicts of Interest

The authors declare no conflict of interest.

References

  1. Han, X.; Dong, Z.; Yang, B. A Point-Based Deep Learning Network for Semantic Segmentation of MLS Point Clouds. ISPRS J. Photogramm. Remote Sens. 2021, 175, 199–214. [Google Scholar] [CrossRef]
  2. Bello, S.A.; Yu, S.; Wang, C.; Adam, J.M.; Li, J. Review: Deep Learning on 3D Point Clouds. Remote Sens. 2020, 12, 1729. [Google Scholar] [CrossRef]
  3. Niemeyer, J.; Rottensteiner, F.; Soergel, U. Contextual Classification of Lidar Data and Building Object Detection in Urban Areas. ISPRS J. Photogramm. Remote Sens. 2014, 87, 152–165. [Google Scholar] [CrossRef]
  4. Reitberger, J.; Schnörr, C.; Krzystek, P.; Stilla, U. 3D Segmentation of Single Trees Exploiting Full Waveform LIDAR Data. ISPRS J. Photogramm. Remote Sens. 2009, 64, 561–574. [Google Scholar] [CrossRef]
  5. Yan, W.Y.; Shaker, A.; El-Ashmawy, N. Urban Land Cover Classification Using Airborne LiDAR Data: A Review. Remote Sens. Environ. 2015, 158, 295–310. [Google Scholar] [CrossRef]
  6. Xu, Y.; Xie, Z.; Chen, Z.; Xie, M. Measuring the similarity between multipolygons using convex hulls and position graphs. Int. J. Geogr. Inf. Sci. 2021, 35, 847–868. [Google Scholar] [CrossRef]
  7. Wu, Z.; Song, S.; Khosla, A.; Yu, F.; Zhang, L.; Tang, X.; Xiao, J. 3D ShapeNets: A Deep Representation for Volumetric Shapes. In Proceedings of the 2015 IEEE Conference on Computer Vision and Pattern Recognition (CVPR), Boston, MA, USA, 7–12 June 2015; pp. 1912–1920. [Google Scholar]
  8. Chang, A.X.; Funkhouser, T.; Guibas, L.; Hanrahan, P.; Huang, Q.; Li, Z.; Savarese, S.; Savva, M.; Song, S.; Su, H.; et al. ShapeNet: An Information-Rich 3D Model Repository. arXiv 2015, arXiv:1512.03012. [Google Scholar]
  9. Dai, A.; Chang, A.X.; Savva, M.; Halber, M.; Funkhouser, T.; Nießner, M. ScanNet: Richly-Annotated 3D Reconstructions of Indoor Scenes. In Proceedings of the 2017 IEEE Conference on Computer Vision and Pattern Recognition (CVPR), Honolulu, HI, USA, 21–26 July 2017; pp. 2432–2443. [Google Scholar]
  10. Su, H.; Maji, S.; Kalogerakis, E.; Learned-Miller, E. Multi-View Convolutional Neural Networks for 3D Shape Recognition. In Proceedings of the 2015 IEEE International Conference on Computer Vision (ICCV), Santiago, Chile, 7–13 December 2015; pp. 945–953. [Google Scholar]
  11. Hu, Q.; Yang, B.; Xie, L.; Rosa, S.; Guo, Y.; Wang, Z.; Trigoni, N.; Markham, A. RandLA-Net: Efficient Semantic Segmentation of Large-Scale Point Clouds. arXiv 2020, arXiv:1911.11236. [Google Scholar]
  12. Maturana, D.; Scherer, S. VoxNet: A 3D Convolutional Neural Network for Real-Time Object Recognition. In Proceedings of the 2015 IEEE/RSJ International Conference on Intelligent Robots and Systems (IROS), Hamburg, Germany, 28 September–2 October 2015; pp. 922–928. [Google Scholar]
  13. Lyu, Y.; Huang, X.; Zhang, Z. Learning to Segment 3D Point Clouds in 2D Image Space. arXiv 2020, arXiv:2003.05593. [Google Scholar]
  14. Charles, R.Q.; Su, H.; Kaichun, M.; Guibas, L.J. PointNet: Deep Learning on Point Sets for 3D Classification and Segmentation. In Proceedings of the 2017 IEEE Conference on Computer Vision and Pattern Recognition (CVPR), Honolulu, HI, USA, 21–26 July 2017; pp. 77–85. [Google Scholar]
  15. Qi, C.R.; Yi, L.; Su, H.; Guibas, L.J. PointNet++: Deep Hierarchical Feature Learning on Point Sets in a MetricSpace. In Proceedings of the Advances in Neural Information Processing Systems 30: Annual Conference on Neural Information Processing Systems 2017, Long Beach, CA, USA, 4–9 December 2017; pp. 5099–5108. [Google Scholar]
  16. Kipf, T.N.; Welling, M. Semi-Supervised Classification with Graph Convolutional Networks. arXiv 2017, arXiv:1609.02907. [Google Scholar]
  17. Wang, Y.; Sun, Y.; Liu, Z.; Sarma, S.E.; Bronstein, M.M.; Solomon, J.M. Dynamic Graph CNN for Learning on Point Clouds. arXiv 2018, arXiv:1801.07829. [Google Scholar] [CrossRef] [Green Version]
  18. Armeni, I.; Sener, O.; Zamir, A.R.; Jiang, H.; Brilakis, I.; Fischer, M.; Savarese, S. 3D Semantic Parsing of Large-Scale Indoor Spaces. In Proceedings of the 2016 IEEE Conference on Computer Vision and Pattern Recognition (CVPR), Las Vegas, NV, USA, 27–30 June 2016; pp. 1534–1543. [Google Scholar]
  19. Lawin, F.J.; Danelljan, M.; Tosteberg, P.; Bhat, G.; Khan, F.S.; Felsberg, M. Deep Projective 3D Semantic Segmentation. In Proceedings of the Computer Analysis of Images and Patterns; Felsberg, M., Heyden, A., Krüger, N., Eds.; Springer International Publishing: Basel, Germany, 2017; pp. 95–107. [Google Scholar]
  20. Yu, T.; Meng, J.; Yuan, J. Multi-View Harmonized Bilinear Network for 3D Object Recognition. In Proceedings of the 2018 IEEE/CVF Conference on Computer Vision and Pattern Recognition, Salt Lake City, UT, USA, 18–23 June 2018; pp. 186–194. [Google Scholar]
  21. Zhang, L.; Sun, J.; Zheng, Q. 3D Point Cloud Recognition Based on a Multi-View Convolutional Neural Network. Sensors 2018, 18, 3681. [Google Scholar] [CrossRef] [Green Version]
  22. Kalogerakis, E.; Averkiou, M.; Maji, S.; Chaudhuri, S. 3D Shape Segmentation with Projective Convolutional Networks. In Proceedings of the 2017 IEEE Conference on Computer Vision and Pattern Recognition (CVPR), Honolulu, HI, USA, 21–26 July 2017; pp. 6630–6639. [Google Scholar]
  23. Le, T.; Bui, G.; Duan, Y. A Multi-View Recurrent Neural Network for 3D Mesh Segmentation. Comput. Graph. 2017, 66, 103–112. [Google Scholar] [CrossRef]
  24. Tang, H.; Liu, Z.; Zhao, S.; Lin, Y.; Lin, J.; Wang, H.; Han, S. Searching Efficient 3D Architectures with Sparse Point-Voxel Convolution. In ECCV 2020, Proceedings of the Computer Vision, Glasgow, UK, 23–28 August 2020; Vedaldi, A., Bischof, H., Brox, T., Frahm, J.-M., Eds.; Springer International Publishing: Basel, Germany, 2020; pp. 685–702. [Google Scholar]
  25. Deng, J.; Shi, S.; Li, P.; Zhou, W.; Zhang, Y.; Li, H. Voxel R-CNN: Towards High Performance Voxel-Based 3D Object Detection. arXiv 2021, arXiv:2012.15712. [Google Scholar]
  26. Hůlková, M.; Pavelka, K.; Matouskova, E. Automatic Classification of Point Clouds for Highway Documentation. Acta Polytech. 2018, 58, 165. [Google Scholar] [CrossRef]
  27. Klokov, R.; Lempitsky, V. Escape from Cells: Deep Kd-Networks for the Recognition of 3D Point Cloud Models. In Proceedings of the 2017 IEEE International Conference on Computer Vision (ICCV), Venice, Italy, 22–29 October 2017; pp. 863–872. [Google Scholar]
  28. Tatarchenko, M.; Dosovitskiy, A.; Brox, T. Octree Generating Networks: Efficient Convolutional Architectures for High-Resolution 3D Outputs. arXiv 2017, arXiv:1703.09438. [Google Scholar]
  29. Li, Y.; Bu, R.; Sun, M.; Wu, W.; Di, X.; Chen, B. PointCNN: Convolution On X-Transformed Points. In Proceedings of the Advances in Neural Information Processing Systems 31: Annual Conference on Neural Information Processing Systems 2018 (NeurIPS 2018), Montréal, QC, Canada, 3–8 December 2018; pp. 828–838. [Google Scholar]
  30. Wu, W.; Qi, Z.; Fuxin, L. PointConv: Deep Convolutional Networks on 3D Point Clouds. In Proceedings of the 2019 IEEE/CVF Conference on Computer Vision and Pattern Recognition (CVPR), Long Beach, CA, USA, 16–20 June 2019; pp. 9613–9622. [Google Scholar]
  31. Zhang, Y.; Rabbat, M. A Graph-CNN for 3D Point Cloud Classification. arXiv 2018, arXiv:1812.01711. [Google Scholar]
  32. Te, G.; Hu, W.; Guo, Z.; Zheng, A. RGCNN: Regularized Graph CNN for Point Cloud Segmentation. arXiv 2018, arXiv:1806.02952. [Google Scholar]
  33. Liang, Z.; Yang, M.; Wang, C. 3D Graph Embedding Learning with a Structure-Aware Loss Function for Point Cloud Semantic Instance Segmentation. IEEE Robot. Autom. Lett. 2020, 5, 4915–4922. [Google Scholar] [CrossRef]
  34. Wang, L.; Huang, Y.; Hou, Y.; Zhang, S.; Shan, J. Graph Attention Convolution for Point Cloud Semantic Segmentation. In Proceedings of the 2019 IEEE/CVF Conference on Computer Vision and Pattern Recognition (CVPR), Long Beach, CA, USA, 16–20 June 2019; pp. 10288–10297. [Google Scholar]
  35. Feng, M.; Zhang, L.; Lin, X.; Gilani, S.Z.; Mian, A. Point Attention Network for Semantic Segmentation of 3D Point Clouds. arXiv 2019, arXiv:1909.12663. [Google Scholar]
  36. Tatarchenko, M.; Park, J.; Koltun, V.; Zhou, Q.-Y. Tangent Convolutions for Dense Prediction in 3D. In Proceedings of the 2018 IEEE/CVF Conference on Computer Vision and Pattern Recognition, Salt Lake City, UT, USA, 18–23 June 2018; pp. 3887–3896. [Google Scholar]
  37. Shen, Y.; Feng, C.; Yang, Y.; Tian, D. Mining Point Cloud Local Structures by Kernel Correlation and Graph Pooling. In Proceedings of the 2018 IEEE/CVF Conference on Computer Vision and Pattern Recognition, Salt Lake City, UT, USA, 18–23 June 2018; pp. 4548–4557. [Google Scholar]
  38. Xu, Y.; Fan, T.; Xu, M.; Zeng, L.; Qiao, Y. SpiderCNN: Deep Learning on Point Sets with Parameterized Convolutional Filters. In Proceedings of the Computer Vision-ECCV 2018—15th European Conference, Munich, Germany, 8–14 September 2018; Volume 11212, pp. 90–105. [Google Scholar]
  39. Li, J.; Chen, B.M.; Lee, G.H. SO-Net: Self-Organizing Network for Point Cloud Analysis. In Proceedings of the 2018 IEEE/CVF Conference on Computer Vision and Pattern Recognition, Salt Lake City, UT, USA, 18–23 June 2018; pp. 9397–9406. [Google Scholar]
  40. Atzmon, M.; Maron, H.; Lipman, Y. Point Convolutional Neural Networks by Extension Operators. ACM Trans. Graph. 2018, 37, 71:1–71:12. [Google Scholar] [CrossRef] [Green Version]
  41. Wang, W.; Yu, R.; Huang, Q.; Neumann, U. SGPN: Similarity Group Proposal Network for 3D Point Cloud Instance Segmentation. In Proceedings of the 2018 IEEE/CVF Conference on Computer Vision and Pattern Recognition, Salt Lake City, UT, USA, 18–23 June 2018; pp. 2569–2578. [Google Scholar]
Figure 1. The 3D illustration of the local feature extraction with different methods: (a) With PointNet ++; (b) With DGCNN; (c) With our proposed DGANet.
Remotesensing 13 03484 g001
Figure 2. The general framework of the proposed DGANet.
Remotesensing 13 03484 g002
Figure 3. The details of the spatial transformation embedding.
Remotesensing 13 03484 g003
Figure 4. The schematic illustration of the local graph construction: (a) The construction of the local graph using normal K-NN; (b) The construction of the local graph using our dilated K-NN.
Remotesensing 13 03484 g004
Figure 5. The workflow of the designed dilated K-NN search.
Remotesensing 13 03484 g005
Figure 6. The designed dilated graph attention module (DGAM).
Remotesensing 13 03484 g006
Figure 7. The illustration of the dilated graph attention module (DGAM).
Remotesensing 13 03484 g007
Figure 8. The illustration of random input dropout in point cloud: (a) Results of our network with random input dropout; (b) Test samples with different numbers of points.
Remotesensing 13 03484 g008
Figure 9. Visual comparison of part segmentation results on ShapeNet part dataset: (a) Input point clouds; (b) Ground truth labels; (c) Results of PointNet; (d) Results of DGCNN; (e) Results of our DGANet. Red circles in this figure represent the local detailed segmentation results of the tested 3D models.
Remotesensing 13 03484 g009
Table 1. Classification results on the ModelNet40 dataset.
MethodInputPointsmA (%)OA (%)Params (Million)FLOPs (108)
3DShapeNets [7]C1 k77.384.7--
VoxNet [12]C1 k8385.90.77-
PointNet [14]C1 k86.289.23.481.88
Kc-Net [37]C1 k-910.9-
Kd-Net [27]C32 k88.591.82-
PointNet++ (ssg) [15]C1 k-90.71.471.37
PointNet++ (msg) [15]C, N5 k-91.91.746.41
PointCNN [29]C1 k88.192.20.45-
SpiderCNN [38]C, N1 k-92.4--
DGCNN [17]C1 k89.591.91.844.63
PointCov [23]C, N1 k-92.21.961.87
OursC1 k89.492.31.724.31
C and N stand for coordinates and normals, respectively.
Table 2. Results of our network with different hyper-parameter settings on the ModelNet40 dataset.
Number of Neighbors
(k)
Search Method of Local Graph ConstructionmA (%)OA (%)
10normal K-NN (d = 1)87.691.2
10dilated K-NN (d = 3)88.791.9
10dilated K-NN (d = 5)87.290.7
20normal K-NN (d = 1)88.691.9
20dilated K-NN (d = 2)89.492.3
20dilated K-NN (d = 3)88.491.1
30normal K-NN (d = 1)88.291.6
30dilated K-NN (d = 2)89.391.8
30dilated K-NN (d = 3)88.190.9
The d stands for dilated scope rate used to expend the search range when constructing the local dilated graph.
Table 3. Part segmentation results on the ShapeNet part dataset.
MethodpIoUAirBagCapCarCha.EarGua.Kin.Lam.LapMot.MugPis.Roc.Ska.Tab.
Kd-Net [27]82.380.174.674.370.388.673.590.287.281.094.957.486.778.151.869.980.3
Kc-Net [37]83.782.881.586.477.690.376.891.087.284.595.569.294.481.660.175.281.3
PointNet [14]83.783.478.782.574.989.673.091.585.980.895.365.293.081.257.972.880.6
3DmFV [39]84.382.084.386.076.989.973.990.885.782.695.266.094.082.651.573.581.8
PCNNet [40]85.182.480.185.579.590.873.291.386.085.095.773.294.883.351.075.081.8
DGCNN [17]85.184.283.784.477.190.978.591.587.382.996.067.093.382.659.775.582.0
SpiderCNN [38]85.383.581.087.277.590.776.891.187.383.395.870.293.582.759.775.882.8
SGPN [41]85.880.478.678.871.588.678.090.983.078.895.877.893.887.460.192.389.4
Ours85.284.685.787.878.591.077.391.287.982.495.867.894.281.159.775.782.0
Table 4. Results of our network with different components on the ShapeNet part dataset.
MethodSTEDGAMpIoU (%)OA (%)
Network A××83.793.6
Network B×84.193.8
Network C×84.794.0
Ours85.294.3
STE stands for spatial transformation embedding illustrated in Figure 3.
Publisher’s Note: MDPI stays neutral with regard to jurisdictional claims in published maps and institutional affiliations.

