Article

Intelligent Recognition Method of Low-Altitude Squint Optical Ship Target Fused with Simulation Samples

1
National Space Science Center, Key Laboratory of Electronics and Information Technology for Space System, Chinese Academy of Sciences, Beijing 100190, China
2
School of Computer Science and Technology, University of Chinese Academy of Sciences, Beijing 100049, China
*
Author to whom correspondence should be addressed.
Remote Sens. 2021, 13(14), 2697; https://doi.org/10.3390/rs13142697
Submission received: 21 May 2021 / Revised: 7 July 2021 / Accepted: 7 July 2021 / Published: 8 July 2021

Abstract

:
To address the problem of intelligent recognition of optical ship targets under low-altitude squint detection, we propose an intelligent recognition method based on simulation samples. This method comprehensively considers geometric and spectral characteristics of ship targets and ocean background and performs full link modeling combined with the squint detection atmospheric transmission model. It also generates and expands squint multi-angle imaging simulation samples of ship targets in the visible light band using the expanded sample type to perform feature analysis and modification on SqueezeNet. Shallow and deeper features are combined to improve the accuracy of feature recognition. The experimental results demonstrate that using simulation samples to expand the training set can improve the performance of the traditional k-nearest neighbors algorithm and modified SqueezeNet. For the classification of specific ship target types, a mixed-scene dataset expanded with simulation samples was used for training. The classification accuracy of the modified SqueezeNet was 91.85%. These results verify the effectiveness of the proposed method.

1. Introduction

In this study, a novel low-altitude platform detection system based on the concept of shipborne low-altitude unmanned aerial vehicles (UAVs) is applied in marine early warning monitoring, to develop a simple, rapid, and economical monitoring method to enhance the ability of marine situation awareness. This can effectively improve the ability of existing shipborne or shore-based platforms in long-distance communication and regional awareness. This new shipborne aerial platform equipped with photoelectric cameras for target recognition can be used for squint multi-angle and high-resolution imaging of targets in the field of view (FOV) at a particular altitude. The details and feature dimensions of targets are richer than those of existing spaceborne and airborne high-altitude imaging observation systems. This provides the possibility of refined target recognition.
At present, studies on optical ship target recognition are mainly focused on low-level recognition applications, such as the classification and recognition of military and civilian ships and recognition of important ship targets [1,2], and the fine identification ability of the target model is insufficient. One reason is the limited data availability and the knowledge level of the target types. The other reason is the complexity and variability of the marine environment, where factors such as lighting, clouds, and shielding have a significant impact on the quality of high-resolution optical satellite remote sensing imaging. In addition, ship targets of the same type and different models have high similarity in shape and other aspects, whereas the targets may have various postures and scales in the imaging process. Owing to these factors, traditional recognition and interpretation methods based on image multi-feature matching can hardly meet the application requirements of fine recognition of target models in terms of accuracy and timeliness.
In recent years, deep convolutional neural networks (DCNNs) have made significant advances in several fields of computer vision, such as target detection [3] and image classification [4,5,6,7]. The use of satellite remote sensing ship target data to develop training images has had a positive effect in intelligent recognition of space-based ship target type detection. For instance, Zhang et al. [8] proposed a cascaded convolutional neural network (CNN) ship detection method, CCNet, based on multispectral images. Lei et al. [9] first classified marine and non-marine regions, extracted the candidate areas of ocean and ship targets through morphological calculation, and finally extracted the ship targets through a trained CNN. Liu et al. [10] proposed a detection framework for ships in any direction. However, real-scene observation images are relatively scarce for the detection of low-altitude squint ship targets. The few-shot learning problem is one of the main reasons that restrict the training effect of the deep learning algorithms.
Data augmentation is the main method to solve the few-shot learning problem. Spatial transformation (flip, rotation, scale, crop, translation, etc.) is the most commonly used method of data augmentation. The spatial transformation operation cannot essentially enrich the feature information of the image, and it has limited improvement in the performance of the model. The data augmentation method based on the generative adversarial networks (GANs) [11] is uncontrollable causing the collapse problem. Multi-angle image inversion based on two-dimensional remote sensing images is difficult, which also limits the application of the network in real scenes. However, computer simulation can flexibly regulate the simulation environment conditions, complete the simulation modeling of the geometric appearance, material texture, and lighting environment, and simulate the optical characteristics of the target and the imaging effect of the camera.
With the development of computer graphics (CG) and virtual reality (VR), professional imaging simulation systems and software have been put into practical applications. For instance, the Digital Imaging and Remote Sensing Laboratory at Rochester Institute of Technology developed an imaging simulation program that can render a two-dimensional scene into an infrared radiation image. They further improved on this and developed a remote sensing imaging simulation software named digital imaging and remote sensing image generation (DIRSIG) [12]. The Vega series simulation module launched by MultiGen-Paradigm is a commercial remote sensing imaging simulation toolkit with relatively complete functions. This toolkit can realize the dynamic simulation of the entire remote sensing imaging process. The simulation images satisfy the physical mechanism and visual expression. High-precision feature expression is the basis for the application of simulated images in multiple fields.
Deep learning has produced a variety of state-of-the-art models that rely on massive labeled data [13]. Owing to the difficulty of acquiring real-scene images and the rapid development of imaging simulation systems, simulation-scene images have been widely used in the field of deep learning. For instance, Wang et al. [14] generated the simulation-scene ship images in the infrared scene and improved the detection accuracy of ship targets under infrared conditions. Li et al. [15] presented an effective method to automatically generate a simulation-scene dataset called “ParallelEye.” They verified the effectiveness of “ParallelEye” for the target detection task. The results of these related works sufficiently demonstrate that the application of simulation images to the field of deep learning has scientific implications.
The typical features of a target play a crucial role in an algorithmic model [16]. The parameters of the imaging simulation system have accurate and rigorous mathematical expressions and practical implications. In the simulation-scene image, the distribution characteristics of the target typical features are aligned with the real-scene target, which is the essential reason why the simulation-scene image can be used for data augmentation.
The appropriate network structure is another key factor affecting the performance of the algorithm. The traditional CNN structure is inefficient, mainly in terms of the speed of the model storage and prediction. It consists of a large number of weights parameters in a network with hundreds of layers that need to be stored on devices with huge storage capacities. To combine the CNN structure with mobile devices, several representative lightweight CNN models have been developed in recent years, such as SqueezeNet, MobileNetV1 [17], MobileNetV2 [18], and ShuffleNet [19]. Among them, SqueezeNet can achieve an effect close to that of AlexNet on the ImageNet dataset using 50 times fewer parameters than AlexNet. Combined with deep compression [20], the model file of SqueezeNet can be 510 times smaller than that of AlexNet. Our study is based on SqueezeNet, as it is a representative work in the field of CNN model compression.
Because the existing optical ship datasets have limited images in low-altitude squint scenes, certain types of ship images are difficult to obtain, and effectively training DCNN based on the existing optical ship datasets is impossible. Considering the geometric and optical characteristics of ship targets and the ocean background, we performed an imaging simulation study of low-altitude squint visible light ship targets. To classify low-altitude squint optical ship targets, we used the simulation-scene images to expand the training set, to improve the accuracy of the model algorithm. The main contributions of this study are summarized as follows:
(1)
For the imaging simulation of low-altitude squint visible light ship targets, we considered their geometric and spectral characteristics, the ocean background, and the atmospheric transmission link to complete their optical imaging simulation modeling.
(2)
We present a new deep neural network to accomplish low-altitude squint optical ship target classification based on SqueezeNet. We modified SqueezeNet with feature fusion (FF-SqueezeNet), using the complementary output of the shallow layer and the deep layer features as the final output to enrich the feature content. The overall framework is illustrated in Figure 1.
(3)
For specific ship target type recognition, we used a mixed-scene dataset expanded by simulation samples during training. The classification accuracy of our proposed FF-SqueezeNet was 91.85%, which demonstrates the effectiveness of the proposed method.
The remainder of this paper is organized as follows. Section 2 introduces the optical image simulation of low-altitude squint multi-angle ship target and our proposed FF-SqueezeNet. The datasets and experimental details are provided in Section 3. The experimental results and discussion are presented in Section 4, and the conclusions are presented in Section 5.

2. Materials and Methods

2.1. Optical Imaging Simulation of Low-Altitude Squint Multi-Angle Ship Target

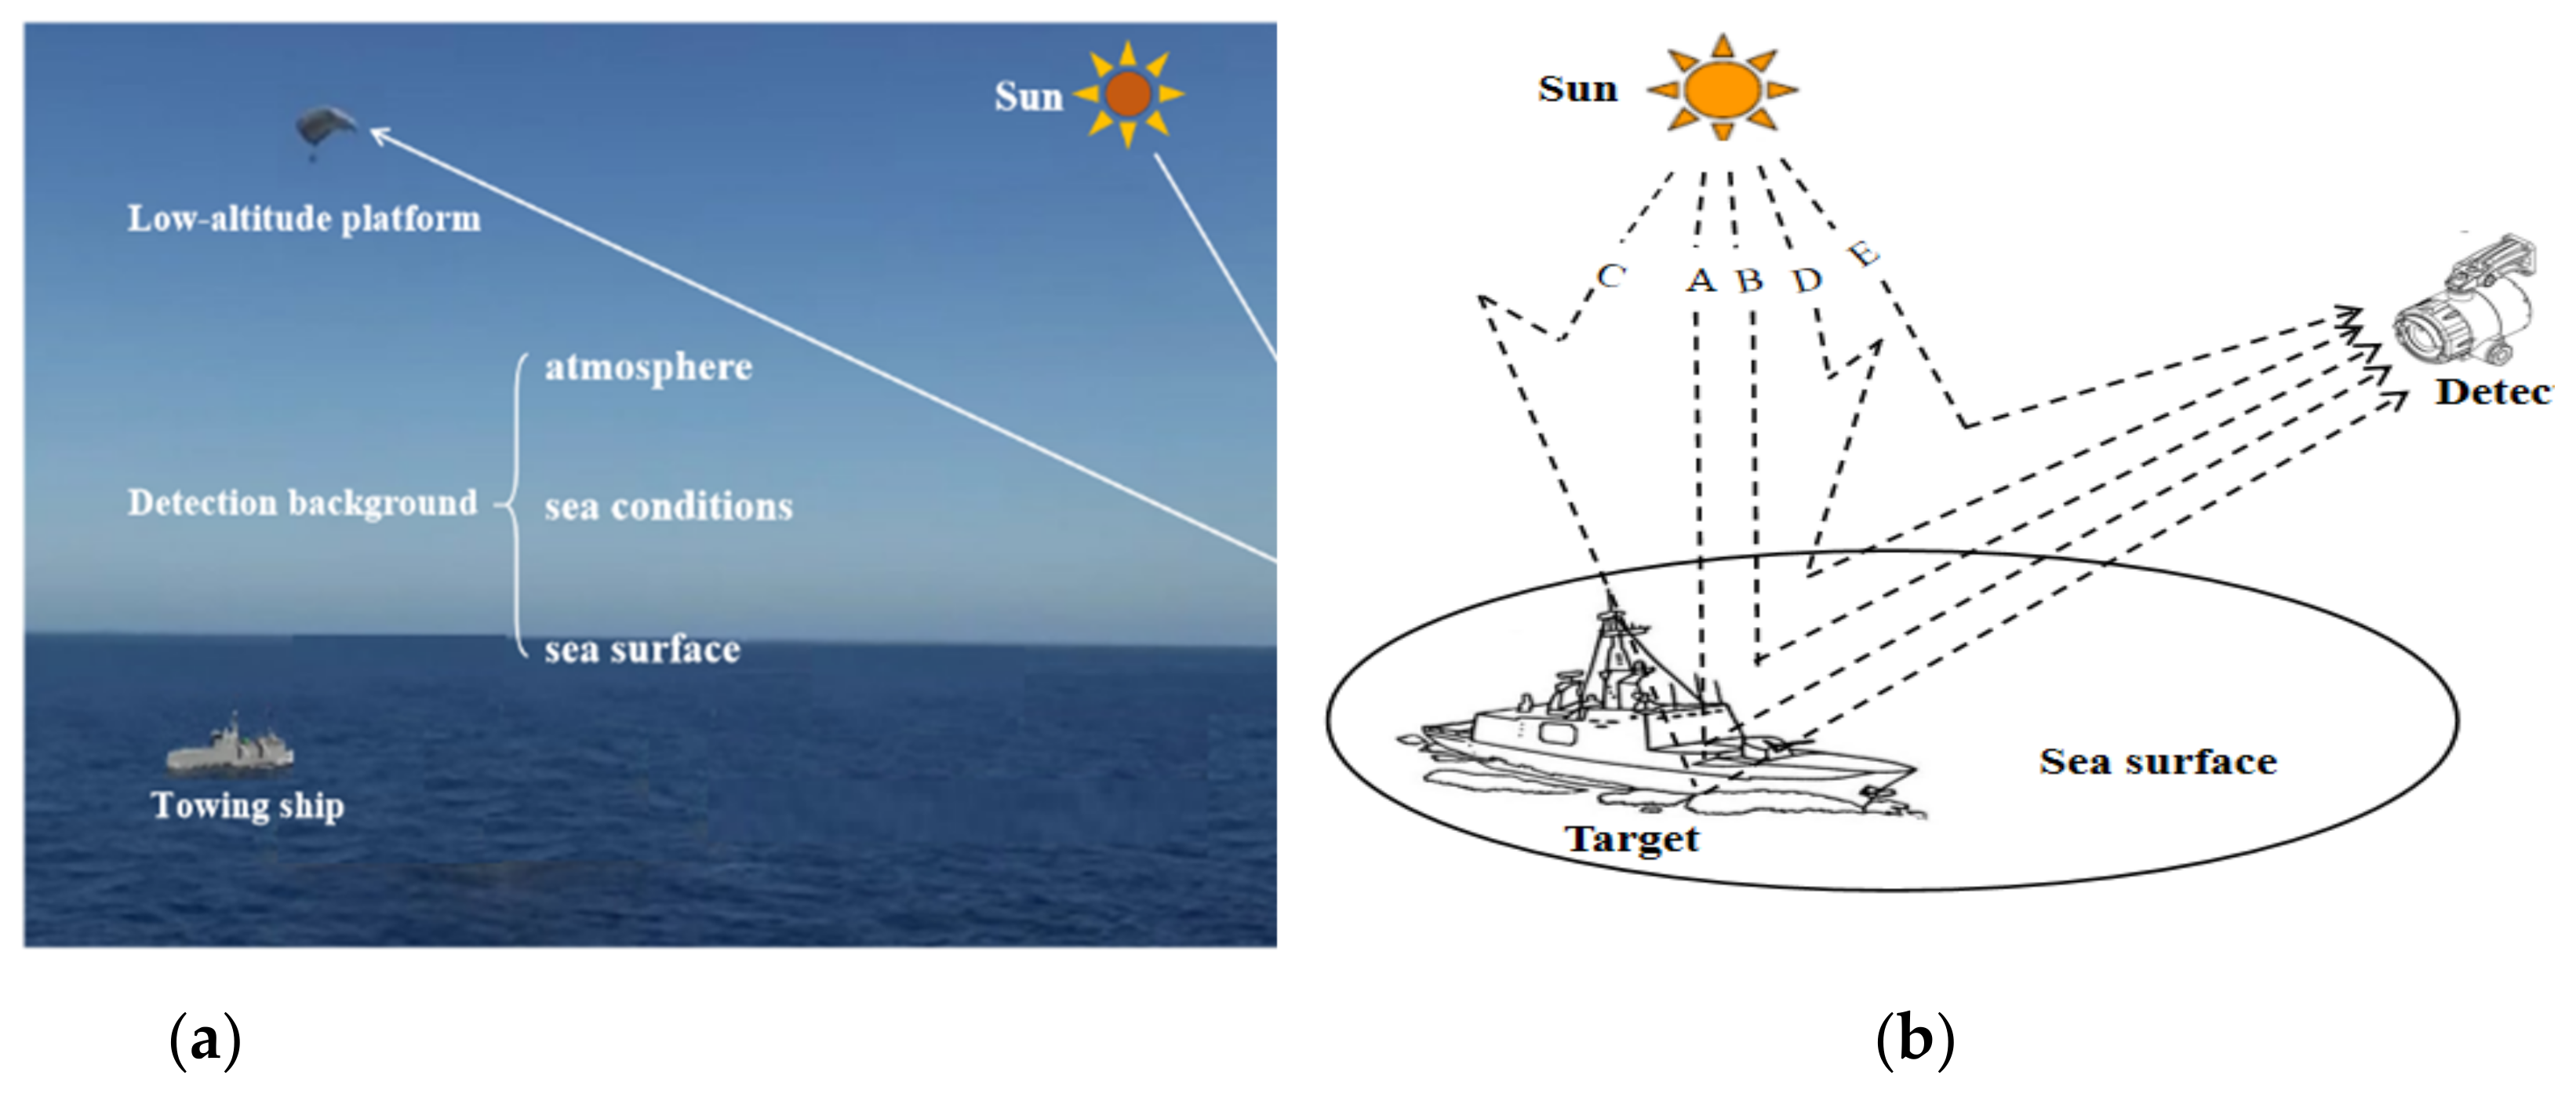
2.1.1. Simulation Principle of Visible Light Imaging for Low-Altitude Squint Ship Targets

In emergency monitoring of offshore moving ship targets in low-altitude and high-squint views, shipborne floating platforms carrying optical payloads are often used and wide staring or scanning modes are adopted to achieve long-distance and large-range target detection. A specific imaging detection scene is shown in Figure 2a. The radiation received by the optical payload on a low-altitude squint detection platform is mainly solar radiation interacting with the atmosphere, ship targets, ocean background, and other complex factors. The FOV of visible light cameras includes the direct reflection of solar radiation energy from ship targets under different solar illumination and squint visibility conditions and the radiation of complex environments, such as the atmospheric environment and ocean background near the targets. Using the application scenario of low-altitude squint imaging detection in Figure 2a as an example, its physical effect is shown in Figure 2b. The radiation energy received on the focal plane of imaging detection considers the characteristics of moving ship targets interacting with the ocean background and atmospheric environment. It mainly includes the following: (A) After passing through the atmosphere, the sunlight directly reaches the surface of the ship target and subsequently reflects the radiation energy into the imaging FOV. (B) After passing through the atmosphere, the sunlight directly reaches the ocean background surface and subsequently reflects the radiation energy into the imaging FOV. (C) The sky background light formed by the scattering of sunlight through the atmosphere reaches the surface of the ship target and subsequently reflects the radiation energy into the imaging FOV. (D) The sky background light, which is formed by the scattering of sunlight through the atmosphere, reaches the ocean background surface and subsequently reflects the radiation energy into the imaging FOV. (E) Before reaching the scene surface, the path radiation formed by atmospheric scattering directly enters the imaging FOV.
Under the condition of low-altitude squint visible light image detection, this study performed radiation imaging simulation modeling and calculation of ship targets and ocean background based on radiation transmission theory, considering the geometric and spectral characteristics of both, coupling the effect of the scene and the ocean atmospheric environment, and the space-time relationship of image detection.
For ship targets, we constructed a three-dimensional (3D) geometric model using 3 ds Max. Thus, we mapped the geometric facet with the spectral data using a texture classification method combined with the measured spectral data of typical materials. The incident radiation, E T , received by the patch unit of the ship surface includes direct solar and sky background light radiations, and the calculation formula is:
{ | E d T x , y , z , t , λ = F d T x , y , z , θ d T , ϕ d T , t τ d T x , y , z , θ d T , ϕ d T , t , λ E d T t , λ c o s θ d T | E s T x , y , z , t , λ = φ s T = 0 2 π θ s T = 0 π 2 V s T x , y , z , θ s T , φ s T , t L d T x , y , z , θ s T , φ s T , t , λ c o s θ s T s i n θ s T d θ s T d φ s T | E T = E d T x , y , z , t , λ + E s T x , y , z , t , λ
where x , y , z , t , λ are the coordinates of the target patch unit at time t and wavelength λ , E d T denotes the incident irradiance of the solar radiation, and F d T denotes the visibility coefficient between the sun and the target, whose value is between 0 and 1 (zero indicates that the direct radiation of the sun to the target is completely blocked, whereas 1 indicates that the direct radiation of the sun to the target is not blocked at all). τ d T denotes the atmospheric transmissivity between the solar spectrum and the target; θ d T and ϕ d T denote the zenith and azimuth angles of the sun relative to the ship target, respectively; E d T is the solar irradiance outside the atmosphere of the scene area; θ s T and φ s T are the zenith and azimuth angles of the sky diffuse sampling in the hemispherical sky above the target, respectively; L d T is the downward radiance of the sky diffuse light reaching the target; and V s T is the visibility coefficient of the sky diffuse light of the target along the θ s T , φ s T direction to the target, with a value between 0 and 1 (zero indicates that the sky diffused light along the θ s T , φ s T direction of the target is completely blocked, whereas 1 indicates that it is completely unobstructed).
We introduced a bidirectional reflectance distribution function (BRDF) model of the ship target based on the calculation of the incident irradiance field of the 3D scene to derive the radiation distribution of the zero meteorological range emergent radiance on the surface of the ship target, as expressed in Equation (2).
L r T x , y , z , θ r T , φ r T , t , λ = ρ d T θ d T , φ d T , θ r T , φ r T , λ π E d T x , y , z , t , λ + φ s T = 0 2 π θ s T = 0 π 2 ρ s T θ s T , φ s T , θ r T , φ r T , λ π V s T x , y , z , θ s T , φ s T , t L d T x , y , z , θ s T , φ s T , t , λ c o s θ s T s i n θ s T   d θ s T d φ s T
where L r T denotes the brightness value of the zero meteorological range emergent radiance from the target patch unit, and θ r T , φ r T is the observation direction. ρ d T is the BRDF of the target from the direct radiation direction θ d T , φ d T . Further, ρ s T is the BRDF of the target from the sky background sampling light incident direction θ s T , φ s T , and the other parameters are as defined above. The radiance fields of all target patch units in the scene were obtained through comprehensive calculations.
Based on the calculation of the emergent radiance fields of the target surface in the zero meteorological range and considering the influence of the atmospheric upward transmittance and atmospheric path radiation in the observation direction of the sensor, we calculated the upward radiance value of the target arriving at the sensor, that is, the radiance value at the entrance pupil of the sensor. The definition is as follows:
L u T x u , y u , z u , θ r T , φ r T , t , λ = L r T x , y , z , θ r T , φ r T , t , λ τ u T x u , y u , z u , θ r T , φ r T , t , λ + L p T x u , y u , z u , θ r T , φ r T , t , λ
where L u T denotes the upward emergent radiance of the target patch unit. θ r T and φ r T are the zenith and azimuth angles of the sensor relative to the target patch unit, respectively. x u , y u , z u is the sensor position. τ u T denotes the atmospheric upward transmittance and L p T is the upward path radiation reaching the sensor position.
For the modeling and simulation of marine background, the grid characteristics of the ocean surface determine the wave shape in the imaging FOV. Because the ocean background is different from static backgrounds, external factors will cause a continuous change in the marine surface height distribution field. For the dynamic marine background, we used geometric grid modeling based on the Phillips wave spectrum to realize the distribution modeling of marine surface height under typical marine conditions. Moreover, to model the spectral characteristics of the ocean surface, marine surface spectral modeling was performed following [21], considering the marine surface wind speed, sea water white cap reflection, specular reflection, and radiation reflection from the water. Finally, for the grid-faceted ocean background, as the incident radiation received by each patch also includes solar direct and sky background light radiations, according to the target radiation transmission link in Equations (1)–(3), we can calculate L u B , the upward emergent radiance of the ocean background patch unit x B , y B , z B from the observation direction θ r B , φ r B to the low-altitude sensor.
Based on the calculation model of the ship target and marine background radiation transmission, the calculation formula for the radiation transmission characteristics of a low-altitude squint detection scene is expressed as follows:
L u x u , y u , z u , t , λ = T arg e t L u T x u , y u , z u , θ r T , φ r T , t , λ + B a c k O c e a n L u B x B , y B , z B , θ r B , φ r B , t , λ

2.1.2. Simulation Image Generation of Ship Target in Visible Light Band with Low-Altitude Squint

Based on the analysis of the process and transmission mechanism of visible light radiation of low-altitude squint ship targets, we identified the imaging parameters that affect the transmission characteristics of visible light, including space scale, observation azimuth, and atmosphere conditions. Thereafter, we organized these parameters into a discrete observation space to meet the basic input requirements of sample simulation. Simultaneously, we performed a sample simulation combined with the simulation of visible light imaging. The framework of the simulation is shown in Figure 3:
The scene diversity construction module includes the ship target geometric structure, ship target spectral feature, sea surface dynamic geometry, sea surface spectral feature, and multi-feature mapping model of the scene. Among them, 3 ds Max was used for modeling the ship target geometric structure according to the typical size and structure of a real ship. The spectral feature modeling of ship targets can generate multispectral data curves by collecting spectral data of typical materials. The sea surface dynamic geometry modeling generates a dynamic sea surface level by using the geometry grid modeling method based on the Phillips sea wave spectrum. The spectral characteristic modeling of the sea surface was achieved using the model in [22] to generate a multispectral curve of the sea surface. The multi-feature mapping modeling of the scene uses the geometry-texture-spectrum strategy to realize the correlation mapping between the geometric patches and the spectral data, providing the input for the radiation link calculation of the scene.
The atmospheric offline data calculation module uses MODTRAN to calculate the ocean scene solar irradiance, sky background light irradiance, atmospheric downward transmittance along with other parameters under typical time periods, atmospheric modes, and visibility conditions. The module is also responsible for calculating parameters such as upward path radiation and atmospheric transmittance of the detection platform and moving the ship target and background under typical visibility, distance, and observation angle. These parameters are organized and managed using a look-up table (LUT) to support the simulation of the atmospheric environment effect of the ship target and background in the radiation transmission process.
The incident radiation calculation module aims at geometric patch units in the scene. According to the simulation conditions, the module obtains the corresponding solar and sky irradiance, atmospheric downward transmittance, and other parameters through the atmospheric LUT. The incident radiation energy of the ship target and ocean background is calculated individually according to Equation (1).
Based on the incident radiation calculation, the emergent radiation calculation module combines the observation azimuth information of the scene from the current platform with the related attributes of each geometric patch and material of the scene, obtains the corresponding reflectance spectral curve data through the material data table, and calculates the zero meteorological range radiation energy of the output scene according to Equation (2). The scene radiation energy at the entrance pupil, that is, the upward emergent radiation energy, is calculated according to Equation (3).
The simulation module of the platform camera effect maps the geometric relationship between the scene and camera focal plane, considering the platform position, altitude, and camera imaging geometry. Based on the photoelectric conversion calibration coefficient, the radiation value at the entrance pupil of the camera was converted to the quantitative gray value of the camera imaging. Thereafter, the image simulation was generated based on the current platform and camera observation conditions.
The simulation scene sample annotation generation module implements the annotation generation of the samples by describing the simulation parameters, such as superimposed time period, visibility, bandpass, target type, and observation direction. It provides unified data management for the sample data generated by the annotation.
We constructed a geometric model and generated a sample simulation under the conditions of specific visibility, specific low-altitude detection altitude, and multiple observation angles. Based on the simulation sample generation framework, this study combines the low-altitude squint detection application scenario to meet the requirements of intelligent recognition for a specific ship target, as presented in Figure 4.
Figure 5 shows the simulation results of the visible light band for the typical detection altitude and visibility under the conditions of 15° of solar altitude, mid-latitude summer atmospheric model, and marine aerosol type. The squint distance is the connection distance between the camera and ship target. The observation angle is defined by the observation altitude and azimuth angles. The observation altitude angle is the angle between the optical axis of the staring camera and the vertical at sea level. The observation azimuth angle is the angle between the projection at sea level and the direction of the bow (positive for the clockwise direction and negative for the anticlockwise direction).
As can be observed from the results of the simulation samples under specific scenarios in Figure 5 and Figure 6, based on Figure 3, the simulation framework of the low-altitude squint ship target in the visible light band can generate an optical sample image of the ship target under the condition that covers typical visibility, detection distance, and multiple observation angles. The sample results are in accordance with imaging physics, and the simulation images can compensate for the low number of optical sample images of ship targets under the existing low-altitude squint detection conditions. In this study, we constructed a high-quality simulation sample dataset under the condition of low-altitude squint imaging, which can provide training samples for the optimization and training of the recognition algorithm.

2.2. Modified Design of SqueezeNet Classification Network Structure Based on Simulation Images

SqueezeNet [23] was proposed based on the Inception [24] module and it is a representative work of neural network model compression research. SqueezeNet adopts two key structures to simplify parameters and optimize calculation: the fire module and global average pooling [25].
Most of the existing neural network structures, including SqueezeNet, use the final output feature mapping and rarely use the middle layer feature map as the output for classification. Although the automatic construction and extraction of features are completed, several intermediate feature information, including details, are missing. The study by Zeiler and Fergus [26] is a pioneering work on feature visualization in the field of CNNs. Using feature visualization, we can determine the features that a CNN has learned from each layer, and thereafter help explore the working mechanism of the network model and the details of feature extraction. CNN visualization can be divided into three methods: feature visualization [27,28], convolution kernel parameter visualization, and class activation map visualization [29,30]. Figure 7 shows the feature visualization outputs of the different fire modules in SqueezeNet.
Figure 7a shows the input image of the network, whereas Figure 7b shows the result of the feature map from some channels of the network, specifically Fire1, Fire3, Fire5, and Fire7. As can be observed from Figure 7b, the low-level feature has higher resolution and contains more location details. However, owing to less convolution, it has fewer semantic features and more noise. High-level features contain more semantic information. As the size of the feature map is reduced, higher dimension semantic level feature information is gradually located. However, the resolution of high-level features is low, and the perception ability of details is poor.
Based on the above analysis, we considered using the complementary advantages of the high-level and low-level features of CNN. The specific method is to modify the original SqueezeNet and cascade the output of the intermediate layer to enhance the classification and recognition ability. The structure of FF-SqueezeNet and the processing flow design are shown in Figure 8.
The image preprocessing module aims at a low-altitude squint detection application. Because the availability of actual multi-angle squint detection images is very limited, data augmentation is an important means to offset the insufficient number of original images. We improved the feature richness by fusing the outputs of different fire layers. The fusion process is determined using Equation (5).
X f = ϕ f T i X i
where X i denotes the feature map to be fused, T i represents the down-sampling or up-sampling operation for the feature map to be fused to bring the feature map to the same size, ϕ f represents the concatenation of feature maps to obtain the fused feature map X f ; the feature fusion diagram is shown in Figure 9.

3. Experimental Details and Data Exploitation

3.1. Experimental Environment and Index Design

The experiment was performed on an Intel Xeon CPU E5-2609 with 16 GB of RAM, NVIDIA GeForce GTX 1080Ti with 11 GB of memory, Python 3.8.2, and PyTorch 1.4.0 for network model training and testing. The ship classification accuracy was defined as follows:
A c c u r a c y = T P + T N T P + F N + F P + T N
where TP, TN, FP, and FN are the numbers of true positives, true negatives, false positives, and false negatives, respectively.

3.2. Dataset

The experimental dataset was sourced from the images generated by the simulation system, and those collected from the web. Data enhancement techniques [31,32], such as cropping and scaling, were used in the experiment.

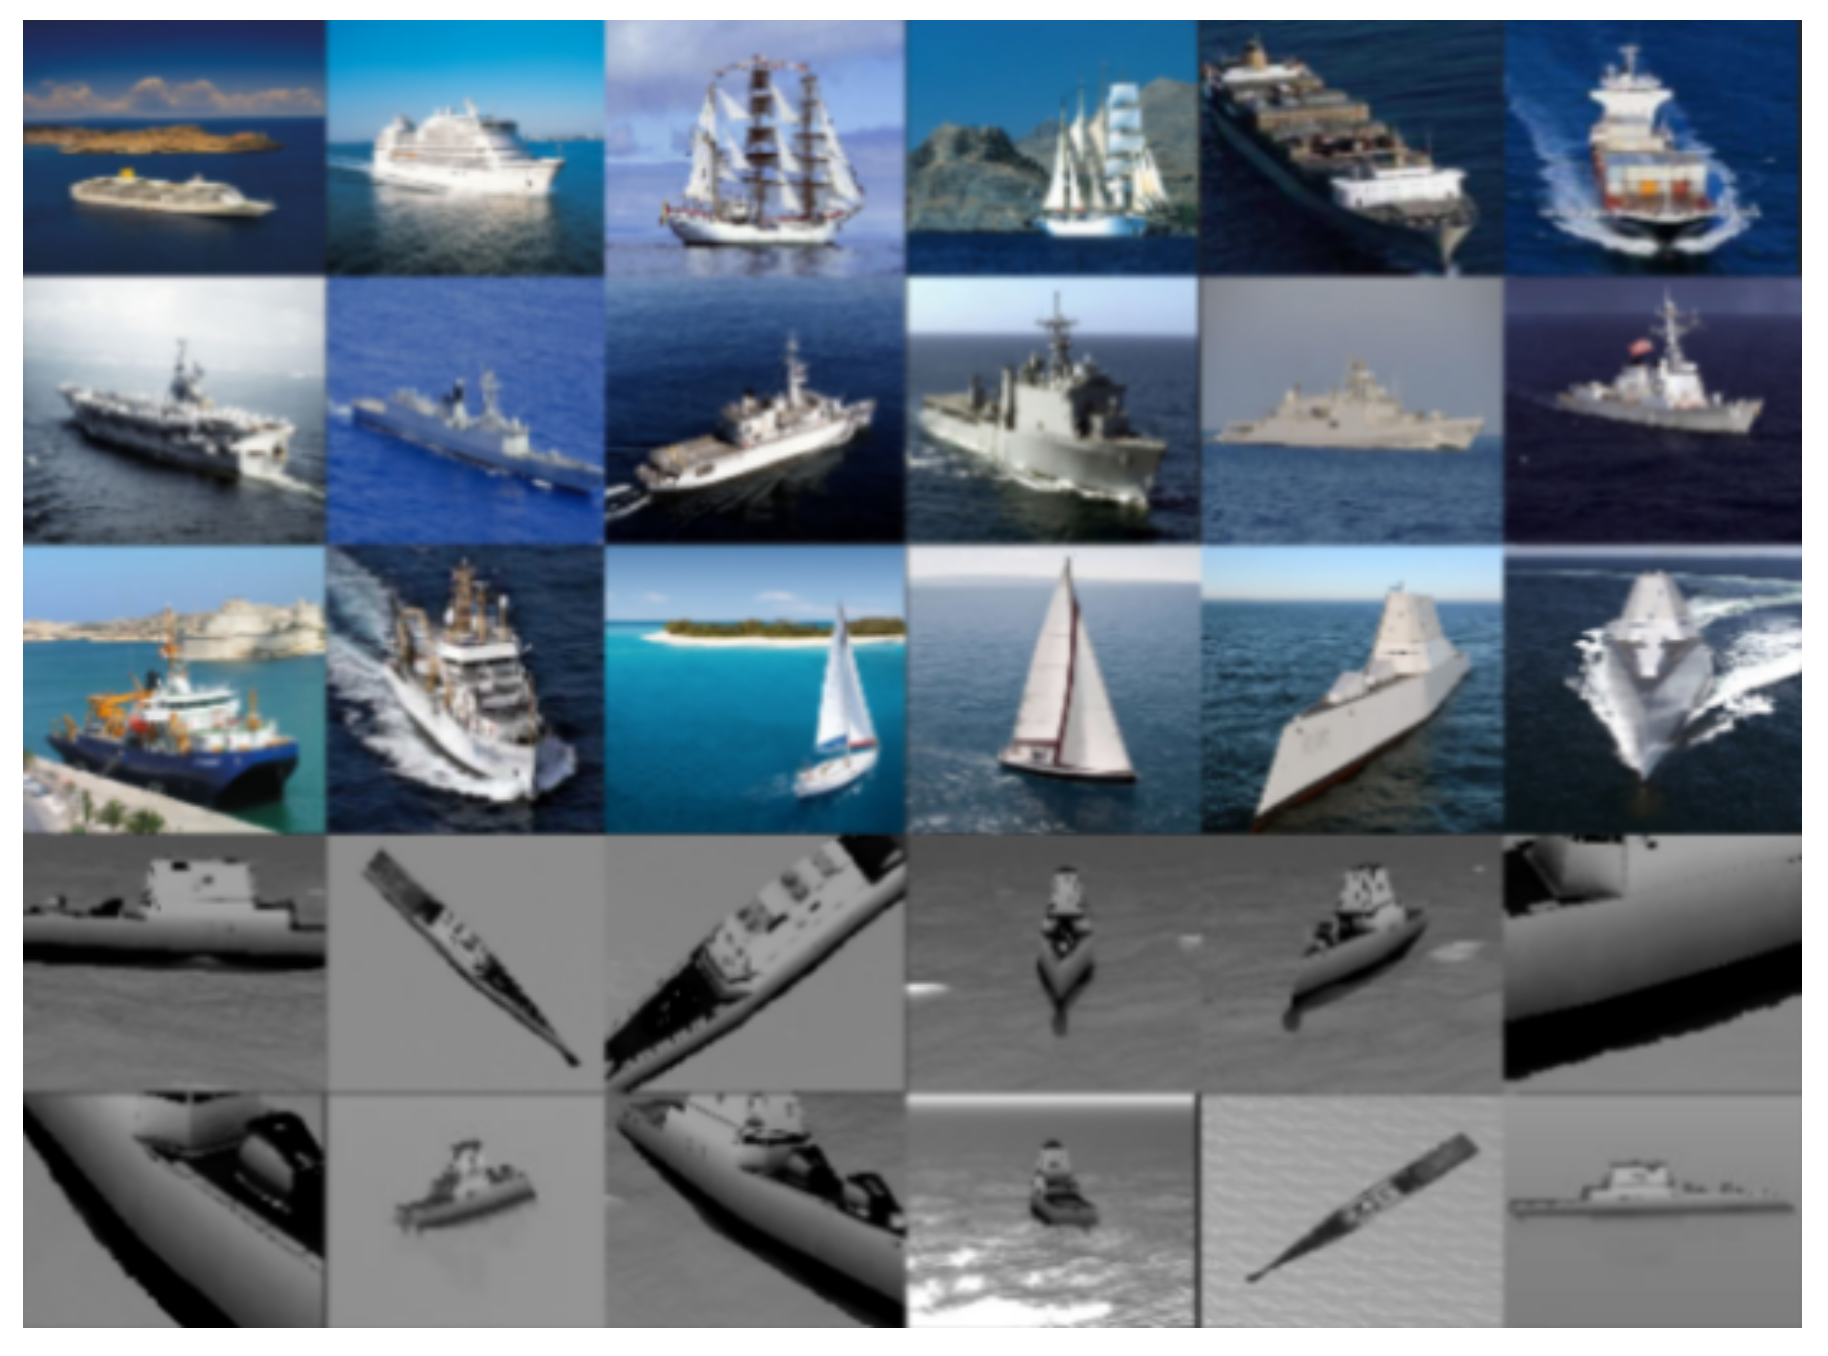
3.2.1. Real-Scene Ship Dataset

To verify the performance of our proposed FF-SqueezeNet, the datasets were all real images, including all types of warships and civilian ships such as cargo, cruise, sailing, and industrial ships. The training set comprised of 860 images, 50% warships and 50% civilian ships; the test set included 1011 images, 755 images of civilian ships, and 256 images of warships. The reason for this setting was that the number of civilian ships was significantly greater than the number of warships in the images obtained from the web. To ensure the data in the training set is balanced, we attempted to maintain the training set samples close to a 1:1 ratio. The settings of the real-scene ship dataset are listed in Table 1.

3.2.2. Mixed-Scene Ship Dataset

The mixed-scene ship dataset includes real-scene images of specific targets and non-specific targets, along with simulation-scene images of specific and non-specific targets. More specifically, a “specific target” represents the Zumwalt-class ship as shown in Figure 4. A “non-specific target” represents other types of ships. Table 2 summarizes the number of targets belonging to the two classes in the mixed-scene ship dataset.
Real-scene images of non-specific targets include cargo ships, cruise ships, sailboats, and work ships, whereas the simulation images of non-specific targets include targets such as industrial ships. We selected 25 high-quality real-scene ship images from each category to form the real sub-dataset of the mixed-scene ship dataset. The real-scene and simulation-scene images had various observation angles and observation distances, and the simulation images have various visibility conditions. To ensure the diversity of simulation samples, the selection of simulation samples covered different visibility, observation distance and direction as much as possible. We selected 150 high-quality simulation-scene images in each category as the simulation sub-dataset of the mixed-scene ship training set. The 150 images of each category were the simulation results of the platform at the squint distance of 1.0, 1.9, 2.5, 3.0, and 5 km, 15 sets of observation angles, and visibility of 20 and 23 km. Figure 10 shows some sample images from the dataset.

4. Results and Discussion

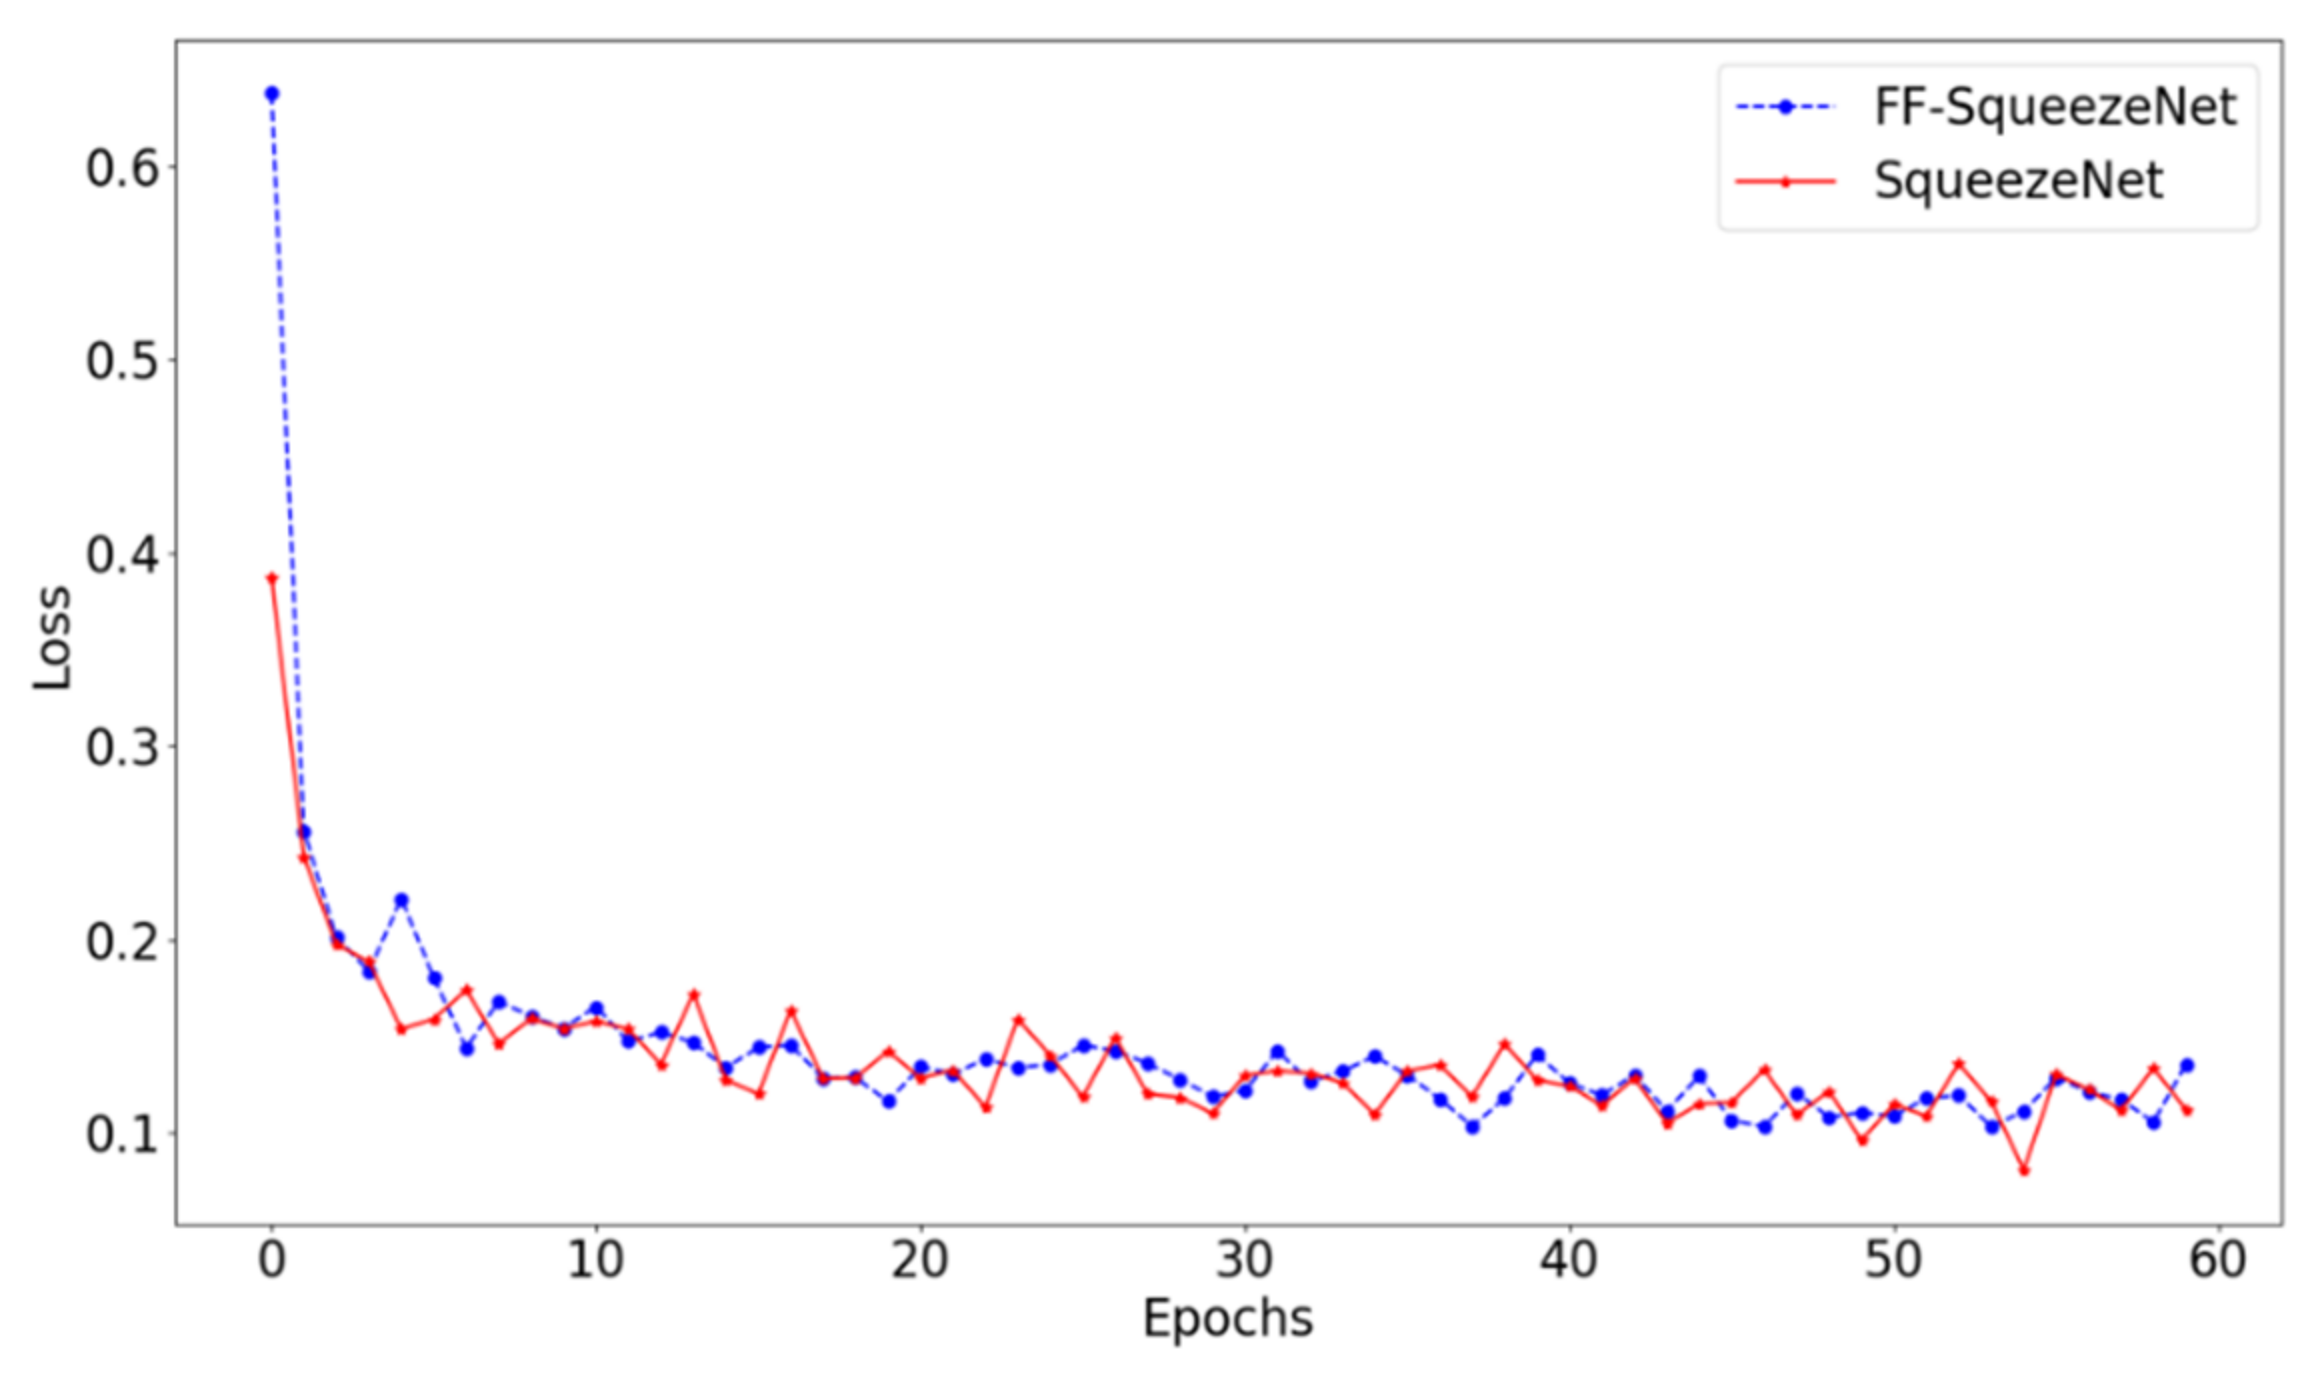
4.1. Performance of FF-SqueezeNet

To prove that the fusion of shallow and deep features can improve the performance of SqueezeNet, we compared the performance of the original algorithm and our FF-SqueezeNet on the real-scene ship dataset. The parameter settings were: A batch size of 16, 60 epochs, and initial learning rate of 0.001. We selected cross-entry loss as the loss function, whereas the Adam optimizer [33] was selected as the optimization algorithm. Dropout [34] was used as the over-fitting mitigation method, and the deletion ratio, P, was 0.5.
The two network models in the experiment were pretrained with the ImageNet dataset, and the loss curve outputs of both networks during training are shown in Figure 11.
As shown in Figure 11, the loss curve of the original SqueezeNet fluctuated significantly during the entire training process. Meanwhile, the loss curve of FF-SqueezeNet decreased rapidly in the initial training stage and subsequently decreased more gradually in the middle and late training periods. It is worth noting that the loss of the FF-SqueezeNet was significantly higher than that of the original SqueezeNet at the beginning of training. Both networks were pretrained on the ImageNet dataset. However, owing to the structural changes of the modified network, the matching between the network and initial weight was poor; therefore, the loss at the initial training stage was significant. With the increase in training rounds, the low-level and high-level features complemented each other and increased the richness of information, resulting in a rapid reduction of loss in the network and a relatively small change in later periods. The effect on the same test set demonstrates that FF-SqueezeNet outperforms the original SqueezeNet, as summarized in Table 3.
As presented in Table 3, compared with the original SqueezeNet, the performance of the algorithm improved by 4.23% using feature fusion. Moreover, it was proven that not only the high-dimensional semantic features play an important role but also the low-dimensional features are of great significance in the target classification task.

4.2. Improving the Performance of FF-SqueezeNet with Simulation-Scene Images

For the fine-grained ship classification task under low-altitude squint conditions, due to the scarcity of the “specific target” real-scene images, the classification accuracy of the algorithm model is seriously restricted. The experiment aimed to determine whether the target must be a specific target and verify whether the simulation-scene dataset can improve the performance of the algorithm to explore the importance of the simulation dataset as an extension of the real-scene dataset in the field of deep learning. Using the model trained on the real sub-dataset of the mixed-scene ship dataset as the baseline, we compared the model performance index before and after adding high-quality simulation-scene images. We tested the traditional k-nearest neighbors (KNN) algorithm, original SqueezeNet, and our FF-SqueezeNet algorithm. The results are summarized in Table 4.
As presented in Table 4, KNN, original SqueezeNet, and our FF-SqueezeNet improved the classification accuracy by expanding the dataset using the simulation-scene images. The detection accuracy reached 83.63% when only the real sub-dataset of the mixed-scene ship dataset was used. The performance of FF-SqueezeNet improved to 91.85% after the simulation-scene image was added, which is significantly higher than that of KNN. The original SqueezeNet improved performance by 11.72% before and after expanding the simulation images to the training set. On the mixed-scene ship dataset, our FF-SqueezeNet achieved 3.89% higher accuracy than the original algorithm. By comparing the experimental results of the original SqueezeNet and FF-SqueezeNet, the performance improvement of FF-SqueezeNet is more apparent in few-shot learning. The experimental results demonstrate the importance of data used for deep learning and the effectiveness of image simulation for improving the performance of the algorithm.

5. Conclusions

In this study, we considered the geometric and spectral characteristics of a ship target and marine background, combined with the atmospheric transmission link, and performed optical imaging simulation modeling of a tilted target. The multi-angle squint imaging simulation modeling of the ship target and ocean background in the visible light band was performed, thus providing simulation samples for the research of target recognition algorithms. Thereafter, we proposed FF-SqueezeNet to ensure that the low-dimensional and high-level semantic features complemented each other in the final output, thus enhancing feature information. Owing to the lack of real-scene images, effectively training an intelligent recognition algorithm is difficult. To address this problem, we used simulation images to expand the dataset and train our proposed FF-SqueezeNet. The results demonstrate that using simulation samples to expand the training set can effectively improve recognition performance of an algorithm.

Author Contributions

Conceptualization, L.L. and B.L.; methodology, B.L. and Q.X.; software, Q.X., W.N., Y.Z. and B.L.; validation, Q.X., W.N. and Y.Z.; formal analysis, L.L., Z.Y. and Y.Z.; investigation, B.L. and L.L.; data curation, B.L., W.N., Q.X. and Y.Z.; writing—original draft preparation, B.L. and L.L.; writing—review and editing, B.L. and L.L.; visualization, B.L. and Q.X.; supervision, L.L. and Z.Y.; project administration, L.L. and Z.Y. All authors have read and agreed to the published version of the manuscript.

Funding

This research received no external funding.

Institutional Review Board Statement

Not applicable.

Informed Consent Statement

Not applicable.

Data Availability Statement

The data used to support the findings of this study are available from the corresponding author upon request.

Conflicts of Interest

The authors declare no conflict of interest. The founding sponsors had no role in the design of the study; in the collection, analyses, or interpretation of data; in the writing of the manuscript, and in the decision to publish the results.

References

  1. Velotto, D.; Soccorsi, M.; Lehner, S. Azimuth ambiguities removal for ship detection using full polarimetric X-band SAR data. IEEE Trans. Geosci. Remote Sens. 2013, 52, 76–88. [Google Scholar] [CrossRef]
  2. Xi, Y.; Lang, H.; Tao, Y.; Huang, L.; Pei, Z. Four-component model-based decomposition for ship targets using PolSAR data. Remote Sens. 2017, 9, 621. [Google Scholar] [CrossRef] [Green Version]
  3. Farhadi, A.; Redmon, J. Yolo9000: Better, faster, stronger. In Proceedings of the IEEE Conference on Computer Vision and Pattern Recognition, Honolulu, HI, USA, 21–26 July 2017; pp. 6517–6525. [Google Scholar] [CrossRef] [Green Version]
  4. Krizhevsky, A.; Sutskever, I.; Hinton, G.E. ImageNet classification with deep convolutional neural networks. NIPS 2012, 1, 1097–1105. [Google Scholar] [CrossRef]
  5. Zeiler, M.D.; Fergus, R. Visualizing and understanding convolutional networks. In European Conference on Computer Vision; Springer Press: Zurich, Switzerland, 2014. [Google Scholar] [CrossRef] [Green Version]
  6. Simonyan, K.; Zisserman, A. Very deep convolutional networks for large-scale image recognition. Comput. Sci. 2014, 48, 135–148. [Google Scholar]
  7. He, K.M.; Zhang, X.Y.; Ren, S.Q.; Sun, J. Deep residual learning for image recognition. In Proceedings of the IEEE/CVF Conference on Computer Vision and Pattern Recognition, Las Vegas, NV, USA, 26 June–1 July 2016; pp. 770–778. [Google Scholar] [CrossRef] [Green Version]
  8. Zhang, Z.X.; Li, H.L.; Zhang, G.Q.; Zhu, W.P.; Liu, L.Y.; Liu, J.; Wu, N.J. CCNet: A high-speed cascaded convolutional neural network for ship detection with multispectral images. Infrared. Millim. Waves 2019, 38, 290–295. [Google Scholar]
  9. Lei, F.; Wang, W.; Zhang, W. Ship extraction using post CNN from high resolution optical remotely sensed images. In IEEE 3rd Information Technology, Networking, Electronic and Automation Control Conference; IEEE Press: Chengdu, China, 2019. [Google Scholar] [CrossRef]
  10. Liu, W.; Ma, L.; Chen, H. Arbitrary-oriented ship detection framework in optical remote-sensing images. IEEE Geosci. Remote Sens. Lett. 2018, 15, 937–941. [Google Scholar] [CrossRef]
  11. Goodfellow, I.J.; Pouget, A.J.; Mirza, M.; Xu, B.; Warde, D.; Ozair, S.; Courville, A.; Bengio, Y. Generative Adversarial Networks. Adv. Neural Inf. Process. Syst. 2014, 3, 2672–2680. [Google Scholar]
  12. Adam, A.G.; Scott, D.B. DIRSIG5: Next-Generation Remote Sensing Data and Image Simulation Framework. IEEE J. Sel. Top. Appl. Earth Obs. Remote Sens. 2017, 11, 4818–4833. [Google Scholar] [CrossRef]
  13. Tian, Y.L.; Li, X.; Wang, K.F.; Wang, F.Y. Training and Testing Object Detectors with Virtual Images. IEEE CAA J. Autom. Sin. 2018, 5, 539–546. [Google Scholar] [CrossRef] [Green Version]
  14. Wang, Z.B. Feasibility Study on Application of Simulated Images in Deep Learning. J. Biomech. 2019, 99, 109544. [Google Scholar] [CrossRef]
  15. Li, X.; Wang, K.F.; Tian, Y.L.; Yan, L.; Wang, F.Y. The ParallelEye Dataset: Constructing Large-Scale Artificial Scenes for Traffic Vision Research. In Proceedings of the International Conference on Intelligent Transportation Systems, Yokahama, Japan, 30 August 2018; pp. 2072–2084. [Google Scholar] [CrossRef]
  16. Sun, C.; Shrivastava, A.; Singh, S.; Gupta, A. Revisiting Unreasonable Effectiveness of Data in Deep Learning Era. In Proceedings of the IEEE International Conference on Computer Vision, Venice, Italy, 22–29 October 2017; pp. 852–863. [Google Scholar] [CrossRef] [Green Version]
  17. Howard, A.G.; Zhu, M.; Chen, B.; Sun, J. Mobile-nets: Efficient convolutional neural networks for mobile vision applications. arXiv 2017, arXiv:physics/1704.04861. [Google Scholar]
  18. Sandler, M.; Howard, A.; Zhu, M.L.; Zhmoginov, A.; Chen, L.C. Mobilenetv2: Inverted residuals and linear bottlenecks. In Proceedings of the IEEE/CVF Conference on Computer Vision and Pattern Recognition, Salt Lake City, UT, USA, 18–23 June 2018; pp. 4510–4520. [Google Scholar] [CrossRef] [Green Version]
  19. Zhang, X.Y.; Zhou, X.Y.; Lin, M.X.; Sun, J. Shuffle-net: An extremely efficient convolutional neural network for mobile devices. In Proceedings of the IEEE/CVF Conference on Computer Vision and Pattern Recognition, Salt Lake City, UT, USA, 18–23 June 2018; pp. 6848–6856. [Google Scholar]
  20. Han, S.; Mao, H.; Dally, W.J. Deep compression: Compressing deep neural networks with pruning, trained quantization and Huffman coding. ICLR 2015, 56, 3–7. [Google Scholar] [CrossRef]
  21. Ren, D.Q.; Du, J.T.; Hua, F.; Yang, Y.; Han, L. Analysis of different atmospheric physical parameterizations in COAWST modeling system for the Tropical Storm Nock-ten application. Nat. Hazards 2016, 82, 903–920. [Google Scholar] [CrossRef] [Green Version]
  22. Mitchell, J.L. Real-Time Synthesis and Rendering of Ocean. Water. ATI Research Technical Report Marlboro; Citeseerx: Princeton, NJ, USA, 2005; pp. 121–126. [Google Scholar]
  23. Iandola, F.N.; Han, S.; Moskewicz, M.W.; Ashraf, K.; Dally, W.; Keutzer, K. SqueezeNet: AlexNet-level accuracy with 50x fewer parameters and <0.5 MB model size. arXiv 2016, arXiv:1602.07360. [Google Scholar]
  24. Szegedy, C.; Liu, W.; Jia, Y.; Sermanet, P.; Reed, S.; Anguelov, D.; Erhan, D.; Vanhoucke, V.; Rabinovich, A. Going deeper with convolutions. In Proceedings of the IEEE/CVF Conference on Computer Vision and Pattern Recognition, Boston, MA, USA, 8–10 June 2015; pp. 1–9. [Google Scholar]
  25. Lin, M.; Chen, Q.; Yan, S. Network in network. arXiv 2013, arXiv:1312.4400. [Google Scholar]
  26. Zeiler, M.D.; Fergus, R. Visualizing and understanding convolutional networks. ECCV 2014, 8689, 818–833. [Google Scholar]
  27. Zeiler, M.D.; Taylor, G.W.; Fergus, R. Adaptive deconvolutional networks for mid and high level feature learning. In International Conference on Computer Vision; IEEE Press: Barcelona, Spain, 2011; pp. 2018–2025. [Google Scholar] [CrossRef]
  28. Noh, H.; Hong, S.; Han, B. Learning deconvolution network for semantic segmentation. In Proceedings of the IEEE International Conference on Computer Vision, Santiago, Chile, 7–13 December 2015; pp. 1520–1528. [Google Scholar] [CrossRef] [Green Version]
  29. Zhou, B.L.; Khosla, A.; Lapedriza, A.; Oliva, A.; Torralba, A. Learning deep features for discriminative localization. In Proceedings of the IEEE/CVF Conference on Computer Vision and Pattern Recognition, Las Vegas, NV, USA, 27–30 June 2016; pp. 2921–2929. [Google Scholar] [CrossRef] [Green Version]
  30. Selvaraju, R.R.; Cogswell, M.; Das, A.; Vedantam, R.; Parikh, D.; Batra, D. Grad-CAM: Visual Explanations from Deep Networks via Gradient-Based Localization. IJCV Int. J. Comput. Vis. 2020, 128, 336–359. [Google Scholar] [CrossRef] [Green Version]
  31. Shorten, C.; Khoshgoftaar, T.M. A survey on image data augmentation for deep learning. J. Big Data 2019, 6, 60. [Google Scholar] [CrossRef]
  32. Cui, Z.; Zhang, M.; Cao, Z.; Cao, C. Image data augmentation for SAR sensor via generative adversarial nets. IEEE Access 2019, 7, 42255–42268. [Google Scholar] [CrossRef]
  33. Kingma, D.P.; Ba, J. Adam: A method for stochastic optimization. In Proceedings of the International Conference Learning Representations (ICLR), San Diego, CA, USA, 5–8 May 2015. [Google Scholar]
  34. Srivastava, N.; Hinton, G.; Krizhevsky, A.; Sutakever, I.; Salakhutdinov, R. Dropout: A simple way to prevent neural networks from overfitting. JMLR 2014, 15, 1929–1958. [Google Scholar]
Figure 1. Our framework for the recognition method of low-altitude squint optical ship target fused with simulation samples.
Remotesensing 13 02697 g001
Figure 2. Low-altitude squint detection scene and radiation effect diagram. (a) Specific imaging detection scene. (b) Radiation mechanism of imaging simulation for low-altitude squint imaging detection application scene.
Remotesensing 13 02697 g002
Figure 3. Framework of the visible light imaging simulation system.
Remotesensing 13 02697 g003
Figure 4. Specific ship target appearance diagram (real-scene image).
Remotesensing 13 02697 g004
Figure 5. Sample simulation results under typical visibility and detection altitude conditions. The first row of the image represents the simulation results of the platform with a height of 260 m and visibility of 12, 15, and 18 km. The second row of the image represents the simulation results of the platform with a height of 150 m and visibility of 12, 15, and 18 km.
Remotesensing 13 02697 g005
Figure 6. Simulation results of the ship target scene in the visible light band for different squint distances and viewing angles under the conditions of 15° of solar altitude angle, mid-latitude summer atmospheric model, marine aerosol type, and visibility of 23 km.
Remotesensing 13 02697 g006aRemotesensing 13 02697 g006b
Figure 7. Feature maps of some neurons in the Fire module of SqueezeNet. (a) Input image of the network; (b) result of the characteristic graph of some channels of SqueezeNet’s Fire1, Fire3, Fire5, and Fire7.
Remotesensing 13 02697 g007
Figure 8. The network architecture of our modified SqueezeNet with feature fusion (FF-SqueezeNet).
Remotesensing 13 02697 g008
Figure 9. Feature fusion diagram of our FF-SqueezeNet middle layer.
Remotesensing 13 02697 g009
Figure 10. Sample images from the mixed-scene ship dataset.
Remotesensing 13 02697 g010
Figure 11. Loss curves of the original SqueezeNet and our FF-SqueezeNet.
Remotesensing 13 02697 g011
Table 1. Setting of the real-scene ship dataset.
ClassImage TypeNumber of Training Set ImagesNumber of Test Set Images
WarshipReal-scene image430256
Simulation-scene image00
Civilian shipsReal-scene image430755
Simulation-scene image00
Total8601011
Table 2. Setting of the mixed-scene ship dataset.
ClassImage TypeNumber of Training Set ImagesNumber of Test Set Images
Specific targetReal-scene image2515
Simulation-scene image1500
Non-specific targetReal-scene image2515
Simulation-scene image1500
Total35030
Table 3. Performance comparison of original SqueezeNet and our proposed FF-SqueezeNet.
Algorithm ModelAccuracy
Original SqueezeNet84.31%
FF-SqueezeNet88.54%
Table 4. Comparison of experimental results before and after adding simulation-scene images.
AlgorithmDatasetAccuracy
Traditional algorithm (KNN)Real sub-dataset of mixed-scene ship dataset61.54%
Mixed-scene ship dataset78.41%
Original SqueezeNetReal sub-dataset of mixed-scene ship dataset76.24%
Mixed-scene ship dataset87.96%
FF-SqueezeNetReal sub-dataset of mixed-scene ship dataset83.63%
Mixed-scene ship dataset91.85%
Publisher’s Note: MDPI stays neutral with regard to jurisdictional claims in published maps and institutional affiliations.

