Correction: Kulk et al. Primary Production, an Index of Climate Change in the Ocean: Satellite-Based Estimates over Two Decades. Remote Sens. 2020, 12, 826

 ,
,  ,
, 
 , ,
, ,  ,
,  , , ,
, , ,  ,
,  ,
,  ,
,  add
Show full author list
add
Show full author list
1. Text Corrections
1.1. A Correction Has Been Made to the Abstract
1.2. Corrections Have Been Made to Results, 3.1 Global and Regional Annual Primary Production, Paragraph 1
1.3. Corrections Have Been Made to Results, 3.2. Trends in Primary Production, Paragraph 2
1.4. Corrections Have Been Made to Results, 3.2. Trends in Primary Production, Paragraph 3
1.5. Corrections Have Been Made to Results, 3.2. Trends in Primary Production, Paragraph 4
1.6. Corrections Have Been Made to Results, 3.3. Sensitivity of Primary Production to Changes in Photosynthetic Parameters, Paragraph 1
1.7. Corrections Have Been Made to Results, 3.3. Sensitivity of Primary Production to Changes in Photosynthetic Parameters, Paragraph 2
1.8. Corrections Have Been Made to Results, 3.4. Relationship between Photosynthetic Parameters and Primary Production, Paragraph 1
1.9. Corrections Have Been Made to the Discussion, Paragraph 1
1.10. Corrections Have Been Made to Discussion, Paragraph 2
1.11. A Correction Has Been Made to the Discussion, Paragraph 4
1.12. Corrections Have Been Made to Conclusions, Paragraph 1
1.13. A Correction Has Been Made to Appendix A. Model of Daily Water-Column Primary Production, Appendix A.2 Irradiance Field, Paragraph 1
2. Figure/Table Corrections
2.1. Corrections Have Been Made to Table 2

| Mean P-I | ||||||
| Coastal | Polar | Trades | Westerlies | Total | ||
| 47 × 106 | 57 × 106 | 141 × 106 | 131 × 106 | 376 × 106 | ||
| Antarctic | 79 × 106 | 1.06 ± 0.09 (0.88−1.21) | 4.83 ± 0.14 (4.66–5.14) | 5.88 ± 0.19 (5.58–6.20) | ||
| Atlantic | 94 × 106 | 3.13 ± 0.16 (2.89–3.33) | 1.54 ± 0.09 (1.39–1.76) | 6.52 ± 0.14 (6.24–6.73) | 3.12 ± 0.05 (3.04–3.24) | 14.3 ± 0.38 (13.7–14.9) |
| Indian | 48 × 106 | 3.82 ± 0.18 (3.55–4.10) | 4.42 ± 0.12 (4.17–4.62) | 8.24 ± 0.30 (7.72–8.70) | ||
| Pacific | 155 × 106 | 4.76 ± 0.22 (4.34–5.03) | 0.91 ± 0.06 (0.80–1.02) | 9.21 ± 0.31 (8.57–9.62) | 7.39 ± 0.16 (7.09–7.60) | 22.3 ± 0.63 (21.2–23.1) |
| Total | 376 × 106 | 11.7 ± 0.53 (10.9–12.4) | 3.51 ± 0.20 (3.12–3.85) | 20.2 ± 0.50 (19.1–20.7) | 15.3 ± 0.30 (15.0–15.9) | 50.7 ± 1.38 (48.7–52.5) |
| Mean P-I –1 Standard Deviation | ||||||
| Coastal | Polar | Trades | Westerlies | Total | ||
| 47 × 106 | 57 × 106 | 141 × 106 | 131 × 106 | 376 × 106 | ||
| Antarctic | 79 × 106 | 0.56 ± 0.04 (0.48–0.64) | 2.82 ± 0.09 (2.72–3.02) | 3.39 ± 0.11 (3.22–3.59) | ||
| Atlantic | 94 × 106 | 1.64 ± 0.08 (1.51–1.76) | 0.81 ± 0.05 (0.73–0.90) | 2.52 ± 0.06 (2.39–2.61) | 1.51 ± 0.03 (1.47–1.56) | 6.48 ± 0.19 (6.16–6.75) |
| Indian | 48 × 106 | 2.27 ± 0.10 (2.11–2.42) | 2.70 ± 0.08 (2.54–2.82) | 4.96 ± 0.17 (4.65–5.24) | ||
| Pacific | 155 × 106 | 2.35 ± 0.11 (2.12–2.49) | 0.52 ± 0.03 (0.45–0.58) | 5.13 ± 0.18 (4.75–5.34) | 4.00 ± 0.09 (3.85–4.12) | 12.0 ± 0.34 (11.4–12.5) |
| Total | 376 × 106 | 6.26 ± 0.28 (5.79–6.64) | 1.89 ± 0.10 (1.70–2.06) | 10.3 ± 0.27 (9.75–10.6) | 8.34 ± 0.17 (8.13–8.66) | 26.8 ± 0.74 (25.7–27.8) |
| Mean P-I +1 Standard Deviation | ||||||
| Coastal | Polar | Trades | Westerlies | Total | ||
| 47 × 106 | 57 × 106 | 141 × 106 | 131 × 106 | 376 × 106 | ||
| Antarctic | 79 × 106 | 1.49 ± 0.14 (1.24–1.71) | 6.71 ± 0.19 (6.48–7.14) | 8.20 ± 0.26 (7.78–8.63) | ||
| Atlantic | 94 × 106 | 4.57 ± 0.23 (4.21–4.86) | 2.27 ± 0.14 (2.05–2.61) | 10.4 ± 0.22 (9.95–10.7) | 4.70 ± 0.08 (4.58–4.87) | 21.9 ± 0.58 (20.9–22.8) |
| Indian | 48 × 106 | 5.34 ± 0.26 (4.96–5.72) | 6.07 ± 0.17 (5.71–6.34) | 11.4 ± 0.42 (10.7–12.0) | ||
| Pacific | 155 × 106 | 7.08 ± 0.32 (6.47–7.49) | 1.30 ± 0.08 (1.13–1.46) | 13.2 ± 0.44 (12.3–13.8) | 10.6 ± 0.23 (10.2–10.9) | 32.1 ± 0.92 (30.6–33.4) |
| Total | 376 × 106 | 17.0 ± 0.77 (15.8–18.0) | 5.07 ± 0.30 (4.48–5.56) | 29.6 ± 0.73 (28.1–30.4) | 22.0 ± 0.43 (21.5–22.8) | 73.7 ± 2.00 (70.8–76.2) |
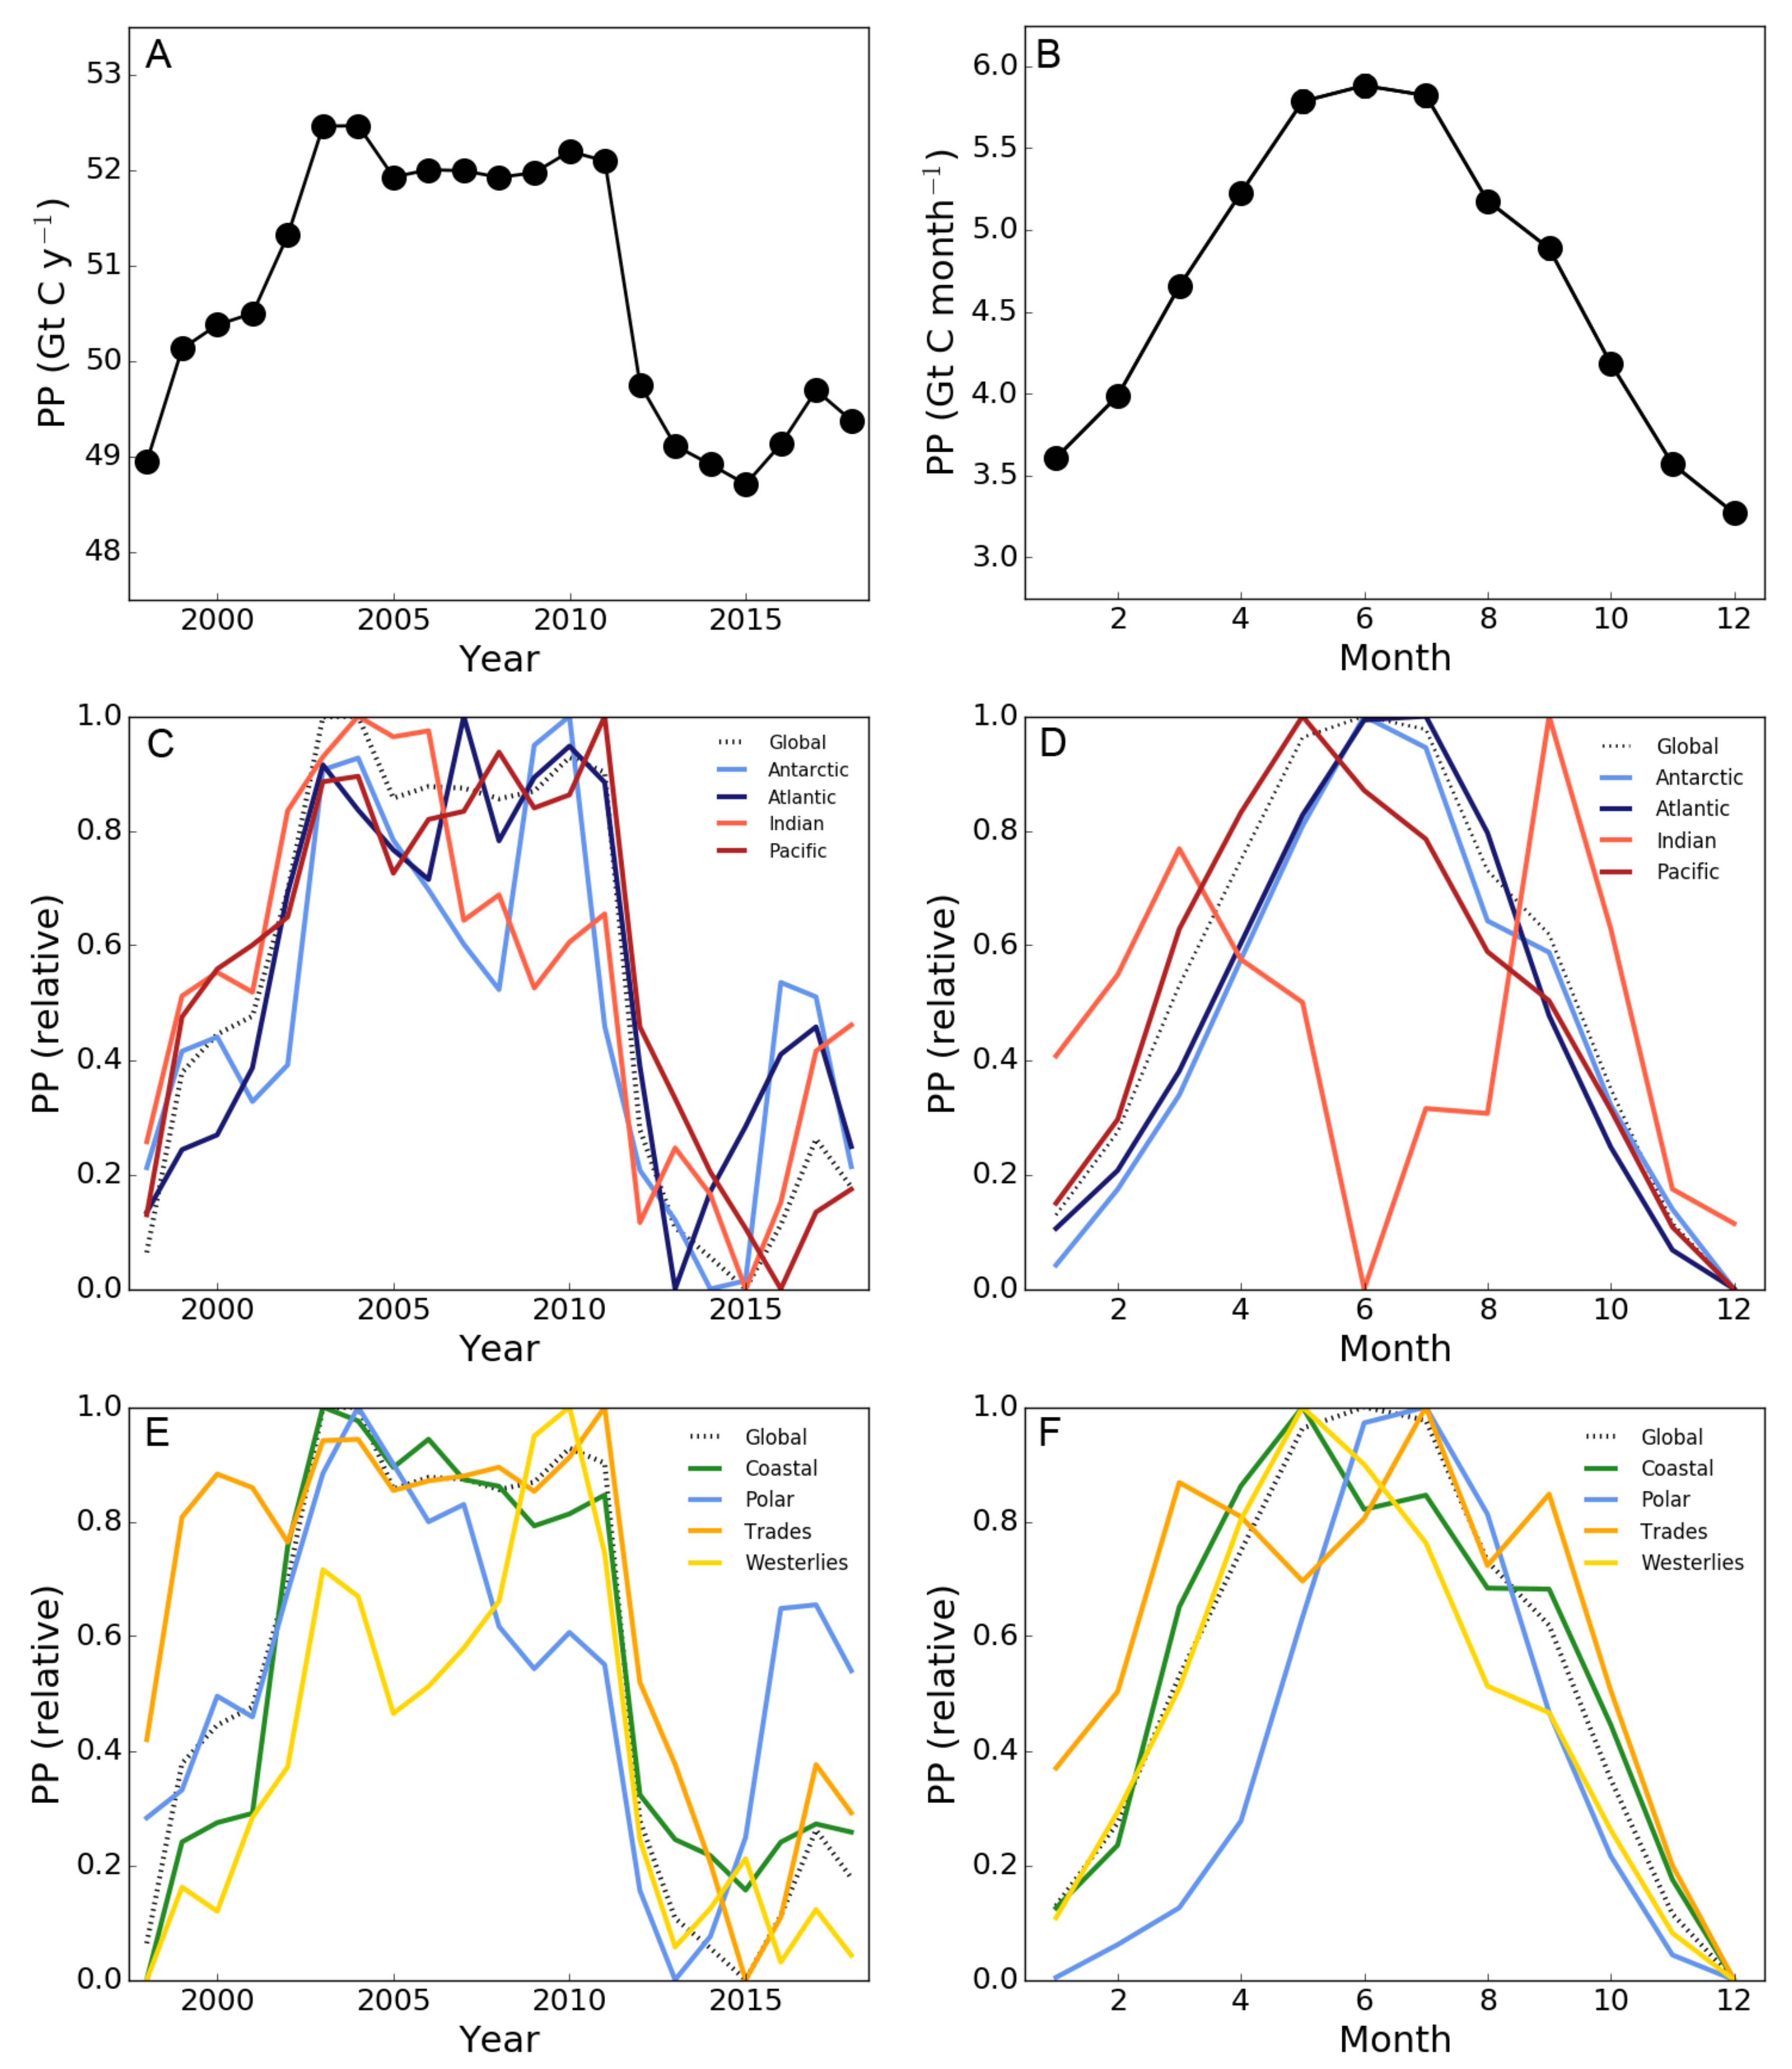
2.2. Corrections Have Been Made to Figure 3
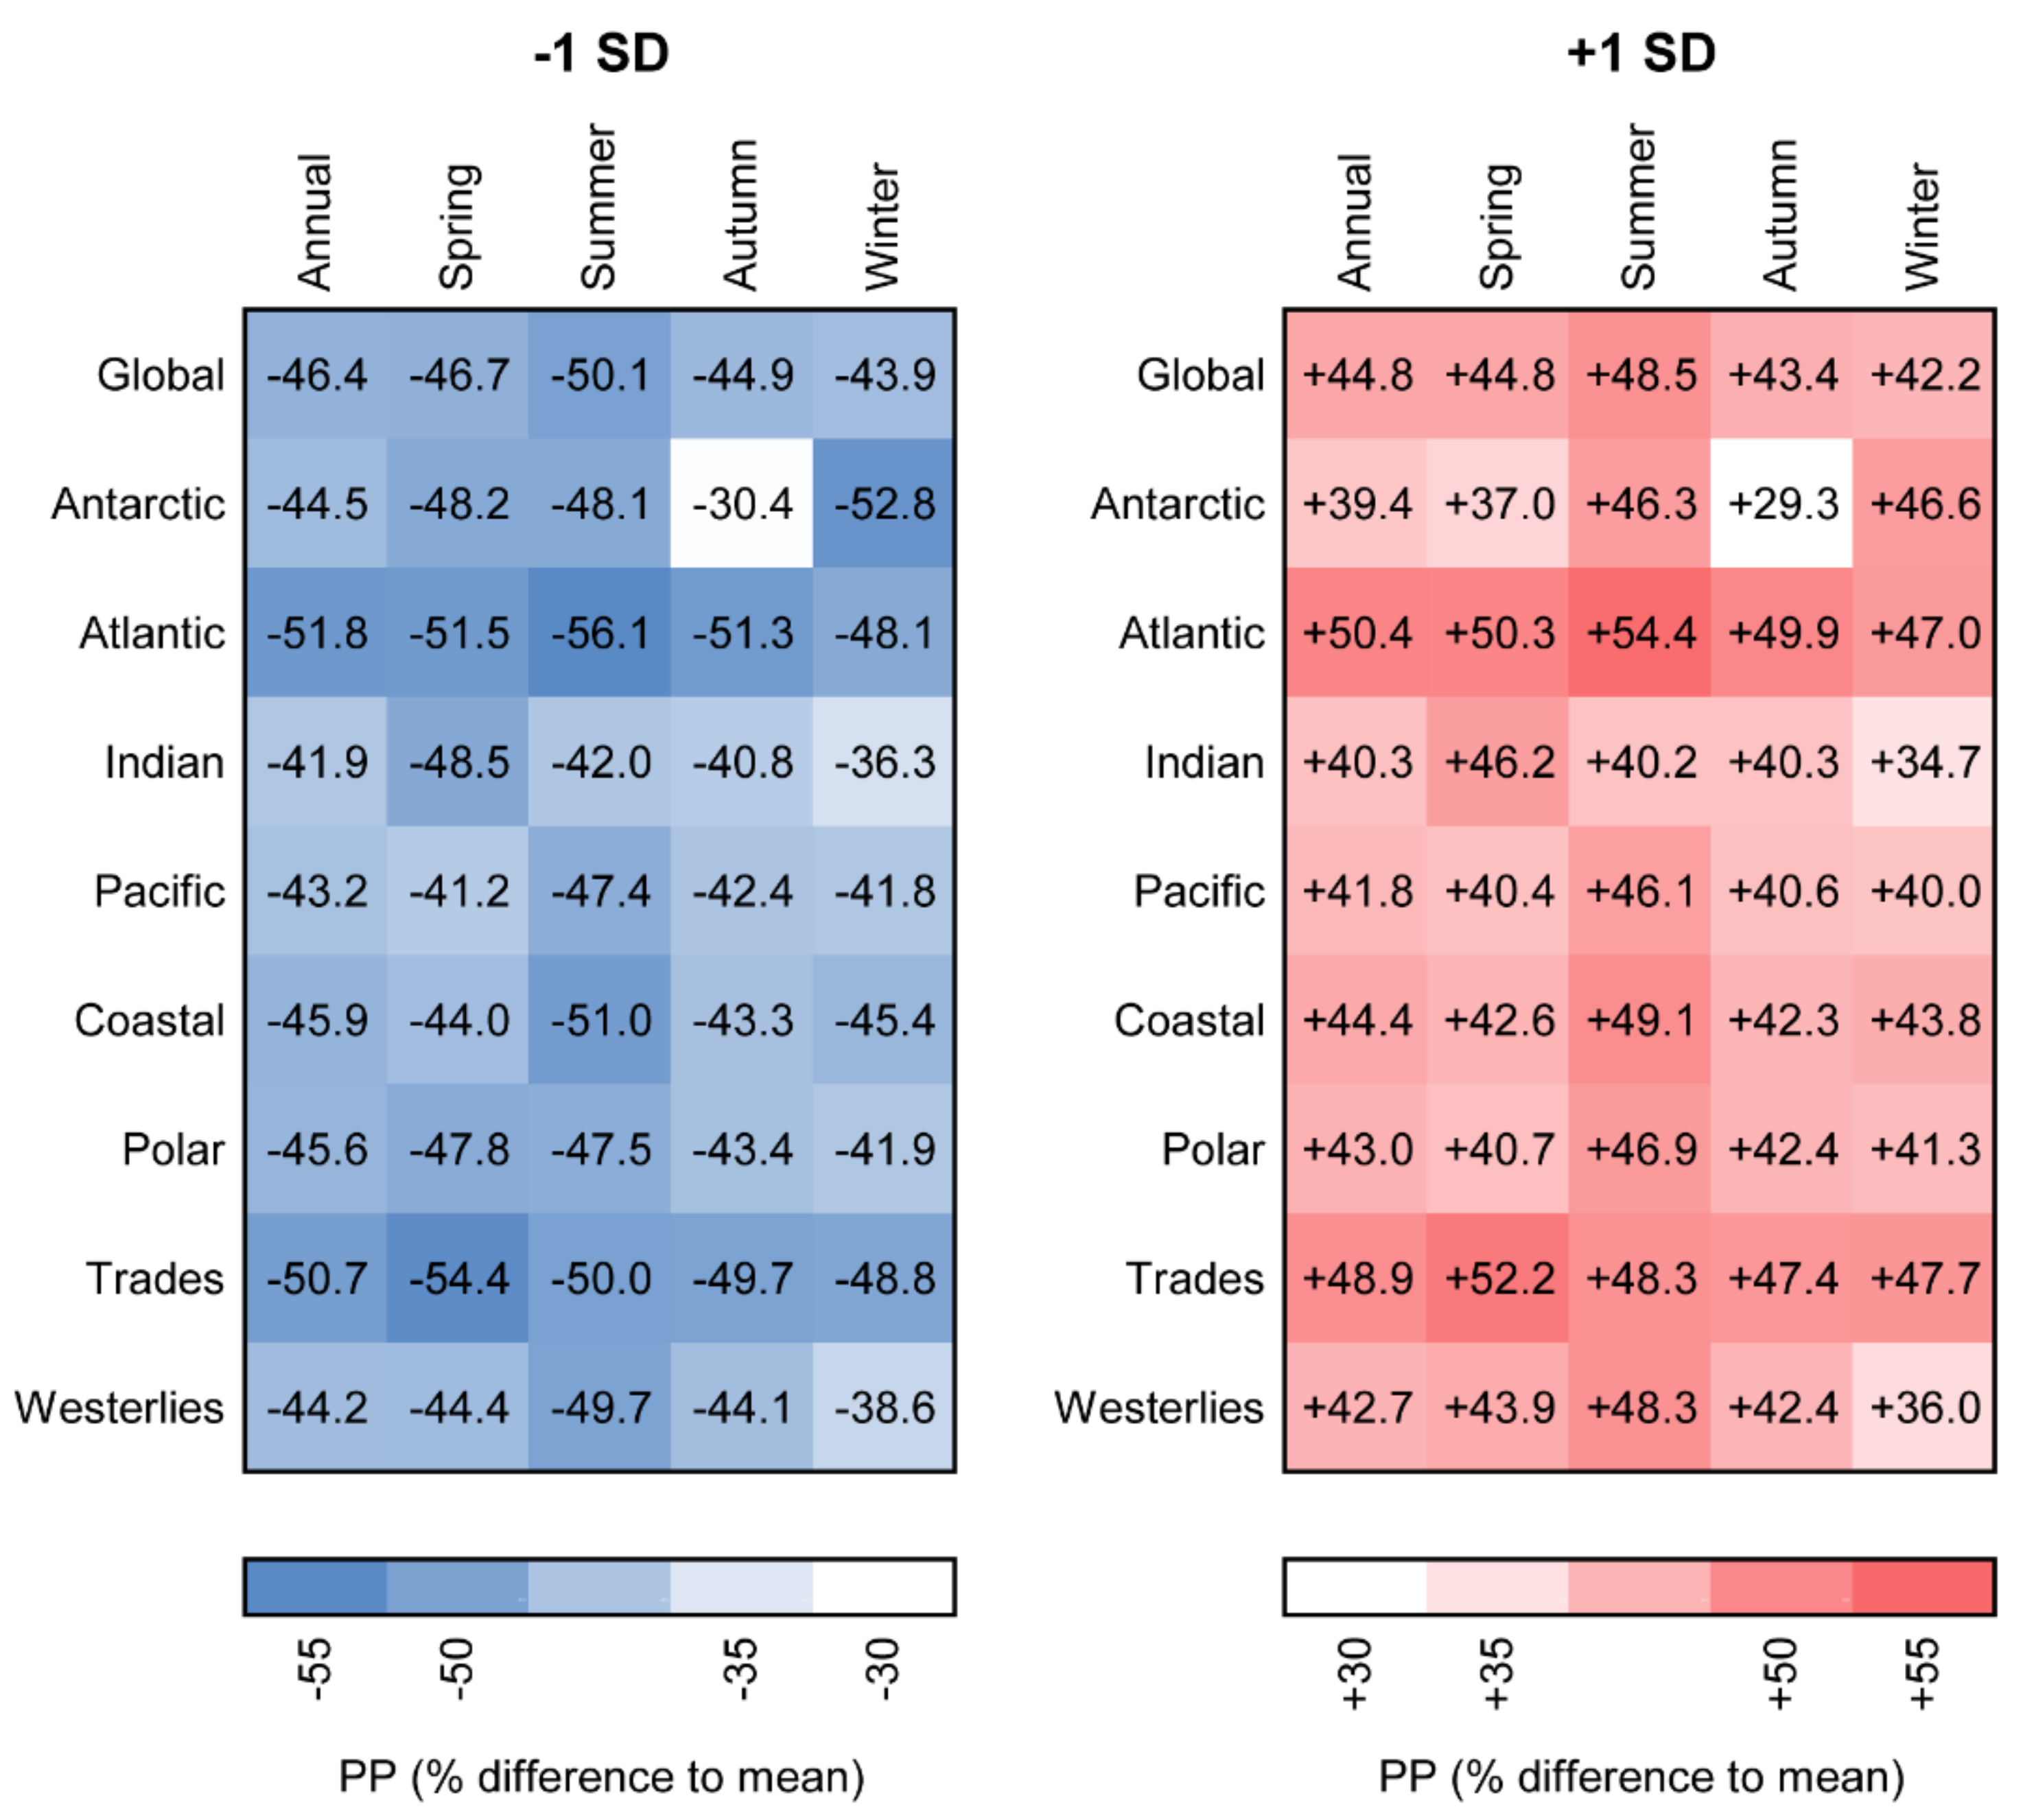
2.3. Corrections Have Been Made to Figure 4

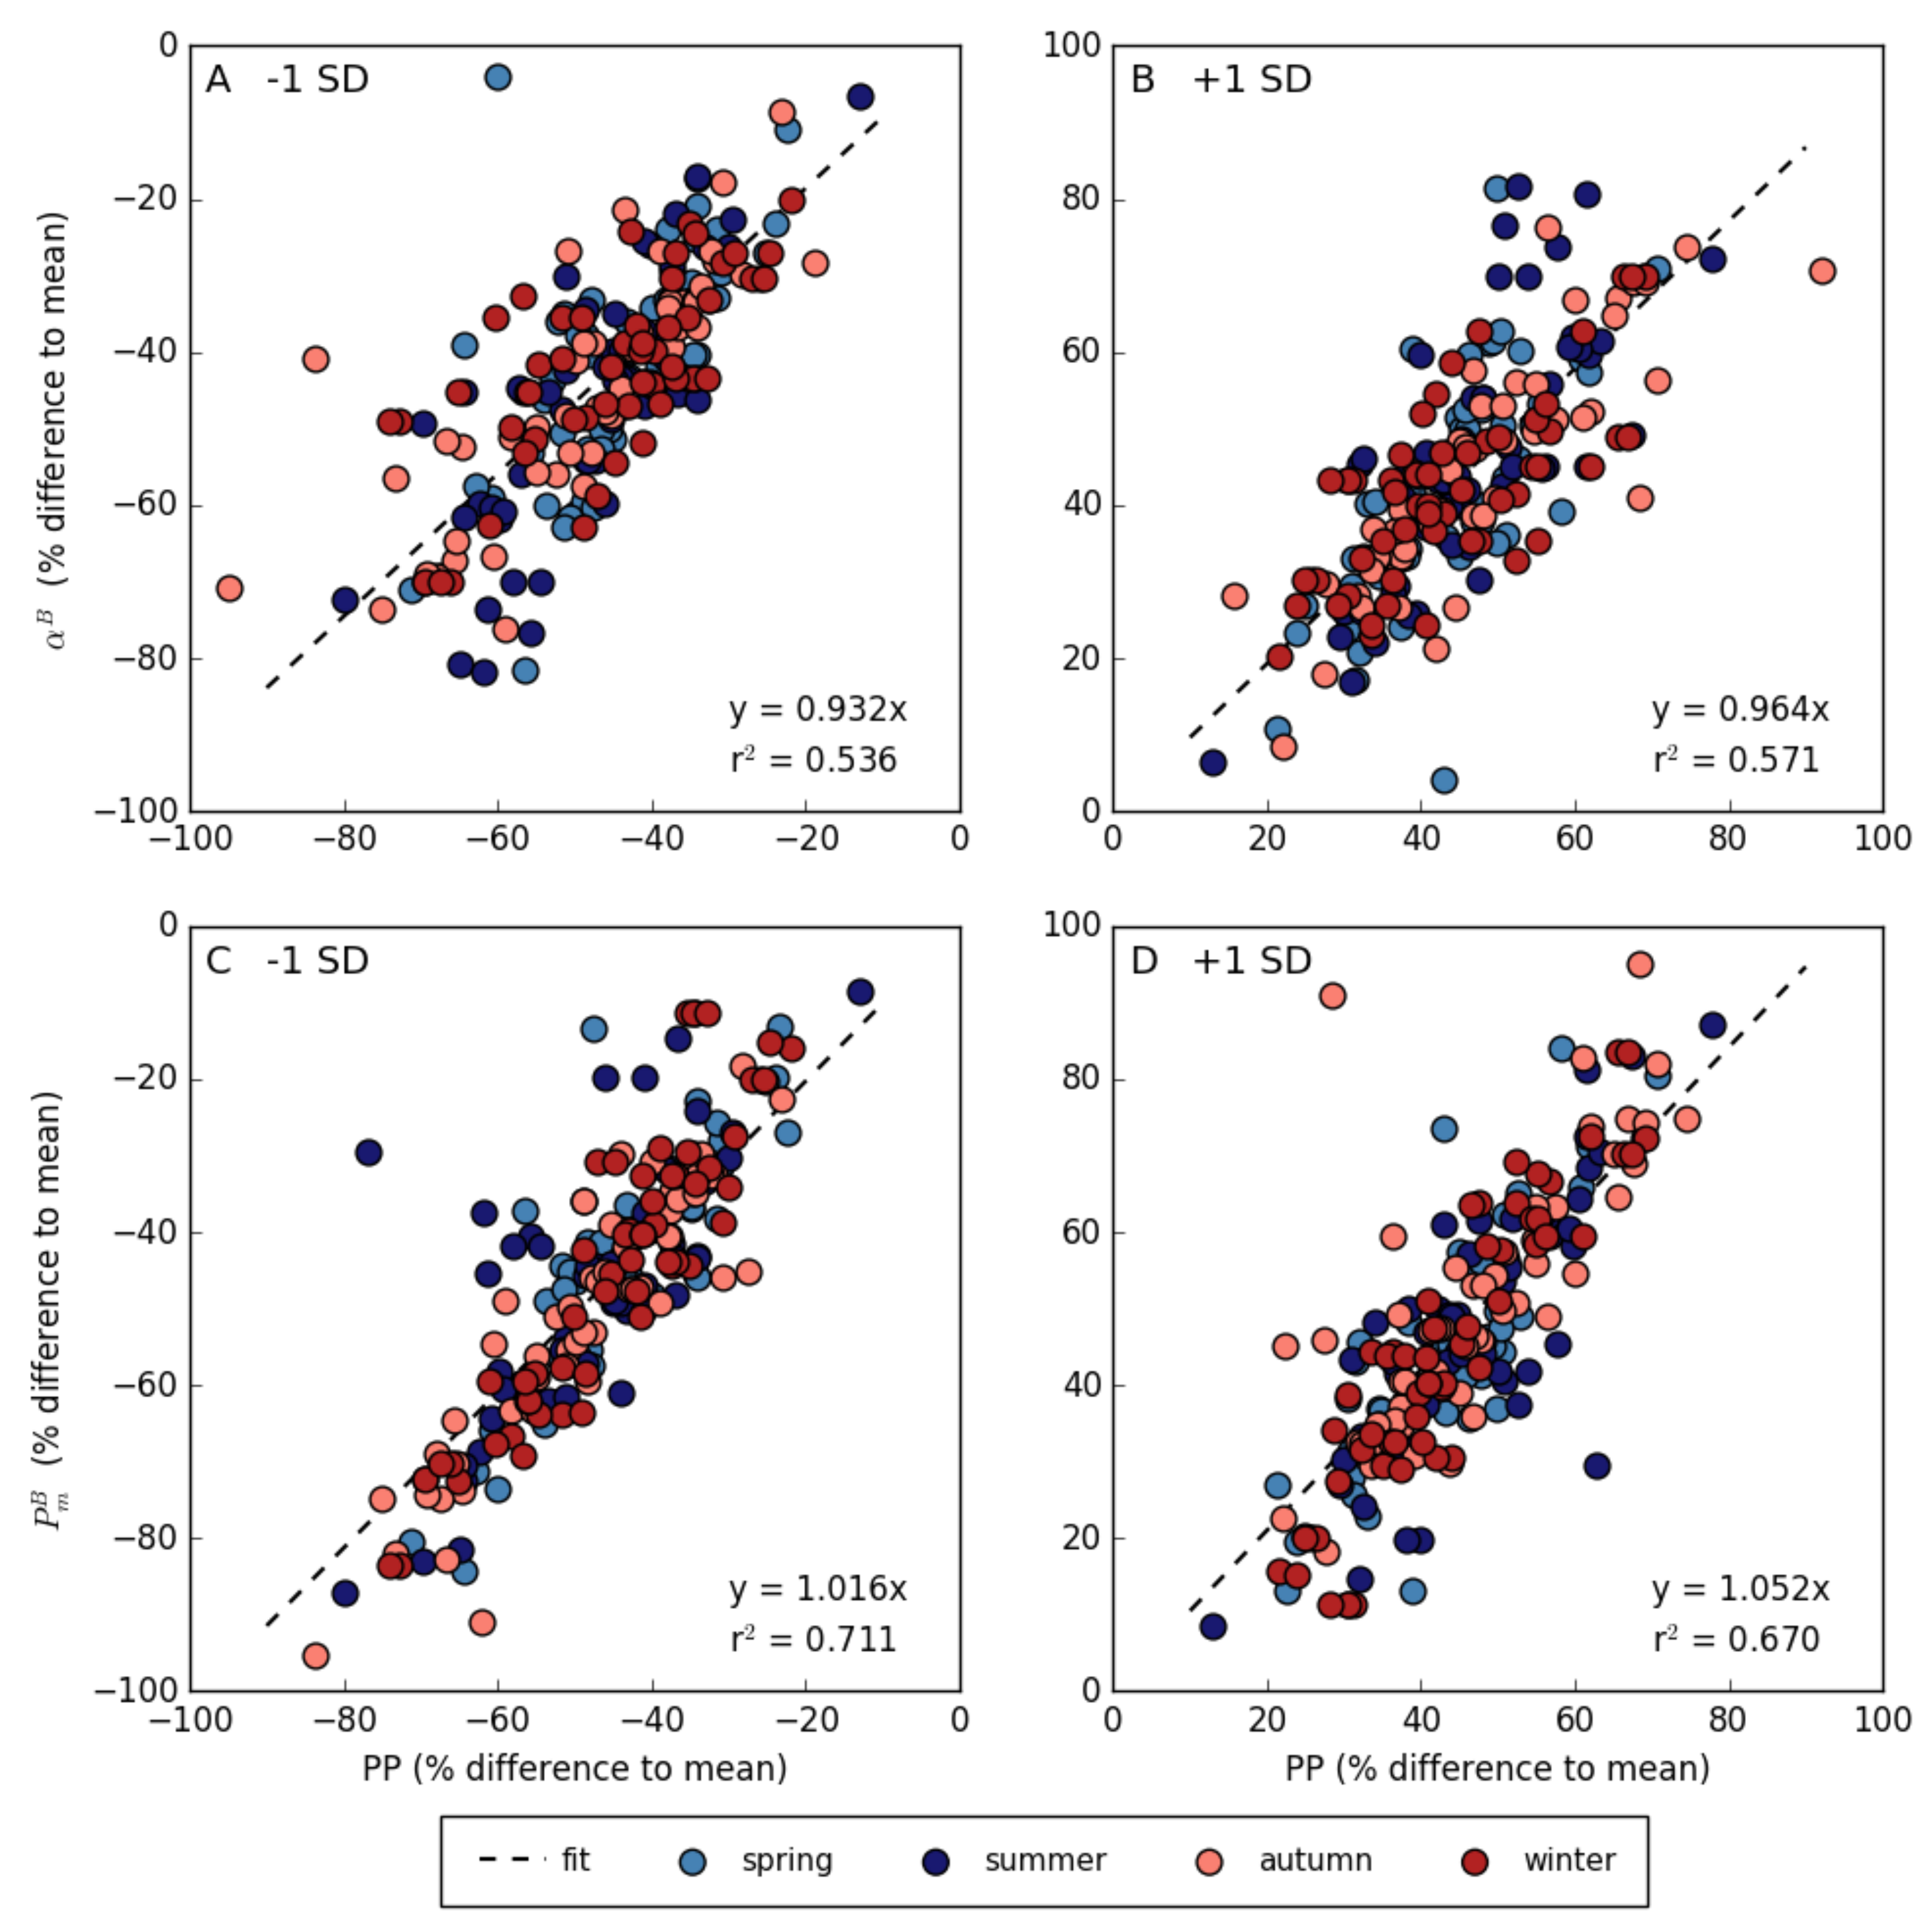
2.4. Corrections Have Been Made to Figure 5

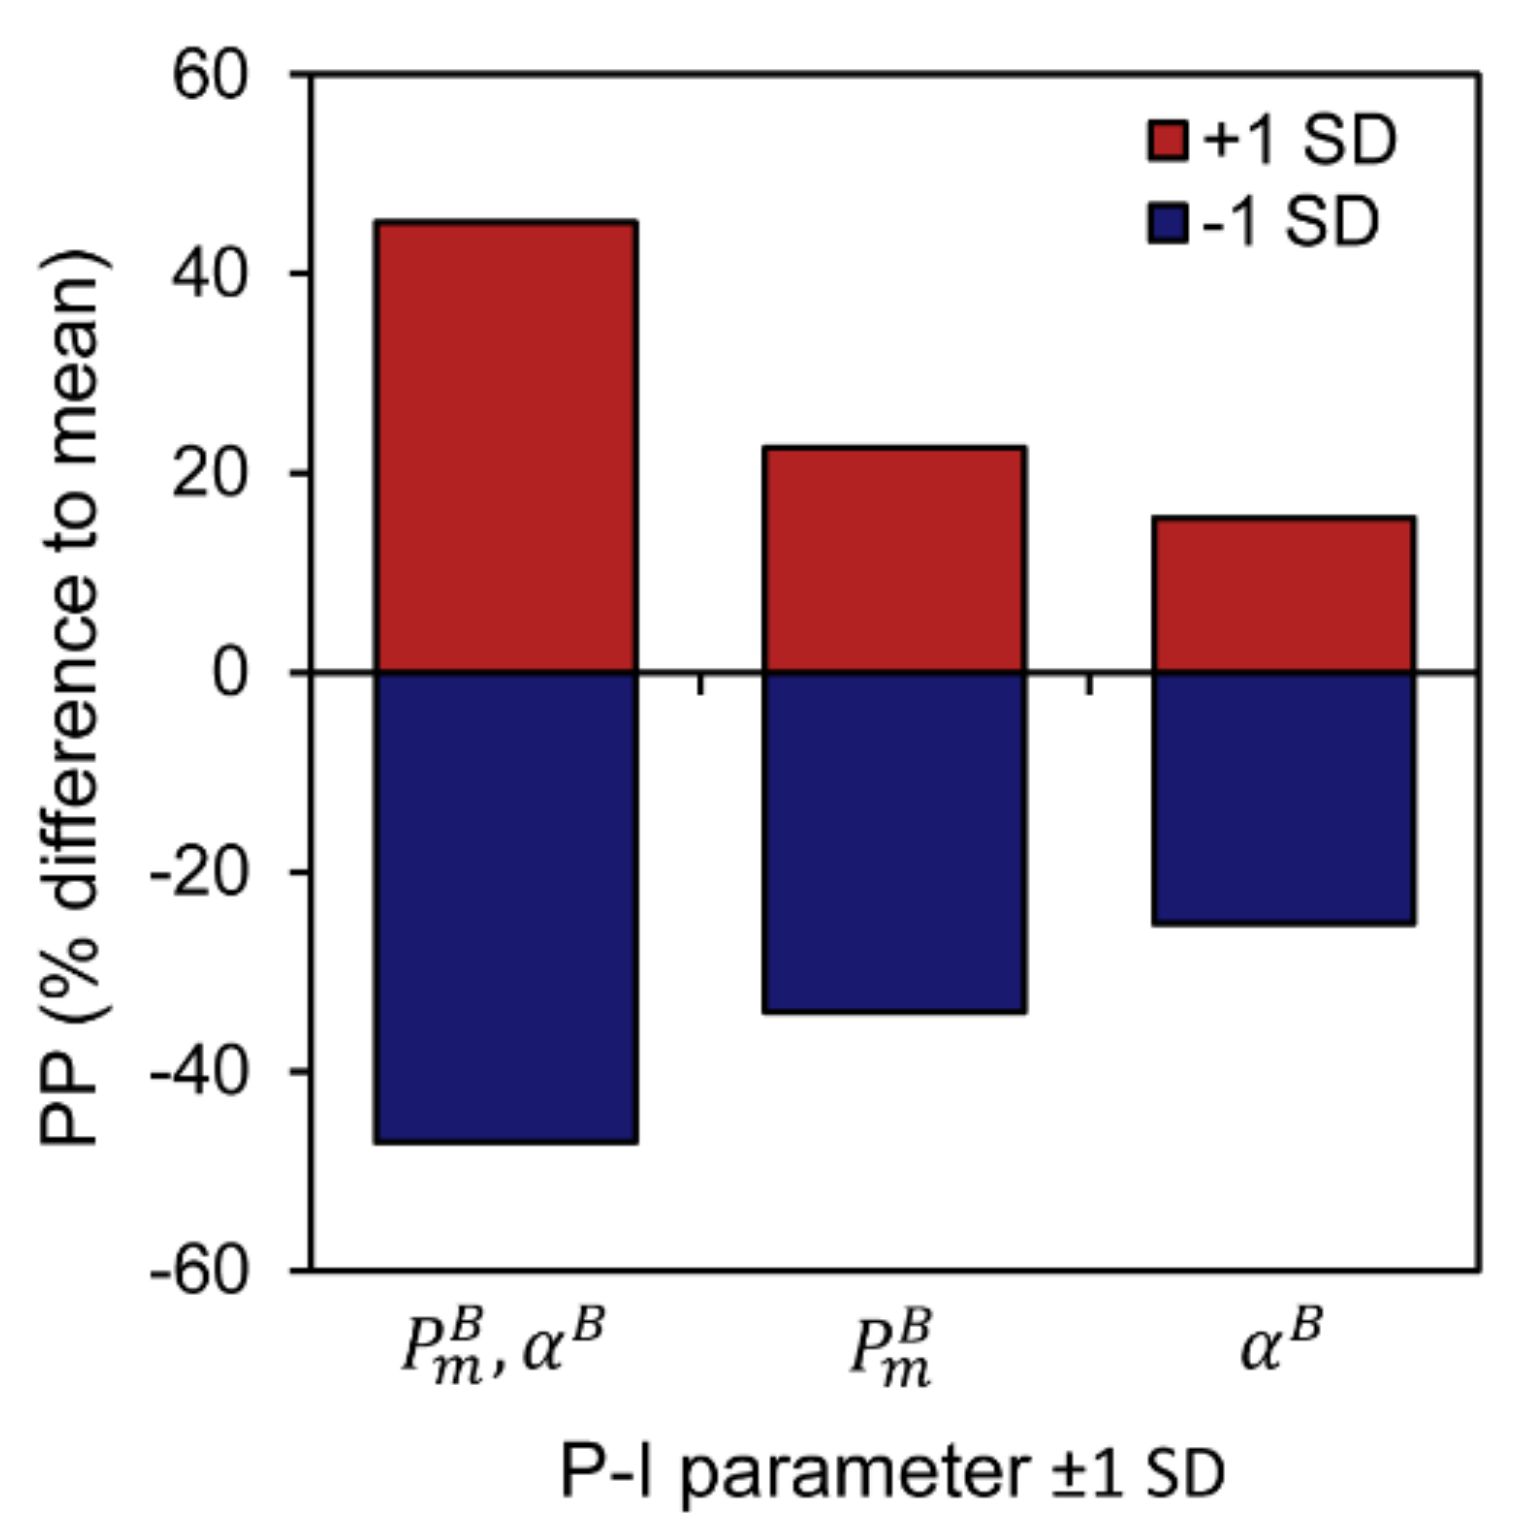
2.5. Corrections Have Been Made to Figure 6

2.6. Corrections Have Been Made to Figure 7

Reference
- Kulk, G.; Platt, T.; Dingle, J.; Jackson, T.; Jönsson, B.F.; Bouman, H.A.; Babin, M.; Brewin, R.J.W.; Doblin, M.; Estrada, M.; et al. Primary Production, an Index of Climate Change in the Ocean: Satellite-Based Estimates over Two Decades. Remote Sens. 2020, 12, 826. [Google Scholar] [CrossRef] [Green Version]
Publisher’s Note: MDPI stays neutral with regard to jurisdictional claims in published maps and institutional affiliations. |
© 2021 by the authors. Licensee MDPI, Basel, Switzerland. This article is an open access article distributed under the terms and conditions of the Creative Commons Attribution (CC BY) license (https://creativecommons.org/licenses/by/4.0/).
Share and Cite
Kulk, G.; Platt, T.; Dingle, J.; Jackson, T.; Jönsson, B.F.; Bouman, H.A.; Babin, M.; Brewin, R.J.W.; Doblin, M.; Estrada, M.; et al. Correction: Kulk et al. Primary Production, an Index of Climate Change in the Ocean: Satellite-Based Estimates over Two Decades. Remote Sens. 2020, 12, 826. Remote Sens. 2021, 13, 3462. https://doi.org/10.3390/rs13173462
Kulk G, Platt T, Dingle J, Jackson T, Jönsson BF, Bouman HA, Babin M, Brewin RJW, Doblin M, Estrada M, et al. Correction: Kulk et al. Primary Production, an Index of Climate Change in the Ocean: Satellite-Based Estimates over Two Decades. Remote Sens. 2020, 12, 826. Remote Sensing. 2021; 13(17):3462. https://doi.org/10.3390/rs13173462
Chicago/Turabian StyleKulk, Gemma, Trevor Platt, James Dingle, Thomas Jackson, Bror F. Jönsson, Heather A. Bouman, Marcel Babin, Robert J. W. Brewin, Martina Doblin, Marta Estrada, and et al. 2021. "Correction: Kulk et al. Primary Production, an Index of Climate Change in the Ocean: Satellite-Based Estimates over Two Decades. Remote Sens. 2020, 12, 826" Remote Sensing 13, no. 17: 3462. https://doi.org/10.3390/rs13173462
APA StyleKulk, G., Platt, T., Dingle, J., Jackson, T., Jönsson, B. F., Bouman, H. A., Babin, M., Brewin, R. J. W., Doblin, M., Estrada, M., Figueiras, F. G., Furuya, K., González-Benítez, N., Gudfinnsson, H. G., Gudmundsson, K., Huang, B., Isada, T., Kovač, Ž., Lutz, V. A., ... Sathyendranath, S. (2021). Correction: Kulk et al. Primary Production, an Index of Climate Change in the Ocean: Satellite-Based Estimates over Two Decades. Remote Sens. 2020, 12, 826. Remote Sensing, 13(17), 3462. https://doi.org/10.3390/rs13173462