Abstract
For the first time thermospheric parameters (neutral composition, exospheric temperature and vertical plasma drift related to thermospheric winds) have been inferred for ionospheric G-conditions observed with Millstone Hill ISR on 11–13 September 2005; 13 June 2005, and 15 July 2012. The earlier developed method to extract a consistent set of thermospheric parameters from ionospheric observations has been revised to solve the problem in question. In particular CHAMP/STAR and GOCE neutral gas density observations were included into the retrieval process. It was found that G-condition days were distinguished by enhanced exospheric temperature and decreased by ~2 times of the column atomic oxygen abundance in a comparison to quiet reference days, the molecular nitrogen column abundance being practically unchanged. The inferred upward plasma drift corresponds to strong ~90 m/s equatorward thermospheric wind presumably related to strong auroral heating on G-condition days.
1. Introduction
Ionospheric F2-layer is the main layer in the Earth’s ionosphere with maximum electron concentration NmF2, which is normally larger than in other ionospheric layers under various geophysical conditions. However, sometimes F2-layer disappears on the ground-based sounding ionograms due to its blanketing by underling F1-layer telling us that critical frequency foF2 becomes ≤ foF1. According to the URSI handbook of ionogram interpretation and reduction [1], such situation is referred to as G-condition. G is just a descriptive letter indicating conditions of ground-based ionospheric sounding observations. During G-conditions no ionospheric information is available from the heights above F1-layer maximum normally located below 200 km. Therefore, any observations of the F2-layer under G-conditions are possible either with topside ionospheric sounding [2] or Incoherent Scatter Radars (ISR). In principle ionospheric radio-occultation (RO) observations provide the whole Ne(h) profiles but a comparison with Millstone Hill ISR observations [3] has shown large disagreement in the bottom-side of Ne(h), especially in summer when the occurrence probability of G-conditions is maximal ([4], Figure 11). Moreover, G-conditions are mainly associated with the periods of geomagnetic disturbances ([4], Figure 1) when large spatial gradients take place in the ionosphere, while RO method implies a spherical symmetry. Therefore, RO observations hardly can be used for analyses of G-conditions. Theoretically, rocket launching sonde observations can provide the whole Ne(h) profile, but such experiments were conducted in the past in the beginning of the space era and we do not know any published results of such observations during G-conditions. Topside ionospheric sounding also has some limitations. For instance, when NmF2 ≤ NmF1 (such case is considered in our analysis) there is a large height range between two maxima which is invisible on the topside sounding ionograms. Moreover, satellite topside sounding observations do not allow the analysis of G-condition development in time at any particular location. Summarizing, one may conclude that ISR observation is the only source of information which may be used to analyze the G-condition formation mechanism. Along with this, a ground-based ionospheric sounding global network can be efficiently used for morphological analyses. For instance, Lobzin & Pavlov [4,5] have done a thorough and detailed morphological analysis of G-conditions using worldwide ground-based ionosonde observations over the 1957–1990 period. They have analyzed the occurrence probability (ψG) of G-conditions on season, local time, latitude, level of solar and geomagnetic activity. The ψG dependence on geomagnetic activity presented by Kp index is impressive—a well-pronounced linear dependence for log(ψG) versus Kp was revealed. It was found that the occurrence probability ψG strongly increased under large Kp although G-conditions occur under low geomagnetic activity as well. The undertaken morphological analysis has shown that “the dependence of the G condition occurrence probability on Kp is mainly determined by processes that control the behavior of the F2-layer with Kp changes”, while F1-layer only slightly reacts to geomagnetic disturbances. A weak reaction of F1-layer to geomagnetic activity was also stressed and analyzed from a physical point of view by Mikhailov & Schlegel [6].
Traditionally the formation of G-conditions in the ionospheric F2-layer is analyzed using model simulations. A good example of this approach may be found in the paper by Deminov et al. [7]. Using the MSISE00 thermospheric model [8] the authors have clearly shown how an increase of geomagnetic activity from Kp = 0 to Kp = 8 decreases NmF2 leaving practically unchanged NmF1 forming by this way G-condition in the ionosphere. Their model calculations were not related to any specific observations and give only a qualitative pattern of G-condition development.
An attempt to describe Millstone Hill ISR observations using the IZMIRAN model for quiet 23–25 June 1986 period when G-conditions took place during morning (07:32 LT) hours was undertaken by Pavlov & Buonsanto [9]. It was shown that neutral composition taken from the original MSIS-86 model [10] gives Ne(h) profile which has nothing in common with the observed one. The authors arbitrarily changed model atomic oxygen [O] and molecular nitrogen [N2] to get a better coincidence with the observed Ne(h). However, the final coincidence is not impressive at all (Figure 3). Similar attempt was repeated later by Schlesier & Buonsanto [11] to describe G-condition observed at Millstone Hill on 11 April 1997 at 09:53 LT. They also varied model MSIS-86 ratios N2/O and O2/O in model simulations to get a better coincidence with the observed Ne(h). The result is same: “none of the simulations give the correct electron density profile”. These results just confirm a well-known postulate—thermospheric parameters (neutral composition, temperature, thermospheric winds producing vertical plasma drift) and ionizing solar EUV flux should constitute a self-consistent set which allows to describe the observed Ne(h). Arbitrarily changing some of them is unproductive.
The aims of our analysis may be formulated as follows.
- Using Millstone Hill ISR observations to find cases with G-condition at various stages of its development: (a) when NmF2 ≈ NmF1, (b) when F2-layer maximum is present but NmF2 < NmF1, and (c) when F2-layer maximum is practically absent on the Ne(h) profile.
- To retrieve a consistent set of the main aeronomic parameters responsible for the formation of daytime mid-latitude F-layer using the earlier developed method to extract thermospheric parameters from ionospheric observations [12]. To Include CHAllenging Minisatellite Payload (CHAMP) and Gravity field and steady state Ocean Circulation Explorer (GOCE) neutral gas density observations in the vicinity of Millstone Hill to the retrieval process to increase the reliability of the inferred thermospheric parameters.
- To discuss the role of neutral composition in the G-condition formation mechanism.
2. Observations, Method, and Results
Millstone Hill ISR observations were analyzed to find noontime cases of G-condition with different degree of its development. There are many obstacles in this. The selection is burdened by a necessity to have a reference (not a perturbed day) close in time to a selected one. This is not always possible, keeping in mind that ISR works episodically. Zenith alternating-code basic parameters observation with a 4 km height step is desirable for this type of analysis to have a sufficient number of points at F1-region heights, while standard zenith single-pulse observations provide Ne(h) profiles with a 20 km height step, which is not a sufficient height resolution to analyze F1-region. Another restriction is related to satellite neutral gas density observations which should be included in the retrieval process. The selected dates of G-condition should coincide with available neutral gas density observations. Excellent CHAMP/STAR and GOCE neutral gas density (ρ) observations are used in our analysis. Therefore, the number of periods available for our consideration is limited to four cases: Sep 11/Sep 07, 2005; Sep 12/Sep 07, 2005; Sep 13/Sep 07, 2005; Jun 13/Jun 15, 2005; and Jul 15/Jul 14, 2012, where second dates are the reference ones.
Our method [12] to retrieve thermospheric parameters from ionospheric observations requires observed noontime foF2 and plasma frequencies at 180 km height, f180 for (10,11,12,13,14) LT; both may be taken from Millstone Hill Digisonde observations. The method is designed to work with routine ground-based ionosonde observations and it cannot be applied during G-conditions, when F2-layer maximum is not seen. Therefore, the method was changed to deal with the whole Ne(h) profiles available from ISR observations. In addition to five f180 values now we use observed Ne at the upper boundary (normally 450–500 km) and a couple of points on the Ne(h) profile controlling its shape. Median Ne(h) ISR profiles calculated over a 2-h time internal around noontime are used in our analysis.
The revised method similar to the basic one [12] has two versions. The first uses only observed electron concentration as fitted parameters. The second version additionally uses observed neutral gas density as a fitted parameter. CHAMP and GOCE neutral gas density observations in the daytime American sector were reduced to the location of Millstone Hill and 12 LT using the MSISE00 thermospheric model and the following expression:
During this reduction the height of ρ observation was kept unchanged not to introduce an additional uncertainty related to unknown MSISE00 neutral temperature Tex for the particular days in question. The inclusion of ρ observations into the retrieval process increases the reliability of the obtained results. In this case the retrieved neutral composition ([O], [N2], [O2] concentrations) and temperature Tex along with vertical plasma drift W and total solar EUV ionizing flux not only describe the observed Ne(h) but also match observed neutral gas density, which has nothing in common with retrieval process.
Figure 1 gives an example of G-condition during the 11–13 September 2005 disturbed period, the quiet 7 September 2005 day being used as a reference. Normally during G-conditions the residual F2-layer also exists but it is blanked by underlying F1-layer and this is seen in Figure 1. However, cases with practically degenerated F2-layer maximum may also take place as on 13 June 2005 (see later). Figure 1 demonstrates that in accordance with the morphological analysis by Lobzin & Pavlov [5] G-condition is more likely to occur during the first half of a day. The first two disturbed days, September 11–12 are marked by increased daytime hmF2 compared to the reference day 7 September 2005. On September 13 when the storm activity has decreased this difference in hmF2 is not seen while NmF1 remains larger than NmF2. This points out the disturbed neutral composition which still remains at Millstone Hill but the equatorward thermospheric wind is decreased (see later) during the recovery storm phase (see Dst index in Figure 1).
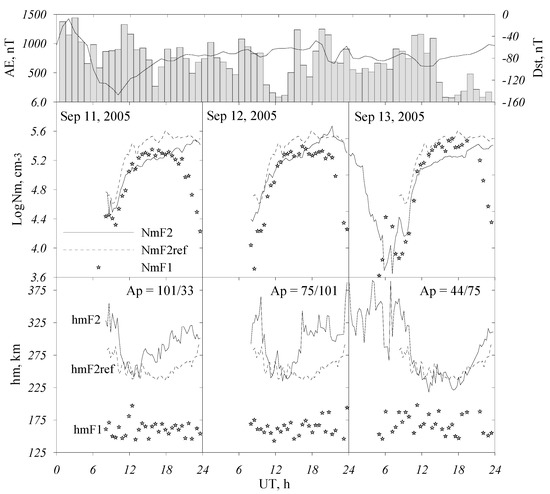
Figure 1.
G-conditions observed at Millstone Hill with ISR during the 11–13 September 2005 disturbed period with 7 September 2005 used as reference day. Observed diurnal NmF2, NmF1, hmF2 and hmF1 variations are shown for three disturbed days. AE and Dst-index variations are given in the top panel while daily Ap indices for the current and previous days are shown in the bottom panels.
Figure 2 gives observed near noontime and calculated Ne(h) profiles for some of the selected G-condition and reference days. The retrieval method is designed to work above 150 km so the lower boundary for calculated Ne(h) is located at this height. All G-condition cases in Figure 2 manifest a strong decrease of electron concentration above F1-layer with a degraded F2-layer which may be well-pronounced like on 12 September 2005, but in other cases it looks like a hint of the F2-layer maximum. It is interesting to note that a very strong decrease of electron concentration at F2-layer heights took place on 13 June 2005, under a moderate level of geomagnetic activity (Ap = 32/54 nT) with a quiet previous period.
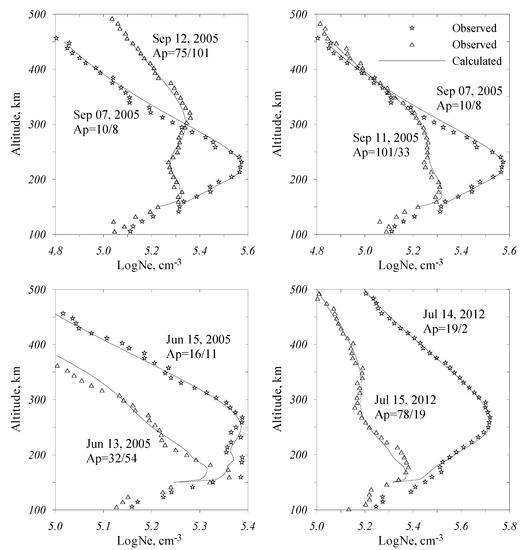
Figure 2.
Observed (symbols) and calculated (solid lines) Ne(h) profiles at Millstone Hill (http://madrigal.haystack.mit.edu, accessed on 26 June 2021) for the periods of G-condition. Stars—reference days, while triangles—disturbed days. Daily Ap for current and previous days for each date are given in the plots.
This example demonstrates that G-conditions do associate to geomagnetic activity but the dependence is not that straight, as shown by Lobzin & Pavlov [4] and Deminov et al. [7]. Along with this, in accordance with previous analyses F1-layer manifests much less variations of electron concentration.
Results of the retrieval process for the days in question along with some other observations are given in Table 1. Firstly, it is seen that observed G-condition cases are not related to day-to-day changes in solar EUV radiation. Due to Solar Radiation and Climate Experiment (SORCE) mission and the Thermosphere, Mesosphere, Ionosphere, Energetic, and Dynamics (TIMED) mission daily EUV (100–1200) Å observations are available since 2002 [13]. These data were used to control day-to-day EUV variations for the periods in question. Both retrieved and observed EUV manifest very small variations if the disturbed and reference days are compared.

Table 1.
Observed EUV along with inferred EUV fluxes, exospheric temperature Tex, vertical plasma drift W, atomic oxygen concentration at the satellite height h in a comparison to MSISE00 model [O] values for G-condition and reference days. Reduced to the location of Millstone Hill and 12 LT neutral gas density observed with CHAMP and GOCE, retrieved column atomic oxygen abundance along with column [O]/[N2] as well as col[O] and col([O]/[N2]) ratios (numbers in brackets) are given for the days in question.
All considered G-condition events occurred under magnetically disturbed conditions (see Ap indices in Figure 2). According to present-day F2-layer storm concept [14,15,16,17,18,19,20,21,22] atomic oxygen concentration and exospheric temperature strongly change in the course of a storm and the mechanism of these changes is well-established. In accordance with this storm mechanism exospheric temperature should be larger and the atomic oxygen abundance should be less for disturbed days compared to reference ones. Atomic oxygen is totally produced and lost in the upper atmosphere [23] therefore we used column atomic density calculated above the level with the N2 column density of 1017 cm−2 [24]. For the analyzed cases this level is located at 140–145 km altitude. Column density is a convenient quantity which does not depend on the temperature height profile.
Table 1 manifests features of the F2-layer storm mechanism: Tex is systematically larger and column atomic density is less by ~2 times for G-condition days compared to reference ones. On the other hand, due to the difference in Tex, neutral gas density at a fixed height is systematically larger for disturbed days. The same occurs for the atomic oxygen concentration if we take large heights (355 km) where [O] provides the main contribution to ρ but the situation is inversed at lower height (261 km) where the [N2] contribution to ρ is dominating.
In accordance with the F2-layer storm concept, normal solar driven daytime northward thermospheric wind Vnx should be inversed due to enhanced auroral heating (see AE index in Figure 1) during disturbed periods. Table 1 indicates strong upward plasma drift W = VnxsinIcosI (where I—magnetic inclination) on G-condition days and negative W which corresponds to northward Vnx for quiet reference days.
3. Interpretation
G-condition effect in the ionospheric F2-region should be considered and can be explained in the framework of the present day F2-layer storm concept (see earlier cited references) considering its part related to negative storm phase. Disturbed neutral composition with a decreased atomic oxygen concentration formed in the auroral zone—due to heating of the thermosphere by magnetospheric electric fields and particle precipitations—is moved to middle latitudes by thermospheric winds resulted from the competition between solar-driven (background) and storm-induced circulations. The bulge of disturbed neutral composition with a decreased atomic oxygen concentration is pushed around by winds and may move back and forth in latitude [18]. Such effect was confirmed by the storm simulations [17] as well as by ESRO-4 data analysis [16]. The pattern strongly depends on season. In summer the [O]/[N2] disturbance zone may extend all the way from the polar to the low latitudes while in winter it is only restricted to high latitudes [25,26]. This seasonal difference is due to different pattern of global thermospheric circulation during two seasons. The solar-driven circulation is equatorward at middle latitudes during nighttime, i.e., it coincides with the storm-induced one while it is poleward during daytime hours. Therefore, disturbed neutral composition flows in middle latitudes during nighttime and is pushed back during daytime. This may explain the morphological fact “that G-condition is more likely to occur during the first half of a day” [5].
G-condition cases considered in our analysis (Table 1) manifest strong equatorward Vnx ~ 90 m/s around noontime hours. This tells us about strong auroral heating during the selected days. However even such strong equatorward Vnx could not overpower the decrease in electron concentration at F2-layer heights resulted from neutral composition changes. It should be stressed that namely the decrease in atomic oxygen abundance rather than in [O]/[N2] distinguishes the G-condition days. This follows from Table 1 (see last two columns). Disturbed/reference day ratios (numbers in brackets) for [O] and [O]/[N2] column abundance are very close, telling us that a decrease in atomic oxygen provides the main contribution to the [O]/[N2] column decrease. Similar calculations for [N2] column density give practically unchanged value ~1.03 × 1017 cm−2 for all dates in question. This is not surprising as molecular nitrogen is chemically inactive thermospheric species whose height distribution is close to a barometric one. Moreover, its distribution is not practically affected by eddy diffusion since molecular weight of N2 is about the same as the average molecular weight of the mixed atmosphere (see e.g., [27]).
The effect of neutral composition changes is also seen at F1-region heights (Figure 2). Electron concentration for G-condition days is slightly less compared to reference ones. Using a simplified scheme of photo-chemical processes it is possible to write down an expression for electron concentration at F1-region heights [6]:
where q(O+)—ion O+ production rate, β = γ1[N2] + γ2[O2], γi—ion-molecule reaction rate coefficients, q = q(O+) + q(M+) = αave[M+]Ne, Ne = O+ + O2+ + NO+, and —average-weighted dissociative recombination rate coefficient. The first term in the right side of Equation (2) represents the O+ ion concentration, while the second term—the concentration of M+ ions. The main contribution to Ne at F1-region heights provide M+ ions especially during disturbed periods when atomic oxygen and correspondingly the first term in expression (2) is decreased. This explains a weak reaction of F1-layer to geomagnetic disturbances usually mentioned in the literature. On the contrary F2-layer is mainly composed of O+ ions whose concentration is proportional to the atomic oxygen ion production rate q(O+), i.e., to the concentration of atomic oxygen [O].
Table 1 indicates that column atomic oxygen abundance in the upper atmosphere is reduced by ~2 times for G-condition days compared to reference ones. However, this [O] decrease is seen only at lower altitudes, such as 261 km on 15 July 2012, but not at larger altitudes, such as 355 km on 12 September 2005, due to larger Tex on disturbed days. Neutral gas density depending both on atomic oxygen and molecular nitrogen is always larger on G-condition days: due to [O] at large altitudes and due to [N2] at lower heights.
4. Discussion
For the first time, aeronomic parameters responsible for the formation of G-conditions in the mid-latitude ionospheric F2-layer have been inferred from Millstone Hill ISR observations. It should be stressed that only ISR observations are able to provide the whole Ne(h) profile which is necessary for such analysis. Our standard method [12] to retrieve a consistent set of aeronomic parameters from routine ground-based ionosonde observations has been changed specially to analyze G-conditions. The required F2-layer maximum may be absent during G-conditions, therefore three points with observed electron concentration, i.e., the upper boundary and two points controlling the Ne(h) profile, were used in the method. Satellite CHAMP and GOCE neutral gas density observations were also introduced to the method. This is a very important component of the method. Mid-latitude daytime F2-layer electron density profile crucially depends on neutral composition (O, O2, and N2 concentrations), which in their turn depend on neutral temperature Tex. The same parameters specify neutral gas density ρ at a given height. Simultaneous fitting observed Ne(h) and ρ leaves not much room for an accidental selection of the thermospheric parameters. An additional ‘nail’ hammered in the method confirming its validity is a comparison of the retrieved to observed solar EUV (Table 1). The correlation coefficient between two variations is 0.974 ± 0.06 which is significant at the 99.9% confidence level according to t-criterion. It should be stressed that the retrieved EUV flux has nothing in common with EUV observations [13]. Therefore, we may conclude that the retrieved thermospheric parameters manifest reality for the analyzed periods of G-conditions.
The results of our analysis tell us that G-conditions present a manifestation of strong F2-layer negative storm phase. We have revealed a strong decrease (by ~2 times) of atomic oxygen abundance, presumably related to the transfer of disturbed neutral composition from the auroral zone. The presence of such transfer is confirmed by strong equatorward thermospheric wind obtained in our calculations for the days of G-conditions (Table 1). Normal northward solar-driven Vnx (negative vertical plasma drift W) on reference days was inversed for positive one. Empirical models of disturbed thermospheric winds like [28] do not reproduce such strong (~90 m/s) equatorward noontime meridional wind.
It is commonly accepted that F2-layer negative storm phase is related to a decrease in the [O]/[N2] ratio at F2-layer heights and this was confirmed by direct observations (e.g., [26]). However, the mechanism of this decrease should be specified. Molecular nitrogen, as discussed earlier, just follows neutral temperature variations being close to a barometric distribution. Neutral temperature increases during storm periods so [N2] concentration also increases at a fixed height in the upper atmosphere but the column [N2] density remains practically unchanged ~1.03 × 1017 cm−2 for the dates in Table 1. Contrary to this atomic oxygen manifests a real strong decrease of its column abundance during disturbed days in a comparison to reference ones (see Table 1). Therefore G-condition (as a manifestation of the F2-layer negative storm phase) is due to a decrease in the total atomic oxygen abundance in the upper atmosphere and an increase of neutral temperature during disturbed periods.
Of course, it would be interesting to compare our retrieved thermospheric parameters to MSISE00 model values as this or MSIS86 thermospheric models were earlier used to describe G-conditions in the F2-region [7,9,11]. Such a comparison is given in Table 2 for the days in question. The comparison is done at the height of a satellite where neutral gas density was observed.
Table 2.
Retrieved exospheric temperature and neutral composition are given in a comparison with MSISE00 (italic) model values at the height h of satellite at Millstone Hill and 12 LT. Data for reference days are given in bold.
The main difference (~200 K) takes place in Tex for disturbed days while this difference is much less for quite reference days. This results in larger retrieved [N2] and [O2] concentrations mainly follow neutral temperature variations. However, inferred atomic oxygen manifests quite different variations. Despite larger Tex retrieved [O] are systematically (by 58% on average) less than MSISE00 model concentrations. This issue was discussed earlier when we mentioned the general decrease of the atomic oxygen abundance in the upper atmosphere during G-condition periods. For this reason, it is not a surprise that neither Pavlov & Buonsanto [9] nor Schlesier & Buonsanto [11] succeeded in trying to describe G-condition Ne(h) profiles observed with Millstone Hill ISR using MSIS model.
5. Conclusions
The main results of our analysis may be summarized as follows.
- For the first time thermospheric parameters (neutral composition, exospheric temperature, and vertical plasma drift related to thermospheric winds) have been retrieved for ionospheric G-conditions observed with Millstone Hill ISR on 11–13 September 2005; 13 June 2005; and 15 July 2012.
- A revised method by Perrone & Mikhailov [12] has been used to retrieve a consistent set of the main aeronomic parameters responsible for the formation of daytime mid-latitude F-region. Observed with CHAMP and GOCE satellites neutral gas density is used as a fitted parameter in this method.
- The analyzed G-condition cases are distinguished by enhanced exospheric temperature and decreased by ~2 times of the column atomic oxygen abundance in a comparison to quiet reference days. Along with this the column abundance of molecular nitrogen remains practically unchanged. Therefore, the O/N2 ratio decrease at F2-layer heights is totally due to an increase in Tex and to a decrease in the atomic oxygen abundance.
- The inferred upward plasma drift ~30 m/s corresponds to strong ~90 m/s equatorward thermospheric wind presumably related to strong auroral heating on G-condition days.
- The inferred set of thermospheric parameters for G-condition days strongly differs from empirical model values therefore the observed Ne(h) can hardly be described on the basis of such models.
Author Contributions
Conceptualization, L.P. and A.V.M.; methodology, A.V.M. and L.P.; software, A.V.M. and L.P.; data preparation, L.P., A.V.M. and D.S.; writing, A.V.M., L.P., and D.S. All authors have read and agreed to the published version of the manuscript.
Funding
This research was carried within the INGV Pianeta Dinamico Project (CUP D53J19000170001), The Solar wind—Earth’s magnetosphere Relationships and their Effects on oNosphere and upper and lower Atmosphere (SERENA)—2021, funded by MUR (law 145/2018).
Acknowledgments
The authors thank GFZ German Research Center for CHAMP data (ftp://anonymous@isdcftp.gfz-potsdam.de/champ/, accessed on 26 June 2021), the European Space Agency to provide GOCE (https://earth.esa.int/web/guest/-/goce-data-access-7219, accessed on 26 June 2021) and Woods for EUV observations (http://lasp.colorado.edu/lisird/, accessed on 26 June 2021) as well as the Lowell DIDBase through GIRO for ionosonde data (http://giro.uml.edu/, accessed on 26 June 2021) and CEDAR through Madrigal database for ISR data (http://madrigal.haystack.mit.edu).
Conflicts of Interest
The authors declare no conflict of interest.
References
- Piggott, W.R.; Rawer, K. U.R.S.I. Handbook of Ionogram Interpretation and Reduction; World Data Center A for Solar-Terrestrial Physics, National Oceanic and Atmospheric Administration—Environmental Data Service: Boulder, CO, USA, 1978. [Google Scholar]
- Norton, R.B. The middle-latitude F region during some severe ionospheric storms. Proc. IEEE 1969, 57, 1147–1149. [Google Scholar] [CrossRef]
- Mikhailov, A.; Belehaki, A.; Perrone, L.; Zolesi, B.; Tsagouri, I. On the possible use of radio occultation middle latitude electron density profiles to retrieve thermospheric parameters. J. Space Weather Space Clim. 2014, 4, A12. [Google Scholar] [CrossRef]
- Lobzin, V.V.; Pavlov, A.V. G Condition in the F2 Region Peak Electron Density: A Statistical Study. Ann. Geophys. 2002, 20, 523–537. [Google Scholar] [CrossRef][Green Version]
- Lobzin, V.V.; Pavlov, A.V. Solar Zenith Angle Dependencies of F1-Layer, NmF2 Negative Disturbance, and G-Condition Occurrence Probabilities. Ann. Geophys. 2002, 20, 1821–1836. [Google Scholar] [CrossRef][Green Version]
- Mikhailov, A.V.; Schlegel, K. Geomagnetic storm effects at F1-layer heights from incoherent scatter observations. Ann. Geophys. 2003, 21, 583–596. [Google Scholar] [CrossRef]
- Deminov, M.G.; Romanova, E.B.; Tashchilin, A.V. Origination of G Conditions in the Ionospheric F Region Depending on Solar and Geomagnetic Activity. Geomag. Aeronom. 2011, 51, 669–675. [Google Scholar] [CrossRef]
- Picone, J.M.; Hedin, A.E.; Drob, D.P.; Aikin, A.C. NRLMSISE-00 empirical model of the atmosphere: Statistical comparison and scientific issues. J. Geophys. Res. 2002, 107, 1468. [Google Scholar] [CrossRef]
- Pavlov, A.V.; Buonsanto, M.J. Anomalous electron density events in the quiet summer ionosphere at solar minimum over Millstone Hill. Ann. Geophys. 1998, 16, 460–469. [Google Scholar] [CrossRef][Green Version]
- Hedin, A.E. MSIS-86 thermospheric model. J. Geophys. Res. 1987, 92, 4649–4662. [Google Scholar] [CrossRef]
- Schlesier, A.C.; Buonsanto, M.J. Observations and modeling of the April 10–12, 1997 ionospheric storm at Millstone Hill. Geophys. Res. Lett. 1999, 26, 2359–2362. [Google Scholar] [CrossRef]
- Perrone, L.; Mikhailov, A.V. A New Method to Retrieve Thermospheric Parameters From Daytime Bottom-Side Ne(h) Observations. J. Geophys. Res. Space Phys. 2018, 123, 10200–10212. [Google Scholar] [CrossRef]
- Woods, T.N.; Eparvier, F.G.; Harder, J.; Snow, M. Decoupling Solar Variability and Instrument Trends Using the Multiple Same-Irradiance-Level (MuSIL) Analysis Technique. Solar Phys. 2018, 293, 76. [Google Scholar] [CrossRef] [PubMed]
- Duncan, R.A. F-region seasonal and magnetic storm behavior. J. Atmos. Terr. Phys. 1969, 31, 59–70. [Google Scholar] [CrossRef]
- Rishbeth, H.; Fuller-Rowell, T.J.; Rodger, A.S. F-layer storms and thermospheric composition. Phys. Scr. 1987, 36, 327–336. [Google Scholar] [CrossRef]
- Skoblin, M.G.; Förster, M. An alternative explanation of ionization depletions in the winter night-time storm perturbed F2-layer. Ann. Geophys. 1993, 11, 1026–1032. [Google Scholar]
- Fuller-Rowell, T.J.; Codrescu, M.V.; Moffett, R.J.; Quegan, S. Response of the thermosphere and ionosphere to geomagnetic storm. J. Geophys. Res. 1994, 99, 3893–3914. [Google Scholar] [CrossRef]
- Prölss, G.W. Ionospheric F-region storms. In Handbook of Atmospheric Electrodynamics; Volland, H., Ed.; CRC Press: Boca Raton, FL, USA, 1995; Volume 2, pp. 195–248. [Google Scholar]
- Forbes, J.M.; Gonzalez, R.; Marcos, F.A.; Revelle, D.; Parish, H. Magnetic storm response of lower thermospheric density. J. Geophys. Res. 1996, 101, 2313–2319. [Google Scholar] [CrossRef]
- Rishbeth, H. How the thermospheric circulation affects the ionospheric F2-layer. J. Atmos. Solar Terr. Phys. 1998, 60, 1385–1402. [Google Scholar] [CrossRef]
- Field, P.R.; Rishbeth, H.; Moffett, R.J.; Idenden, D.W.; Fuller-Rowell, T.J.; Millward, G.H.; Aylward, A.D. Modelling composition changes in F-layer storms. J. Atmos. Solar Terr. Phys. 1998, 60, 523–543. [Google Scholar] [CrossRef]
- Rishbeth, H.; Müller-Wodarg, I.C.F. Vertical circulation and thermospheric composition: A modelling study. Ann. Geophys. 1999, 17, 794–805. [Google Scholar] [CrossRef]
- Banks, P.M.; Kockarts, G. Aeronomy; Academic Press: New York, NY, USA, 1973. [Google Scholar]
- Strickland, D.J.; Evans, J.S.; Paxton, L.J. Satellite remote sensing of thermospheric O/N2 and solar EUV 1. Theory. J. Geophys. Res. 1995, 100, 12217–12226. [Google Scholar] [CrossRef]
- Prölss, G.W.; von Zahn, U. Seasonal variations in the latitudinal structure of atmospheric disturbances. J. Geophys. Res. 1977, 82, 5629–5632. [Google Scholar] [CrossRef]
- Prölss, G.W. Magnetic storm associated perturbations of the upper atmosphere: Recent results obtained by satellite-borne gas analyzers. Rev. Geophys. 1980, 18, 183–202. [Google Scholar] [CrossRef]
- Shimazaki, T. Effective eddy diffusion coefficient and atmospheric composition in the lower thermosphere. J. Atmos. Terr. Phys. 1971, 33, 1383–1401. [Google Scholar] [CrossRef]
- Emmert, J.T.; Drob, D.P.; Shepherd, G.G.; Hernandez, G.; Jarvis, M.J.; Meriwether, J.W.; Niciejewski, R.J.; Sipler, D.P.; Tepley, C.A. DWM07 global empirical model of upper thermospheric storm-induced disturbance winds. J. Geophys. Res. 2008, 113, A11319. [Google Scholar] [CrossRef]


Publisher’s Note: MDPI stays neutral with regard to jurisdictional claims in published maps and institutional affiliations. |
© 2021 by the authors. Licensee MDPI, Basel, Switzerland. This article is an open access article distributed under the terms and conditions of the Creative Commons Attribution (CC BY) license (https://creativecommons.org/licenses/by/4.0/).