Abstract
Historically stable areas across North Africa, known as pseudo invariant calibration sites (PICS), have been used as targets for the calibration and monitoring of optical satellite sensors. However, two major drawbacks exist for these sites: first is the dependency on a single location to be always invariant, and second is the limited amount of observation achieved using these sites. As a result, longer time periods are necessary to construct a dense dataset to assess the radiometric performance of on-orbit optical sensors and confirm that the change detected is sensor-specific rather than site-specific. This work presents a global land cover classification to obtain an extended pseudo invariant calibration site (EPICS) on a global scale using Landsat-8 Operational Land Imager (OLI) data. This technique provides multiple calibration sites across the globe, allowing for the building of richer datasets in a shorter time frame compared to the traditional approach (PICS), with the advantage of assessing the calibration and stability of the sensors faster, detecting possible changes sooner and correcting them accordingly. This work identified 23 World Reference System two (WRS-2) path/row locations around the globe as part of the global EPICS. These EPICS have the advantage of achieving multiple observations per day, with similar spectral characteristics compared to traditional PICS, while still producing a temporal coefficient of variation (ratio of temporal standard deviation and temporal mean) less than 4% for all bands, with some as low as 2.7%.
1. Introduction
Understanding the world is a primary concern for humanity, and satellite imagery is a crucial part of the process of discovering and tracking the Earth’s changes. In order to have reliable data for scientific applications, it is imperative to have consistent and calibrated data acquired by sensors onboard satellites for earth observation; hence it is very important to ensure that these sensors are well calibrated [1]. To guarantee comparability between data collected from different satellites, radiometric calibration is essential. This calibration can be conducted using diverse methods, such as pre-launch, on-board, and vicarious calibration. Pre-launch calibration provides a reference to which the post-launch calibration is compared and is achieved through a variety of techniques in the laboratory; for instance, an integrating sphere is widely used for performing this calibration. Since this device is used as a reference, National Institute of Standards and Technology (NIST) traceability is crucial for integrating the sphere prior to usage for calibration [2,3]. Yet, in the process of placing the satellite in orbit and throughout its lifetime, the sensor calibration can change and, consequently, it is necessary to perform post-launch calibration to assure data accuracy. This radiometric calibration can be done using on-board calibrators, such as lamps, solar diffuser panels, among others [3,4].
On-board calibrators are a good option to ensure the sensor is providing accurate data. However, due to increased cost, not every satellite has on-board calibrators. In addition, on-board calibration systems and the sensor can experience degradation, thus it is necessary to perform the calibration using other independent techniques. An alternative and widely used approach is the utilization of satellite imagery across very stable areas of the Earth’s surface, known as PICS. Since these targets on the ground are considered to be constant over time, the stability or changes in the sensor’s response can be assessed on the basis that changes in the sensor measurement may be due to the sensor itself, instead of a variation in the target [1,5]. Several desert sites were identified as spatially, spectrally, and temporally stable regions. The Committee on Earth Observation Satellites (CEOS) selected six locations in the North African desert to provide an international context. These sites are called Libya 1 and 4, Mauritania 1 and 2, and Algeria 3 and 5 [6,7].
PICS have been used to calibrate optical earth remote sensing instruments for several decades. However, due to temporal resolution, sensor field of view, and environmental conditions, such as clouds or sandstorms over these test sites, the amount of clear observations can decrease significantly. This leads to a reduced dataset for assessing the radiometric calibration of the sensor and means a longer period of time is required to achieve a dense dataset. Vuppula et al. [8] developed a technique that integrates data, collected by Landsat-8, over six PICSs in North Africa into a single dataset to address the temporal resolution limitations using traditional PICSs. Egypt 1, Sudan 1, Libya 1, Libya 4, Niger 1, and Niger 2 [9] were normalized using Libya 4 as a reference, in what the author called the “PICS Normalization Process”. In that work, the author reported an improvement in PICS temporal resolution for Landsat-8 from 16 days to 3–4 days. Although the combination of traditional PICSs increased the temporal resolution significantly, it did not achieve daily observation. The possibility of observations on a daily basis can be useful for the detection of long-term changes in the sensor response faster, and therefore address them sooner, but they can also be used to detect erratic short-term changes that might be missed otherwise.
An attempt to achieve nearly daily acquisitions was performed by Shrestha et al. [1] through developing a characterization of North Africa in the search of temporally stable and spectrally similar regions across the continent, rather than using specific areas as was done with the traditional PICS approach. Along with temporal stability characterization, the spectral response of North Africa was also considered, in order to perform a classification based not only on the temporal stability of the sites, but also their spectral characteristics. As a result of this classification, 19 “clusters” were identified across North Africa; “Cluster 13” was selected as a possible candidate to be an extended PICS (EPICS) due to its spatial extent and spectral and temporal characteristics.
This work presents an extension of “Cluster 13” to a worldwide scale. As shown by Hasan et al. [10] with “Cluster 13” in North Africa, EPICS can provide cloud-free acquisitions on almost a daily basis. When expanding these sites to a global scale, multiple acquisitions every day can be obtained. In the same period of time, a global EPICS can achieve a temporally denser dataset than traditional PICSs, allowing for the faster assessment of satellite sensor performance. Moreover, an expansion of “Cluster 13” can provide alternative locations around the globe to perform calibration of optical satellite sensors that can reduce the impact of potential variability of a single calibration site.
This paper is organized as follows: the first section provides a brief overview about the topic; Section 2 presents the methodology, materials, methods, and the data processing performed for this analysis; Section 3 contains the results and the discussion of this extended classification; Section 4 demonstrates a validation using the Libya 4 Centre National d’Etudes Spatiales region of interest (Libya 4 CNES ROI); and, finally, Section 5 presents the conclusions of this analysis.
2. Methodology
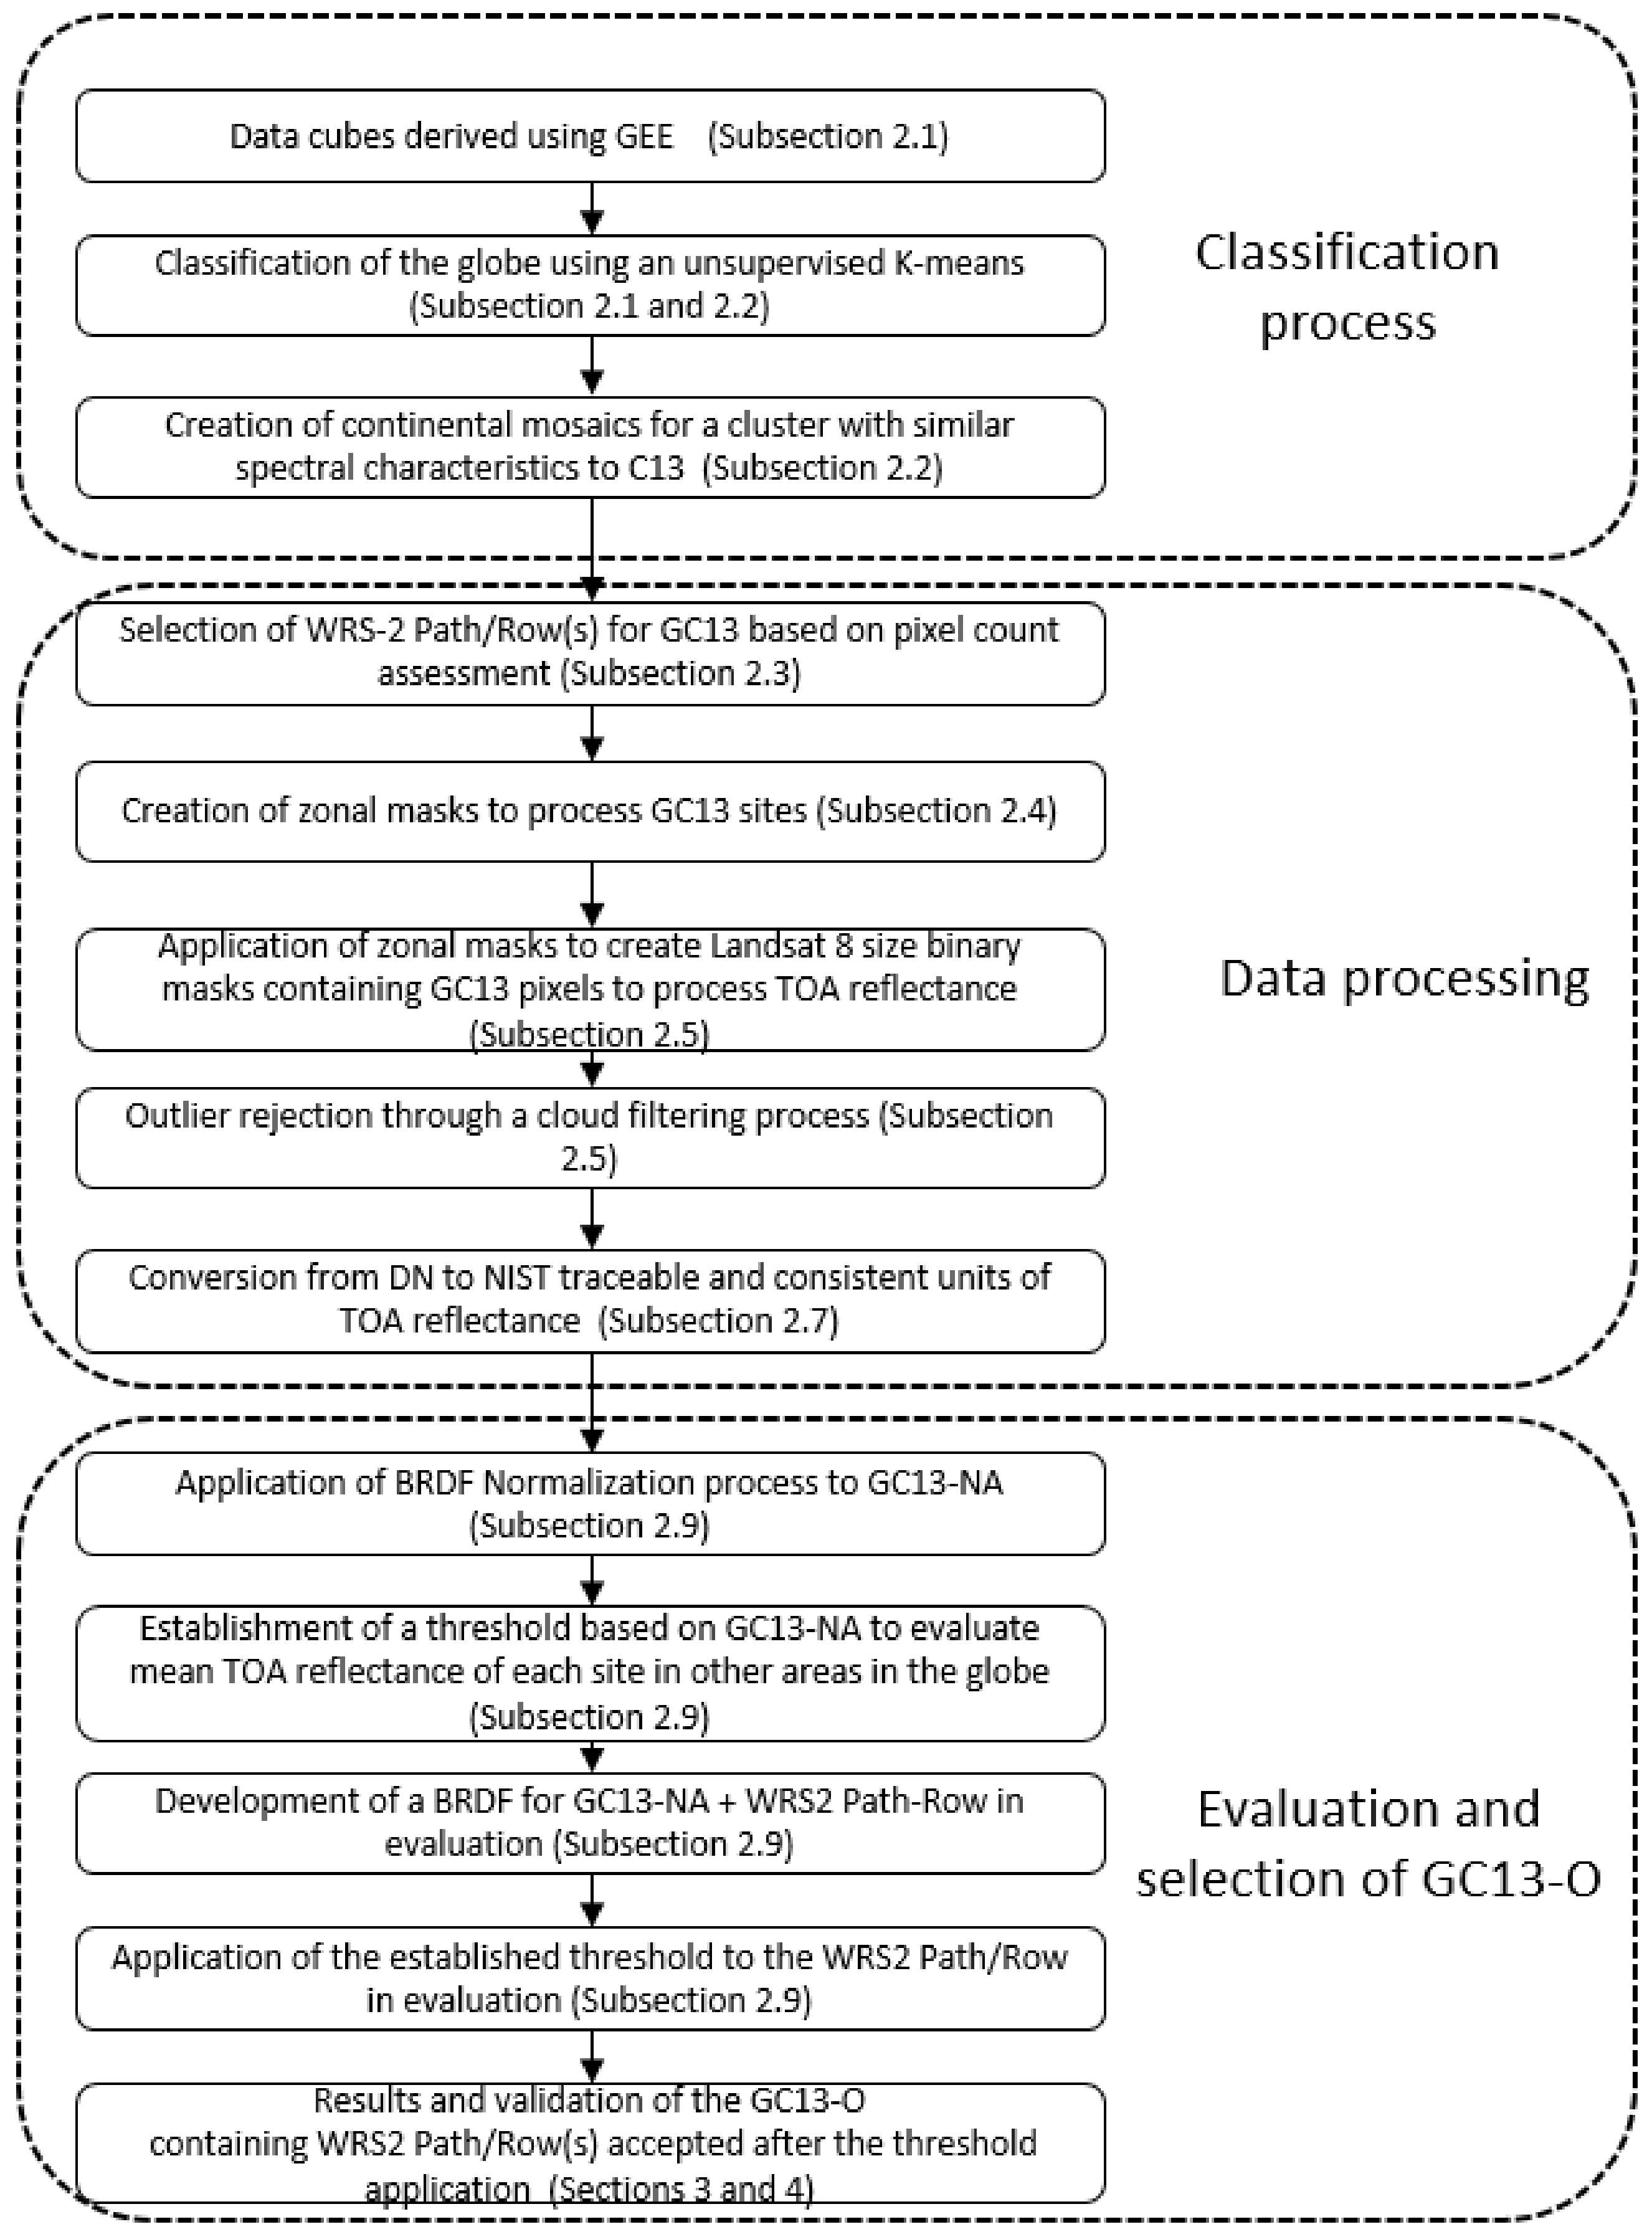
In this section, the steps followed and the data processing completed to obtain an expanded version of “Cluster 13” are addressed. The selection of the locations that create the global cluster, the development of zonal masks to obtained top-of-atmosphere reflectance (TOA reflectance) for Landsat-8 and Landsat-7, bidirectional reflectance distribution function (BRDF) normalization, and the selection of locations for the final global EPICS are explained. In this work, “Cluster 13”, established by Shrestha et al. [1], is referred to as Cluster 13 (C13), while the locations around the globe found in this work are called Global Cluster 13 (GC13). In addition, sites across North Africa for this Global Cluster 13 are named GC13-NA, and the optimal locations selected after processing, those regarded as a global EPICS, are called the Optimal Global Cluster 13 (GC13-O). Figure 1 presents a block diagram for the steps followed during the classification process, data processing of GC13, and the selection of locations for GC13-O.
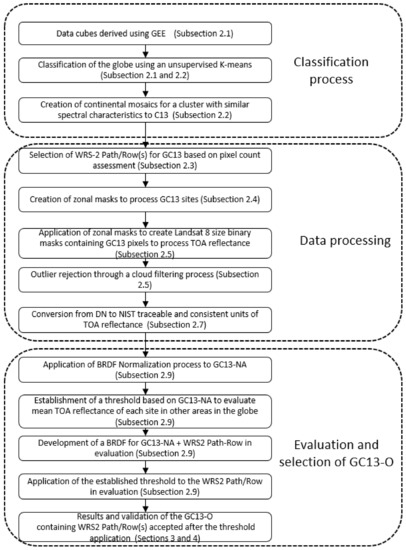
Figure 1.
Block diagram of the classification, data processing, and data selection for the global EPICS.
2.1. Classification and Evaluation of North Africa as an EPICS
Shrestha et al. [1] performed an unsupervised classification of North Africa. In order to perform this analysis, a mosaic of North Africa was obtained using data cubes created with Google Earth Engine (GEE), a platform with vast computational capabilities that contains data for geospatial analysis on a global scale [11]. Landsat-8 OLI data were selected to accomplish the classification of North Africa as the published radiometric calibration accuracy for this sensor is 3% [12]. These data cubes of 1° latitude by 1° longitude contained the number of pixels, the temporal mean, temporal standard deviation, and temporal uncertainty (temporal standard deviation divided by temporal mean), and were generated with a spatial resolution of 300 m for computational and storage proposes at South Dakota State University (SDSU). A North African mosaic was then processed locally using an unsupervised classification algorithm that identified 19 “clusters” across North Africa with pixels that showed temporal (variability of each pixel through time) and spatial uncertainty of 5% or less. From this classification, “Cluster 13”, which had a larger number of pixels that were more aggregated together throughout North Africa, was considered a good candidate for an extended PICS.
Hasan et al. [10] performed the assessment of C13 as an EPICS for calibration and stability monitoring of optical satellite sensors. To perform this evaluation, Landsat-8 OLI, Landsat-7 Enhanced Thematic Mapper Plus (ETM+), and Sentinel-2A and -2B multispectral instrument (MSI) data were used. This work showed that, using 16 WRS-2 path/row(s) that intersect Cluster 13 across North Africa, the imaging period of Landsat-8 can be reduced to 1.4 days on average, using cloud-free acquisitions, in contrast to the 18 to 20 days required for traditional PICSs. Moreover, the temporal coefficient of variation of C13 was proven to be less than 3% for all bands, demonstrating that, like traditional PICSs, it is very stable.
2.2. Expansion of Cluster 13 to a Global Scale
The classification performed in this work was based on the classification done by Shrestha et al. [1]. Data cubes containing temporal mean, temporal standard deviation, temporal uncertainty, and pixel count were generated to create a North Africa mosaic. Each pixel, with a temporal uncertainty of 5 percent or less and a pixel count of at least 25 (number of scenes in the time series), was classified using a k-means as described in Shrestha et al.’s work. According to the authors, 25 was set as a pixel count threshold because it is approximately a third of the possible cloud-free acquisitions [1]. In the classification performed in this work, a modified version of the k-means classification algorithm used in the initial North Africa classification was developed and used to achieve a new global classification that could provide an expanded Cluster 13 from North Africa to the world (GC13). As input to the k-means classifier, data cubes of 1° latitude and 1° longitude were also created for every continent. These data cubes contained temporal mean, temporal standard deviation, and temporal uncertainty. In order to remove the preference for only detecting bright stable sites, the thresholds used in the previous North Africa classification were removed. These past filters included temporal uncertainty greater than 5%, waterbody filters, and low reflectance filters. In this analysis, every pixel across the world was assessed not only by considering its spectral characteristics, but also its temporal variability, which was evaluated via its temporal standard deviation. In this new classification, clusters were not only grouped by considering their spectral characteristic, but also assessing their variability without any threshold limiting the outcome. After the classification was completed, continental scale mosaics for each specific cluster found in the classification were created. Considering that C13 showed similar spectral characteristics when compared to Libya 4 CNES ROI, a cluster obtained in this classification with similar spectral characteristics to C13 was selected as a global EPICS (GC13), and the mosaics created for each continent, with pixels belonging to this cluster, were selected for further evaluation.
2.3. Selection of Locations of GC13 Based on Pixel Count
Hasan et al. [10] selected 16 optimal WRS-2 path/row(s) across North Africa, which were identified as optimal WRS-2 path/row(s) for the GC13-NA. In order to identify and select specific WRS-2 path/row(s) to be evaluated in continents other than North Africa, KML files were generated using the Geospatial Data Abstraction Library (GDAL), a raster and vector geospatial data converter library that is provided by the Open Source Geospatial Foundation in the X/MIT style Open Source license [13]. The gdal_polygonize function, which creates a polygon feature layer using a raster input, corresponding to raster outputs obtained in this classification, was used. In Google Earth, shaped polygons were displayed in order to identify the paths imaged by Landsat-8 over GC13. WRS-2 path/row(s) to be assessed on each continent were chosen on the basis of an initial visual inspection. WRS-2 path/row(s) with areas where pixels were aggregated together were selected for pixel count assessment. The row in each path that contained the largest number of pixels was selected as a GC13 location for further analysis.
2.4. Creation of the GC13 Zonal Masks
In order to make the processing of GC13 more efficient, raster masks were created using the raster images obtained from the classification. These masks were generated using GDAL. For the purpose of this analysis, the gdalwarp function was used to create raster masks for the data processing. The GDAL function requires, as an input, a raster image (the continental scale mosaics from the classification), a universal transversal de Mercator (UTM) zone of the mask to be created, and the target extent. In this case, the reference size for the target extent was the UTM zone dimension, oversized by approximately 100 km in the east-west direction to account for images positioned in two different UTM zones. The Gdalwarp function also requires the spatial resolution of the sensor, which in this case was the Landsat-8, and, therefore, the spatial resolution was 30 m. Twenty-eight raster masks (zonal masks) were created in total for processing GC13.
2.5. Application of the GC13 Zonal Masks
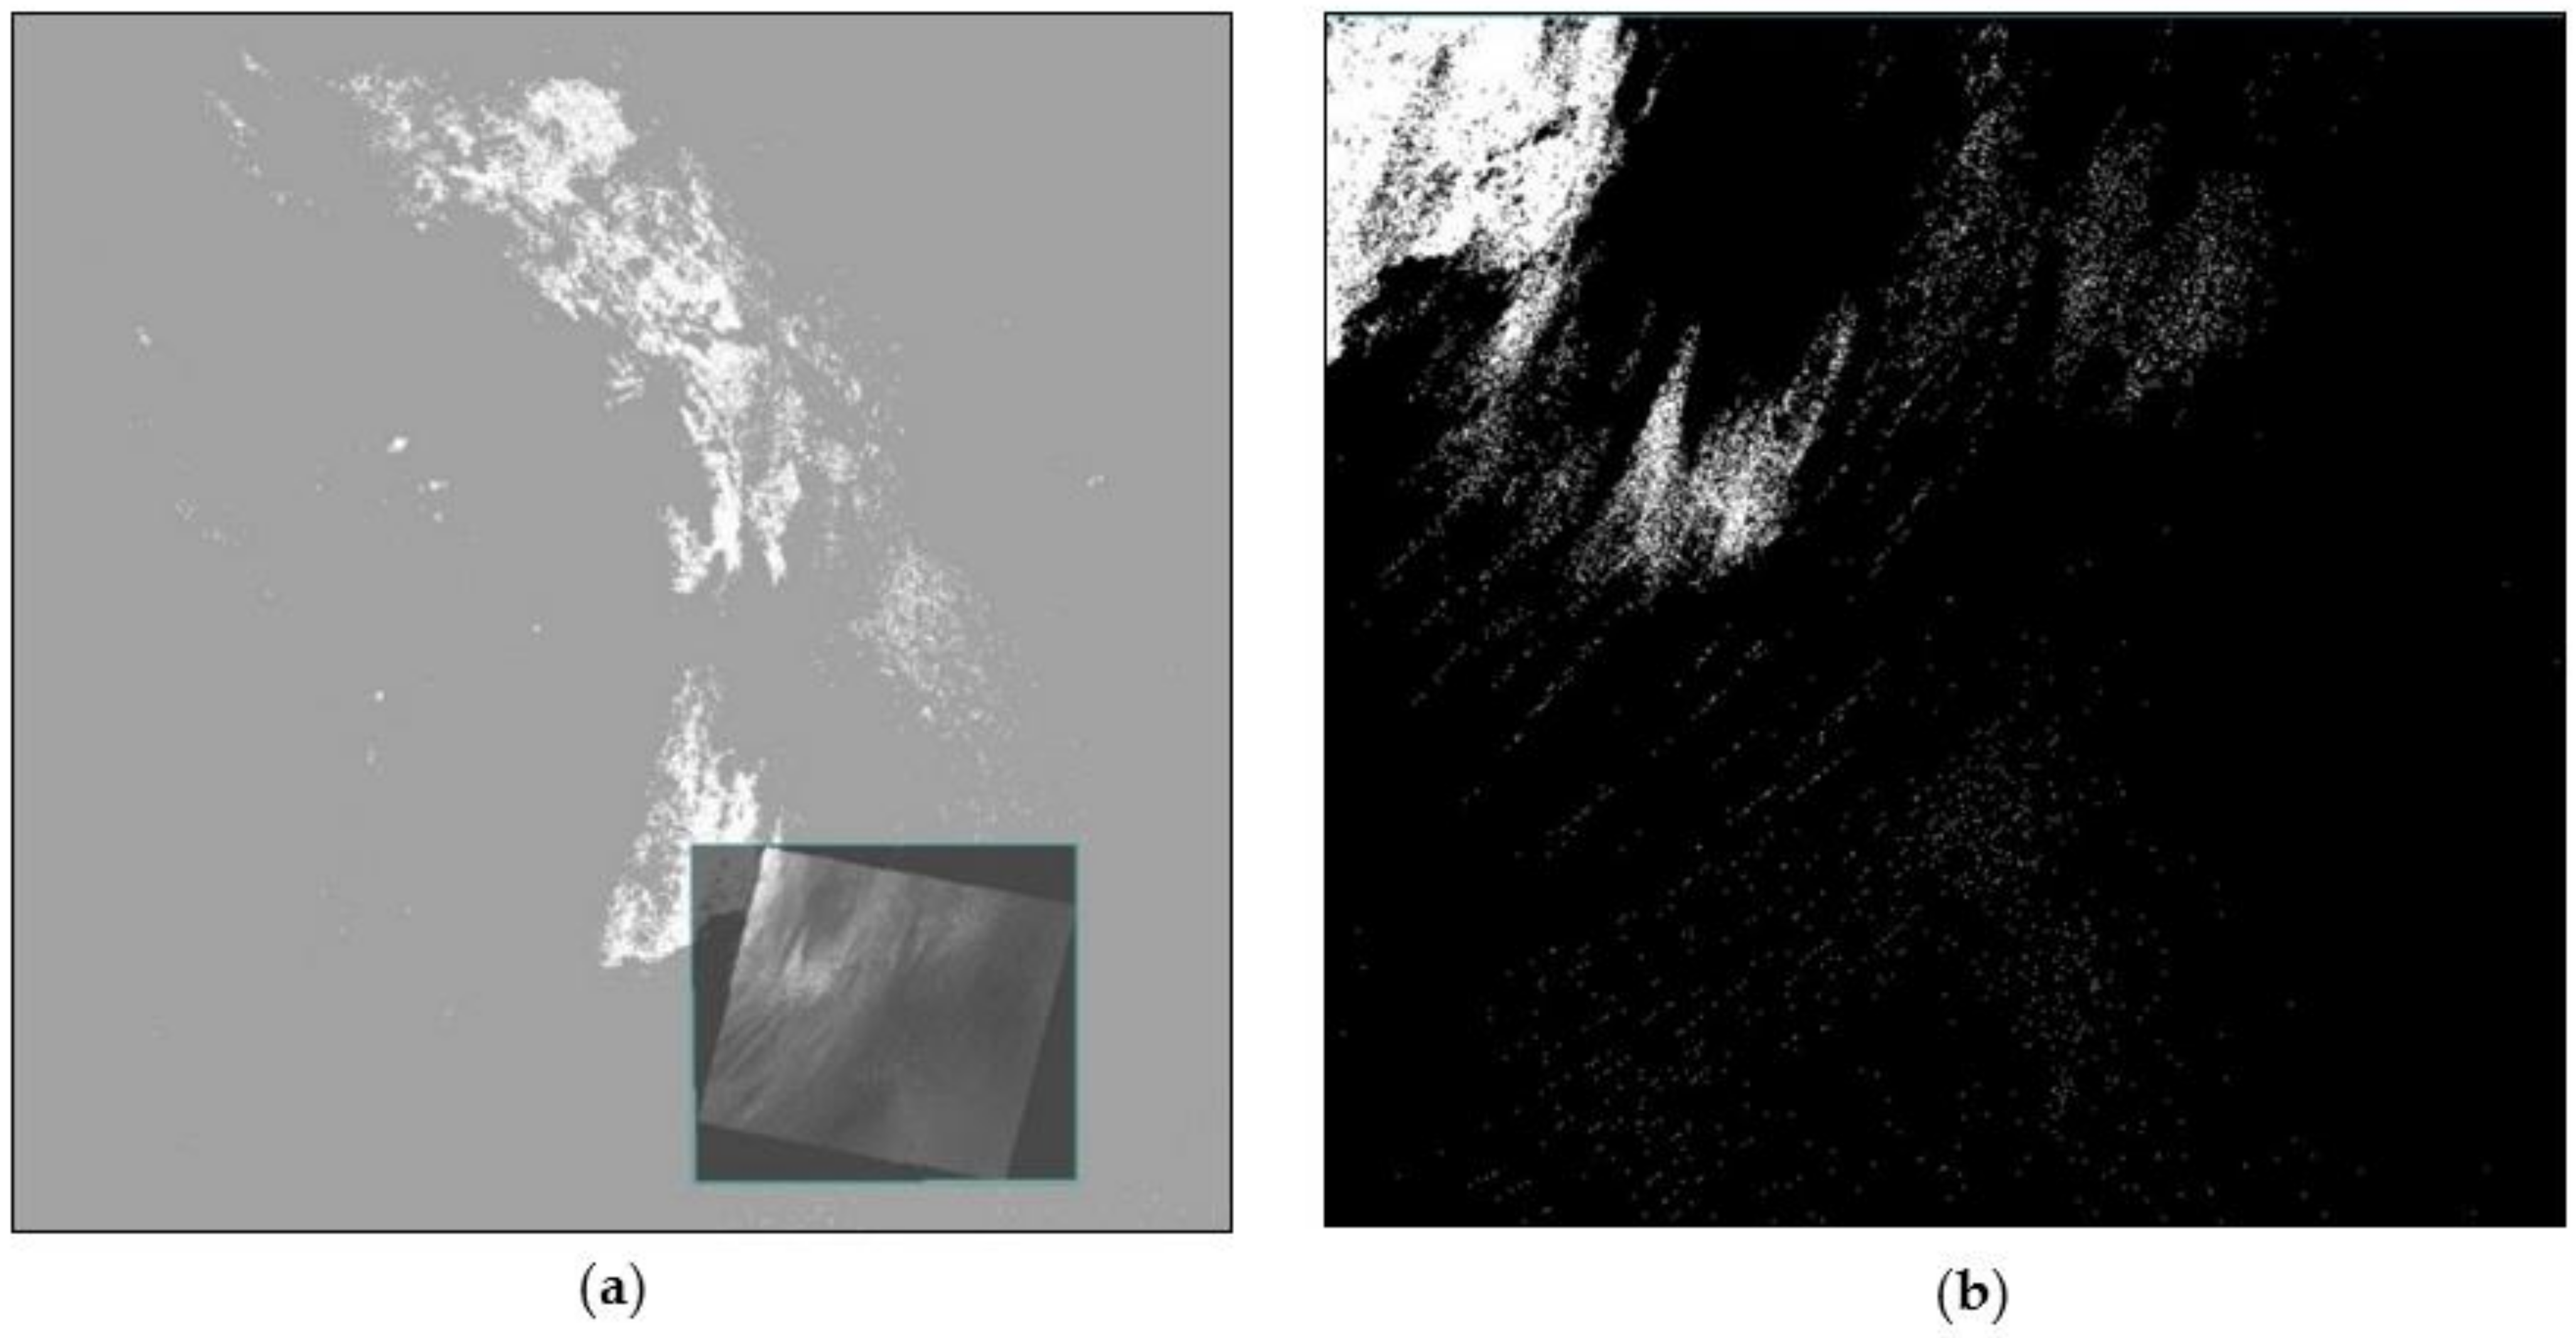
Zonal masks created in the previous step for all GC13 locations were applied to Landsat-8 images. Using the geospatial information, every Landsat-8 image was located over the corresponding portion of the cluster UTM zone sized mask and intersected, obtaining a Landsat-8 sized image of Cluster 13. An example of this is presented in Figure 2 below. The WRS-2 path 163/row 45 over the UTM zone 39 raster mask in the Middle East is shown in Figure 2a, with white areas representing the GC13 pixels and the small square representing the Landsat-8 image that is masked by the GC13 zonal mask. Figure 2b shows the resulting Landsat-8 sized image containing GC13 pixels, which was later used to compute TOA reflectance and conduct further analyses discussed in the upcoming sections.
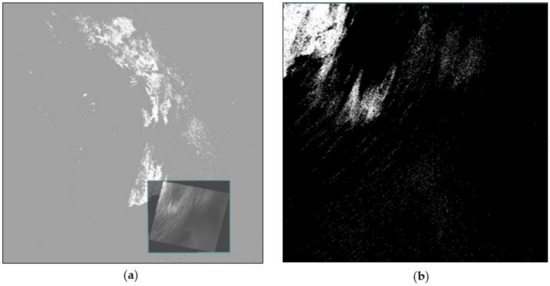
Figure 2.
(a) Application of zonal mask for path 163/row 45-Middle East; (b) Binary mask containing GC13 pixels obtained after the application of the UTM zonal mask.
2.6. Filtering Process Using the Quality Assessment Band (BQA) Data
In order to remove outliers or data points with measurements that do not represent the nature of the target and can give misleading results, a filtering process to remove clouds and shadows from the analysis was performed using the BQA data provided for Landsat-8, collection 1, level 1 data. Considering that GC13 is a wide region formed by contiguous pixels, a filtering process was created. A binary cloud mask was generated from the BQA data for every Landsat-8 image. The union of this mask and the Landsat-8 mask of the cluster (Figure 2b) was taken. While this binary mask can be applied at the pixel level, we decided to apply it first at the scene level to remove dates where the region of interest (GC13 pixels) was significantly covered by clouds, given that cloud filters are not perfect and cloudy pixels can be missed on very cloudy days. After evaluating many potential threshold values, 50% was chosen because it provided a good balance between the number of images removed from the study and the presence of outliers (missed cloudy pixels) in the data. Thus, if the number of clear pixels in the cloud binary mask belonging to the cluster was greater than 50% of the number of pixels in the Landsat-8 cluster image (Figure 2b), the image was kept and then the pixel-by-pixel cloud mask was applied to the scene, otherwise the whole scene was rejected.
2.7. Conversion of DN Values to TOA Reflectance
Conversion from unitless digital numbers (DN) to NIST traceable and consistent units of top-of-atmosphere reflectance (TOA) was necessary to perform this analysis. Since Landsat-8 is the satellite selected to conduct this study, TOA reflectance was calculated using the equation provided by the United States Geological Survey (USGS) as shown in Equation (1) [14].
where and are the multiplicative and additive scaling factors provided in the metadata file, is the quantized and calibrated product for the pixel values (DN), and corresponds to the solar zenith angle for every pixel obtained from the solar angle product.
2.8. Cluster BRDF Model
Variability in the TOA reflectance can be present in the data acquired by any satellite. This can come from a number of factors, such as atmospheric effects, sun position, and view geometry of the acquisition, among others. One of the main contributors to this variability is the BRDF of the target type. Most of this BRDF variability is driven by the large change in sun position throughout the different seasons due to the view geometry being very consistent for these nadir sensors. The BRDF effect impacts, to a different extent, all wavelengths and, to a greater extent, the longer wavelengths [14,15]. Kaewmanee developed a 4 angle BRDF quadratic model, where a conversion from spherical coordinates to Cartesian coordinates is achieved, taking into account that angular information is given in spherical coordinates and MATLAB performs better with Cartesian coordinates [16]. Hasan et al. developed an extended version of Kaewmanee’s approach, where all interaction terms between solar and view angles in the quadratic model were included [10]. This BRDF full quadratic model was applied to the GC13 data in order to normalize for angular differences:
where , , , and are the Cartesian coordinates projected from the angular information in spherical coordinates, through are the coefficients in the model, and corresponds to the predicted TOA reflectance. The Cartesian coordinates used for this model are:
where, SZA and SAA correspond to the solar zenith and azimuth angles, respectively, and VZA and VAA correspond to the view zenith and azimuth angles, respectively.
To calculate the normalized TOA reflectance, the following equation was applied:
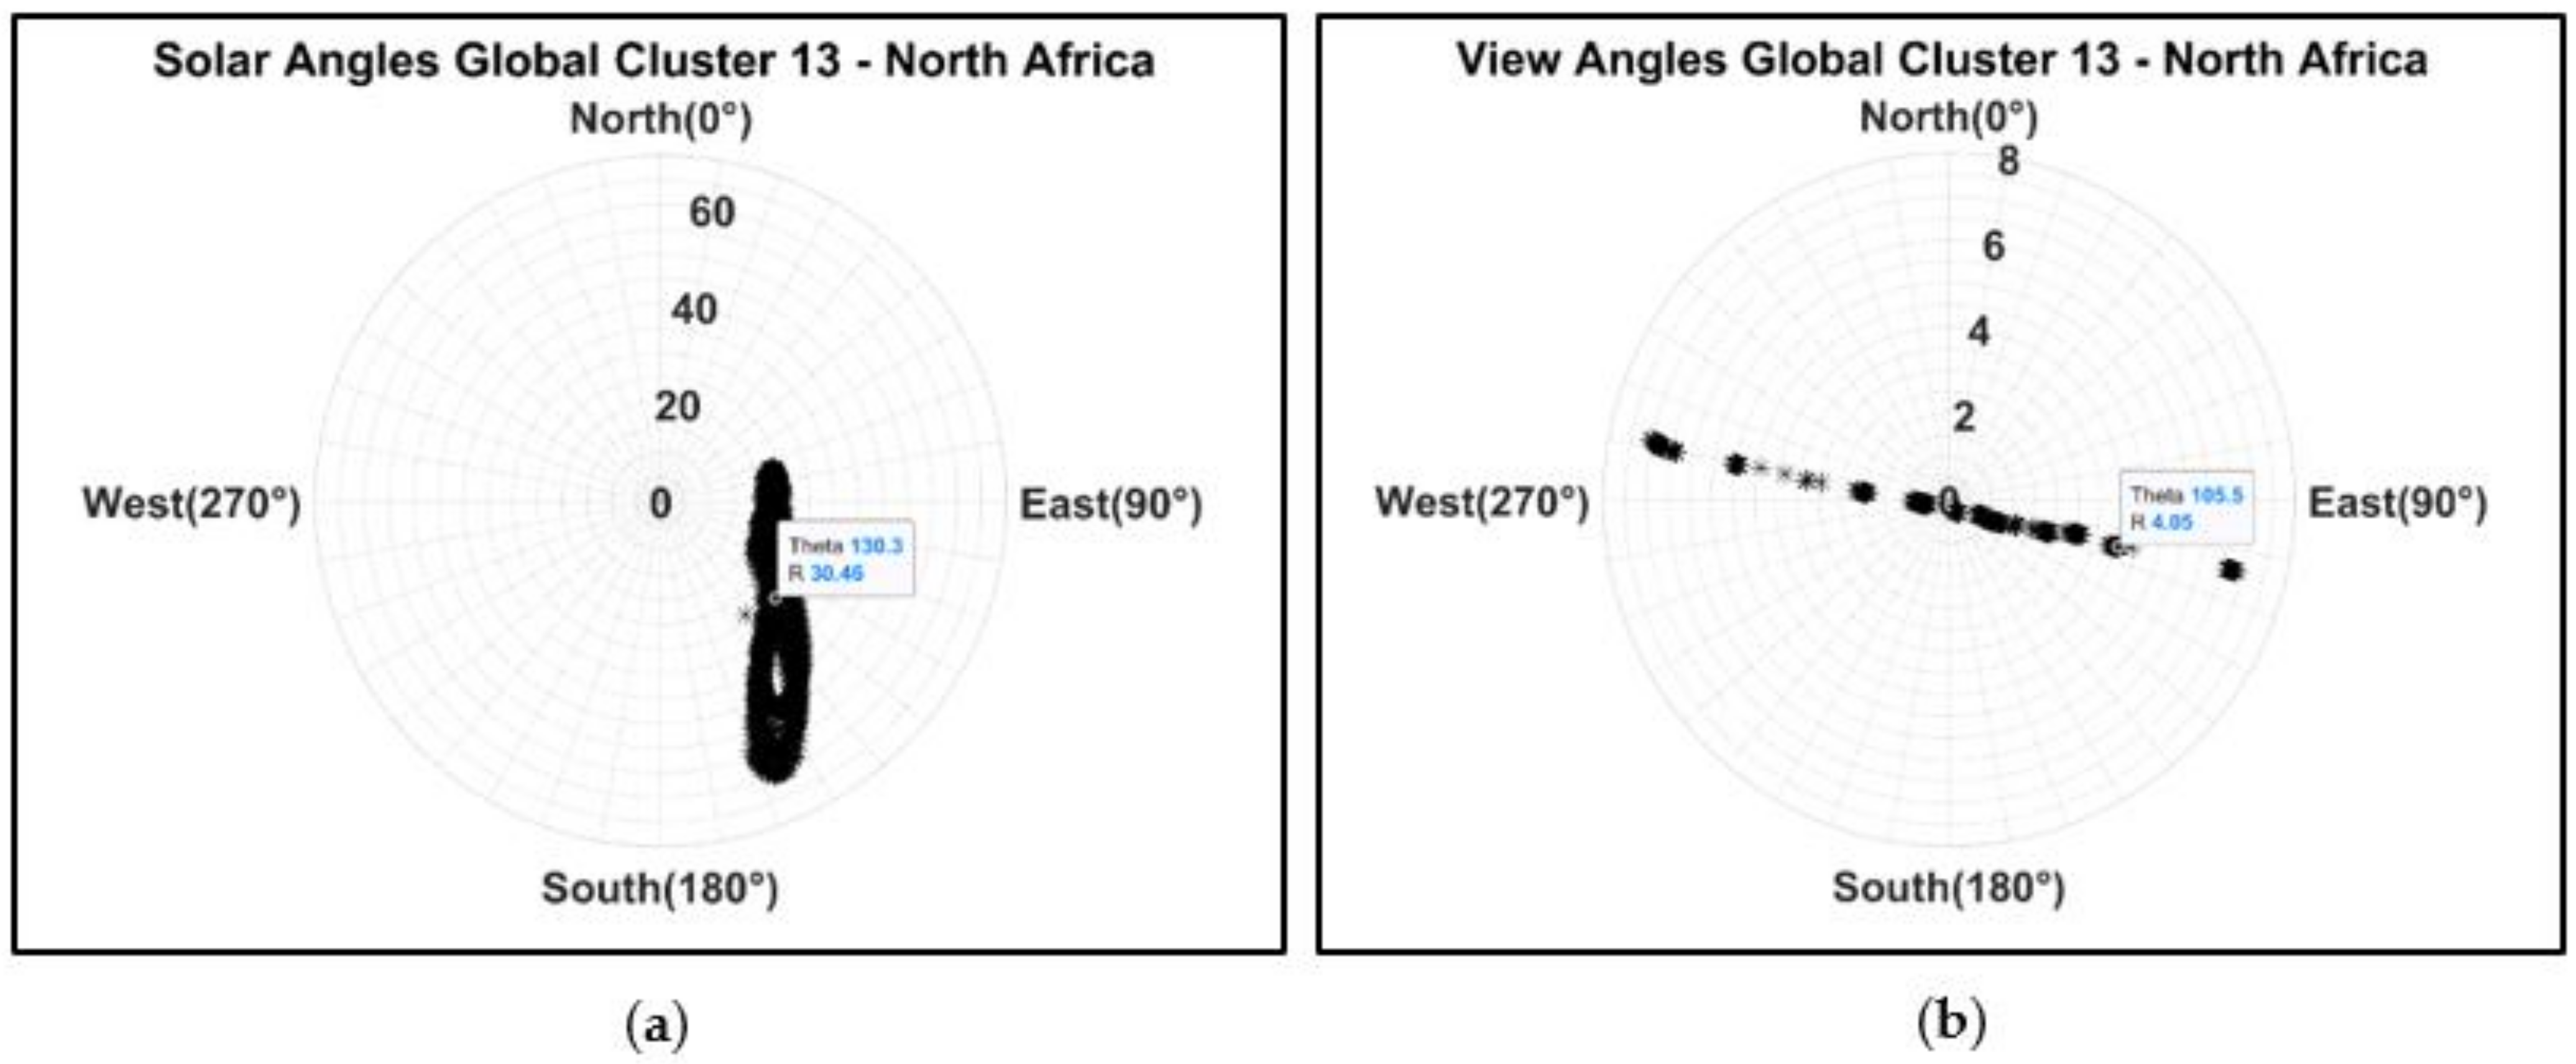
where is the BRDF normalized TOA reflectance, is the observed TOA reflectance for every cloud filtered scene available, corresponds to the predicted TOA reflectance for each observation, and is the mean TOA reflectance estimated using reference geometry. This reference geometry contains reference solar zenith and solar azimuth angles as well as view zenith and view azimuth angles. To choose the reference angles to estimate the reference reflectance, a polar plot of GC13—NA (locations across North Africa found in this global classification) was obtained. From the center of the data set, the reference solar azimuth and solar zenith angles were selected as shown in Figure 3a. For a given date at which the solar geometry corresponds to the reference angles selected, view angles were selected as reference view angles (Figure 3b) to estimate a reference TOA reflectance from actual acquisition geometries. The reference angles were chosen in the center of the dataset so that the TOA reflectance was normalized to a geometry of acquisition with real acquired angles that provided a reflectance close to the cluster mean. The reference angles selected were a solar zenith angle of 30°, a solar azimuth angle of 130°, a view zenith angle of 4°, and a view azimuth angle of 105°.
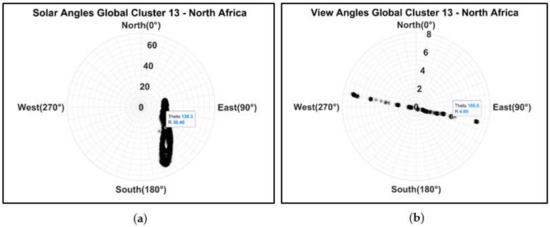
Figure 3.
(a) Polar plot of solar azimuth and solar zenith angles of every scene of every location in North Africa. Data cursor in polar plot shows solar zenith and solar azimuth reference angles selected to perform BRDF normalization using GC13-NA as reference. (b) Polar plot of view azimuth and view zenith angles of every location in North Africa found in this global cluster. Data cursor in polar plot shows view zenith and view azimuth reference angles to perform BRDF normalization using GC13-NA as reference.
2.9. Selection of GC13-O Locations
As mentioned previously, Hasan et al. [10] selected 16 optimal WRS-2 path/row(s) across North Africa. However, in this study, two of the WRS-2 path/row(s) selected by Hasan et al. for C13 were replaced. After visually inspecting outliers present in the GC13-NA dataset, it was possible to determine that WRS-2 path 178/row 47 is subject to sand storms. Thus, this location was replaced by WRS-2 path 178/row 41, considering that path 178/row 41 also contains GC13 pixels. After observing the temporal trend of this location, it proved to be stable and was selected as one of the 16 optimal WRS-2 path/row(s) of the GC13-NA. In addition, WRS-2 path 182/row 40 exhibited a higher temporal mean TOA reflectance for coastal aerosol and blue bands compared to the temporal trend of the other WRS-2 path/row(s) in the GC13-NA for these bands. Higher temporal mean TOA reflectance for any particular location, compared to the rest of the cluster, may be an indicator that there were pixels marked as part of Cluster 13 that might, in fact, belong to a different cluster, suggesting that the classification could be improved. Since WRS-2 path 182/row 40 exhibited higher TOA reflectance for two of the OLI spectral bands (coastal aerosol and blue band), this location was replaced by WRS-2 path 198/row 47, considering its spectral characteristics and larger pixel count. WRS-2 path 198/row 47 has approximately 54 million pixels, whereas WRS-2 path 182/row 40 has nearly 32 million pixels. The new optimal WRS-2 path 198/row 47 was stable. In addition, the temporal trend of this site was within the temporal TOA reflectance of the additional 15 sites that were selected as part of GC13-NA.
Considering the results found for C13, and how Hasan et al. [10] evaluated and showed North Africa’s potential as an EPICS, 16 optimal WRS-2 path/row(s) in North Africa found for this classification were used as a reference in this study (optimal WRS-2 path/row 1 to 16 in Table 1). This was for the purpose of determining if locations in other continents, identified as having similar temporal and spectral characteristics as North Africa, were, indeed, part of the same cluster and could be regarded as potential candidates for the cluster 13 global EPICS, or if these sites were part of a different cluster and the classification needed adjustment. Sites in North America, South America, Australia, Middle East, Central Africa, and South Africa were included in this analysis.

Table 1.
GC13-O optimized WRS-2 path/row for every Landsat-8 acquisition day, pixel count, and area in km2.
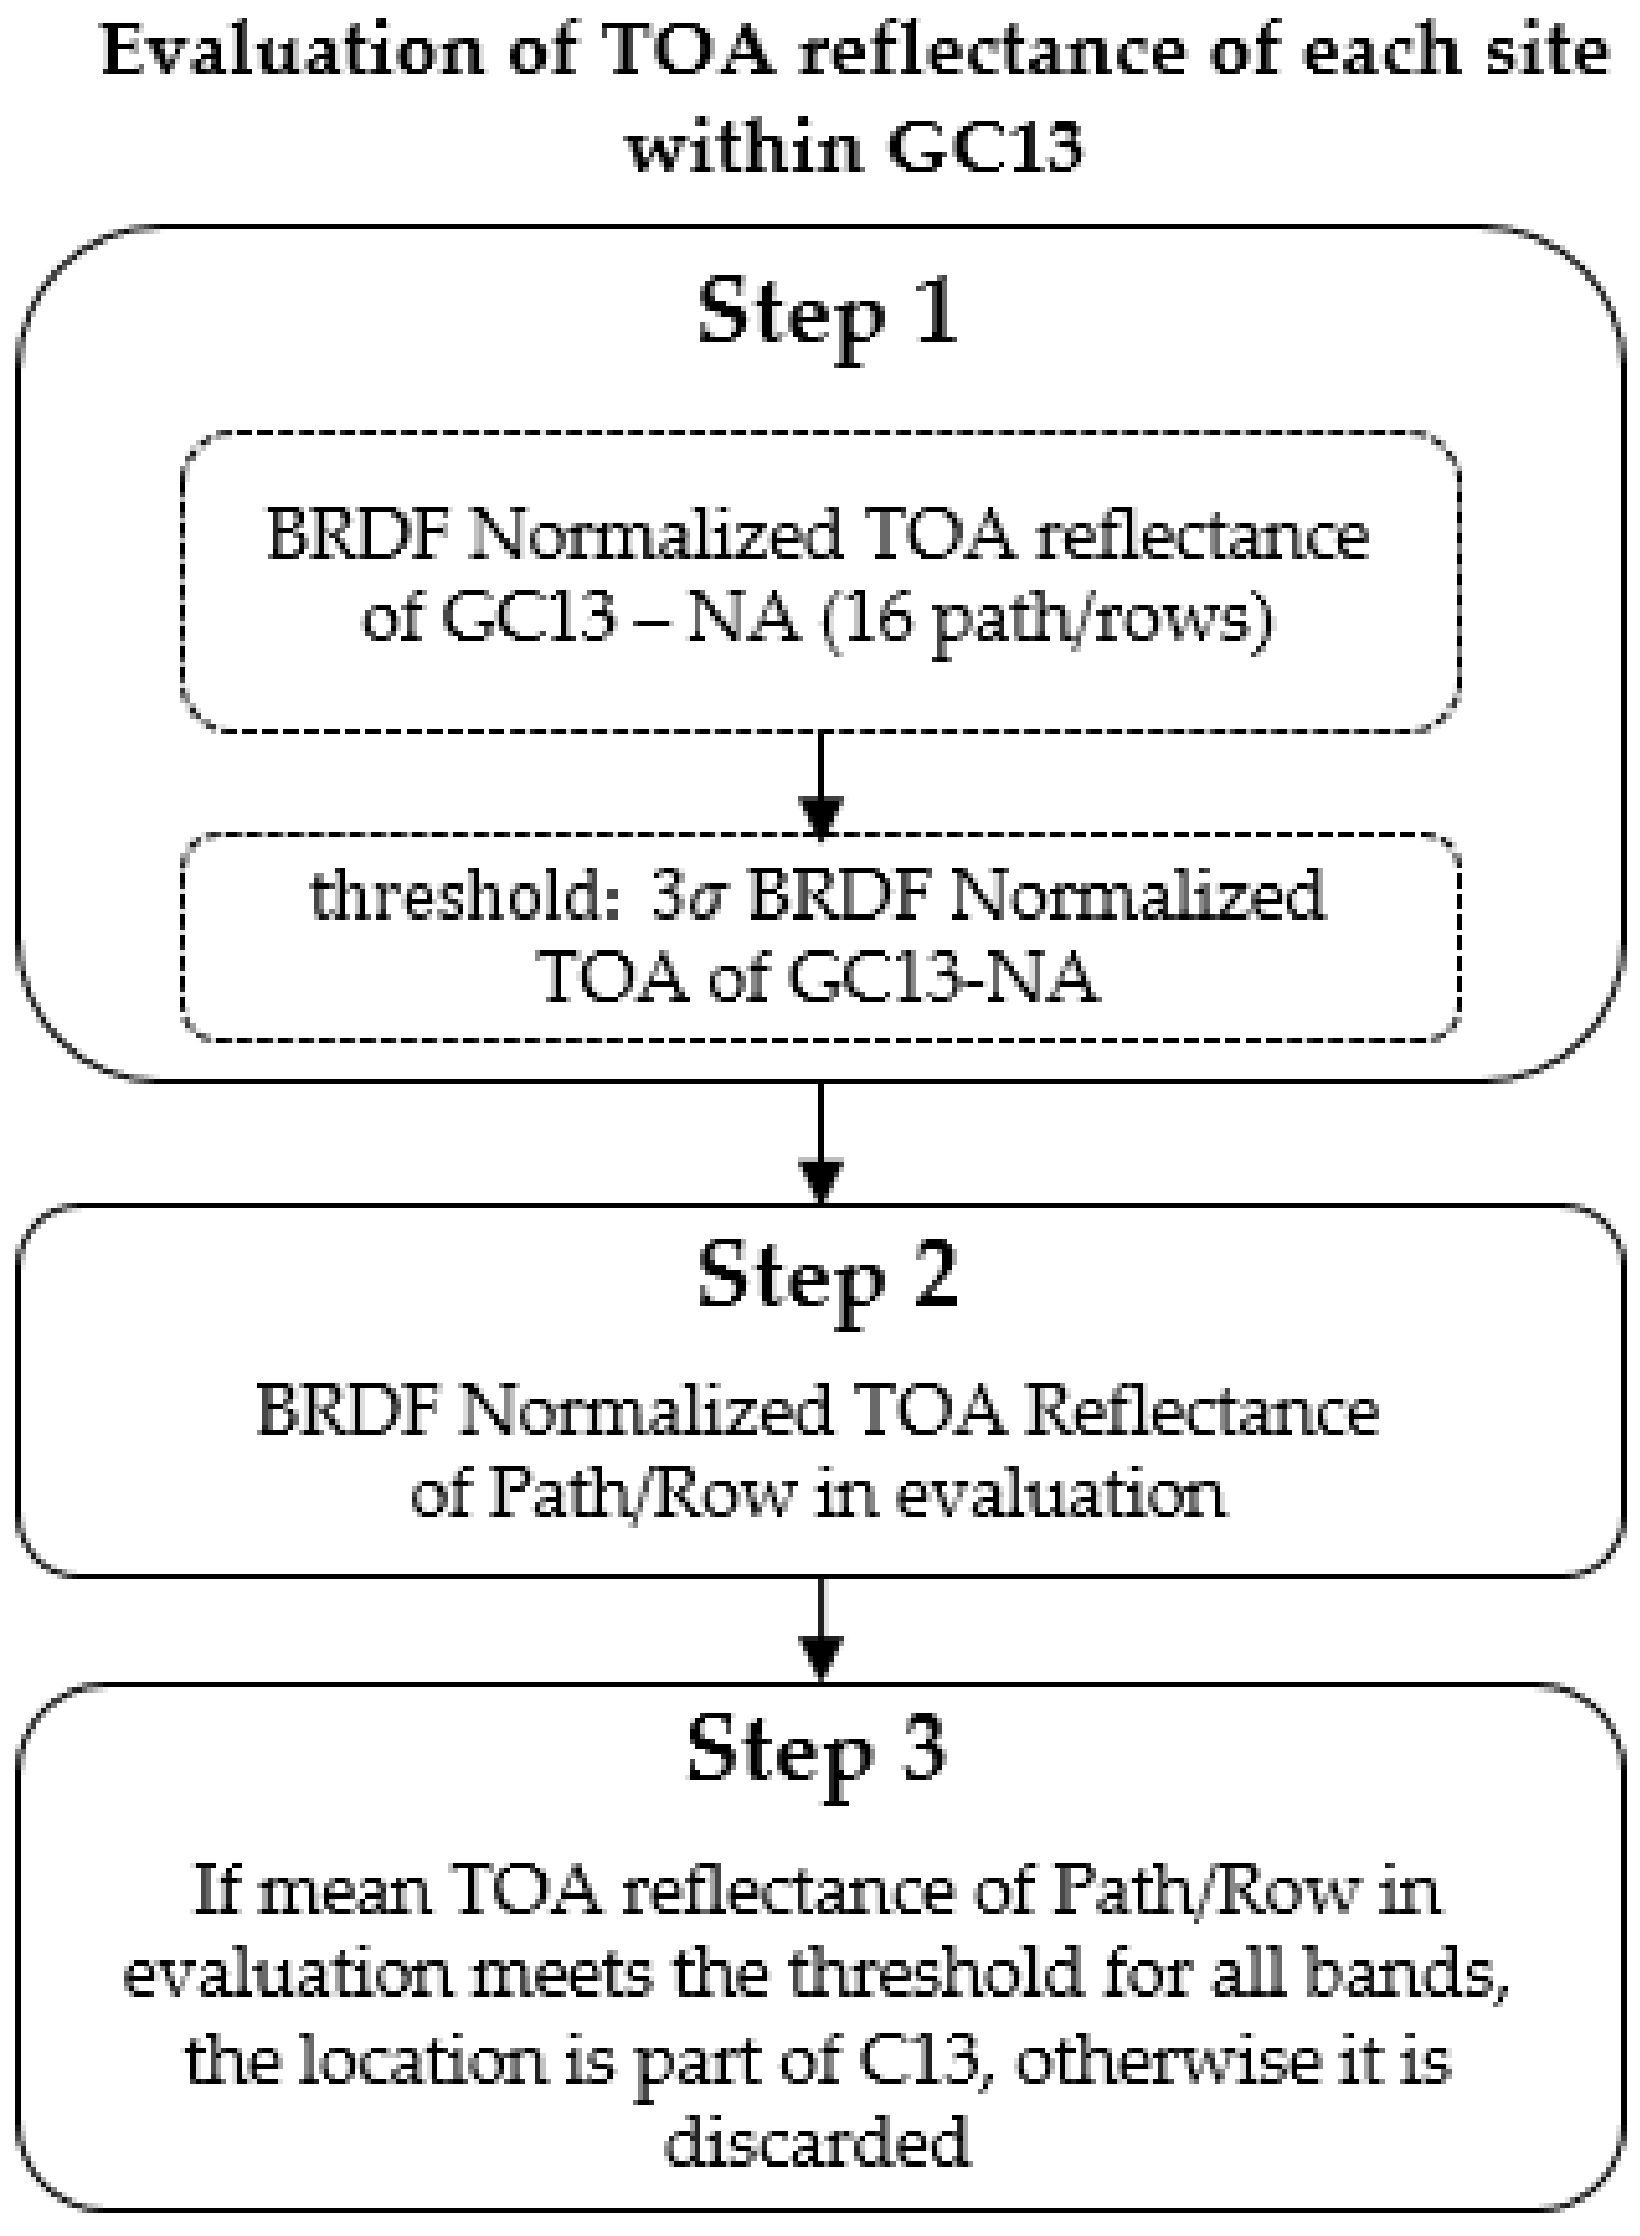
To evaluate if any of the previously mentioned locations were temporally and spectrally similar to GC13-NA, a threshold was set. Figure 4 shows a block diagram with the steps for the estimation and application of the threshold. In step 1, the temporal mean of the BRDF normalized TOA reflectance of the GC13-NA (16 WRS-2 path/row(s)) was chosen as a baseline to set the threshold. A 99.7% confidence interval was chosen and the threshold was set at three times the temporal standard deviation (±3σ) of the BRDF normalized TOA reflectance of the GC13-NA for each spectral band.
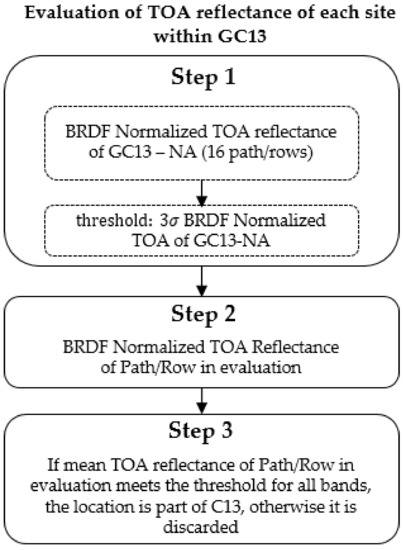
Figure 4.
Steps followed for the evaluation of BRDF normalized TOA reflectance of every site within GC13.
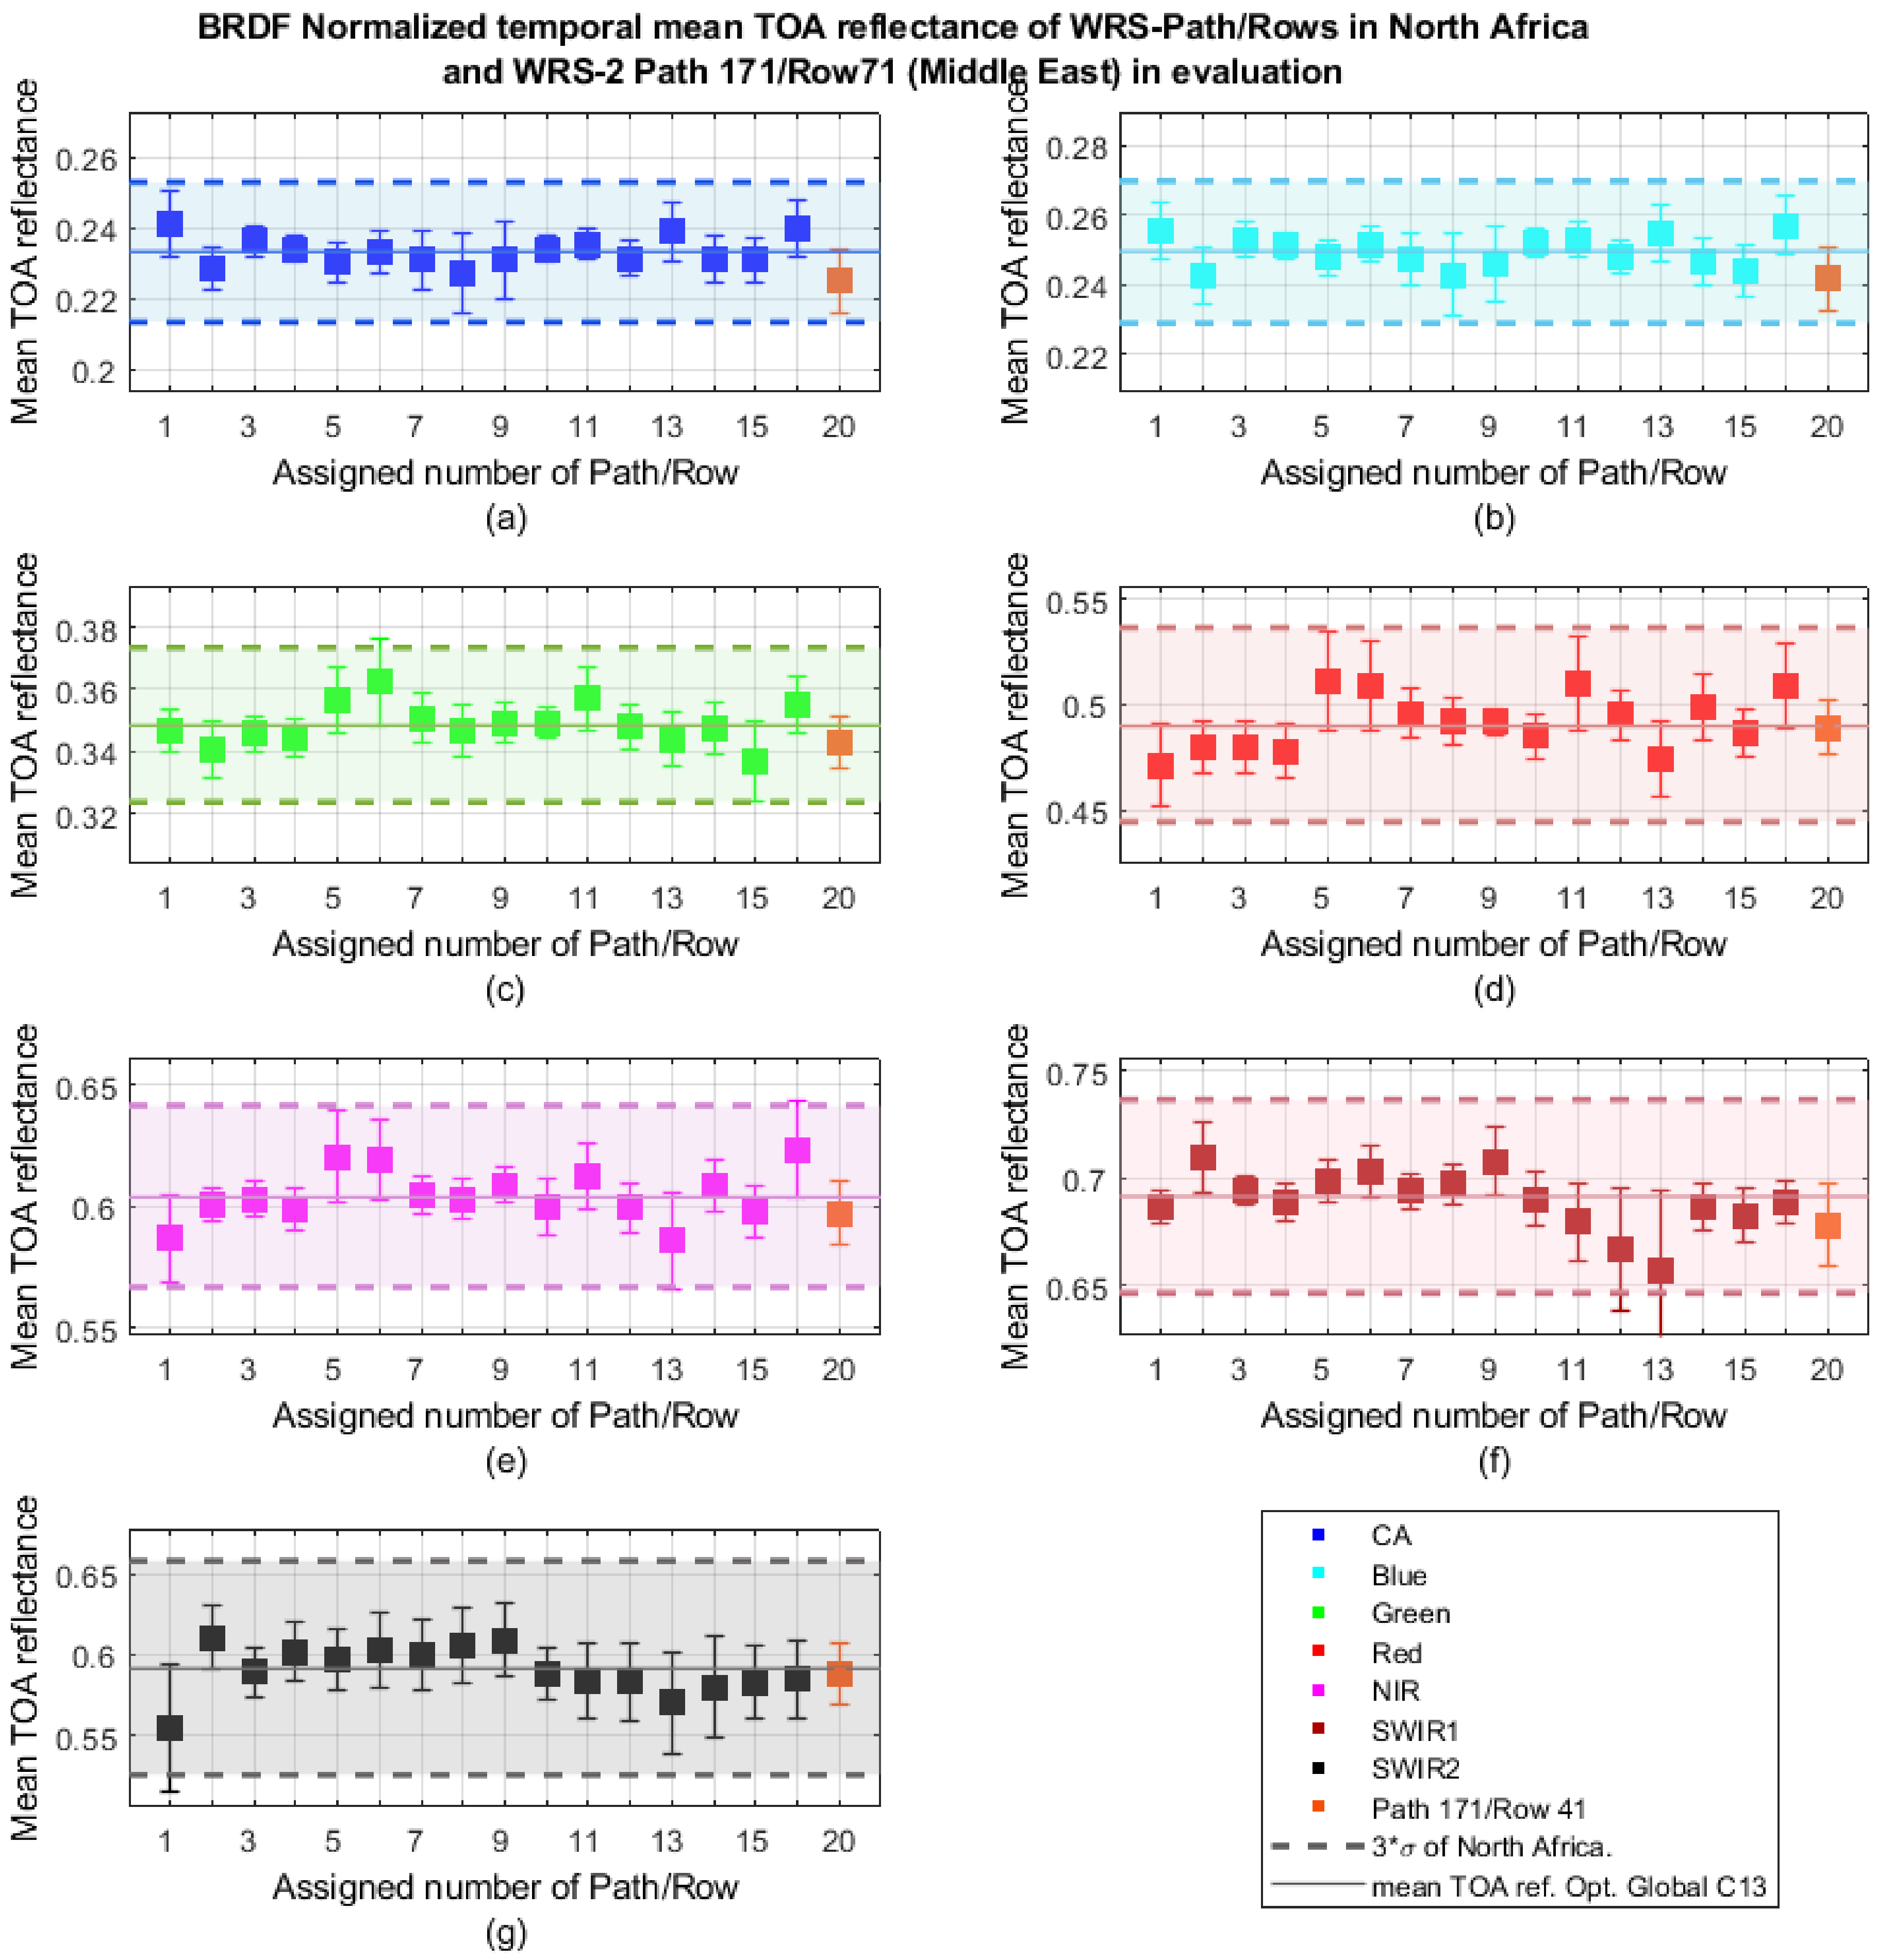
Step 2 was to compute the BRDF normalized mean TOA reflectance of each site being evaluated. This normalized TOA reflectance was obtained in a combination with the North Africa time series using the BRDF model mentioned in Section 2.8. Step 3 was the application of the threshold. A location was considered as part of the cluster if the BRDF normalized TOA reflectance of the site under evaluation fell within three times the temporal standard deviation (±3σ) of the BRDF normalized TOA reflectance of the GC13-NA for all spectral bands. On the other hand, if the threshold was not met, the location was not included since it did not present similar spectral and/or BRDF behavior as that of the North Africa sites. For example, Figure 5a–g shows the BRDF normalized TOA reflectance of WRS-2 path 171/row 41 (Middle East) being evaluated, as well as the BRDF normalized TOA reflectance of every WRS-2 path/row of the GC13-NA. The orange square in every chart corresponds to the BRDF normalized TOA reflectance of the location under study (WRS-2 path171/row41) showing it is within the threshold (dashed lines-shaded areas), and indicating that this location meets the threshold requirements and, consequently, is part of Cluster 13 and included in the GC13-O.
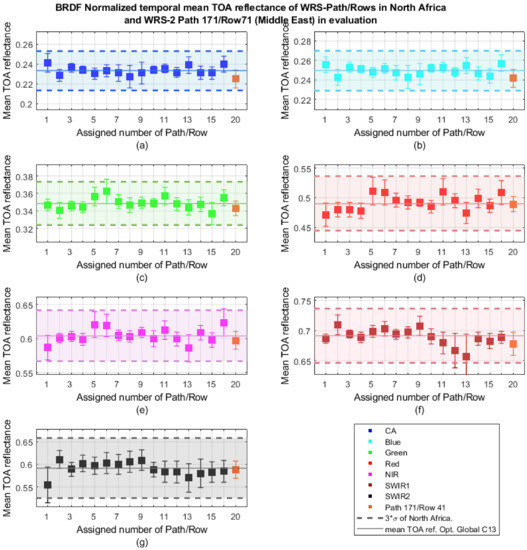
Figure 5.
Individual behavior of 16 different WRS-2 path/row(s) of GC13-NA and WRS-2 path 171/row 41 in evaluation for the Middle East. (a) CA band, (b) blue band, (c) green band, (d) red band, (e) NIR band, (f) SWIR 1 band, and (g) SWIR 2 band. Each WRS-2 path/row can be seen in Table 1 using the assigned number shown in the x-axis of each chart.
2.10. Uncertainty Estimation
In order to perform the uncertainty analysis of the GC13-O, uncertainty was estimated through the consideration of the random variability present in the data, as well as the uncertainty that could be introduced to the results through data processing. Uncertainty sources included in this study were accounted for from a temporal perspective, through spatial variability between sites (WRS-2 path/row within the cluster), the stability of the sensor, and the impact that the BRDF normalization process could have on the results. Temporal uncertainty () corresponds to the temporal variability of the site throughout the time series in combination with the uncertainty of the sensor, considering that there is a random variability associated with it in every measurement. Likewise, the BRDF model uncertainty () was included given that the BRDF normalized TOA reflectance was obtained using a mathematical model that has an uncertainty associated with it. In addition, spatial variability between sites () was considered to account for differences that could exist between sites.
Total uncertainty for this GC13-O was calculated as shown in Equation (8). The temporal component, , which was assumed to contain temporal variability of the site as well as the stability of the sensor, was estimated as the average of temporal standard deviations of the BRDF normalized TOA reflectance of every path/row in the GC13-O time series. This is shown in Equation (9), where is the temporal standard deviation of the BRDF normalized TOA reflectance for each location in the GC13-O and N is the total number of locations in the GC13-O (23 in this analysis).
Given that this global EPICS is a combination of multiple locations for every day of the Landsat cycle, a different portion (but on those cycle days the same exact portion) of the cluster is imaged, contrary to what occurs with the traditional PICS, where every observation is achieved over the exact same target. In order to account for variability that could exist between sites (portions of the cluster), spatial uncertainty () was considered. This variability was estimated as shown in Equation (11). Standard deviation of the BRDF normalized TOA reflectance of the entire cluster was estimated (). This standard deviation contained the temporal component () as well as variability between sites. The spatial component () was then estimated as the difference between the temporal standard deviation of the cluster () and the temporal component (), as shown in Equation (11).
Additionally, Equation (12) shows the estimation of , which corresponds to the BRDF error measuring the differences between the observed TOA reflectance () and the predicted TOA reflectance of the BRDF model shown in Section 2.8 ().
3. Results and Discussion
In this new classification achieved using global data, 160 land cover types (clusters), across the world, with different temporal, spectral, and spatial characteristics were found. Considering the potential of C13 as an EPICS, one of the 160 clusters obtained in this classification that exhibited similar spectral characteristics to C13 was selected as a global EPICS (GC13). Results obtained after evaluating every site within this GC13 are shown in this section, including spectral similarities between sites and a comparison of the GC13-O (23 WRS-2 path/row(s) selected after the evaluation described in Section 2.9) with C13. In addition, a comparison between the GC13-O and the traditional PICS approach, using Libya 4 CNES ROI, is presented, given that it is a well-known site in the remote sensing community.
3.1. Optimal Global Cluster GC13-O
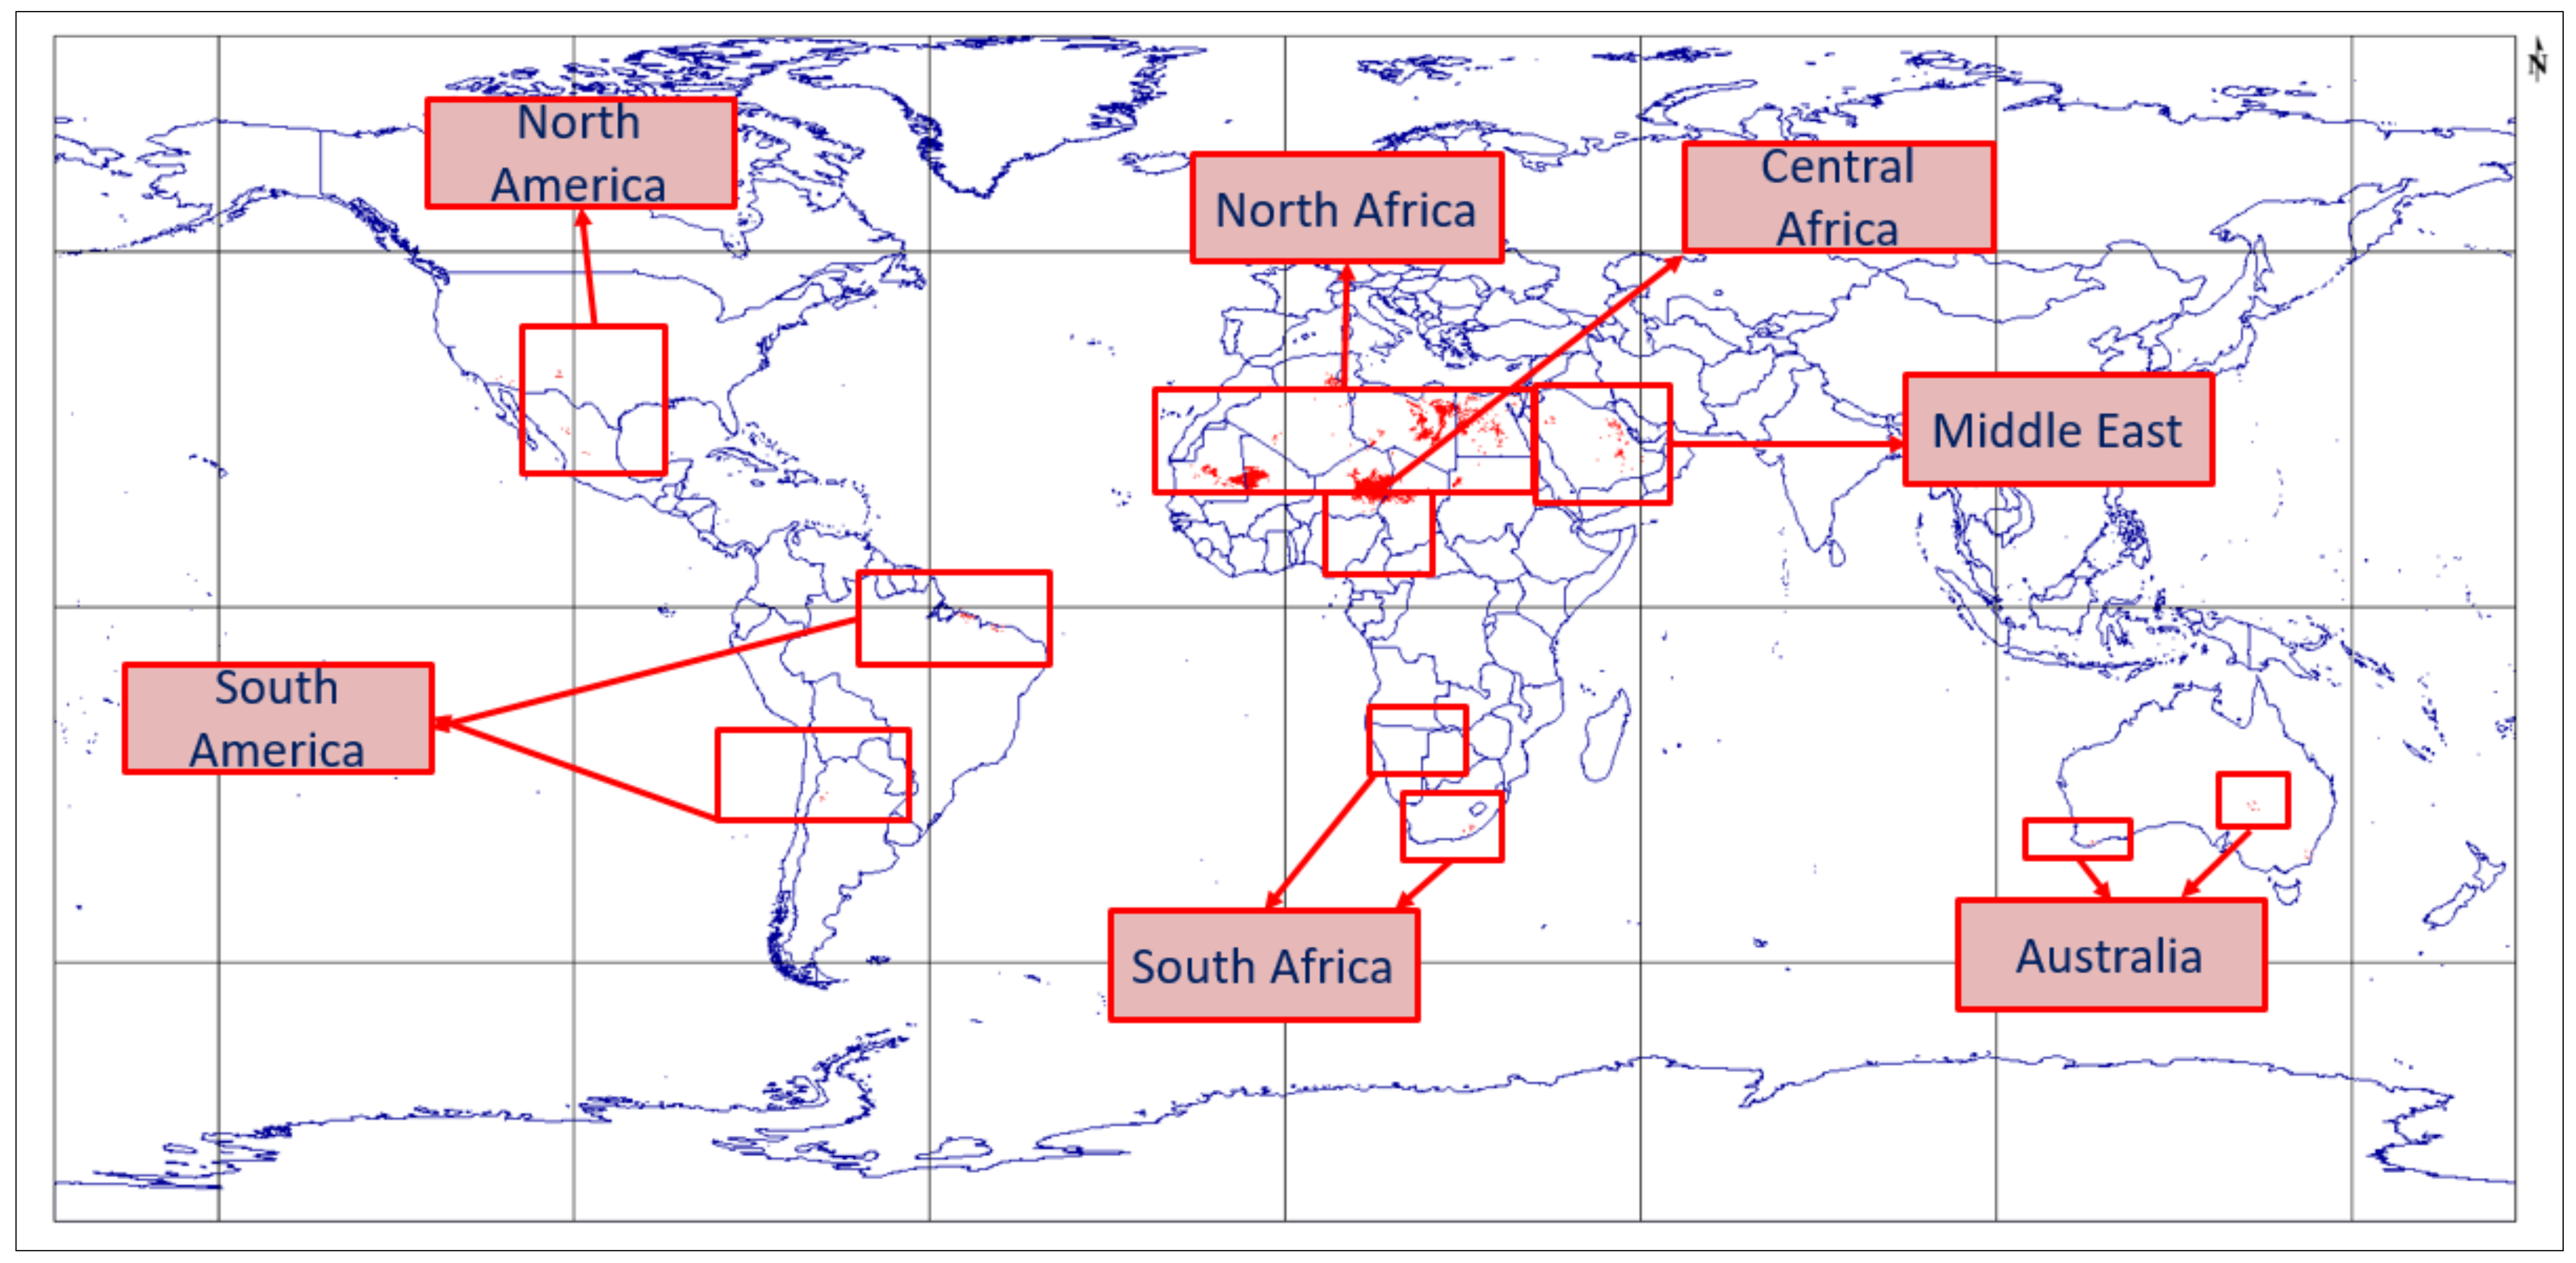
A cluster containing pixels with similar characteristics to C13 was found in this classification across North and South America, Africa, Middle East, Australia, and East Asia, as shown in Figure 6. Pixels found across East Asia were sporadic and pixel count was much lower than other locations, such as the Middle East. East Asia contained 8079 disperse pixels, whereas the Middle East had over 40 million pixels, most of which were aggregated together in vast areas. In addition, when there are single pixels belonging to a cluster scattered across a scene, as it is the case of East Asia, geometric accuracy can be a problem. Considering that if a scene is displaced by at least one pixel, the terrain features may differ from those defined as a certain cluster, which, in this case, was Cluster 13. Therefore, locations in East Asia were not considered for further analysis. Using the Landsat acquisition calendar tool [17], 38 WRS-2 paths imaged over this GC13 for every day of the Landsat cycle, with multiple rows containing Cluster 13 pixels, were identified, demonstrating a capability to achieve multiple acquisitions for every day of the Landsat revisit cycle. Five WRS-2 path/row(s) in the Middle East were unstable at the end of the time series (2018 to 2020) and, therefore, were not considered for further analysis (WRS-2 path 160/row 47, WRS-2 path 161/row 48, WRS-2 path 162/row 48, WRS-2 path 170/row 39, and WRS-2 path 173/row 36). Moreover, WRS-2 path 99/row 79 in Australia exhibited changes from the year 2014 to 2016, and, thus, this site was also excluded from additional analysis. Table 1 shows the WRS-2 path/row(s) selected as part of the GC13-O produced after the application of the threshold. It likewise contains the locations for every day in the Landsat-8 revisit cycle, assigned number, pixel count, and area in km2.
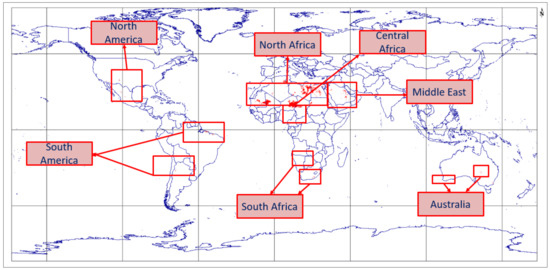
Figure 6.
Global Cluster 13 pixel distribution across the globe found in the classification performed for this work. Red areas over each continent within each red square represent the pixels identified as part of the expanded Global Cluster 13 in each continent.
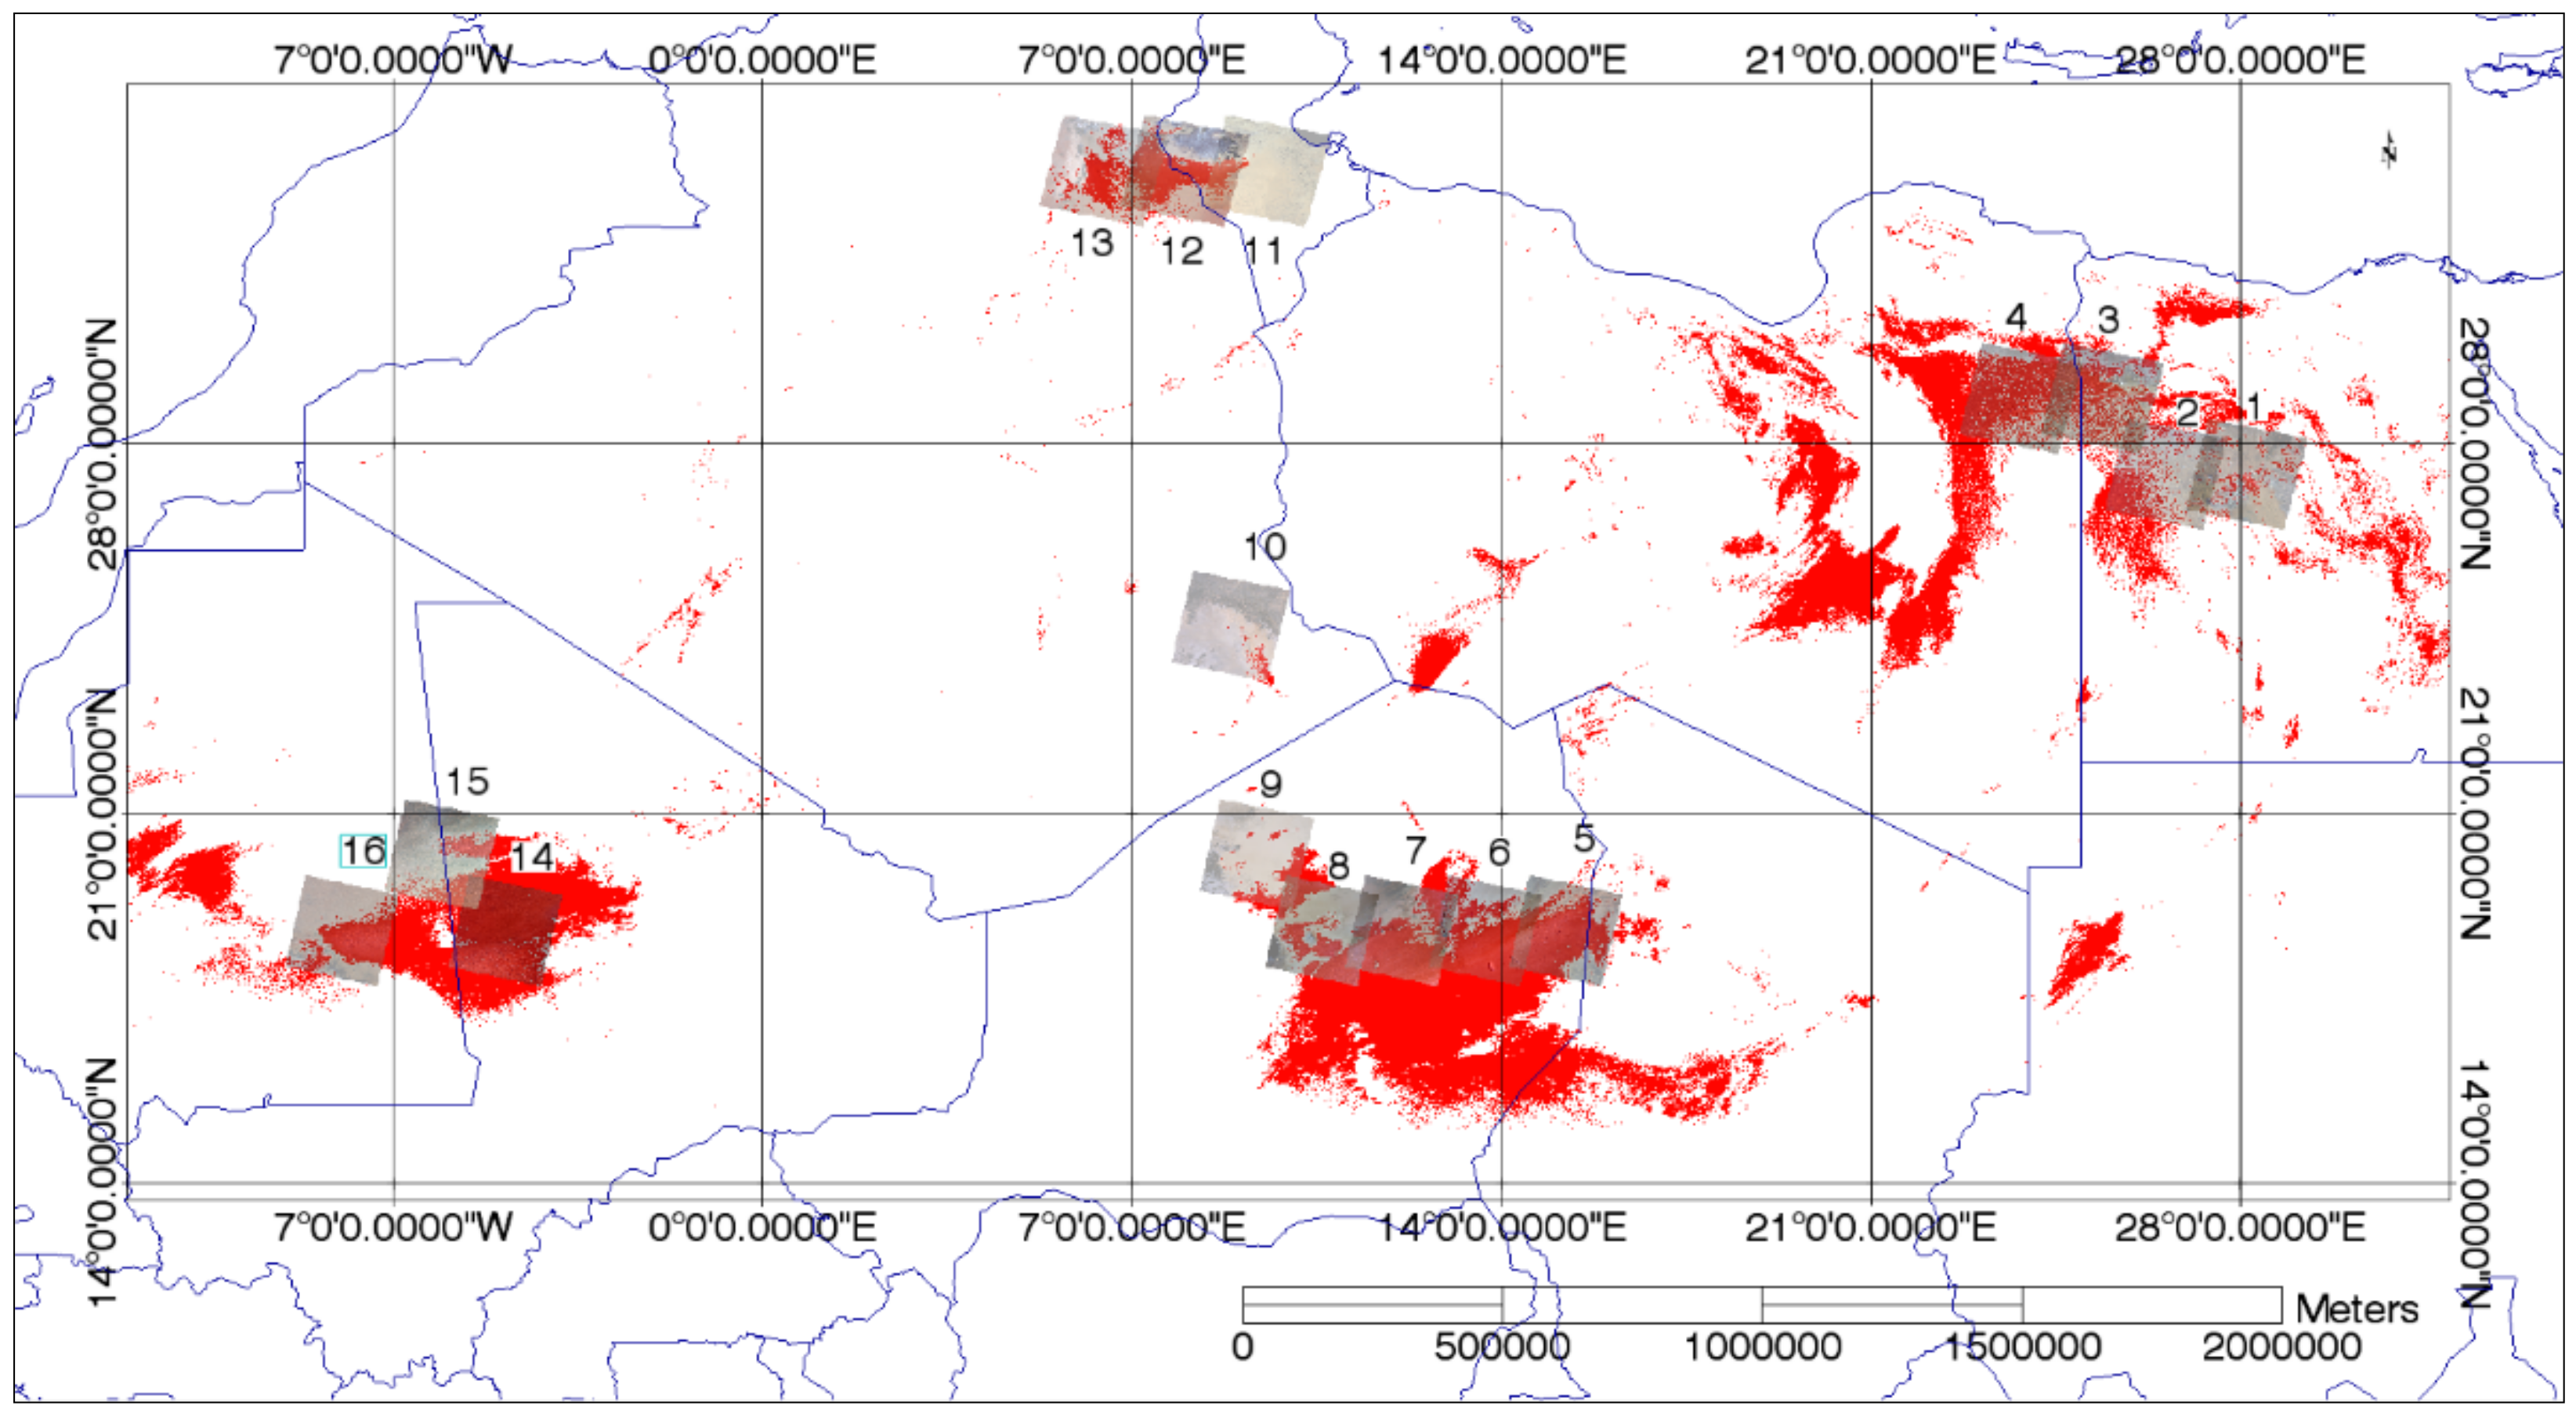
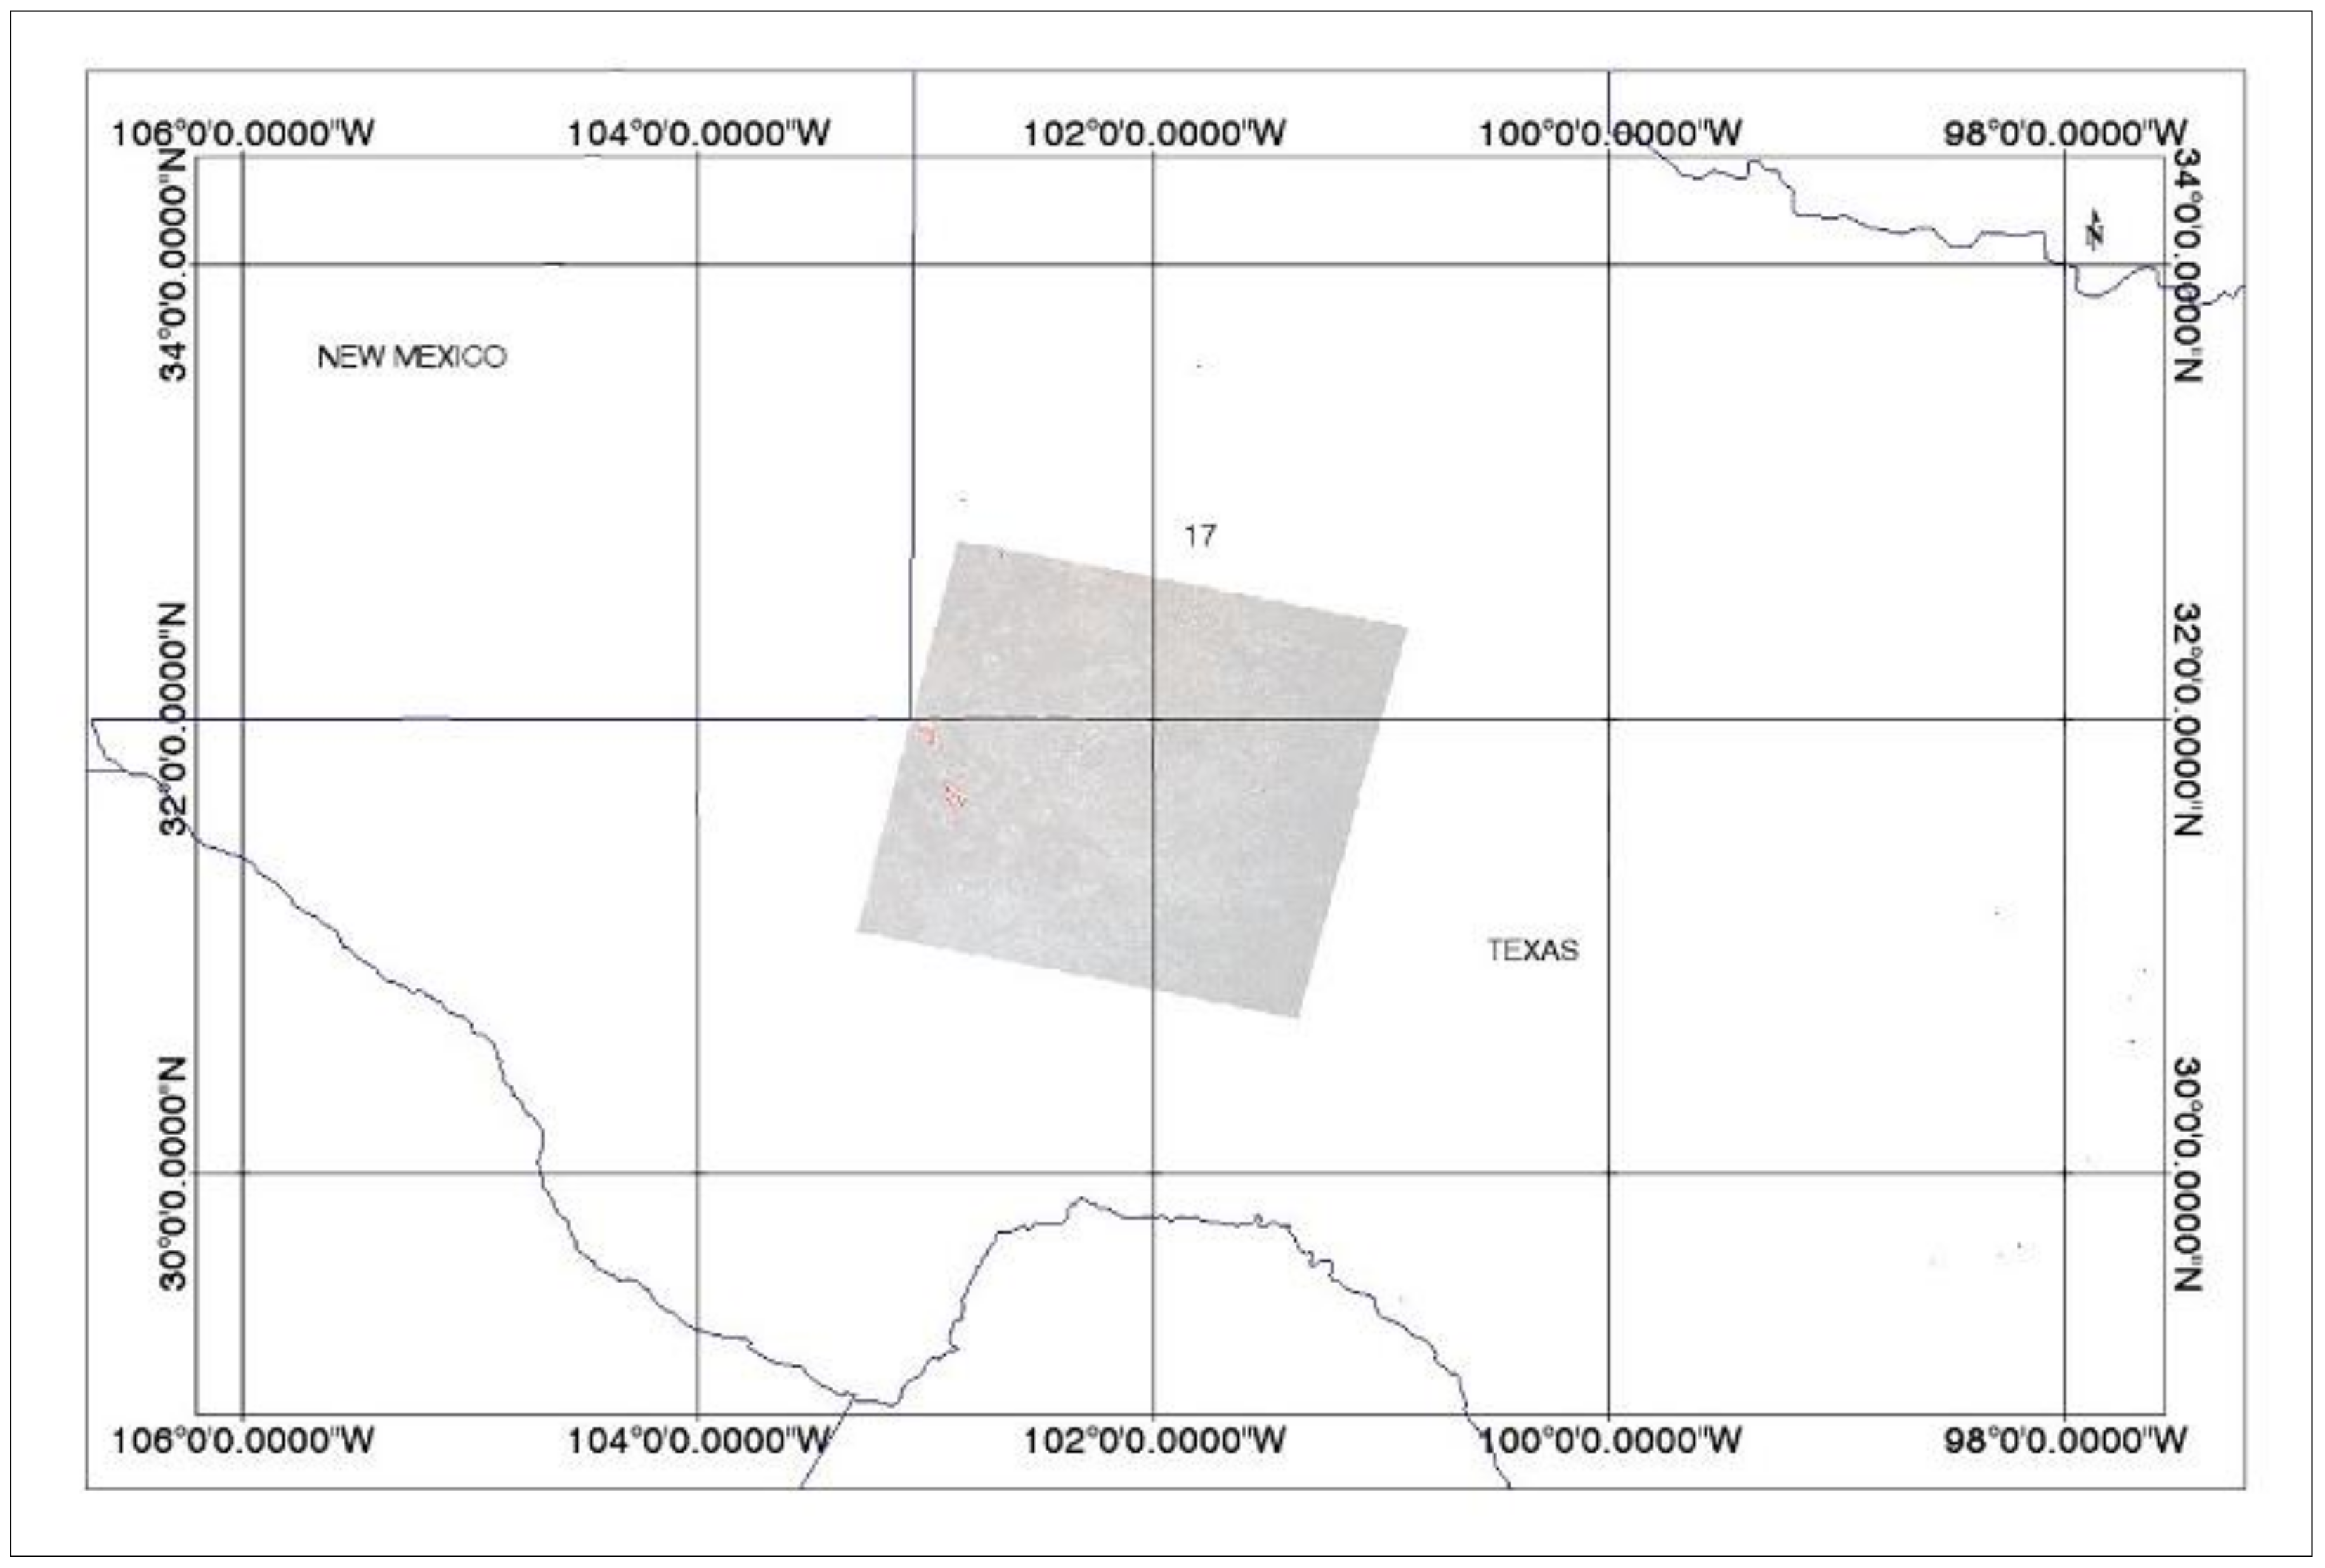
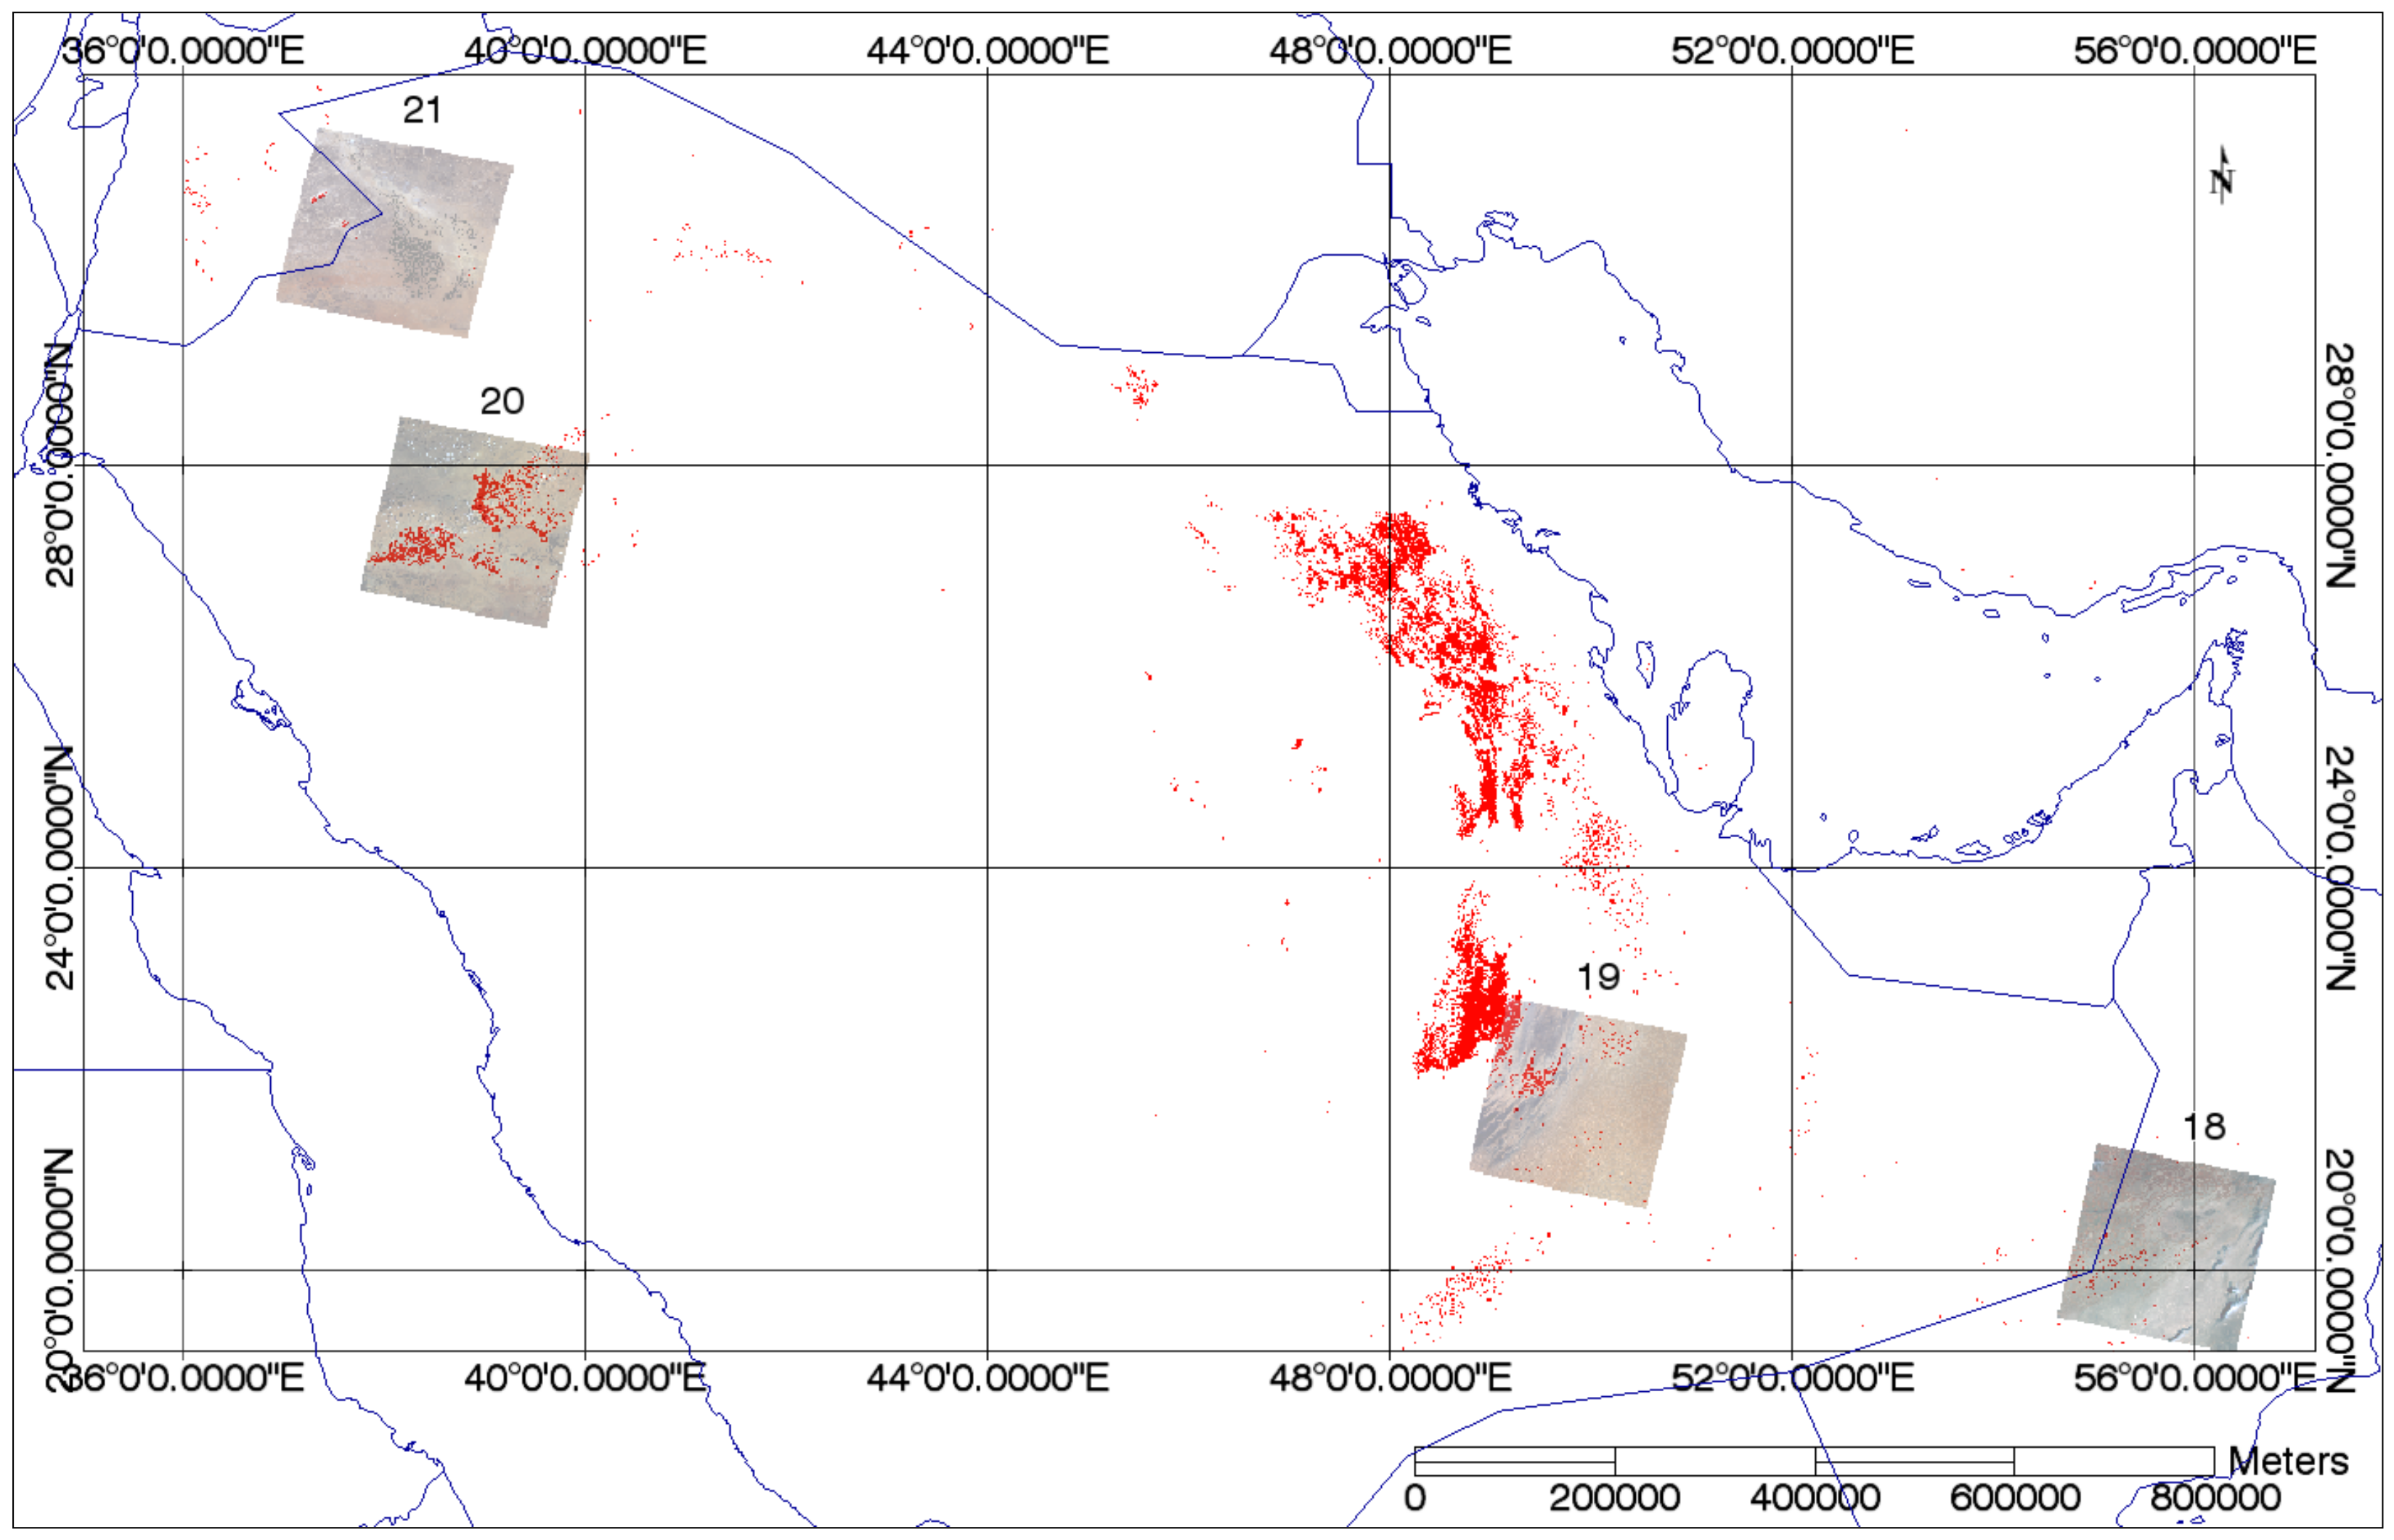
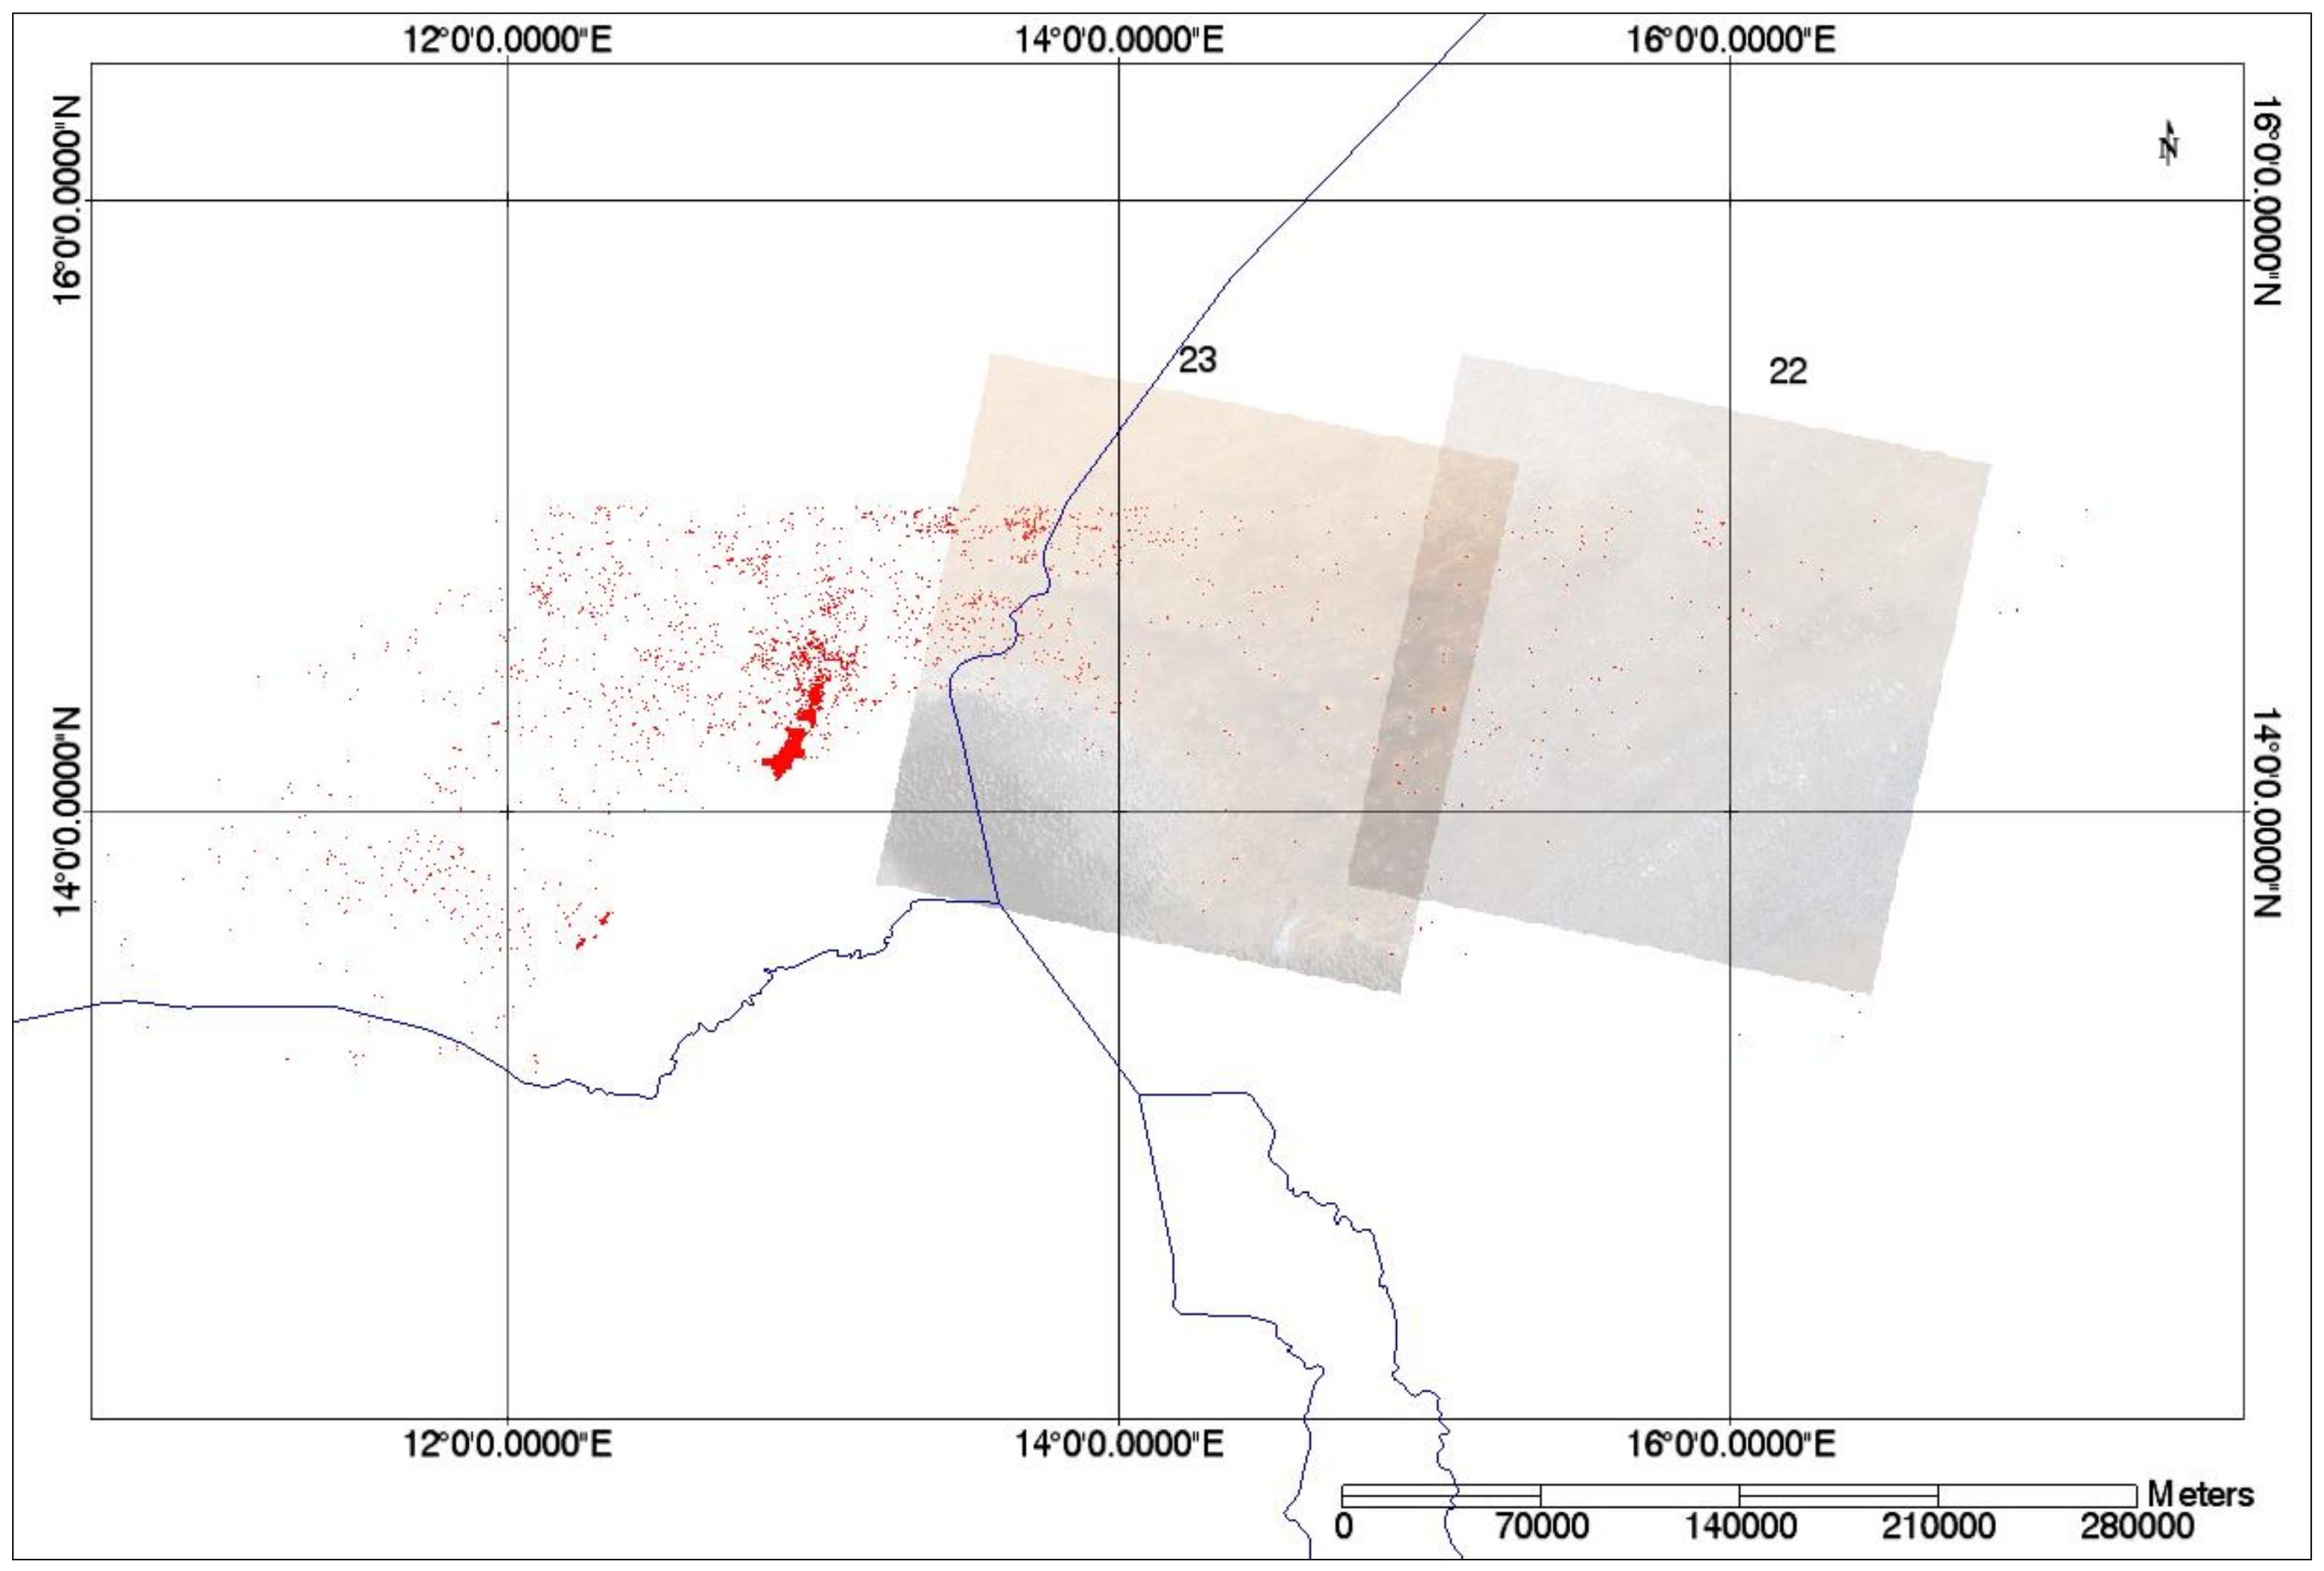
Figure 7, Figure 8, Figure 9 and Figure 10 show the resulting pixel distribution of the new GC13-O and the selected WRS-2 path/row(s) (Landsat-8 images), distributed across North Africa, North America, Middle East, and Central Africa. The WRS-2 path/row(s) in North Africa are the locations assigned numbers 1 through 16 in Table 1, where path 1 is the first WRS-2 path/row located in the east side of North Africa and path 16 corresponds to the last optimal WRS-2 path/row located on the west side of the continent, as shown in Figure 7. The site assigned number 17 corresponds to the selected location in North America, while sites assigned numbers 18 to 21 in Table 1 are sites located in the Middle East and, lastly, sites assigned numbers 22 and 23 are those in the Central Africa region.
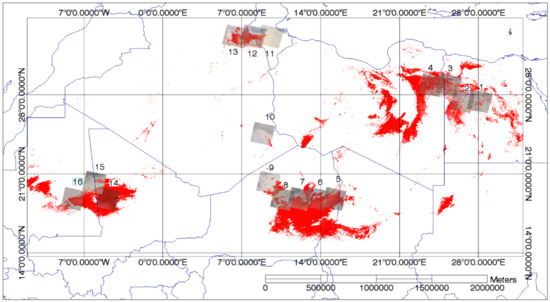
Figure 7.
Sixteen different WRS-2 path/row(s) within North Africa in the GC13-O.
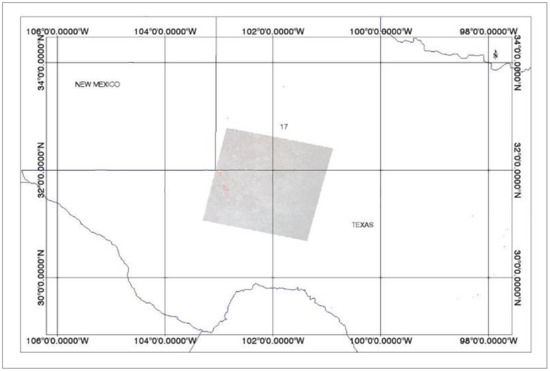
Figure 8.
One WRS-2 path/row for the GC13-O in North America (area: 9 km2).
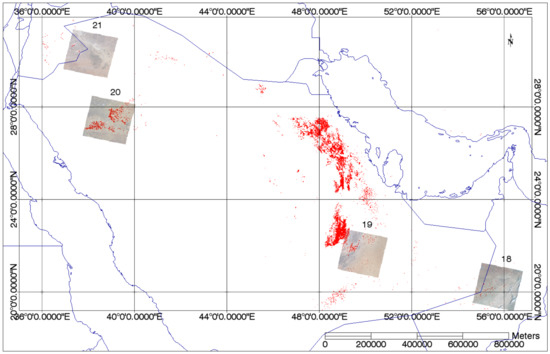
Figure 9.
Four WRS-2 path/row(s) for the GC13-O in the Middle East.
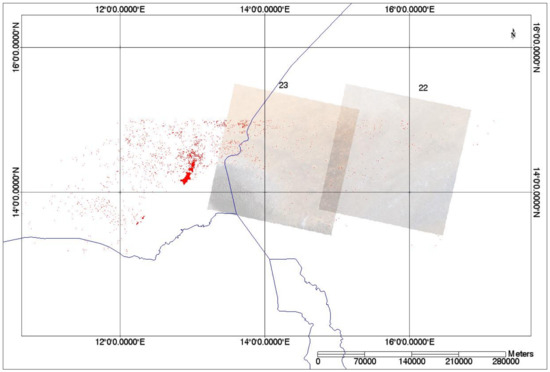
Figure 10.
Two WRS-2 path/row(s) for the GC13-O in Central Africa.
Table 2 shows the rest of the WRS-2 path/rows in the GC13 that were not included in the GC13-O after their evaluation, as explained in Section 2.9 For instance, WRS-2 path 232/row 78 in Argentina was stable throughout the time series as well as WRS-2 path 100/row 81 in Australia. Moreover, WRS-2 path 164/row 44, WRS-2 path 165/row 41, WRS-2 path 166/row 41, and WRS-2 path 167/row 40 in the Middle East were stable for the time period in study (2013 to 2020). However, based on the selection performed using the threshold explained in Section 2.9, these sites were not spectrally and BRDF similar to the GC13-NA, and therefore were not included in the GC13-O. It is possible that these sites belong to a different cluster (with different spectral characteristics), suggesting that the classification may need adjustments. Despite the difference in spectral characteristics between these sites and GC13-NA, these locations might be used to perform calibration and stability monitoring of optical satellite sensors using them as additional EPICS, but further study over these sites would be needed.

Table 2.
GC13 WRS-path/row identified as Cluster 13 in the classification, but not included in the GC13-O.
A total of 23 WRS-2 path/row(s) around the globe were chosen as optimal WRS-2 path/row(s) to be part of a global EPICS (GC13-O) because they were spectrally, temporally, and BRDF consistent with each other. For this extended cluster, the analysis conducted was based on data from 2013 to August 2020. Using GC13-O, a total of 2569 cloud-free acquisitions were obtained for Landsat-8 and 4625 for Landsat-7. Two observations per day were accomplished for days 3, 4, 7, 8, 12, 14, and 16 of the Landsat acquisition cycle, where the second observation per day corresponds to a different site outside of North Africa, in contrast to C13, where daily observations could only be made over North Africa. This is a valuable advantage that GC13-O offers, providing stable regions for calibration and stability monitoring of optical satellite sensors using multiple locations not only on a continental scale, but also on a global scale.
3.2. Optimal Global Cluster Spectral Similarities
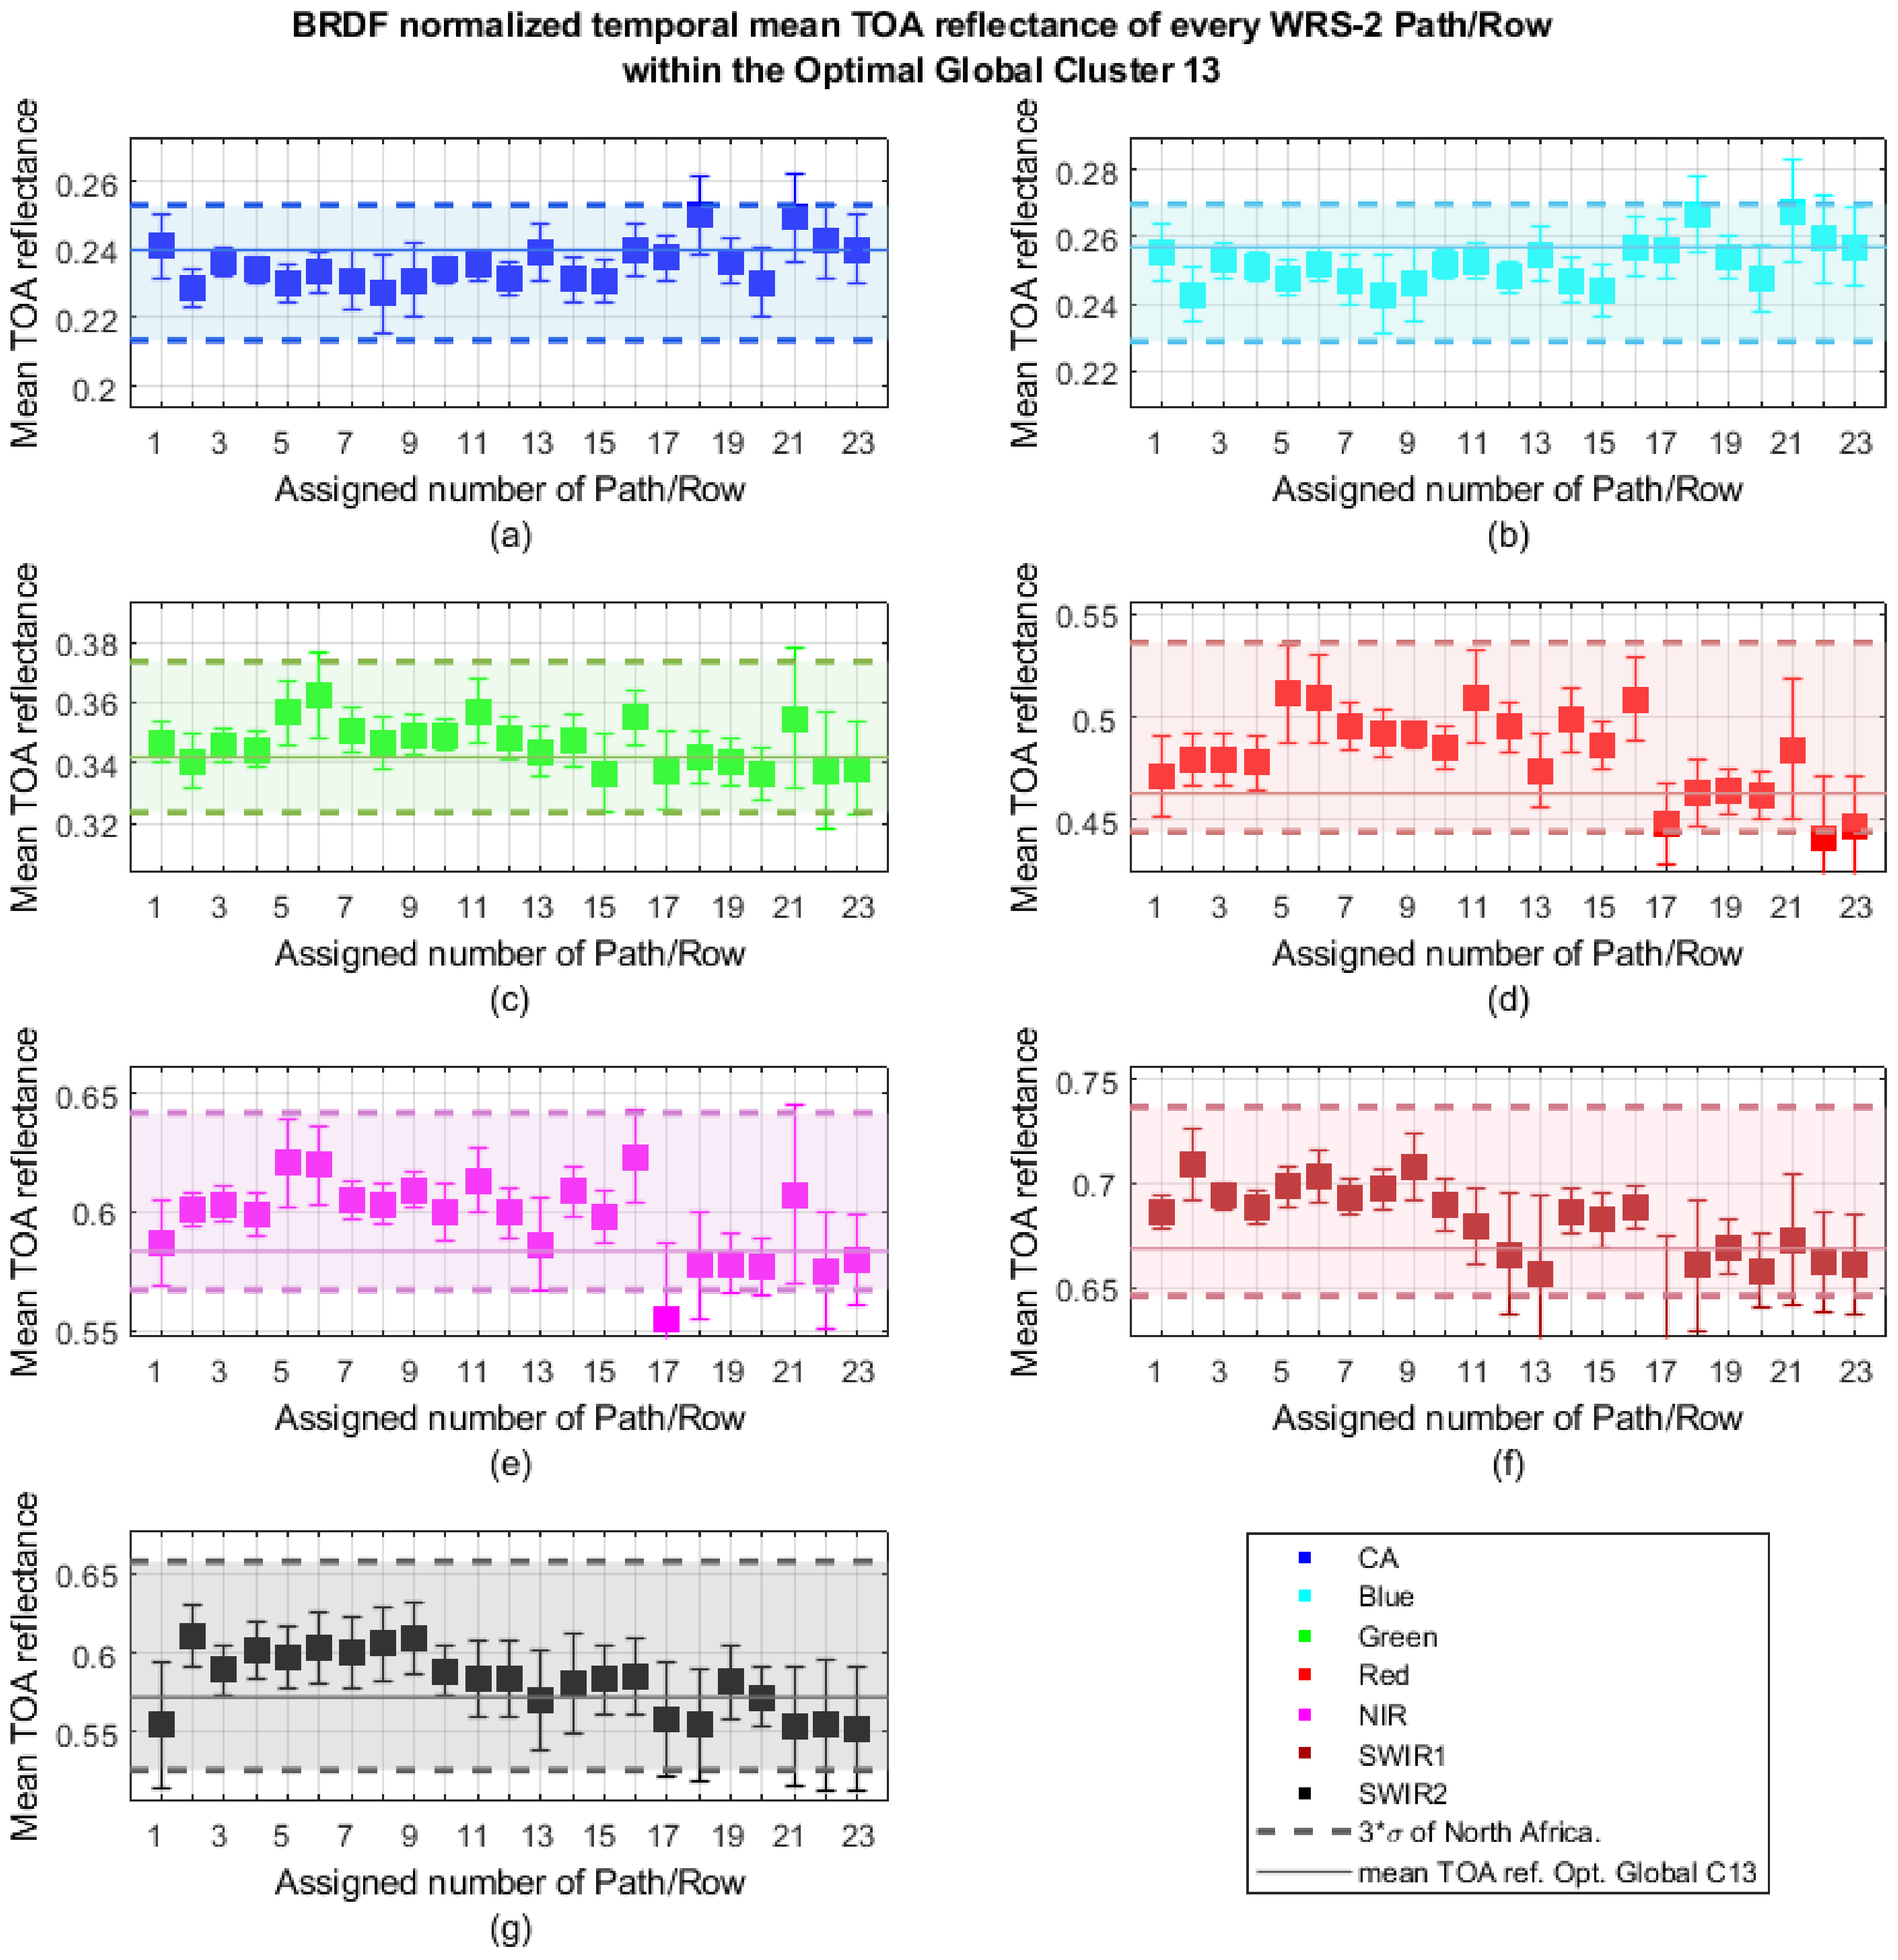
To ensure spectral and BRDF similarities for all sites within the GC13-O, the BRDF normalized mean TOA reflectance of every optimized WRS-2 path/row selected as part of these new EPICS was evaluated to see if every location was within the threshold described in Section 2.9. In order to visualize the behavior of each site within the GC13-O, the BRDF model, shown in Section 2.8, was applied to the entire cluster (23 WRS-2 path/row(s)). The BRDF normalized TOA reflectance of each location is shown in Figure 11, where the error bars indicate the uncertainty estimated, as shown in Section 2.10. From Figure 11, it is possible to see that every site’s BRDF normalized mean TOA reflectance is within the threshold (dashed lines-shaded area), showing that all the sites selected have similar temporal, spectral, and BRDF characteristics, and, thereby, belong to the same cluster. BRDF normalized TOA reflectance for all paths and rows in the coastal aerosol, blue, green, red, NIR, and SWIR 2 band are within the threshold. WRS-2 path 30/row 38, with assigned number 17, located in North America showed a BRDF normalized mean TOA reflectance outside of the dashed line for the SWIR 1 band (0.63 0.06) and NIR band (0.56 0.03). In addition, WRS-2 path 184/row 50 in Central Africa (assigned number 22) also showed a BRDF normalized mean TOA reflectance outside of the dashed line for the red band (0.44 0.02). However, the error bar crossed the mean TOA reflectance of the cluster, 0.669 ± 0.0266 for the NIR band, 0.583 ± 0.0216 for the SWIR 1 band, and 0.46 0.17 for the red band, showing that these sites can be still considered statistically similar to the rest of the cluster.
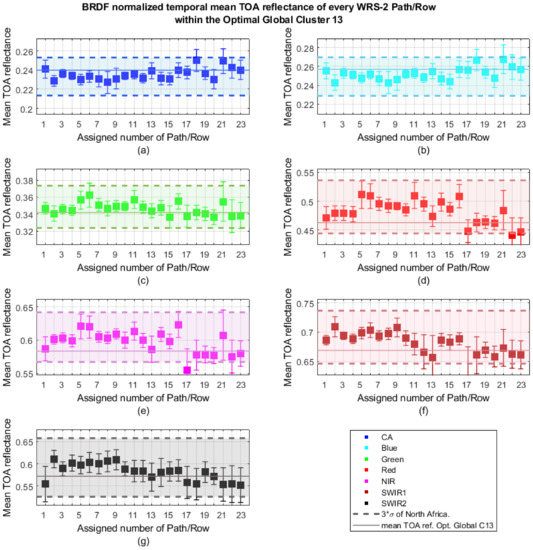
Figure 11.
BRDF normalized temporal mean TOA reflectance (with associated uncertainty) of the 23 individual WRS-2 path/row(s) for (a) CA band, (b) blue band, (c) green band, (d) red band, (e) NIR band, (f) SW1R 1 band, and (g) SW1R 2 band. Each WRS-2 path/row can be seen in Table 1 using the assigned number.
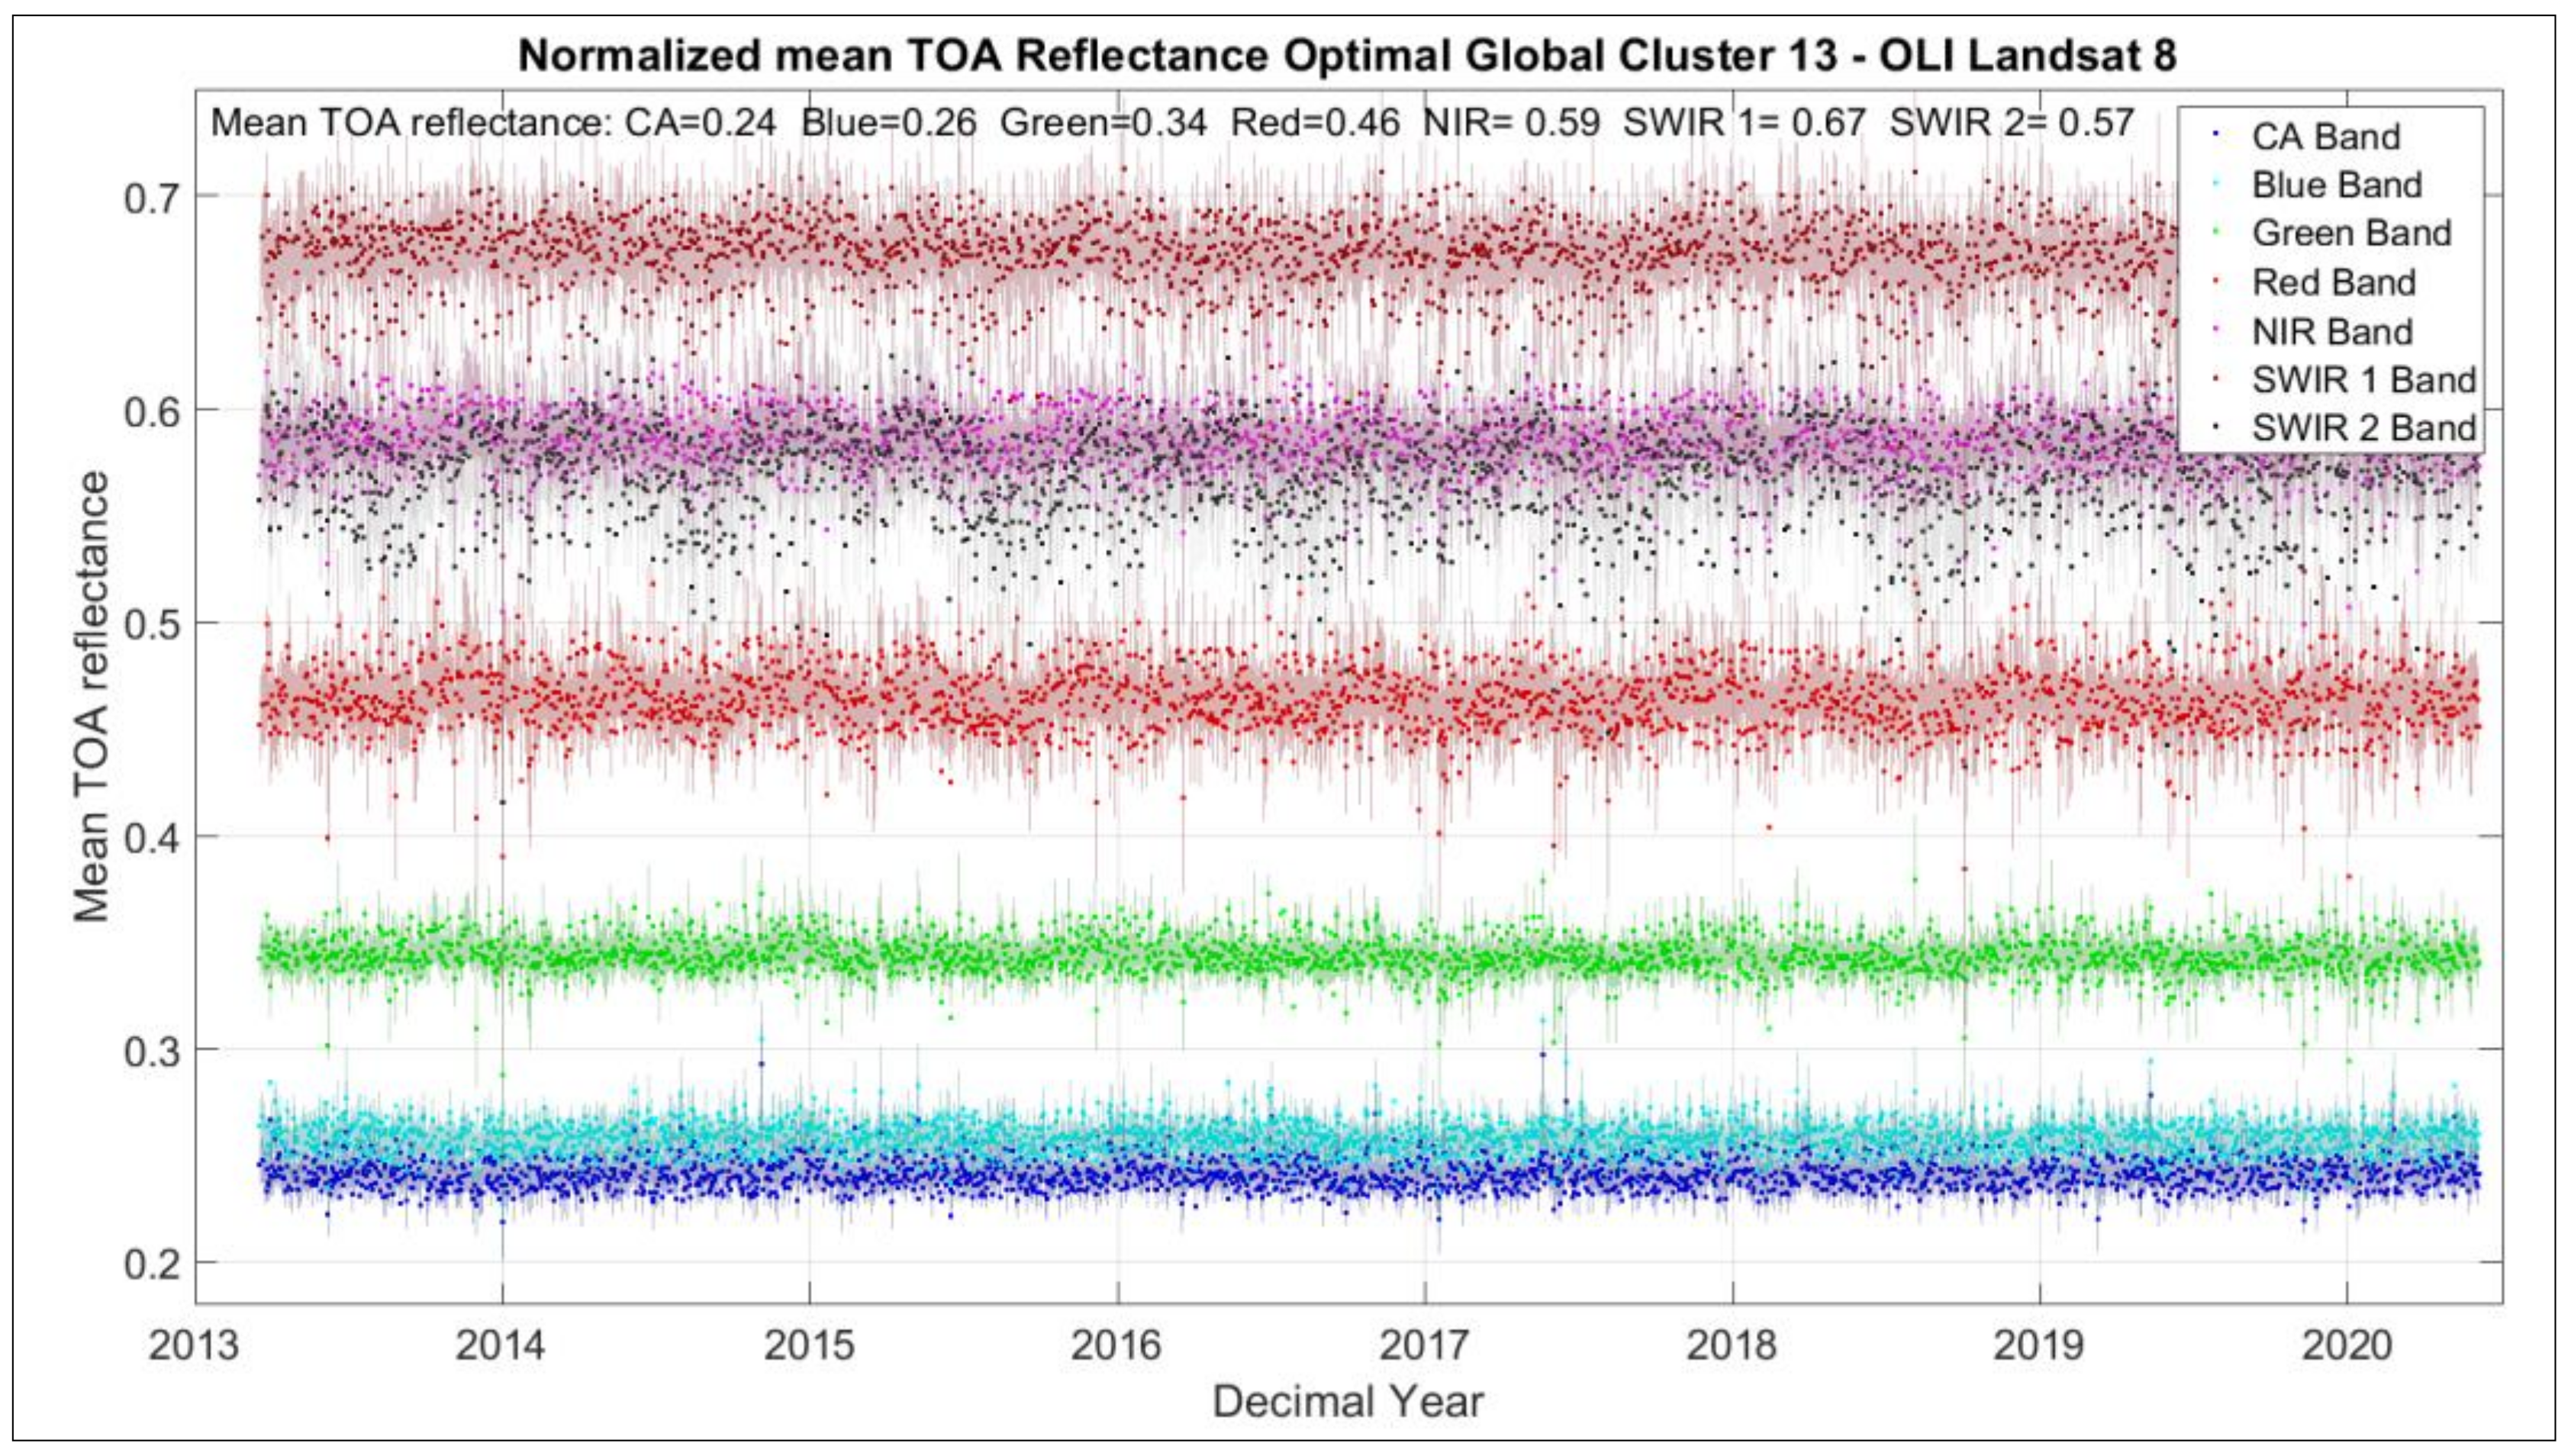
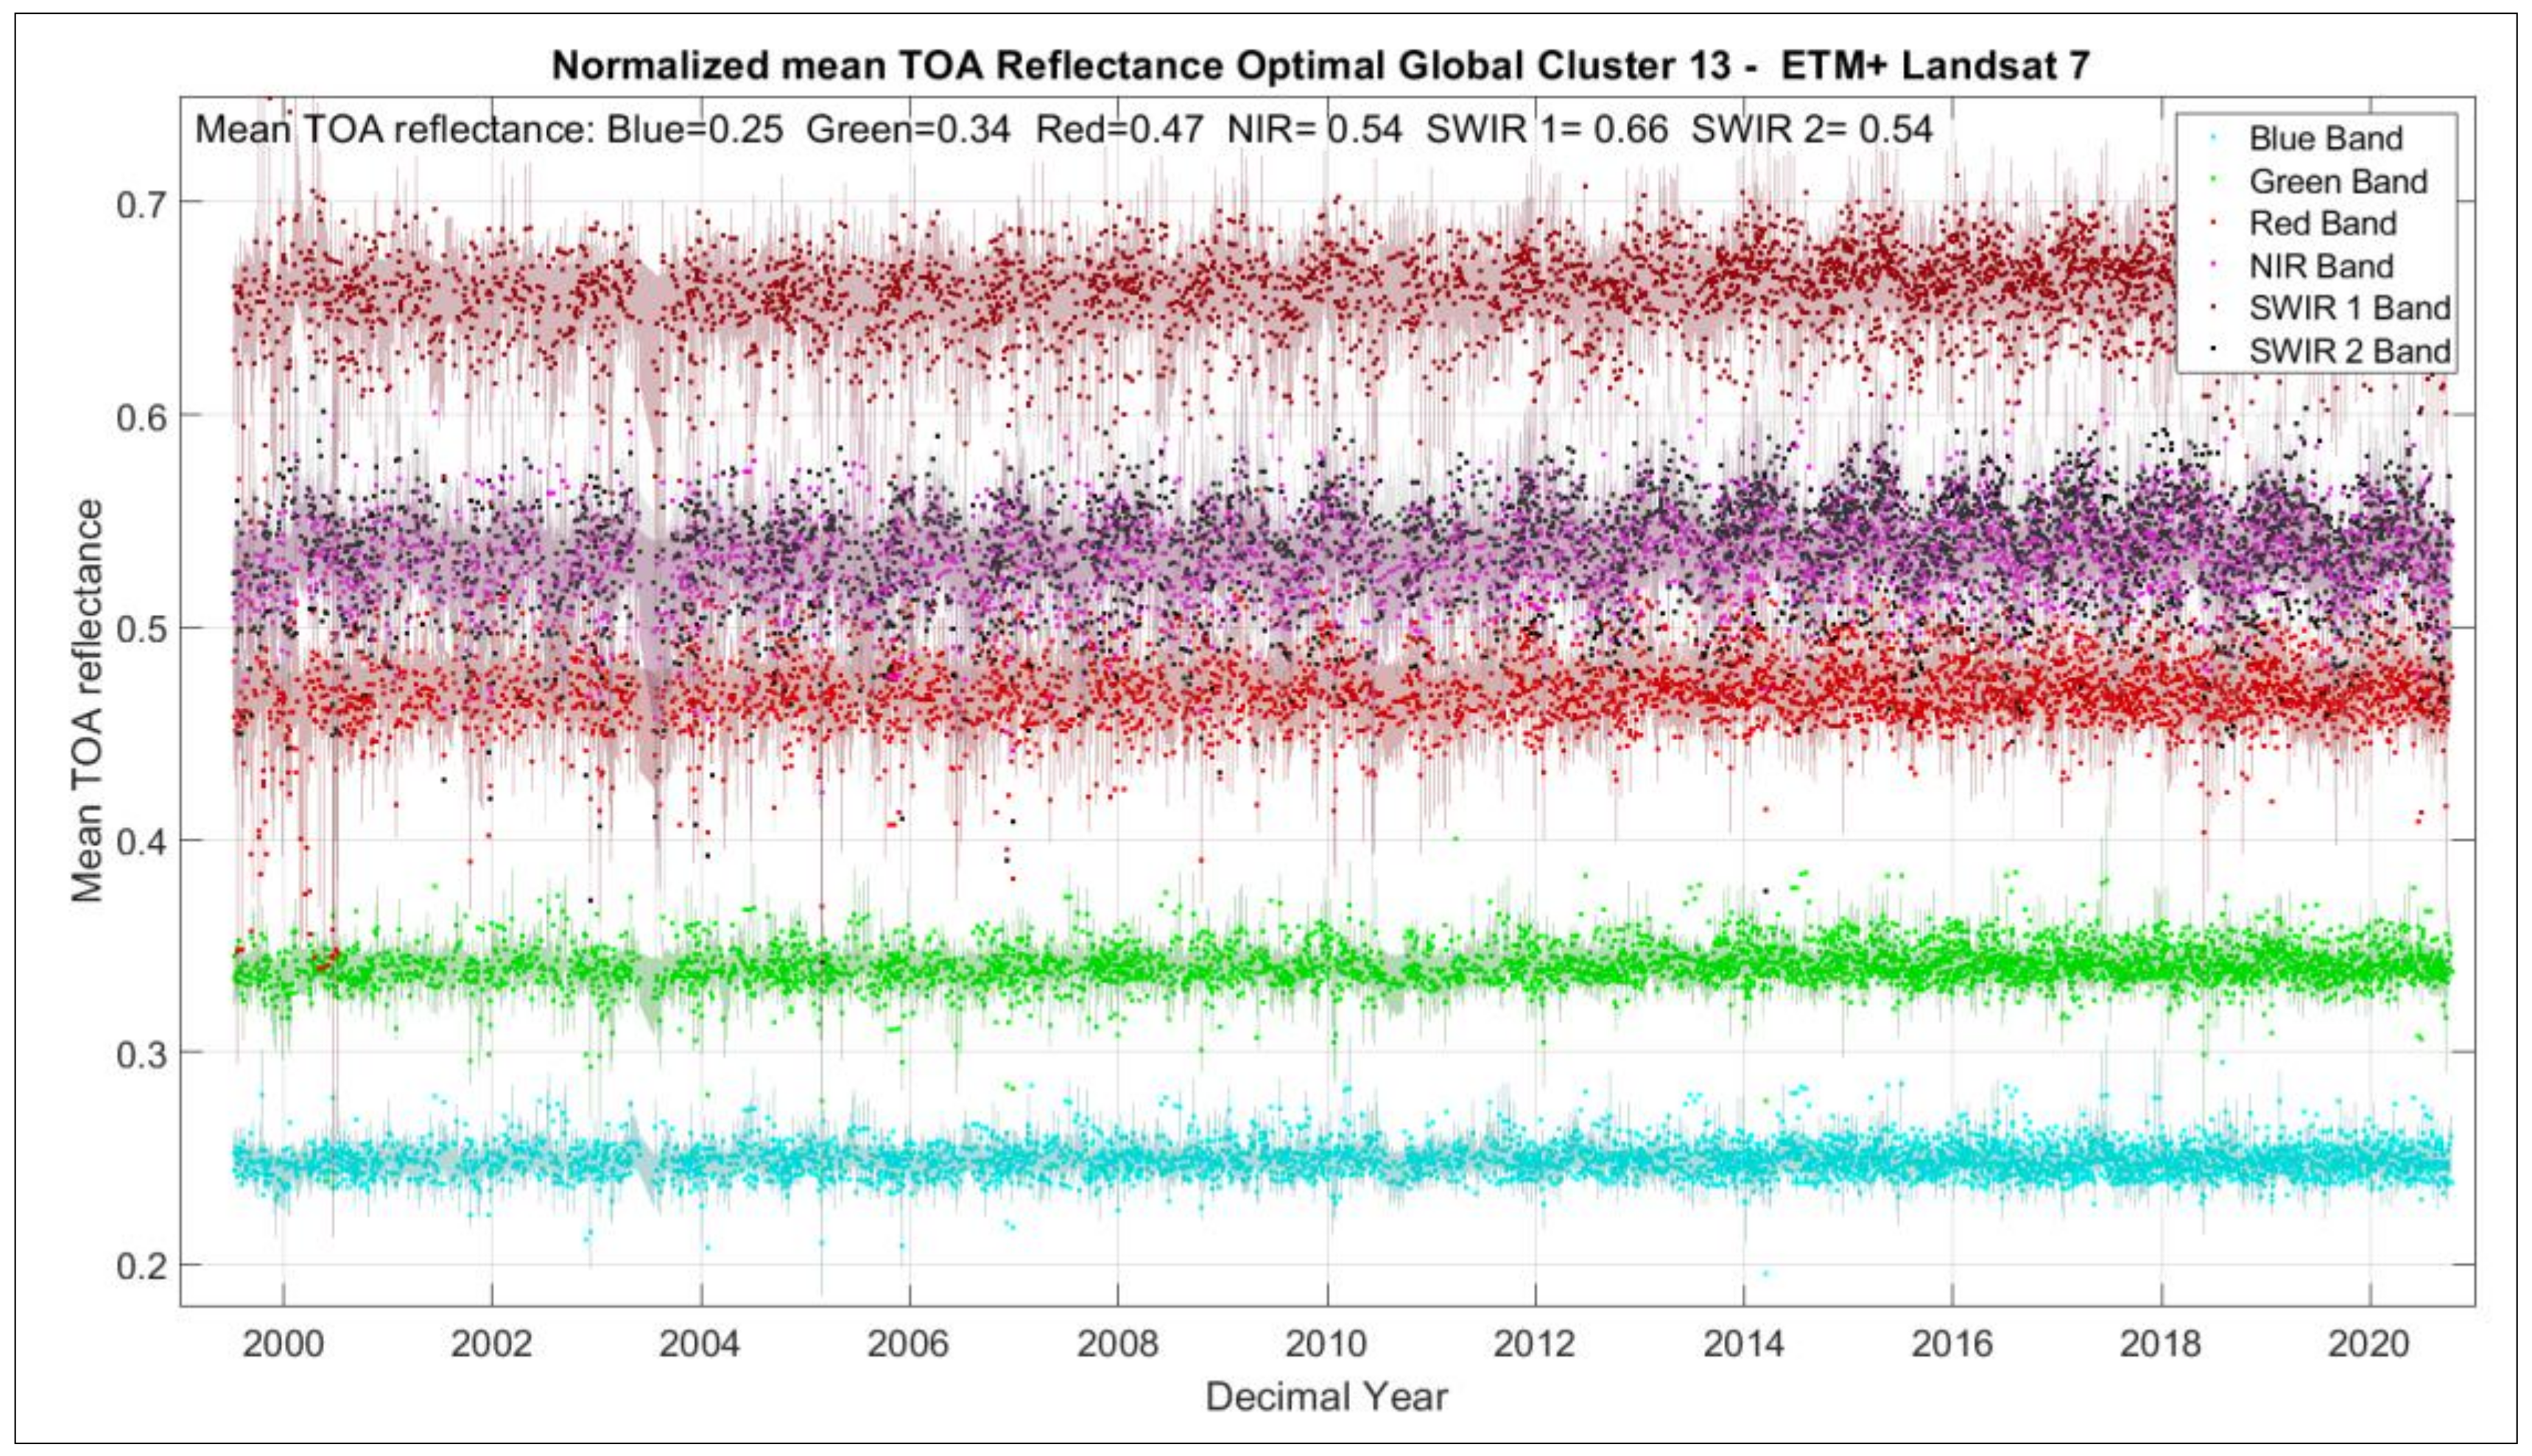
The temporal mean TOA reflectance over the OGC-13 for Landsat-8 and Landsat-7 is shown in Figure 12 and Figure 13, respectively, illustrating the large dataset that can be achieved using this technique. Table 3 shows the corresponding temporal mean, coefficient of variation (CV), and spatial variability of the GC13-O. For Landsat-8, this EPICS exhibited a CV ranging from 2.7% to 4.6%, and the spatial variability within the site was less than 7% across all bands. Table 4 shows that for Landsat-7, the CV ranged from 3.1% to 5.5%, and the average spatial variability within the site was less than 7% across all bands. Although the temporal and spatial variability is larger than a traditional PICS, it is important to remember that this is a pseudo-invariant calibration site on a global scale (23 locations across the globe). These results are very encouraging considering that, although this technique shows slightly higher uncertainties, it provides an incredibly large number of calibration points that allow for the faster determination of gain changes and drifts in the sensor response when compared to the traditional PICS approach, as is shown in Section 4. In addition, removing the dependency on a single site to be invariant reduces the impact of a single location determining a sensor’s performance.
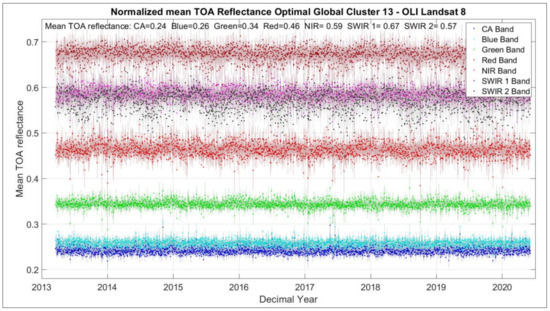
Figure 12.
TOA reflectance of Landsat-8 OLI over the GC13-O (23 WRS-2 path/rows(s)) as a function of time. Dots indicate observations; shading indicates uncertainty of each observation in the cluster (uncertainty estimated using Equation (8)).
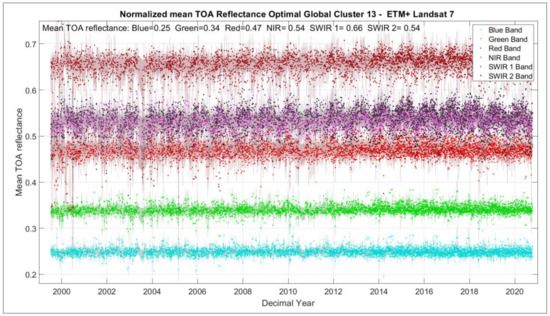
Figure 13.
TOA reflectance of Landsat-7 ETM+ over the GC13-O (23 WRS-2 path/rows(s)) as a function of time. Dots indicate observations; shading indicates uncertainty of each observation in the cluster (uncertainty estimated using Equation (8)).

Table 3.
GC13-O (23 WRS-2 paths/rows) temporal and spatial characteristics after BRDF normalization for Landsat-8 OLI.

Table 4.
GC13-O (23 WRS-2 paths/rows) temporal and spatial characteristics after BRDF normalization for Landsat-7 ETM+.
The total uncertainty for the GC13-O, including temporal Uncertainty (), BRDF uncertainty (), and spatial uncertainty (), is shown in Table 5 for Landsat-8 and Table 6 for Landsat-7. The total uncertainty across all bands for this global EPICS was less than 7% for Landsat-8. Moreover, for this sensor, the BRDF component is the element that contributes most to the uncertainty, showing less than 3% for the green and NIR bands, less than 3.3% for the coastal aerosol, blue, and SWIR 1 bands, and 4% and 5% for the red and SWIR 2 bands, respectively. In the case of Landsat-7, the BRDF uncertainty is also the largest contributor to the uncertainty, exhibiting less than 3% for blue and green bands, within 4% for the red, NIR, and SWIR 1 bands, and less than 5% for the SWIR 2 band. The temporal and spatial components showed an uncertainty less than 3.3% across all bands for Landsat-8. While the temporal and spatial components for Landsat-7 had an uncertainty of less than 3% for the blue, green, NIR, and SWIR bands, and less than 4% for the red and SWIR 2 bands.

Table 5.
Uncertainty of GC13-O (%), Landsat-8 OLI.

Table 6.
Uncertainty of GC13-O (%), Landsat-7 ETM+.
4. Validation
In this section, the new EPICS obtained in this study (GC13-O, containing 23 sites) is compared to the traditional and well-known Libya 4 CNES ROI. In addition, a comparison with the previous classification, where C13 was identified across North Africa, will be discussed. The comparison of BRDF normalized mean TOA reflectance of the temporal trend of these sites, as well as the coefficient of variation and spatial variability, are shown below.
4.1. Traditional PICS vs. GC13-O
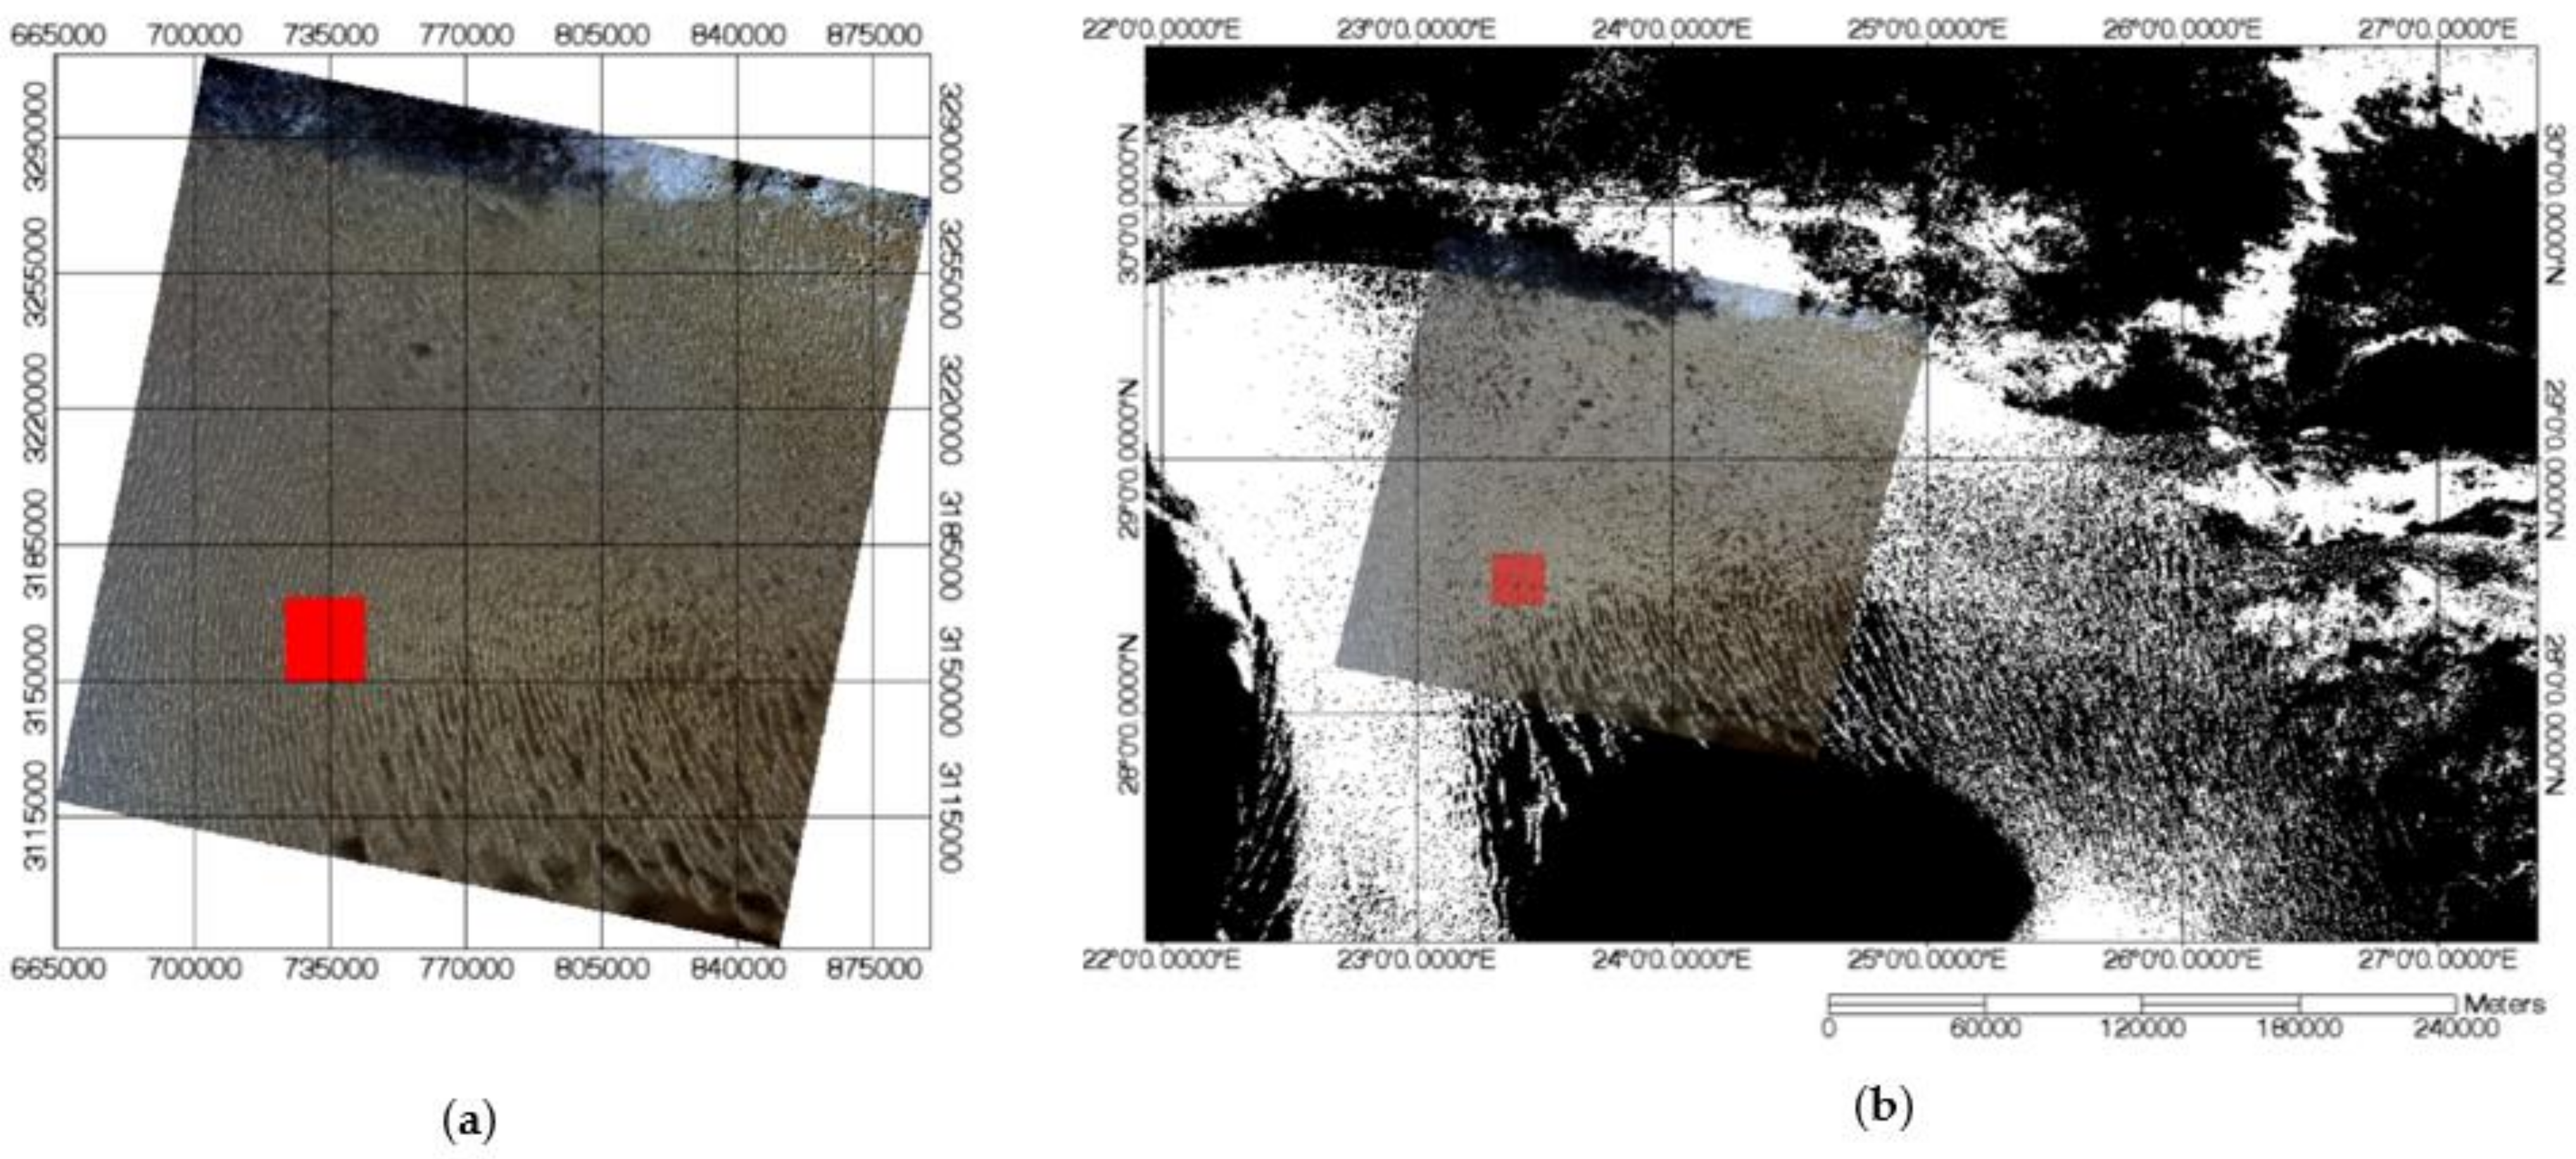
As mentioned earlier, there are six CEOS-recommended PICS locations in the Saharan desert called Libya 1 and 4, Mauritania 1 and 2, and Algeria 3 and 5 [6,7]. Libya 4 CNES ROI is one of the most common sites among the remote sensing community for the calibration and stability monitoring of optical satellite sensors. In order to validate if GC13-O can be considered an extended pseudo-invariant calibration site on a global scale, a comparison between Libya 4 CNES ROI and the GC13-O (23 WRS-2 path/row(s)) was performed. Figure 14 shows the Libya 4 CNES ROI, located in path 181/row 40 of the WRS-2 system, used to perform this comparison. Figure 14a shows Libya 4 CNES ROI (red square) over a Landsat-8 OLI image acquired in 2014. Figure 14b shows the Landsat-8 image and Libya 4 CNES ROI over the pixel distribution of GC13 for the area in study. It is evident that most of the pixels in the Libya 4 CNES ROI were identified in the classification process as part of Cluster 13.
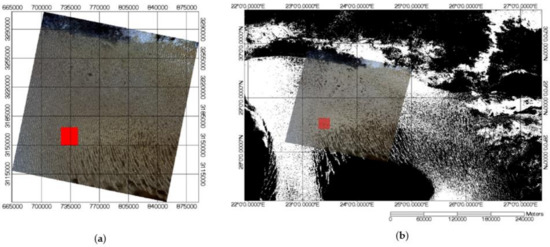
Figure 14.
(a) Libya 4 CNES ROI (red square) over a Landsat-8 image (Left); (b) image described on (a) over the GC13-O, where white areas represent the pixel distribution of GC13-O (Right).
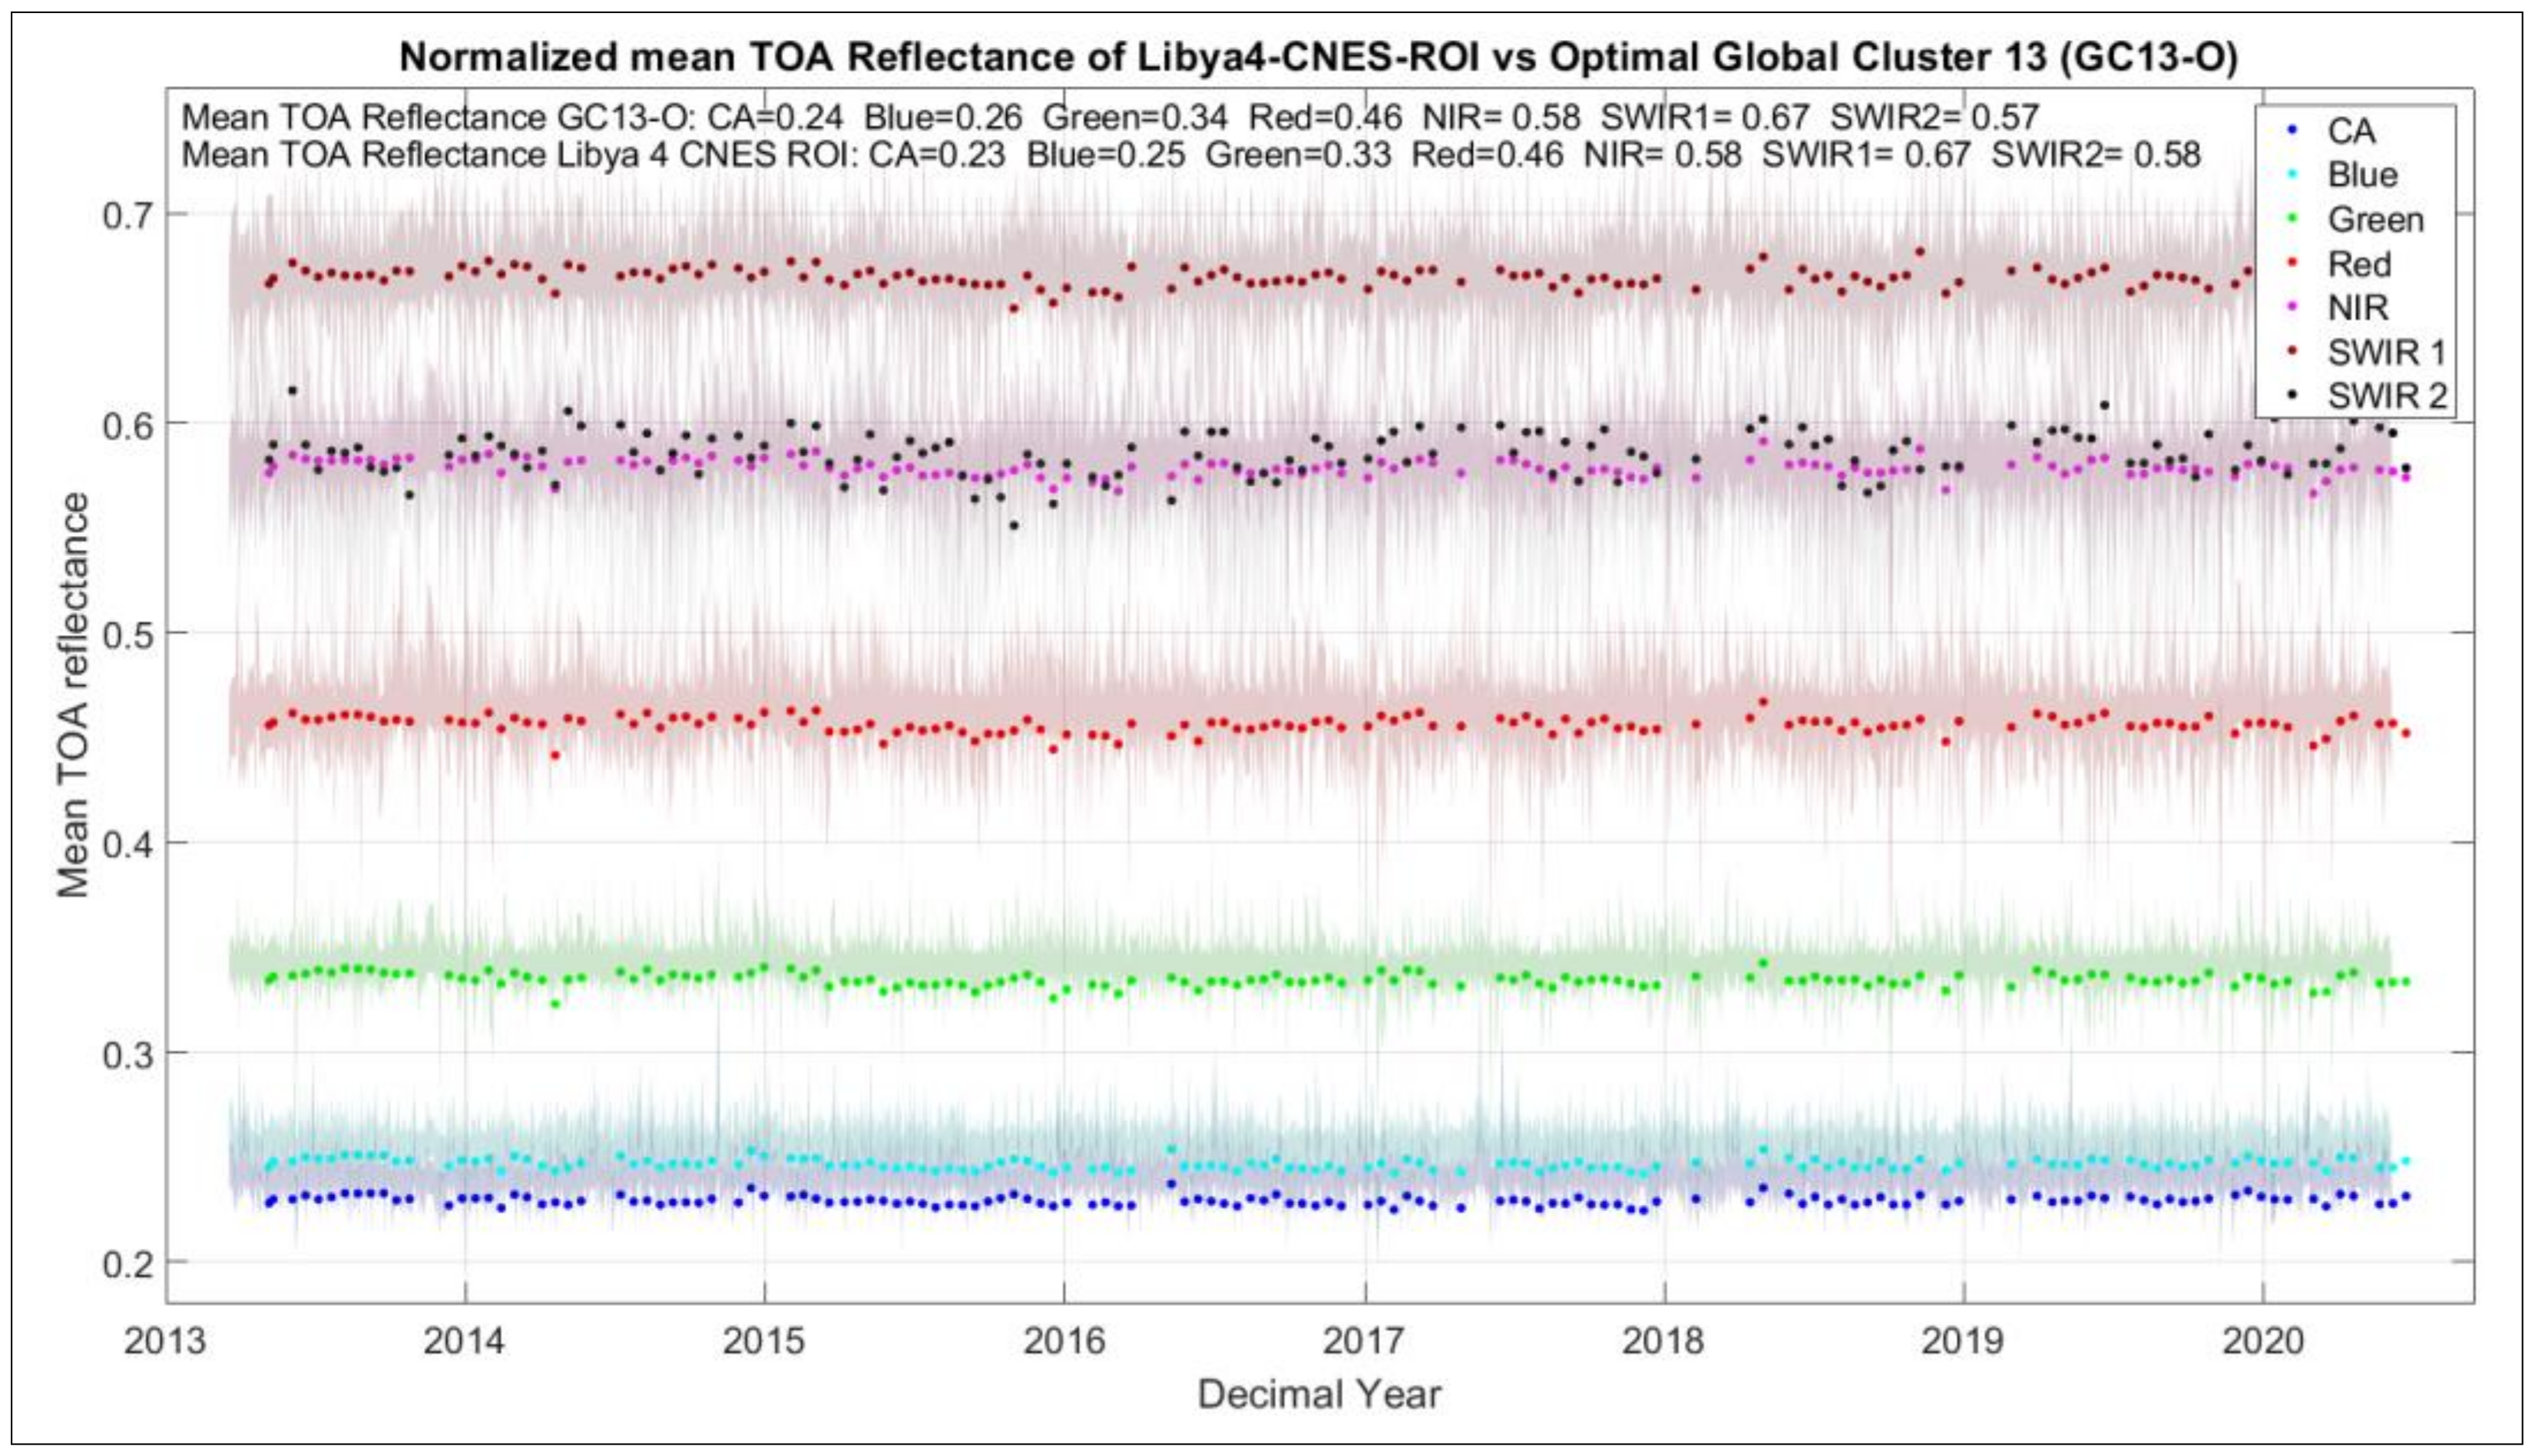
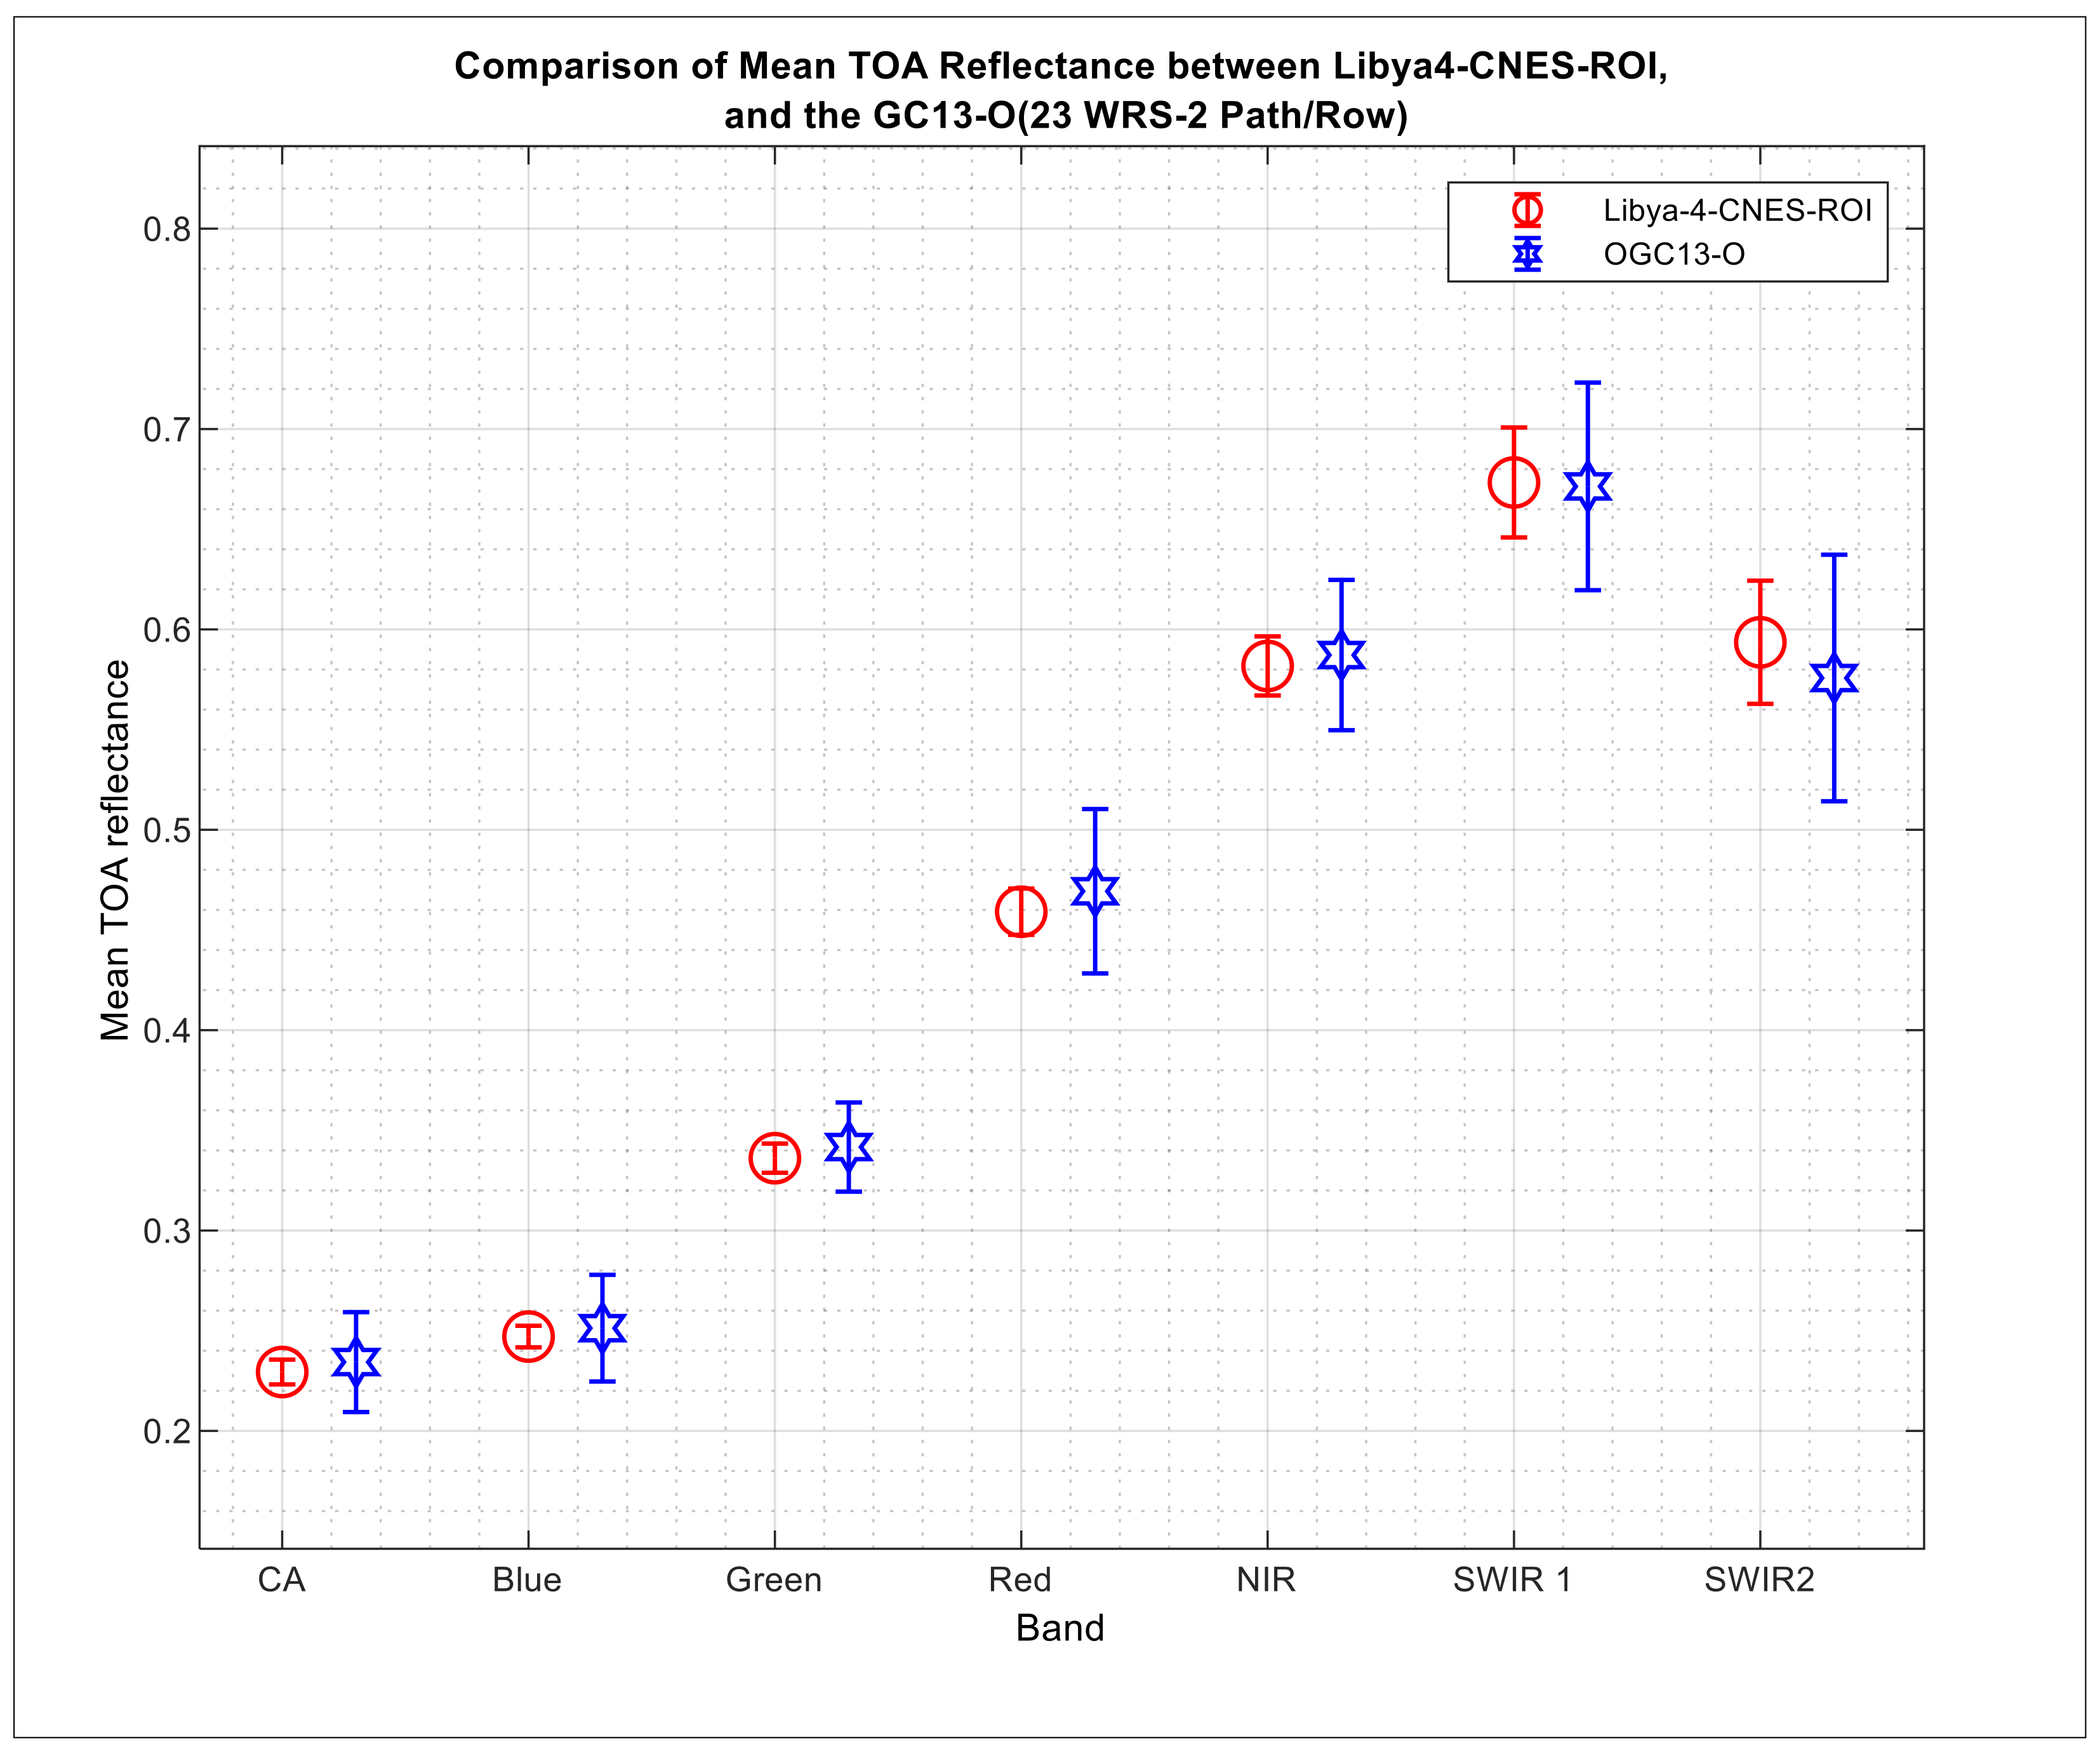
Figure 15 displays the TOA reflectance over the GC13-O (23 WRS-2 path/row(s)) vs. the Libya 4 CNES ROI after the BRDF normalization process. The shaded areas in the chart correspond to the BRDF normalized mean TOA reflectance of the GC13-O, including its uncertainty, and the markers (dots) correspond to the BRDF normalized temporal mean TOA reflectance of the Libya 4 CNES ROI. From this chart, it is clear that the temporal trend of Libya 4 CNES ROI lies within this new EPICS for all spectral bands, except for the coastal aerosol band. This indicates that the temporal trend of the GC13-O is similar in nature compared to the traditional approach, but with the advantage of having a significantly larger amount of data. The dense data sets achieved with the global EPICS provide an enormous benefit for the calibration and stability monitoring of optical satellite sensors, and for the possible detection of variations in the sensor’s response in a shorter period of time. Between the years 2013 and 2020, for the Libya 4 CNES ROI, 143 cloud-free acquisitions were obtained, giving an average imaging period of 18.4 days for this PICS. On the other hand, 2569 cloud-free observations were achieved for the GC13-O during the same timeframe, providing an average acquisition of 1.02 days, indicating a significant increase in the amount of data. Figure 16 shows a comparison between the mean TOA reflectance of the Libya 4 CNES ROI and the mean TOA reflectance of the GC13-O, with the error bar corresponding to each site’s temporal standard deviation (k = 2). As can be seen, for all spectral bands, the mean TOA reflectance of the Libya 4 CNES ROI was within the standard deviation of the Optimal GC13, demonstrating that they have similar characteristics.
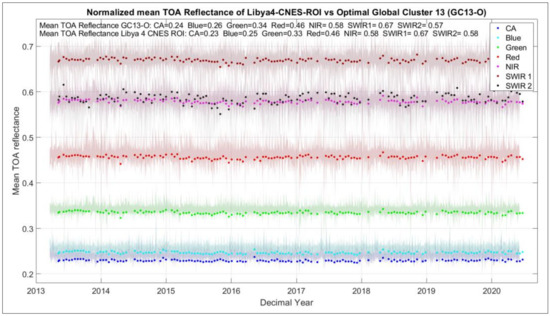
Figure 15.
TOA reflectance of Landsat-8 OLI over GC13-O (23 WRS-2 path/rows(s)) vs. TOA reflectance of Landsat-8 OLI over Libya 4 CNES ROI as a function of time. Dots indicate observations over Libya 4 CNES ROI; shading indicates observations over GC13-O, with corresponding uncertainty, from launch to August 2020.
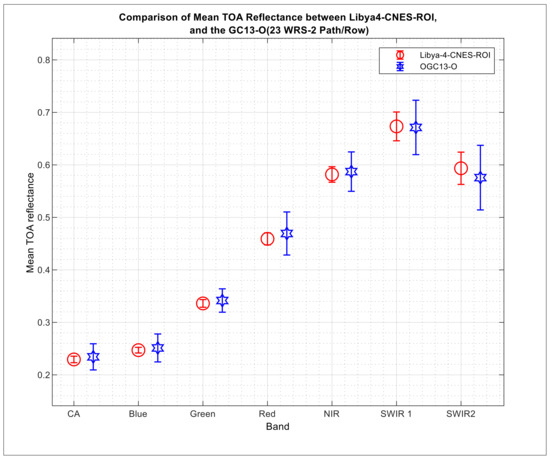
Figure 16.
Comparison of the mean TOA reflectance and temporal standard deviation between Libya 4 CNES ROI and GC13-O (23 WRS-2 path/row(s)). Error bar 2 sigma.
Table 7 shows the statistics for these two datasets containing the mean TOA reflectance, temporal coefficient of variation (CV), and average spatial variation within the site. The absolute percentage difference in the mean TOA reflectance between the Libya 4 CNES ROI and the GC13-O, using the Libya 4 CNES ROI as a reference, ranged between 0.1% and 4.1%, where smallest variation was present in the SWIR 1 band and the largest variation was for the coastal aerosol band. Furthermore, the absolute percentage difference between the coefficient of variation for the Libya 4 CNES ROI and the GC13-O, using the Libya 4 CNES ROI as a reference, ranged from 1.9 percent (green band) and 2.8% (SWIR 2 band). Likewise, the difference in the average spatial variation ranged between 0.21% (SWIR 1 band) and 3.42% (coastal aerosol band). Although there was a difference present in the spatial variability within the site, and CV between this expanded cluster and the Libya 4 CNES ROI, it is important to remember that the GC13-O is composed of multiple sites at various locations across the globe, and thus the “n” number of observations is an order of magnitude larger. Thus, even with this higher uncertainty, the much greater data density (2569 cloud-free observations for the GC13-O vs. 143 cloud-free acquisitions for the Libya 4 CNES ROI) allows for the quicker determination of change in a sensor’s performance on both short (abrupt change) and longer (drift) time scales.

Table 7.
Comparison between GC13-O and Libya 4 temporal and spatial characteristics with BRDF normalization.
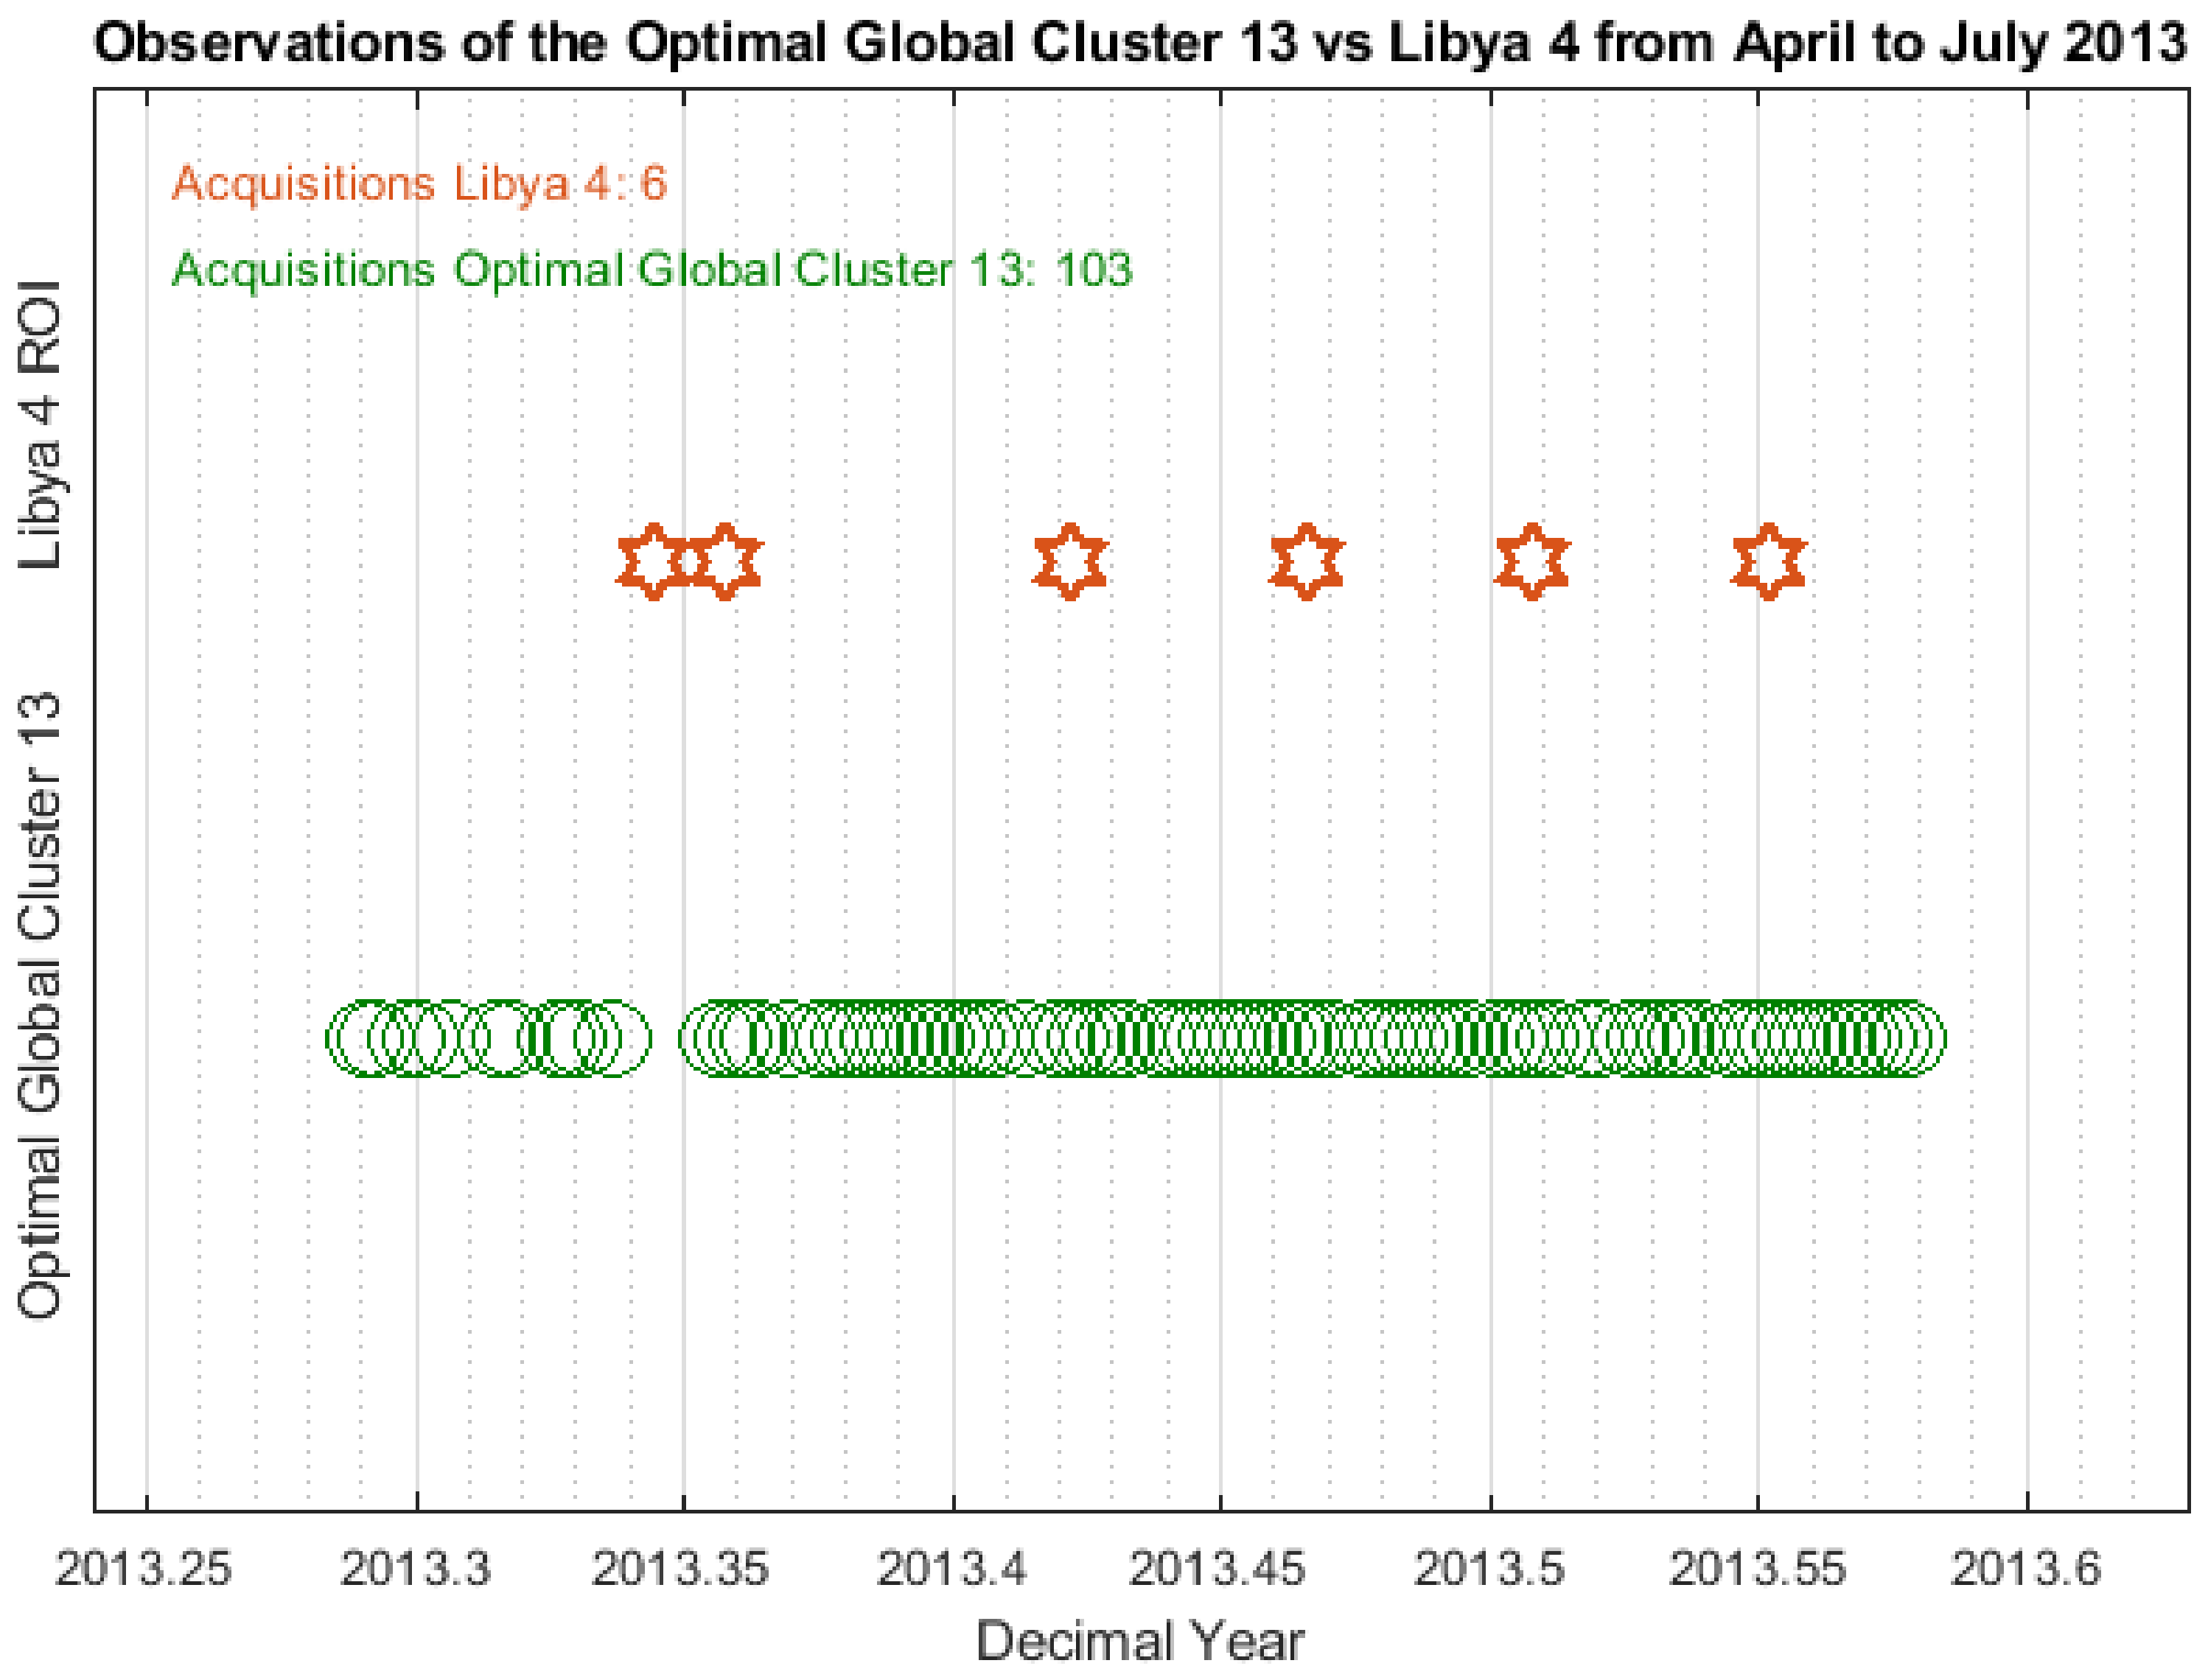
Figure 17 shows the number of observations achieved for the initial stages of the Landsat-8 OLI (mid-April 2013 to July 2013) over the Libya 4 CNES ROI, as well as for the GC13-O. In order to assess and genuinely understand the behavior of the sensor’s radiometric performance after launch, the first months of operation are crucial. According to what was reported at CALCON 2013 [18], from the period of time mentioned above (mid-April 2013 to July 2013) six observations over Libya 4 were achieved and used to evaluate the radiometric performance of the OLI. The red stars in Figure 17 show that a small dataset was obtained using traditional PICS for that time frame. On the other hand, for the GC13-O, 103 observations (green markers) were accomplished for the same period of time, obtaining a much denser dataset that could allow for the understanding of the sensor’s performance in those initial stages, and possibly detect changes in trends in a much faster way.
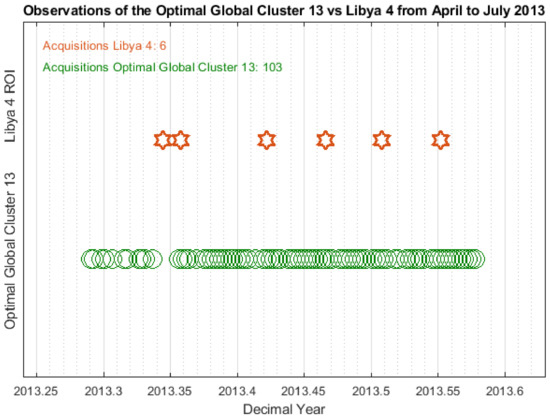
Figure 17.
Comparison in the number of observations acquired over the Libya 4 CNES ROI and the GC13-O for the initial stages of the OLI Landsat-8.
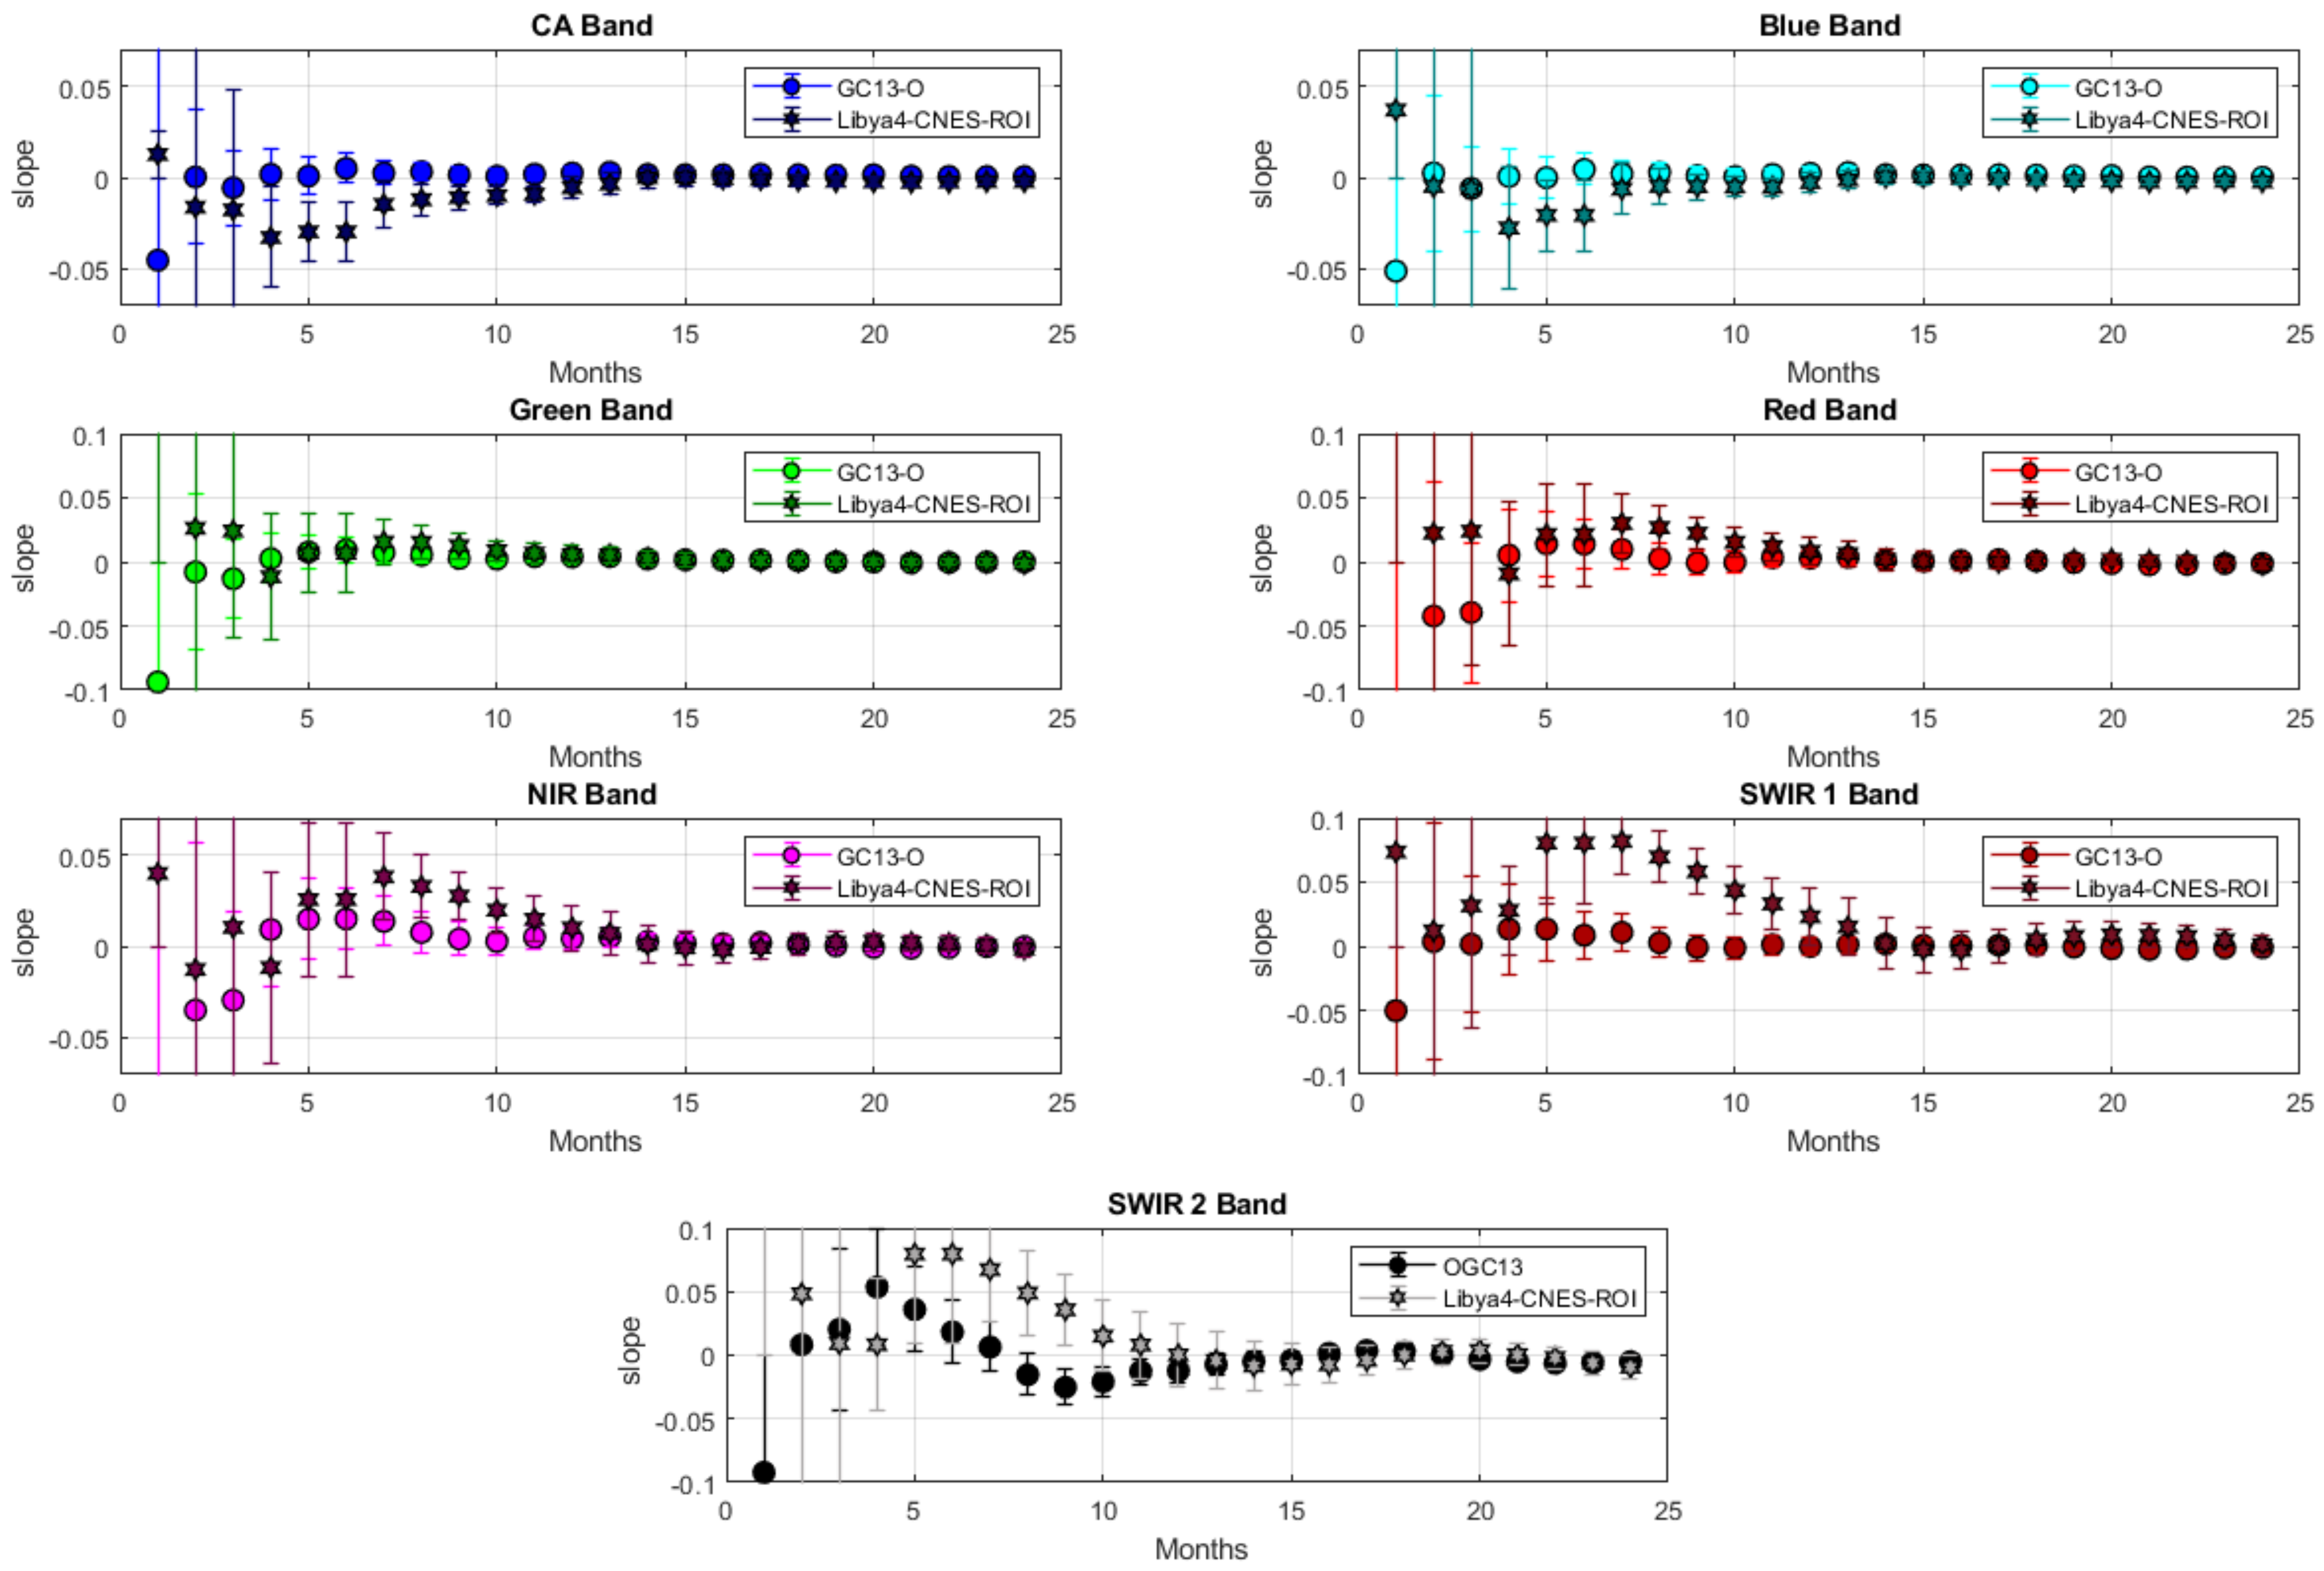
An example of detecting drifts on a short time period can be seen in Figure 18, which shows the slope estimation for the Libya 4 CNES ROI vs. the GC13-O. The slopes were calculated by adding data points one month at a time over the course of two years of operation (January 2014 to December 2015) using Landsat-8 OLI data. Assuming there was no change in the Libya 4 site, both methods should converge to zero. It is possible to see that both sites reached this result after using two years of data. However, the GC13-O reached a stable estimate much faster than the Libya 4 CNES ROI. Using the GC13-O data, the detection of the slope in the coastal aerosol, blue, green, and SWIR 1 bands reached this estimate after only three months’ worth of observations. Similarly, the red and NIR bands stabilized in about 7 months, and the SWIR 2 band in about 10 months. Libya 4, on the other hand, required about 15 months of data to achieve the same level of stability that the GC13-O achieved. Furthermore, due to the large amount of data provided by the GC13-O for regression estimation, the confidence intervals for the slope (error bars), obtained using the GC13-O data, are smaller. Moreover, this technique eliminatesd the dependency of a single site to be invariant. If there is a change in the sensor’s response over the GC13-O, it is less likely that all 23 sites will be changing at the same time at the same rate, as opposed to traditional PICS, where changes in the sensor’s response might be due to changes in the target.
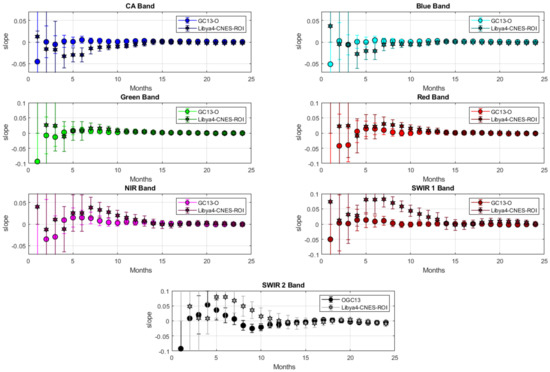
Figure 18.
Comparison of slopes detected using Libya 4 CNES ROI and GC13-O from January 2014 to December 2015 by adding data one month at a time.
This technique represents a considerable advantage in evaluating the radiometric performance of sensors in their initial stages of operation. Moreover, this global EPICS is not only useful for satellites, such as Landsat, with lifetimes over five years [19], but also for low-cost satellites with shorter lifetimes of months or a few years, where time periods of traditional PICS might not offer enough data to provide a high confidence assessment of change in performance. This technique can also be useful for satellites that do not image traditional PICS continuously. In addition, many of these satellites lack onboard calibrators, for which this new technique would provide a great advantage when it comes to evaluating their radiometric performance daily. Considering that, when using global EPICS, dense datasets can be achieved in a short time frame, and it is possible to assess the response of the sensors onboard these satellites in a much faster way, not only in the crucial initial collections after launch, but throughout their lifetime, allowing for the faster detection of anomalies in the sensor’s response and correcting them accordingly.
4.2. Comparison between C13 and GC13-O
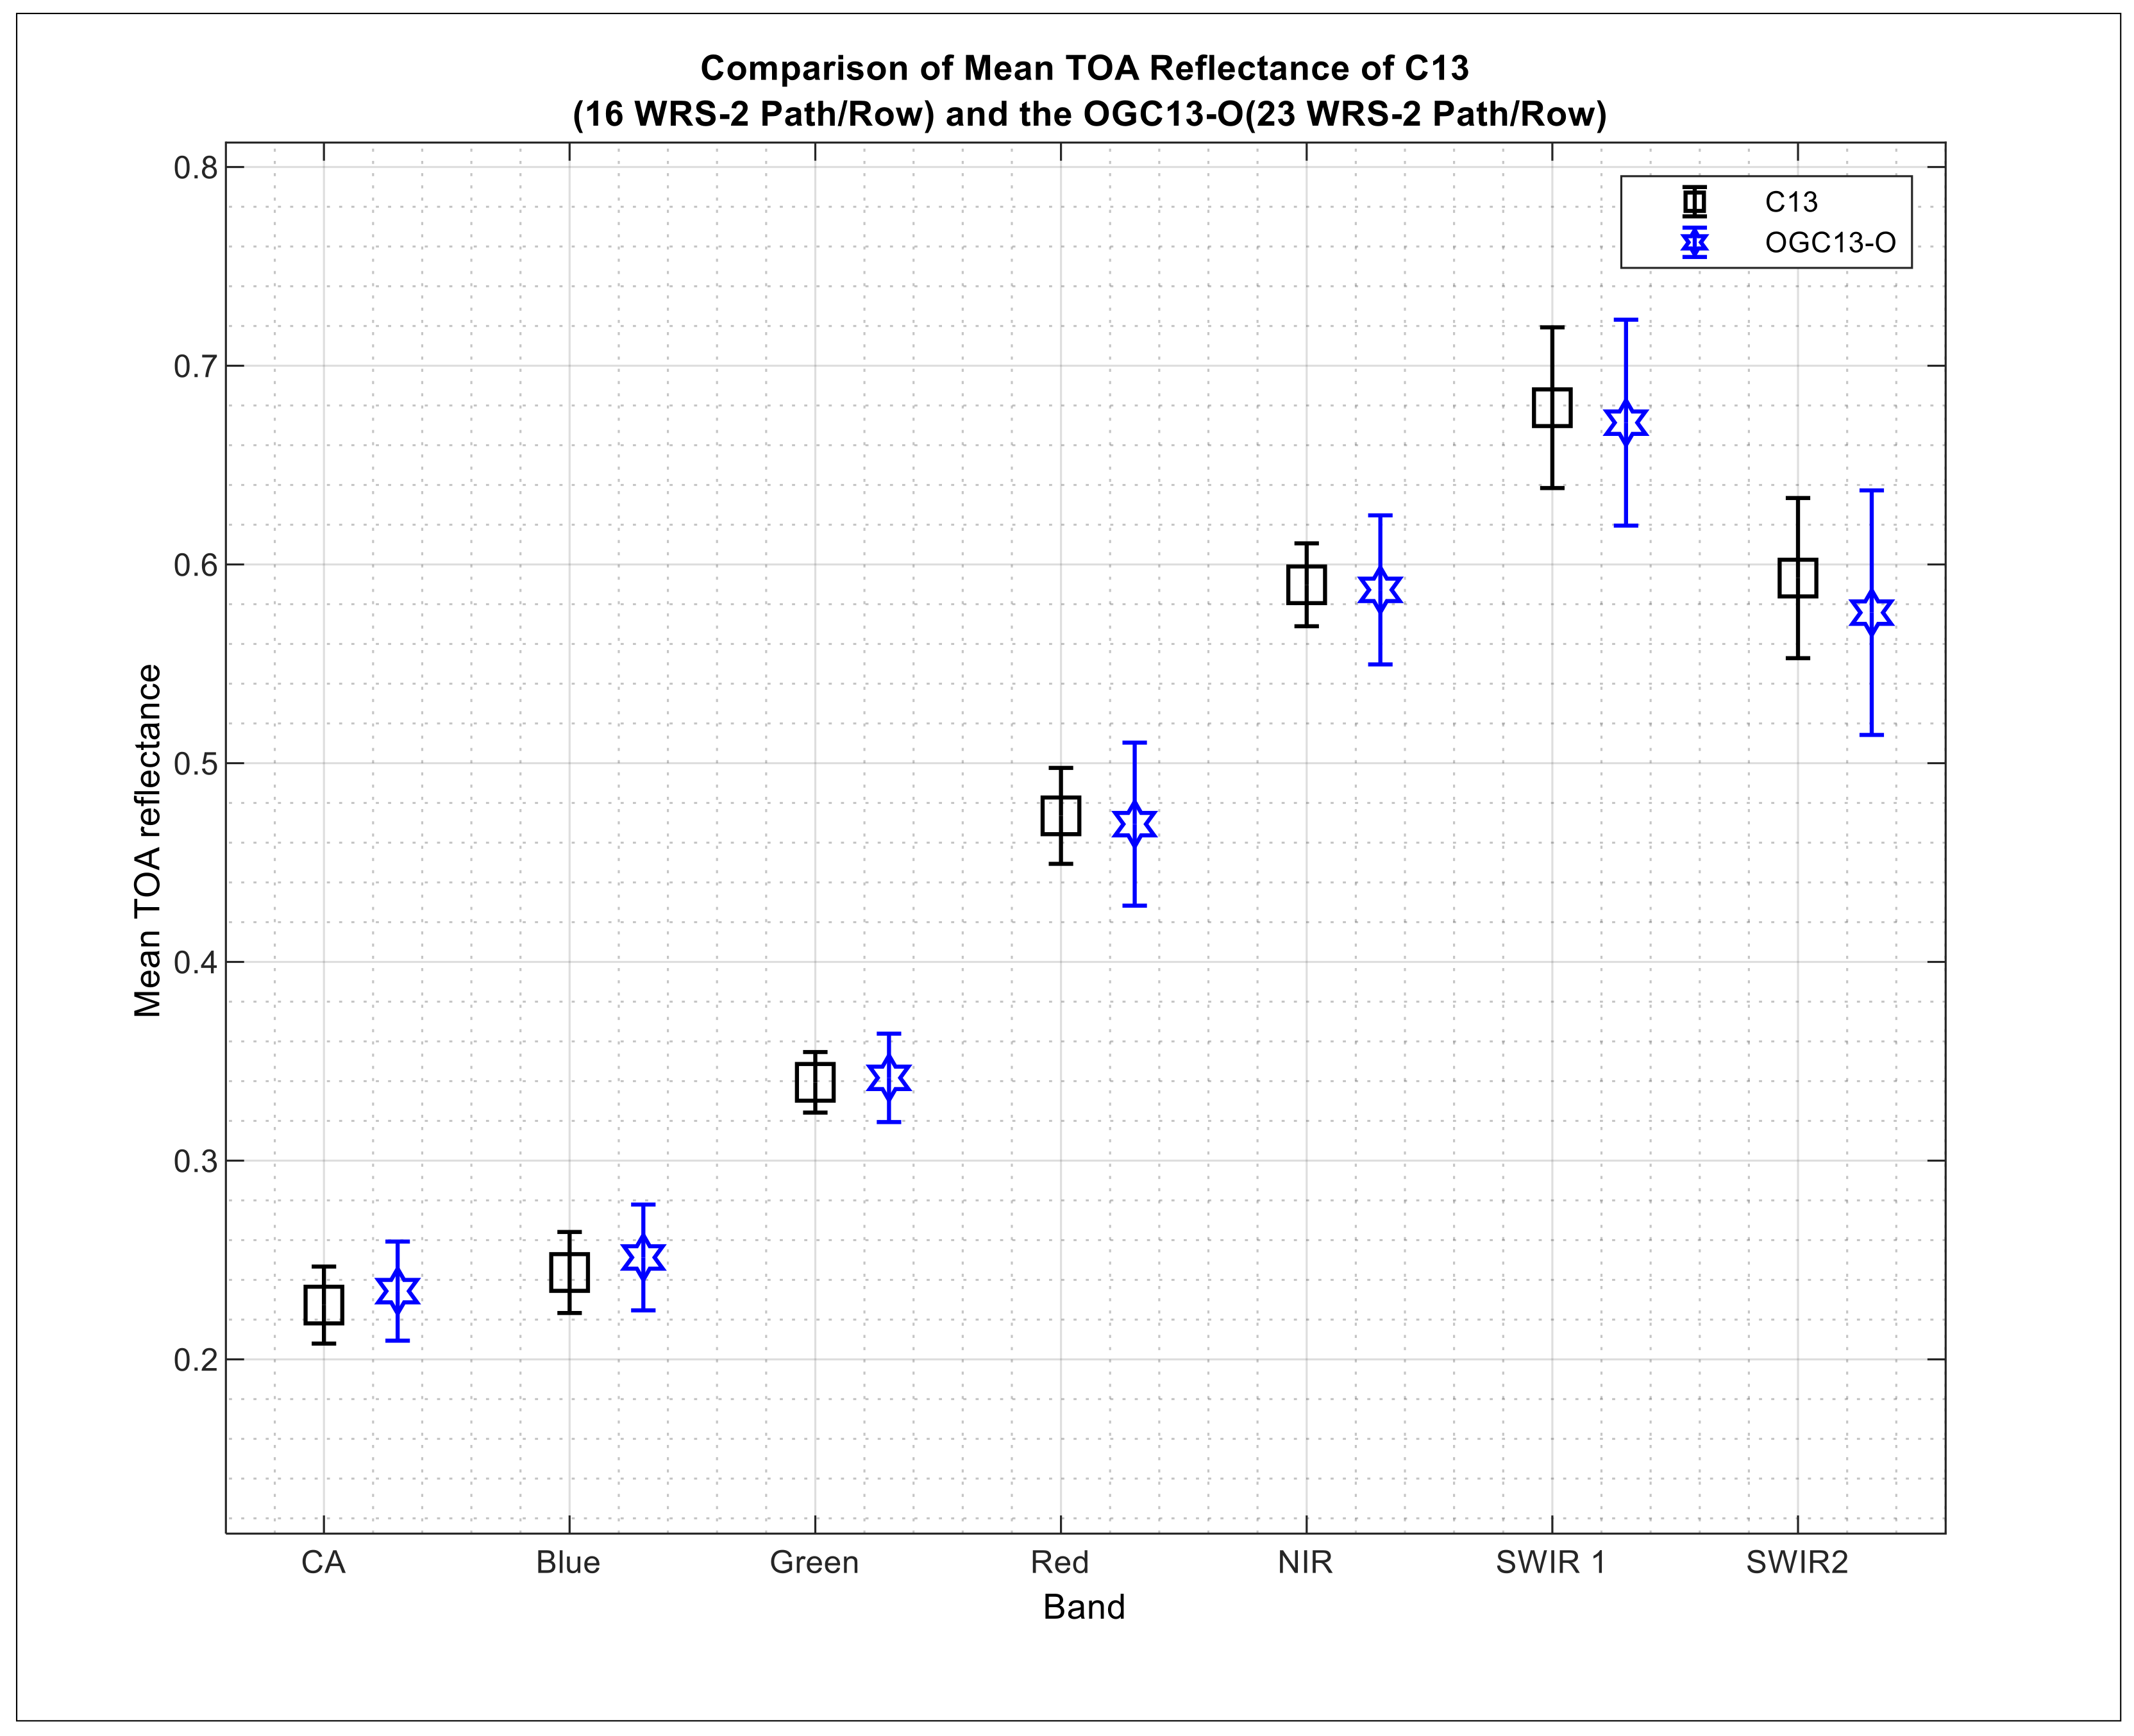
A comparison between C13 and the globally expanded Cluster 13 is discussed in this section. A total of 1871 observations were achieved over C13 using Landsat-8 OLI data from its launch until August 2020. For the same time frame, 2569 cloud-free measurements were acquired for the Optimal GC13. The imaging period for Landsat-8 using the Global Cluster was reduced from 1.4 to 1.02 days on average relative to C13. This helped to obtain a considerably larger dataset in an even shorter period of time, and further reduced one site’s impact, in addition to providing multiple acquisitions across the globe every day of the Landsat acquisition cycle. Figure 19 shows a comparison between the mean TOA reflectance of C13 and the GC13-O for all spectral bands. The mean TOA reflectance of both locations are side by side, and the error bars represent the standard deviation (k = 2) of each site’s temporal trend, indicating that the GC13-O is statistically the same as C13. Statistics for those sites are shown in Table 8. Absolute percentage difference in the temporal mean TOA reflectance between the GC13-O and C13 ranges between 0.29% (green band) and 5.6% (SWIR 2 band). Likewise, the absolute percentage difference in the coefficient of variation and the average spatial variation between sites ranges from 0.06% (blue band) to 1.5% (red Band) and 1.17% (SWIR 1 Band) to 1.95% (blue Band), respectively. Although there is a slight increase in the temporal coefficient of variation as well as in the spatial variability, this increase might be expected considering that seven additional locations are part of the Optimal GC13, moving from a continental scale to a global scale. Despite this increase, GC13-O exhibit similar results to C13, but with the advantage of having a higher imaging frequency, allowing a richer dataset in a shorter period of time.
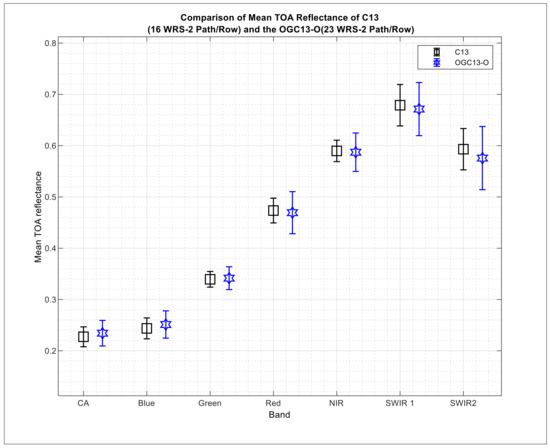
Figure 19.
Comparison of the mean TOA reflectance and standard deviation between C13 and GC13-O (23 WRS-2 path/row(s)). Error bar 2 sigma.

Table 8.
Comparison between GC13-O and C13 temporal and spatial characteristics with BRDF normalization (calculated using 1 sigma).
5. Conclusions
This work identified and demonstrated the potential of a global EPICS to perform calibration and stability monitoring of on-orbit optical sensors. In this analysis, using an unsupervised classification, pixels across the world with similar spectral and temporal characteristics were found in North America, North Africa, Central Africa, and the Middle East. After evaluating the TOA reflectance of each site identified in this work, 23 optimal WRS-2 path/rows, creating an Optimal Global Cluster 13 (GC13-O), were selected as a global EPICS. Using this global cluster, two observations for days 3, 4, 7, 8, 12, 14, and 16 of the Landsat acquisition cycle were obtained, providing the possibility of building a richer, more temporally dense calibration dataset in a much shorter period of time. This, in turn, allows for the potential to more quickly detect changes in the sensor’s response due to drift or to abrupt changes in the sensor’s performance. Since 23 sites are used worldwide, rather than a single target, it is possible to be certain that changes in sensor response were produced by the sensor, rather than the ground target.
In this work, a comparison between this new global EPICS and the traditional Libya-4 CNES ROI was performed. Results showed that the global EPICS is statistically the same as Libya 4, with differences in the coefficient of variation between these sites of less than 3% across all bands. Uncertainty estimations shown in this work may be reduced by increasing the number of clusters in the clustering k-means algorithm, but further analysis is in process.
This global EPICS provided the advantage of reaching a stable estimation of slope more quickly. For Landsat-8, it took only three months of observations to detect any drift for the coastal aerosol, blue, green, and SWIR 1 bands, seven months for the red and NIR bands, and 10 months for the nosier (due to water vapor sensitivity) SWIR 2 band. The Libya 4 traditional PICS took approximately 15 months of observations for all spectral bands. This shows that the global EPICS can be key for the assessment of the radiometric calibration of sensors in the initial stages of their lifetime, or satellites lacking on board calibrators, since it provides significantly more cloud-free observations compared to using singular sites. In addition, dependency on a single site to be invariant is removed when using this technique. If the sensor’s response changes over the GC13-O, it is more likely that the changes are due to the sensor rather than the target, since all 23 sites are unlikely to change at the same time.
Even though this work focused on Landsat satellites, the technique could be used to monitor the radiometric calibration of any satellite that has the capability to image any portion of this global EPICS.
Author Contributions
Conceptualization, J.F.R. and L.L.; formal analysis, J.F.R., L.L., C.T.P., M.K. and D.H.; methodology, J.F.R. and L.L.; software, J.F.R.; validation, J.F.R.; writing—original draft, J.F.R.; writing—review and editing, L.L. and D.H. All authors have read and agreed to the published version of the manuscript.
Funding
USGS EROS (grant number G19AS00001).
Data Availability Statement
Landsat-8 image courtesy of the U.S. Geological Survey; Landsat-7 image courtesy of the U.S. Geological Survey.
Acknowledgments
The authors would like to thank Larry Leigh for his guidance and help in the development of this project, and all other members of the Image Processing Laboratory for their support.
Conflicts of Interest
The authors declare no conflict of interest.
References
- Shrestha, M.; Leigh, L.; Helder, D. Classification of North Africa for Use as an Extended Pseudo Invariant Calibration Sites (EPICS) for Radiometric Calibration and Stability Monitoring of Optical Satellite Sensors. Remote. Sens. 2019, 11, 875. [Google Scholar] [CrossRef] [Green Version]
- Thorne, K.; Markharn, B.; Barker, P.S.; Biggar, S. Radiometric calibration of Landsat. Photogramm. Eng. Remote. Sens. 1997, 63, 853–858. [Google Scholar]
- Markham, B.; Barsi, J.; Kvaran, G.; Ong, L.; Kaita, E.; Biggar, S.; Czapla-Myers, J.; Mishra, N.; Helder, D. Landsat-8 operational land imager radiometric calibration and stability. Remote. Sens. 2014, 6, 12275–12308. [Google Scholar] [CrossRef] [Green Version]
- Shrestha, M.; Hasan, N.; Leigh, L.; Helder, D. Derivation of Hyperspectral Profile of Extended Pseudo Invariant Calibration Sites (EPICS) for Use in Sensor Calibration. Remote. Sens. 2019, 11, 2279. [Google Scholar] [CrossRef] [Green Version]
- Helder, D.L.; Basnet, B.; Morstad, D.L. Optimized identification of worldwide radiometric pseudo-invariant calibration sites. Can. J. Remote. Sens. 2010, 36, 527–539. [Google Scholar] [CrossRef]
- Bouvet, M. Radiometric comparison of multispectral imagers over a pseudo-invariant calibration site using a reference radiometric model. Remote. Sens. Environ. 2014, 140, 141–154. [Google Scholar] [CrossRef]
- Teillet, P.; Chander, G. Terrestrial reference standard sites for postlaunch sensor calibration. Can. J. Remote. Sens. 2010, 36, 437–450. [Google Scholar] [CrossRef]
- Vuppula, H. Normalization of Pseudo-Invariant Calibration Sites for Increasing the Temporal Resolution and Long-Term Trending; South Dakota State University: Brookings, SD, USA, 2017. [Google Scholar]
- Cosnefroy, H.; Leroy, M.; Briottet, X. Selection and characterization of Saharan and Arabian desert sites for the calibration of optical satellite sensors. Remote. Sens. Environ. 1996, 58, 101–114. [Google Scholar] [CrossRef]
- Hasan, M.N.; Shrestha, M.; Leigh, L.; Helder, D. Evaluation of an Extended PICS (EPICS) for Calibration and Stability Monitoring of Optical Satellite Sensors. Remote. Sens. 2019, 11, 1755. [Google Scholar] [CrossRef] [Green Version]
- Gorelick, N.; Hancher, M.; Dixon, M.; Ilyushchenko, S.; Thau, D.; Moore, R. Google Earth Engine: Planetary-scale geospatial analysis for everyone. Remote. Sens. Environ. 2017, 202, 18–27. [Google Scholar] [CrossRef]
- Mishra, N.; Haque, M.O.; Leigh, L.; Aaron, D.; Helder, D.; Markham, B. Radiometric cross calibration of Landsat 8 operational land imager (OLI) and Landsat 7 enhanced thematic mapper plus (ETM+). Remote. Sens. 2014, 6, 12619–12638. [Google Scholar] [CrossRef] [Green Version]
- Warmerdam, F. GDAL/OGR API Documentation. 2005–2008. GDAL/OGR Website. Available online: http://www.gdal.org/ (accessed on 24 March 2020).
- Survey, U.S.G. Landsat Missions. Available online: https://www.usgs.gov/core-science-systems/nli/landsat/using-usgs-landsat-level-1-data-product (accessed on 10 January 2020).
- Shrestha, M. Bidirectional Distribution Reflection Function of Algodones Dunes; South Dakota State University: Brookings, SD, USA, 2016. [Google Scholar]
- Kaewmanee, M. Pseudo Invariant Calibration Sites: PICS Evolution; South Dakota State University: Brookings, SD, USA, 2018. [Google Scholar]
- United States Geological Survey. Landsat Acquisition Tool. Available online: https://landsat.usgs.gov/landsat_acq (accessed on 2 February 2020).
- South Dakota State University; Nasa Goddard Space Flight Center; USGS EROS; University of Arizona. In Proceedings of the Landsat 8 OLI On Orbit Spatial Uniformity, Absolute Calibration and Stability, Conference on Characterization and Radiometric Calibration for Remote Sensing, 19 – 22 August 2013; Utah State University: Logan, UT, USA, 2013.
- Landsat 8 Satellite Safty. Available online: https://satellitesafety.gsfc.nasa.gov/landsat8.html (accessed on 25 February 2020).
Publisher’s Note: MDPI stays neutral with regard to jurisdictional claims in published maps and institutional affiliations. |
© 2021 by the authors. Licensee MDPI, Basel, Switzerland. This article is an open access article distributed under the terms and conditions of the Creative Commons Attribution (CC BY) license (https://creativecommons.org/licenses/by/4.0/).

