Abstract
Satellite altimetry observations have provided a significant contribution to the understanding of global sea surface processes, particularly allowing for advances in the accuracy of ocean tide estimations. Currently, almost three decades of satellite altimetry are available which can be used to improve the understanding of ocean tides by allowing for the estimation of an increased number of minor tidal constituents. As ocean tide models continue to improve, especially in the coastal region, these minor tides become increasingly important. Generally, admittance theory is used by most global ocean tide models to infer several minor tides from the major tides when creating the tidal correction for satellite altimetry. In this paper, regional studies are conducted to compare the use of admittance theory to direct estimations of minor tides from the EOT20 model to identify which minor tides should be directly estimated and which should be inferred. The results of these two approaches are compared to two global tide models (TiME and FES2014) and in situ tide gauge observations. The analysis showed that of the eight tidal constituents studied, half should be inferred (2N2, , MSF and T2), while the remaining four tides (J1, L2, and ) should be directly estimated to optimise the ocean tidal correction. Furthermore, for certain minor tides, the other two tide models produced better results than the EOT model, suggesting that improvements can be made to the tidal correction made by EOT when incorporating tides from the two other tide models. Following on from this, a new approach of merging tidal constituents from different tide models to produce the ocean tidal correction for satellite altimetry that benefits from the strengths of the respective models is presented. This analysis showed that the tidal correction created based on the recommendations of the tide gauge analysis provided the highest reduction of sea-level variance. Additionally, the combination of the EOT20 model with the minor tides of the TiME and FES2014 model did not significantly increase the sea-level variance. As several additional minor tidal constituents are available from the TiME model, this opens the door for further investigations into including these minor tides and optimising the tidal correction for improved studies of the sea surface from satellite altimetry and in other applications, such as gravity field modelling.
1. Introduction
Investigations of global sea level from satellite altimetry have been done for almost three decades following the launch of the ERS-1 and TOPEX/Poseidon altimeters in the early 1990s. Since then, several additional altimeter missions have followed, allowing for the continued assessment of sea level trends both in the open ocean and in the coastal regions (e.g., [1,2,3]). However, errors resulting from ocean tide signals continue to affect the studying of sea surface processes using along-track altimetry.
The launch of the TOPEX/Poseidon mission provided unprecedented global data that was used to significantly advance the field of global ocean tide modelling (see [4,5,6]). In the years that have followed, several empirical ocean tide models have been developed based on the increased availability of altimeter observations, which has resulted in the increased accuracy of tidal estimations in the open ocean and coastal regions [5,7]. However, difficulties remain in the coastal region due to the land-contamination of signals, inaccurate bathymetry information, and the complex nature of ocean tides closer to the coast. Recent advances in coastal altimetry, such as the ALES retracker for improved retrieval of coastal signals [8], has been influential in advancing the accuracy of tidal estimations in the coastal region [9,10].
One such model that has recently shown significant improvements in the coastal region resulting from these advances is the EOT20 model. EOT20 is the latest in a series of global empirical ocean tide (EOT) models produced by residual tidal analysis of multi-mission along-track satellite altimetry [10]. EOT20 produced an increased consistency with tide gauges compared to other state-of-the-art ocean tide models, particularly in the coastal region. EOT20 uses the FES2014 tide model [11] as the reference model for the residual analysis and can, therefore, provide the full tidal signals of the 34 constituents provided by FES. In fact, further tidal constituents can be inferred from EOT when assuming that the reference tidal signals are close to zero. However, difficulties remain, such as the computational load required to globally estimate tides based on the decades of altimetry, tidal aliasing, as well as difficulties in accurately estimating very small tidal constituents. These difficulties mean that providing additional global estimations of tidal constituents is not as easy as it sounds. A total of seventeen tidal constituents are provided globally by the EOT20 model [12], with additional minor constituents being inferred via admittance theory in the creation of the tidal correction.
Minor tides have long been included in the estimation of tidal corrections [13] and play an important role in the prediction of sea level from satellite altimetry. Their inference from major tides allows additional constituents to be provided and, therefore, aids in reducing errors in the tidal correction [14,15]. Furthermore, admittance theory is used in satellite altimetry analysis to infer tides that cannot be estimated due to noise or tidal aliasing problems [16]. In the International Earth Rotation and Reference Systems Service (IERS) conventions [17], a list of tidal constituents are suggested for which linear admittance of tides in the diurnal and semi-diurnal bands can be done. The concept of admittance, the relation of the tidal height with respect to the amplitude of the corresponding tide generating potential for a specific tidal wave [18], is assumed to be a smooth function of frequency [19]. Based on these assumptions, minor tides can be linearly interpolated for long-period, diurnal, and semi-diurnal tides [18] according to the formulations presented in [17].
As stated in Foreman and Henry [14], knowing when to directly estimate minor tides through least-squares analysis and when to infer them is not easily answered. Since then, there have been several studies on minor tides comparing direct and inferred estimations (e.g., [16,20]). However, questions still arise on whether the accuracy of these inferred tides is sufficient in reducing errors in the altimetry correction. The Reference Ray [16] showed how, for certain models, the inferred P1 tidal constituent produced better results compared to the direct estimation, with the opposite being the case for the J1 tide. The Reference Karbon et al. [20] compared different techniques of inferring minor tides with the direct estimations of FES2012, and found an RMS difference of less than 0.75 cm, with higher differences seen in the coastal regions. As we continue to improve the coastal estimations of tides, these discrepancies between inferred and direct estimations become increasingly valuable in understanding the errors in ocean tide estimations.
With this in mind, this paper aims to identify the tidal constituents that are required to be directly estimated during the least-squares harmonic analysis performed on satellite altimetry by the EOT model. An evaluation of a new approach of producing the ocean tidal correction for satellite altimetry by combining the major and minor tidal constituents of two different tide models is also presented. To do so, the aliasing periods and Rayleigh criteria for the satellite altimetry missions used are evaluated in Section 2 for all the tidal constituents available from the FES2014 model.
In Section 3, three regional studies are done comparing the direct and inferred minor tide estimations, as well as a purely hydrodynamic model and a data-constrained hydrodynamic model with in situ tide gauge data. Following on from this, the use of these minor tidal estimations are evaluated in the context of providing the tidal correction for satellite altimetry. Finally, a summary and outlook are given in Section 4.
2. Data and Methodology
The global EOT20 model showed significant improvements in the estimation of ocean tides in the coastal and open ocean region compared to other state-of-the-art global ocean tide models [10]. The EOT20 model is a semi-empirical tide model that is derived from residual tidal analysis of multi-mission satellite altimetry [21]. EOT20 relies on the FES2014 model [11] as a reference model for which residual analysis is performed to determine the residual tidal signals. A regional version of the EOT model is compared to both the FES2014 and the TiME global ocean tide models. The FES2014 model is the latest in a series of finite element solution (FES) global ocean tide atlases that have been produced to serve as a tidal correction for along-track satellite altimetry [11]. FES2014 is considered to be one of the leading ocean tide models and, therefore, the provided minor tides can serve as a good reference point to compare the results of minor tide estimations made by other models and techniques. The recently updated TiME model presented in Sulzbach et al. [22] is a numerical tide model that provides a vast number of minor tidal constituents that, when compared to inferred tides from data-constrained models, has been shown to improve the accuracy of several minor tides. TiME solves the shallow water equations on a truly global grid under consideration of dynamic effects, that are known to exert a critical influence on tidal oscillation systems. Further profiting from an upgraded bathymetric map, the obtained open ocean accuracy for the main semi-diurnal lunar M2-tide was found to be below 3.4 cm with respect to the FES2014 model [22]. Being independent of data constraints, the model accuracy with respect to the tidal signal only drops moderately for minor tides, rendering TiME useful for the continued evaluation of smaller tidal signals to improve the understanding of the full tidal spectrum needed to produce the tidal correction for satellite altimetry.
2.1. Estimation of Minor Tides Using the EOT Approach
EOT applies the least-squares approach to the harmonic formula to derive the residual amplitude and phase of single tidal constituents from the observations of the sea-level anomaly obtained from multi-mission satellite altimetry [10]. Due to the approach being a data-intensive approach which relies on the input of several decades of satellite altimetry data in order to make estimations, only 17 tidal constituents are estimated in the global EOT20 configuration, while FES2014 provides global maps of 34 tidal constituents. The estimation of additional tidal constituents may be important in improving the accuracy of the model particularly in the creation of the tidal correction. Therefore, based on the same residual harmonic analysis performed by the global EOT20 model, the model has been run to include the same 34 tidal constituents as presented in FES2014 in three different regions; henceforth, this (R)egional version of the model will be referred to as EOT-R. Regional studies are preferred over a global study due to the high computational load required from running a global configuration. The three regions chosen are: the Yellow Sea and the surrounding ocean, which includes the Japan Sea and East China Sea (henceforth, this region is referred to as the Yellow Sea); Australia; and New Zealand, which were all chosen based on their complex coastlines, relatively high minor tide signals, and high variability between tide models for the major tides [7].
2.2. Inference of Minor Tides Using Admittance Theory
The concept of admittance, the relation of the tidal height with respect to the amplitude of the corresponding tide generating potential for a specific tidal wave [18], is assumed to be a smooth function of frequency [19]. Therefore, several unknown minor tides can be inferred from the major tides given in global tide models [18].
This inference is valuable, particularly when providing predictions that require the full tidal spectrum [16,23]. This has resulted in the continued development of techniques and softwares (examples given in [18] and https://github.com/tsutterley/pyTMD (accessed on 22 June 2021)) that have been designed to optimise the estimation of these minor tides. The IERS conventions provide a list of 71 minor tides that can be inferred from the linear admittance theory [17]. To provide an example of a tide that can be inferred using admittance theory, the L2 tidal constituent is presented in Figure 1 which is inferred from the K2 and M2 tidal constituents.
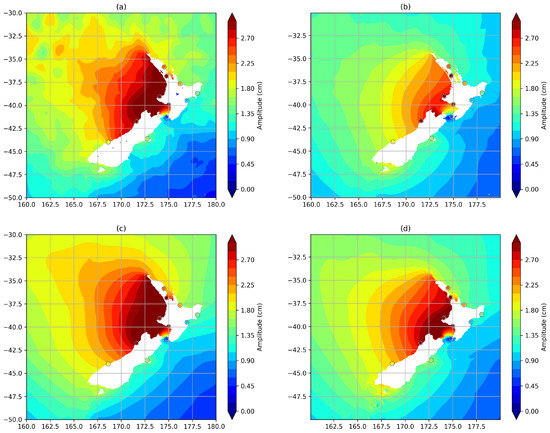
Figure 1.
The L2 tidal amplitude for (a) EOT-R, (b) Inferred from EOT20, (c) TiME and (d) FES2014 compared to the L2 amplitudes from the tide gauge observations (circles).
Differences can be noted between the estimations with the modelled amplitudes matching the amplitudes of the observations for most of the tide gauges, particularly in the Cook Strait between the two islands. For the relatively complex coastline of the northern island of New Zealand, however, the amplitude of the inferred L2 tide shows a clear underestimation compared to the observed L2 tide, while the modelled tides provide a better estimation. The in-phase (A) and quadrature (B) component of the L2 tide is inferred as the following:
with f being the frequency of the tide expressed in cycles per day, while H is the known tide-generating potential of the constituent.
Using this approach, eight additional tidal constituents were inferred from the EOT20 model based on the ability to be inferred via admittance, as well as the availability of these tide maps from the respective ocean tide models and the availability of in situ tide gauges needed to validate the tidal solutions. These constituents are: T2, , J1, L2, , MSF, and 2N2. For more information about these tidal constituents, please refer to Chapter 6 of Petit and Luzum [17]. In practice, admittance theory is used to improve the estimation of the full tidal height [16] and in this application, we apply the admittance theory to validate the accuracy of this inference compared to in situ tide gauge observations and with direct estimations from the ocean tide models presented above.
2.3. Aliasing Periods
As the EOT methodology relies on satellite altimetry which only samples the same locations at varying times based on their orbits (i.e., Jason altimeters sampling the same position every 9.9156 days and Envisat altimeters every 35 days), the aliasing period of the tidal constituents should be taken into account to determine whether the empirical model can provide an appropriate estimation of tidal constituents. The aliasing periods have been estimated for the Jason-series and the Envisat-series based on the research conducted by Wang [24], and are presented in Figure 2. When considering the length of data available from the Jason-series (more than 9000 days) and the Envisat-series (more than 6500 days), for 32 of the 34 tidal constituents considered the aliasing period does not have an influence on the determination of these tidal constituents. However, a known problem in the Envisat-series can be seen for the S1 and S2 tidal constituents in Figure 2. The altimetry missions that follow the orbit of the Envisat mission are all sun-synchronous, which means the aliasing period of these two solar tides becomes infinite and cannot be resolved by these missions alone. However, by incorporating the Jason-series of data that follow a different orbit, EOT can still provide an estimation of these two tidal constituents.
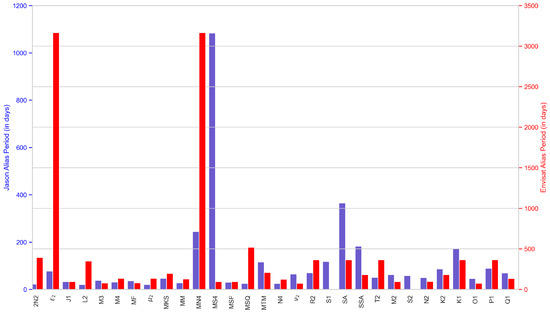
Figure 2.
The alias period (in days) for all the tidal constituents available from FES2014, with the blue bars indicating the Jason orbit missions and the red bars representing Envisat orbit missions. The S1 and S2 tidal constituents of the Envisat orbit have an aliasing period of infinity due to their sun-synchronous orbit.
Also important in the estimation of ocean tides from satellite altimetry, is the Rayleigh criteria which provides information on the length of time-series required to separate tidal constituents of similar angular frequencies [25]. Again, this varies based on the orbits and repeat cycles of the altimetry missions used, and with that in mind, the Rayleigh criteria are presented in Figure 3.
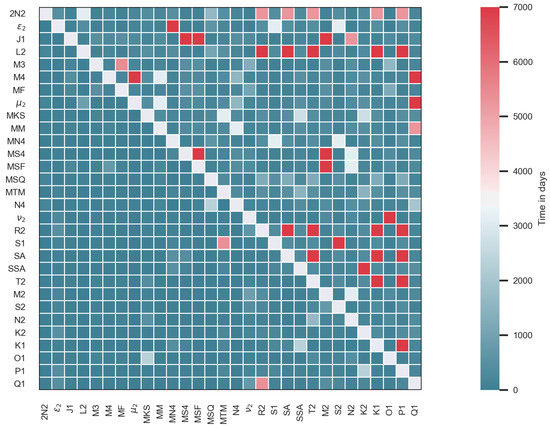
Figure 3.
Rayleigh coefficient in days of the Jason orbit (lower-left corner) and the Envisat orbit (upper-right corner) missions. The maximum time in days seen in the colourbar is chosen to be the temporal extent of the Envisat orbit used in the EOT model.
In this figure, the lower-left triangle represents the Rayleigh criteria (in days) of the Jason-series, while the upper-right triangle is that of the Envisat-series. For the Jason-series of data, the Rayleigh criteria is satisfied for all of the tidal constituents but this is not the case for the Envisat-series. Focusing on the minor tides that will be investigated later in this study, the Rayleigh criteria indicates difficulties in estimating the semi-diurnal solar T2 tidal constituents, as well as the and MSF tidal constituents. It can, therefore, be suggested that these tidal constituents may benefit from their inferences from their major tidal constituents, but inaccuracies in these tides may be compensated by the Jason-series, for which this is not an issue.
3. Results and Discussion
3.1. Tide Gauge Analysis
Three regional studies were conducted to assess the accuracy and importance of minor tidal constituents. For each of these regions, the EOT-R, FES2014, and TiME tide models, as well as tides inferred from the EOT20 model (EOT-I), were compared to tide gauges obtained from the TICON dataset [26]. TICON is a global tide gauge dataset derived from the Global Extreme Sea Level Analysis (GESLA) project which provides tidal constants for individual tide gauges that have been estimated through least-squares-based harmonic analysis.
The TICON data have been extensively quality controlled and provide all the tidal constituents available from the FES2014 tide model [26]. Therefore, this tide gauge dataset is used due to the availability of the appropriate minor tides for which comparisons should take place between the four tide models. The models are compared to the tide gauges using root-mean-square differences (RMS) and the root-sum-square (RSS) as presented in Hart-Davis et al. [10] with the tidal signal estimated following Stammer et al. [7], with the RMS, RSS, and tidal signal being presented in Figure 4.
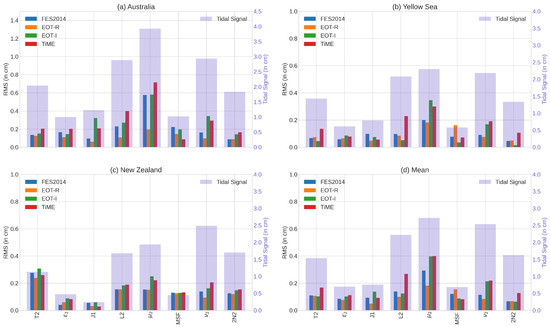
Figure 4.
The RMS, in cm, of the minor tides from all three regions for the EOT-R, EOT-I, FES2014, and TiME tide models. The RMS is overlaid above the tidal signals (blue axis) of each individual constituent in each of the regions. The number of tide gauges for each region is 27 for Australia, 65 for the Yellow Sea, and 12 for New Zealand, with the mean being of all 104 tide gauges.
For all of the tide gauges presented, EOT-R shows a lower root-square-sum (RSS) compared to all of the tide models, but there are several constituents where the RMS is higher than that of the other models (Figure 4d). For the Australia and New Zealand regions, EOT-R shows a lower RSS compared to all of the tide models and shows relatively low RMS results for all of the constituents. In the Yellow Sea (Figure 4b), however, EOT-R shows a relatively poor RMS for the MSF tide, which results in the RSS in this region being slightly higher than the FES2014 model. Additionally, this is also the only region where EOT-R shows a higher RMS for the T2 tide compared to both EOT-I and FES2014.
The MSF and T2 tides, as shown in Figure 3, were constituents where the Rayleigh coefficient for the Envisat missions was not satisfied. In fact, as seen in Figure 4, MSF is one of two tides where an overall improvement was not seen compared to the reference tide model, FES2014, indicating that this tidal constituent cannot be accurately determined via the least-squares analysis done by EOT. This is further confirmed by the RMS results of the EOT-I for the MSF and T2 tides, where the mean results are lower than that of the EOT-R model.
The tidal signal of MSF is the lowest of all the tides, indicating known difficulties in direct estimation of smaller tides from satellite altimetry. The tides used to infer the MSF tide are the MM and MF tides, while T2 is inferred from the M2 and K2 constituents [17], which are already processed in the creation of the global EOT20 model and it is, therefore, recommended that these tides be inferred in order to reduce the influence of any errors forming from the failure to meet the Rayleigh criteria for Envisat-orbit missions.
The estimation of the 2N2 constituent is the only other tide where EOT-R shows a higher RMS compared to both EOT-I and FES2014. This tide is provided in the global EOT20 tide model and used in the inference of the constituent [17] and, therefore, requires special consideration regarding whether it should or should not be directly estimated via harmonic analysis. Overall, the RMS of the 2N2 tide from EOT-R is very similar to the results of both FES2014 and EOT-I, while for the tide, EOT-R shows slightly improved results. Based on the relatively high tidal signal of the 2N2 tide, all models do well in estimating this tide compared to the tide gauges, while for , the models show a relatively high RMS compared to the signal itself. When inferring from the inferred 2N2 tide (not shown), the RMS of the tide compared to tide gauges is reduced by 0.1 mm and becomes in line with the RMS of EOT-R and FES2014. This means that the 2N2 and the tide can be inferred by the EOT model and do not need to be directly estimated through harmonic analysis.
For the remaining constituents, EOT-I shows significantly larger RMS values compared to EOT-R. The results for , and J1 tides are consistent for all of the regions, implying the inference does not provide an accurate estimation of these tides. These results are in line with what has previously been shown for the J1 tide in Ray [16]. For the L2 tide, however, the picture is not as clear. In the Yellow Sea, EOT-I outperforms EOT-R, while in New Zealand and Australia, the results are vice versa. However, the inferred L2 tide shows an RMS that is more than double that of the EOT-R in Australia. With this high RMS, coupled with the overall larger RMS for EOT-I, it is recommended that the L2, as well as the remaining three tides, be directly estimated by the EOT model. When considering that EOT-R and FES2014 are optimised for the estimation of tides in the coastal region, the performance of TiME compared to the tide gauge observations exceeds expectations. TiME shows the lowest overall RMS for the MSF tidal constituent and is within 2 mm of the overall RSS estimations of the EOT-I and FES2014 models.
Furthermore, the higher RSS of the TiME model is strongly influenced by poorer estimations of the L2 and tidal constituents, while for the remaining constituents, the RMS of TiME is closer to those of the other models. The high RMS in the is driven by larger errors seen in the Australian region, with relatively high errors also seen in the FES2014 and EOT-I results. For L2, TiME shows consistency in having the highest RMS value, with this influencing the RSS differences between EOT-I and TiME. With this tide removed from the analysis, the overall RSS of TiME reduces to be within 0.1 mm of EOT-I. This suggests that TiME provides valuable minor tide estimations that can potentially be used to improve the understanding of minor tides, as well as improve tidal corrections.
The results of the tide gauge analysis provide important insight for the estimation of tides from the current availability of satellite altimetry and, therefore, the EOT ocean tide model. Coupled with Figure 3, it can be recommended that of the constituents presented, 2N2, , MSF, and T2 tides do not need to be directly estimated during the harmonic analysis of satellite altimetry. For the remaining J1, L2, and tides, it is recommended to directly estimate these tides when using the approach combining both Envisat- and Jason-orbit altimetry missions. For the most part, the results of TiME and FES2014 are outperformed by the EOT-R model, however, when compared to the inferred constituents, both models show encouraging results. Therefore, instead of using linear admittance to infer minor tidal constituents for use in the tidal correction, models such as FES2014 and TiME could be coupled with the EOT major tides to provide an accurate tidal correction.
3.2. Regional Sea Level Variance Analysis
In this section, the above-mentioned tide models are used to create tidal corrections for satellite altimetry observations. To evaluate the accuracy of the tidal corrections, regional sea-level variance analysis is presented within the three regions described above. For this, the sea level anomaly (SLA) is estimated for the Jason-2 altimeter following the same technique used in Andersen and Scharroo [27] and Hart-Davis et al. [10]: , where H is the orbital height, R the range, the mean sea surface, and is the geophysical corrections, with the same parameters and corrections being used as in Table 2 of Hart-Davis et al. [10].
Here, the only variable that is changed is the ocean tidal correction for which four different tidal corrections were computed. For all of these corrections, the eight minor tides as presented in Figure 4 are used from the tide models and are combined with the major tides of the EOT-R model. The use of the major tides from the EOT-R model is kept consistent so that the SLA variance is only influenced by the minor tides. These major tides are M2, K2, K1, S2, N2, O1, P1, and Q1, as well as the long-period tides MM, MF, SA, and SSA. Several additional constituents are available from each model, but these are chosen based on consistency between models and the ability to infer via linear admittance. It should also be made clear that there will potentially be small errors resulting from inconsistencies between model-defined coastlines, as well as variable spatial resolutions.
For each cycle of Jason-2, the SLA was gridded onto a 3-degree grid and, finally, this was then used to calculate the SLA variance for each of the scenarios created. The SLA variance differences are then presented for Australia (Figure 5), New Zealand (Figure 6), and the Yellow Sea (Figure 7) with the mean differences being presented in Table 1.
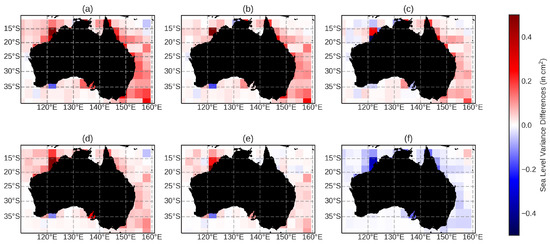
Figure 5.
The sea-level variance differences between the scenarios presented for the Jason-2 altimeter in the Australia region. The subplots of sea-level variance differences are as follows: (a) modTiME–EOT-R; (b) modTiME–EOT-I; (c) modTiME–modFES; (d) modFES–EOT-R; (e) modFES–EOT-I; and (f) EOT-R–EOT-I. The figures are designed so that when the colours are blue, the first model has a lower variance, while when the regions are red, the first model has a higher variance compared to the second model.
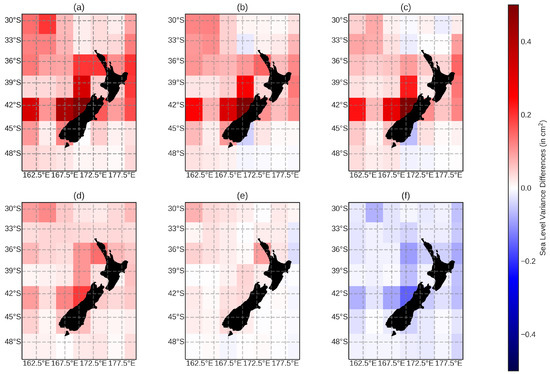
Figure 6.
The same as in Figure 5, but for the New Zealand region.
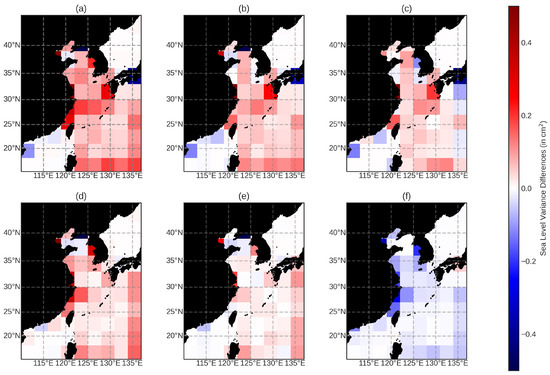
Figure 7.
The same as in Figure 5, but for the Yellow Sea region.

Table 1.
The mean sea-level variance difference (in cm) estimated for each of the listed scenarios.
The results of the regions of New Zealand and Australia show that the inferred minor tides reduce the variance compared to both TiME and FES2014 ’hybrid’ tidal corrections (henceforth referred to as modTiME and modFES, respectively), with modFES showing a reduction compared to modTiME. For the most part, the variance differences are small, rarely exceeding 0.1 cm; however, in the coastal region, the modTiME model shows relatively high variances compared to the other model estimations. This is somewhat expected, due to the FES and EOT models being optimised for the coastal regions. The differences between modFES and EOT-I are also largely in the coastal regions, with variances being very similar further away from the coast.
In Hart-Davis et al. [10], improvements were seen in the estimation of tides in EOT20 compared to FES2014 in the coastal region based on the incorporation of the ALES retracker and the improved coastal representation, while in the open ocean regions, the models showed similar results for the estimation of tides. Although those results were for major tides, similar results can be seen here for the minor tides.
For the Yellow Sea region (Figure 7), the mean SLA variance differences between the models generally decreases, with modFES slightly outperforming EOT-I. Like in the other two regions, the general strong point for EOT-I is in the coastal region, with the model differences decreasing further away from the coast. However, in the Yellow Sea, there are, in fact, certain coastal points where EOT-I, as well as EOT-R, perform relatively poorly. For example, the grid points at 40N and 125E, as well as 35N and 135E show high sea-level variance for EOT-R and EOT-I and relatively low variances for modTiME and modFES. This region was where EOT-R was outperformed by FES2014 in the tide gauge analysis and where EOT-R had the highest RMS for the MSF tide. This suggests that EOT-R is not providing a good estimation of the minor tides in the sub-regions identified in Figure 7, which could be caused by either the complexity of these two regions (being areas of several islands) or the size of the grids used in this analysis. With these two sub-regions removed, the mean differences between the models of the Yellow Sea show similar results to what was seen in the Australia and New Zealand regions.
Despite the tide gauge analysis suggesting problematic tides, such as the MSF tide, it was somewhat anticipated that the minor tides of the EOT-R model would provide an improved tidal correction, and this has proved to be the case. Compared to the other configurations in every region (Table 1), EOT-R shows a mean reduction in sea-level variance, although the mean differences only exceed 0.1 cm for the modTiME model in the New Zealand region. There are sub-regions where EOT-R shows a large reduction exceeding 0.2 cm compared to both modTiME and modFES; however, overall, the differences remain small. Furthermore, EOT-R shows a reduction for all of the regions except two grid cells compared to EOT-I but, again, the differences are minimal. Although EOT-R shows better results compared to the other models overall, the mean differences between the models are small, which is driven by smaller variance differences between the models away from the coasts.
In the coastal regions, EOT-R shows a large reduction in variances compared to the other models, as well as the inferred tides. These differences could potentially decrease when larger errors in individual tides, for example in the L2 tide (Figure 4), are addressed in the other minor tide estimations. However, this further highlights the importance of either investigating different techniques to infer the minor tides, or directly estimating them to provide a better tidal correction in the coastal region for use in sea-level studies using satellite altimetry.
A final comparison between two tidal corrections is presented in Figure 8. In this comparison, a tidal correction is created based on the recommendations produced in the tide gauge analysis on which tides to infer and which tides to directly estimate in the EOT model, to produce a ’(H)ybrid’ ocean tidal correction called EOT-H. To reiterate, the tides recommended to infer were 2N2, , MSF, and T2 tides, and those recommended to directly estimate were J1, L2, , and tides. The overall mean differences show a reduced variance for EOT-H compared to EOT-R in both Australia and the Yellow Sea, while EOT-R showed a reduced variance in the New Zealand region. The variance differences remain very low and never exceed 0.01 cm, with the average difference being 0.002 cm in favour of EOT-H (Table 1).
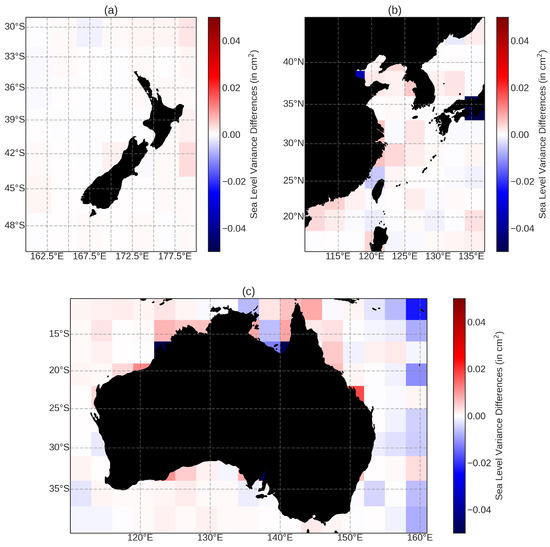
Figure 8.
The sea-level variance differences between EOT-R and EOT-H for (a) New Zealand, (b) the Yellow Sea and (c) Australia. Please note the adjusted color bar compared to Figure 5, Figure 6 and Figure 7. Here, when the regions are colored red, EOT-R shows a reduction in SLA variance, while the opposite is the case in blue regions.
Generally, the differences in the coastal region favour EOT-R; however, there are certain regions where the EOT-H shows a reduction in variance, particularly around 140E and 15S in Australia. The region where there is the highest improvement from EOT-H is in the eastern coast of Australia, near a western boundary current known as the East Australian Current. Generally, a higher SLA variance is seen in western boundary currents [28] resulting from difficulties, among other things, to accurately estimate the ocean tides in regions of high non-tidal variability [29].
By determining which tides can accurately be inferred and directly estimated, EOT-H allows for maintenance of the higher accuracy tidal estimations, but also utilises admittance theory to infer tides where satellite altimetry struggles to do so. The recommendation of tides to infer and directly estimate, therefore, produces results that are suitable for use in an ocean tidal correction of satellite altimetry.
4. Summary and Outlook
This paper presented an evaluation of the accuracy of the estimation of minor tidal constituents and the implications this has on the estimation of the sea level from along-track satellite altimetry. Furthermore, a new technique of merging constituents calculated from different models to utilise strengths of individual models was presented. The use of minor tides is valuable for the estimation of the sea level from along-track satellite altimetry [13]. For the EOT tide model, estimating minor tides is made difficult due to tidal aliasing and due to the small signals of these tides which are challenging to detect from satellite altimetry. Four different tide models were compared to one another: EOT-R which is a regional model created following the exact configuration of EOT20 [10] simply with additional constituents; EOT-I which is the minor tides that are inferred from the EOT20 model using linear admittance theory; and FES2014 [11] and TiME [22].
The tide gauge analysis provides valuable insight for the EOT model on which tidal constituents need to be directly estimated during the harmonic analysis and which tides can be inferred via admittance theory. Based on these results, it is recommended that the J1, L2, and tides be directly estimated and that the 2N2, , MSF and T2 be inferred. This will reduce the computational load while still providing an accurate tidal correction for satellite altimetry. On average, EOT-R outperforms all of the other models, but there are regions and constituents for which the other models show better results. The results of the SLA variance analysis showed that the minor tide correction created based on the recommendations of the tide gauge analysis provided the best results in terms of the tidal correction. However, the differences between the four different minor tide estimations are relatively low. Although TiME produced relatively large errors for certain tides, the results are rather encouraging compared to the FES2014, EOT-R and EOT-I minor tide estimations, despite being a purely hydrodynamic model and not being optimised for the estimation of tides in the coastal region. As stated by Sulzbach et al. [22], the accuracy of the TiME model is lower than that of data-constrained models for major tidal constituents, but improvements can be seen in certain minor tides, with this being confirmed by the tide gauge analysis in Figure 4, particularly for the MSF constituent.
Additional factors limit the ability of the estimation of minor tides in the EOT model, such as errors resulting from the failure to satisfy the Rayleigh criteria for certain tidal constituents based on the altimetry used. This is somewhat accounted for by combining multiple satellite altimetry missions, however, certain tides are still challenging to estimate, as seen in Figure 3 and Figure 4. Furthermore, as EOT is a purely empirical model that relies on decades of altimetry observations, computational limitations restrict the ability of the model to globally estimate a large number of constituents. This means that the inference of tides from major constituents is still used to help reduce these errors. However, the inference of certain tides is still imperfect compared to direct estimations.
Therefore, EOT may still benefit from the use of the minor tides obtained from the purely hydrodynamic TiME model, which could increase the number of constituents available to provide a more complete estimation of ocean tides. However, care should be taken in developing a technique to merge these two models to optimise the estimation of the ocean tides and to take into account things such as the different spatial resolutions and gridding techniques of the models. Additionally, the numerical models may have constraints for certain tidal constituents based on their relationships to other tides and, therefore, the combination of these tides with EOT may result in inconsistencies creeping into the tidal corrections. Furthermore, the development and implementation of improved techniques to infer the minor tides from the major tides may also provide better estimations for minor tides in the coastal regions. These avenues for the improvement of minor tide estimations will be the subject of future studies alongside the continued development of the EOT and TiME ocean tide models.
This work additionally serves as a framework to expand into additional regions and to study more complex tidal constituents. As more satellite altimetry missions are launched and the current orbits are being continued, for example, via missions such as Sentinel-6, the number of constituents able to be directly estimated continues to rise. The Reference Ray [30] demonstrated the ability of satellite altimetry to directly estimate third-degree ocean tides and showed the importance of these signals for the prediction of ocean tides. As the coastal altimetry field continues to grow, these smaller tidal constituents become vital in helping to accurately monitor the changes in the global sea level.
Author Contributions
M.G.H.-D., D.D., R.S. and M.T. conceptualised the idea of the research as part of the TIDUS research group within the DFG research unit, NEROGRAV. M.G.H.-D. developed the methodology, performed the analysis and validation, and wrote the paper. D.D. contributed to the interpretation of the results and the formulation of the paper. R.S. and M.T. provided the TiME tide model data and assisted in the interpretation of the results. C.S. provides and maintains the satellite altimetry database and the OpenADB tools that was used in the creation of the EOT20 model and in the sea-level variance analysis. F.S. provided the resources making the study possible and coordinates the activities of the research group at DGFI-TUM. All authors have read and agreed to the published version of the manuscript.
Funding
The authors acknowledge funding by the DFG project TIDUS (grant DE2174/12-1 and grant TH864/15-1) within the DFG research unit NEROGRAV (RU 2736/1). This work used resources of the Deutsches Klimarechenzentrum (DKRZ) granted by its Scientific Steering Committee (WLA) under project ID 499.
Institutional Review Board Statement
Not applicable.
Informed Consent Statement
Not applicable.
Data Availability Statement
The ocean tides from EOT20 are available at: https://doi.org/10.17882/79489 (accessed on 1 July 2021). The satellite altimetry data used in the sea-level variance study can be found at: https://openadb.dgfi.tum.de/ (accessed on 1 July 2021). The tide gauges from the TICON dataset used in the tide gauge analysis, are available at: https://doi.pangaea.de/10.1594/PANGAEA.896587 (accessed on 1 July 2021). The Python code based on estimating the aliasing period, can be found at: https://github.com/hart-davis/alias_periods.git (accessed on 1 July 2021).
Conflicts of Interest
The authors declare no conflict of interest.
References
- Ablain, M.; Legeais, J.; Prandi, P.; Marcos, M.; Fenoglio-Marc, L.; Dieng, H.; Benveniste, J.; Cazenave, A. Satellite altimetry-based sea level at global and regional scales. Surv. Geophys. 2017, 38, 7–31. [Google Scholar] [CrossRef]
- The Climate Change Initiative Coastal Sea Level Team. Coastal sea level anomalies and associated trends from Jason satellite altimetry over 2002–2018. Sci. Data 2020, 7, 357. [Google Scholar] [CrossRef]
- Passaro, M.; Müller, F.L.; Oelsmann, J.; Rautiainen, L.; Dettmering, D.; Hart-Davis, M.G.; Abulaitijiang, A.; Andersen, O.B.; Høyer, J.L.; Madsen, K.S.; et al. Absolute Baltic Sea Level Trends in the Satellite Altimetry Era: A Revisit. Front. Mar. Sci. 2021, 8, 546. [Google Scholar] [CrossRef]
- Andersen, O.B. Global ocean tides from ERS 1 and TOPEX/POSEIDON altimetry. J. Geophys. Res. Oceans 1995, 100, 25249–25259. [Google Scholar] [CrossRef]
- Shum, C.; Woodworth, P.; Andersen, O.; Egbert, G.D.; Francis, O.; King, C.; Klosko, S.; Le Provost, C.; Li, X.; Molines, J.M.; et al. Accuracy assessment of recent ocean tide models. J. Geophys. Res. Oceans 1997, 102, 25173–25194. [Google Scholar] [CrossRef]
- Savcenko, R.; Bosch, W. EOT11a-Empirical Ocean Tide Model from Multi-Mission Satellite Altimetry; DGFI Report No. 89; Deutsches Geodätisches Forschungsinstitut (DGFI): München, Germany, 2012. [Google Scholar] [CrossRef]
- Stammer, D.; Ray, R.; Andersen, O.B.; Arbic, B.; Bosch, W.; Carrère, L.; Cheng, Y.; Chinn, D.; Dushaw, B.; Egbert, G.; et al. Accuracy assessment of global barotropic ocean tide models. Rev. Geophys. 2014, 52, 243–282. [Google Scholar] [CrossRef] [Green Version]
- Birol, F.; Léger, F.; Passaro, M.; Cazenave, A.; Niño, F.; Calafat, F.M.; Shaw, A.; Legeais, J.F.; Gouzenes, Y.; Schwatke, C.; et al. The X-TRACK/ALES multi-mission processing system: New advances in altimetry towards the coast. Adv. Space Res. 2021, 67, 2398–2415. [Google Scholar] [CrossRef]
- Piccioni, G.; Dettmering, D.; Passaro, M.; Schwatke, C.; Bosch, W.; Seitz, F. Coastal improvements for tide models: The impact of ALES retracker. Remote Sens. 2018, 10, 700. [Google Scholar] [CrossRef] [Green Version]
- Hart-Davis, M.G.; Piccioni, G.; Dettmering, D.; Schwatke, C.; Passaro, M.; Seitz, F. EOT20: A global ocean tide model from multi-mission satellite altimetry. Earth Syst. Sci. Data 2021, 13, 3869–3884. [Google Scholar] [CrossRef]
- Lyard, F.H.; Allain, D.J.; Cancet, M.; Carrère, L.; Picot, N. FES2014 global ocean tide atlas: Design and performance. Ocean Sci. 2021, 17, 615–649. [Google Scholar] [CrossRef]
- Hart-Davis, M.; Piccioni, G.; Dettmering, D.; Schwatke, C.; Passaro, M.; Seitz, F. EOT20—A Global Empirical Ocean Tide Model from Multi-Mission Satellite Altimetry. SEANOE [Dataset]. 2021. Available online: https://doi.org/10.17882/79489 (accessed on 1 July 2021).
- Schrama, E.; Ray, R. A preliminary tidal analysis of TOPEX/POSEIDON altimetry. J. Geophys. Res. Oceans 1994, 99, 24799–24808. [Google Scholar] [CrossRef]
- Foreman, M.G.G.; Henry, R.F. The harmonic analysis of tidal model time series. Adv. Water Resour. 1989, 12, 109–120. [Google Scholar] [CrossRef]
- Egbert, G.D.; Ray, R.D. Tidal prediction. J. Mar. Res. 2017, 75, 189–237. [Google Scholar] [CrossRef]
- Ray, R. On tidal inference in the diurnal band. J. Atmos. Ocean. Technol. 2017, 34, 437–446. [Google Scholar] [CrossRef]
- Petit, G.; Luzum, B. IERS Conventions (2010); Technical Report; Verlag des Bundesamts für Kartographie und Geodäsie: Frankfurt am Main, France, 2010. [Google Scholar]
- Rieser, D.; Mayer-Gürr, T.; Savcenko, R.; Bosch, W.; Wünsch, J.; Dahle, C.; Flechtner, F. The Ocean Tide Model EOT11a in Spherical Harmonics Representation; Technical Note; Institute of Theoretical Geodesy and Satellite Geodesy (ITSG): Graz, Austria, 2012. [Google Scholar]
- Munk, W.H.; Cartwright, D.E. Tidal spectroscopy and prediction. Philos. Trans. R. Soc. Lond. Ser. A Math. Phys. Sci. 1966, 259, 533–581. [Google Scholar]
- Karbon, M.; Balidakis, K.; Belda, S.; Nilsson, T.; Hagedoorn, J.; Schuh, H. Long-term evaluation of ocean tidal variation models of polar motion and UT1. In Geodynamics and Earth Tides Observations from Global to Micro Scale; Springer: Cham, Switzerland, 2019; pp. 17–35. [Google Scholar]
- Piccioni, G.; Dettmering, D.; Schwatke, C.; Passaro, M.; Seitz, F. Design and regional assessment of an empirical tidal model based on FES2014 and coastal altimetry. Adv. Space Res. 2021, 68, 1013–1022. [Google Scholar] [CrossRef]
- Sulzbach, R.; Dobslaw, H.; Thomas, M. High-Resolution Numerical Modeling of Barotropic Global Ocean Tides for Satellite Gravimetry. J. Geophys. Res. Oceans 2021, 126. [Google Scholar] [CrossRef]
- Le Provost, C.; Lyard, F.; Molines, J.M. Improving ocean tide predictions by using additional semidiurnal constituents from spline interpolation in the frequency domain. Geophys. Res. Lett. 1991, 18, 845–848. [Google Scholar] [CrossRef]
- Wang, Y. Ocean Tide Modeling in the Southern Ocean; Technical Report; Division of Geodetic Science, Ohio State University: Columbus, OH, USA, 2004. [Google Scholar]
- Savcenko, R.; Bosch, W. Residual Tide Analysis in Shallow Water-Contributions of ENVISAT and ERS Altimetry. In Proceedings of the Envisat Symposium, Montreux, Switzerland, 23–27 April 2007. [Google Scholar]
- Piccioni, G.; Dettmering, D.; Bosch, W.; Seitz, F. TICON: TIdal CONstants based on GESLA sea-level records from globally located tide gauges. Geosci. Data J. 2019, 6, 97–104. [Google Scholar] [CrossRef] [Green Version]
- Andersen, O.B.; Scharroo, R. Range and geophysical corrections in coastal regions: And implications for mean sea surface determination. In Coastal Altimetry; Springer: Berlin/Heidelberg, Germany, 2011; pp. 103–145. [Google Scholar]
- Zaron, E.D. Mapping the nonstationary internal tide with satellite altimetry. J. Geophys. Res. Oceans 2017, 122, 539–554. [Google Scholar] [CrossRef]
- Ray, R.D.; Byrne, D.A. Bottom pressure tides along a line in the southeast Atlantic Ocean and comparisons with satellite altimetry. Ocean Dyn. 2010, 60, 1167–1176. [Google Scholar] [CrossRef] [Green Version]
- Ray, R.D. First global observations of third-degree ocean tides. Sci. Adv. 2020, 6, eabd4744. [Google Scholar] [CrossRef] [PubMed]
Publisher’s Note: MDPI stays neutral with regard to jurisdictional claims in published maps and institutional affiliations. |
© 2021 by the authors. Licensee MDPI, Basel, Switzerland. This article is an open access article distributed under the terms and conditions of the Creative Commons Attribution (CC BY) license (https://creativecommons.org/licenses/by/4.0/).