Article

A Deep Learning Multimodal Method for Precipitation Estimation

1
Royal Meteorological Institute of Belgium, Avenue Circulaire 3, 1180 Brussels, Belgium
2
ETRO Department, Vrije Universiteit Brussel, Pleinlaan 2, 1050 Brussels, Belgium
*
Author to whom correspondence should be addressed.
Remote Sens. 2021, 13(16), 3278; https://doi.org/10.3390/rs13163278
Submission received: 8 July 2021 / Revised: 12 August 2021 / Accepted: 14 August 2021 / Published: 19 August 2021
(This article belongs to the Special Issue Artificial Intelligence for Weather and Climate)

Abstract

:
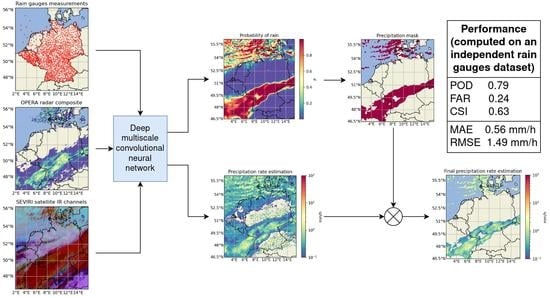
To improve precipitation estimation accuracy, new methods, which are able to merge different precipitation measurement modalities, are necessary. In this study, we propose a deep learning method to merge rain gauge measurements with a ground-based radar composite and thermal infrared satellite imagery. The proposed convolutional neural network, composed of an encoder–decoder architecture, performs a multiscale analysis of the three input modalities to estimate simultaneously the rainfall probability and the precipitation rate value with a spatial resolution of 2 km. The training of our model and its performance evaluation are carried out on a dataset spanning 5 years from 2015 to 2019 and covering Belgium, the Netherlands, Germany and the North Sea. Our results for instantaneous precipitation detection, instantaneous precipitation rate estimation, and for daily rainfall accumulation estimation show that the best accuracy is obtained for the model combining all three modalities. The ablation study, done to compare every possible combination of the three modalities, shows that the combination of rain gauges measurements with radar data allows for a considerable increase in the accuracy of the precipitation estimation, and the addition of satellite imagery provides precipitation estimates where rain gauge and radar coverage are lacking. We also show that our multi-modal model significantly improves performance compared to the European radar composite product provided by OPERA and the quasi gauge-adjusted radar product RADOLAN provided by the DWD for precipitation rate estimation.

Graphical Abstract

1. Introduction

Improving precipitation estimation is one of the main subjects of study in meteorological institutes because of its importance in various applications and research fields. Meteorological institutes need accurate precipitation estimations for the verification of their weather forecast models and for precipitation nowcasting [1]. Precipitation estimation is also necessary for other research fields such as hydrology.
A variety of different measurement methods exist, allowing for precipitation estimates to be made. The three most important ones are the rain gauges, ground-based radars and satellite remote-sensing devices such as satellite radiometers or satellite radars. Each of these measurement methods have their own strengths, and it is their complementarity that provides the main motivation to combine these modalities for a more accurate precipitation estimation.
Rain gauges directly measure the precipitation quantity in a small receptacle. Although the rain gauge measurements can suffer from different measurement error sources (calibration, strong wind, etc.) [2], this method provides the most direct means of measuring precipitation. Rain gauges are generally considered as the ground truth for precipitation estimation. The main limitation of rain gauges is that they only provide very local measurements. Unfortunately, precipitation can show large spatial variability when we look at a short timescale (i.e., instantaneous precipitation rate). When averages over longer timescales are considered, e.g., the monthly or yearly mean rainfall, the spatial variability is reduced [3], and rain gauge measurements can be used on a stand-alone basis.
For instantaneous precipitation rate estimation, the radar is tool of choice. Weather radars allow for scans of the atmosphere around them to detect hydrometeors, such as rain drops. They allow for an estimation of the precipitation rate within a radius of approximately 250 km around them, with a high temporal and spatial resolution. However, their precipitation estimation suffers from many different sources of error because weather radars do not provide direct measurements of precipitation [4,5]. Rainfall intensities at the ground are derived from radar reflectivity measurements at a given height in the atmosphere. The conversion between reflectivity and rainfall intensity is very uncertain since it strongly depends on the phase and size of the hydrometeors. The rainfall estimates are subject to various errors such as contamination by non-meteorological echoes and radio interferences, beam blockage or attenuation effects. In addition, the height of the measurements increases with the distance to the radar, which makes the radar measurements less representative of ground conditions. The use of polarimetric measurements allow for improvements in the quality of rainfall estimates by reducing contamination by non-meteorological signals and the effect of attenuation from severe rainfall [6]. However, even after a very careful processing of the radar data, the above-mentioned challenges can result in substantial errors in the radar-based estimates of rainfall at the ground. The final step is generally the merging of radar estimates with rain gauge observations [7,8].
Satellite remote sensing data are not used as often as rain gauges or weather radars for precipitation estimation. Nonetheless, they remain a source of interest for precipitation estimation studies because they allow for near-real time global coverage, including oceans, with uniform quality. Some of the most popular methods for satellite-based precipitation estimation involve a combination of Low Earth Orbit (LEO) microwave radiometer and Geostationary Earth Orbiting (GEO) infrared radiometer [9,10]. More recently, popular solutions to converting this particular combination of satellite information into precipitation detection and estimation make use of artificial neural networks, such as multilayer perceptrons [11,12,13], convolutional neural network [14] or conditional generative adversarial network [15]. However, using GEO radiometer data alone for direct precipitation estimation is also possible [16,17,18]. Second-generation GEO radiometers such as the Spinning Enhanced Visible and Infrared Imager (SEVIRI) on board the Meteosat Second Generation (MSG) [19] have the benefit of having a high temporal and spatial resolution that are only slightly below those of weather radars (5 vs. 15 min and 1 vs. 4 km, for the radar and SEVIRI, respectively). Precipitation estimation can be made at all times of the day with satellite thermal infrared data by determining the physical properties of the clouds and their water droplets [20].
Combining different modalities for precipitation estimation is a complex problem. The most popular methods are the geostatistical merging of rain gauges measurements with radar products [21]. However, to the best of our knowledge, there is no existing method to also merge additional modalities of data that are not direct precipitation measurements, such as satellite thermal infrared imagery. A practical solution to this could derive from Deep Learning (DL) because DL models can be adapted to work with various data modalities and let the model learn based on a training dataset of complex non-linear statistical relations between a set of predictors and an output variable [22,23]. For precipitation estimation, we demonstrated in [20] that DL can be used to fuse rain gauges measurements and GEO radiometer data from SEVIRI by using a multiscale Convolutional Neural Network (CNN) inspired by the architecture from [24]. Using SEVIRI data and automatic rain gauges as input, our DL model was trained to estimate the precipitation rate at the ground by using automatic rain gauge measurements as target data. Our model was able to detect precipitation with a Probability Of Detection (POD) of 0.75 and a False Alarm Ratio (FAR) of 0.3 and estimate precipitation rate with a Root Mean Square Error (RMSE) of 1.6 mm/h at a spatial resolution of 3 km [20].
In this paper, we extend our previous work by adding radar data to the list of modalities used by our model. We use the European radar composite OPERA [25], which covers our countries of study, namely Belgium, the Netherlands and Germany. The quality of the OPERA product has improved over the years since its creation and it allows for the monitoring of flash flood hazards on a European scale [26]. The OPERA product is available with a spatial resolution of 2 km, allowing us to increase our previous resolution of 3 km, and the temporal resolution is 15 min. The radar modality was the precipitation measurement tool of choice for instantaneous precipitation rate estimation; its addition allowed us to greatly increase the performance compared to our previous method [20], which used only rain gauges and the satellite radiometer SEVIRI. Compared to our previous work [20], a novelty in this paper is the direct comparison of our results to a radar method (the OPERA product) and a gauge-adjusted radar method (the quasi gauge-adjusted five-minute precipitation rate RADOLAN YW product [27]). The other main novelty proposed in this paper consists of a method to eliminate the bias between different rain gauge networks. Indeed, while using different networks of rain gauges originating from different countries, we observed a significant bias difference between each network of rain gauges, and our method of correction was able to remove this. We also introduced a few improvements to our DL model to optimize its performance and remove artifacts that were sometimes visible in the estimations made by our previous architecture [20].
In summary, the main novelties introduced in this paper are:
  • An extension of our previous work [20] by adding radar data to the list of modalities used by our model.
  • An improved spatial resolution, reduced from 3 km down to 2 km.
  • A couple of architecture updates allowing for optimization of the computational cost of our model and removal off some artifacts present in its output.
  • A method to eliminate the bias between different rain gauge networks.
  • A method to correct daily total precipitation accumulation bias.
  • A direct comparison of our results, a radar method (the OPERA product) and a gauge-adjusted radar method (the quasi-gauge-adjusted five-minute precipitation rate RADOLAN YW product [27]).
Section 2 will detail: our rain gauge dataset, and radar and satellite imagery data; our model architecture and the modifications and improvements made to it, compared to our previous work in [20]; the training strategy of our model; the correction of the rain gauge inter-network bias correction applied to our dataset of rain gauge measurements. After that, in Section 3 we perform an ablation study to: assess the contribution of each modality; a comparison of our model against the raw OPERA product and RADOLAN for instantaneous precipitation rate estimation; an evaluation of the spatial variability of our results, including a study on the difference in performance between estimations made on the sea and on the land; a qualitative evaluation of selected cases of precipitation rate maps produced by our model; an evaluation of the performance for daily accumulation precipitation. Finally, in Section 4, we discuss the outcome of our study.

2. Methodology

2.1. Data

Our DL model uses three different modalities as input to estimate instantaneous precipitation rate: rain gauge, precipitation radar, and satellite infrared radiometer observations. Our study area covers Belgium, the Netherlands and Germany, for the years ranging from 2015 to 2019. Our model is a CNN, so each data source needs to be prepared as a 2D images defined on the same spatial grid, before being aggregated into a multichannel image. For the grid definition, we use the projection of the OPERA product, which is a Lambert equal area projection with a resolution of 2 km. This is an improvement compared to the resolution of our previous method, using a 3 km grid. Each modality is also prepared on a temporal grid with a 15 min time step.
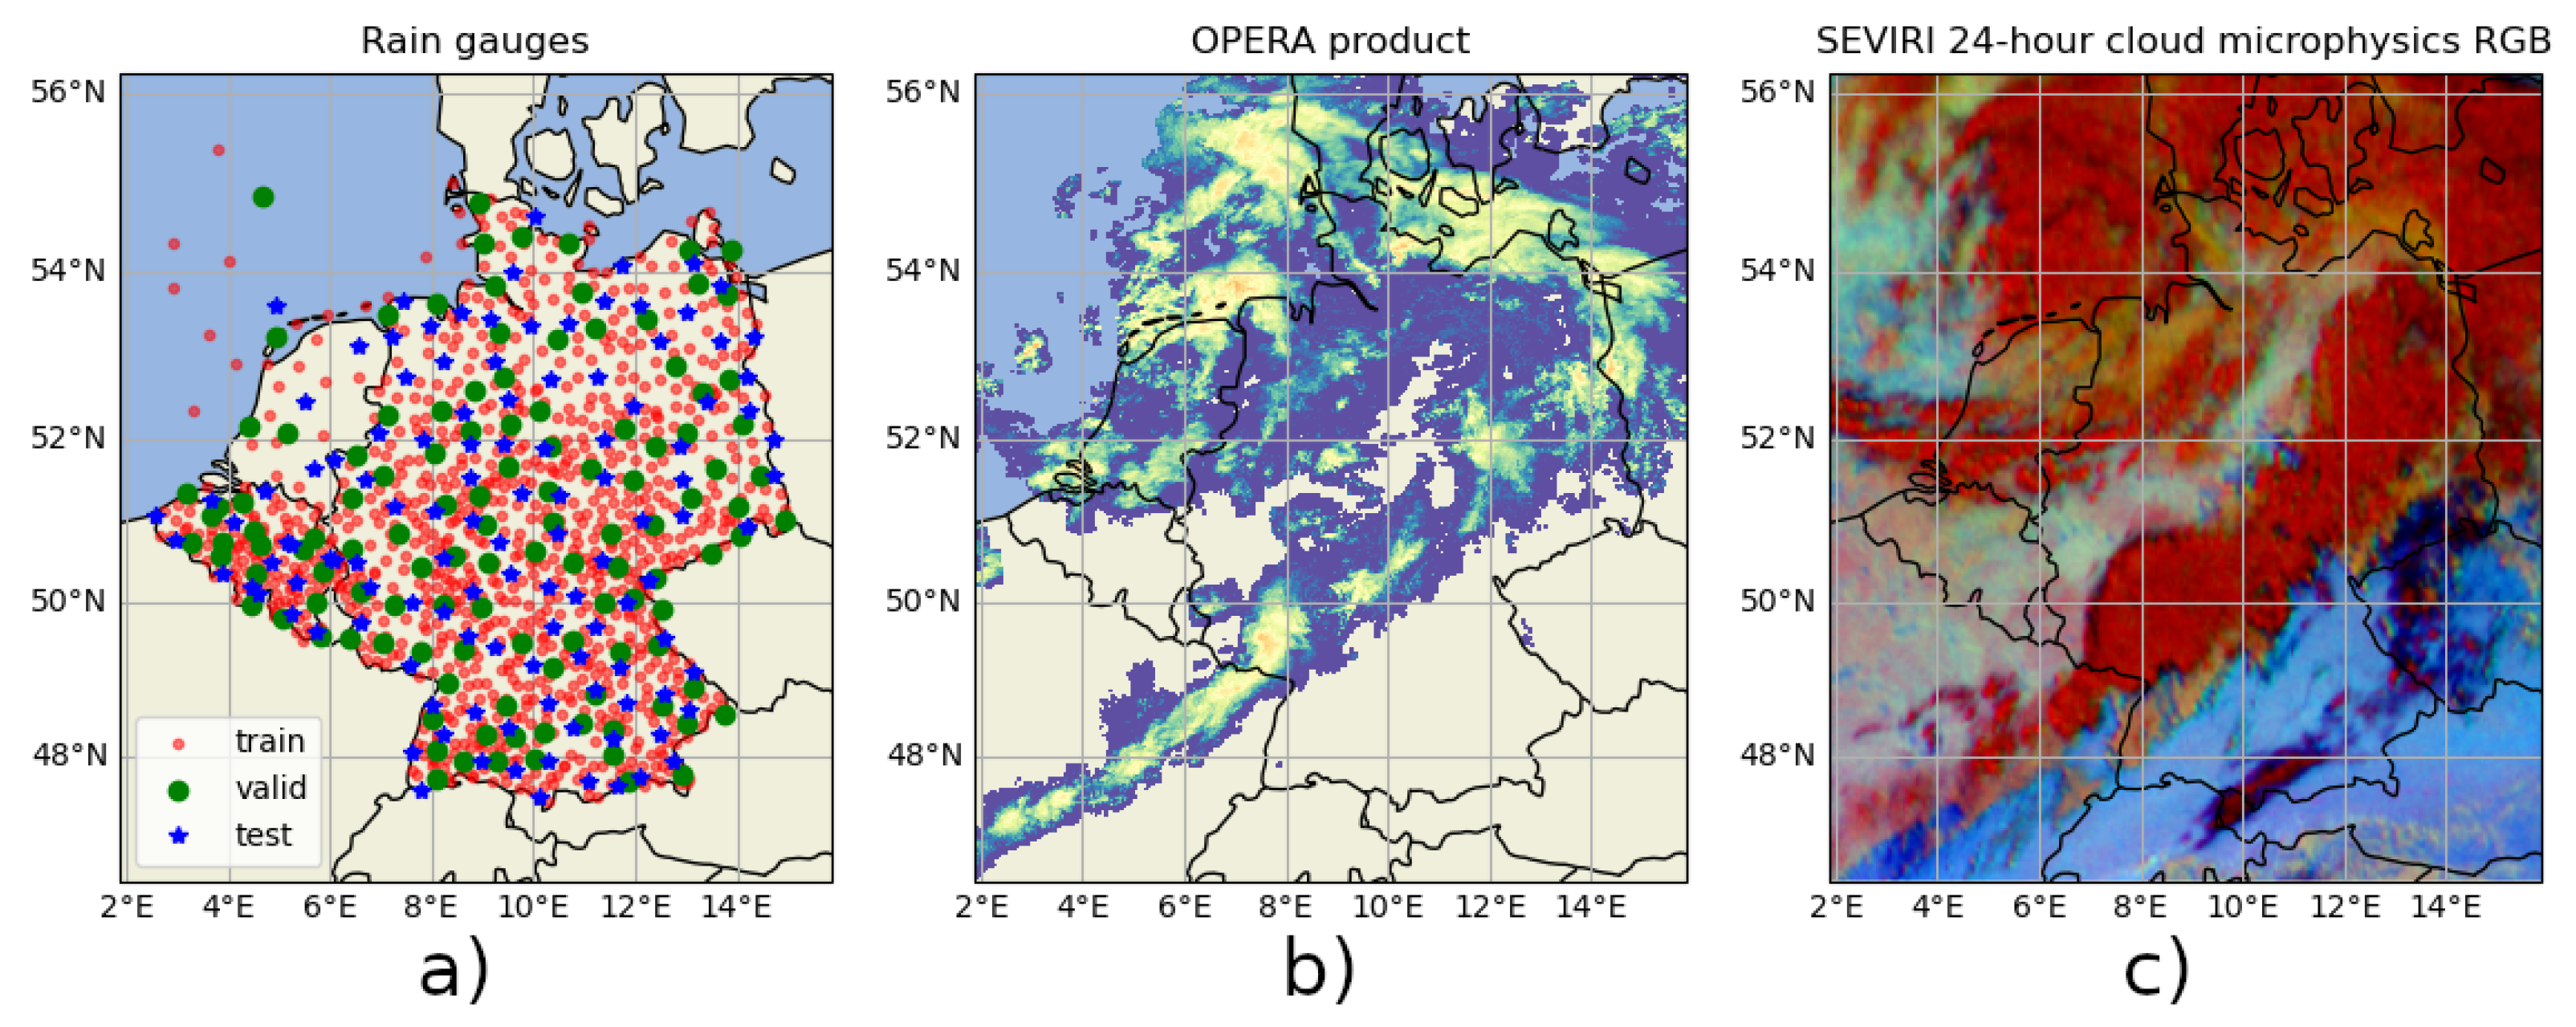
The rain gauge data come from five different networks of automatic rain gauges: the Royal Meteorological Institute of Belgium (RMIB), the Vlaamse Milieumaatschappij (VMM) and the Service Public de Wallonie (SPW) for Belgium; the Koninklijk Nederlands Meteorologisch Instituut (KNMI) for the Netherlands; and the Deutscher Wetterdienst (DWD) for Germany. In total, we have a dataset of 1161 automatic rain gauges (Figure 1a). The rain gauges measure 5 or 10 min precipitation accumulation, from which we compute the averaged precipitation rate. Then, we linearly interpolate the precipitation rate on our temporal grid. To prepare the rain gauge data as an input image for our CNN, we attribute each rain gauge measurement to its closest grid point (using the 2 km grid obtained with the Lambert equal area projection of the OPERA product) and we set all grid points devoided from a rain gauge measurement to 0. Next, we combine this channel with an additional image representing the position of each rain gauge measurement in our network. This second channel takes the value 1 in those grid points with a rain gauge measurement, and the value 0 otherwise.
The radar data come from the pan-European OPERA weather radar composite product [25] from the European Meteorological Network (EUMETNET), whose goal is to distribute high-quality pan-European weather radar composite products. This radar composite does not use dual polarization data, but its processing does include a beam blockage correction, a clutter filtering making use of a hit-accumulation map, an anomaly-removal module and a satellite-based filter based on the EUMETSAT Nowcasting SAF cloud products. The products from OPERA have the advantage of being uniformly processed across Europe and are ready to be processed by our CNN model. We used two different products from OPERA: the precipitation rate composite (Figure 1b) and the quality index composite (the quality depends on the distance from the radar). These two products are available at a spatial resolution of 2 km, which allowed us to increase the resolution of our original model from 3 km to 2 km, with a temporal resolution of 15 min. Similarly to rain gauge data, we deal with missing radar data by setting pixels with no measurements to 0; we add an extra image with a value of 1 in locations where data for the radar product are available and 0 otherwise.
For the satellite infrared data, we use the 8.7, 10.8, and 12.0 µm images from SEVIRI. These three wavelengths are related to the physical properties of the clouds, which are necessary to estimate precipitation, i.e., the cloud optical thickness, the cloud top temperature and the particle size. The images at these wavelengths also have the benefit of being usable during both the day and night [17]. For illustration purposes, these three infrared channels may be combined to obtain the 24-h cloud microphysics RGB image (Figure 1c). The SEVIRI images have a temporal resolution of 15 min. The spatial resolution is 3 km at nadir, and about 4 km in our area of study (i.e., Western Europe). We interpolate these linearly by triangulation the SEVIRI data on a grid of 4 km using the same Lambert equal area projection used for our other modalities.
Finally, we add the topography, the time of day and time of year, both converted into a periodical variable, as additional inputs to our model. This leaves us with an input image of 11 channels.
As rain gauge data are generally considered as the ground truth, we use them as target data for the training of our model. We split the rain gauges into a training, validation and test set, so that they are spread uniformly across our study area, with a ratio of 80/10/10 percent of the amount of rain gauges in each set, respectively (left part of Figure 1). We also split the data uniformly across time for each set, with a similar ratio of 80/10/10 percent, while keeping complete days of data for the test set, to eventually test the performance for daily precipitation accumulation. The ratio of 80% (training set), 10% (validation set) and 10% (test set) is typically used in DL training, and is chosen because we need as many training samples as possible to correctly train our model. For the validation and test sets, the ratio of 10% allows for a sufficient amount of validation and test samples to perform a significant evaluation of our model while maximizing the amount of training samples.

2.2. Model Architecture

Our model closely follows the architecture proposed in our prior work [20], namely, a multiscale CNN composed of an encoder, a decoder and two sub-networks: one estimating the probability of precipitation and the other estimating the rain rate.
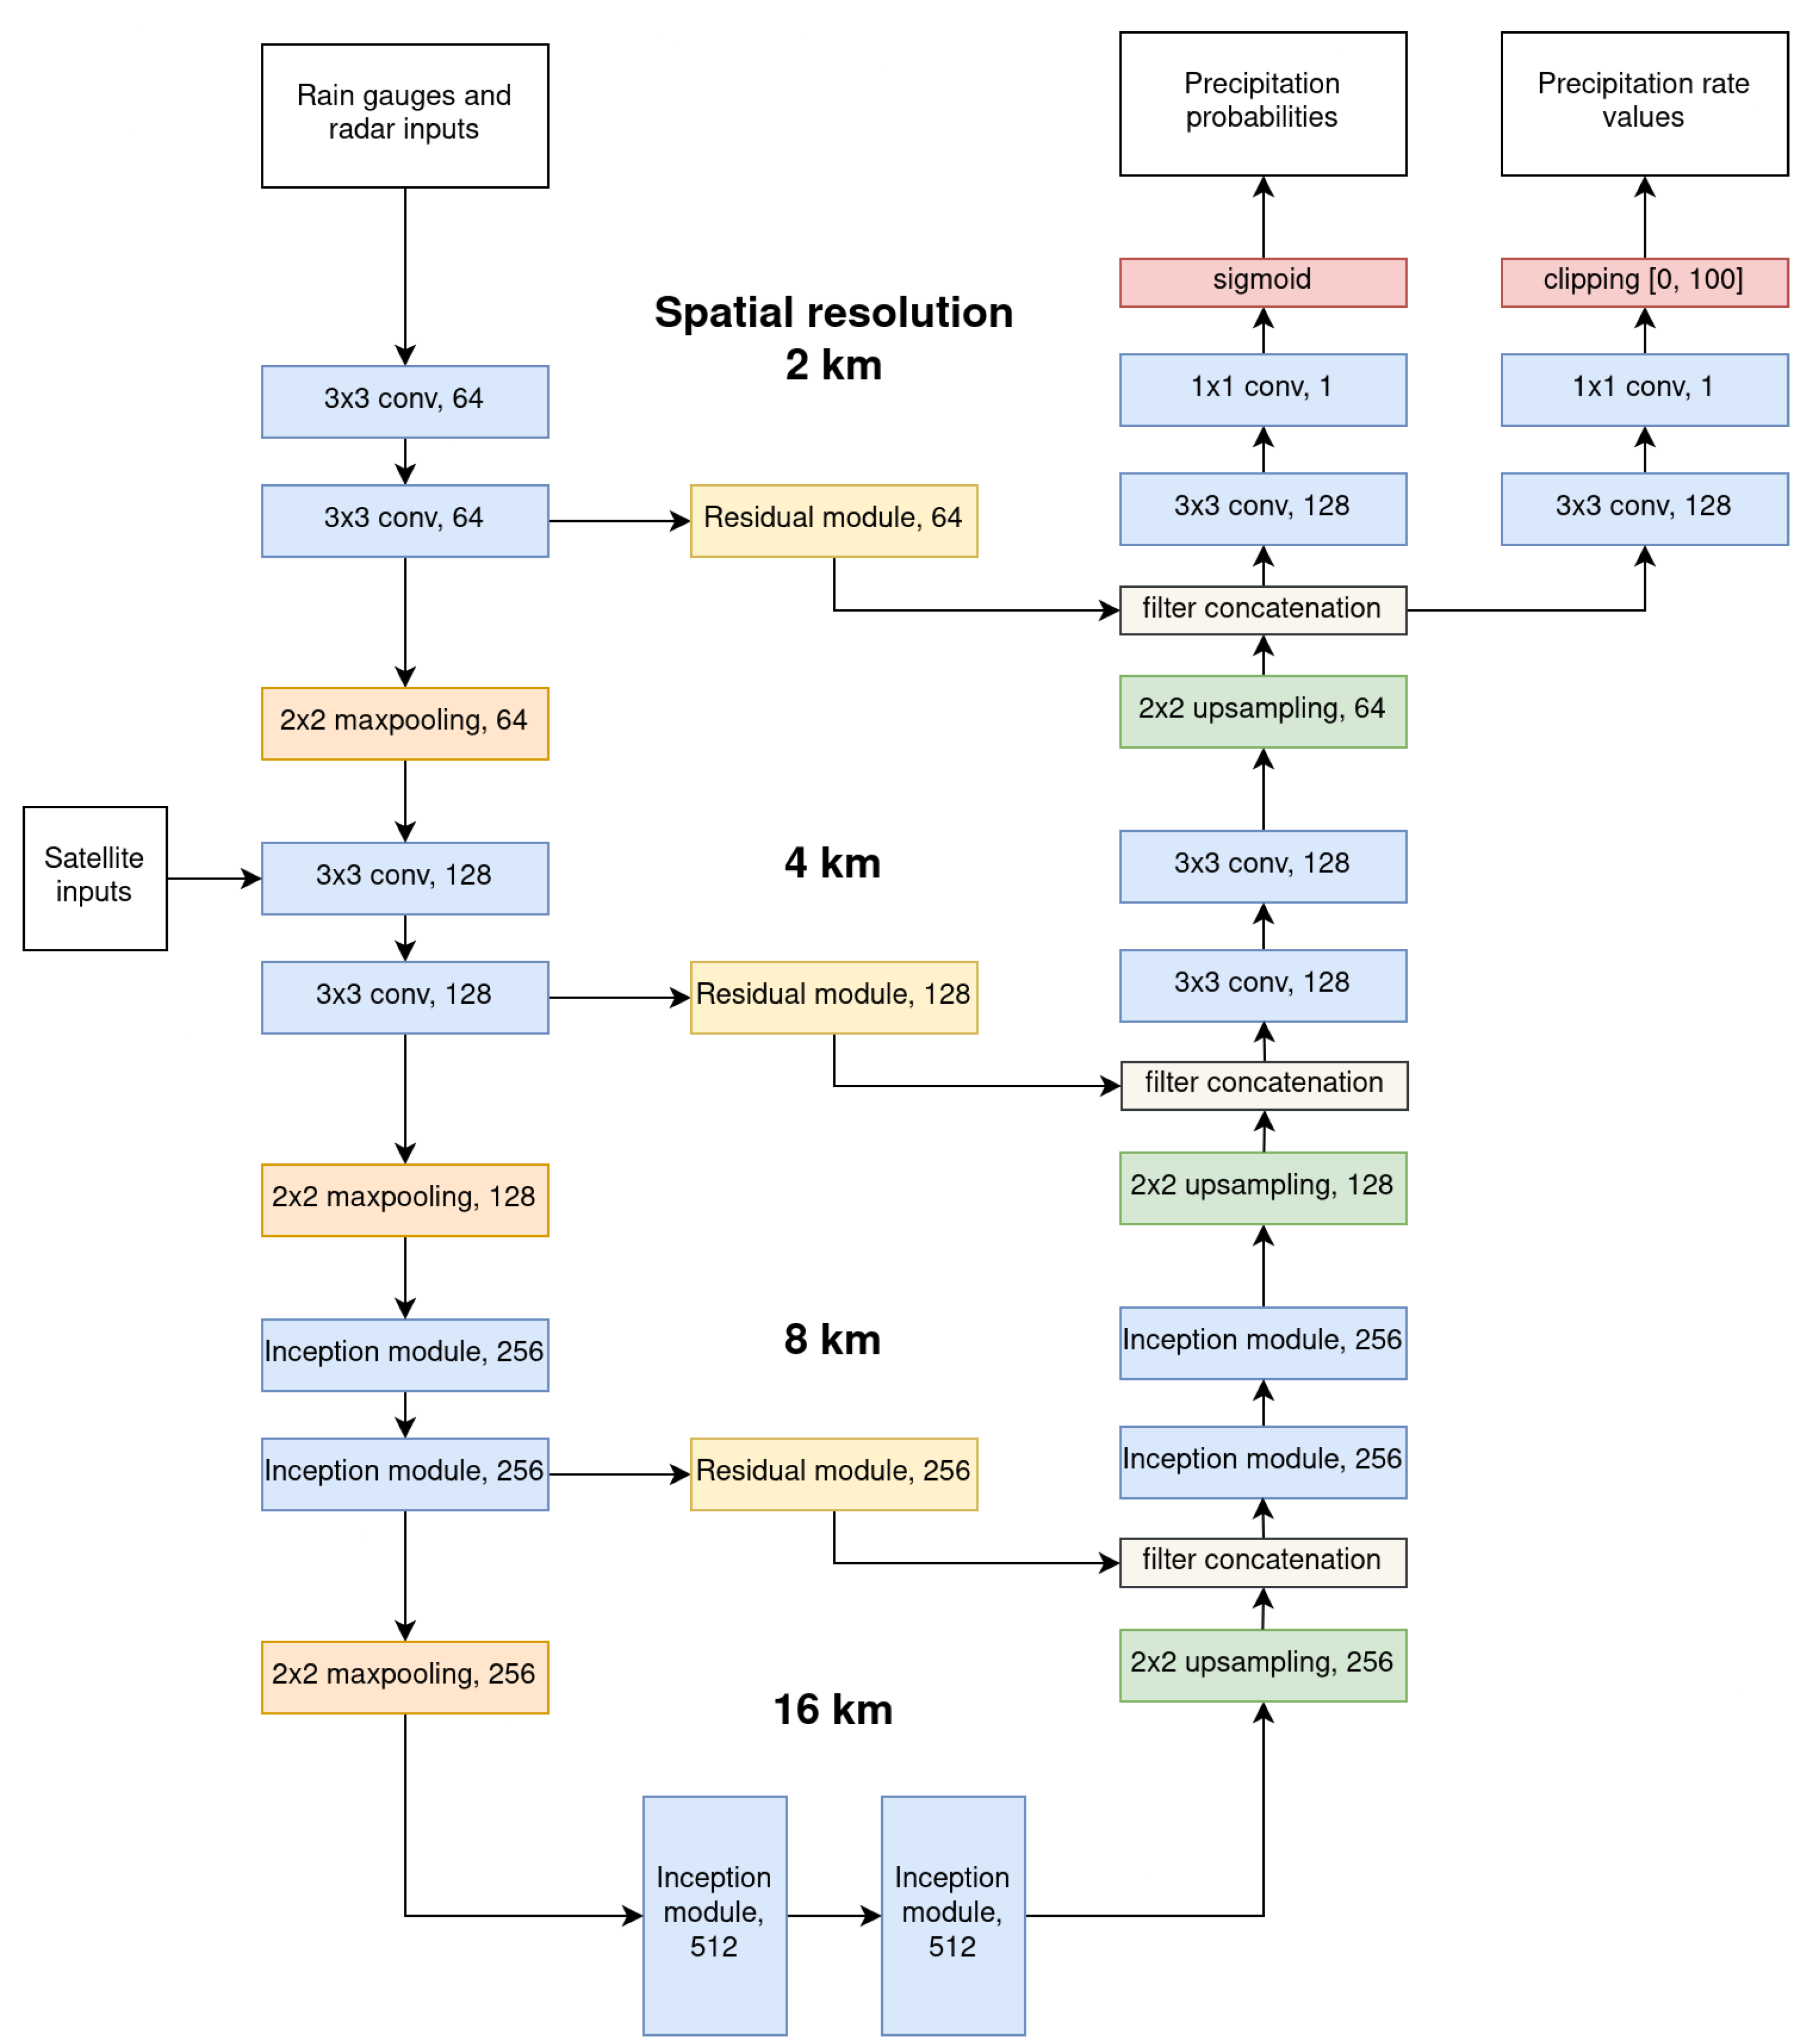
A diagram of the architecture is given in Figure 2. The inputs are first processed at a spatial resolution of 2 km by the encoder through two convolutional layers. The convolutional layers use a 3 × 3 kernel size and are followed by a batch normalization [28] and a ReLU activation function. Then, the feature map is downsampled by a factor 2 using a max pooling layer. As the satellite channels have a spatial resolution of 4 km (compared to the 2 km spatial resolution of the other inputs), they are passed to the network only after the first max pooling layer. The encoder repeats the same operation a second time before replacing the convolution layers with inception layers [29]. After having downsampled the feature map three times, for an actual downsampling of a factor 8, the feature map is upsampled back through the decoder.
The decoder upsamples the feature map using nearest-neighbour upsampling, directly followed by a 3 × 3 convolution layer. The upsampled feature map is then combined with the pre-downsampling information from the encoder, passed through a residual layer [30]. Their combination passes through two inception layers before being upsampled a second time. The encoder finishes with two layers containing a 3 × 3 convolution, a batch normalization and an ReLU activation function, followed by a final upsampling of the feature map, back to the original resolution of the encoder inputs.
Finally, the output of the decoder is passed to two different subnetworks. They both consist of a single layer of 3 × 3 convolution–batch normalization–ReLU activation function, followed by a final 1 × 1 convolutional layer reducing the feature map to a single channel. One sub-network is trained to output the probability of precipitation. The other sub-network is trained to estimate the rain rate. For a more detailed description of the architecture and its different layers, we refer the reader to our prior work [20].
It is important to note that we made a few changes compared to our previous design, described in [20]. We observed that our prior model sometimes produces grid-like artifacts in its estimations. This problem is best known in DL as the checkerboard effect, and the culprits are the transposed convolutional layers used in the decoder to increase the resolution of the feature map. We were able to resolve this problem by replacing the transposed convolutional layers with a nearest-neighbour upsampling, followed by a 3 × 3 convolution layer. Additionally, we slightly optimized the computational cost of the model by updating the inception layers. For this, we factorized the convolutions of large kernel size (5 × 5 or 7 × 7) of our previous architecture by multiple convolutions of 3 × 3 kernels [31].

2.3. Training Method

Our training strategy is similar to the one used in our previous work [20]. Namely, we use the rain gauge as target data to train the model, as rain gauge measurements can generally be considered as a ground truth for precipitation estimation. To train the model, we use our training dataset of rain gauge data and balance the dataset so that the amount of precipitation/no-precipitation measurements is equal, where precipitation events are measurements with raining rate r > 0 and no-precipitation events are measurements with r = 0 . In the same way, we build a balanced validation dataset from the validation rain gauge data and use this validation dataset for early stopping during the model’s training.
In the training/validation phase, each rain gauge from the training/validation dataset serves as a target to compute the loss function. The model uses a window of 48 × 48 pixel resolution (corresponding to a surface of 96 × 96 km²) as input, centered on the target rain gauge. All rain gauge measurements available in the input window are used as input, except for the target rain gauge, which is used to compute the loss function. Compared to our previous model [20], which expects its input data on a spatial grid with a 3 km resolution, this model uses two different spatial resolutions for its input data: we use 2 km for every input except the satellite modality, which has a 4 km resolution. In practice, this means that the satellite modality is introduced in the model after the first maxpooling layer, which is used to reduce the spatial resolution of the other modalities by a factor 2.
With its two sub-networks, our model multitasks by outputting both an estimation of the rain rate r and an estimation of the probability of precipitation P r > 0 . The estimation of r is a regression problem, while the estimation of P r > 0 is a classification problem. To train the model and perform the gradient descent, we use the mean squared error loss L m s e for regression and the binary cross-entropy loss L b c e for classification. As the mean squared error loss is only relevant for positive rain rate values, we set it to 0 for the samples with a null target rain rate. Both tasks are learned simultaneously by combining the two losses, as follows:
L = 1 σ b c e 2 L b c e + 1 2 σ m s e 2 L m s e + log σ b c e + log σ m s e
The method comes from [32], which considers the homoscedastic uncertainty of each task to allow for a combination of different losses. The parameters σ b c e and σ m s e are learnable and automatically optimized during the training of the model using the back-propagation algorithm.
We used a batch size of 256 and the Adam optimizer with a starting learning rate of 10 3 , divided by 5 every two epochs and using early stopping. The training was carried out on two RTX 2080 Ti graphic cards using the PyTorch library, which took approximately 12 epochs until convergence of the model, with each epoch taking about 4 h.
After training the model, we optimized the probability threshold needed to differentiate precipitation from no-precipitation estimations of the model. The optimization of the probability threshold was performed on the aggregated training and validation datasets and chosen to maximize the F1 score (see Section 3 for more details about this score).

2.4. Bias Reduction between Rain Gauge Networks

When working with data from multiple networks of rain gauges originating from different countries and institutions, it is likely that some discrepancies exist between them, which lead to a lack of spatial uniformity in the performance of our model. In essence, the Mean Error (ME) between the ground truth and rain estimates produced with our model depends on the underlying network of rain gauges. Indeed, in the results obtained with our model, reported in Table 1, we notice that the ME has different values for each rain gauge network, and these inter-network variations in the ME are not insignificant.
Since the offshore precipitation measurements provided by the KNMI are from weather stations, which are less accurate than rain gauges, and because we want to compare the performance over the land and over the sea, in Table 1, we make the distinction between land and sea measurements from the KNMI network.
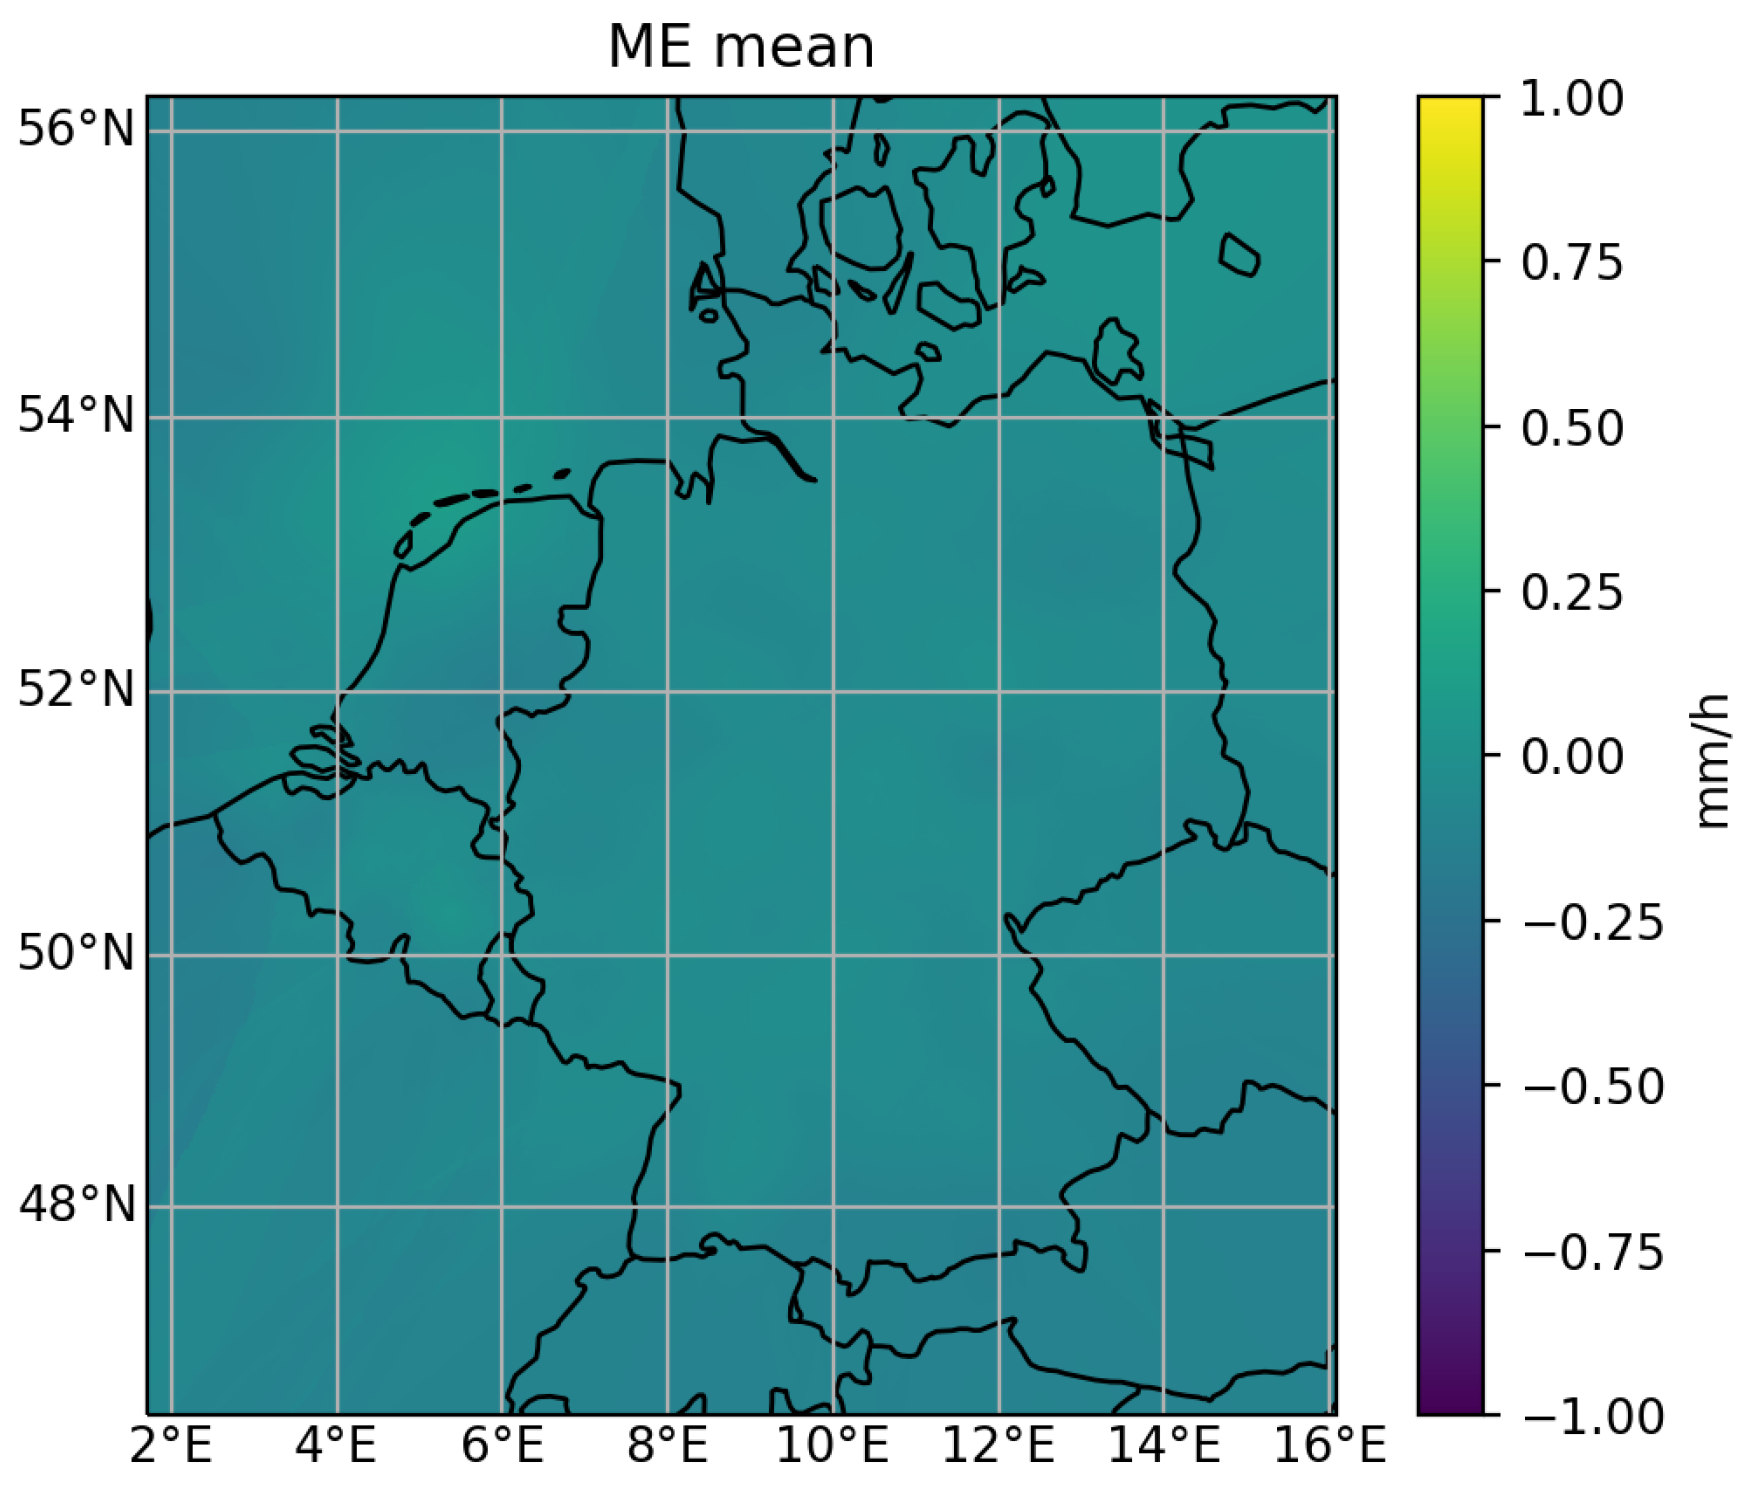
To further study the inter-network bias, we used a model that only uses the satellite modality as input. Additionally, the model is trained solely on the rain gauge measurements from the DWD network to avoid it learning any spatially dependant bias correction. Thus, this model can make estimations that are independent of the rain gauge data, and can thus be used to assess the inter-network bias. The model is used to visualize the ME spatial inhomogeneities across networks; we depict the average ME obtained with out model in Figure 3a. These results show that the ME changes significantly between the North and the South of Belgium, which are covered by different networks of rain gauges (VMM for the North of Belgium and SPW for the South of Belgium), and at the borders between each of the three studied countries, namely Belgium, the Netherlands and Germany. We can also see that a few outliers exist among the rain gauges, i.e., there are a few unusually dark or bright spots. To estimate the robustness of the measurements for each stations, we look at the standard deviation of the ME (Figure 3b). We can easily identify one main outlier, close to the western border between France and Belgium. Except for this rain gauge, the standard deviation is quite uniform across the entire dataset.
The inter-network variation in the ME obtained with this model and reported in Table 2 is correlated with the ME variation reported in Table 1. From these results, we can conclude that it should be possible to apply a correction to the rain gauge data to eliminate the inter-network bias and, in turn, have our model produce a uniform estimation across the various rain gauge networks. This is detailed as follows.

Bias Correction through the Satellite Modality

The variations in the ME observed across the different networks can be explained by different relationships between the rain gauge measurement and the actual rain rate for each network, probably due to different rain gauge device manufacturers and different calibration methods. As a consequence, to remove the ME differences between the networks, we need to apply a correction to the rain gauges measurements of each network. For this, we can apply a rescaling of the measurements of each network by multiplying them by the correcting factors α n : y n i α n y n i . To compute the correction factors α n that correspond to the bias of each network, we use the model trained on the DWD network, which takes only the satellite modality as input. We can use the ME from Table 2, obtained with this model, to compute the correction factors α n . The ME in Table 2 is determined as follows:
m e n = y n ^ ¯ y n ¯ ,
where y n ^ ¯ is the mean value of the predictions of the model for network n, y n ¯ is the mean value of the measurements for network n, and m e n is the ME of network n. We replace y n ¯ by α n y n ¯ and enforce that m e n = 0 , yielding:
α n = y n ^ ¯ y n ¯ .
The values of α n for the various networks computed from the data from the training and validation sets are reported in the Table 3. We notice that α K N M I ( s e a ) is particularly high, and far from the other α n .
In the last step, we take the DWD network, which represents our largest source of rain gauge data, as the network of reference: we normalize all α n by dividing them by α D W D , before using them to rescale the rain gauge measurements injected in our model.
The results obtained with these correction factors are shown in Figure 4. We notice from this figure that the use of these correction factors produces a uniform ME across countries and networks and removes the bias between them. This corresponds to a large improvement in the spatial uniformity of ME, as opposed to the ME map obtained when not using this bias correction scheme (see left part of Figure 3).
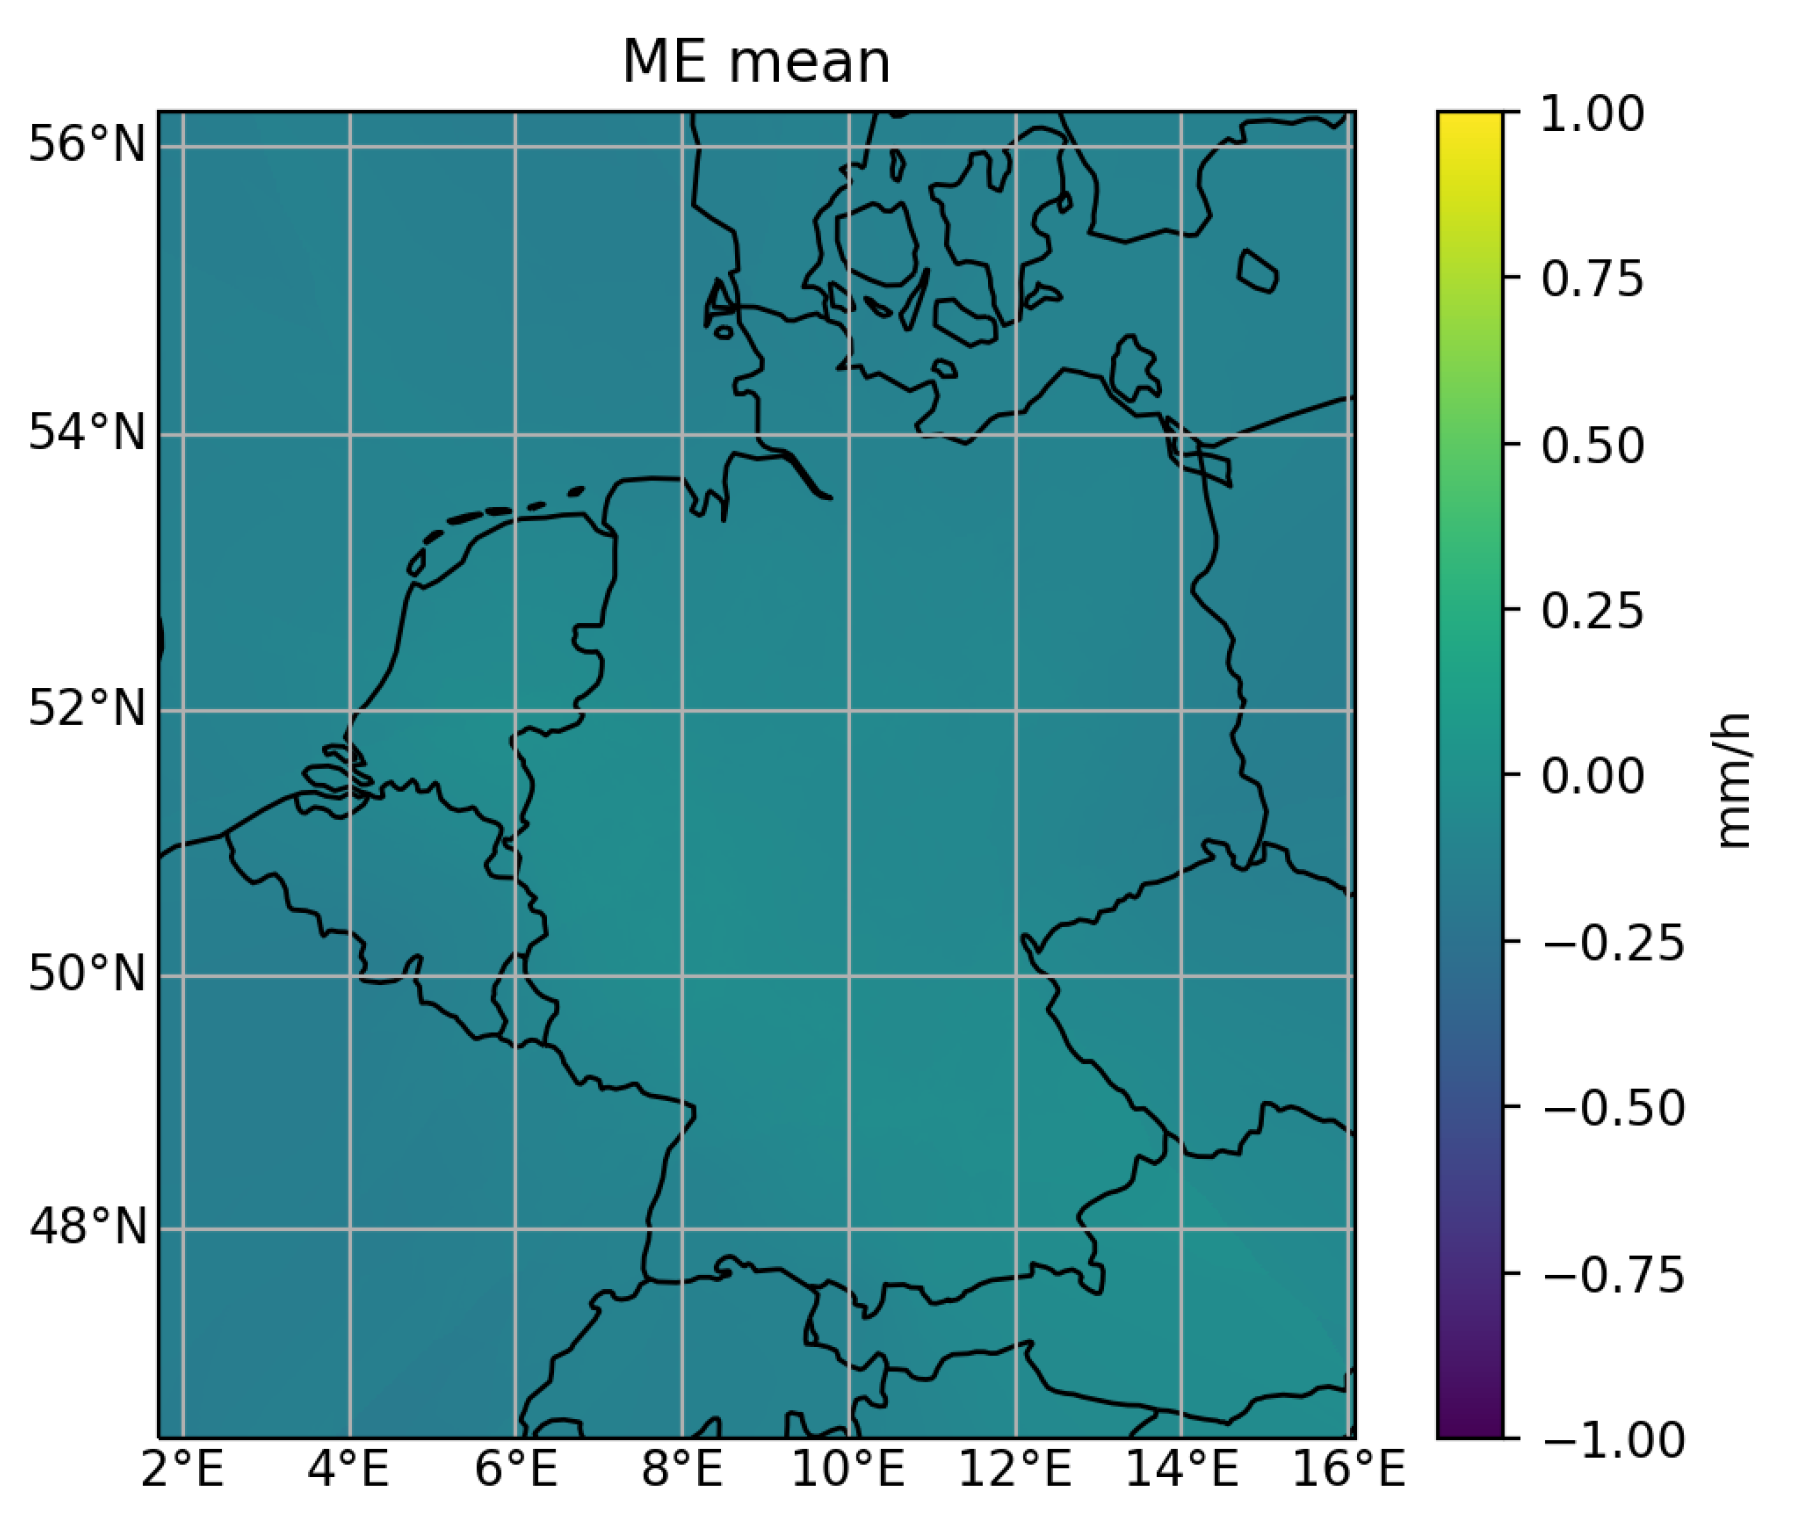
The effectiveness of our bias correction method can also be verified by comparing the inter-network variations in the ME obtained with the multimodal model, which uses bias correction (Table 4) for the variations in the ME produced by the model that does not use our bias correction method (Table 1). The interpolated map of the ME for this model also shows a good spatial uniformity (Figure 5).

3. Results

3.1. Evaluation Method

For the evaluation of our model, we use a subset of the performance metrics from our previous work [20]. The classification scores are the Probability Of Detection (POD), the False Alarm Ratio (FAR), the Probability of False Detection (POFD), the Accuracy (ACC), the Critical Success Index (CSI) and the F1 score (F1) (Table 5). These classification scores are computed from the contingency table made from observations of the rain gauges and the estimations of our model (see Table 6).
For the regression scores, we use the Mean Error (ME), the Mean Absolute Error (MAE), the Root Mean Squared Error (RMSE), the Reduction of Variance (RV) and the Pearson Correlation Coefficient (PCORR) (see Table 7 for a definition of each metric). All scores reported in the next subsections were computed individually for each test gauge, and the results were averaged across all of them.

3.2. Ablation Study

To study the effect of each modality on the performance of our model, we perform an ablation study by training and testing our model with every possible combination of the three modalities: satellite, radar and rain gauges. Depending on their inputs, each variation of our model is named as follows: DL-S (satellite), DL-G (rain gauge), DL-R (radar), DL-SG (satellite and rain gauge); DL-SR (satellite and radar), DL-GR (rain gauge and radar) and DL-SGR (satellite, rain gauge and radar). For each of these models, training and evaluation were performed using the rescaled rain gauge measurements, to reduce the inter-network bias. We test each task separately; the performance for the detection of precipitation (the classification task) and for the estimation of the rain rate (the regression task) are reported in Table 8 and Table 9, respectively. The classification scores are computed on our complete test dataset. For the regression scores, we only used the test measurements with a non-null precipitation rate ( r > 0 ).
From the performance of the DL-S, DL-G and DL-R models listed in Table 8 and Table 9, we can see that the satellite is the weakest modality for both precipitation detection and rain rate estimation. This result is to be expected because satellite imagery is the least direct method for precipitation observation of the three modalities. Both rain gauges and radar, when used alone, obtain a similar performance for precipitation detection, but the radar performs the best for rain rate estimation by a significant margin. By combining the two modalities, we expect an improvement in the performance compared to the models that use only a single modality. Combining the satellite data with an other modality slightly increases the rain detection and rain rate estimation performances that result from a from comparison between DL-SG with DL-G and DL-SR with DL-R in Table 8 and Table 9. Combining the radar with the rain gauges results in the biggest increase in performance compared to the models using each of these modalities on their own, as revealed by comparing DL-G and DL-R with DL-GR in Table 8 and Table 9. Finally, adding all three modalities together produces the best performance for precipitation detection and rain rate estimation, but the difference between DL-GR and DL-SGR is small, particularly for precipitation detection. The overall conclusion is that the combination of all modalities increases the performance, but the addition of the satellite modality offers much fewer improvements than the combination of the two other modalities together.

3.3. Comparison with OPERA

We expect our models that use the radar modality (i.e., the OPERA data) to perform better than the OPERA product. The reason for this is that when using the OPERA data as input for our model, we are actually performing a form of residual learning on the OPERA product by further improving the performance. This is confirmed by the results in Table 10, which show that our model is able to framatically increase the precipitation detection performance of the OPERA product. Note that to reduce the very large FAR from which the OPERA product suffers, we applied a thresholding to its estimation with a value of 0.12 mm/h. Under that value, the rate from OPERA is set to 0 mm/h. This threshold was optimized on the training and validation datasets, in order to maximize the F1 score.
The results for the rain rate estimation in Table 11 also show that our model performs better than the OPERA product. It is particularly interesting to see how much our model, which uses only the OPERA product as a predictor, outperforms the raw OPERA products. This demonstrates that our model can be used as an additional post-processing layer for the OPERA radar composite.

3.4. Comparison with RADOLAN

The state-of-the-art methods for instantaneous precipitation rate estimation are based on gauge-adjusted radar estimation. A good example of this type of method is the so-called RADOLAN YW product from the DWD, which is a quasi-gauge-adjusted radar composite from the DWD [27], which covers Germany with a spatial resolution of 1 km and a temporal resolution of 5 min. We compared our results to the RADOLAN YW product on the test timestamps from 2015 to 2019 on the test rain gauges from the DWD network; the results are reported in Table 12 and Table 13.
For the detection of precipitation, the comparison of our DL model with the RADOLAN product in Table 12 shows much better detection scores for our DL model.
Concerning the regression scores in Table 13, the performance from the RADOLAN product are improved compared to those of OPERA shown in Table 11. Nonetheless, the performance from our DL model still shows an improvement over RADOLAN.

3.5. Spatial Variability of the Results

Although we observed that the satellite modality does not significantly improve the performance when combined with the rain gauges and radar modalities, we expect that the satellite modality may improve the spatial uniformity of the estimation, because the quality of the satellite data is much more spatially uniform compared to the two other modalities. To compare the spatial variability of the performance, we compare each modality combination by looking at the standard deviation over all test rain gauges of each test rain gauge mean RMSE score. As the RMSE value depends on the modality combination, we also normalize the standard deviation with the mean RMSE score across all test rain gauges. In the Table 14, we see that the normalized standard deviation of the satellite modality is indeed the best of all three modalities (DL-S vs. DL-G and DL-R). Despite this, adding the satellite modality to the two other modalities does not seems to increase the spatial uniformity of the performance (DL-GR vs. DL-SGR), probably because most of our study area is well covered by the OPERA product and rain gauge networks.
However, the indisputable advantage of the satellite modality remains its ability to make estimations over the sea, while the radar composite will, at best, cover up to 150 km away from the coast, and very few in situ precipitation measurements are available in the sea (they are provided by 10 weather stations from the KNMI network, which offer less accuracy than rain gauges). As we used a 80/10/10 splitting proportion between the training, validation and test set, we only kept one weather station in the sea for our original test set (left part of Figure 1). To better evaluate the performance of the satellite modality in the sea, we retrained the model DL-S on a modified training/validation/test rain gauges split that keeps five offshore weather stations in both the training and test sets. The difference in performance between the measurements in the sea and those of the networks of rain gauges on the land is reported in Table 15. The sea and land performance for the classification task is very similar on sea and on land. The performance in the sea is actually better compared to most of the other land networks. In contrast, for the regression task, the results are much worse on the sea than on the land in terms of the MAE and the RMSE. The reason for this probably partly lies in our bias correction. Indeed, the bias correction factor for the sea rain gauges is quite large, at a value of 1.932, which skews the MAE and RMSE scores toward higher values. On the other hand, the RV and PCORR scores are unaffected by the bias correction and so are better comparison indices between each networks. The RV score for the sea rain gauges is similar to those of the land networks. The PCORR score is worst in the sea, but not by much with respect to the gauges from land networks. Unfortunately, it is impossible to certainly conclude, for out model, if the overall reduction in performance over the sea for the quantitative estimation of precipitation rate is due to the reduced accuracy of the precipitation measurements provided by the offshore weather stations, or due to our model not performing as well over sea as over land.
Overall, the conclusion for sea performance is quite positive. The precipitation detection remains as good over sea as over land. Additionally, precipitation estimation in the sea is almost exclusively possible thanks to satellite data. Hence, our DL-S model has no real competition from other precipitation estimation methods, such as OPERA, for example.

3.6. Visual Evaluation for Instantaneous Precipitation Estimation

We also perform a qualitative analysis by visualising the output from our model using all possible combinations of the three modalities. We also compare our models output to the OPERA and RADOLAN YW products.
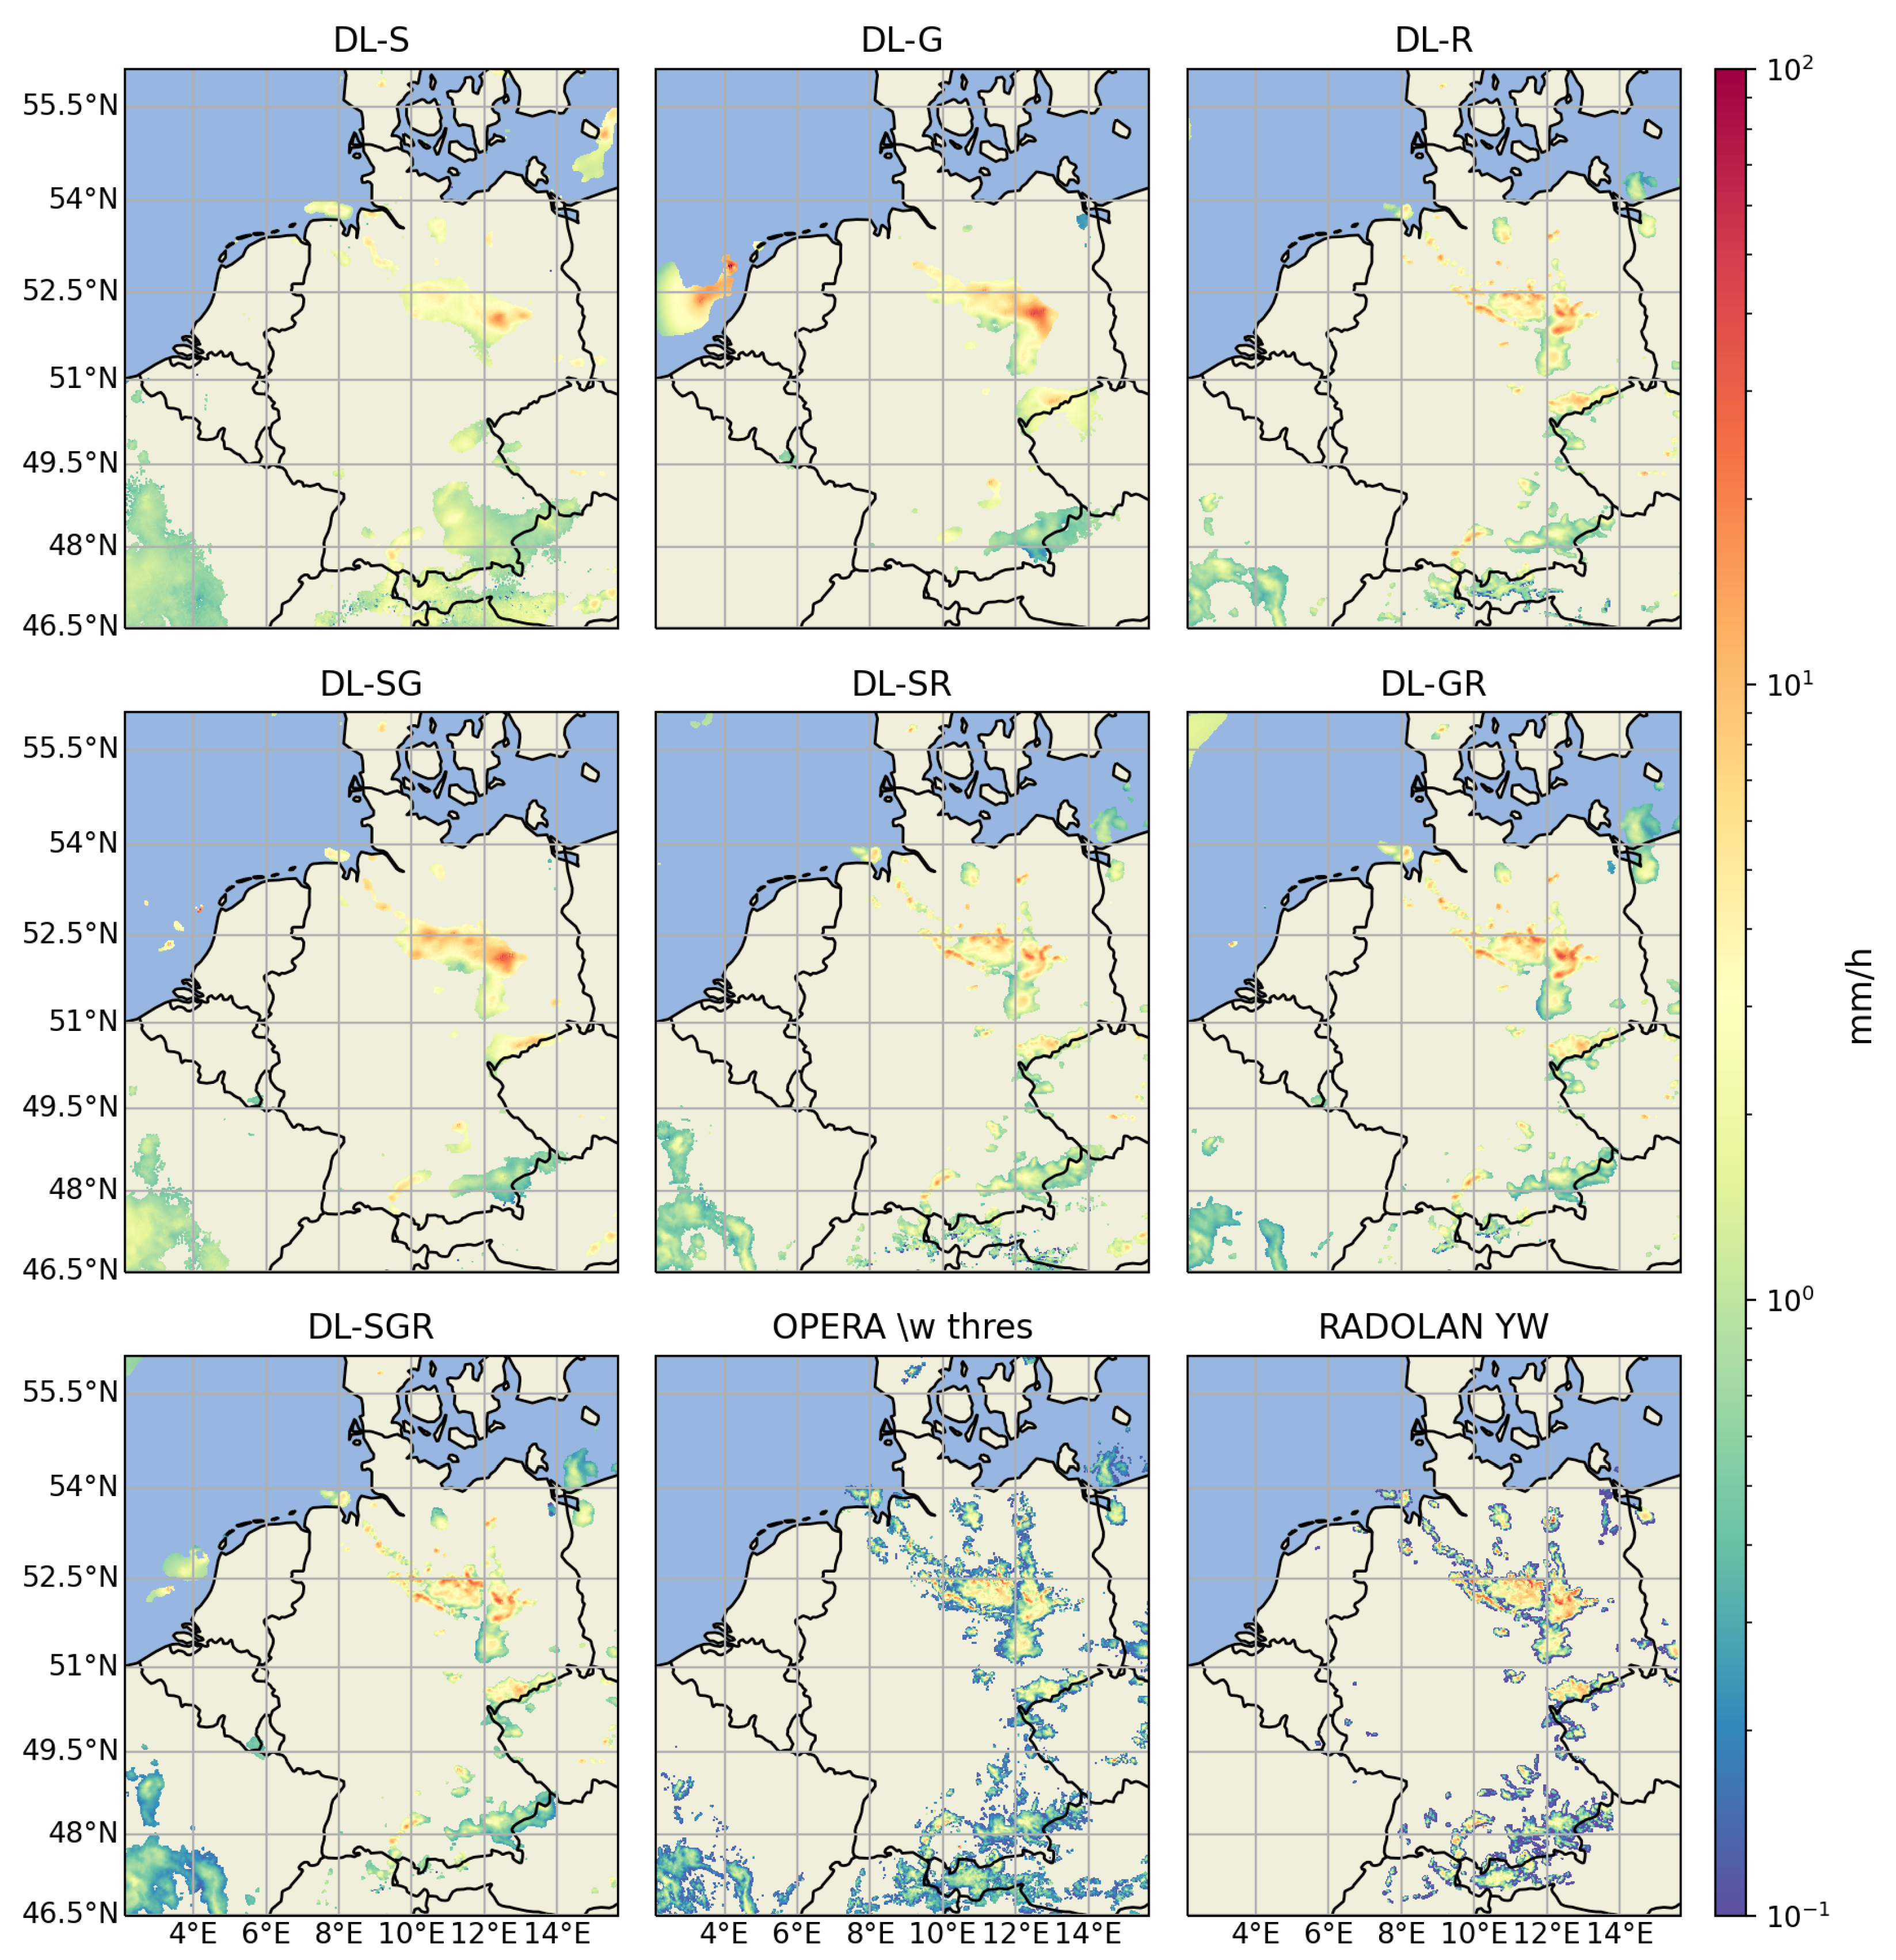
Our first case, shown in Figure 6, features convective rain. The satellite (DL-S) and radar (DL-R) models both find a similar precipitation pattern, but the satellite seems to overestimate the precipitation area, leading to a large number of false alarms. The rain gauge (DL-G) modality does not detect the precipitation in France because we do not use rain gauge data from France. The DL-G estimation also shows precipitation in the North Sea close to the Netherlands. This precipitation area is probably overestimated because of the small rain gauge density in the North Sea and because the other modalities do not indicate any precipitation in that area. Combining either the radar or the satellite modality with the rain gauge data reduces the error made over sea due to the rain gauge modality, while still detecting precipitation in France.
Comparing the precipitation map from DL-SGR to the OPERA and RADOLAN products mainly shows a significant difference concerning the contour of the precipitation areas. The edges of the precipitation areas detected by DL-SGR have higher precipitation rate values than those detected by the OPERA and RADOLAN products. Taking the results of the POD and FAR scores from Table 10 and Table 12 into account, we can deduce that DL-SGR is better at eliminating low precipitation intensity detected by the radars.
In our second study case (Figure 7), we have a large stratiform precipitation area covering Germany and France, and some convective rain over the North Sea. Comparing the rain rate map estimated by DL-S to the one from OPERA, we see that the satellite does not properly estimate the large stratiform area in its entirety, but is able to detect precipitation over the North Sea, above the radar range, and which are, therefore, missed by OPERA. The DL-G estimation does not show any precipitation in the North Sea, which is probably due to the sparsity of the rain gauges in that area. Combining the radar and satellite together is successful because we can accurately perceive both the stratiform rain across France and Germany and the convective rain in the North Sea.
RADOLAN does not detect the precipitation area in Denmark that appears in the OPERA and the DL-SGR estimations. The most probable explanation for this is that this area is too far away from the radars used by the DWD to produce the RADOLAN product.

3.7. Daily Precipitation Accumulation Estimation Performance

For climatological studies, instantaneous precipitation rate is less useful than total precipitation accumulation on long timescales of the order of a day, a month, a season or even a year. We evaluate the performance of our model on daily total precipitation accumulation using the RMIB network of climatological rain gauges which contains 272 rain gauges, manually checked on a daily basis, spread across the Belgian territory.
The OPERA product and all of our models show a tendency to underestimate the daily precipitation, with an ME value of approximately 0.5 mm/day, except for the DL-S model, which has a better ME of 0.111 mm/day (Table 16). The mean daily precipitation accumulation of the climatological rain gauges is 2.141 mm/day, so it is important to reduce the ME of our models. To correct this bias, we compute a correction coefficient for the daily precipitation accumulation based on Equation (2), using the climatological rain gauges measurements from the training and validation dates. Then, we correct the daily precipitation accumulation estimation of our model and the OPERA product by multiplying their value by the correction coefficient, i.e., y c o r r ^ = α n y ^ . The results are displayed in Table 17.
Comparing the ME in both Table 16 and Table 17 shows the effectiveness of our bias reduction method. From Table 17, we can draw similar conclusions to those made for the instantaneous precipitation rate performance of our models. Every score (except the ME) is improved for each addition of modality and the hierarchy of performance between each modality is maintained: the radar is superior to the rain gauge, which is itself superior to satellite.

4. Discussion

This work builds on our previous designs in [20], which successfully introduced a multiscale, multimodal deep learning method for precipitation detection and quantity estimation based on rain gauges measurements and satellite imagery. In this work we proposed an upgraded version of our model that also uses radar data, leading to an important improvement in the estimation accuracy. Section 3 reports the performance obtained with every combination of the three different modalities (rain gauge, satellite and radar), with the OPERA radar composite for instantaneous precipitation detection and rain rate estimation, and for daily total precipitation accumulation.
We have limited our study to Belgium, the Netherlands and Germany, but our method could easily be broadened to the whole of Europe. Indeed, the satellite data from SEVIRI are usable on the whole European continent, and their quality will only degrade on very high-latitude countries such as Norway, Sweden or Finland. The OPERA radar composite is available for the large majority of European countries, and automatic rain gauge data are available in every country; only the density of the rain gauges networks may fluctuate.
The newest results obtained by our deep learning model when using the three different modalities show a significant improvement compared to the results obtained with the subset of modalities (rain gauge and satellite) used in our previous work [20]. The addition of the radar modality raised our precipitation detection F1 score from 0.726 to 0.771, and reduced the RMSE score of the precipitation rate estimation from 1.704 mm/h to 1.488 mm/h. For daily total precipitation accumulation, we lowered the RMSE from 2.045 mm down to 1.826 mm. In addition to the significant improvement in performance, our model has also improved the spatial resolution of its estimation: it is now 2 km, while it was 3 km previously in [20].
We have also demonstrated the ability of our method to significantly improve the performance of the OPERA radar composite through the addition of rain gauge and infrared satellite data, with an improvement in the F1 score from 0.590 up to 0.771 for the detection of precipitation and an improvement in the RMSE from 1.872 mm/h down to 1.488 mm/h for the precipitation rate estimation. Our results also show an improvement over the quasi-gauge-adjusted RADOLAN YW product for instantaneous precipitation detection, with an F1 score of 0.598 (RADOLAN) vs. 0.897 (ours), and rate estimation, with an RMSE of 1.788 mm/h (RADOLAN) vs. 1.140 mm/h (ours). Additionally, putting the modality merging aspect of our method aside, we have also demonstrated the ability of the proposed method to improve the performance of the OPERA radar composite by performing residual learning: after training a model that only uses the OPERA radar composite as input, we obtain a large improvement in performance compared to the raw OPERA product, with an F1 score increase from 0.590 to 0.701, a decrease in the RMSE from 1.872 mm/h to 1.611 mm/h for instantaneous precipitation, and a decrease from 2.872 mm down to 2.211 mm for the daily total accumulation precipitation. These results can be explained by the fact that ML learning methods are able to capture data dependencies that are intractable by physical models; in the case of precipitation estimation from the radar reflectivity, ML models can move beyond the simple Marshall–Palmer equation [33].
The results of our ablation study proved the effectiveness of our deep learning model for merging the different modalities. Each addition of a modality to the list of the predictors used by our model increases the accuracy of the precipitation estimation. Another conclusion is that the rain gauge and the radar modalities are the most important to obtain the best accuracy. Adding the satellite to the two other modalities does not significantly increase the performance if the density of the rain gauges is high and the radar coverage is good. However, we also showed that the addition of the satellite modality is justified if we want to make estimations in areas that are not well covered by rain gauges and radars, such as the sea, for example.
It is important to point out that adding the radar modality is not the only substantial change introduced to improve performance. We removed a grid-like artifact, also known as the checkerboard effect, from the estimations of our model; this was achieved by replacing the transposed convolution layers by nearest-neighbour upsampling, followed by a 3 × 3 convolution layer. Compared to [20], we also optimized our model by updating our inception layers to the version from [31].
Finally, regarding the rain gauge measurements that originate from different rain gauges networks, we observed significant differences in their bias and we proposed a solution to this problem. We calculated correction coefficients for each rain gauges network using a model that makes estimates independently from rain gauges. This model uses only the satellite imagery data as predictor and was trained on a single rain gauges network (the German network). The bias correction scheme demonstrates a uniform distribution of the ME across countries and networks and removes the bias between them.

5. Conclusions

In this paper, we have demonstrated the ability of a deep learning method for merging precipitation measurements from rain gauges, radars and a GEO satellite infrared radiometer. By combining these three precipitation measurement modalities, our deep learning model has been able to significantly iprove the performance for instantaneous precipitation detection and precipitation rate estimation over each of the initial inputs. Notably, we have shown that our model greatly improves the performance of the OPERA radar composite through residual learning. These results show great promise for other deep learning applications to meteorological problems by using a similar residual learning scheme, i.e., by building the deep learning method on top of a traditional method.
As a further scope, we could apply our method to the entirety of Europe. OPERA offers a good radar composite of most of the European countries, and SEVIRI covers the entirety of Europe. The only limitation is access to rain gauge data. Fortunately, rain gauge data from European countries are increasingly accessible as open data. The significant results obtained for instantaneous precipitation detection and precipitation rate estimation by our multimodal deep learning method also motivates an extension of the study to nowcasting. In addition, our proposed method could be adapted to focus on precipitation accumulation estimation, rather than on instantaneous precipitation estimation.
The method described in this paper can be applied to any new area. The main limitation is the availability of rain gauge data, because the deep learning model will need to be retrained on the new area. This is necessary to allow the model to adapt to the different viewing angle from the satellite.

Author Contributions

Conceptualization for the implementation of the radar data, S.D., A.M. (Adrian Munteanu), A.M. (Arthur Moraux) and B.C.; Updates of the architecture compared to our previous work, A.M. (Arthur Moraux); Bias correction conceptualization, A.M. (Adrian Munteanu), S.D., B.C. and A.M. (Arthur Moraux); Data preparation and software implementation, A.M. (Arthur Moraux); Writing, A.M. (Arthur Moraux); Review and editing, B.C., S.D. and A.M. (Adrian Munteanu). All authors have read and agreed to the published version of the manuscript.

Funding

This research was funded by the Royal Meteorological Institute of Belgium and the Solar Terrestrial Center of Excellence.

Institutional Review Board Statement

Not applicable.

Informed Consent Statement

Not applicable.

Acknowledgments

We would like to thanks all the external organizations providing us the data used in this study, i.e., EUMETSAT for the SEVIRI data, EUMETNET for the OPERA composite, Vlaamse Milieumaatschappij (VMM), Service Public de Wallonie (SPW), the Koninklijk Nederlands Meteorologisch Instituut (KNMI), the Deutscher Wetterdienst (DWD) for the automatic rain gauge data, and the DWD for the quasi-gauge adjusted radar product RADOLAN YW.

Conflicts of Interest

The authors declare no conflict of interest.

Abbreviations

The following abbreviations are used in this manuscript:
General abbreviations
LEOLow Earth Orbit
GEOGeostationnary Earth Orbiting
SEVIRISpinning Enhanced Visible and Infrared Imager
DLDeep Learning
CNNConvolutional Neural Network
RMIBRoyal Meteorological Institute of Belgium
KNMIKoninklijk Nederlands Meteorologisch Instituut
DWDDeutscher Wetterdienst
EUMETNETthe European Meteorological Network
DL-Smodel using the satellite modality as input
DL-Gmodel using the rain gauge modality as input
DL-Rmodel using the radar modality as input
DL-SGmodel using the satellite and rain gauge modalities as input
DL-SRmodel using the satellite and radar modalities as input
DL-GRmodel using the rain gauge and radar modalities as input
DL-SGRmodel using the satellite, rain gauge and radar modalities as input
Scores abbreviations
PODProbability Of Detection
FARFalse Alarm Ratio
POFDProbability Of False Detection
ACCAccuracy
CSICritical Success Index
F1F1 score
MEMean Error
MAEMean Absolute Error
RMSERoot Mean Squared Error
RVReduction of Variance
PCORRPearson Correlation

References

  1. Foresti, L.; Reyniers, M.; Seed, A.; Delobbe, L. Development and verification of a stochastic precipitation nowcasting system for urban hydrology in Belgium. Hydrol. Earth Syst. Sci. 2016, 20, 505–527. [Google Scholar] [CrossRef] [Green Version]
  2. WMO. Guide to Instruments and Methods of Observation: Volume I—Measurement of Meteorological Variables; WMO: Geneva, Switzerland, 2018; pp. 221–224. [Google Scholar]
  3. Villarini, G.; Mapaka, P.V.; Krajewski, W.F.; Moore, R.J. Rainfall and sampling uncertainties: A rain gauge perspective. J. Geophys. Res. 2008, 113. [Google Scholar] [CrossRef]
  4. Villarini, G.; Krajewski, W.F. Review of the Different Sources of Uncertainty in Single Polarization Radar-Based Estimates of Rainfall. Surv. Geophys. 2010, 31, 107–129. [Google Scholar] [CrossRef]
  5. Krajewski, W.F.; Villarini, G.; Smith, J.A. RADAR-Rainfall Uncertainties. Bull. Am. Meteorol. Soc. 2010, 91, 87–94. [Google Scholar] [CrossRef]
  6. Chandrasekar, V.; Keränen, R.; Lim, S.; Moisseev, D. Recent advances in classification of observations from dual polarization weather radars. Atmos. Res. 2013, 119, 97–111. [Google Scholar] [CrossRef]
  7. Ochoa-Rodriguez, S.; Wang, L.-P.; Willems, P.; Onof, C. A review of radar-rain gauge data merging methods and their potential for urban hydrological applications. Water Resour. Res. 2019, 55, 6356–6391. [Google Scholar] [CrossRef]
  8. Goudenhoofdt, E.; Delobbe, L. Generation and Verification of Rainfall Estimates from 10-Yr Volumetric Weather Radar Measurements. J. Hydrometeorol. 2016, 17, 1223–1242. [Google Scholar] [CrossRef]
  9. Kidd, C.; Kniveton, D.R.; Todd, M.C.; Bellerby, T.J. Satellite rainfall estimation using combined passive microwave and infrared algorithms. J. Hydrometeorol. 2003, 4, 1088–1104. [Google Scholar] [CrossRef]
  10. Kidd, C. Satellite rainfall climatology: A review. Int. J. Climatol. 2001, 21, 1041–1066. [Google Scholar] [CrossRef]
  11. Tao, Y.; Gao, X.; Ihler, A.; Sorooshian, S.; Hsu, K. Precipitation Identification with Bispectral Satellite Information Using Deep Learning Approaches. J. Hydrometeorol. 2017, 18, 1271–1283. [Google Scholar] [CrossRef]
  12. Nguyen, P.; Ombadi, M.; Sorooshian, S.; Hsu, K.; AghaKouchak, A.; Braithwaite, D.; Ashouri, H.; Thorstensen, A.R. The PERSIANN family of global satellite precipitation data: A review and evaluation of products. Hydrol. Earth Syst. Sci. 2018, 22, 5801–5816. [Google Scholar] [CrossRef] [Green Version]
  13. Chen, H.; Chandrasekar, V.; Cifelli, R.; Xie, P. A machine learning system for precipitation estimation using satellite and ground radar network observations. IEEE Trans. Geosci. Remote. Sens. 2019, 58, 982–994. [Google Scholar] [CrossRef]
  14. Sadeghi, M.; Asanjan, A.A.; Faridzad, M.; Nguyen, P.; Hsu, K.; Sorooshian, S.; Braithwaite, D. PERSIANN-CNN: Precipitation Estimation from Remotely Sensed Information Using Artificial Neural Networks–Convolutional Neural Networks. J. Hydrometeorol. 2019, 20, 2273–2289. [Google Scholar] [CrossRef]
  15. Hayatbini, N.; Kong, B.; Hsu, K.-l.; Nguyen, P.; Sorooshian, S.; Stephens, G.; Fowlkes, C.; Nemani, R.; Ganguly, S. Conditional Generative Adversarial Networks (cGANs) for Near Real-Time Precipitation Estimation from Multispectral GOES-16 Satellite Imageries—PERSIANN-cGAN. Remote Sens. 2019, 11, 2193. [Google Scholar] [CrossRef] [Green Version]
  16. Rosenfeld, D.; Lensky, I.M. Satellite-Satellite-based insights into precipitation formation processes in continental and maritime convective clouds. Bull. Am. Meteorol. Soc. 1998, 79, 2457–2476. [Google Scholar] [CrossRef] [Green Version]
  17. Lensky, I.M.; Rosenfeld, D. Clouds-aerosols-precipitation satellite analysis tool (CAPSAT). Atmos. Chem. Phys. 2008, 8, 6739–6753. [Google Scholar] [CrossRef] [Green Version]
  18. Roebeling, R.A.; Holleman, I. SEVIRI rainfall retrieval and validation using weather radar observations. J. Geophys. Res. Atmos. 2009, 114. [Google Scholar] [CrossRef]
  19. Schmetz, J.; Pili, P.; Tjemkes, S.; Just, D.; Kerkmann, J.; Rota, S.; Ratier, A. An introduction to Meteosat second generation (MSG). Bull. Am. Meteorol. Soc. 2002, 83, 977–992. [Google Scholar] [CrossRef]
  20. Moraux, A.; Dewitte, S.; Cornelis, B.; Munteanu, A. Deep Learning for Precipitation Estimation from Satellite and Rain Gauges Measurements. Remote Sens. 2019, 11, 2463. [Google Scholar] [CrossRef] [Green Version]
  21. Goudenhoofdt, E.; Delobbe, L. Evaluation of radar-gauge merging methods for quantitative precipitation estimates. Hydrol. Earth Syst. Sci. 2009, 13, 195–203. [Google Scholar] [CrossRef] [Green Version]
  22. LeCun, Y.; Bengio, Y.; Hinton, G. Deep learning. Nature 2015, 521, 436. [Google Scholar] [CrossRef]
  23. Reichstein, M.; Camps-Valls, G.; Stevens, B.; Jung, M.; Denzler, J.; Carvalhais, N. Prabhat Deep learning and process understanding for data-driven Earth system science. Nature 2019, 566, 195–204. [Google Scholar] [CrossRef]
  24. Liu, Y.; Minh Nguyen, D.; Deligiannis, N.; Ding, W.; Munteanu, A. Hourglass-shapenetwork based semantic segmentation for high resolution aerial imagery. Remote Sens. 2017, 9, 522. [Google Scholar] [CrossRef] [Green Version]
  25. Saltikoff, E.; Haase, G.; Delobbe, L.; Gaussiat, N.; Martet, M.; Idziorek, D.; Leijnse, H.; Novák, P.; Lukach, M.; Stephan, K. OPERA the radar project. Atmosphere 2019, 10, 320. [Google Scholar] [CrossRef] [Green Version]
  26. Park, S.; Berenguer, M.; Sempere-Torres, D. Long-term analysis of gauge-adjusted radar rainfall accumulations at European scale. J. Hydrol. 2019, 573, 768–777. [Google Scholar] [CrossRef] [Green Version]
  27. Winterrath, T.; Brendel, C.; Hafer, M.; Junghänel, T.; Klameth, A.; Lengfeld, K.; Walawender, E.; Weigl, E.; Becker, A. RADKLIM Version 2017.002: Reprocessed Quasi Gauge-Adjusted Radar Data, 5-Minute Precipitation Sums (YW); Deutscher Wetterdienst: Offenbach, Germany, 2018. [Google Scholar] [CrossRef]
  28. Ioffe, S.; Szegedy, C. Batch normalization: Accelerating deep network training by reducing internal covariate shift. In Proceedings of the 32nd International Conference on Machine Learning, Lille, France, 6–11 July 2015; pp. 448–456. [Google Scholar]
  29. Szegedy, C.; Liu, W.; Jia, Y.; Sermanet, P.; Reed, S.; Anguelov, D.; Erhan, D.; Vanhoucke, V.; Rabinovich, A. Going Deeper with Convolutions. In Proceedings of the 2015 IEEE Conference on Computer Vision and Pattern Recognition (CVPR), Boston, MA, USA, 7–12 June 2015; pp. 1–9. [Google Scholar]
  30. He, K.; Zhang, X.; Ren, S.; Sun, J. Deep residual learning for image recognition. In Proceedings of the 2016 IEEE Conference on Computer Vision and Pattern Recognition (CVPR), Las Vegas, NV, USA, 27–30 June 2016; pp. 770–778. [Google Scholar]
  31. Szegedy, C.; Vanhoucke, V.; Ioffe, S.; Shlens, J.; Wojna, Z. Rethinking the inception architecture for computer vision. In Proceedings of the 2016 IEEE Conference on Computer Vision and Pattern Recognition (CVPR), Las Vegas, NV, USA, 27–30 June 2016; pp. 2818–2826. [Google Scholar]
  32. Kendall, A.; Gal, Y.; Cipolla, R. Multi-task learning using uncertainty to weigh losses for scene geometry and semantics. In Proceedings of the IEEE Conference on Computer Vision and Pattern Recognition, Salt Lake City, UT, USA, 18–23 June 2018; pp. 7482–7491. [Google Scholar]
  33. Marshall, J.S. The distribution of raindrops with size. J. Meteor. 1948, 5, 165–166. [Google Scholar] [CrossRef]
Figure 1. Visualization of the three modalities of data source used as input, and also target for the rain gauges (a). The OPERA rain rate composite (b) and the SEVIRI 24-h cloud microphysics RGB (c) images are from 29 September 2019 12:55:00.
Remotesensing 13 03278 g001
Figure 2. The architecture of our multiscale convolutional model. Each block defines the type of layer and number of filters.
Remotesensing 13 03278 g002
Figure 3. Map of the average ME (a), and the standard deviation of the ME (b), for the estimation of the satellite model trained on the DWD network. The map is interpolated from the ME mean and standard deviation values of every rain gauge used in our study.
Remotesensing 13 03278 g003
Figure 4. Map of the average ME for the satellite model trained on the DWD network, using our bias correction method.
Remotesensing 13 03278 g004
Figure 5. Map of the average ME, for the model using the three modalities of data (satellite, radar and rain gauges), using our bias correction method.
Remotesensing 13 03278 g005
Figure 6. The estimation map made by our model with each different combinations of the three modalities, and the rain rate map of OPERA with a minimum rain rate value thresholding, and the RADOLAN YW product, for 31 May 2016 17:40.
Remotesensing 13 03278 g006
Figure 7. The estimation map made by our model with each different combinations of the three modalities, and the rain rate map of OPERA with a minimum rain rate value thresholding, and the RADOLAN YW product, for 27 October 2019 17:25.
Remotesensing 13 03278 g007
Table 1. The test ME (in mm/h) for each network of rain gauges for the rain estimates produced by the model when using the three modalities of data (satellite, radar and rain gauges) using the non-null rain rate values. As a reference, the mean rain rate of the test rain gauges for the non-null measurements is 0.988 mm/h.
RMIBSPWVMMKNMI (Land)KNMI (Sea)DWD
ME mean−0.191−0.442−0.1540.1770.203−0.074
Table 2. The test ME (in mm/h) for each network of rain gauges for the rain estimates produced by the model when using only the satellite modality and trained only on the DWD network of rain gauges.
RMIBSPWVMMKNMI (Land)KNMI (Sea)DWD
ME mean−0.330−0.581−0.1210.3070.378−0.089
Table 3. The values of the rain gauge measurements rescaling factors α n for each network.
RMIBSPWVMMKNMI (Land)KNMI (Sea)DWD
α 0.8090.6410.8611.3721.8190.941
Table 4. The test ME (in mm/h) of each network of rain gauges, for the model using the three modalities of data (satellite, radar and rain gauges), using our bias correction method.
RMIBSPWVMMKNMI (Land)KNMI (Sea)DWD
ME mean−0.154−0.069−0.0010.2180.077−0.017
Table 5. The classification scores equation, value range and optimum value. The F1 score is calculated from the precision P and the recall R.
EquationRangeOptimum
POD t p t p + f n [0, 1]1
FAR f p f p + t p [0, 1]0
POFD f p f p + t n [0, 1]0
ACC t p + t n t p + f p + t n + f n [0, 1]1
CSI t p t p + f p + f n [0, 1]1
F1 2 · P · R P + R with P = t p t p + t n , R = t p t p + f n [0, 1]1
Table 6. Contingency table between the observations and the estimations, recording the number of true negatives t n , the number of false negatives f n , the number of false positives f p and the number of true positives t p .
Observations
r = 0r > 0
Estimationsr = 0 t n f n
r > 0 f p t p
Table 7. The regression scores equation, value range and optimum value. y i is an observation and y ^ i is its estimation.
EquationRangeOptimum
ME 1 N i = 1 N ( y ^ i y i ) [ , ]0
MAE 1 N i = 1 N | y ^ i y i | [ 0 , ]0
RMSE 1 N i = 1 N ( y ^ i y i ) 2 [ 0 , ]0
RV 1 1 N i = 1 N ( y ^ i y i ) 2 s y 2 with s y 2 = 1 N i = 1 N ( y i y ¯ ) 2 [ , 1]1
PCORR 1 N i = 1 N ( y ^ i y ^ ¯ ) ( y i y ¯ ) s y ^ · s y [−1, 1]1
Table 8. Classification scores averaged on the automatic test stations.
DL-SDL-GDL-RDL-SGDL-SRDL-GRDL-SGR
POD0.5780.6740.7000.6930.7240.7760.788
FAR0.5320.2440.2860.2330.2870.2350.243
POFD0.0580.0190.0250.0180.0250.0210.022
ACC0.9140.9570.9540.9590.9560.9640.964
CSI0.3470.5540.5410.5720.5590.6270.629
F10.5130.7110.7010.7260.7160.7690.771
Table 9. Regression scores averaged on the automatic test stations. The ME, the MAE and the RMSE are expressed in mm/h.
DL-SDL-GDL-RDL-SGDL-SRDL-GRDL-SGR
ME−0.170−0.0950.109−0.0650.0590.034−0.082
MAE0.7760.6590.6880.6530.6630.5900.557
RMSE1.8461.7591.6111.7041.5891.5161.488
RV0.1410.2440.3400.2710.3590.4180.445
PCORR0.4330.5040.6370.5540.6340.6830.688
Table 10. Classification scores comparison between OPERA and our DL-R and DL-SGR models.
OPERADL-RDL-SGR
POD0.6040.7000.788
FAR0.4070.2860.243
POFD0.0370.0250.022
ACC0.9340.9540.964
CSI0.4220.5410.629
F10.5900.7010.771
Table 11. Regression scores comparison between OPERA and our DL-R and DL-SGR models. The ME, the MAE and the RMSE are expressed in mm/h.
OPERADL-RDL-SGR
ME−0.4280.109−0.082
MAE0.7210.6880.557
RMSE1.8721.6111.488
RV0.0550.3400.445
PCORR0.5050.6370.688
Table 12. Classification scores comparison between RADOLAN YW and our DL-SGR model on the automatic test stations from the DWD network.
DL-SGRRADOLAN YW
POD0.9050.545
FAR0.1090.319
POFD0.0110.022
ACC0.9830.942
CSI0.8180.432
F10.8970.598
Table 13. Regression scores comparison between RADOLAN YW and our DL-SGR model on the automatic test stations from the DWD network. The ME, the MAE and the RMSE are expressed in mm/h.
DL-SGRRADOLAN YW
ME0.140−0.207
MAE0.3950.722
RMSE1.1401.788
RV0.6390.012
PCORR0.8850.566
Table 14. RMSE statistics (the standard deviation, the mean and the standard deviation normalized by the mean) across all test stations.
DL-SDL-GDL-RDL-SGDL-SRDL-GRDL-SGR
std0.1040.1100.0930.1030.0890.0880.084
mean0.8340.6790.7150.6790.6840.6040.576
std/mean0.1250.1620.1300.1520.1300.1450.146
Table 15. Classification and regression scores comparison between the different networks of rain gauges for the DL-S model. The ME, the MAE and the RMSE are expressed in mm/h.
KNMI (Sea)KNMI (Land)RMIBSPWVMMDWD
POD0.5750.5490.5010.5150.4950.597
FAR0.4540.4230.5200.6200.5270.526
POFD0.0770.0550.0560.0530.0430.057
ACC0.8720.8980.9040.9220.9250.917
CSI0.3870.3890.3240.2800.3150.359
F10.5570.5600.4890.4360.4780.526
ME−0.337−0.062−0.309−0.205−0.149−0.198
MAE1.1730.8440.7050.7150.8290.774
RMSE3.6391.7052.1271.7131.8521.859
RV0.1110.1890.200−0.0210.2000.136
PCORR0.3520.4540.4780.3750.4790.438
Table 16. Performance results for the daily precipitation accumulation estimation, measured on the climatological rain gauges measurements at the test dates. The ME, the MAE and the RMSE are expressed in mm.
OPERADL-SDL-GDL-RDL-SGDL-SRDL-GRDL-SGR
ME−0.614−0.111−0.589−0.411−0.519−0.182−0.452−0.536
MAE1.3511.3140.9050.9840.8680.9150.8170.829
RMSE2.8932.7202.2922.2322.0412.0671.9101.944
RV0.3860.4880.4500.6650.7100.7080.7470.739
PCORR0.7430.7350.8680.8400.8780.8560.8990.901
Table 17. Performance results for the daily precipitation accumulation estimation with bias correction, measured on the climatological rain gauges measurements at the test dates. The ME, the MAE and the RMSE are expressed in mm.
OPERADL-SDL-GDL-RDL-SGDL-SRDL-GRDL-SGR
ME−0.012−0.104−0.044−0.154−0.031−0.139−0.066−0.067
MAE1.3761.3160.8930.9960.8570.9180.7890.788
RMSE2.8722.7232.2702.2112.0452.0661.8301.826
RV0.2870.4870.2510.6670.6990.7070.7570.762
PCORR0.7430.7350.8680.8400.8780.8560.8990.901
Publisher’s Note: MDPI stays neutral with regard to jurisdictional claims in published maps and institutional affiliations.