Article

Retrieving Precipitable Water Vapor from Real-Time Precise Point Positioning Using VMF1/VMF3 Forecasting Products

1
School of Environment Science and Spatial Informatics, China University of Mining and Technology, Xuzhou 221116, China
2
Satellite Positioning for Atmosphere, Climate, and Environment (SPACE) Research Centre, RMIT University, Melbourne, VIC 3001, Australia
3
Shenzhen Yunhai Exploration Technology Co., Ltd., Shenzhen 518100, China
*
Author to whom correspondence should be addressed.
Remote Sens. 2021, 13(16), 3245; https://doi.org/10.3390/rs13163245
Submission received: 4 July 2021 / Revised: 1 August 2021 / Accepted: 12 August 2021 / Published: 16 August 2021
(This article belongs to the Special Issue Satellite Observation for Atmospheric Modeling)

Abstract

:
Real-time precise point positioning (RT-PPP) has become a powerful technique for the determination of the zenith tropospheric delay (ZTD) over a GPS (global positioning system) or GNSS (global navigation satellite systems) station of interest, and the follow-on high-precision retrieval of precipitable water vapor (PWV). The a priori zenith hydrostatic delay (ZHD) and the mapping function used in the PPP approach are the two factors that could affect the accuracy of the PPP-based ZTD significantly. If the in situ atmospheric pressure is available, the Saastamoinen model can be used to determine ZHD values, and the model-predicted ZHD results are of high accuracy. However, not all GPS/GNSS are equipped with an in situ meteorological sensor. In this research, the daily forecasting ZHD and mapping function values from VMF1 forecasting (VMF1_FC) and VMF3 forecasting (VMF3_FC) products were used for the determination of the GPS-derived PWV. The a priori ZHDs derived from VMF1_FC and VMF3_FC were first evaluated by comparing against the reference ZHDs from globally distributed radiosonde stations. GPS observations from 41 IGS stations that have co-located radiosonde stations during the period of the first half of 2020 were used to test the quality of GPS-ZTD and GPS-PWV. Three sets of ZTDs estimated from RT-PPP solutions using the a priori ZHD and mapping function from the following three VMF products were evaluated: (1) VMF1_FC; (2) VMF3_FC (resolution 5° × 5°); (3) VMF3_FC (resolution 1° × 1°). The results showed that, when the ZHDs from 443 globally distributed radiosonde stations from 1 July 2018 to 30 June 2021 were used as the reference, the mean RMSEs of the ZHDs from the three VMF products were 5.9, 5.4, and 4.3 mm, respectively. The ZTDs estimated from RT-PPP at 41 selected IGS stations were compared with those from IGS, and the results showed that the mean RMSEs of the ZTDs of the 41 stations from the three PPP solutions were 8.6, 9.0, and 8.6 mm, respectively, and the mean RMSEs of the PWV converted from their corresponding ZWDs were 1.9, 2.4, and 1.7 mm, respectively, in comparison with the reference PWV from co-located radiosonde stations. The results suggest that the a priori ZHD and mapping function from VMF1_FC and VMF3_FC can be used for the precise determination of real-time GPS/GNSS-PWV in most regions, especially the VMF3_FC (resolution 1° × 1°) product.

Graphical Abstract

1. Introduction

The GNSS (global navigation satellite systems), initially designed for positioning, navigation, and timing, has now been used in the field of atmospheric sensing. GNSS measurements are subject to various types of errors, particularly atmospheric errors, i.e., the tropospheric and ionospheric delay errors. The tropospheric delay needs to be estimated along with all the other unknown parameters in the GNSS data processing. For reducing the number of unknown parameters to be solved for, the slant tropospheric delay (STD) of all GNSS signals observed at the same station usually need to be projected onto the zenith direction of the station (i.e. the zenith hydrostatic delay (ZHD) and zenith wet delay(ZWD)) using the formula below:
S T D = Z H D m f h + Z W D m f w + m f w cot ( e ) ( G N cos ( α ) + G E sin ( α ) )
where m f h and m f w are their corresponding mapping functions, which are closely related to the elevation angle of the signal and usually obtained from models such as GMF [1], VMF1 [2], or VMF3 [3]; e and α are the elevation angle and azimuth angle of the signal, respectively; G N and G E are the tropospheric gradient parameters resulting from the asymmetry troposphere.
A standard model can be used to determine ZHD values, and the model-predicted ZHD results are of a high accuracy under the condition that high-accuracy in situ atmospheric pressure is available from an in situ meteorological sensor or a numerical weather model (NWM). However, the ZWD cannot be obtained in the same way, as it is tightly related to the water vapor content over the site, which is highly dynamic. Instead, it is considered an unknown parameter in the GNSS data processing process. The two common approaches used in GNSS data processing for unknown parameter estimation are the network-based and precise point positioning (PPP) procedures. The former is based on double-difference observations from more than one station, while the latter is based on undifferenced observations from one station.
Nowadays, near real-time GNSS-ZTD obtained from the network solution has been assimilated into numerical weather prediction (NWP) models for improving the performance of weather forecasting [4,5,6,7]. Efforts have also been made to obtain the ZTD and PWV from RT-PPP, which uses the International GNSS Service (IGS) Real-time Service (RTS). Preliminary results showed that the ZTD and PWV resulting from RT-PPP can meet the requirements of related meteorological applications [8,9,10,11,12]. With the full deployment of GALILEO and BDS, as well as the development of multi-GNSS RTS products, studies for the contribution of GLONASS, GALILEO, and BDS to ZTD estimates and their converted PWV have been carried out during past years [13,14,15,16,17,18,19,20]. It has been proved that the convergence time of the solution and the accuracy of the ZTD estimate can be improved through the integration of multi-GNSS. The accuracy of PPP-ZTD can also be improved by PPP with ambiguity resolution (PPP-AR), as reported by Ding [21], Lu [22], and Li [15]. The impacts of real-time satellite clock errors, high-order ionospheric delays, and other advanced processing strategies on PPP-ZTD estimates have also been reported by some researchers [23,24,25,26,27,28,29].
In the estimation process for the ZTD (together with other unknown parameters) through PPP, it is common that the a priori ZHD is used in the projection for the slant hydrostatic delays of the signals observed at the station, i.e., the a priori ZHD value multiplying the corresponding mapping function (see the first term on the right-hand side of Equation (1)) can be regarded as the approximate values of the unknown parameter ZTD. If the a priori ZHD and the two mapping functions in Equation (1) are sufficiently accurate, then the estimate for this term from the solution is the ZWD; otherwise, the errors in the three terms will be partly or/and indirectly absorbed into the ZWD estimate, depending on the mapping functions selected. These errors affect not only the ZWD or ZTD but also the position estimates, especially in the height direction [2,30,31]. Therefore, the obtaining of a high-accuracy ZHD and mapping function is significant to the accuracy of GNSS estimation results.
As mentioned before, the ZHD can be obtained at a high accuracy from a standard (or empirical) model, which is a function of the in situ measurement of atmospheric pressure [32]. However, not all GNSS stations are equipped with meteorological sensors for this purpose. To address this issue, some empirical regional or global models have been developed, of which the GPT series [33,34,35] have been widely applied to predict the ZHD for any site over the region or globe. Wang et al. [36] evaluated the atmospheric pressure derived from the GPT2w model, and the results showed that GPT2w performed worse at mid-latitude and high-latitude regions, compared to that at low-latitude regions. Moreover, atmospheric pressure obtained from NWM data (including reanalysis data and forecasting data) can also be used as the input variable of a standard ZHD model to obtain the ZHD. The reanalysis data, such as ERA5 reanalysis, are only available in the post-processing mode; thus, it is not suitable for real-time applications. A priori ZHD and mapping functions obtained from forecasting NWM data can be used for real-time GNSS data processing, but this may increase the computational burden of parameter estimation. Fortunately, the Vienna mapping functions 1 (VMF1) [2] and Vienna mapping functions 3 (VMF3) [37] data, which contain forecast results (named VMF1_FC and VMF3_FC, respectively), are routinely generated by the Vienna University of Technology (TU Wien, TUW) and published on the VMF Data Server [38], which provides access to the ZTD (including the ZHD and ZWD) and mapping function from the NWM. VMF-like products are also provided by the University of New Brunswick (UNB, http://unb-vmf1.gge.unb.ca/, accessed on 26 July 2021) and GeoForschungsZentrum Potsdam (GFZ, ftp://139.17.3.3/, accessed on 26 July 2021). Yao et al. [39] evaluated the accuracy of the ZTD derived from VMF1_FC grids by comparing it against the IGS tropospheric product. Yuan [40] stated that the ZTD and position estimated from RT-PPP were improved by the use of VMF1_FC, compared to the one that utilizes empirical tropospheric models. However, little work has been reported on the accuracy of the a priori ZHD from VMF1_FC and VMF3_FC, as well as the ZTD and PWV resulting from RT-PPP utilizing ZHD and the mapping function from VMF1_FC and VMF3_FC. This research mainly focused on the assessment of the performance of these products.
This paper is organized as follows. Section 2 describes the mathematical model of real-time uncombined PPP and the method of converting GNSS-ZWD to PWV. Data and processing strategies employed in this research are introduced in Section 3. In Section 4, the accuracies of various results, including the a priori ZHDs from VMF1_FC and VMF3_FC, the ZTD estimated from RT-PPP, the application of VMF1_FC and VMF3_FC, and the ZWD-converted PWV were evaluated. The summary and conclusions are presented in the last section.

2. Materials and Methods

In this section, the data sources and processing strategies employed in this research are depicted.

2.1. Real-Time Orbits and Clocks

In this research, CLK93 real-time orbit and clock corrections from DOY (day of year) 1 to 180 in 2020 were decoded and stored to the local disk through the BNC software [41]. However, due to an internet connection problem of the computer for recording the CLK93 corrections, only 154 days of corrections were available for the data processing of the RT-PPP. It is noted that the RT-PPP algorithm was carried out in a simulated real-time mode as the observation data were from data files, rather than streams (which are truly real-time data).

2.2. GPS Data and Processing Strategies

GPS observation files from DOY 1 to 180 in 2020 downloaded from the FTP server of Wuhan University were used for testing. The 41 IGS stations, as is shown in Figure 1, were selected based on the following criteria: (1) As the reference of the PPP-derived ZTD, the ZTD from IGS products is available. (2) A radiosonde station that has a less than 10 km horizontal distance and a less than 100 m height difference from the IGS station is available. A modified BNC software was developed to support the real-time dual-frequency uncombined PPP algorithm for this study. The strategies utilized in the RT-PPP data processing are shown in Table 1.
The elevation-dependent stochastic model recommended by Hadas [24] was used to determine the weight of the observation:
σ = σ 0 a + b cos n ( e )
where σ 0 is the a priori sigma of observations; a = 1 , b = 4 , and n = 8 are constants; e is the elevation angle.
The ZWD estimated from RT-PPP is converted into PWV using:
P W V = Π Z W D
where Π is the conversion factor, which is a function of the weighted mean temperature ( T m ) along the vertical direction of the atmosphere over the receiver’s site:
Π = 10 6 ρ w R v ( k 3 T m + k 2 )
where ρ w is the density of liquid water; R v = 461.5 J / ( kg K ) is the specific gas constant for water vapor; k 2 = 22.1   K / hPa and k 3 = 373 , 900   K 2 / hPa are atmospheric refractivity constants.
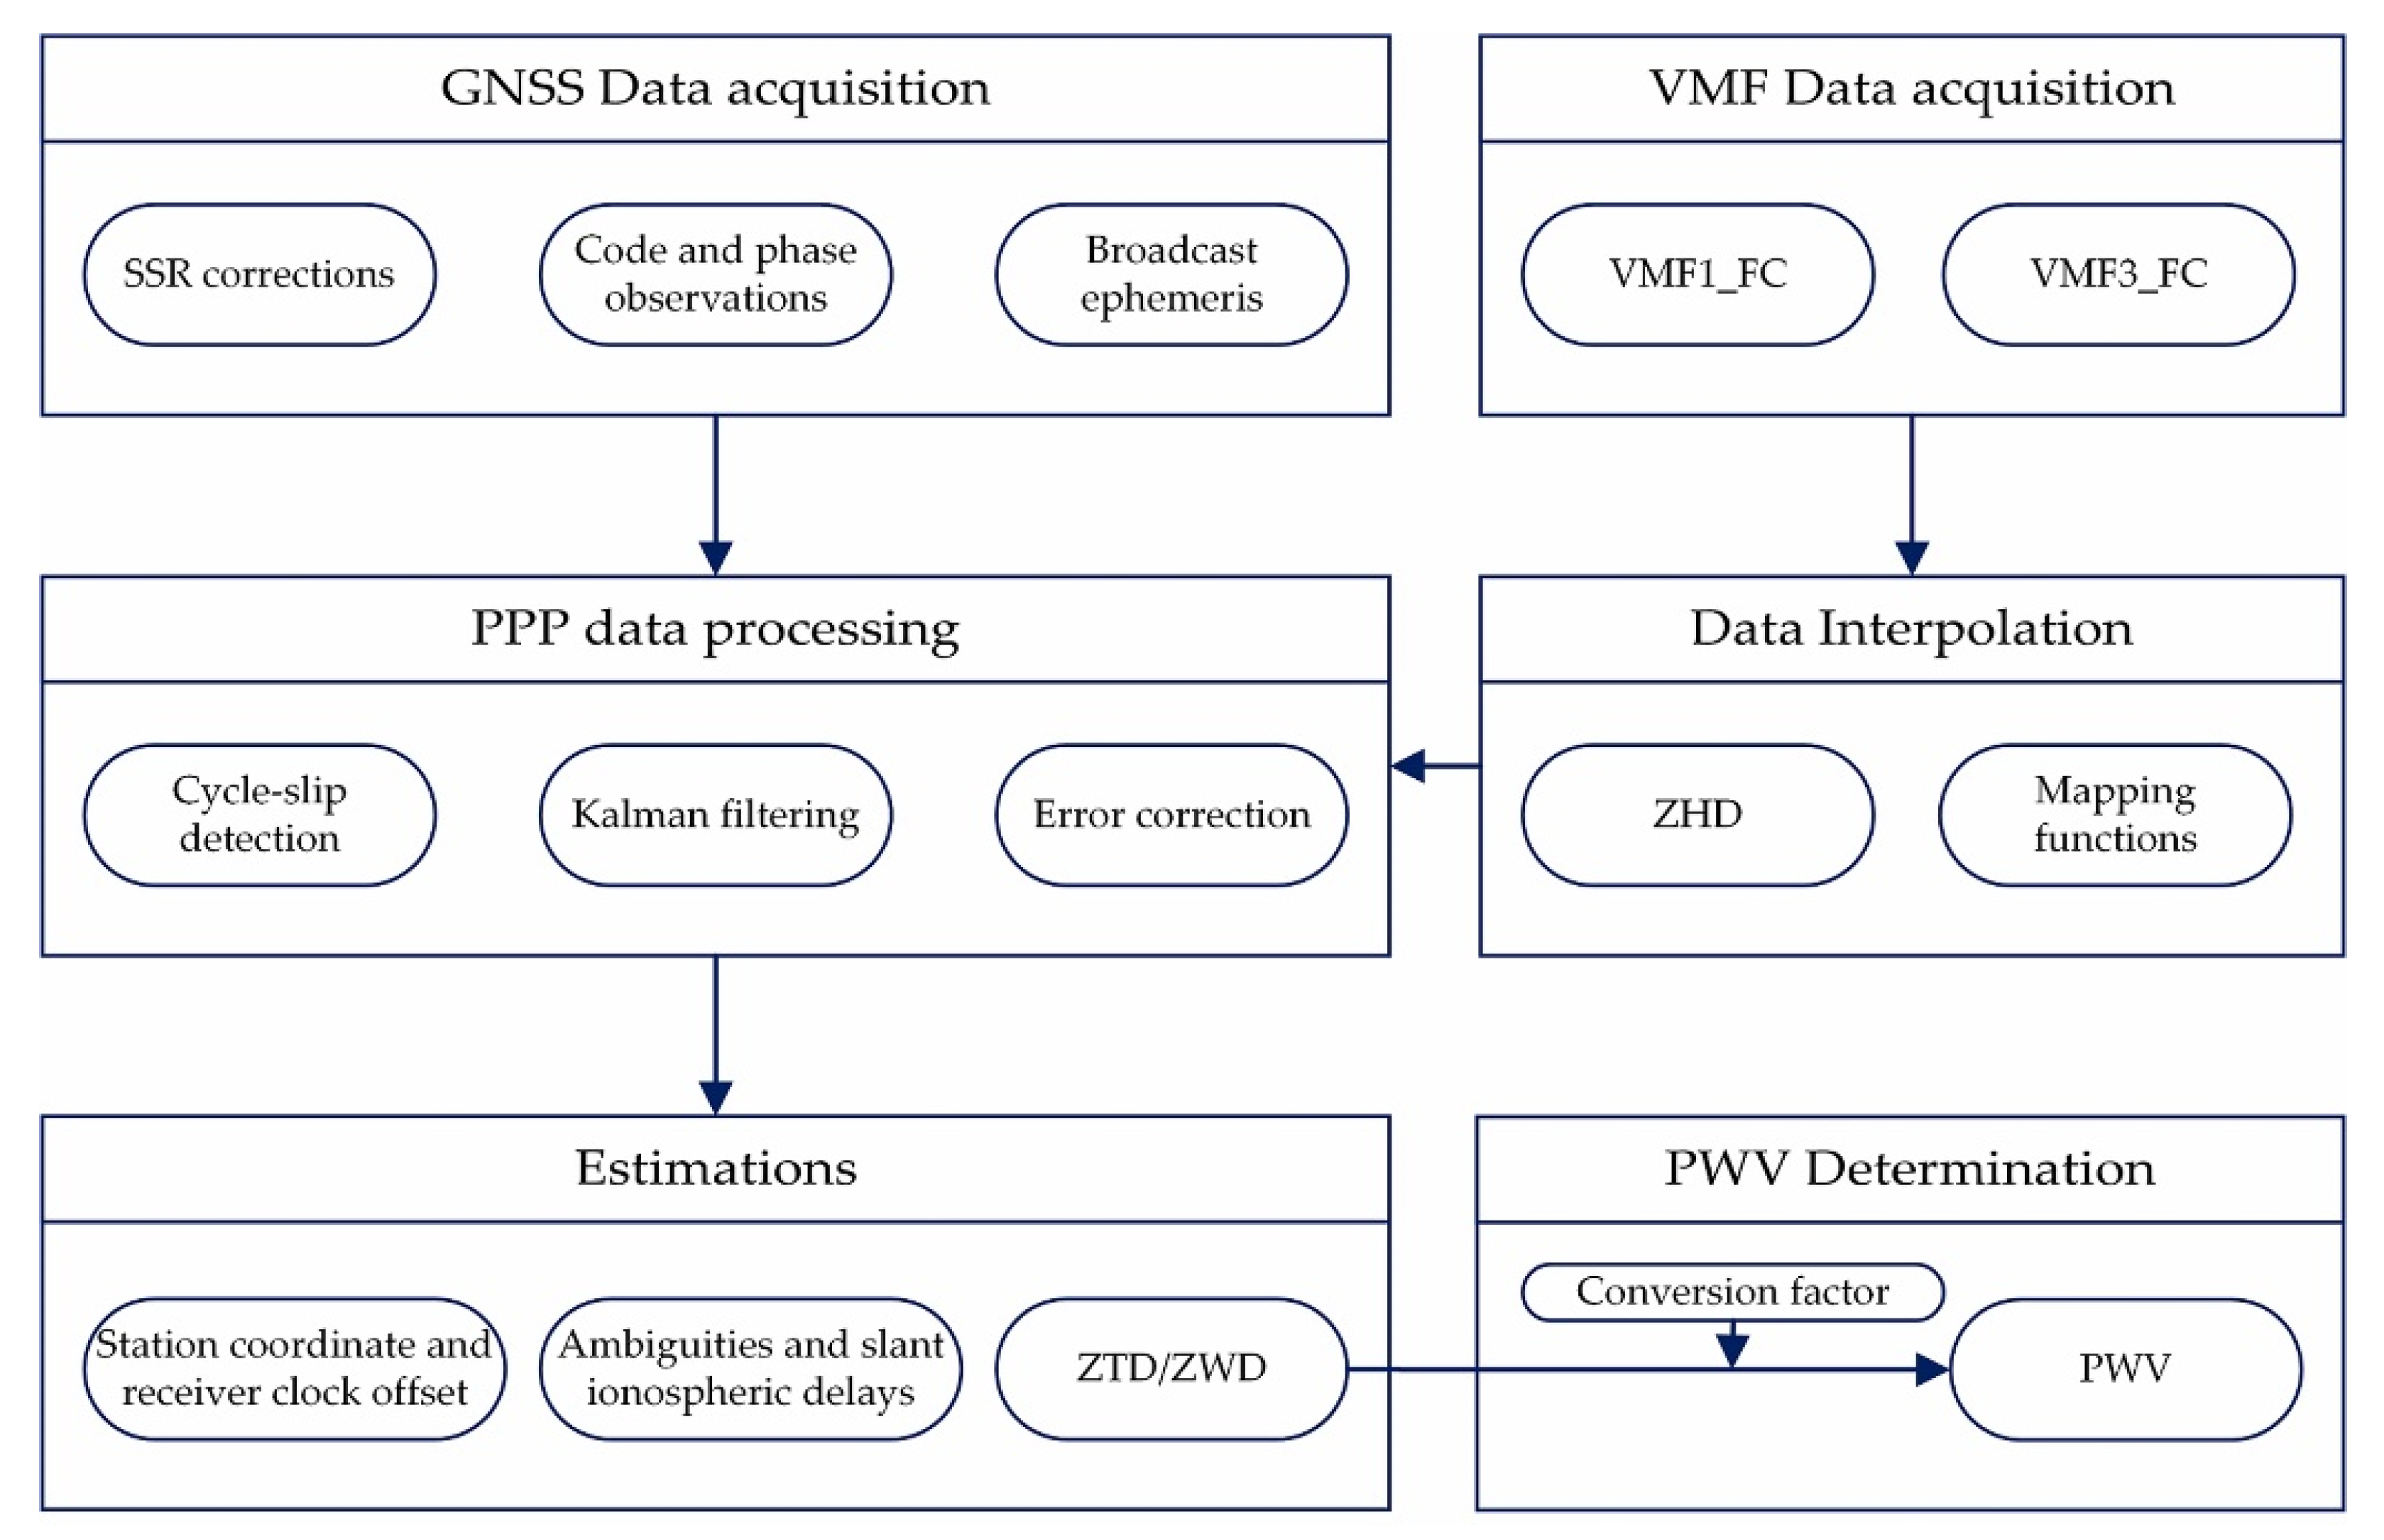
The procedure of the RT-PPP-based PWV retrieval utilizing VMF1/VMF3 forecasting products is shown in Figure 2.

2.3. VMF Forecasting Data

The two types of VMF forecasting data provided by the VMF Data Server are grid-based data for any location around the globe and site-based data for specific GNSS, DORIS, VLBI stations. Only three grid-based VMF forecasting products, see Table 2, were tested in this research. The horizontal resolution of VMF1_FC is 2.5° × 2.0°, while VMF3_FC has two resolutions: 1.0° × 1.0° and 5.0° × 5.0°. The a priori ZHD and ZWD, as well as the coefficients of their corresponding mapping functions, are given for each of the grid points. All of these grid-based VMF forecasting data in 2020 were downloaded from the VMF Data Server [38] for the evaluation of the accuracy of their corresponding a priori ZHDs and the application for real-time retrieval of GPS-PWV. The vertical reduction model and the bilinear interpolation method recommended by Kouba [30] were utilized to obtain the ZHD for the target GPS station based on the height difference and horizontal distance between the station and its four surrounding grid points. First, the atmospheric pressure at the grid point can be calculated according to the Saastamoinen model [32,42]:
P 0 = Z H D ( 1 0.00266 cos ( 2 φ ) 0.28 10 6 H ) 0.0022768
where P 0 is the atmospheric pressure at the grid point; φ and H are the latitude and height of the grid point. Then, the atmospheric pressure at the target height over the grod point can be obtained by:
P ( h ) = P 0 ( 1 0.0000226 ( h H ) ) 5.225
where h is the height of the target station. Finally, the ZHD at the target height over the grid point can be calculated using the Saastamoinen model, followed by the horizontal interpolation of ZHD at the target station.

2.4. Radiosonde Data for Evaluating VMF1/VMF3 Forecasting ZHD

The radiosonde data were downloaded from the FTP server of the Integrated Global Radiosonde Archive (IGRA). Although radiosonde balloons at most radiosonde stations are released two to four times a day, only the profiles at 00:00 and 12:00 UTC were selected in this research. For the evaluation of the ZHD resulting from VMF1_FC and VMF3_FC, atmospheric pressures over the earth surface of 443 stations from 1 July 2018 to 30 June 2021 were selected as more than 1500 profiles were observed at these stations. The ZHD at the surface level of a selected radiosonde station was calculated using the Saastamoinen model. It should be noted that as radiosonde balloons were not necessarily released exactly at 00:00 and 12:00 UTC, the ZHD obtained from the surface atmospheric pressure was in fact of the release time rather than 00:00 and 12:00 UTC.

2.5. Radiosonde Data for Evaluating RT-PPP-Based PWV

For the evaluation of the accuracy of GNSS-PWV resulting from the above-mentioned VMF forecasting products, the reference PWV for each of the 41 selected IGS stations shown in Figure 1 was calculated from the observation profiles at its co-located radiosonde station through the integration defined below:
P W V = 1 ρ   ( q / g ) d p
where ρ is the density of liquid water; q is the specific humidity; g is the gravitational acceleration, which was set to 9.80665 m / s 2 in this research; p is the atmospheric pressure. It should be noted that in practice, a discretization is used for an approximation of Equation (7), as radiosonde observations are given at the observed pressure levels. In consideration of the height difference between the selected IGS station and its co-located radiosonde station, the atmospheric pressure for the height of the IGS station is obtained by the following reduction model:
P s = P 0 e   g m M R T v ( h s h 0 )
where P s and P 0 are the pressures at the height of the IGS station and the reference pressure level, respectively, and h s and h 0 are their heights; g m is the mean gravitational acceleration (9.80665 m / s 2 ).   M is the constant for the molar mass of dry air (0.0289644 kg / mol ); R is the universal gas constant (8.3143 J / K / mol ); T v is the virtual temperature (in K) at the reference height, which can be calculated by:
T v = T ( 1 + 0.6077 q )
where T is the temperature (in Kelvin). The specific humidity was obtained by:
q = 0.6228 E / ( P 0.378 E )
where E is the water vapor pressure. A linear interpolation or extrapolation was performed to obtain the water vapor pressure at the height of the IGS station from its closest two radiosonde pressure levels. The reference PWV can then be obtained from the radiosonde profile starting with the specific humidity and atmospheric pressure at the height of the IGS station.

3. Results and Discussion

3.1. A Priori ZHD from VMF1_FC and VMF3_FC

The overall accuracy of the a priori ZHD derived from the three VMF products are listed in Table 2, and all testing data were measured by the bias and RMSE of all the n samples:
b i a s = 1 n i = 1 n (   Z H D R S , i Z H D V M F , i )
R M S E = 1 n i = 1 n (   Z H D R S , i Z H D V M F , i ) 2  
where Z H D V M F and Z H D R S are the ZHD from the VMF product and radiosonde observations, respectively.
Figure 3 shows the bias and RMSE of the ZHD predicted by the three VMF forecasting products at each of the 443 stations, and Table 3 shows the statistical results of all the stations. From the left panes (a1, a2, and a3) in Figure 3, we can see that most biases ranged from −0.5 to 0.5 cm, suggesting little biases in the VMF-based ZHDs in most regions. Those stations that had a warm bias were mainly located in low-latitude regions, especially in China and Southeast Asia; and those stations that had a large cold bias were mainly located in the Asian continent, northwest America, and Antarctica, especially from the first two products. The mean biases of the ZHDs predicted by products 1 to 3 were −2.2, 0.5, and 1.7 mm, respectively (see Table 3).
The right panels (b1, b2, and b3) in Figure 3 indicate that the RMSEs at most stations were in the range (0–5) mm, suggesting that the ZHDs from both VMF1_FC and VMF3_FC can be used to retrieve PWV from the RT-PPP-based approach at most stations. The mean RMSEs resulting from the three VMF products at all the 443 stations were 5.9, 5.4, and 4.3 mm, respectively, see Table 3. Those stations that had a large RMSE from the first two products were mainly located in Asia, North America, and Antarctica. According to Equation (3), if Π = 0.15 , for a 5 mm error in ZHD, 0.75 mm in its resultant PWV is expected. Thus, these grid-based VMF1/VMF3 forecasting products should be evaluated before being applied to real-time PWV retrieval in some regions.
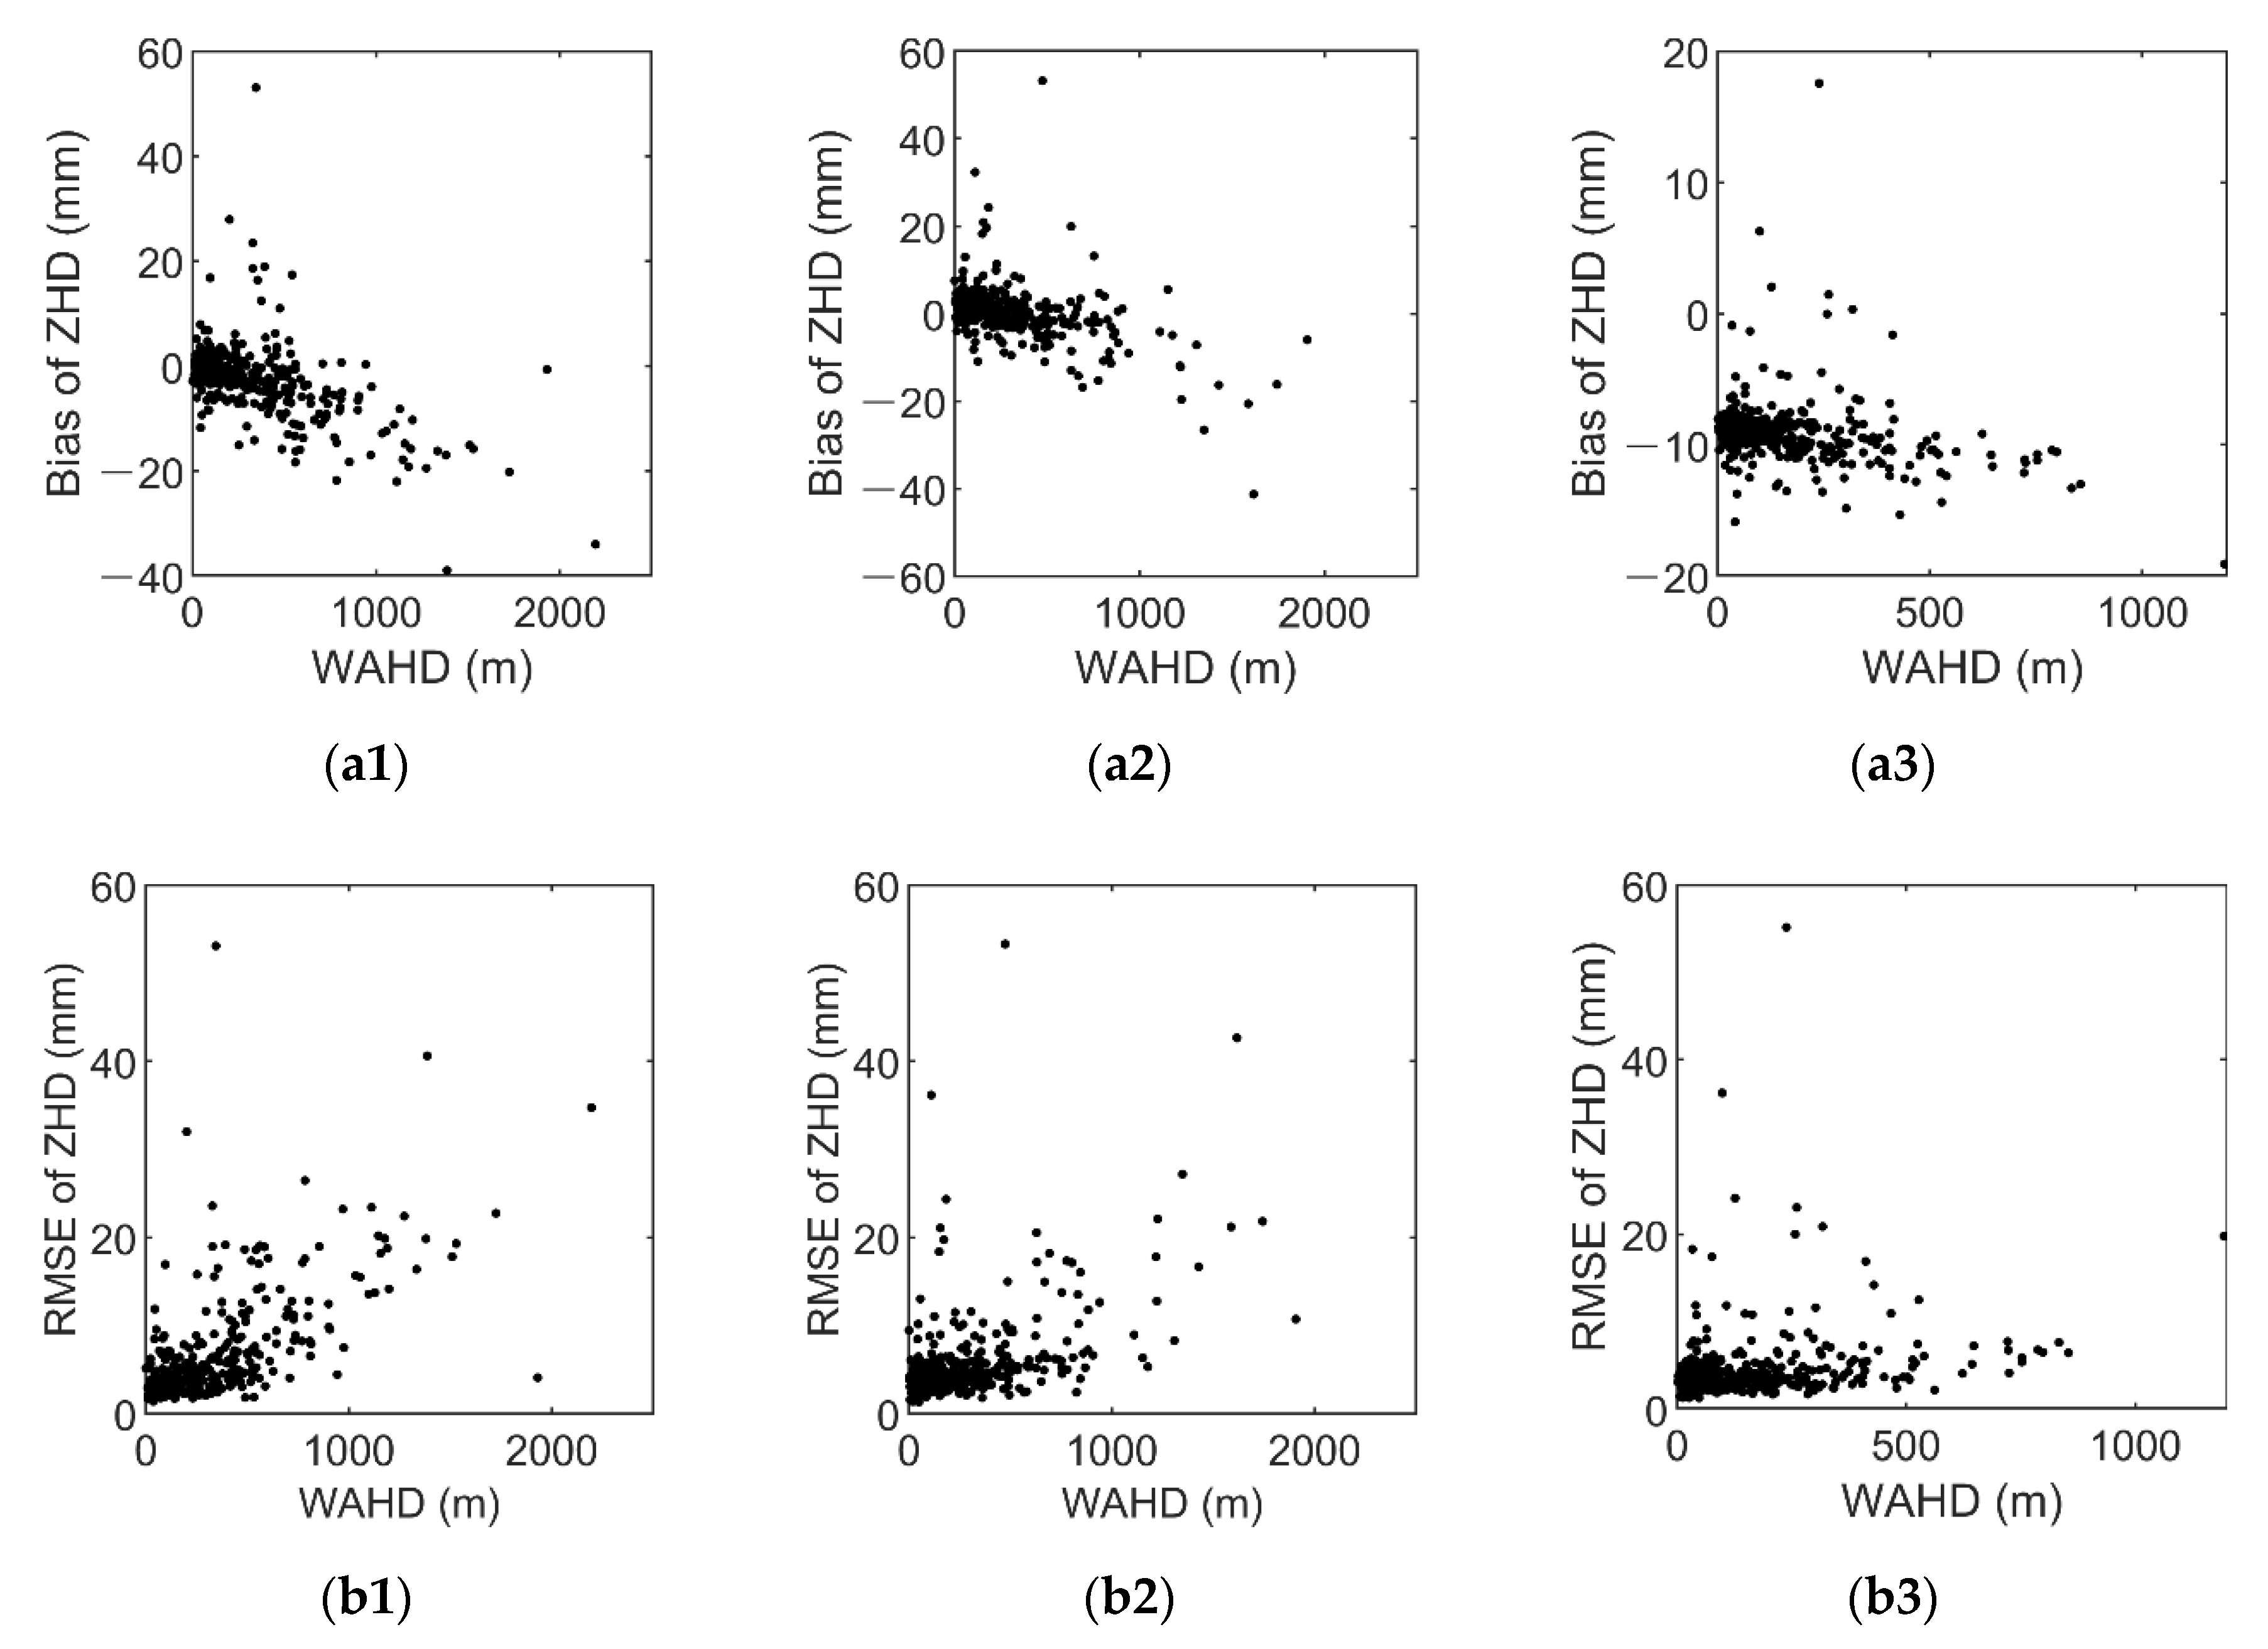
Given that the ZHD above the target GNSS station is intepolated from four nearby grid points and the height difference between the target station and the grid points is adjusted using an empirical model, the accuracy of the VMF-predicted ZHD may be affected by the height differences [43]. In this research, a new parameter, named weighted absolute heigh difference (WAHD) was used for measuring the correlation between the above-mentioned statistics and the height difference between the target station and the grid points:
WAHD = i = 1 4 w i H i
where H i is the height difference between the target station and the i t h nearby grid point; w i is the weight of the i t h height difference:
w i = 1 / d i / i = 1 4 1 / d i
where d i is the horizontal distance between the target station and the i t h nearby grid point.
Figure 4 shows the correlation between WAHD and two statistics (the bias and RMSE in Figure 3). The mean WAHD of the three products were 286.9, 260.3, and 147.7 m, respectively, at 442 selected stations (the station that is located at 90° S, 0° E was not taken into consideration here). The mean WAHD of product 3 reduced significantly compared to those of products 1 and 2, probably due to its high spatial resolution. As is shown in the figure, stations with a large WAHD tend to have a large bias and RMSE, especially products 1 and 2. These results suggest that the topography should be considered when using these grid-based products.
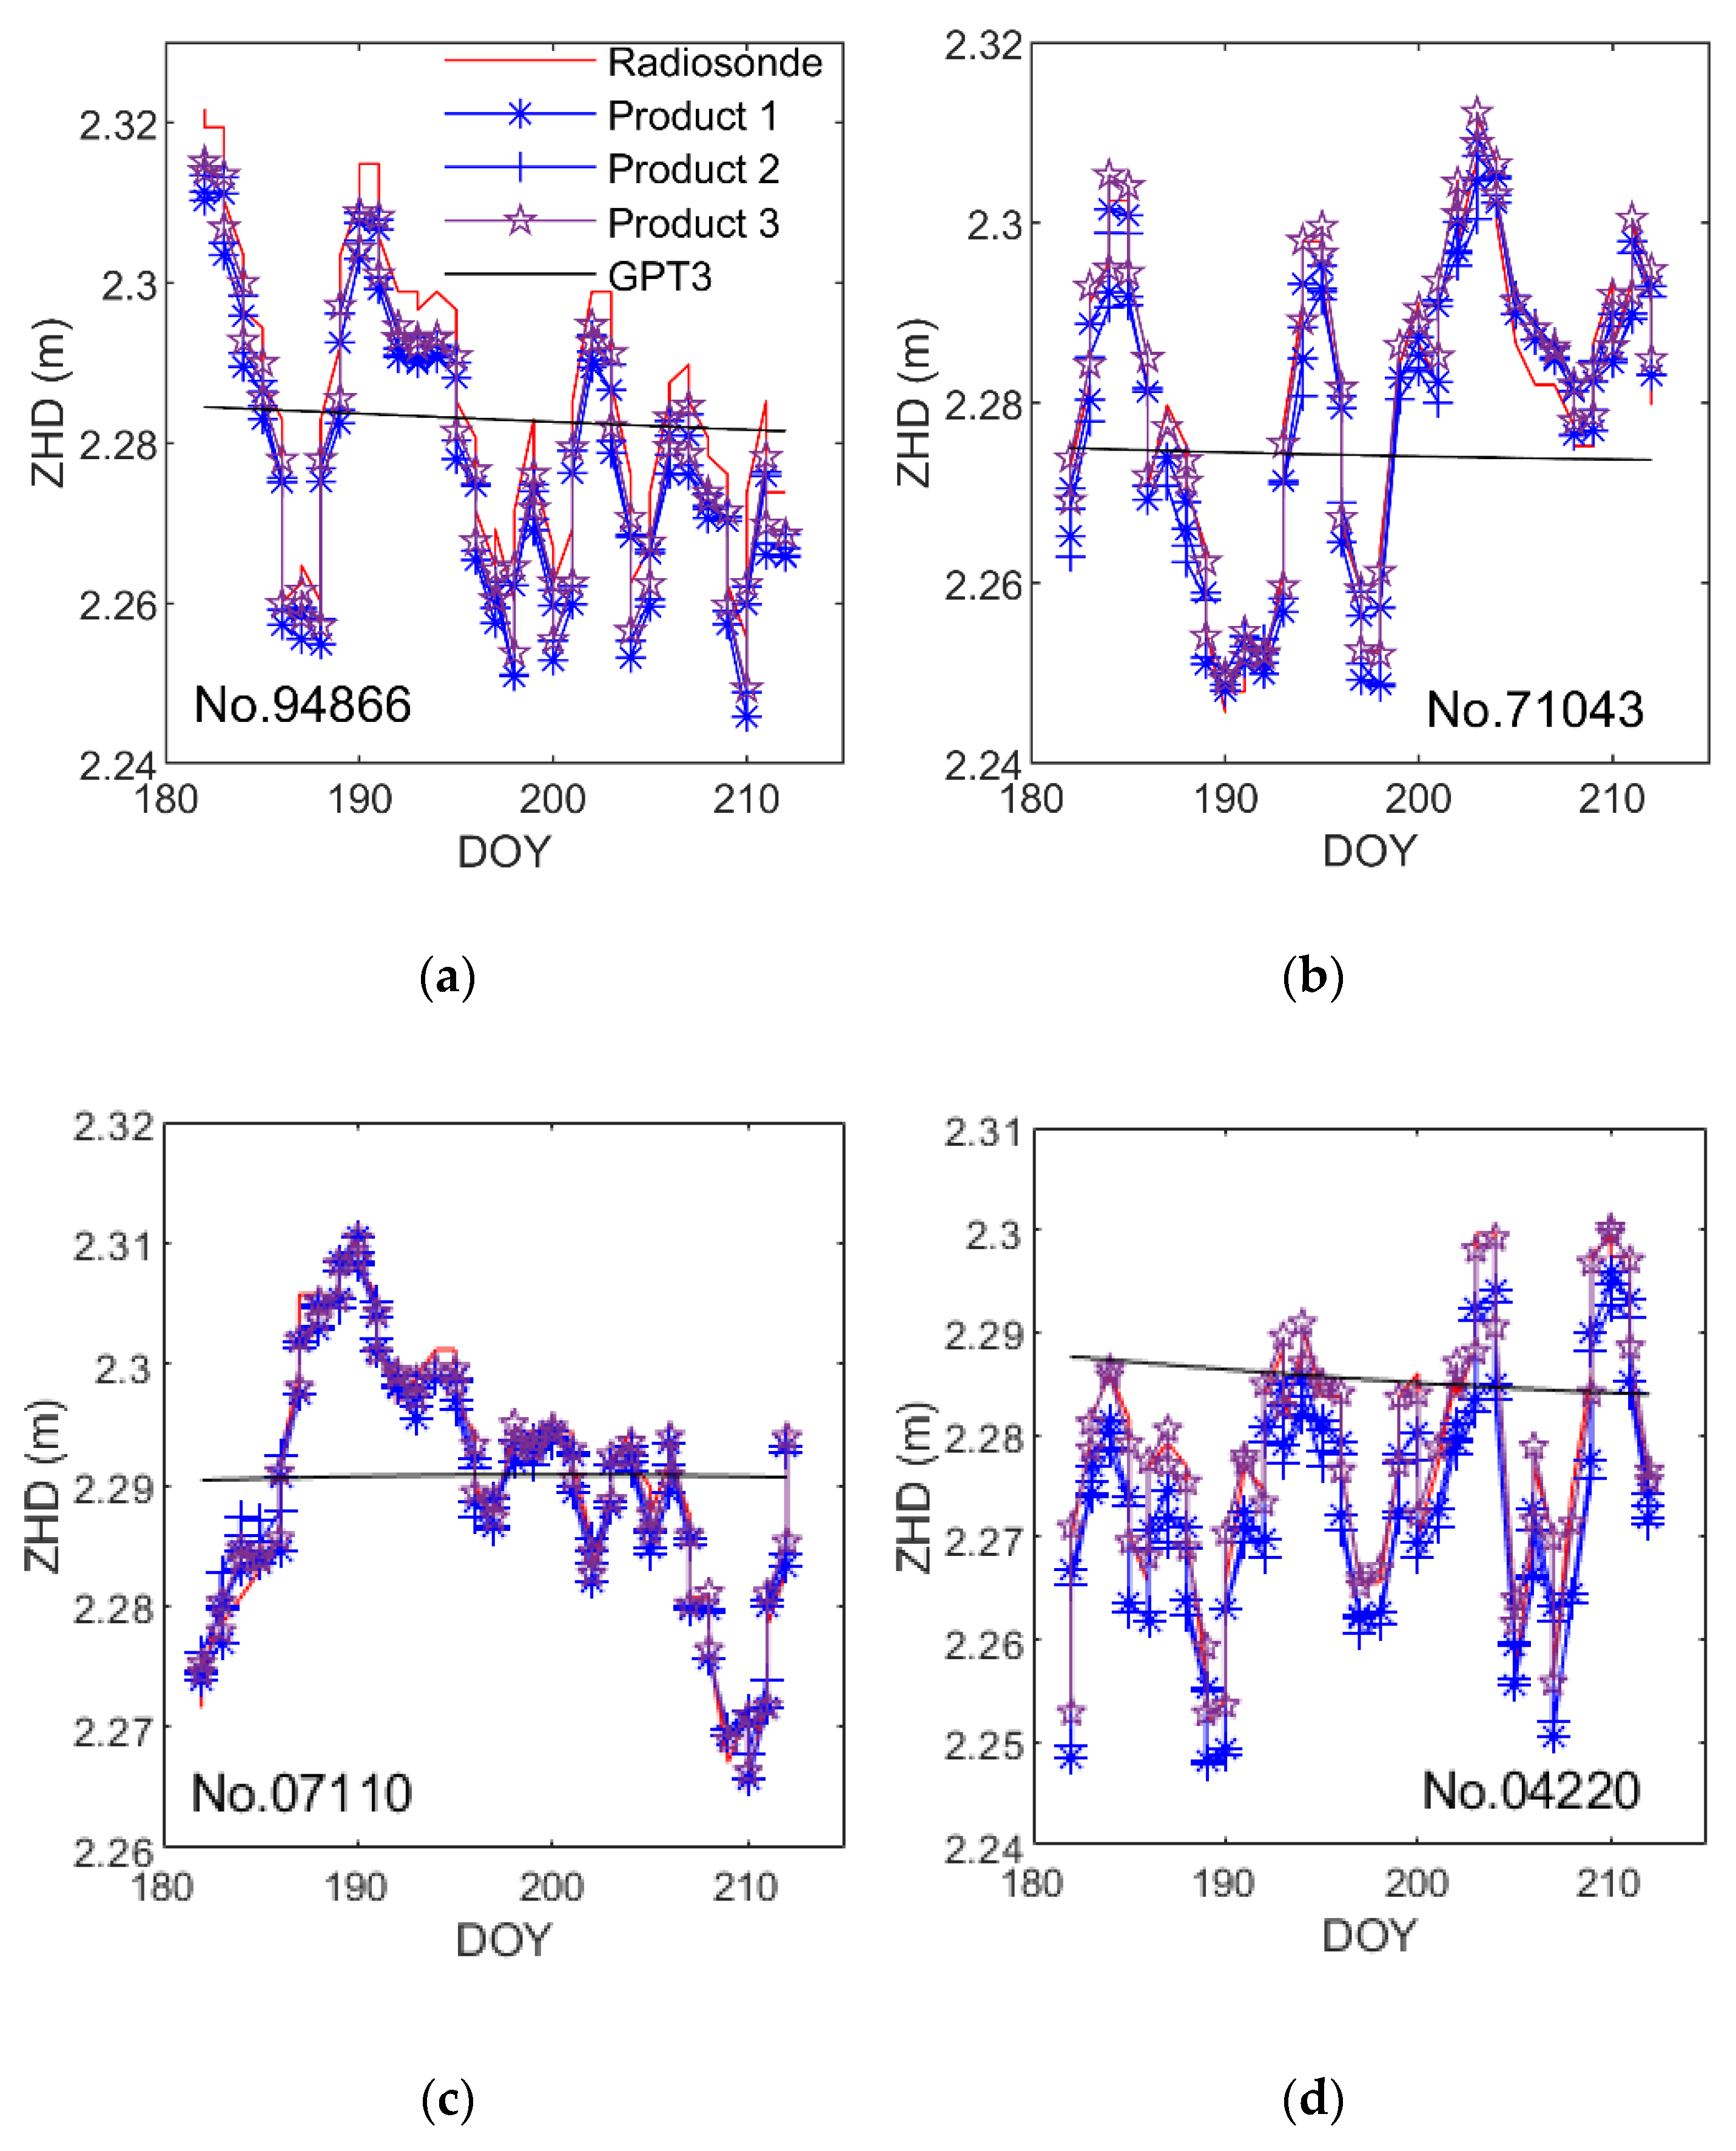
The time series of the ZHD obtained from the GPT3 model and VMF1/VMF3 forecasting products in July 2018 at four radiosonde stations are shown in Figure 5. As is shown in the figure, the variation in ZHD can be captured by VMF1/VMF3 forecasting products. The GPT3 model performed worst as only the mean, annual, and semi-annual variations in the asmospheric pressure were modeled.

3.2. RT-ZTD Estimated from PPP

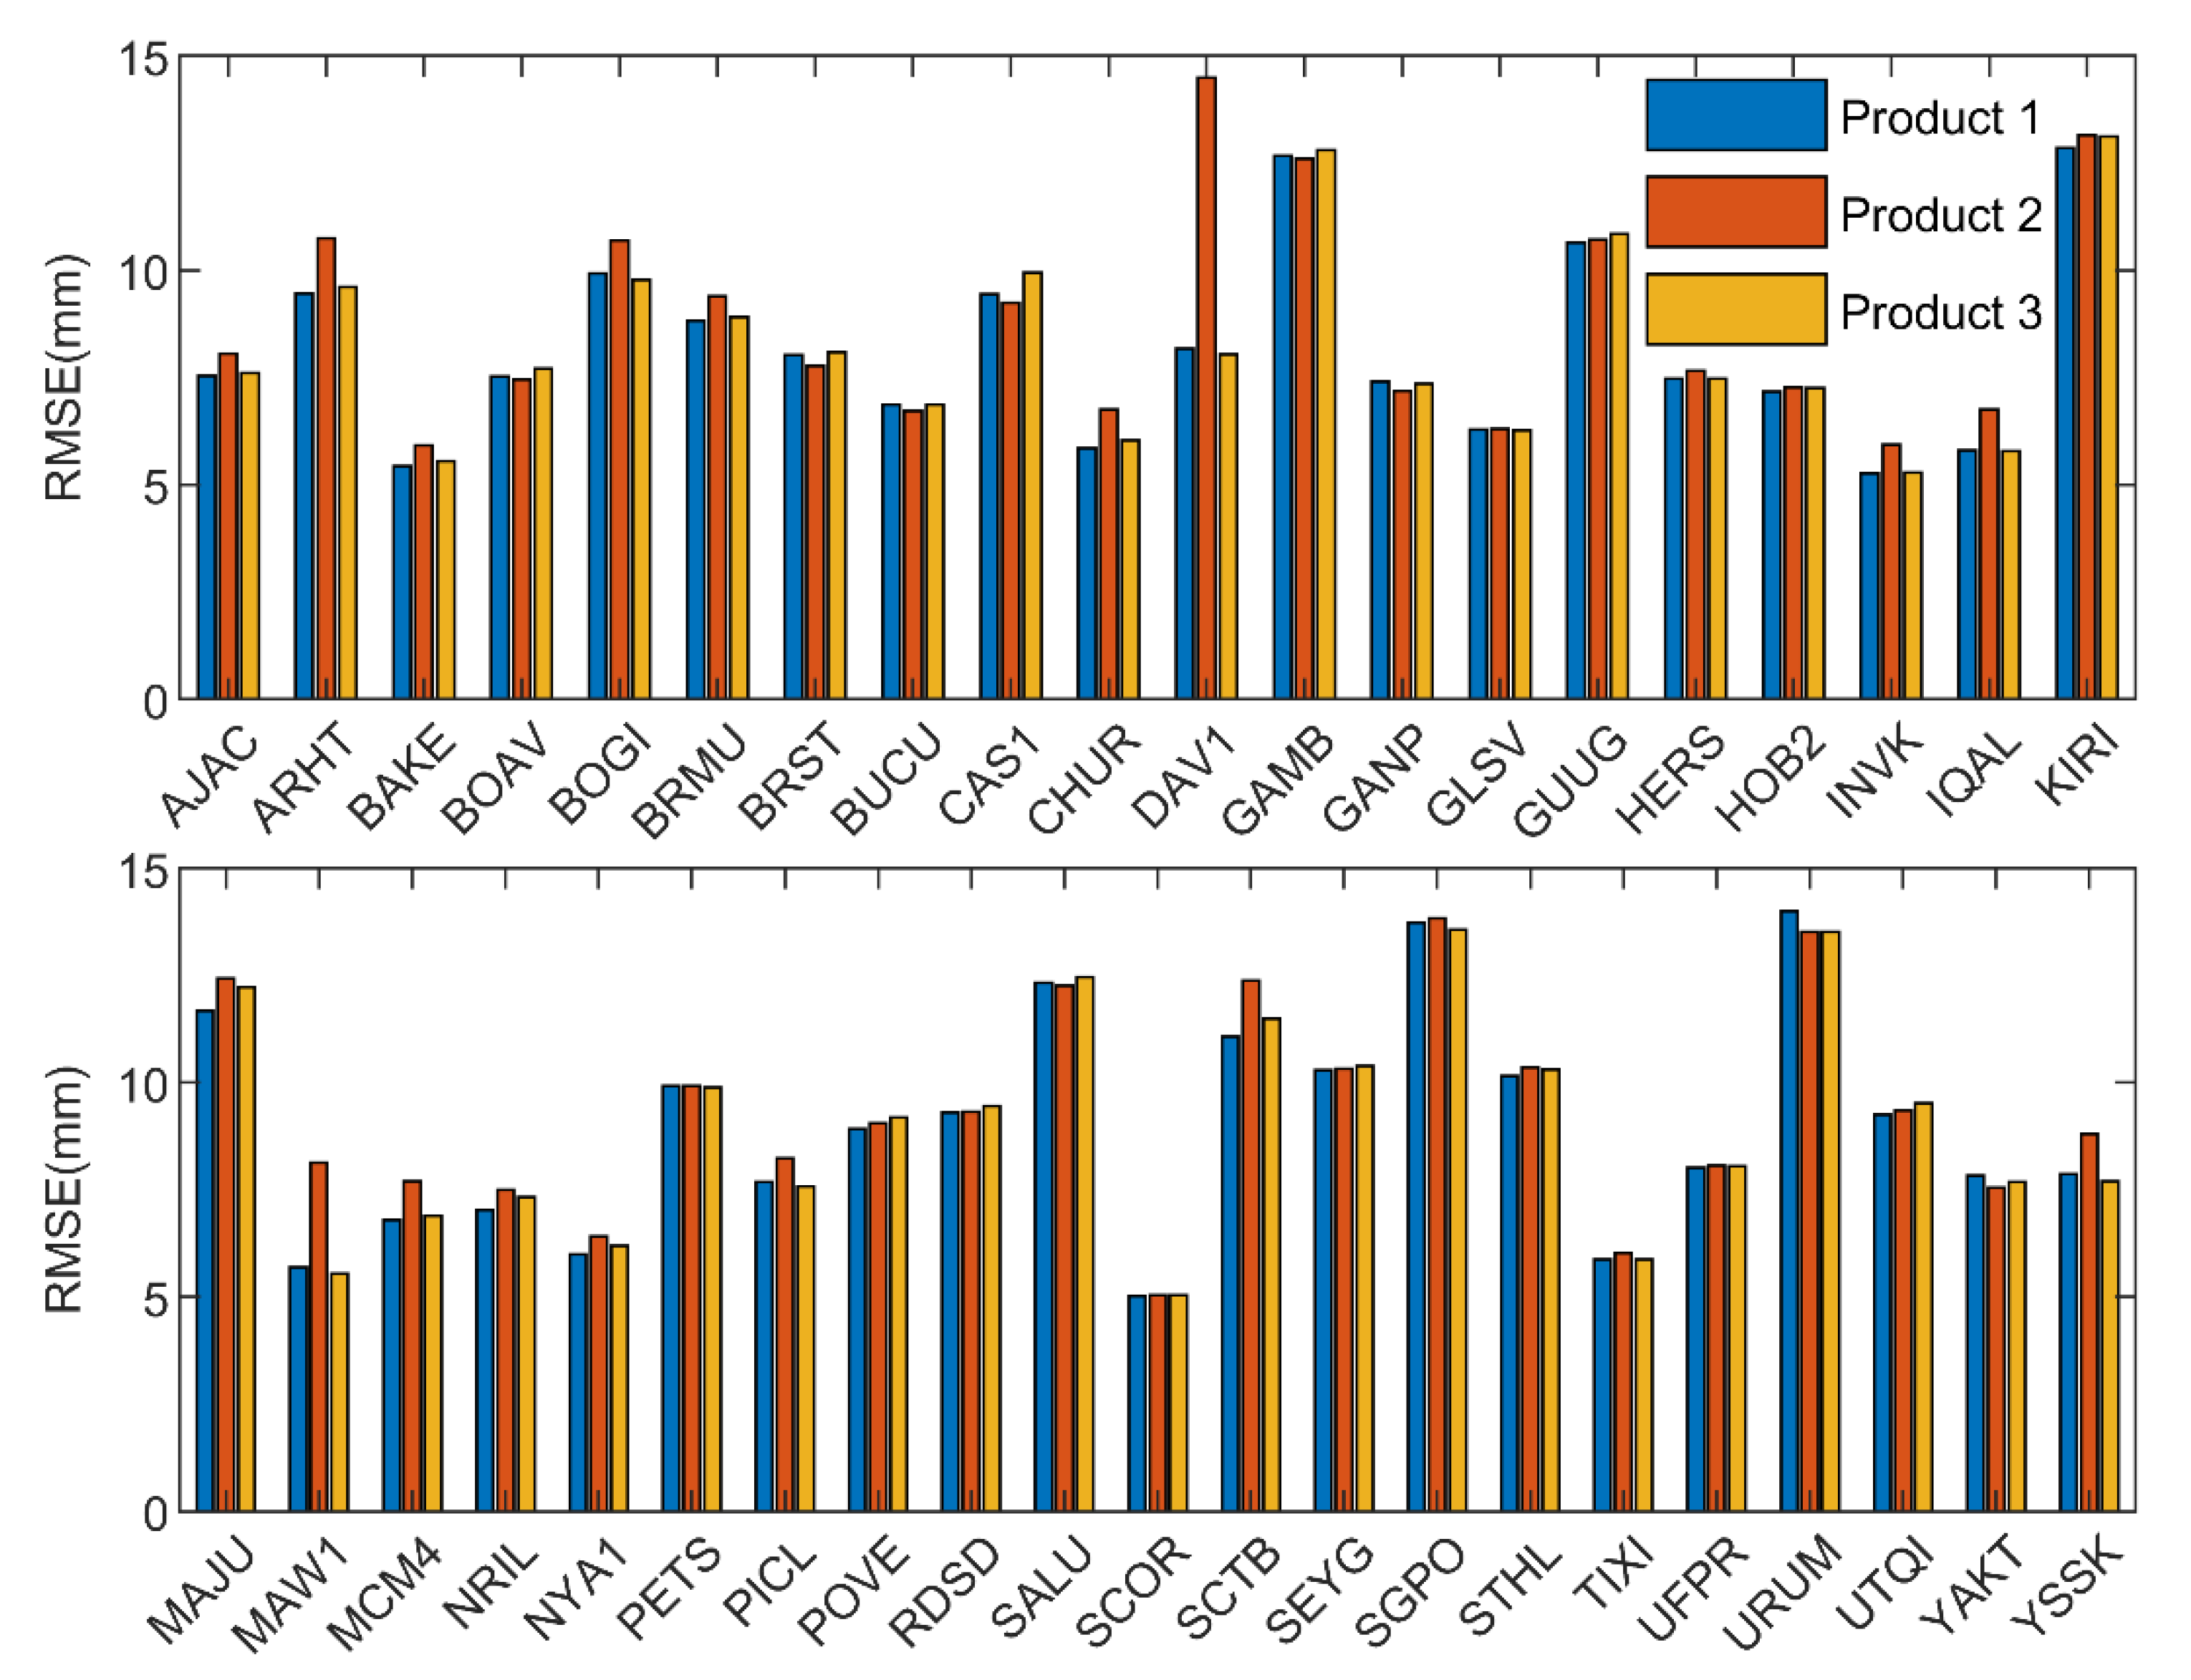
The RT-ZTD estimated from PPP that applied the three VMF products for the tropospheric delay at each of the 41 selected IGS stations (shown in Figure 1) was compared to the IGS-provided ZTD of the same station for the accuracy evaluation of the VMF product, and the statistical results of all the 154 days in 2020 are shown in Figure 6. It should be mentioned that the estimated ZWDs during the first 2 h of the convergence process of PPP were excluded from the evaluation results to ensure that all the ZTDs used to calculate the RMSE were converged results. As is shown, the RMSE of the ZTD estimates at any station was under 15 mm, and most of them were under 10 mm. In addition, the mean RMSEs of the ZTDs at all the 41 stations resulting from the three VMF products were 8.6, 9.0, and 8.6 mm, meaning that product 2 performed worst (especially at the DAV1 station (−68.58° S, 77.97° E), see the top pane in Figure 6). Besides, differences between the heights of the DAV1 station resulting from products 2 and 3 were also found from the testing. The RMS of the error in the height component at DAV1 station resulting from RT-PPP using products 1 to 3 were 2.92, 5.13, and 2.80 cm, respectively, compared to the IGS-provided coordinate. The mean RMS of the height error at the 41 selected stations resulting from the above-mentioned schemes were 3.16, 3.31, and 3.15 cm, respectively. These results suggest that the height component of the station coordinate is also affected by the a priori ZHD and mapping functions.

3.3. RT-PWV Estimated from PPP

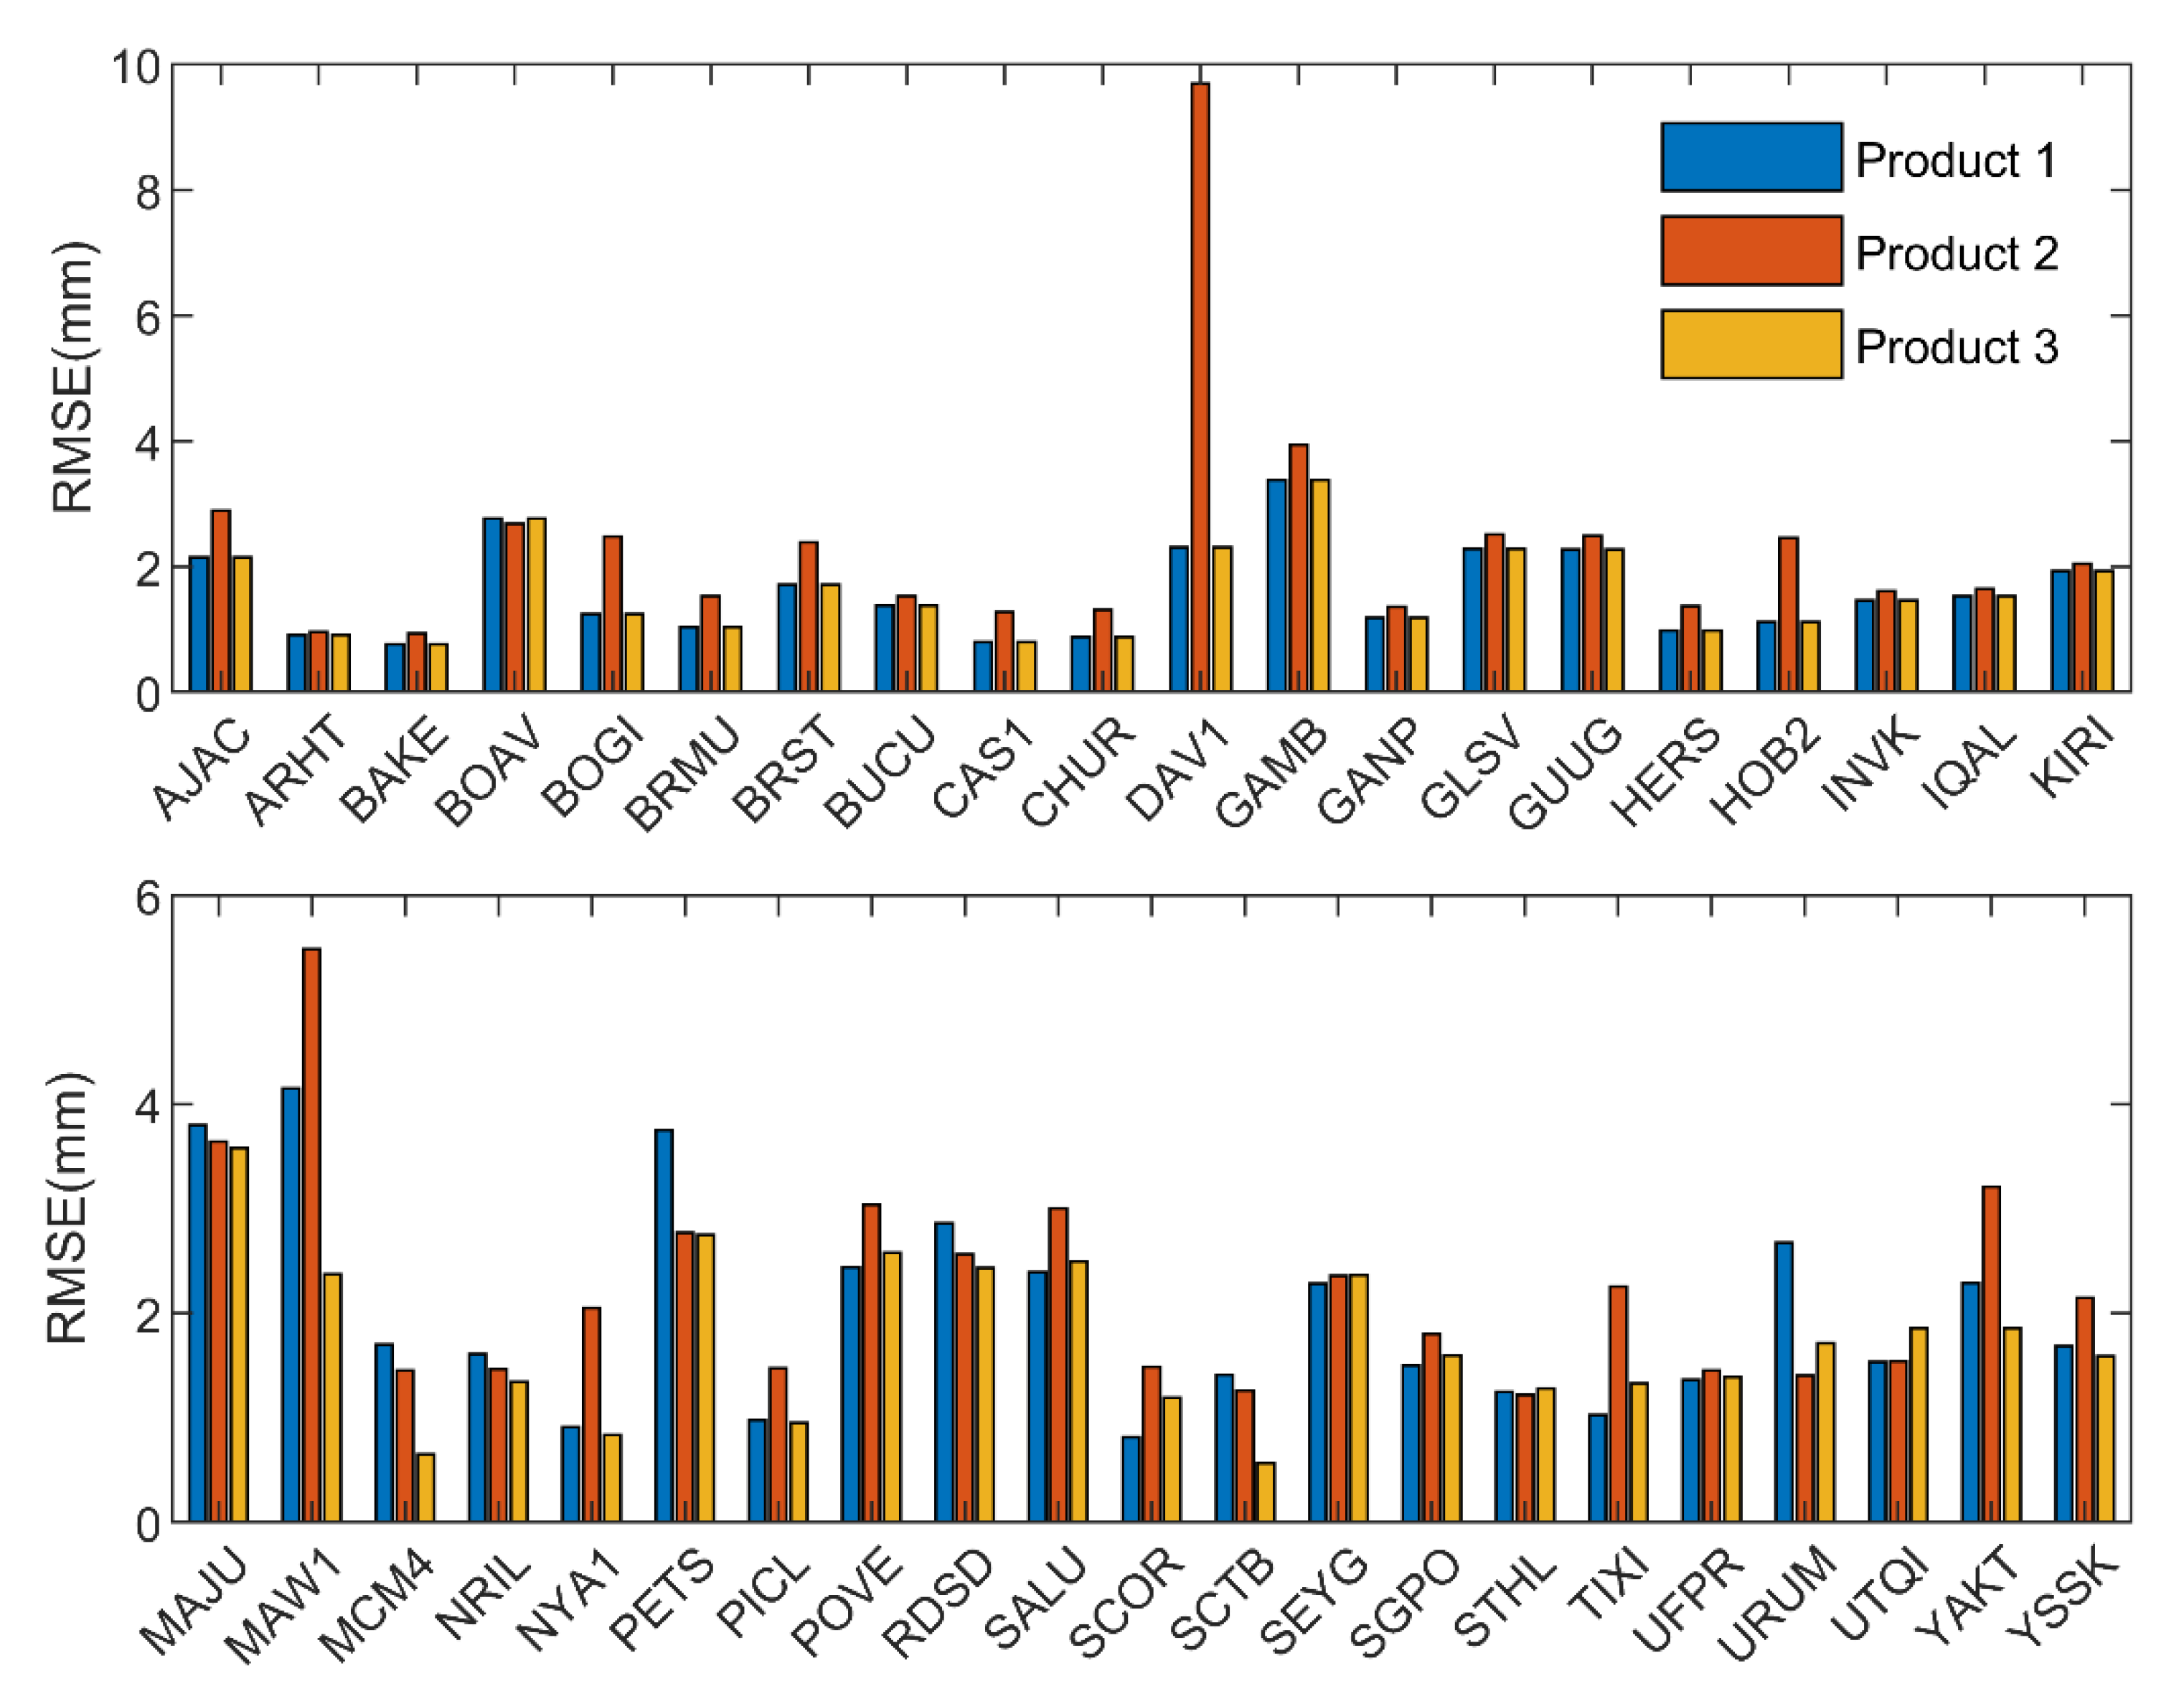
The PWV over each of the above 41 selected IGS stations was obtained from the conversion of the RT-ZWD using the weighted mean temperature predicted by the GGNTm model [44], followed by the comparison of the PWV against the reference PWV obtained from the co-located radiosonde station. The RMSE of the converted PWVs of the 154 days in 2020 at each station is shown in Figure 7. As we can see, most of the RMSEs of the PWVs resulting from the three VMF products were under 3 mm, except for the GAMB (top panel) and MAJU (bottom panel) stations, at which all the RMSEs from the three VMF products exceeded 3 mm. The mean RMSEs of the PWVs of all the 41 stations resulting from the three schemes were 1.9, 2.4, and 1.7 mm, meaning that product 2 is the worst performer, again, especially at the DAV1 (top pane) and MAW1 (bottom pane) stations.
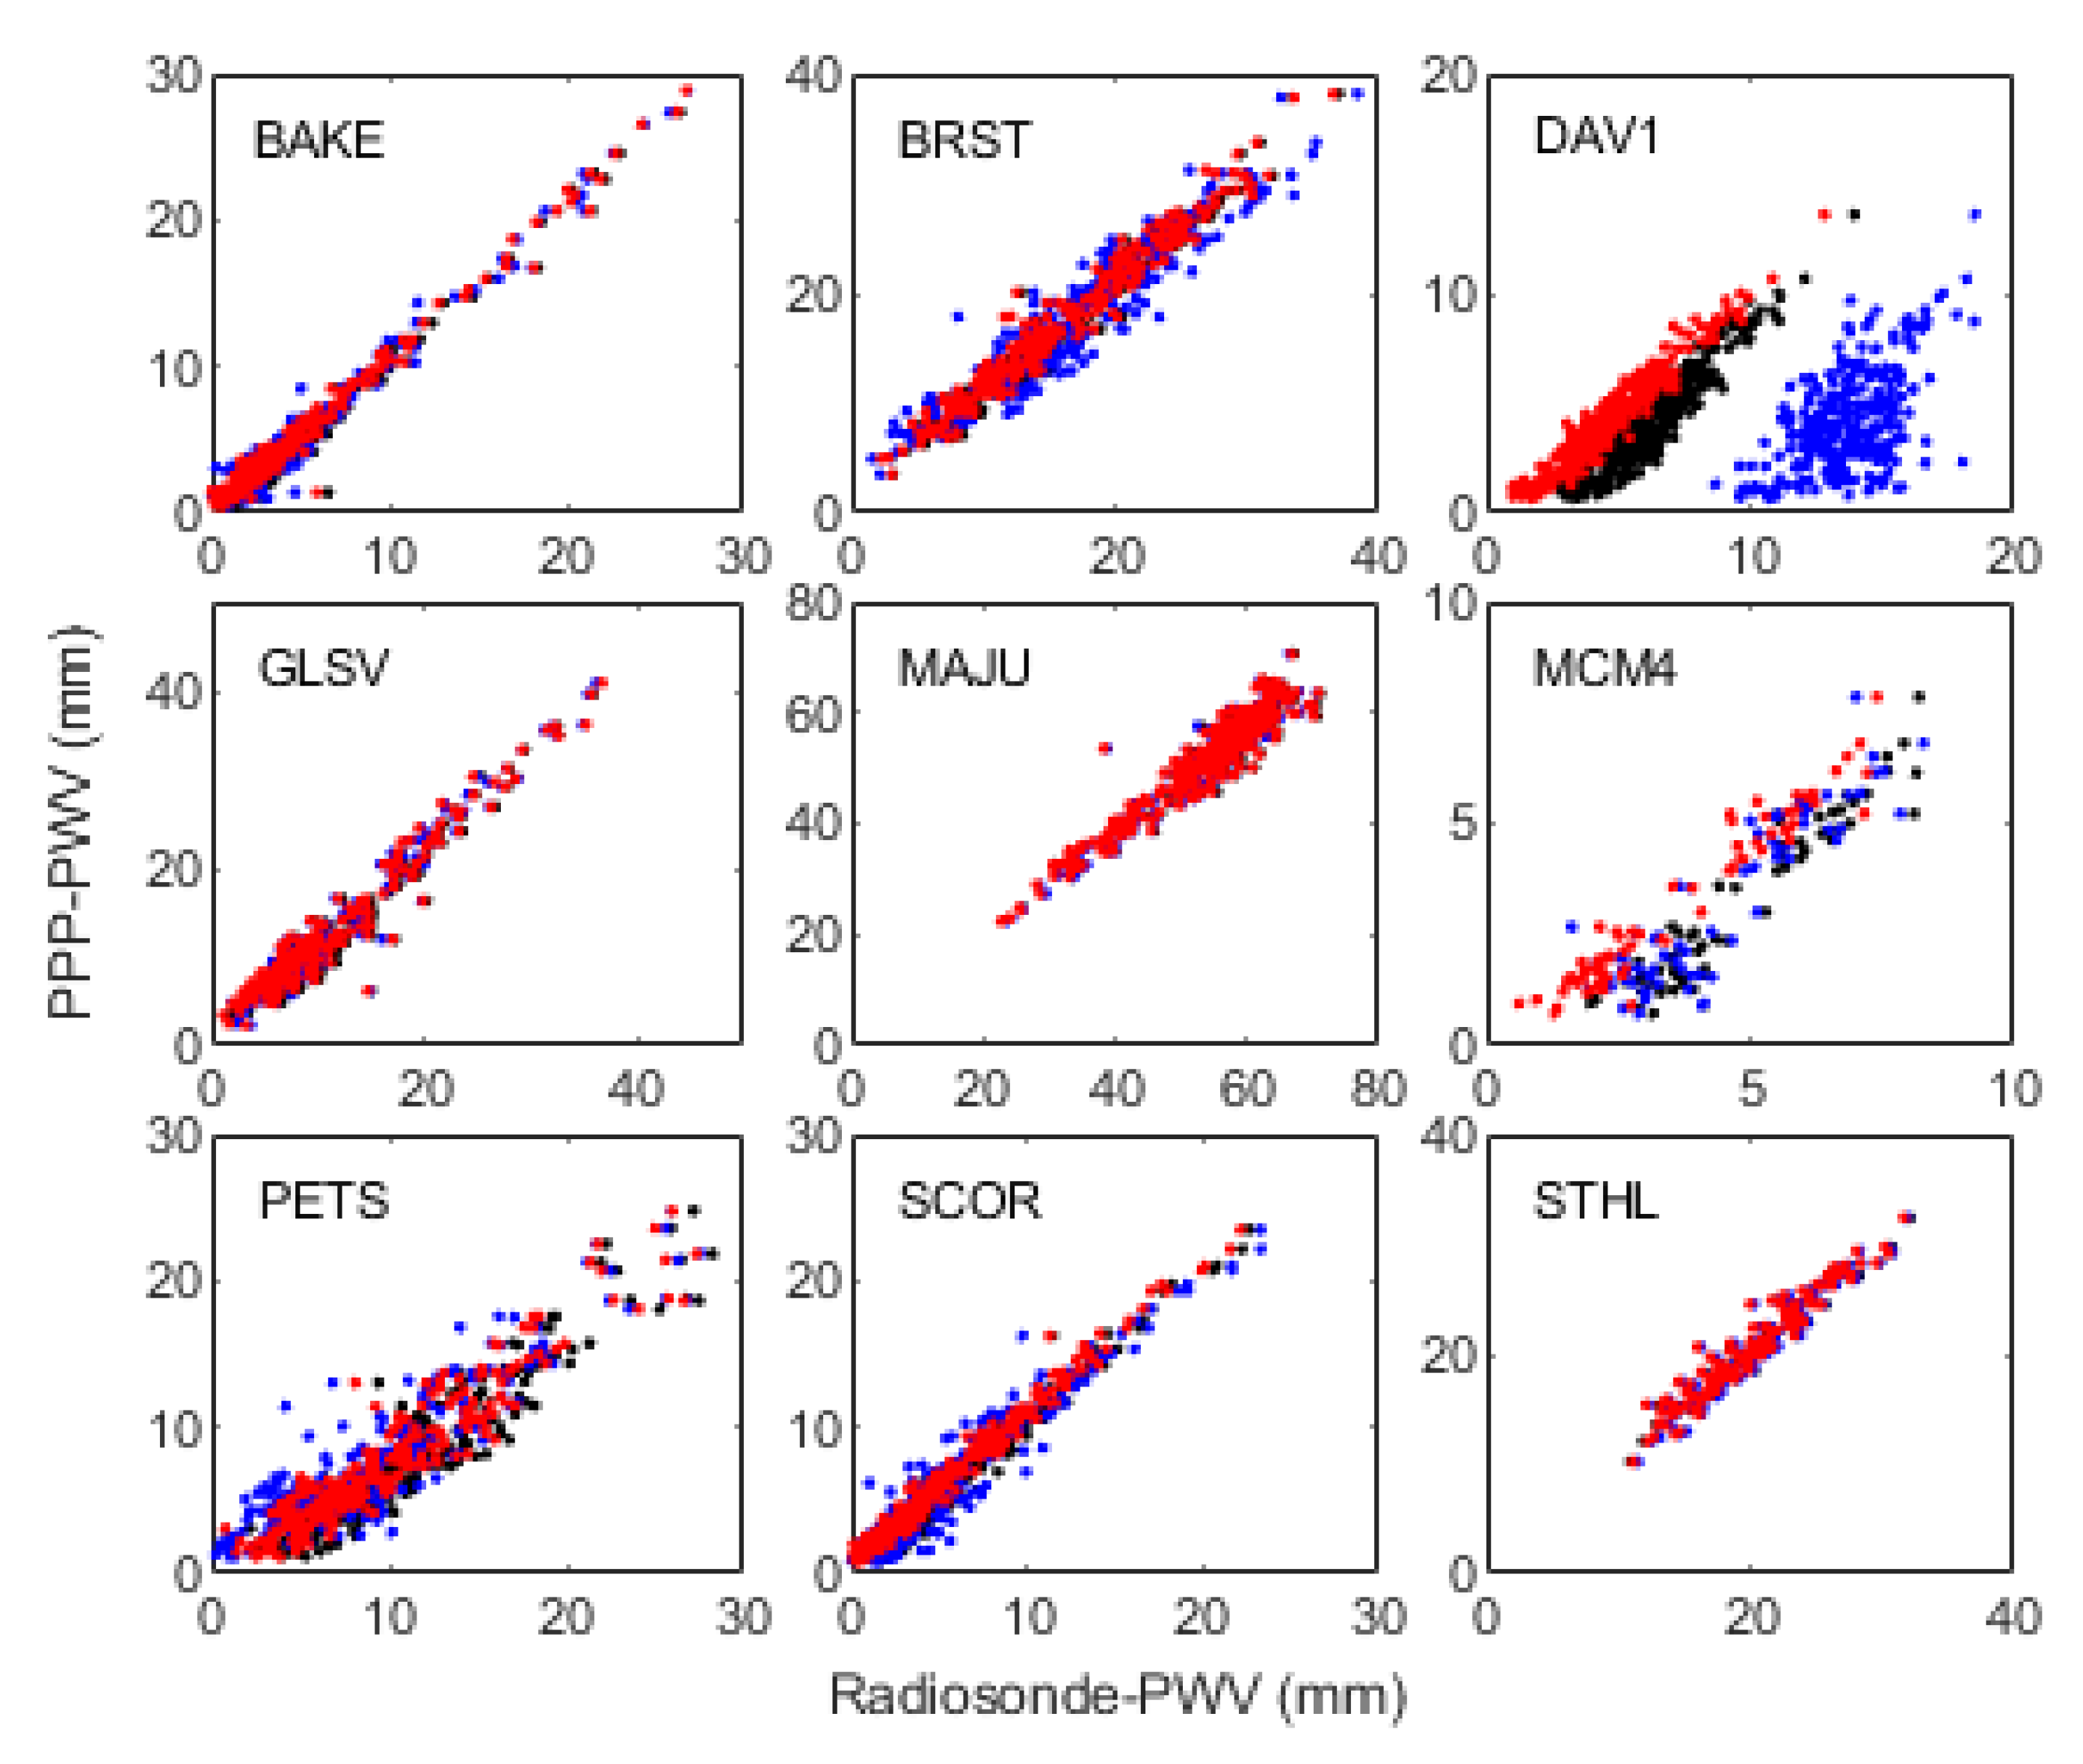
Figure 8 shows the correlation between the PWV converted from PPP-ZWD at nine IGS stations and the reference PWV from their co-located radiosonde stations. It can be seen that product 3 (red) was best, while the PWVs resulting from the other two products at the DAV1 and MCM4 stations were largely underestimated, and both stations are located in Antarctica.

4. Conclusions

RT-PPP has been proven to be an efficient technique for the retrieval of the ZTD over a GNSS station from all GNSS signals observed at the station [24], and the accuracy of the ZTD estimate is affected by various factors, including the a priori ZHD and the mapping function applied in the observation equations [40]. In this research, the ZHD and mapping function from the VMF forecasting products (VMF1_FC and VMF3_FC) were applied to RT-PPP for testing their resultant GPS-PWV, which is converted from GNSS-ZWD. The accuracy of the a priori ZHD derived from three selected grid-based VMF forecasting products was evaluated by comparing them against the reference ZHD obtained from sounding profiles observed at 443 globally distributed radiosonde stations. GPS observations from 41 IGS stations that have co-located radiosonde stations during the period of the first half year of 2020 were used to test GNSS-ZTD and GNSS-PWV. Three sets of ZTDs estimated from RT-PPP and the application of the a priori ZHD and mapping function obtained from the following three VMF products were evaluated: (1) VMF1_FC; (2) VMF3_FC (resolution 5° × 5°); (3) VMF3_FC (resolution 1° × 1°). It is shown that when the ZHDs from the above 443 radiosonde stations from 1 July 2018 to 30 June 2021 were used as the reference, the mean RMSEs of the ZHDs from the three VMF products were 5.9, 5.4, and 4.3 mm, respectively. The ZTDs estimated at the above 41 selected IGS stations were compared against IGS-provided ZTDs, and results indicated that the second VMF product was the worst performer at some stations, and the mean RMSEs of the ZTD estimates of the 41 IGS stations from the three products were 8.6, 9.0 and 8.6 mm, respectively. The mean RMSEs of the PWV converted from the ZWDs at the 41 stations were 1.9, 2.4, and 1.7 mm, respectively, compared to the reference PWV from co-located radiosonde data. These results suggest that the a priori ZHD and mapping function from both VMF1_FC and VMF3_FC can be applied to the PPP approach for obtaining real-time GNSS-PWV in most regions.

Author Contributions

Conceptualization, P.S.; methodology, P.S.; software, P.S.; validation, M.W. and Y.L.; writing—original draft, P.S.; writing—review and editing, K.Z. and S.W. All authors have read and agreed to the published version of the manuscript.

Funding

This work was funded by the National Natural Science Foundation of China (Grant No. 41730109 and 41874040), and the Program of Introducing Talents of Discipline to Universities (Grant No. B20046).

Data Availability Statement

Radiosonde data are available at: ftp://ftp.ncdc.noaa.gov/pub/data/igra/ (accessed on 26 July 2021). VMF1 and VMF3 products are available at: http://doi.org/10.17616/R3RD2H (accessed on 26 July 2021). GPS observations and IGS-provided ZTDs are available at: http://www.igs.gnsswhu.cn/ (accessed on 1 March 2021).

Acknowledgments

We would like to thank the IGS for the provision of GPS observations and tropospheric products, and also thank the IGRA and TU Wien for the provision of radiosonde profiles and VMF products, respectively.

Conflicts of Interest

The authors declare no conflict of interest.

Appendix A. Mathematical Model for GPS Uncombined PPP

GPS code (denoted by P) and phase (denoted by L) observation equations are commonly expressed as:
P r , j s = ρ r s + c ( d t r d t s ) + S T D r s + γ j I r , 1 s + c ( d r , j s d j s ) + ε r , j s L r , j s = ρ r s + c ( d t r d t s ) + S T D r s γ j I r , 1 s + λ j ( N r , j s + b r , j s b j s ) + ξ r , j s
where s and r denote the satellite and receiver, respectively; j is the frequency band (j = 1, 2, 5); ρ r s is the distance between the receiver and satellite; c is the speed of light; d t r and d t s are the clock offsets of the receiver and satellite, respectively; λ j is the wavelength of the carrier phase of the frequency f j ; γ j = ( f 1 / f j ) 2 ; I r , 1 s is the slant ionospheric delay on the frequency f 1 ; N r , j s is the integer ambiguity of the carrier phase; d r , j s and d j s are the uncalibrated code delays (UCD) of the receiver and satellite, respectively; b r , j s and b j s are the uncalibrated phase delays (UPD) of the receiver and satellite, respectively; ε r , j s and ξ r , j s are the observation noise of the code and phase observations, respectively.
The IGS GPS satellite clock products are conventionally generated through a linear ionosphere-free (IF) combination of L1 and L2 dual-frequency observations. As a result, the linear combination of the satellite’s UCDs are contained in the satellite clock error d t ¯ s :
d t ¯ s = d t s + α 12 d 1 s + β 12 d 2 s + d D
where α 12 = f 1 2 f 1 2 f 2 2 , β 12 = f 2 2 f 1 2 f 2 2 , d 1 s and d 2 s are the satellite UCDs of corresponding code observations, and d D is the error caused by the reference frame when d t ¯ s is estimated. After the slant hydrostatic delay, the satellite orbit, and clock products are applied, Equation (A1) becomes:
Δ P r , j s = e r s Δ x + c d t r + d D + d r , j s + Z W D m f w r s + γ j I r , 1 s + c d I F , 12 s d j s + ε r , j s Δ L r , j s = e r s Δ x + c d t r + d D + d r , j s + Z W D m f w r s γ j I r , 1 s + λ j s N r , j s + b r , j s b j s + c d I F , 12 s d r s + ξ r , j s
where P r , j s and L r , j s are the observed-minus-computed (O-C) code and phase observations, respectively; e r s is the unit vector of the component from r to s ; x is the increment of the receiver’s (or station’s) coordinate with respect to its a priori value; c ( d I F , 12 s d j s ) is the satellite code bias item that can be corrected by the differential or observation-specific code bias product. In this research, the code bias is corrected by the observation-specific code bias corrections contained in the CLK93 real-time orbit and clock correction stream.
To solve the rank-deficient problem when estimating the position, the receiver’s clock offset, the ZWD, the ionospheric delays, and ambiguities, a re-parameterization process is often performed on the L1/L2 dual-frequency observation equations. After the code bias is corrected, Equation (4) is simplified to:
P r , j s = e r s x + c d t ¯ r + Z W D m f w r s + γ j I r , 1 s + ε r , j s L r , j s = e r s x + c d t ¯ r + Z W D m f w r s γ j I r , 1 s + N ¯ r , j s + ξ r , j s
where d t ¯ r , I r , 1 s , and N ¯ r , j s are the re-parameterized receiver clock offset, slant ionospheric delay, and ambiguities, respectively:
d t ¯ r = d t r + d r , I F 12 + d D I ¯ r , 1 = I r , 1 s + c β 12 D C B r , 12 N ¯ r , 1 s = λ 1 s N r , 1 s + b r , 1 s b 1 s + c d I F , 12 s d r , I F 12 + c β 12 D C B r , 12 N ¯ r , j s = λ 2 s N r , 2 + b r , 2 s b 2 s + c d I F , 12 s d r , I F 12 c α 12 D C B r , 12
where d r , I F 12 = α 12 d r , 1 + β 12 d r , 2 ; D C B is the differential code bias: D C B r , 12 = d r , 1 s d r , 2 s .
If n GPS satellites are tracked by the receiver at an epoch, the estimated parameters of the GPS dual-frequency uncombined PPP at the epoch can be expressed as:
[ X ¯ , d t ¯ r ,   Z W D ,   I ¯ r , 1 s ( 1 ~ n ) ,   N ¯ r , 1 s ( 1 ~ n ) , N ¯ r , 2 s ( 1 ~ n ) ]
where X ¯ is the vector of the receiver coordinate; I ¯ r , 1 s ( 1 ~ n ) , N ¯ r , 1 s ( 1 ~ n ) , and N ¯ r , 2 s ( 1 ~ n ) are the vectors of the slant ionospheric delay and the ambiguities on the two frequencies, respectively.

References

  1. Böhm, J.; Niell, A.; Tregoning, P.; Schuh, H. The Global Mapping Function (GMF): A New Empirical Mapping Function Based on Numerical Weather Model Data. Geophys. Res. Lett. 2006, 33, L07304. [Google Scholar] [CrossRef] [Green Version]
  2. Boehm, J.; Werl, B.; Schuh, H. Troposphere Mapping Functions for GPS and Very Long Baseline Interferometry from European Centre for Medium-Range Weather Forecasts Operational Analysis Data. J. Geophys. Res. Solid Earth 2006, 111, B02406. [Google Scholar] [CrossRef]
  3. Landskron, D.; Böhm, J. Refined Discrete and Empirical Horizontal Gradients in VLBI Analysis. J. Geod. 2018, 92, 1387–1399. [Google Scholar] [CrossRef] [Green Version]
  4. Guerova, G.; Jones, J.; Douša, J.; Dick, G.; de Haan, S.; Pottiaux, E.; Bock, O.; Pacione, R.; Elgered, G.; Vedel, H.; et al. Review of the State of the Art and Future Prospects of the Ground-Based GNSS Meteorology in Europe. Atmos. Meas. Tech. 2016, 9, 5385–5406. [Google Scholar] [CrossRef] [Green Version]
  5. Gutman, S.I.; Sahm, S.R.; Benjamin, S.G.; Schwartz, B.E.; Holub, K.L.; Stewart, J.Q.; Smith, T.L. Rapid Retrieval and Assimilation of Ground Based GPS Precipitable Water Observations at the NOAA Forecast Systems Laboratory: Impact on Weather Forecasts. J. Meteorol. Soc. Jpn. 2004, 82, 351–360. [Google Scholar] [CrossRef] [Green Version]
  6. Mile, M.; Benáček, P.; Rózsa, S. The Use of GNSS Zenith Total Delays in Operational AROME/Hungary 3D-Var over a Central European Domain. Atmos. Meas. Tech. 2019, 12, 1569–1579. [Google Scholar] [CrossRef] [Green Version]
  7. Rohm, W.; Yuan, Y.; Biadeglgne, B.; Zhang, K.; Marshall, J.L. Ground-Based GNSS ZTD/IWV Estimation System for Numerical Weather Prediction in Challenging Weather Conditions. Atmos. Res. 2014, 138, 414–426. [Google Scholar] [CrossRef]
  8. Ahmed, F.; Václavovic, P.; Teferle, F.N.; Douša, J.; Bingley, R.; Laurichesse, D. Comparative Analysis of Real-Time Precise Point Positioning Zenith Total Delay Estimates. GPS Solut. 2016, 20, 187–199. [Google Scholar] [CrossRef] [Green Version]
  9. Dousa, J.; Vaclavovic, P. Real-Time Zenith Tropospheric Delays in Support of Numerical Weather Prediction Applications. Adv. Space Res. 2014, 53, 1347–1358. [Google Scholar] [CrossRef]
  10. Li, X.; Dick, G.; Ge, M.; Heise, S.; Wickert, J.; Bender, M. Real-Time GPS Sensing of Atmospheric Water Vapor: Precise Point Positioning with Orbit, Clock, and Phase Delay Corrections. Geophys. Res. Lett. 2014, 41, 3615–3621. [Google Scholar] [CrossRef] [Green Version]
  11. Shi, J.; Xu, C.; Guo, J.; Gao, Y. Real-Time GPS Precise Point Positioning-Based Precipitable Water Vapor Estimation for Rainfall Monitoring and Forecasting. IEEE Trans. Geosci. Remote Sens. 2015, 53, 3452–3459. [Google Scholar] [CrossRef]
  12. Yuan, Y.; Zhang, K.; Rohm, W.; Choy, S.; Norman, R.; Wang, C.-S. Real-Time Retrieval of Precipitable Water Vapor from GPS Precise Point Positioning: Real-Time Retrieval of PWV from GPS PPP. J. Geophys. Res. Atmos. 2014, 119, 10044–10057. [Google Scholar] [CrossRef]
  13. Hadas, T.; Hobiger, T. Benefits of Using Galileo for Real-Time GNSS Meteorology. IEEE Geosci. Remote Sens. Lett. 2020, 1–5. [Google Scholar] [CrossRef]
  14. Li, X.; Dick, G.; Lu, C.; Ge, M.; Nilsson, T.; Ning, T.; Wickert, J.; Schuh, H. Multi-GNSS Meteorology: Real-Time Retrieving of Atmospheric Water Vapor from BeiDou, Galileo, GLONASS, and GPS Observations. IEEE Trans. Geosci. Remote Sens. 2015, 53, 6385–6393. [Google Scholar] [CrossRef] [Green Version]
  15. Li, X.; Tan, H.; Li, X.; Dick, G.; Wickert, J.; Schuh, H. Real-Time Sensing of Precipitable Water Vapor from BeiDou Observations: Hong Kong and CMONOC Networks. J. Geophys. Res. Atmos. 2018, 123, 7897–7909. [Google Scholar] [CrossRef]
  16. Lu, C.; Li, X.; Nilsson, T.; Ning, T.; Heinkelmann, R.; Ge, M.; Glaser, S.; Schuh, H. Real-Time Retrieval of Precipitable Water Vapor from GPS and BeiDou Observations. J. Geod. 2015, 89, 843–856. [Google Scholar] [CrossRef]
  17. Lu, C.; Li, X.; Ge, M.; Heinkelmann, R.; Nilsson, T.; Soja, B.; Dick, G.; Schuh, H. Estimation and Evaluation of Real-Time Precipitable Water Vapor from GLONASS and GPS. GPS Solut. 2016, 20, 703–713. [Google Scholar] [CrossRef] [Green Version]
  18. Lu, C.; Chen, X.; Liu, G.; Dick, G.; Wickert, J.; Jiang, X.; Zheng, K.; Schuh, H. Real-Time Tropospheric Delays Retrieved from Multi-GNSS Observations and IGS Real-Time Product Streams. Remote Sens. 2017, 9, 1317. [Google Scholar] [CrossRef] [Green Version]
  19. Lu, C.; Feng, G.; Zheng, Y.; Zhang, K.; Tan, H.; Dick, G.; Wickert, J. Real-Time Retrieval of Precipitable Water Vapor from Galileo Observations by Using the MGEX Network. IEEE Trans. Geosci. Remote Sens. 2020, 58, 4743–4753. [Google Scholar] [CrossRef]
  20. Pan, L.; Guo, F. Real-Time Tropospheric Delay Retrieval with GPS, GLONASS, Galileo and BDS Data. Sci. Rep. 2018, 8, 17067. [Google Scholar] [CrossRef] [Green Version]
  21. Ding, W.; Teferle, F.N.; Kazmierski, K.; Laurichesse, D.; Yuan, Y. An Evaluation of Real-Time Troposphere Estimation Based on GNSS Precise Point Positioning. J. Geophys. Res. Atmos. 2017, 122, 2779–2790. [Google Scholar] [CrossRef]
  22. Lu, C.; Li, X.; Cheng, J.; Dick, G.; Ge, M.; Wickert, J.; Schuh, H. Real-Time Tropospheric Delay Retrieval from Multi-GNSS PPP Ambiguity Resolution: Validation with Final Troposphere Products and a Numerical Weather Model. Remote Sens. 2018, 10, 481. [Google Scholar] [CrossRef] [Green Version]
  23. Hadas, T.; Teferle, F.N.; Kazmierski, K.; Hordyniec, P.; Bosy, J. Optimum Stochastic Modeling for GNSS Tropospheric Delay Estimation in Real-Time. GPS Solut. 2017, 21, 1069–1081. [Google Scholar] [CrossRef] [Green Version]
  24. Hadas, T.; Hobiger, T.; Hordyniec, P. Considering Different Recent Advancements in GNSS on Real-Time Zenith Troposphere Estimates. GPS Solut. 2020, 24, 99. [Google Scholar] [CrossRef]
  25. Shi, J.; Xu, C.; Li, Y.; Gao, Y. Impacts of Real-Time Satellite Clock Errors on GPS Precise Point Positioning-Based Troposphere Zenith Delay Estimation. J. Geod. 2015, 89, 747–756. [Google Scholar] [CrossRef]
  26. Zhang, S.; Fang, L.; Wang, G.; Li, W. The Impact of Second-Order Ionospheric Delays on the ZWD Estimation with GPS and BDS Measurements. GPS Solut. 2020, 24, 41. [Google Scholar] [CrossRef]
  27. Zhang, Z.; Guo, F.; Zhang, X. The Effects of Higher-Order Ionospheric Terms on GPS Tropospheric Delay and Gradient Estimates. Remote Sens. 2018, 10, 1561. [Google Scholar] [CrossRef] [Green Version]
  28. Zhao, L.; Václavovic, P.; Douša, J. Performance Evaluation of Troposphere Estimated from Galileo-Only Multi-Frequency Observations. Remote Sens. 2020, 12, 373. [Google Scholar] [CrossRef] [Green Version]
  29. Zus, F.; Deng, Z.; Wickert, J. The Impact of Higher-Order Ionospheric Effects on Estimated Tropospheric Parameters in Precise Point Positioning: Higher-Order Ionospheric Effects. Radio Sci. 2017, 52, 963–971. [Google Scholar] [CrossRef] [Green Version]
  30. Kouba, J. Implementation and Testing of the Gridded Vienna Mapping Function 1 (VMF1). J. Geod. 2008, 82, 193–205. [Google Scholar] [CrossRef]
  31. Tregoning, P.; Herring, T.A. Impact of a Priori Zenith Hydrostatic Delay Errors on GPS Estimates of Station Heights and Zenith Total Delays. Geophys. Res. Lett. 2006, 33, L23303. [Google Scholar] [CrossRef] [Green Version]
  32. Saastamoinen, J. Atmospheric correction for the troposphere and stratosphere in radio ranging satellites. In The Use of Artificial Satellites for Geodesy; American Geophysical Union (AGU): Washington, DC, USA, 1972; pp. 247–251. ISBN 978-1-118-66364-6. [Google Scholar]
  33. Boehm, J.; Heinkelmann, R.; Schuh, H. Short Note: A Global Model of Pressure and Temperature for Geodetic Applications. J. Geod. 2007, 81, 679–683. [Google Scholar] [CrossRef]
  34. Böhm, J.; Möller, G.; Schindelegger, M.; Pain, G.; Weber, R. Development of an Improved Empirical Model for Slant Delays in the Troposphere (GPT2w). GPS Solut. 2015, 19, 433–441. [Google Scholar] [CrossRef] [Green Version]
  35. Lagler, K.; Schindelegger, M.; Böhm, J.; Krásná, H.; Nilsson, T. GPT2: Empirical Slant Delay Model for Radio Space Geodetic Techniques. Geophys. Res. Lett. 2013, 40, 1069–1073. [Google Scholar] [CrossRef] [PubMed] [Green Version]
  36. Wang, X.; Zhang, K.; Wu, S.; He, C.; Cheng, Y.; Li, X. Determination of Zenith Hydrostatic Delay and Its Impact on GNSS-Derived Integrated Water Vapor. Atmos. Meas. Tech. 2017, 10, 2807–2820. [Google Scholar] [CrossRef] [Green Version]
  37. Landskron, D.; Böhm, J. VMF3/GPT3: Refined Discrete and Empirical Troposphere Mapping Functions. J. Geod. 2018, 92, 349–360. [Google Scholar] [CrossRef] [PubMed]
  38. Re3data.org: VMF Data Server Editing Status 2020-12-14; Re3data.Org-Registry of Research Data Repositories. Available online: https://vmf.geo.tuwien.ac.at (accessed on 26 July 2021).
  39. Yao, Y.; Xu, X.; Xu, C.; Peng, W.; Wan, Y. GGOS Tropospheric Delay Forecast Product Performance Evaluation and Its Application in Real-Time PPP. J. Atmos. Sol.-Terr. Phys. 2018, 175, 1–17. [Google Scholar] [CrossRef]
  40. Yuan, Y.; Holden, L.; Kealy, A.; Choy, S.; Hordyniec, P. Assessment of Forecast Vienna Mapping Function 1 for Real-Time Tropospheric Delay Modeling in GNSS. J. Geod. 2019, 93, 1501–1514. [Google Scholar] [CrossRef]
  41. Weber, G.; Mervart, L.; Stürze, A. BKG Ntrip Client (BNC): Version 2.12; Verlag des Bundesamtes für Kartographie und Geodäsie: Frankfurt am Main, Germany, 2016; Volume 49. [Google Scholar]
  42. Davis, J.L.; Herring, T.A.; Shapiro, I.I.; Rogers, A.E.E.; Elgered, G. Geodesy by Radio Interferometry: Effects of Atmospheric Modeling Errors on Estimates of Baseline Length. Radio Sci. 1985, 20, 1593–1607. [Google Scholar] [CrossRef]
  43. Zhang, H.; Yuan, Y.; Li, W. An Analysis of Multisource Tropospheric Hydrostatic Delays and Their Implications for GPS/GLONASS PPP-Based Zenith Tropospheric Delay and Height Estimations. J. Geod. 2021, 95, 83. [Google Scholar] [CrossRef]
  44. Sun, P.; Wu, S.; Zhang, K.; Wan, M.; Wang, R. A New Global Grid-Based Weighted Mean Temperature Model Considering Vertical Nonlinear Variation. Atmos. Meas. Tech. 2021, 14, 2529–2542. [Google Scholar] [CrossRef]
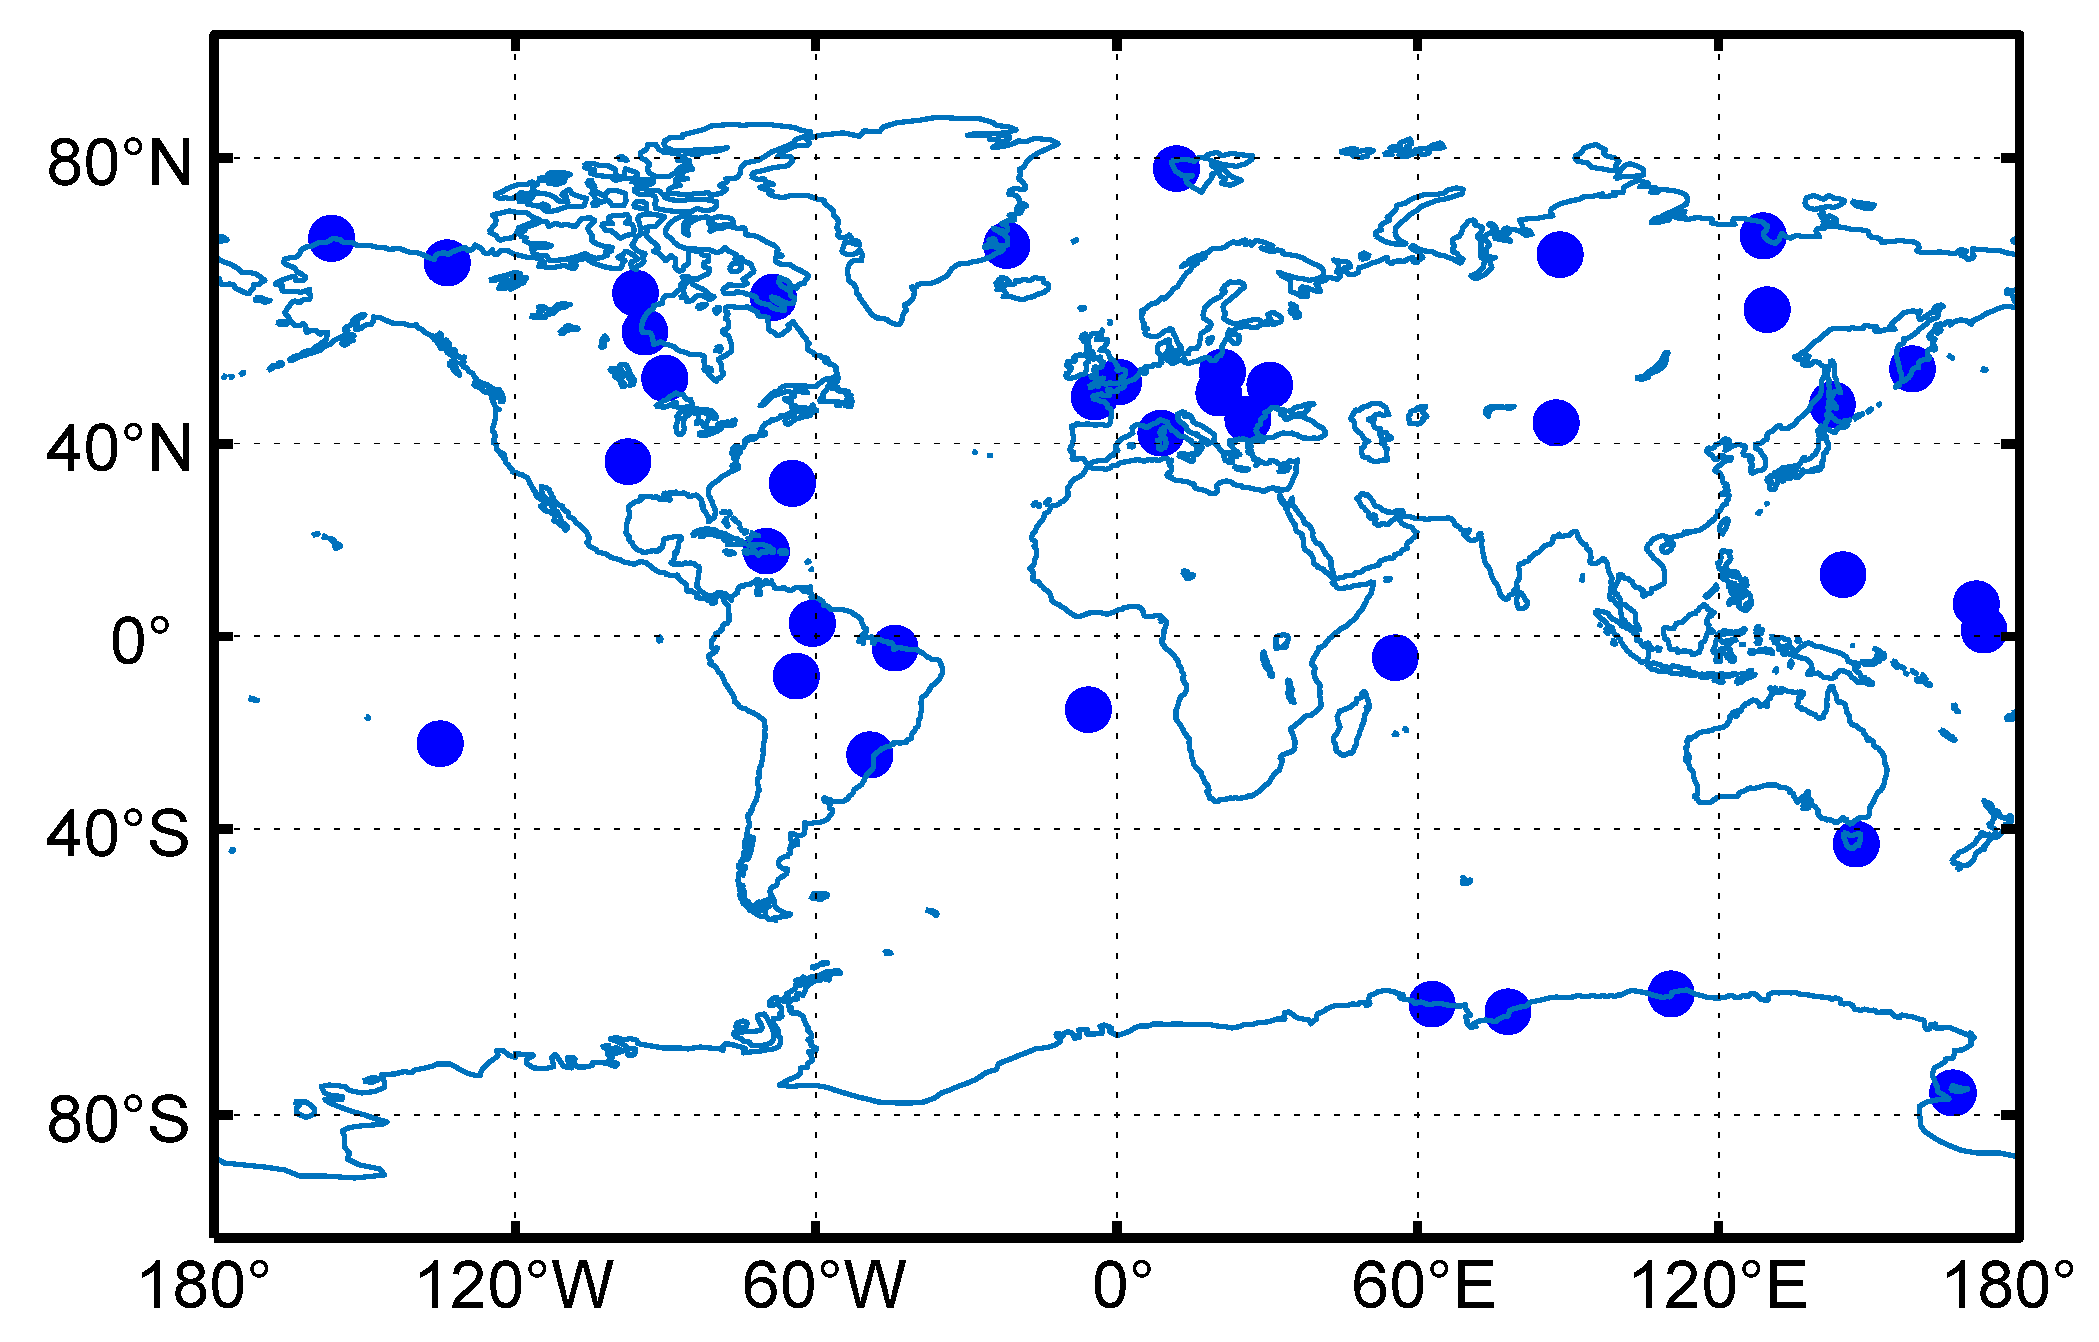
Figure 1. Distribution of 41 selected IGS stations.
Remotesensing 13 03245 g001
Figure 2. Procedure of the RT-PPP-based PWV retrieval utilizing VMF1/VMF3 forecasting products.
Remotesensing 13 03245 g002
Figure 3. Bias (left) and RMSE (right) of ZHD at each of the 443 radiosonde stations from 1 July 2018 to 30 June 2021 resulting from product 1 (top), product 2 (middle), and product 3 (bottom).
Remotesensing 13 03245 g003
Figure 4. Correlation between the weighted absolute height difference (WAHD) and two statistics (bias and RMSE in Figure 3). (a1) Bias-WAHD (VMF1_FC). (a2) Bias-WAHD (VMF1_FC). (a3) Bias-WAHD (VMF1_FC). (b1) RMSE-WAHD (VMF1_FC). (b2) RMSE-WAHD (VMF1_FC). (b3) RMSE-WAHD (VMF1_FC).
Remotesensing 13 03245 g004
Figure 5. Time series of the ZHD obtained from GPT3 model and VMF1/VMF3 forecasting products in July 2018 at four radiosonde stations (DOY represents “day of year”). (a) ZHD time series at No. 94866. (b) ZHD time series at No. 71043. (c) ZHD time series at No. 07110. (d) ZHD time series at No. 04220.
Remotesensing 13 03245 g005
Figure 6. RMSE of the ZTDs estimated from PPP of 154 days in 2020 resulting from three VMF forecasting products at each of the 41 selected IGS stations.
Remotesensing 13 03245 g006
Figure 7. RMSE of the PWVs converted from PPP-ZWDs during 154 days in 2020 at each of the 41 IGS stations resulting from three VMF forecasting products.
Remotesensing 13 03245 g007
Figure 8. Correlation between the PWV converted from PPP-ZWD of 154 days in 2020 at nine IGS stations resulting from three VMF products (the results of products 1 to 3 are in black, blue, and red, respectively) and the reference PWV from radiosonde data.
Remotesensing 13 03245 g008
Table 1. Processing strategies of RT-PPP.
ItemStrategy
FrequencyGPS: L1, L2
Sampling interval30 s
Elevation cut-off angle
PPP modelUncombined PPP (see Appendix A)
Receiver phase centerCorrected
Solid earth tideCorrected
Ocean tideCorrected
Phase wind-upCorrected
Estimation methodKalman filtering
Station coordinateEstimated, constant was assumed
ZHDCorrected with VMF1_FC/VMF3_FC grid
ZWDEstimated, random-walk process was assumed (0.02 m m / s ), and the initial value of the first epoch was set to the ZWD derived from VMF1_FC/VMF3_FC grid.
Tropospheric gradientNeglected
Mapping functionVMF1/VMF3
Receiver clock errorEstimated, white noise was assumed
AmbiguityEstimated, float constant was assumed
Slant ionospheric delayEstimated, random-walk process was assumed (0.04 m / s )
Table 2. Three VMF forecasting data were tested in this research.
Product No.VMF ProductResolutionMapping Function
1VMF1_FC2.5° × 2°VMF1
2VMF3_FC5° × 5°VMF3
3VMF3_FC1° × 1°VMF3
Table 3. Statistical results of all the 443 stations shown in Figure 2 for the three products.
Product No.Bias (mm)
Mean [Min, Max]
RMSE (mm)
Mean [Min, Max]
1−2.2[−38.9, 53.0]5.9[1.4, 53.1]
20.5[−41.3, 53.2]5.4[1.3, 53.3]
31.7[−18.2, 55.1]4.3[1.3, 55.1]
Publisher’s Note: MDPI stays neutral with regard to jurisdictional claims in published maps and institutional affiliations.