Article

Validation of FY-3D MERSI-2 Precipitable Water Vapor (PWV) Datasets Using Ground-Based PWV Data from AERONET

1
State Environment Protection Key Laboratory of Satellite Remote Sensing, Aerospace Information Research Institute, Chinese Academy of Sciences, Beijing 100101, China
2
University of Chinese Academy of Sciences, Beijing 100049, China
3
Institute of Remote Sensing Satellite, China Academy of Space Technology, Beijing 100094, China
*
Author to whom correspondence should be addressed.
Remote Sens. 2021, 13(16), 3246; https://doi.org/10.3390/rs13163246
Submission received: 25 June 2021 / Revised: 5 August 2021 / Accepted: 12 August 2021 / Published: 16 August 2021
(This article belongs to the Section Atmospheric Remote Sensing)

Abstract

:
The medium resolution spectral imager-2 (MERSI-2) is one of the most important sensors onboard China’s latest polar-orbiting meteorological satellite, Fengyun-3D (FY-3D). The National Satellite Meteorological Center of China Meteorological Administration has developed four precipitable water vapor (PWV) datasets using five near-infrared bands of MERSI-2, including the P905 dataset, P936 dataset, P940 dataset and the fusion dataset of the above three datasets. For the convenience of users, we comprehensively evaluate the quality of these PWV datasets with the ground-based PWV data derived from Aerosol Robotic Network. The validation results show that the P905, P936 and fused PWV datasets have relatively large systematic errors (−0.10, −0.11 and −0.07 g/cm2), whereas the systematic error of the P940 dataset (−0.02 g/cm2) is very small. According to the overall accuracy of these four PWV datasets by our assessments, they can be ranked in descending order as P940 dataset, fused dataset, P936 dataset and P905 dataset. The root mean square error (RMSE), relative error (RE) and percentage of retrieval results with error within ± ( 0.05 + 0.10 P W V A E R O N E T ) (PER10) of the P940 PWV dataset are 0.24 g/cm2, 0.10 and 76.36%, respectively. The RMSE, RE and PER10 of the P905 PWV dataset are 0.38 g/cm2, 0.15 and 57.72%, respectively. In order to obtain a clearer understanding of the accuracy of these four MERSI-2 PWV datasets, we compare the accuracy of these four MERSI-2 PWV datasets with that of the widely used MODIS PWV dataset and AIRS PWV dataset. The results of the comparison show that the accuracy of the MODIS PWV dataset is not as good as that of all four MERSI-2 PWV datasets, due to the serious overestimation of the MODIS PWV dataset (0.40 g/cm2), and the accuracy of the AIRS PWV dataset is worse than that of the P940 and fused MERSI-2 PWV datasets. In addition, we analyze the error distribution of the four PWV datasets in different locations, seasons and water vapor content. Finally, the reason why the fused PWV dataset is not the one with the highest accuracy among the four PWV datasets is discussed.

Graphical Abstract

1. Introduction

Water vapor is one of the most important sources of the greenhouse effect [1], as well as a key factor affecting precipitation, severe weather and the global energy cycle [2,3,4]. Although water vapor only accounts for a small part of the total atmosphere, it plays an important role in the earth’s weather system and climate change. In addition, due to the emission and absorption of radiation in specific spectral regions by water vapor, it can significantly affect the accuracy of quantitative remote sensing, such as land surface temperature inversion based on thermal infrared data [5,6] and aerosol retrieval [7,8]. The precipitable water vapor (PWV) is the total atmospheric water vapor contained in a vertical column of a unit cross-sectional area of the atmosphere from the ground to the top of the atmosphere (unit: g/cm2), and is an important parameter to characterize the water vapor content. Due to the uneven distribution of water vapor sources and complex water vapor transmission, the spatial distribution of water vapor varies greatly within the globe. Therefore, the large-scale monitoring of PWV is of great significance for research on climate change, weather forecasting, quantitative remote sensing and so on.
At present, there are two main methods to monitor PWV. One is to use ground-based sites, such as sun photometer networks, radiosondes, global positioning system (GPS) receivers and ground-based microwave radiometers [9,10,11,12,13]. The other is to use remote sensing data, such as water vapor monitoring using the moderate resolution imaging spectroradiometer (MODIS) and the calibration microwave radiometer (CMR) data [14,15,16,17]. In general, the accuracy of ground-based measurement is better than that of remote sensing inversion results [11]. However, due to the huge difference in the spatial distribution of water vapor, uneven distribution of ground-based sites and limited number of sites, ground-based measurement cannot effectively monitor water vapor on a large scale, especially in remote areas lacking ground-based sites. Compared with ground-based measurement, satellite remote sensing data can be effectively used for the large-scale monitoring of water vapor. According to the spectral range of remote sensing data, the water vapor retrieval algorithms can be divided into three categories: microwave algorithm [14,18], thermal infrared (TIR) algorithm [19,20] and near-infrared (NIR) algorithm [15,21]. After decades of development, there are a large number of satellite sensors that can be used for water vapor retrieval, such as the medium resolution spectral imager-2 (MERSI-2) and MODIS for the NIR algorithm [15,22,23], the Spinning Enhanced Visible and Infrared Imager (SEVIRI) and the Advanced Very High Resolution Radiometer (AVHRR) for the TIR algorithm [24,25,26,27] and the Microwave Radiation Imager (MWRI) and the CMR for the microwave algorithm [14,16,28,29]. Since the spatial distribution of water vapor changes rapidly with time, and the transit time of the above-mentioned sensors is different, all of the PWV products developed for the above sensors are very useful for the assessment of climate change and the atmospheric correction of remote sensing data.
MERSI-2 is one of the main payloads onboard China’s newest polar-orbiting meteorological satellite Fengyun (FY)-3D [30]. It has 25 spectral bands, including nine visible (VIS) bands, eight NIR bands, four mid-infrared (MIR) bands and four far-infrared (FIR) bands. Wang et al. [22] developed four PWV datasets over land using five NIR bands of MERSI-2 with the wavelengths at around 1 micron. The above-mentioned PWV datasets have been adopted by China’s National Satellite Meteorological Center (NSMC) and have been publicly released as official PWV products. In order to facilitate the use of MERSI-2 PWV products, it is necessary to evaluate them comprehensively. The previous study has shown that the MERSI-2 PWV products have high accuracy and are in good agreement with ground-based PWV data [22]. However, the previous validation mainly focused on the evaluation of MERSI-2 PWV products in North America. The accuracy assessment of the MERSI-2 PWV products in other regions is still lacking. Therefore, it is necessary to evaluate the FY-3D/MERSI-2 PWV data on a global scale.
The main objective of this work is to comprehensively evaluate the quality of MERSI-2 PWV products for the convenience of users. The Aerosol Robotic Network (AERONET) PWV data, which are a kind of ground-based data that are widely used for accuracy assessment of remote sensing PWV data [31], will be used as true values for the validation of MERSI-2 PWV data. In addition to the overall validation, we will also make a systematic evaluation of their applicability under different conditions. The structure of this paper is as follows. Section 2 introduces the MERSI-2 PWV data, the ground-based data used for validation and the statistical parameters used for accuracy evaluation. Next, the specific validation results and corresponding analysis are provided in Section 3. After that, the validation results are discussed in Section 4. Finally, this paper is concluded in Section 5.

2. Materials and Methods

2.1. FY-3D MERSI-2 PWV Data

FY-3D, China’s latest polar-orbiting meteorological satellite, was launched on 15 November 2017. FY-3D has been in operation since 1 January 2019. It has an orbital height of 836 km and its orbital period is 101.5 min. MERSI-2 is one of the most important sensors onboard FY-3D, and is mainly used for atmospheric monitoring. Thanks to its very large imaging width, MERSI-2 can obtain seamless images of the world every day. MERSI-2 has five NIR bands for water vapor monitoring, including three water vapor absorption bands (905, 936 and 940 nm) and two bands (865 and 1030 nm) in atmospheric window. The spectral response functions (SRF) of these five bands are shown in Figure 1, and their spatial resolution and signal-to-noise (SNR) ratios are shown in Table 1 [32]. The MERSI-2 PWV products used in this work are developed using the data of these five bands, and these data can be downloaded for free from the website of China’s NSMC (http://www.nsmc.org.cn/en/NSMC/Home/Index.html, accessed on 6 April 2021).
The principle of retrieval algorithm for developing MERSI-2 PWV products is as follows. Due to their relatively long wavelengths, the atmospheric path reflectance of these five bands can be ignored, and the TOA reflectance observed by the satellite can be calculated using Equation (1).
T O A λ = T λ R E F λ ,
where T O A λ , T λ and R E F λ are the TOA reflectance, total atmospheric transmittance and surface reflectance of the band with the center wavelength of λ, respectively.
Since the change of surface reflectance can be regarded as a linear change in the spectral range of 850–1250 nm [15], we can use the linear interpolation method to calculate the TOA reflectance of water vapor absorption bands (905, 936 and 940 nm) when the water vapor content is zero according to the TOA reflectance of the near bands (865 and 1030 nm) in atmospheric window. The specific method of calculation is shown in Equation (2).
T O A λ = T O A λ 1 + ( T O A λ 2 T O A λ 1 ) ( λ λ 1 ) ( λ 2 λ 1 ) ,
where T O A λ is the TOA of the band at λ obtained by linear interpolation using the TOA of band at λ 1 and band at λ 2 .
Next, we can calculate the total transmittance of the atmosphere of water vapor absorption bands according to Equation (3) [22].
T λ = T O A λ / T O A λ ,
After that, we can use the MODerate resolution atmospheric TRANsmission (MODTRAN) code [33] in order to calculate the total atmosphere transmittance under different PWV conditions and obtain the PWV retrieval result by interpolation.
According to the PWV retrieval algorithm mentioned above, we can develop three PWV datasets that are derived from the combination of band 15, band 16 and band 19, the combination of band 15, band 17 and band 19 and the combination of band 15, band 18 and band 19, respectively (listed in Table 1). For the convenience of description, we refer to the above three PWV datasets as P905, P936 and P940 datasets according to the water vapor absorption channels used to develop them. However, the above three PWV results are different due to the difference in the sensitivity of the three water vapor absorption channels to water vapor. This will bring confusion to data users. In order to solve this problem and improve the accuracy of PWV retrieval results, Wang et al. [22] fuse the above three PWV results according to the sensitivity of different channels (905, 936 and 940 nm) to water vapor. The specific fusion method is shown in Equation (4).
P = P 1 W 1 + P 2 W 2 + P 3 W 3 ,
where P 1 , P 2 and P 3 are the PWV retrieved using the combination of band 15, band 16 and band 19, the combination of band 15, band 17 and band 19 and the combination of band 15, band 18 and band 19, respectively; W 1 , W 2 and W 3 are the weights corresponding to P 1 , P 2 and P 3 , respectively; P is the fused PWV retrieval result.

2.2. Ground-Based PWV Data

AERONET is a global ground-based aerosol observation network, which consists of hundreds of sun photometers [34]. It has been in continuous operation for more than 25 years. Its main task is to monitor aerosols, but it can also monitor water vapor. The sun photometer has multiple spectral channels, including channels with wavelengths of 340, 380, 440, 500, 670, 870, 940 and 1020 nm. Among them, the channel at 940 nm is a water vapor absorption channel. The PWV data provided by AERONET are retrieved by using the atmospheric transmittance of the channel [35,36]. As a result of the high accuracy and long-term continuous observation of AERONET PWV data, and the wide distribution of AERONET sites around the world, AERONET PWV data are widely used as true values for the validation of remote sensing PWV data [31,37,38]. The latest version of AERONET data is version 3 [39]. The latest version of level 1.5 of AERONET PWV data (cloud-screened and quality controlled) released in near real time is selected for validation of remote sensing PWV datasets. In this paper, ground-based PWV data from 369 AERONET sites are used to validate the MERSI-2 PWV data. The spatial distribution of these AERONET sites is shown in Figure 2. All the above AERONET data can be downloaded free of charge from the official website of AERONET (https://aeronet.gsfc.nasa.gov/, accessed on 8 April 2021).

2.3. Validation of Remote Sensing Data Using Ground-Based Data

MERSI-2 PWV products are raster data with a spatial resolution of 1 km × 1 km, whereas AERONET PWV data are a kind of point data, so it is impossible to directly compare AERONET PWV data with MERSI-2 PWV products. In this paper, we use the temporal mean of AERONET PWV data within half an hour of the transit time of FY-3D to match the spatial average of 9 × 9 pixels of MERSI-2 PWV products centered on the AERONET site [31]. This method of matching the spatial mean of remote sensing data with the temporal mean of ground-based data has been widely used in the validation of atmospheric remote sensing datasets [40,41].
In this study, a total of six statistical parameters are used to evaluate the quality of MERSI-2 PWV products, which contain the root mean square error (RMSE), mean absolute error (MAE), mean bias (MB), the relative error (RE), percentage of MERSI-2 PWV data whose error falls within ± ( 0.05 + 0.10 P W V A E R O N E T ) (PER10) and percentage of MERSI-2 PWV data whose error falls within ± ( 0.05 + 0.15 P W V A E R O N E T ) (PER15). The above RMSE, MAE, MB and RE can be calculated by Equations (5)–(8), respectively.
RMSE = i = 1 N ( P i P i ) 2 / N ,
MAE = i = 1 N | P i P i | / N ,
MB = i = 1 N ( P i P i ) / N ,
RE = i = 1 N | P i P i | / i = 1 N P i ,
where N is the number of effective matching results between the MERSI-2 PWV data and AERONET PWV data, P i is the value of MERSI-2 PWV data of the i-th matching result, and P i is the value of AERONET PWV data corresponding to P i .

3. Results

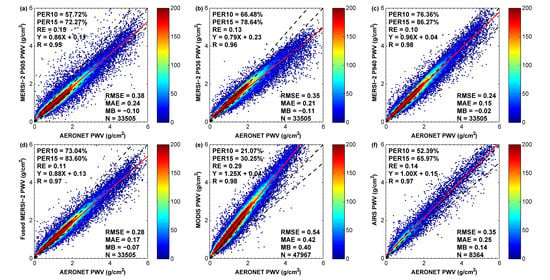
3.1. Overall Accuracy Assessment and Comparison of Four MERSI-2 PWV Datasets

The overall accuracy of the four MERSI-2 PWV datasets released by China’s NSMC (P905, P936, P940 and fused PWV datasets) is evaluated in this section. The scatter plots of the matching results between the AERONET PWV data and four MERSI-2 PWV datasets are shown in Figure 3. In order to facilitate readers to analyze and compare the values of statistical parameters of different PWV datasets, we summarize them in Table 2. As shown in Figure 3, most of the matching results of the MERSI-2 PWV datasets and AERONET PWV data range from 0 to 4 g/cm2. These four MERSI-2 PWV datasets all have a very high correlation with ground-based observation data, and their correlation coefficients are not less than 0.95. The slopes of the linear fitting equations for these four MERSI-2 PWV datasets indicate that there is underestimation in all four MERSI-2 PWV datasets. The slopes corresponding to the P905, P936 and fused PWV datasets are all less than 0.9, and their underestimation is relatively obvious, whereas the slope of the P940 dataset is 0.96, and its underestimation is small. This is consistent with the MB of four MERSI-2 PWV datasets. The order of slopes and MBs of these four datasets from small to large are P936 (slope: 0.79, MB: −0.11 g/cm2), P905 (0.86, −0.10 g/cm2), fused (0.88, −0.07 g/cm2) and P940 (0.96, −0.02 g/cm2) PWV datasets.
For these four MERSI-2 PWV datasets, the order of RMSE from small to large is the same as that of MAE, and is the P940, fused, P936 and P905 PWV datasets. The MAEs and RMSEs of the P905 and P936 PWV datasets are significantly larger than those of the P940 and fused PWV datasets. This indicates that the absolute errors of the P905 and P936 PWV datasets are significantly larger than those of the P940 and fused PWV datasets. The relatively large RMSE and MAE of the P936 PWV dataset are caused by a large number of PWV retrieval results that are obviously smaller than the actual PWV values in the case of high water vapor content. Similar to the P936 dataset, there is also an underestimation in the P905 dataset, with values greater than 4. In addition, a lot of abnormal retrieval results is also one of the reasons for the relatively large RMSE and MAE of the P905 dataset.
The order of PER10 from small to large is the same as that of PER15, and is the P905, P936, fused and P940 PWV datasets. This means that the P940 PWV dataset has the highest percentage of retrieval results with errors within ± ( 0.05 + 0.15 P W V A E R O N E T ) and ± ( 0.05 + 0.10 P W V A E R O N E T ) , whereas the P905 PWV dataset has the smallest percentage. Since the PER10s of the P940 and fused PWV datasets are all greater than 68.27%, we can consider their expected error (EE) to be less than ± ( 0.05 + 0.10 P W V A E R O N E T ) . The REs of the P905, P936, P940 and fused MERSI-2 PWV datasets are 0.15, 0.13, 0.10 and 0.11, respectively. This is consistent with the above validation results; that is, the RE of the dataset with the larger MAE and RMSE is also larger, and the RE of the dataset with the smaller PER10 and PER15 is larger.
In summary, all four MERSI-2 PWV datasets have some underestimation. The underestimation of the P940 PWV dataset is slight, whereas the other three PWV datasets have relatively obvious underestimation. In terms of the overall accuracy of the four MERSI-2 PWV datasets, they can be sorted in descending order as follows: P940 dataset, fused dataset, P936 dataset and P905 dataset. Among them, the accuracy of the P940 and fused PWV datasets is obviously better than that of the P936 and P905 datasets.

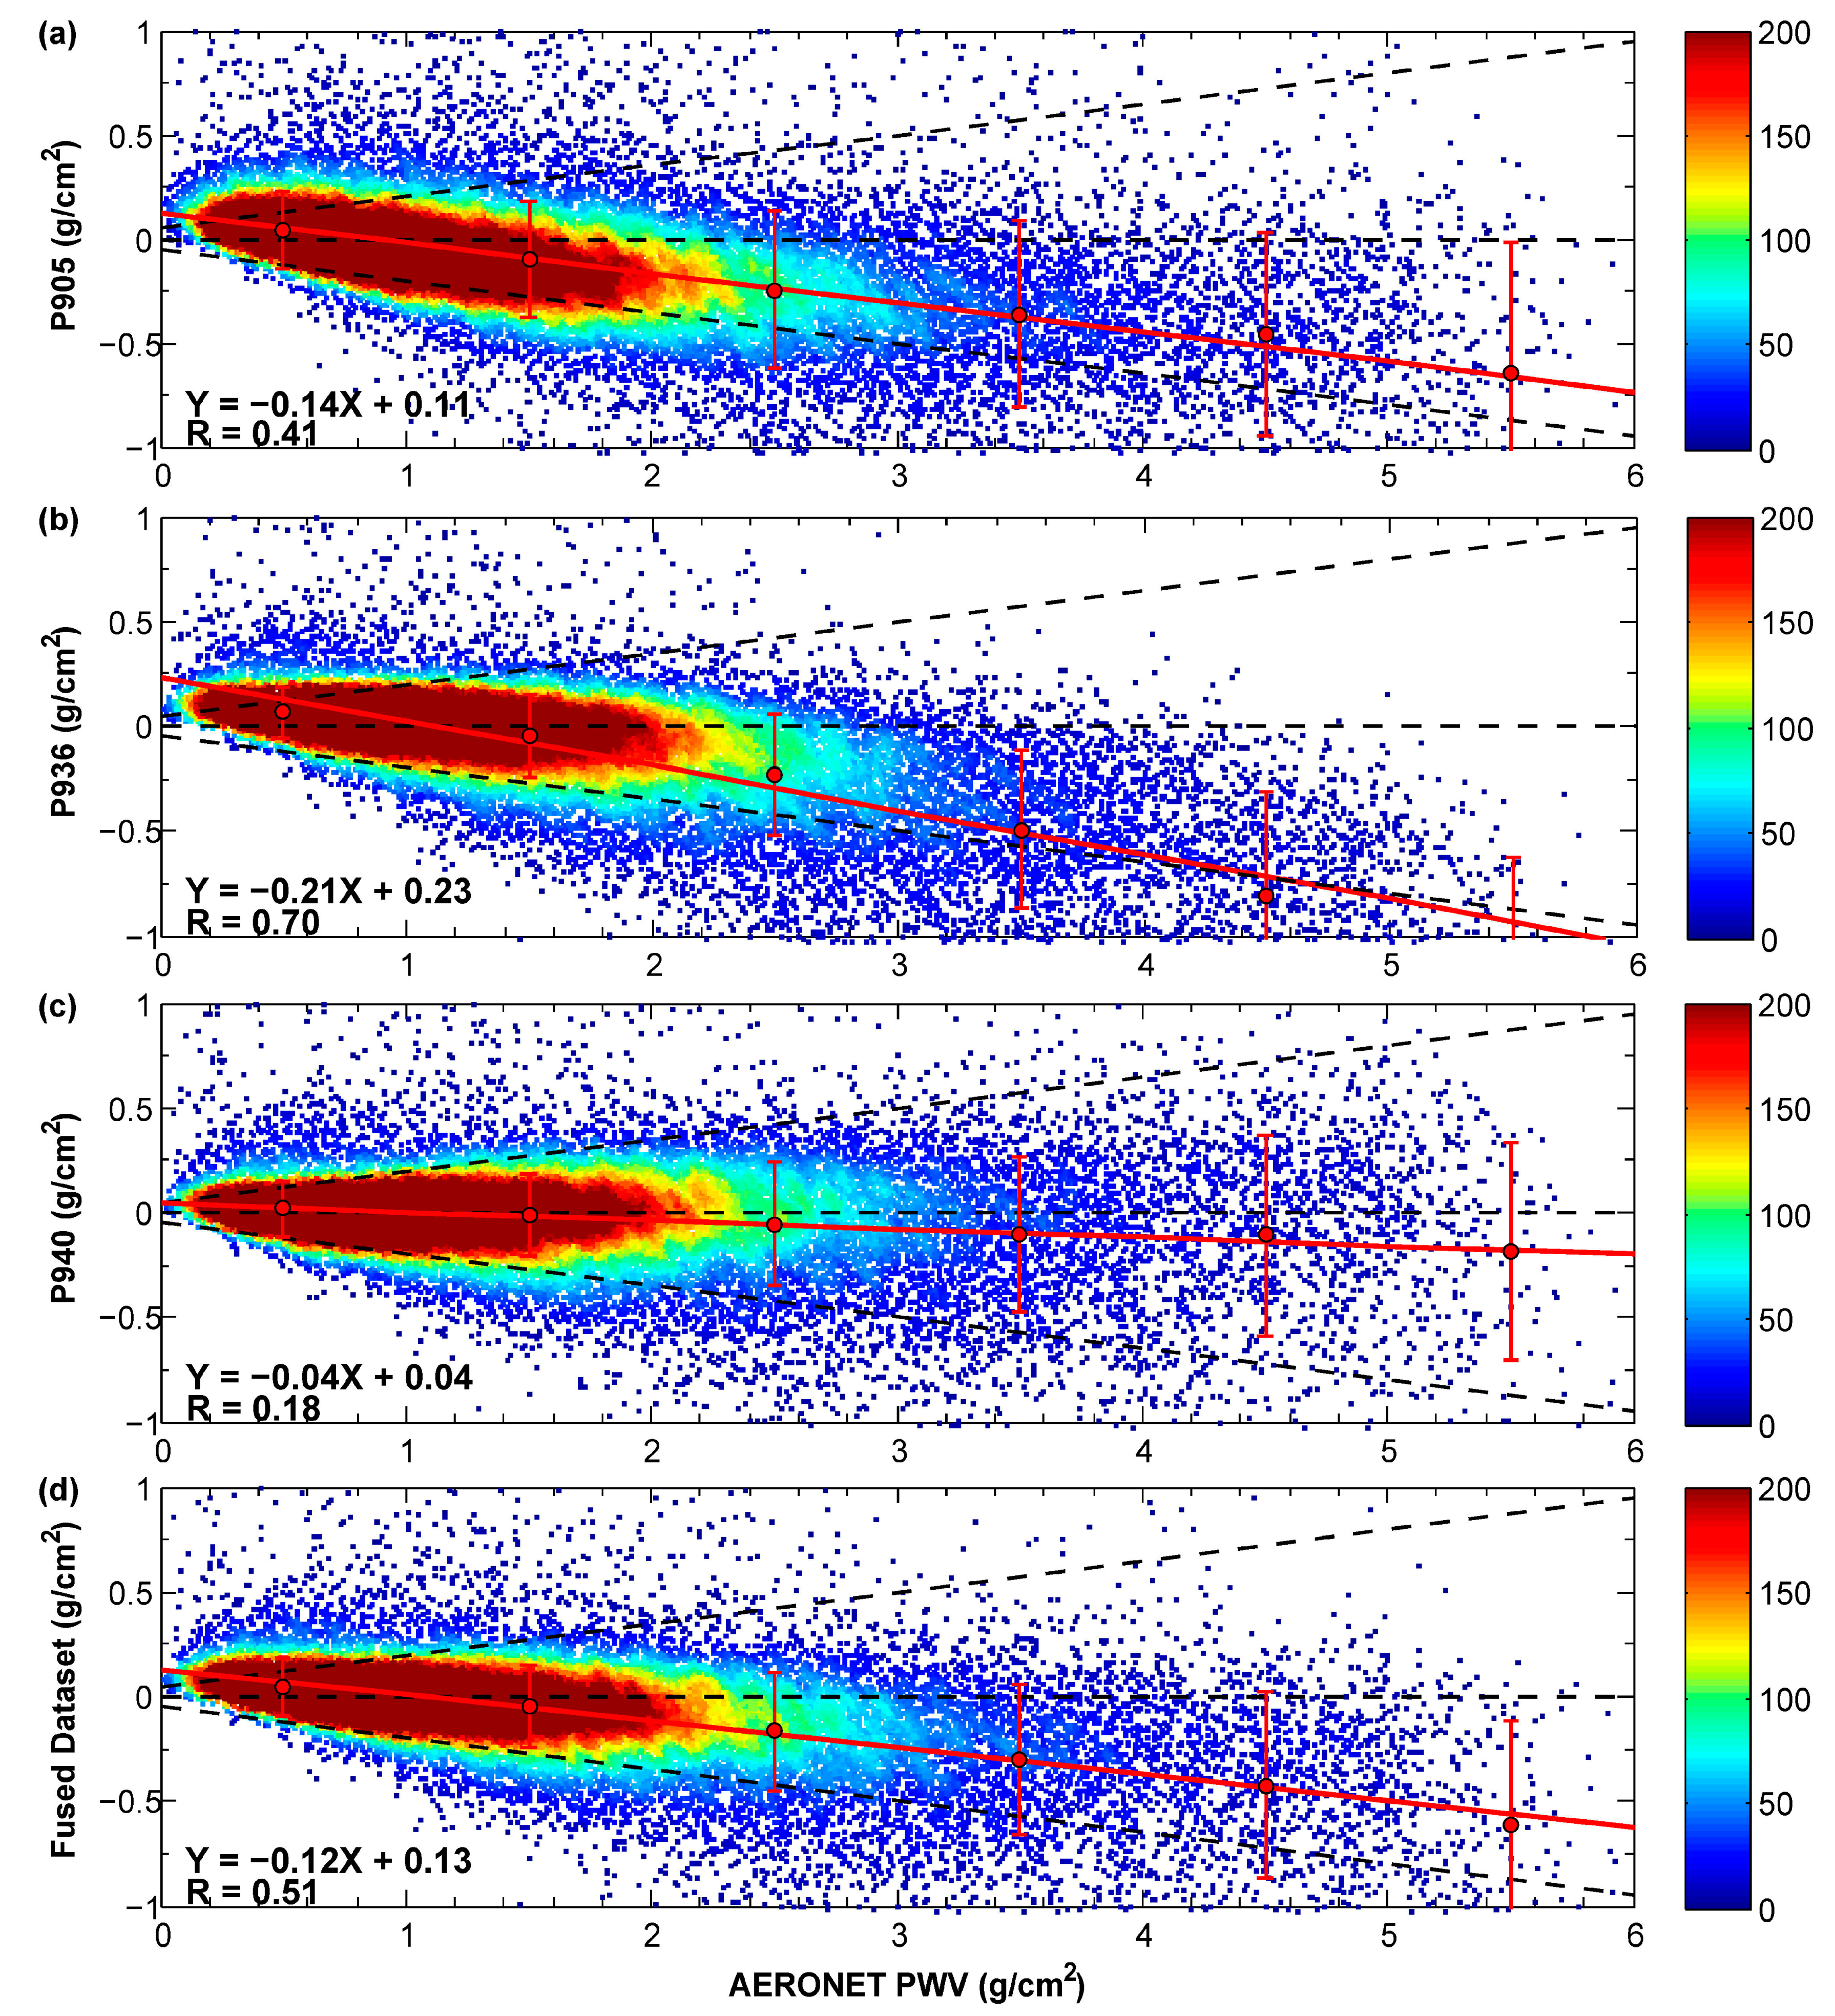
3.2. Error Analysis of MERSI-2 PWV Products under Different Water Vapor Content

Since existing studies have shown that the errors of the remote sensing PWV dataset are usually related to the content of water vapor [42,43], this section will analyze the errors of the four MERSI-2 PWV datasets under different PWV conditions. The error distributions of these four MERSI-2 PWV datasets are shown in Figure 4. The errors here are calculated by using remote sensing retrieval results to minus ground-based observations. This means that a positive error indicates that the remote sensing data have an overestimation of the actual situation, and a negative error indicates that the remote sensing data have an underestimation of the actual situation. More statistical parameters for these four MERSI-2 PWV datasets in different PWV ranges are summarized in Table 3.
In Figure 4, we present the MBs and standard deviations (STD) of errors of the four MERSI-2 PWV datasets for different PWV intervals. The MB and STD can be regarded as indicators to characterize systematic error and random error, respectively [44]. The MBs of these four MERSI-2 PWV datasets in different PWV intervals all decrease with the increase of PWV. However, the difference in MBs of the P940 dataset of different PWV intervals is small, whereas the changes in MBs of the other three PWV datasets are relatively large, and decrease significantly with the increase of PWV. This indicates that the P905, P936 and fused PWV datasets have relatively large systematic errors, whereas the systematic error of the P940 dataset is very small. In terms of STD, the difference of STDs of the P936, P940 and fused PWV datasets in the same PWV interval are small, and their STDs are obviously smaller than that of the P905 PWV dataset. This means that the random errors of the P936, P940 and fused PWV datasets are approximately equal, and their random errors are obviously smaller than that of the P905 PWV dataset. In other words, the P905 PWV dataset is the one with the greatest uncertainty in these four MERSI-2 PWV datasets, and there is no significant difference in the uncertainty of the other three PWV datasets.
The correlation coefficients between the errors of the P905, P936, P940 and fused PWV datasets and AERONET PWV data are 0.41, 0.70, 0.18 and 0.51, respectively. Therefore, we can conclude that the errors of the P905, P936 and fused datasets are related to the AERONET PWV data, whereas the errors of the P940 dataset are basically not related to the ground-based PWV data. This is consistent with the above-mentioned conclusion that the systematic error of the P940 dataset will not change significantly with the increase of PWV. By analyzing the statistical parameters in Table 3, it can be seen that the following phenomena is present in all four MERSI-2 PWV datasets: the RMSE and MAE used to characterize the absolute error will gradually increase with increasing water vapor content. This is consistent with the above conclusion that the systematic errors and random errors of the four MERSI-2 PWV datasets will increase with the increase of PWV. Since the trend of RE is determined by both the increasing rate of MAE and the increasing rate of PWV, the trend of RE is obviously different from that of MAE and RMSE. For example, the increasing rate of MAE of the P940 dataset is less than that of PWV, so the RE of the P940 dataset at different PWV intervals gradually decreases with PWV.

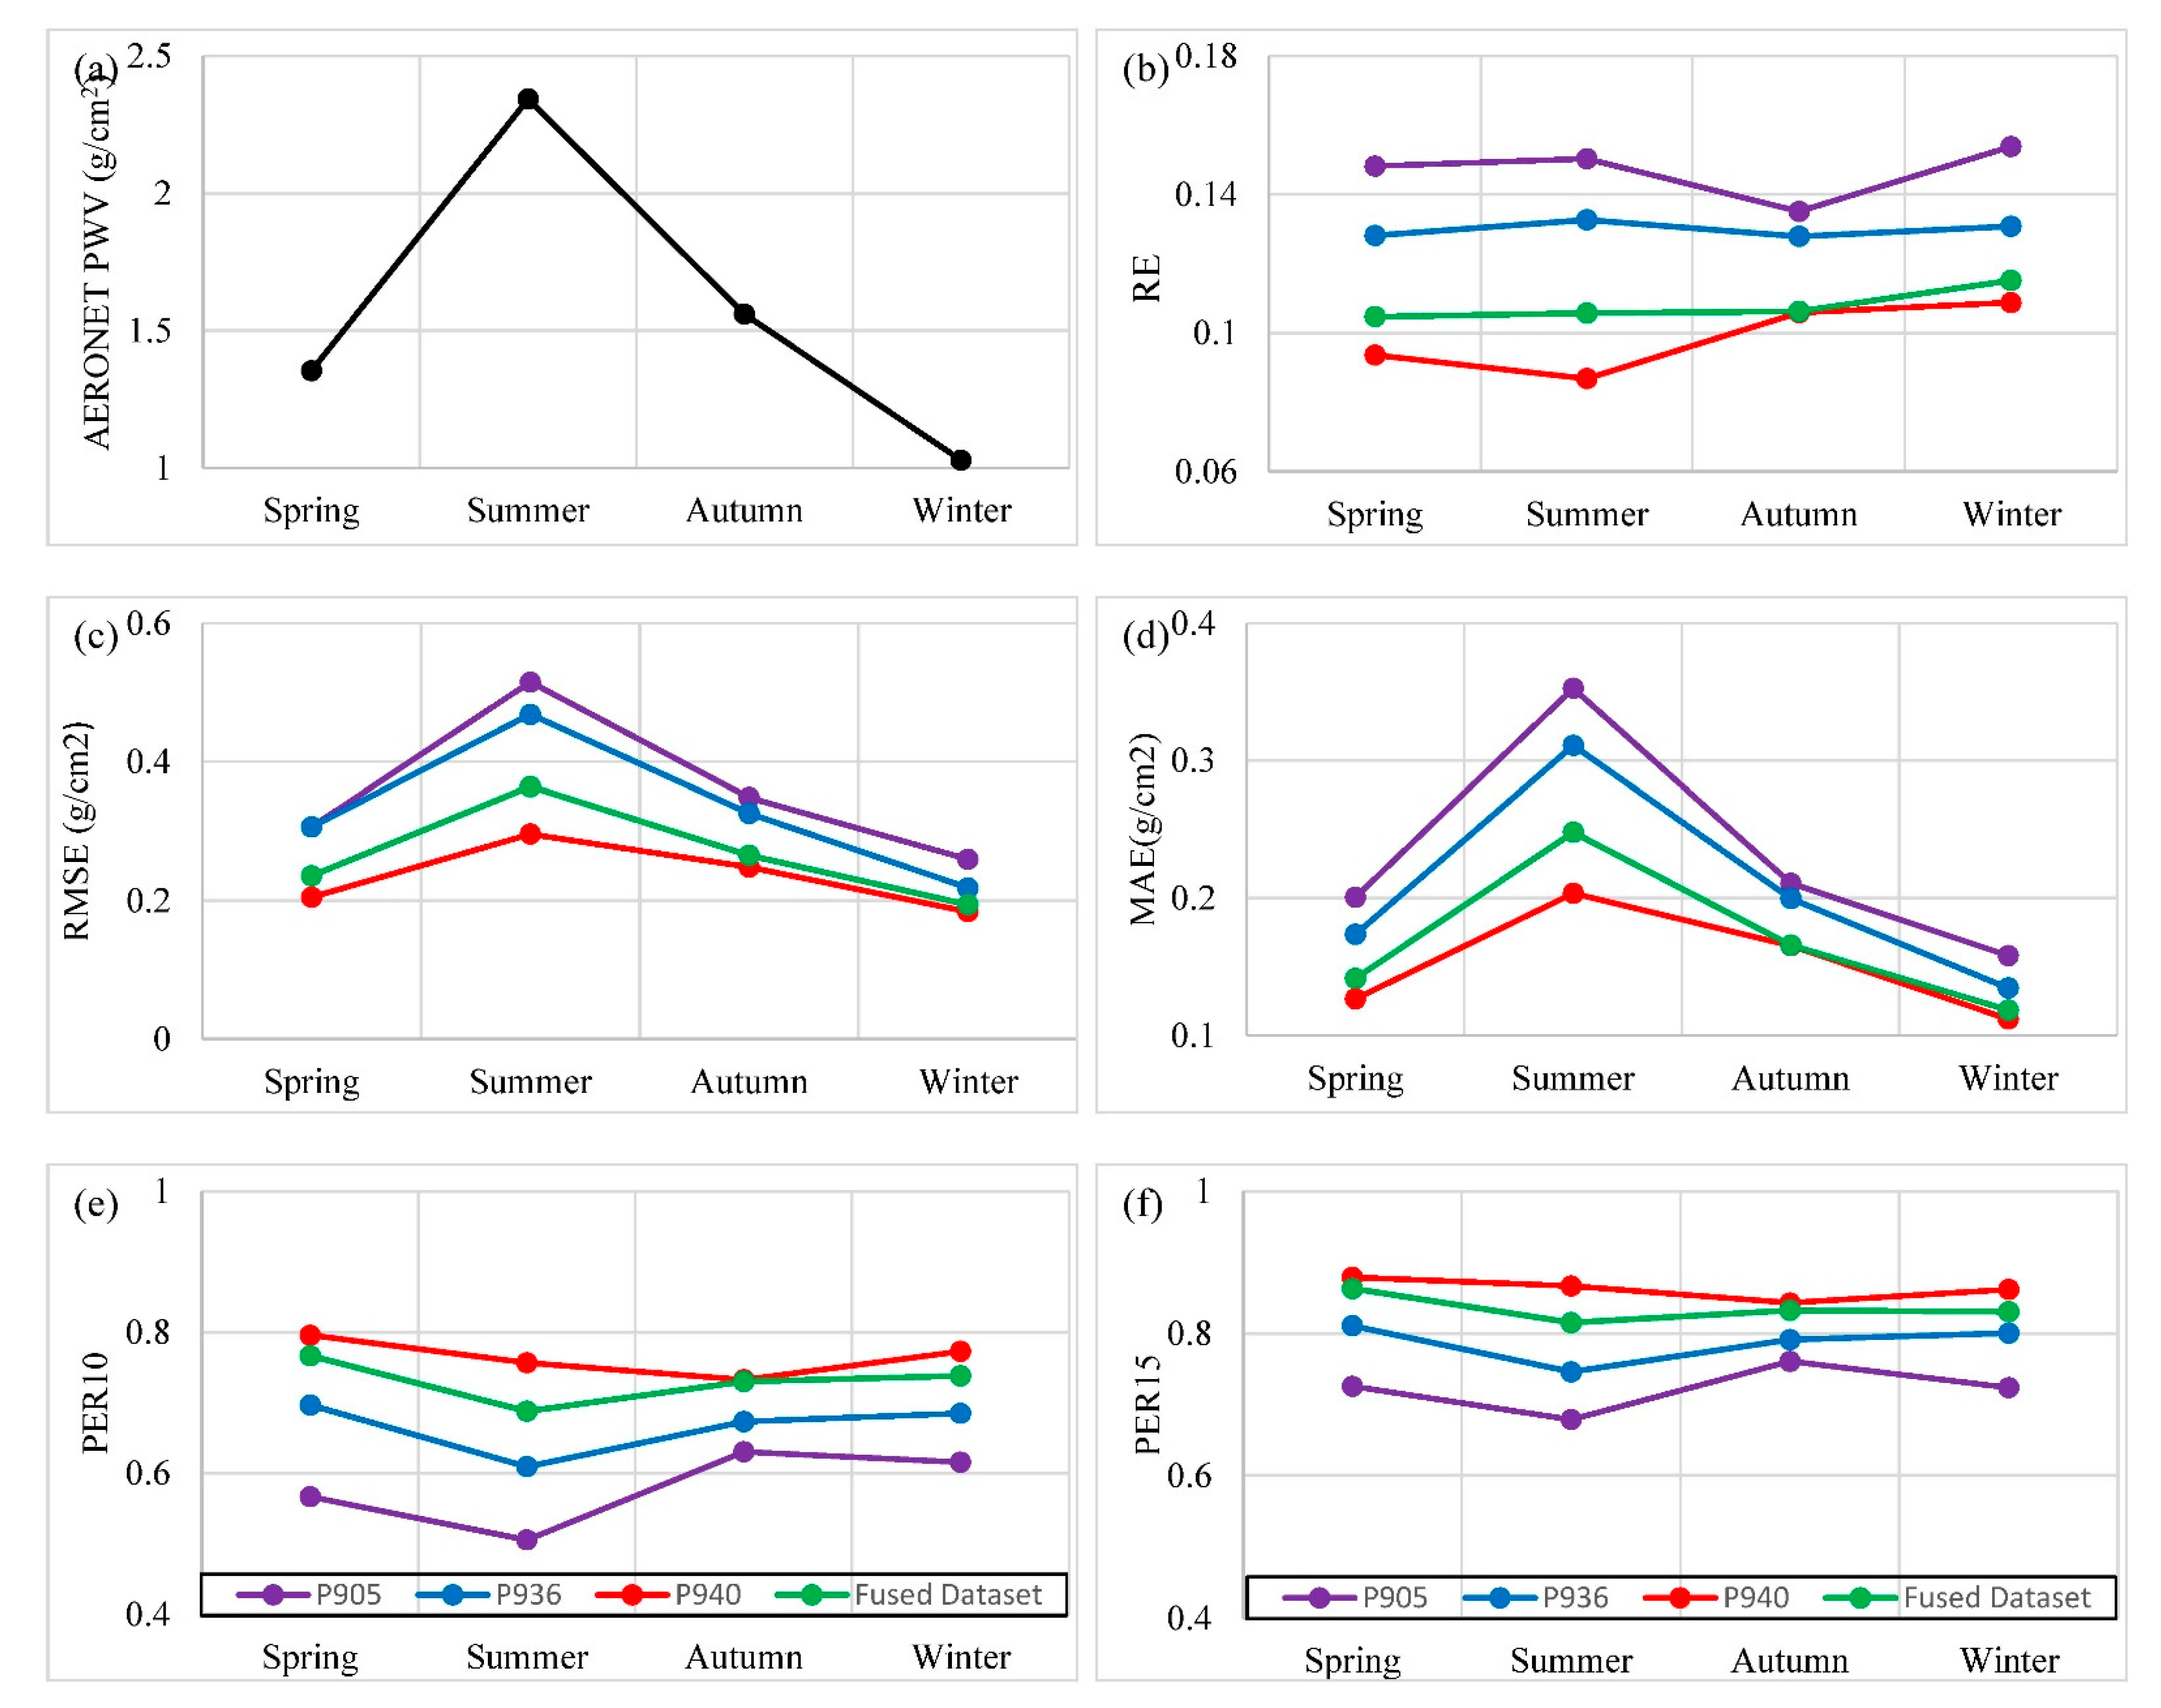
3.3. Validation Results of MERSI-2 PWV Datasets in Different Seasons

In this section, the accuracy of the four MERSI-2 PWV datasets in different seasons will be analyzed and compared. The error of these four MERSI-2 PWV datasets in different seasons are shown in Figure 5. The mean values of the ground-based PWV data in different seasons are shown in Figure 5a. Since most of the AERONET sites are located in the Northern Hemisphere, the average of the ground-based measurements from June to August (that is, the summer in the Northern Hemisphere) is the largest in all four seasons, whereas the mean value for the three months of January, February and December is the smallest. Due to the fact that the RMSEs and MAEs of all four MERSI-2 PWV datasets are positively correlated with water vapor content, the RMSEs and MAEs of these four datasets in winter should be the smallest, and the RMSEs and MAEs of these four datasets in summer should be the largest. This is in line with the actual situation. Although the MAEs and RMSEs of these four MERSI-2 PWV datasets show the same trend across seasons, their values differ significantly. According to MAE and RMSE, these four PWV datasets can be arranged in descending order as P905, P936, fused and P940 datasets. Unlike RMSE and MAE, there is no significant seasonal trend in the REs of these four PWV datasets, and the REs of the same PWV dataset do not differ significantly from season to season. However, the descending order of REs, RMSEs and MAEs of these four MERSI-2 PWV datasets is the same. Regardless of evaluating the accuracy of these four MERSI-2 PWV datasets by absolute error or relative error, the P940 PWV dataset is the one with the best accuracy, and the P905 PWV dataset is the one that has the lowest accuracy in all four seasons.
The PER10s and PER15s of these four PWV datasets in different seasons are shown in Figure 5e,f. The PER10s of the P905 dataset in the four seasons of spring, summer, autumn and winter are 56.64%, 50.50%, 63.01% and 61.52%. The corresponding PER10s of the P936 dataset are 69.67%, 60.90%, 67.28% and 68.45%. The corresponding PER10s of the P940 dataset are 79.59%, 75.66%, 73.25% and 77.26%. The corresponding PER10s of the fused dataset are 76.67%, 68.78%, 73.00% and 73.78%. The PER10s of the P905 dataset in all four seasons are obviously smaller than the corresponding PER10s of the other three PWV datasets, whereas the PER10s of the P940 dataset are the largest. Among these four MERSI-2 PWV datasets, the PER10s of the P940 and fused PWV datasets in all seasons are greater than 68.27%, the PER10s of the P936 PWV dataset in some seasons are greater than 68.27%, and the PER10s of the P905 PWV dataset in all seasons are less than 68.27%. This means that only the EE of the P940 and fused PWV datasets is better than ± ( 0.05 + 0.10 P W V A E R O N E T ) in all seasons, the EE of the P936 PWV dataset is better than ± ( 0.05 + 0.10 P W V A E R O N E T ) in some seasons and the EE of the P905 PWV dataset is worse than ± ( 0.05 + 0.10 P W V A E R O N E T ) in all seasons. The four PWV datasets can be sorted in ascending order of PER10 as P905, P936, fused and P940 datasets, which is the same as the ascending order of PER15 for the four PWV datasets.

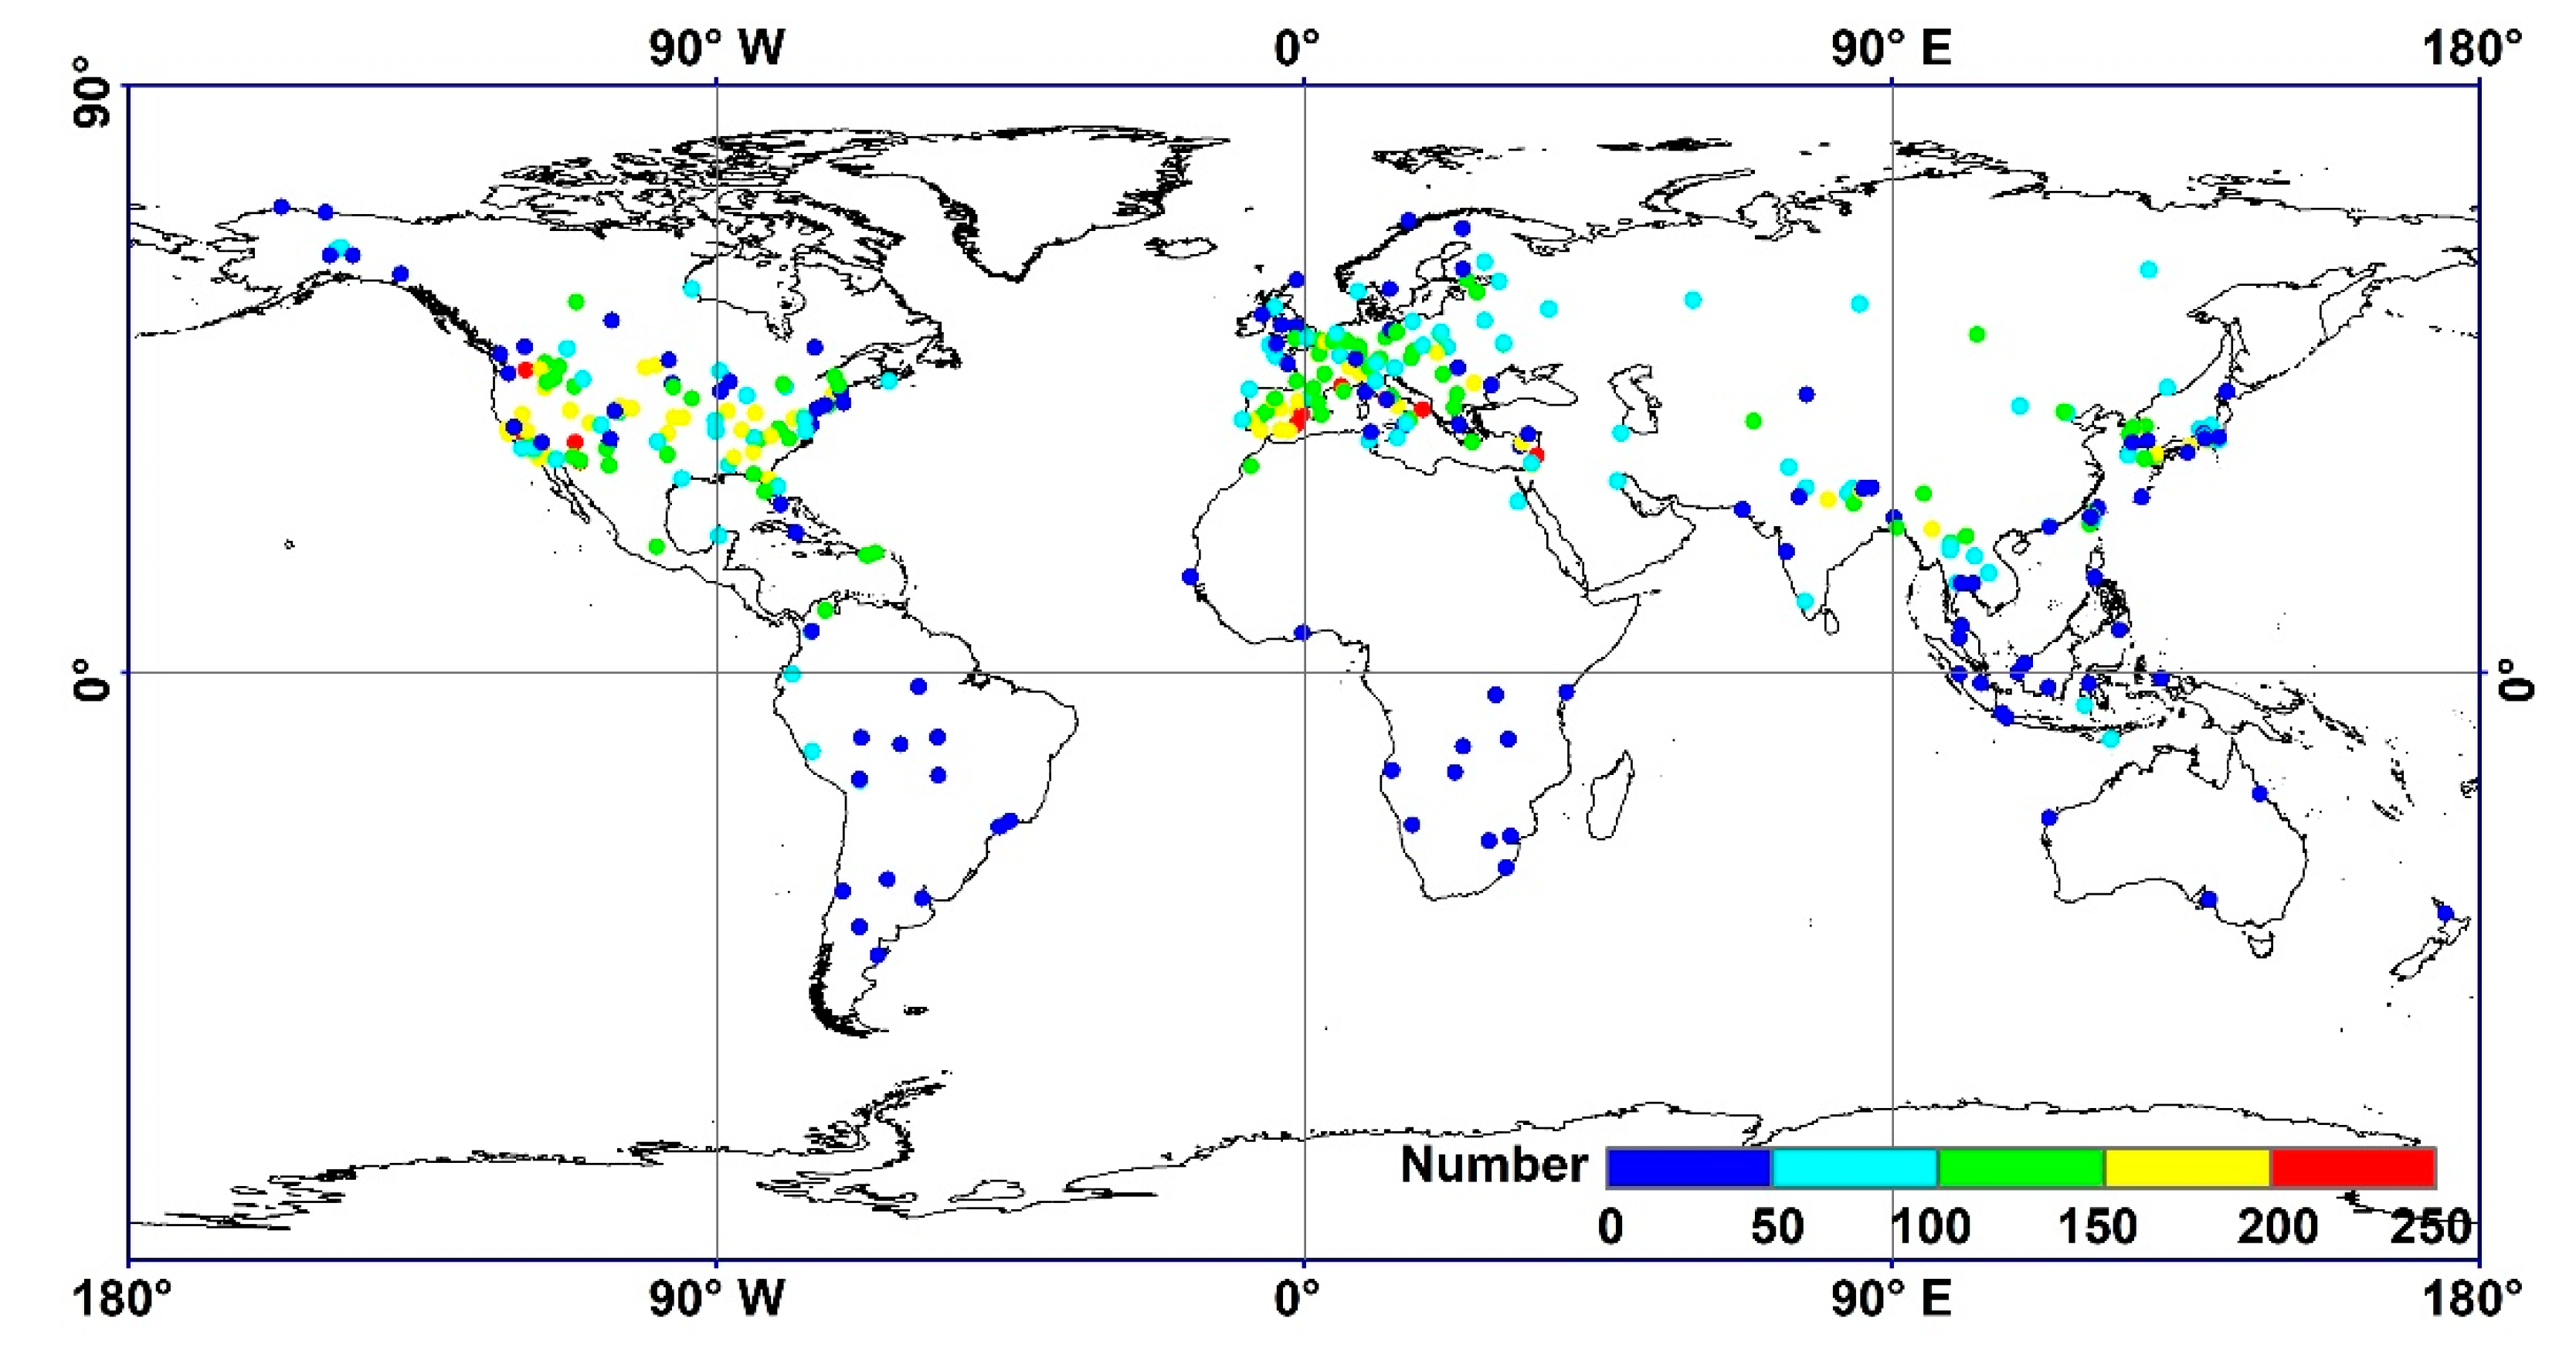
3.4. Validation Results of MERSI-2 PWV Datasets in Different Locations

The spatial distribution of RMSE and MAE for the four MERSI-2 PWV datasets is shown in Figure 6. Since both RMSE and MAE are indicators used to characterize absolute error, the spatial distribution of RMSE and MAE of the same PWV dataset are similar. By analyzing the spatial distribution of RMSE and MAE of these four PWV datasets, it can be seen that most points with MAE and RMSE greater than 0.3 are distributed in tropical or coastal areas with very high water vapor content. This is consistent with the validation results of other remote sensing PWV datasets; that is, the error of PWV retrieval results will become larger as the water vapor content increases [31,42]. In general, the spatial distribution of RMSE and MAE for the P940 and fused datasets are similar, and the RMSEs and MAEs of these two PWV datasets at most AERONET sites are within 0.2. The spatial distribution of RMSE and MAE for the P905 and P936 datasets is quite different from that of the P940 and fused PWV datasets. In addition, the ratios of the validation results of the P905 and P936 PWV datasets with RMSE and MAE greater than 0.3 are significantly higher than those of the other two PWV datasets, especially the ratio of the P905 PWV dataset.
The spatial distribution of RE and PER10 for these four MERSI-2 PWV datasets is shown in Figure 7. Theoretically, RE is negatively correlated with PER10. By analyzing Figure 7, it can be found that this is consistent with the actual situation. The spatial distribution of RE of the P940 and fused PWV datasets is similar, whereas the spatial distribution of RE of the P905 and P936 datasets is obviously different from that of the above two PWV datasets. The RE of the P940 and fused PWV datasets at most AERONET sites is less than 0.15, and the PER10 of these two PWV datasets at most sites is greater than 70%. The proportion of validation results of the P905 and P936 PWV datasets that meet the above requirements are significantly lower than those of the P940 and fused PWV datasets. As shown in Figure 7c,d, the validation results of the P936 dataset with a RE greater than 0.15 and PER10 less than 60% are mainly distributed in the regions with relatively high water vapor content. This is because the retrieval results of the P936 PWV dataset with a PWV greater than 3 g/cm2 have significant systematic errors. Compared with the P936 PWV dataset, the P905 PWV dataset has a higher proportion of validation results, with a RE greater than 0.15 and PER10 less than 60%. This is because the P905 PWV dataset not only has obviously systematic errors, but also has larger random errors than the other three PWV datasets.

3.5. Accuracy Comparision between Four MERSI-2 PWV Datasets, AIRS PWV Dataset and MODIS PWV Dataset

The accuracy of the four MERSI-2 PWV datasets has been analyzed in detail, but the comparison between their accuracy and the accuracy of other remote sensing PWV datasets is still lacking. Therefore, this section will focus on comparing the accuracy of the MERSI-2 PWV datasets and other PWV datasets. The Atmospheric Infrared Sounder (AIRS) is a sensor aboard Aqua. The AIRS L2 PWV dataset is the official standard product released by NASA. MOD05 and MYD05 are water vapor products released by NASA that are derived from MODIS aboard the Terra and Aqua satellites, based on the difference in atmospheric transmittance of different NIR channels [15]. The above PWV datasets have been widely used and fully validated [45,46,47,48]. For example, the existing global validation results show that the RMSE and correlation coefficient of the MODIS PWV dataset are approximately equal to 0.51 g/cm2 and 0.86, respectively [49]. The above validation results show that the values of the statistical parameters of the MODIS PWV dataset are worse than those of the four MERSI-2 PWV datasets. Since the ground-based data used for validation of the MODIS PWV dataset is different than that used to validate the MERSI-2 PWV datasets, and the selected time periods are also different, we cannot directly determine the order of their accuracy based on the above validation results. Therefore, we will directly compare the accuracy of the MERSI-2 PWV datasets with the MODIS PWV dataset and AIRS PWV dataset.
The scatter plot of the matching results between the MODIS PWV dataset, AIRS PWV dataset and AERONET data are shown in Figure 8. Through the analysis of Figure 8, it can be found that the MODIS PWV dataset has significant systematic errors. This is consistent with the previous validation results [49]. The RMSE, MAE, MB, RE, PER10 and PER15 of the MODIS PWV dataset are 0.54 g/cm2, 0.42 g/cm2, 0.40 g/cm2, 0.29, 21.07% and 30.25%, respectively. The RMSE, MAE, MB, RE, PER10 and PER15 of the AIRS PWV dataset are 0.35 g/cm2, 0.25 g/cm2, 0.14 g/cm2, 0.14, 52.39% and 65.97%, respectively. The values of the corresponding statistical parameters for the four MERSI-2 PWV datasets are shown in Table 2. By comparing the values of these statistical parameters of the MODIS PWV dataset and four MERSI-2 PWV datasets, it can be found that, regardless of whether absolute error or relative error is used to evaluate the remote sensing PWV datasets, the accuracy of the MODIS PWV dataset is worse than that of all four MERSI-2 PWV datasets. In fact, there is a strong correlation between the MODIS PWV dataset and the AERONET PWV data. The relatively large absolute and relative errors of the MODIS PWV dataset are caused by systematic overestimation. By comparing the AIRS PWV dataset and P905 and P936 MERSI-2 PWV datasets, it can be found that these three datasets have similar values of statistical parameters. However, regardless of whether absolute error or relative error is used to evaluate the remote sensing PWV datasets, the accuracy of the AIRS PWV dataset is worse than that of the P940 and fused MERSI-2 PWV datasets.

4. Discussion

In this paper, we used the ground-based PWV data derived from AERONET in order to validate four MERSI-2 PWV datasets released by China’s National Satellite Meteorological Center. To the best of our knowledge, this is the first comprehensive validation of these four MERSI-2 PWV datasets on a global scale. The order of these four MERSI-2 PWV datasets in descending order of accuracy is as follows: P940 dataset, fused dataset, P936 dataset and P905 dataset. Although the fused MERSI-2 PWV dataset also has a high accuracy, it is not the dataset with the highest accuracy in these four datasets. This means that the fusion algorithm mentioned in Section 2.1 cannot effectively improve the accuracy of three source MERSI-2 PWV datasets participating in fusion. Compared with the other three MERSI-2 PWV datasets, does the fused MERSI-2 PWV dataset have any advantages? What can be done to obtain a fusion dataset with higher accuracy? We will discuss these problems below.
The fusion of remote sensing datasets generally includes two objectives: (1) expanding the spatial coverage of remote sensing datasets and (2) improving the accuracy of remote sensing datasets [44,50]. Theoretically, a successful data fusion should be able to achieve at least one of the above two objectives. Due to the fact that the algorithm principles of developing these three MERSI-2 PWV datasets participating in data fusion are the same, and that they are applicable to all cloudless MERSI-2 level 1 data during the daytime, the spatial coverage of these three PWV datasets is the same. The fused MERSI-2 PWV dataset is obtained by fusing three original PWV datasets using a weighted average method, so the spatial coverage of the fused MERSI-2 PWV dataset is the same as that of these three datasets. In terms of data accuracy, the overall accuracy of the fused MERSI-2 PWV dataset is better than that of the P905 and P936 datasets, but is worse than that of the P940 dataset. Overall, compared with these three original MERSI-2 PWV datasets, the fused MERSI-2 PWV dataset neither improves the spatial coverage nor improves the accuracy of the PWV datasets.
The reason why the weighted average algorithm used to fuse three original MERSI-2 PWV datasets cannot improve the spatial coverage of the MERSI-2 PWV datasets has been discussed in detail. Next, we will discuss the reason why the accuracy of the fused MERSI-2 PWV dataset is not optimal. Theoretically, in order to obtain the optimal fusion result, the uncertainty of source datasets should be fully considered when fusing multiple source datasets [44]. In other words, the weight of each PWV dataset participating in fusion should be determined according to the corresponding uncertainty. The weight of each dataset can be calculated using Equation (9) [51,52].
W i = U N i 2 / k = 1 N U N k 2 ,
where i and k are the serial numbers of the MERSI-2 PWV dataset, N is the total number of original PWV datasets participating in fusion, U N i is the uncertainty of the i-th PWV dataset and W i is the weight of the i-th PWV dataset participating in fusion.
Since the uncertainty of the PWV dataset can be characterized by the standard deviation of its error [44], we can calculate the uncertainty of these three PWV datasets in different PWV situations based on their validation results, and then obtain the weights of different PWV datasets participating in fusion based on the above uncertainty. The weights of three MERSI-2 PWV datasets calculated according to the uncertainty of the dataset are shown in Figure 9.
However, the weights of three MERSI-2 PWV datasets used by Wang et al. [22] are not calculated according to the uncertainty of each PWV dataset, but determined according to the sensitivity of the TTA of the corresponding water vapor absorption channel to water vapor. The weights of three original MERSI-2 PWV datasets under different water vapor content used by Wang et al. [22] are shown in Figure 10. In addition to the sensitivity of the TTA of the water vapor absorption channel to water vapor, there are many variables that can affect the uncertainty of PWV retrieval results, such as the calibration accuracy of different channels of MERSI-2, observation error of MERSI-2, the accuracy of the TOA reflectance of different water vapor absorption channels obtained by interpolation and the accuracy of the radiation transmission model, etc. By comparing Figure 9 and Figure 10, it can be seen that the weights calculated based on the sensitivity of the TTA of water vapor absorption channels to water vapor are different from the weights calculated using uncertainty. Therefore, it is unreasonable to determine the required weight of each MERSI-2 PWV dataset participating in fusion only based on the sensitivity of the TTA of the corresponding water vapor absorption channel to water vapor. In order to improve the accuracy of fused MERSI-2 PWV datasets, it is necessary to consider the influence of other variables on the uncertainty of retrieval results.
In addition to the above-mentioned uncertainty that can be used to characterize the random error, the systematic error can also affect the effect of fusion. In theory, if the systematic error does exist in the original MERSI-2 PWV datasets, it needs to be removed before fusion. Otherwise, the systematic error will be brought into the fusion result [44]. As shown in Figure 4, among these three MERSI-2 PWV datasets participating in fusion, only the P940 dataset has no significant systematic error. However, the systematic error is not considered when fusing the MERSI-2 PWV datasets. This directly leads to an obvious systematic error in the fused MERSI-2 PWV dataset. As a result, it is essential to remove the systematic error of source MERSI-2 PWV datasets in order to improve the accuracy of the fusion result.

5. Conclusions

In this work, we used ground-based PWV data derived from 369 AERONET sites in order to evaluate the accuracy of four MERSI-2 PWV datasets released by China Meteorological Administration. The validation results show that all four MERSI-2 PWV datasets are highly correlated with AERONET data. However, the accuracy of the P905 and P936 PWV datasets are significantly worse than those of the P940 and fused datasets. The RMSE, MAE, MB, RE, PER10 and PER15 of the P905 PWV dataset with the lowest accuracy in these four PWV datasets are 0.38 g/cm2, 0.24 g/cm2, −0.10 g/cm2, 0.15, 57.72% and 72.27%, respectively. The RMSE, MAE, MB, RE, PER10 and PER15 of the P936 PWV dataset are 0.35 g/cm2, 0.21 g/cm2, −0.11 g/cm2, 0.13, 66.48% and 78.64%, respectively. The RMSE, MAE, MB, RE, PER10 and PER15 of the P940 PWV dataset with the highest accuracy in these four PWV datasets are 0.24 g/cm2, 0.15 g/cm2, −0.02 g/cm2, 0.10, 76.36% and 86.27%, respectively. The RMSE, MAE, MB, RE, PER10 and PER15 of the fused PWV dataset are 0.28 g/cm2, 0.17 g/cm2, −0.07 g/cm2, 0.11, 73.04% and 83.60%, respectively. According to the overall accuracy of these four MERSI-2 PWV datasets, they can be ranked in descending order as P940 dataset, fused dataset, P936 dataset and P905 dataset. Due to the fact that the systematic error of the original PWV datasets is not considered when developing the fused MERSI-2 PWV dataset, and the weight assigned to different original PWV datasets is unreasonable, the fused PWV dataset has a significant systematic error, and its accuracy is not as good as that of the dataset with the best accuracy in these three original PWV datasets.
An error analysis of the four MERSI-2 PWV products under different water vapor content shows that the random error of the four MERSI-2 PWV datasets will increase with increasing PWV, and the random error of the P905 dataset is obviously larger than that of the other PWV datasets. In addition, the P905, P936 and fused PWV datasets have relatively large systematic errors (−0.10, −0.11 and −0.07 g/cm2), whereas the systematic error of the P940 dataset (−0.02 g/cm2) is very small. The validation results of the MERSI-2 PWV datasets in different seasons indicate that the absolute errors of the four PWV datasets have obvious seasonal trends. The absolute errors are the largest in summer in the Northern Hemisphere and the smallest in winter. This is because most AERONET sites are located in the Northern Hemisphere, and the absolute errors of the four MERSI-2 PWV datasets are positively correlated with water vapor content. However, the relative errors of these four PWV datasets have no obvious seasonal trend. The validation results of the MERSI-2 PWV data in different locations show that most validation results with relatively large absolute errors for these four PWV datasets are distributed in tropical or coastal areas with very high water vapor content. This is consistent with the previous validation results; that is, the error of PWV retrieval results will become larger as the water vapor content increases. In order to obtain a clearer understanding of the accuracy of the four MERSI-2 PWV datasets, we compare the accuracy of the four MERSI-2 PWV datasets with that of the widely used MODIS PWV dataset and AIRS PWV dataset. The results of the comparison show that the accuracy of the MODIS PWV dataset is not as good as that of all four MERSI-2 PWV datasets, due to the serious systematic error of the MODIS PWV dataset, and that the accuracy of the AIRS PWV dataset is worse than that of the P940 and fused MERSI-2 PWV datasets.

Author Contributions

This work was carried out in collaboration with all the authors. Conceptualization, Y.X., Z.L. and W.H.; methodology, Y.X. and W.H.; writing—original draft, Y.X., Z.L., W.H., J.G., Y.M., Y.W., S.W. and D.Y. All authors have read and agreed to the published version of the manuscript.

Funding

This work was supported by the National Natural Science Foundation of China (Grant No. 41871269), the National Outstanding Youth Foundation of China (Grant No. 41925019) and the National Natural Science Foundation of China (Grant No. 41701407).

Institutional Review Board Statement

Not applicable.

Informed Consent Statement

Not applicable.

Data Availability Statement

All data used in this study can be downloaded for free. MERSI-2 PWV data can be downloaded from the official website of China’s National Satellite Meteorological Center website (http://www.nsmc.org.cn/en/NSMC/Home/Index.html, accessed on 11 June 2021). MODIS PWV data can be downloaded from the website of NASA (https://ladsweb.modaps.eosdis.nasa.gov/, accessed on 8 May 2021). AERONET data can be downloaded from the official website of AERONET (https://aeronet.gsfc.nasa.gov/, accessed on 25 July 2021).

Acknowledgments

The MODIS PWV dataset, AIRS PWV dataset and the four MERSI-2 PWV datasets are provided free of charge by NASA and China’s National Satellite Meteorological Center, respectively. The authors thank them for their data support for this study. The ground-based PWV data used to validate the remote sensing PWV data are obtained from 369 AERONET sites. We would also like to thank the PI(s), Co-I(s) and their staff for their efforts in establishing and maintaining the AERONET sites. In addition, we thank Ling Wang from China’s National Satellite Meteorological Center for introducing the MERSI-2 PWV data.

Conflicts of Interest

The authors declare no conflict of interest.

References

  1. Held, I.M.; Soden, B.J. Water Vapor Feedback and Global Warming. Annu. Rev. Energy Environ. 2000, 25, 441–475. [Google Scholar] [CrossRef] [Green Version]
  2. Lyngwa, R.V.; Nayak, M.A. Atmospheric river linked to extreme rainfall events over Kerala in August 2018. Atmos. Res. 2021, 253, 13. [Google Scholar] [CrossRef]
  3. Reid, K.J.; Rosier, S.M.; Harrington, L.J.; King, A.D.; Lane, T.P. Extreme rainfall in New Zealand and its association with Atmospheric Rivers. Environ. Res. Lett. 2021, 16, 044012. [Google Scholar] [CrossRef]
  4. Ziskin Ziv, S.; Alpert, P.; Reuveni, Y. Long-term variability and trends of precipitable water vapour derived from GPS tropospheric path delays over the Eastern Mediterranean. Int. J. Climatol. 2021, 1–22. [Google Scholar] [CrossRef]
  5. Zheng, Y.T.; Ren, H.Z.; Guo, J.X.; Ghent, D.; Tansey, K.; Hu, X.B.; Nie, J.; Chen, S.S. Land Surface Temperature Retrieval from Sentinel-3A Sea and Land Surface Temperature Radiometer, Using a Split-Window Algorithm. Remote Sens. 2019, 11, 650. [Google Scholar] [CrossRef] [Green Version]
  6. Choi, Y.Y.; Suh, M.S. Development of Himawari-8/Advanced Himawari Imager (AHI) Land Surface Temperature Retrieval Algorithm. Remote Sens. 2018, 10, 2013. [Google Scholar] [CrossRef] [Green Version]
  7. Levy, R.C.; Mattoo, S.; Munchak, L.A.; Remer, L.A.; Sayer, A.M.; Patadia, F.; Hsu, N.C. The Collection 6 MODIS aerosol products over land and ocean. Atmos. Meas. Tech. 2013, 6, 2989–3034. [Google Scholar] [CrossRef] [Green Version]
  8. Xue, Y.; He, X.W.; Xu, H.; Guang, J.; Guo, J.P.; Mei, L.L. China Collection 2.0: The aerosol optical depth dataset from the synergetic retrieval of aerosol properties algorithm. Atmos. Environ. 2014, 95, 45–58. [Google Scholar] [CrossRef]
  9. Koulali, A.; Ouazar, D.; Bock, O.; Fadil, A. Study of seasonal-scale atmospheric water cycle with ground-based GPS receivers, radiosondes and NWP models over Morocco. Atmos. Res. 2012, 104, 273–291. [Google Scholar] [CrossRef]
  10. Renju, R.; Raju, C.S.; Mathew, N.; Antony, T.; Moorthy, K.K. Microwave radiometer observations of interannual water vapor variability and vertical structure over a tropical station. J. Geophys. Res. Atmos. 2015, 120, 4585–4599. [Google Scholar] [CrossRef]
  11. Hu, H.; Yang, R.K.; Lee, W.C.; Cao, Y.C.; Mao, J.J.; Gao, L.N. Multi-sensor study of precipitable water vapor and atmospheric profiling from microwave radiometer, GNSS/MET, radiosonde, and ECMWF reanalysis in Beijing. J. Appl. Remote Sens. 2020, 14, 18. [Google Scholar] [CrossRef]
  12. Li, Z.Q.; Xu, H.; Li, K.T.; Li, D.H.; Xie, Y.S.; Li, L.; Zhang, Y.; Gu, X.F.; Zhao, W.; Tian, Q.J.; et al. Comprehensive Study of Optical, Physical, Chemical, and Radiative Properties of Total Columnar Atmospheric Aerosols over China: An Overview of Sun-Sky Radiometer Observation Network (SONET) Measurements. Bull. Am. Meteorol. Soc. 2018, 99, 739–755. [Google Scholar] [CrossRef]
  13. Campmany, E.; Bech, J.; Rodríguez-Marcos, J.; Sola, Y.; Lorente, J. A comparison of total precipitable water measurements from radiosonde and sunphotometers. Atmos. Res. 2010, 97, 385–392. [Google Scholar] [CrossRef] [Green Version]
  14. Wu, Z.L.; Liu, Y.X.; Liu, Y.; Wang, J.G.; He, X.F.; Xu, W.X.; Ge, M.R.; Schuh, H. Validating HY-2A CMR precipitable water vapor using ground-based and shipborne GNSS observations. Atmos. Meas. Tech. 2020, 13, 4963–4972. [Google Scholar] [CrossRef]
  15. Gao, B.C.; Kaufman, Y.J. Water vapor retrievals using moderate resolution Imaging spectroradiometer (MODIS) near-infrared channels. J. Geophys. Res. Atmos. 2003, 108, 10. [Google Scholar] [CrossRef]
  16. Liu, Y.; Liu, Y.X.; Chen, G.X.; Wu, Z.L. Evaluation of HY-2A satellite-borne water vapor radiometer with shipborne GPS and GLONASS observations over the Indian Ocean. GPS Solut. 2019, 23, 9. [Google Scholar] [CrossRef]
  17. He, J.; Liu, Z.Z. Water Vapor Retrieval From MODIS NIR Channels Using Ground-Based GPS Data. IEEE Trans. Geosci. Remote Sens. 2020, 58, 3726–3737. [Google Scholar] [CrossRef]
  18. Liu, H.L.; Li, H.P.; Tang, S.H.; Duan, M.Z.; Zhang, S.L.; Deng, X.B.; Hu, J.Y. A physical algorithm for precipitable water vapour retrieval over land using passive microwave observations. Int. J. Remote Sens. 2020, 41, 6288–6306. [Google Scholar] [CrossRef]
  19. Gangwar, R.K.; Thapliyal, P.K. Retrieval of total precipitable water from thermal infrared observations of INSAT-3D imager over the ocean. Curr. Sci. 2020, 119, 382–389. [Google Scholar] [CrossRef]
  20. Li, Z.L.; Jia, L.; Su, Z.B.; Wan, Z.M.; Zhang, R.H. A new approach for retrieving precipitable water from ATSR2 split-window channel data over land area. Int. J. Remote Sens. 2003, 24, 5095–5117. [Google Scholar] [CrossRef]
  21. Abbasi, B.; Qin, Z.H.; Du, W.H.; Fan, J.L.; Zhao, C.L.; Hang, Q.Y.; Zhao, S.H.; Li, S.F. An Algorithm to Retrieve Total Precipitable Water Vapor in the Atmosphere from FengYun 3D Medium Resolution Spectral Imager 2 (FY-3D MERSI-2) Data. Remote Sens. 2020, 12, 3469. [Google Scholar] [CrossRef]
  22. Wang, L.; Hu, X.Q.; Xu, N.; Chen, L. Water Vapor Retrievals from Near-infrared Channels of the Advanced Medium Resolution Spectral Imager Instrument onboard the Fengyun-3D Satellite. Adv. Atmos. Sci. 2020, 38, 1351–1366. [Google Scholar] [CrossRef]
  23. Merrikhpour, M.H.; Rahimzadegan, M. Improving the Algorithm of Extracting Regional Total Precipitable Water Vapor Over Land From MODIS Images. IEEE Trans. Geosci. Remote Sens. 2017, 55, 5889–5898. [Google Scholar] [CrossRef]
  24. Zhang, X.Y.; Pang, J. A comparison between atmospheric water vapour content retrieval methods using MSG2-SEVIRI thermal-IR data. Int. J. Remote Sens. 2015, 36, 5075–5086. [Google Scholar] [CrossRef]
  25. Schroedter-Homscheidt, M.; Drews, A.; Heise, S. Total water vapor column retrieval from MSG-SEVIRI split window measurements exploiting the daily cycle of land surface temperatures. Remote Sens. Environ. 2008, 112, 249–258. [Google Scholar] [CrossRef]
  26. Sobrino, J.A.; Romaguera, M. Water-vapour retrieval from Meteosat 8/SEVIRI observations. Int. J. Remote Sens. 2008, 29, 741–754. [Google Scholar] [CrossRef]
  27. Eck, T.F.; Holben, B.N. AVHRR split window temperature differences and total precipitable water over land surfaces. Int. J. Remote Sens. 1994, 15, 567–582. [Google Scholar] [CrossRef]
  28. Du, B.L.; Ji, D.B.; Shi, J.C.; Wang, Y.Q.; Lei, T.J.; Zhang, P.; Letu, H. The Retrieval of Total Precipitable Water over Global Land Based on FY-3D/MWRI Data. Remote Sens. 2020, 12, 1508. [Google Scholar] [CrossRef]
  29. Wu, Q.; Dou, F.; Guo, Y.; Gu, S. Validation of FY-3C MWRI Total Precipitable Water Products. Meteorol. Mon. 2020, 46, 73–79. [Google Scholar]
  30. Chen, S.L.; Zheng, X.B.; Li, X.; Wei, W.; Du, S.D.; Guo, F.X. Vicarious Radiometric Calibration of Ocean Color Bands for FY-3D/MERSI-II at Lake Qinghai, China. Sensors 2021, 21, 139. [Google Scholar] [CrossRef]
  31. Martins, V.S.; Lyapustin, A.; Wang, Y.J.; Giles, D.M.; Smirnov, A.; Slutsker, I.; Korkin, S. Global validation of columnar water vapor derived from EOS MODIS-MAIAC algorithm against the ground-based AERONET observations. Atmos. Res. 2019, 225, 181–192. [Google Scholar] [CrossRef] [Green Version]
  32. Xu, N.; Niu, X.H.; Hu, X.Q.; Wang, X.H.; Wu, R.H.; Chen, S.S.; Chen, L.; Sun, L.; Ding, L.; Yang, Z.D.; et al. Prelaunch Calibration and Radiometric Performance of the Advanced MERSI II on FengYun-3D. IEEE Trans. Geosci. Remote Sens. 2018, 56, 4866–4875. [Google Scholar] [CrossRef]
  33. Berk, A.; Bernstein, L.S.; Robertson, D.C. MODTRAN: A Moderate Resolution Model for LOWTRAN. Technical Report, 12 May 1986–11 May 1987; Spectral Sciences, Inc.: Burlington, MA, USA, 1987. [Google Scholar]
  34. Holben, B.N.; Eck, T.F.; Slutsker, I.; Tanre, D.; Buis, J.P.; Setzer, A.; Vermote, E.; Reagan, J.A.; Kaufman, Y.J.; Nakajima, T.; et al. AERONET—A federated instrument network and data archive for aerosol characterization. Remote Sens. Environ. 1998, 66, 1–16. [Google Scholar] [CrossRef]
  35. Michalsky, J.J.; Min, Q.L.; Kiedron, P.W.; Slater, D.W.; Barnard, J.C. A differential technique to retrieve column water vapor using sun radiometry. J. Geophys. Res. Atmos. 2001, 106, 17433–17442. [Google Scholar] [CrossRef] [Green Version]
  36. Halthore, R.N.; Eck, T.F.; Holben, B.N.; Markham, B.L. Sun photometric measurements of atmospheric water vapor column abundance in the 940-nm band. J. Geophys. Res. Atmos. 1997, 102, 4343–4352. [Google Scholar] [CrossRef]
  37. Shi, F.L.; Xin, J.Y.; Yang, L.K.; Cong, Z.Y.; Liu, R.X.; Ma, Y.N.; Wang, Y.S.; Lu, X.F.; Zhao, L. The first validation of the precipitable water vapor of multisensor satellites over the typical regions in China. Remote Sens. Environ. 2018, 206, 107–122. [Google Scholar] [CrossRef]
  38. Makarau, A.; Richter, R.; Schlapfer, D.; Reinartz, P. APDA Water Vapor Retrieval Validation for Sentinel-2 Imagery. IEEE Geosci. Remote Sens. Lett. 2017, 14, 227–231. [Google Scholar] [CrossRef] [Green Version]
  39. Giles, D.M.; Sinyuk, A.; Sorokin, M.G.; Schafer, J.S.; Smirnov, A.; Slutsker, I.; Eck, T.F.; Holben, B.N.; Lewis, J.R.; Campbell, J.R.; et al. Advancements in the Aerosol Robotic Network (AERONET) Version 3 database—Automated near-real-time quality control algorithm with improved cloud screening for Sun photometer aerosol optical depth (AOD) measurements. Atmos. Meas. Tech. 2019, 12, 169–209. [Google Scholar] [CrossRef] [Green Version]
  40. Ichoku, C.; Chu, D.A.; Mattoo, S.; Kaufman, Y.J.; Remer, L.A.; Tanre, D.; Slutsker, I.; Holben, B.N. A spatio-temporal approach for global validation and analysis of MODIS aerosol products. Geophys. Res. Lett. 2002, 29, MOD1-1–MOD1-4. [Google Scholar] [CrossRef] [Green Version]
  41. Levy, R.C.; Remer, L.A.; Mattoo, S.; Vermote, E.F.; Kaufman, Y.J. Second-generation operational algorithm: Retrieval of aerosol properties over land from inversion of Moderate Resolution Imaging Spectroradiometer spectral reflectance. J. Geophys. Res. Atmos. 2007, 112. [Google Scholar] [CrossRef] [Green Version]
  42. Wang, Y.Z.; Liu, H.L.; Zhang, Y.; Duan, M.Z.; Tang, S.H.; Deng, X.B. Validation of FY-4A AGRI layer precipitable water products using radiosonde data. Atmos. Res. 2021, 253, 14. [Google Scholar] [CrossRef]
  43. Vaquero-Martinez, J.; Anton, M.; de Galisteo, J.P.O.; Cachorro, V.E.; Alvarez-Zapatero, P.; Roman, R.; Loyola, D.; Costa, M.J.; Wang, H.Q.; Abad, G.G.; et al. Inter-comparison of integrated water vapor from satellite instruments using reference GPS data at the Iberian Peninsula. Remote Sens. Environ. 2018, 204, 729–740. [Google Scholar] [CrossRef]
  44. Xie, Y.Q.; Xue, Y.; Che, Y.H.; Guang, J.; Mei, L.L.; Voorhis, D.; Fan, C.; She, L.; Xu, H. Ensemble of ESA/AATSR Aerosol Optical Depth Products Based on the Likelihood Estimate Method With Uncertainties. IEEE Trans. Geosci. Remote Sens. 2018, 56, 997–1007. [Google Scholar] [CrossRef]
  45. Ningombam, S.S.; Jade, S.; Shrungeshwara, T.S.; Song, H.J. Validation of water vapor retrieval from Moderate Resolution Imaging Spectro-radiometer (MODIS) in near infrared channels using GPS data over IAO-Hanle, in the trans-Himalayan region. J. Atmos. Sol. Terr. Phys. 2016, 137, 76–85. [Google Scholar] [CrossRef]
  46. Wang, R.N.; Liu, Y.B. Recent declines in global water vapor from MODIS products: Artifact or real trend? Remote Sens. Environ. 2020, 247, 18. [Google Scholar] [CrossRef]
  47. Roman, J.; Knuteson, R.; August, T.; Hultberg, T.; Ackerman, S.; Revercomb, H. A global assessment of NASA AIRS v6 and EUMETSAT IASI v6 precipitable water vapor using ground-based GPS SuomiNet stations. J. Geophys. Res. Atmos. 2016, 121, 8925–8948. [Google Scholar] [CrossRef]
  48. Zhao, Y.; Zhou, T. Asian water tower evinced in total column water vapor: A comparison among multiple satellite and reanalysis data sets. Clim. Dyn. 2020, 54, 231–245. [Google Scholar] [CrossRef] [Green Version]
  49. Bright, J.M.; Gueymard, C.A.; Killinger, S.; Lingfors, D.; Sun, X.X.; Wang, P.; Engerer, N.A. Climatic and Global Validation of Daily MODIS Precipitable Water Data at AERONET Sites for Clear-Sky Irradiance Modelling; International Solar Energy Society: Freiburg, Germany, 2018; pp. 1490–1501. [Google Scholar] [CrossRef] [Green Version]
  50. Tang, Q.X.; Bo, Y.C.; Zhu, Y.X. Spatiotemporal fusion of multiple-satellite aerosol optical depth (AOD) products using Bayesian maximum entropy method. J. Geophys. Res. Atmos. 2016, 121, 4034–4048. [Google Scholar] [CrossRef] [Green Version]
  51. Xu, H.; Guang, J.; Xue, Y.; de Leeuw, G.; Che, Y.H.; Guo, J.P.; He, X.W.; Wang, T.K. A consistent aerosol optical depth (AOD) dataset over mainland China by integration of several AOD products. Atmos. Environ. 2015, 114, 48–56. [Google Scholar] [CrossRef]
  52. Xie, Y.; Xue, Y.; Guang, J.; Mei, L.; Fan, C.; Che, Y.; She, L. Image fusion of MODIS AOD (collection 6) in China based on uncertainty. In Proceedings of the 2017 IEEE International Geoscience and Remote Sensing Symposium (IGARSS), Fort Worth, TX, USA, 23–28 July 2017; pp. 3365–3368. [Google Scholar]
Figure 1. The spectral response functions of five NIR bands of MERSI-2 used for water vapor retrieval. The first line in the legend (black line) represents the total transmittance of the atmosphere (TTA) when the satellite view zenith angle and solar zenith angle are equal to 0 and PWV is equal to 1 g/cm2. The second line (yellow line) represents the TTA when the satellite view zenith angle and solar zenith angle are equal to 0 and PWV is equal to 3 g/cm2. The next five are spectral response functions of the five MERSI-2 bands used for water vapor retrieval.
Remotesensing 13 03246 g001
Figure 2. Spatial distribution of AERONET sites used for validation of four MERSI-2 PWV products. Each dot represents an AERONET site. The color of these dots indicates the number of matching results between AERONET data and each MERSI-2 PWV product.
Remotesensing 13 03246 g002
Figure 3. Scatter plots of matching results between AERONET PWV data and four MERSI-2 PWV datasets: (a) MERSI-2 P905 PWV dataset; (b) MERSI-2 P936 PWV dataset; (c) MERSI-2 P940 PWV dataset; (d) fused MERSI-2 PWV dataset. The dashed line in the middle is the 1-1 line. The dashed lines on both sides are the envelope of PER15. The red line is the linear regression line. The color of each point represents the density of the point where the point is located.
Remotesensing 13 03246 g003
Figure 4. Error distributions of four MERSI-2 PWV datasets: (a) MERSI-2 P905 PWV dataset; (b) MERSI-2 P936 PWV dataset; (c) MERSI-2 P940 PWV dataset; (d) fused MERSI-2 PWV dataset. The dashed lines on both sides are the envelope of PER15. The red line is the linear regression line. The color of each point represents the density of the point where the point is located.
Remotesensing 13 03246 g004
Figure 5. The mean values of AERONET PWV data and error of the four MERSI-2 PWV datasets in different seasons. (a) means values of AERONET PWV data; (b) REs of the four MERSI-2 PWV datasets; (c) RMSEs of the four MERSI-2 PWV datasets; (d) MAEs of the four MERSI-2 PWV datasets; (e) PER10s of the four MERSI-2 PWV datasets; (f) PER15s of the four MERSI-2 PWV datasets.
Remotesensing 13 03246 g005
Figure 6. Spatial distribution of RMSE and MAE for the four MERSI-2 PWV datasets. (a) RMSE of the P905 dataset; (b) MAE of the P905 dataset; (c) RMSE of the P936 dataset; (d) MAE of the P936 dataset; (e) RMSE of the P940 dataset; (f) MAE of the P940 dataset; (g) RMSE of the fused dataset; (h) MAE of the fused dataset.
Remotesensing 13 03246 g006
Figure 7. Spatial distribution of RE and PER10 for the four MERSI-2 PWV datasets. (a) RE of the P905 dataset; (b) PER10 of the P905 dataset; (c) RE of the P936 dataset; (d) PER10 of the P936 dataset; (e) RE of the P940 dataset; (f) PER10 of the P940 dataset; (g) RE of the fused dataset; (h) PER10 of the fused dataset.
Remotesensing 13 03246 g007
Figure 8. Scatter plot of matching results between the AERONET PWV data, MODIS PWV dataset and AIRS PWV dataset in 2020. (a) MODIS PWV dataset, (b) AIRS PWV dataset.
Remotesensing 13 03246 g008
Figure 9. The weights of three original MERSI-2 PWV datasets participating in fusion calculated based on their uncertainty.
Remotesensing 13 03246 g009
Figure 10. The weights of three original MERSI-2 PWV datasets participating in fusion used by Wang et al. [22].
Remotesensing 13 03246 g010
Table 1. Characteristics of five NIR bands of MERSI-2 used for PWV retrieval.
Band No.Center Wavelength (μm)Band Width (nm)Signal-to-Noise RatioSpatial Resolution (m)Atmospheric Window
150.865205001000Yes
160.905202001000No
170.936201001000No
180.940502001000No
191.03201001000Yes
Table 2. Statistical parameters of four MERSI-2 PWV datasets.
Statistical ParametersP905 DatasetP936 DatasetP940 DatasetFused Dataset
RMSE (g/cm2)0.380.350.240.28
MAE (g/cm2)0.240.210.150.17
MB (g/cm2)−0.10−0.11−0.02−0.07
PER1057.72%66.48%76.36%73.04%
PER1572.27%78.64%86.27%83.60%
RE0.150.130.100.11
Slope0.860.790.960.88
Bias (g/cm2)0.110.230.040.13
R0.950.960.980.97
Table 3. Statistical parameters of the four MERSI-2 PWV datasets in different PWV ranges.
DatasetPWV Range (g/cm2)MB (g/cm2)STD (g/cm2)RMSE (g/cm2)MAE (g/cm2)PER10 (%)PER15 (%)REN
P905 dataset[0, 1)0.040.190.200.1261.7572.050.1912,024
[1, 2)−0.090.300.320.2158.3273.650.1411,967
[2, 3)−0.240.380.450.3452.9170.700.145506
[3, 4)−0.350.510.620.4749.4569.880.142457
[4, 5)−0.410.650.770.5752.4573.770.131243
[5, 6]−0.580.750.950.7150.3268.180.13308
P936 dataset[0, 1)0.070.120.140.1067.9179.040.1612,024
[1, 2)−0.040.190.200.1476.2986.310.1011,967
[2, 3)−0.230.290.370.2863.7177.500.115506
[3, 4)−0.490.380.620.5143.9662.680.152457
[4, 5)−0.810.500.950.8128.3249.880.181243
[5, 6]−1.190.571.321.1912.3429.220.23308
P940 dataset[0, 1)0.020.130.140.0878.4885.590.1312,024
[1, 2)−0.010.200.200.1475.6886.280.1011,967
[2, 3)−0.050.290.290.2275.4387.320.095506
[3, 4)−0.110.370.390.2973.0286.530.082457
[4, 5)−0.110.480.500.3773.8587.210.081243
[5, 6]−0.150.540.560.4373.0587.660.08308
Fused dataset[0, 1)0.050.140.140.0974.7282.840.1412,024
[1, 2)−0.040.200.200.1476.4486.860.1011,967
[2, 3)−0.170.280.330.2470.3482.930.105506
[3, 4)−0.300.360.470.3763.2178.140.112457
[4, 5)−0.420.460.620.4860.8276.830.111243
[5, 6]−0.600.530.800.6451.6269.160.12308
Publisher’s Note: MDPI stays neutral with regard to jurisdictional claims in published maps and institutional affiliations.

