Abstract
In this study, the case of super typhoon Lekima, which landed in Jiangsu and Zhejiang Province on 4 August 2019, is numerically simulated. Based on the Weather Research and Forecasting (WRF) model, the sensitivity experiments are carried out with different combinations of physical parameterization schemes. The results show that microphysical schemes have obvious impacts on the simulation of the typhoon’s track, while the intensity of the simulated typhoon is more sensitive to surface physical schemes. Based on the results of the typhoon’s track and intensity simulation, one parameterization scheme was further selected to provide the background field for the following data assimilation experiments. Using the three-dimensional variational (3DVar) data assimilation method, the Microwave Humidity Sounder-2 (MWHS-2) radiance data onboard the Fengyun-3D satellite (FY-3D) were assimilated for this case. It was found that the assimilation of the FY-3D MWHS-2 radiance data was able to optimize the initial field of the numerical model in terms of the model variables, especially for the humidity. Finally, by the inspection of the typhoon’s track and intensity forecast, it was found that the assimilation of FY-3D MWHS-2 radiance data improved the skill of the prediction for both the typhoon’s track and intensity.
1. Introduction
The numerical weather prediction (NWP) models are largely related to initial conditions and the physical parameterization schemes applied in the model [1]. On the one hand, different schemes are introduced into the dynamic framework of the numerical model to describe the weather process at various scales reasonably. In order to simulate a typhoon’s track and intensity accurately, the interaction between multitemporal and spatial scale weather systems should be considered in the model, such as the mutual effect of the subgrid physical processes and the large-scale background environment [2]. On the other hand, a model’s initial field is affected by the quality of observation data [3,4,5,6,7,8,9,10,11,12] and the data assimilation approaches. Previously, it was mainly provided with conventional data, which have low resolution, large errors, and other problems. Currently, unconventional data from satellites and other instruments are used more widely [13,14]. Along with the development of satellite technology, the accuracy of unconventional data continues to improve, with the advantages of wide coverage, intensive spatial distribution, and high temporal resolution. However, with abundant high-quality observations, how to utilize them more rationally to enhance the numerical prediction skill remains a great challenge.
As China’s new generation of polar-orbit meteorological satellites, the observation data provided by the Fengyun-3 (FY-3) series of satellites play a significant role in meteorological operations, and China has implemented a large-scale global monitoring to promote the accuracy of typhoon prediction. The first four FY-3 series of satellites: FY-3A (2008), FY-3B (2010), FY-3C (2013), FY-3D (2017) were successfully launched by China [15]. Such satellites are mainly used to detect atmospheric circulation and obtain high-resolution global observations. The main detection instruments loaded on FY-3A and FY-3B are microwave humidity sounder (MWHS), infrared spectrometer (IRAS) and microwave thermometer (MWTS), which provide important datasets for meteorological research. FY-3C has updated its atmospheric microwave vertical detector with higher resolution over the first two satellites. Compared to the other three satellites, FY-3D is more sophisticated and can conduct networked observations with FY-3C. The MWHS-2 onboard FY-3D not only obtains the profile distribution of atmospheric temperatures and humidity well, but also yields essential observations for typhoon forecasting. It is a supplement to those regions with limited conventional data, especially in ocean, plateau, and other areas with complex terrain [16,17,18,19].
In the recent two decades, remarkable progress has been made in terms of utilizing the observations from the microwave humidity sounders with 3DVAR or ensemble-based data assimilation methods [20,21,22]. Lu et al. (2011) found the data of the FY-3A MWHS and MHS (microwave humidity sounder) had similar accuracy contributions in weather forecasting [15]. Chen et al. (2015) found a slight improvement in weather forecasts when assimilating radiances of FY-3A and FY-3B MWHSs in the European Centre for Medium-Range Weather Forecasts (ECMWF)’s Integrated Forecasting System [17]. Newman et al. (2015) evaluated the forecast impact of assimilating MHS radiances with a regional ensemble Kalman filter data assimilation system [23]. Xu et al. evaluated the effect of assimilating FY-3B MWHS data on binary typhoons with different assimilation methods [24]. Sun et al. (2021) [25] conducted FY-3D MWHS2 data assimilation experiments in the regional model of Weather Research and Forecasting (WRF) and found that data assimilation of the FY-3D MWHS2 radiance was inspiring in the typhoon simulation.
Although previous research works have made several achievements in the FY3 series MWHS/MWHS2 radiance assimilation on tropical cyclone systems, very few studies investigate both the factors of the physical parametrization schemes in the NWP model and the data assimilation approach that directly impact typhoons’ analyses and forecasts. Super typhoon Lekima (2019) is selected since it was the most powerful typhoon during the summer of 2019 in the western North Pacific that experienced a severe and long rapid intensification process [26]. Therefore, this study aims to evaluate the forecast sensitivity of the super typhoon to different physical parametrization schemes and the add-on value of assimilating the MWHS2 radiance from the latest FY-3 generation. This study serves as a pilot to provide some guidelines for numerical simulations of tropical cyclones in terms of the physical parametrization and data assimilation techniques. Firstly, the sensitivity experiments are carried out with different combinations of physical parameterization schemes. An optimal scheme is further selected to provide the background field for the following data assimilation experiments. The numerical simulations are conducted in the framework of the Weather Research and Forecasting Data Assimilation (WRFDA) system based on a typhoon case in the Northwest Pacific in August 2019.
The rest of this study is as follows. A brief introduction to the FY-3D MWHS-2 radiance data, the WRF model and the variational assimilation system are presented in Section 2. In Section 3, the overview of super typhoon Lekima and the setups of the experiments are presented. The experimental results and analyses from the two experiments are described in Section 4. The first experiment is about the sensitivity analysis of physical parameterization schemes, the second experiment is about the assimilation of FY-3D MWHS-2 radiance data. Finally, the summary and discussion are described in Section 5.
2. Data, Model, and Methodology
2.1. MWHS-2 Radiance Data
The MWHS onboard the FY-3 satellite is an atmospheric humidity vertical detector, providing remote sensing data in the way of a cross-orbit continuous variable speed scanning mode. The satellite radiance data provided by MWHS-2 on FY-3D are applied in this study. The features of ice clouds and land surfaces can be detected by MWHS-2 channels at 89 GHz and 150 GHz, respectively. The eight oxygen channels around 118.3 GHz are newly added, which are sensitive to atmospheric temperature and the five 183 GHz water vapor absorption channels are sensitive to atmospheric humidity [27]. The main observation altitude of channel 1 and channel 8–10 on the instrument is at the ground level, while other channels are mainly applied to the high-altitudinal data. The MWHS2′s 5–7 and 11–15 channels are selected for this assimilation experiment. The detailed information of each channel can be seen in Table 1 [28].

Table 1.
Characteristics of MWHS-2 for each channel.
2.2. WRF Model and Data Assimilation
2.2.1. WRF Model
The WRF model is a widely used mesoscale numerical model for weather research. The options of the physical parameterization schemes play an important role in typhoon forecast [29]. To consider the subgrid-scale physical processes, some physical parameterization schemes are usually taken to satisfy the model resolution and they are listed in Table 2. The following section mainly describes their impacts.
Table 2.
Introduction of physical parameterization schemes.
Microphysical processes are able to simulate the evolution of water vapor, clouds, and precipitation, as well as the weather phenomena caused by the interaction of ice and water particles [2]. Four different microphysical parameterization (the option named mp_physics in WRF) schemes are selected. Among them, the WSM6-class scheme is able to indicate the mixing ratio of different phases like rain, cloud ice, and snow. The changing process of ice, snow, and graupel can be depicted by the Thompson scheme. Using the Morrison 2-moment scheme can reflect the mixing ratio and concentration ratio of the five particles (droplets, cloud ice, snow, rain, and graupel). The WRF dual-parameter (WDM6) scheme is the result of a further optimization of the WSM6 scheme.
The radiation process can be divided into the shortwave radiation and the longwave radiation. Due to the transmission of the radiation, the radiation balance of the atmosphere and the land surface will be destroyed, resulting in temperature changes. Simulations of the land surface physical processes are able to provide favorable lower boundary conditions for the planetary boundary layer. Moreover, the surface physics scheme (the option named as sf_surface_physics) is more complex and changeable. The five-layer thermal diffusion scheme was selected to construct a model with a five-layer soil temperature unchanged. The unified Noah land surface model is a temperature and humidity model with four-layer soil, which is employed to deal with the ice and snow cover effect.
The planetary boundary layer is the momentum sink, heat source, and water vapor source throughout the atmosphere, and the turbulent motion process in this layer is also crucial to the transmission of physical quantities [2]. The Yonsei University (YSU) scheme and the Mellor–Yamada–Janjic (MYJ) scheme were chosen in bl_pbl_physics. The YSU scheme is used to deal with the problem of excessive mixing, while the MYJ scheme is more computational efficient and accurate.
2.2.2. WRF-3DVar Assimilation System
The WRF-3DVar assimilation system was developed by the National Center for Atmospheric Research (NCAR). Its basic idea is to calculate the function of the model’s initial field, which can measure the weight values of the observation and the background as follows [30]:
where is the background field vector and is the observation along with the observation error covariance matrix and the background error covariance matrix . is the observation operator that converts the model variables into observations. The difference between the and is further calculated, before minimizing this scalar cost function to obtain the variable .
2.3. Radiance Data Assimilation Methodology
The function of the rapid radiation transfer model (RRTM) is to convert the model variables into a virtual atmospheric radiation rate. In this experiment, the radiative transfer for TOVS (RTTOV) developed by European Organization for Meteorological Satellites (EUMETSAT) was adopted to assimilate the FY-3D MWHS radiance data under the clear sky conditions.
Due to a series of errors caused by the accuracy of the instrument, the radiation transfer model, the improper operation of the instrument, and the background field error, quality control (QC) procedures are essential in the data assimilation as follows [31]:
- (1)
- Eliminate all channels with mixed observation data from the land surface.
- (2)
- Eliminate the satellite data detected at large scanning angles.
- (3)
- Eliminate data if the absolute difference between the bias-corrected brightness temperature (Tb) and the simulated Tb exceeds 15 K or if it is three times larger than that of the specified observation error.
- (4)
- Delete data with high scattering index (SI), which is the difference of the observed values in channel 1 (89 GHz) and channel 10 (150 GHz). Data are removed when SI exceeds the relative high threshold of 5 K [18].
3. Case Overview and Experimental Design
3.1. Overview of Super Typhoon Lekima
On 4 August 2019, a tropical depression formed over the Pacific Ocean at the east of the Philippines, then continued to develop and intensified into a severe tropical storm on 6 August. At 1500 UTC 7 August, it was officially numbered as super typhoon Lekima (Table 3). The system upgraded under the influence of various conditions and reached its strongest stage of the whole process on 8 August, with a minimum sea level pressure (MSLP) of 915 hPa and a maximum wind speed (MWS) exceeding 65 m/s. Lekima moved northwestward because of the combined action of the subtropical high over the northwest Pacific Ocean and the internal forces in the typhoon itself. During the development of Lekima, Krosa was located near its east side (23°N, 140°E). There was no “Fujiwara Effect” among them, since the distance between the two typhoons was about 2000 km [32]. However, the indirect impact was found between the two typhoons, which helped Lekima move westward in the easterly winds. Meanwhile, due to the subtropical high in stable maintenance, it was squeezed westward. Thus, Lekima moved along the southwest of the subtropical high, twisting from west to the northwest. This typhoon landed on the coast of China’s Zhejiang Province on 10 August. Afterwards, it began to weaken and finally ended on 13 August (Figure 1). After it landed in China, the inverted trough that presented in the north of typhoon caused large-scale precipitation in Jiangsu, Zhejiang Province, and other areas. Latterly, the heavy precipitation in the Shandong and Hebei provinces was mainly affected by the deep westerly trough and the northwest cold air invading Lekima’s inverted trough. Super typhoon Lekima brought serious rainstorm disasters and economic losses to the above affected areas [33].
Table 3.
Super typhoon Lekima (2019).
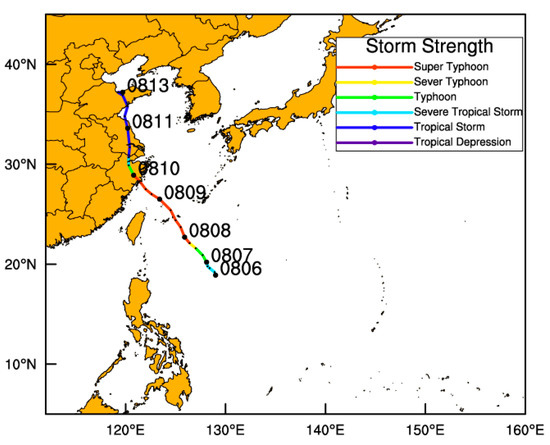
Figure 1.
The moving track and strength change of super typhoon Lekima from 6 August to 13 August 2019.
3.2. The Experimental Setups
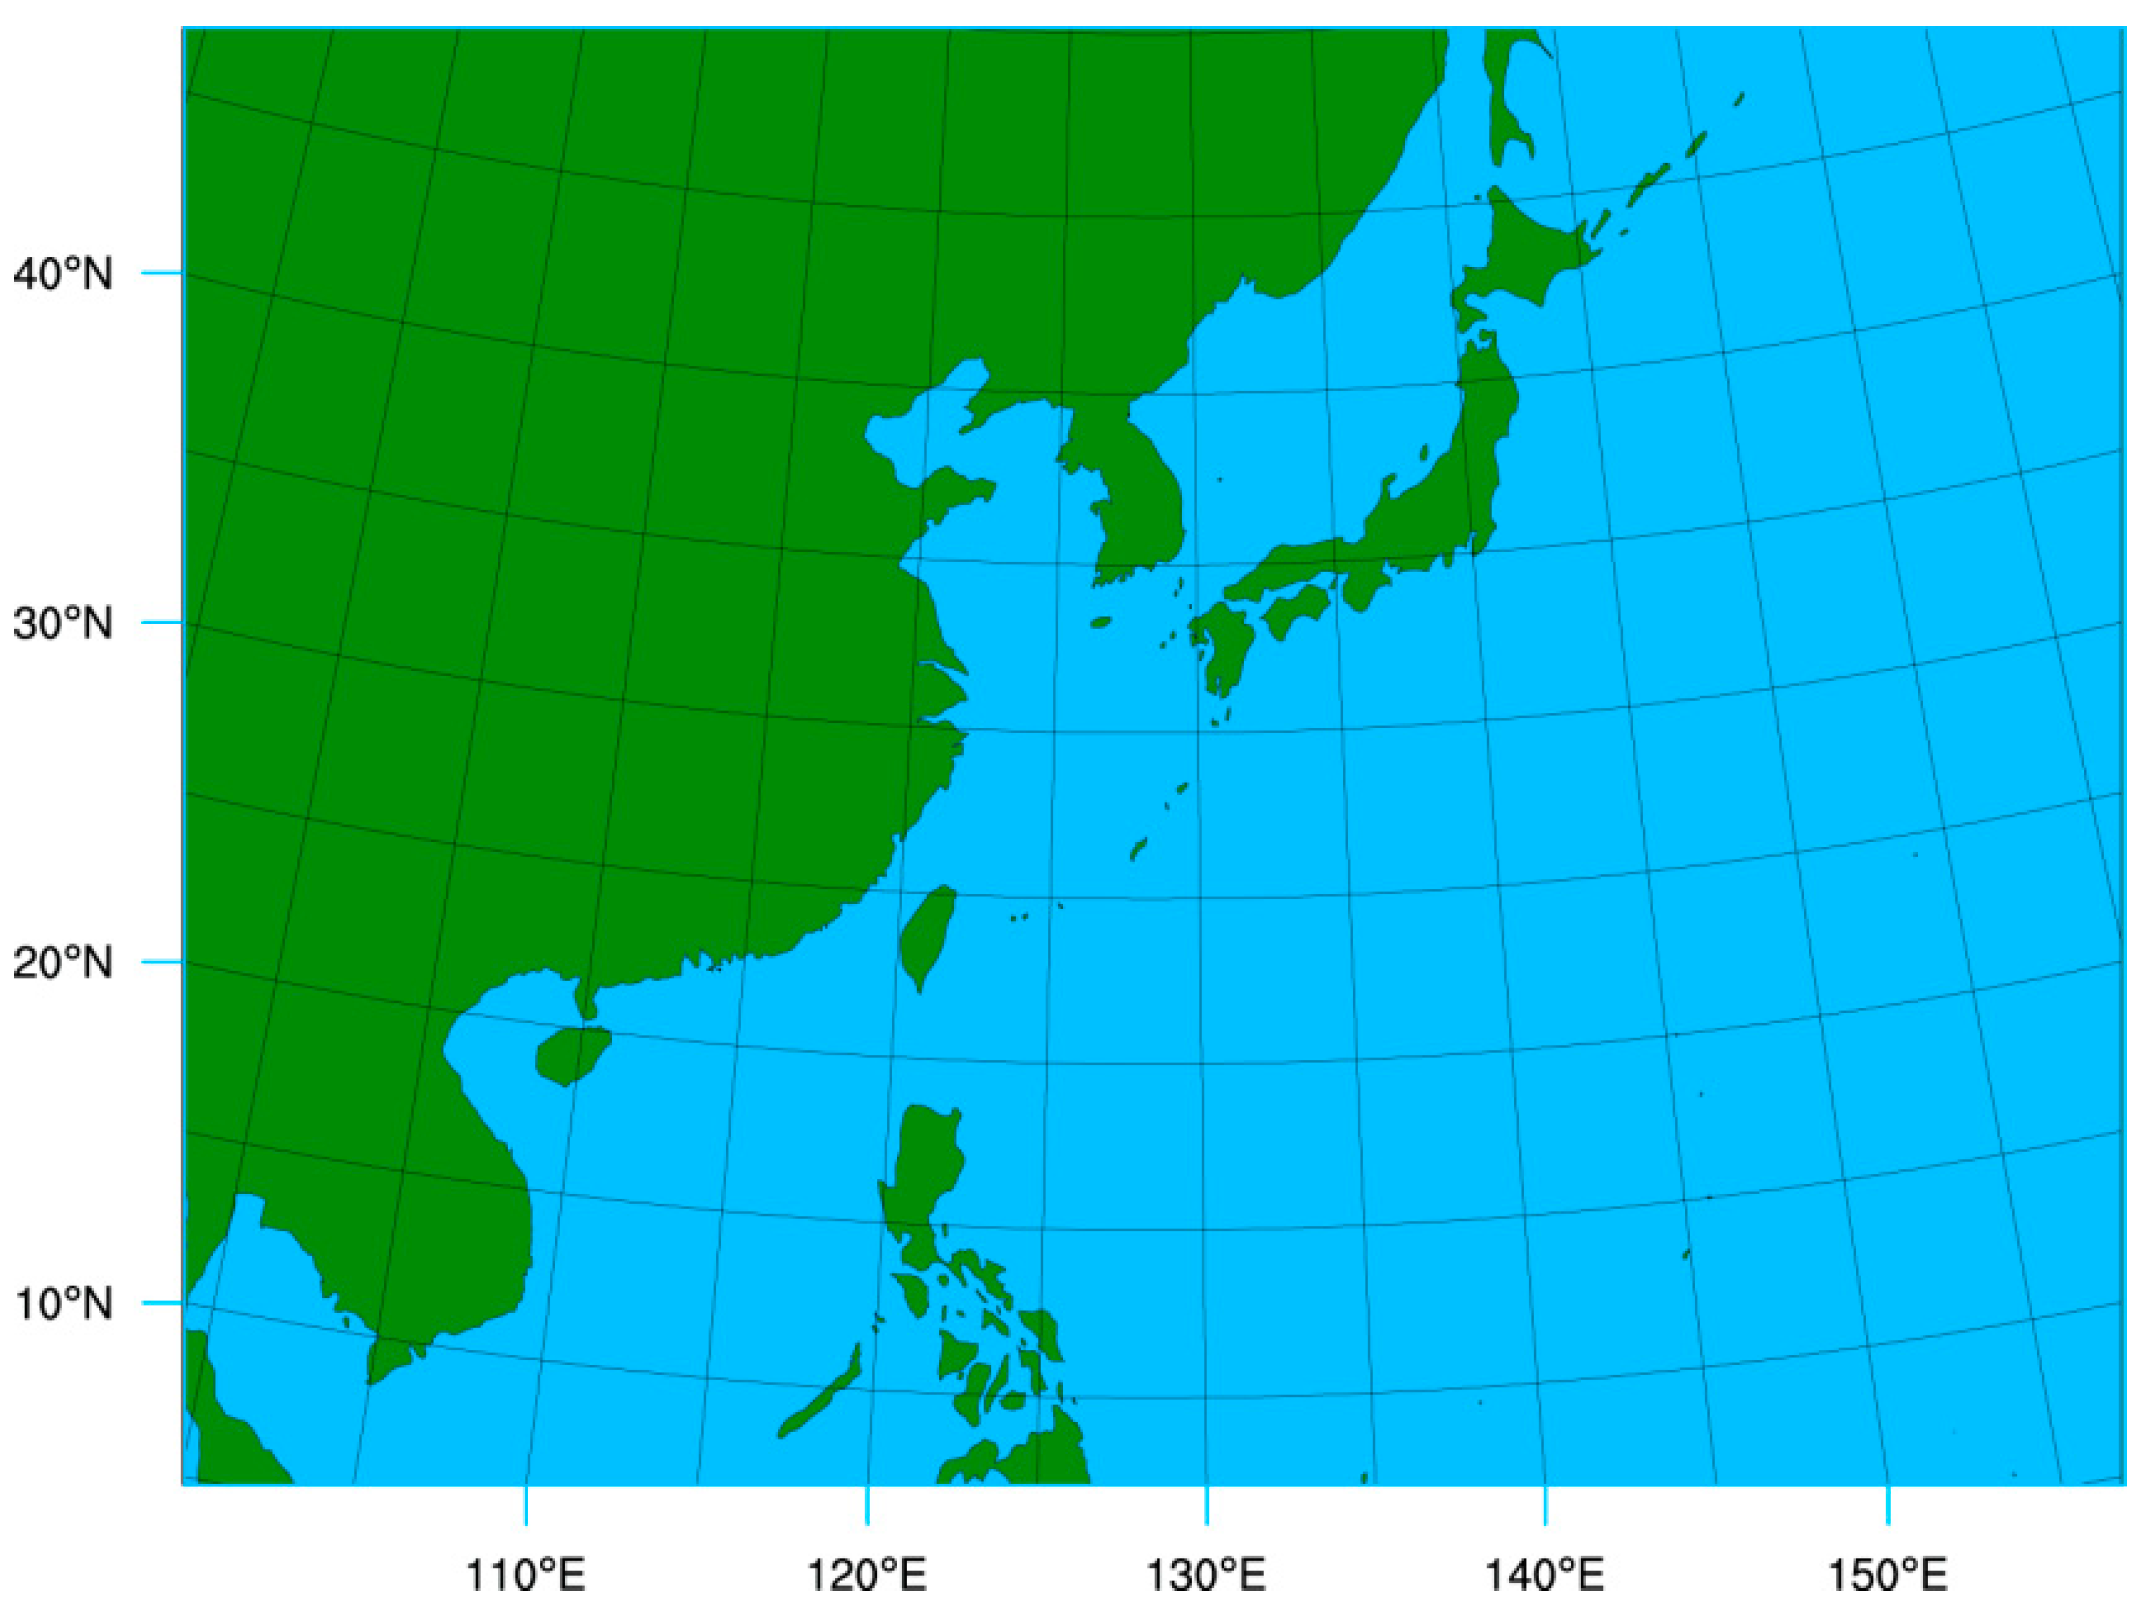
This study adopted the WRF model version 4.0. Reanalysis data provided by the National Centers for Environmental Prediction (NCEP) with a resolution of 0.25° × 0.25° were used as initial boundary conditions. The model domain (Figure 2) was from the western Pacific Ocean to the southeast coast of China, with its center at (128.4°E, 29.3°N) and the number of horizontal grids was 721 × 541 for a single domain. The horizontal grid distance of the WRF model was 9 km with 57 vertical levels, with the model’s top pressure at 50 hPa.
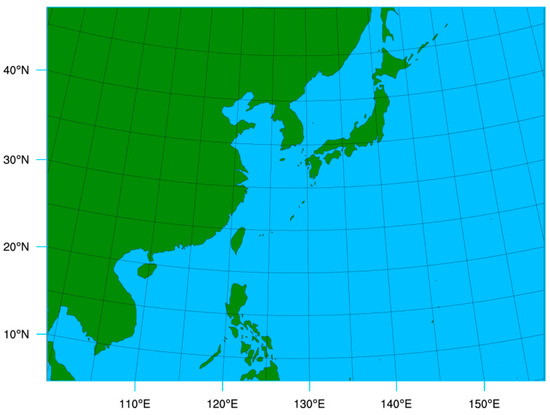
Figure 2.
The simulation domain of WRF model.
For super typhoon Lekima, deterministic 42 h forecasts were launched from 0600 UTC 8 August to 0000 UTC 10 August 2019 in the experiments. The time interval of forecast outputs was recoded every 6 h, and the time integration step was 20 s. Eight different physical parameterization schemes were selected for the sensitivity experiments (Table 4). In addition, the ninth experiment with data assimilation was designed with the sensitivity experiments for various physical parameterization schemes. The forecast field from exp4 was provided as the background field for the assimilation experiment valid at 0600 UTC 8 August 2019.
Table 4.
The settings of eight sensitivity experiments.
4. Results
The results of the parameterization sensitivity experiments and the MWHS-2 data assimilation experiment were analyzed. The observed track, MWS, and MSLP data of typhoon Lekima were from the China Meteorological Administration (CMA), which were used as the ground truth. The maximum wind at 10 m and the minimum surface pressure were directly determined as MWS and MSLP, respectively, in the numerical experiments with an appropriate search size to exclude other typhoons in the domain.
4.1. Parameterization Sensitivity Experiments
The eight experiments adopted different combinations of physical parameterization schemes. Quantitative comparative results are provided to demonstrate the effect of applying different parameterization schemes on the analysis and forecast of the typhoon’s track and intensity based on the eight experiments from Table 2.
4.1.1. The Typhoon’s Track
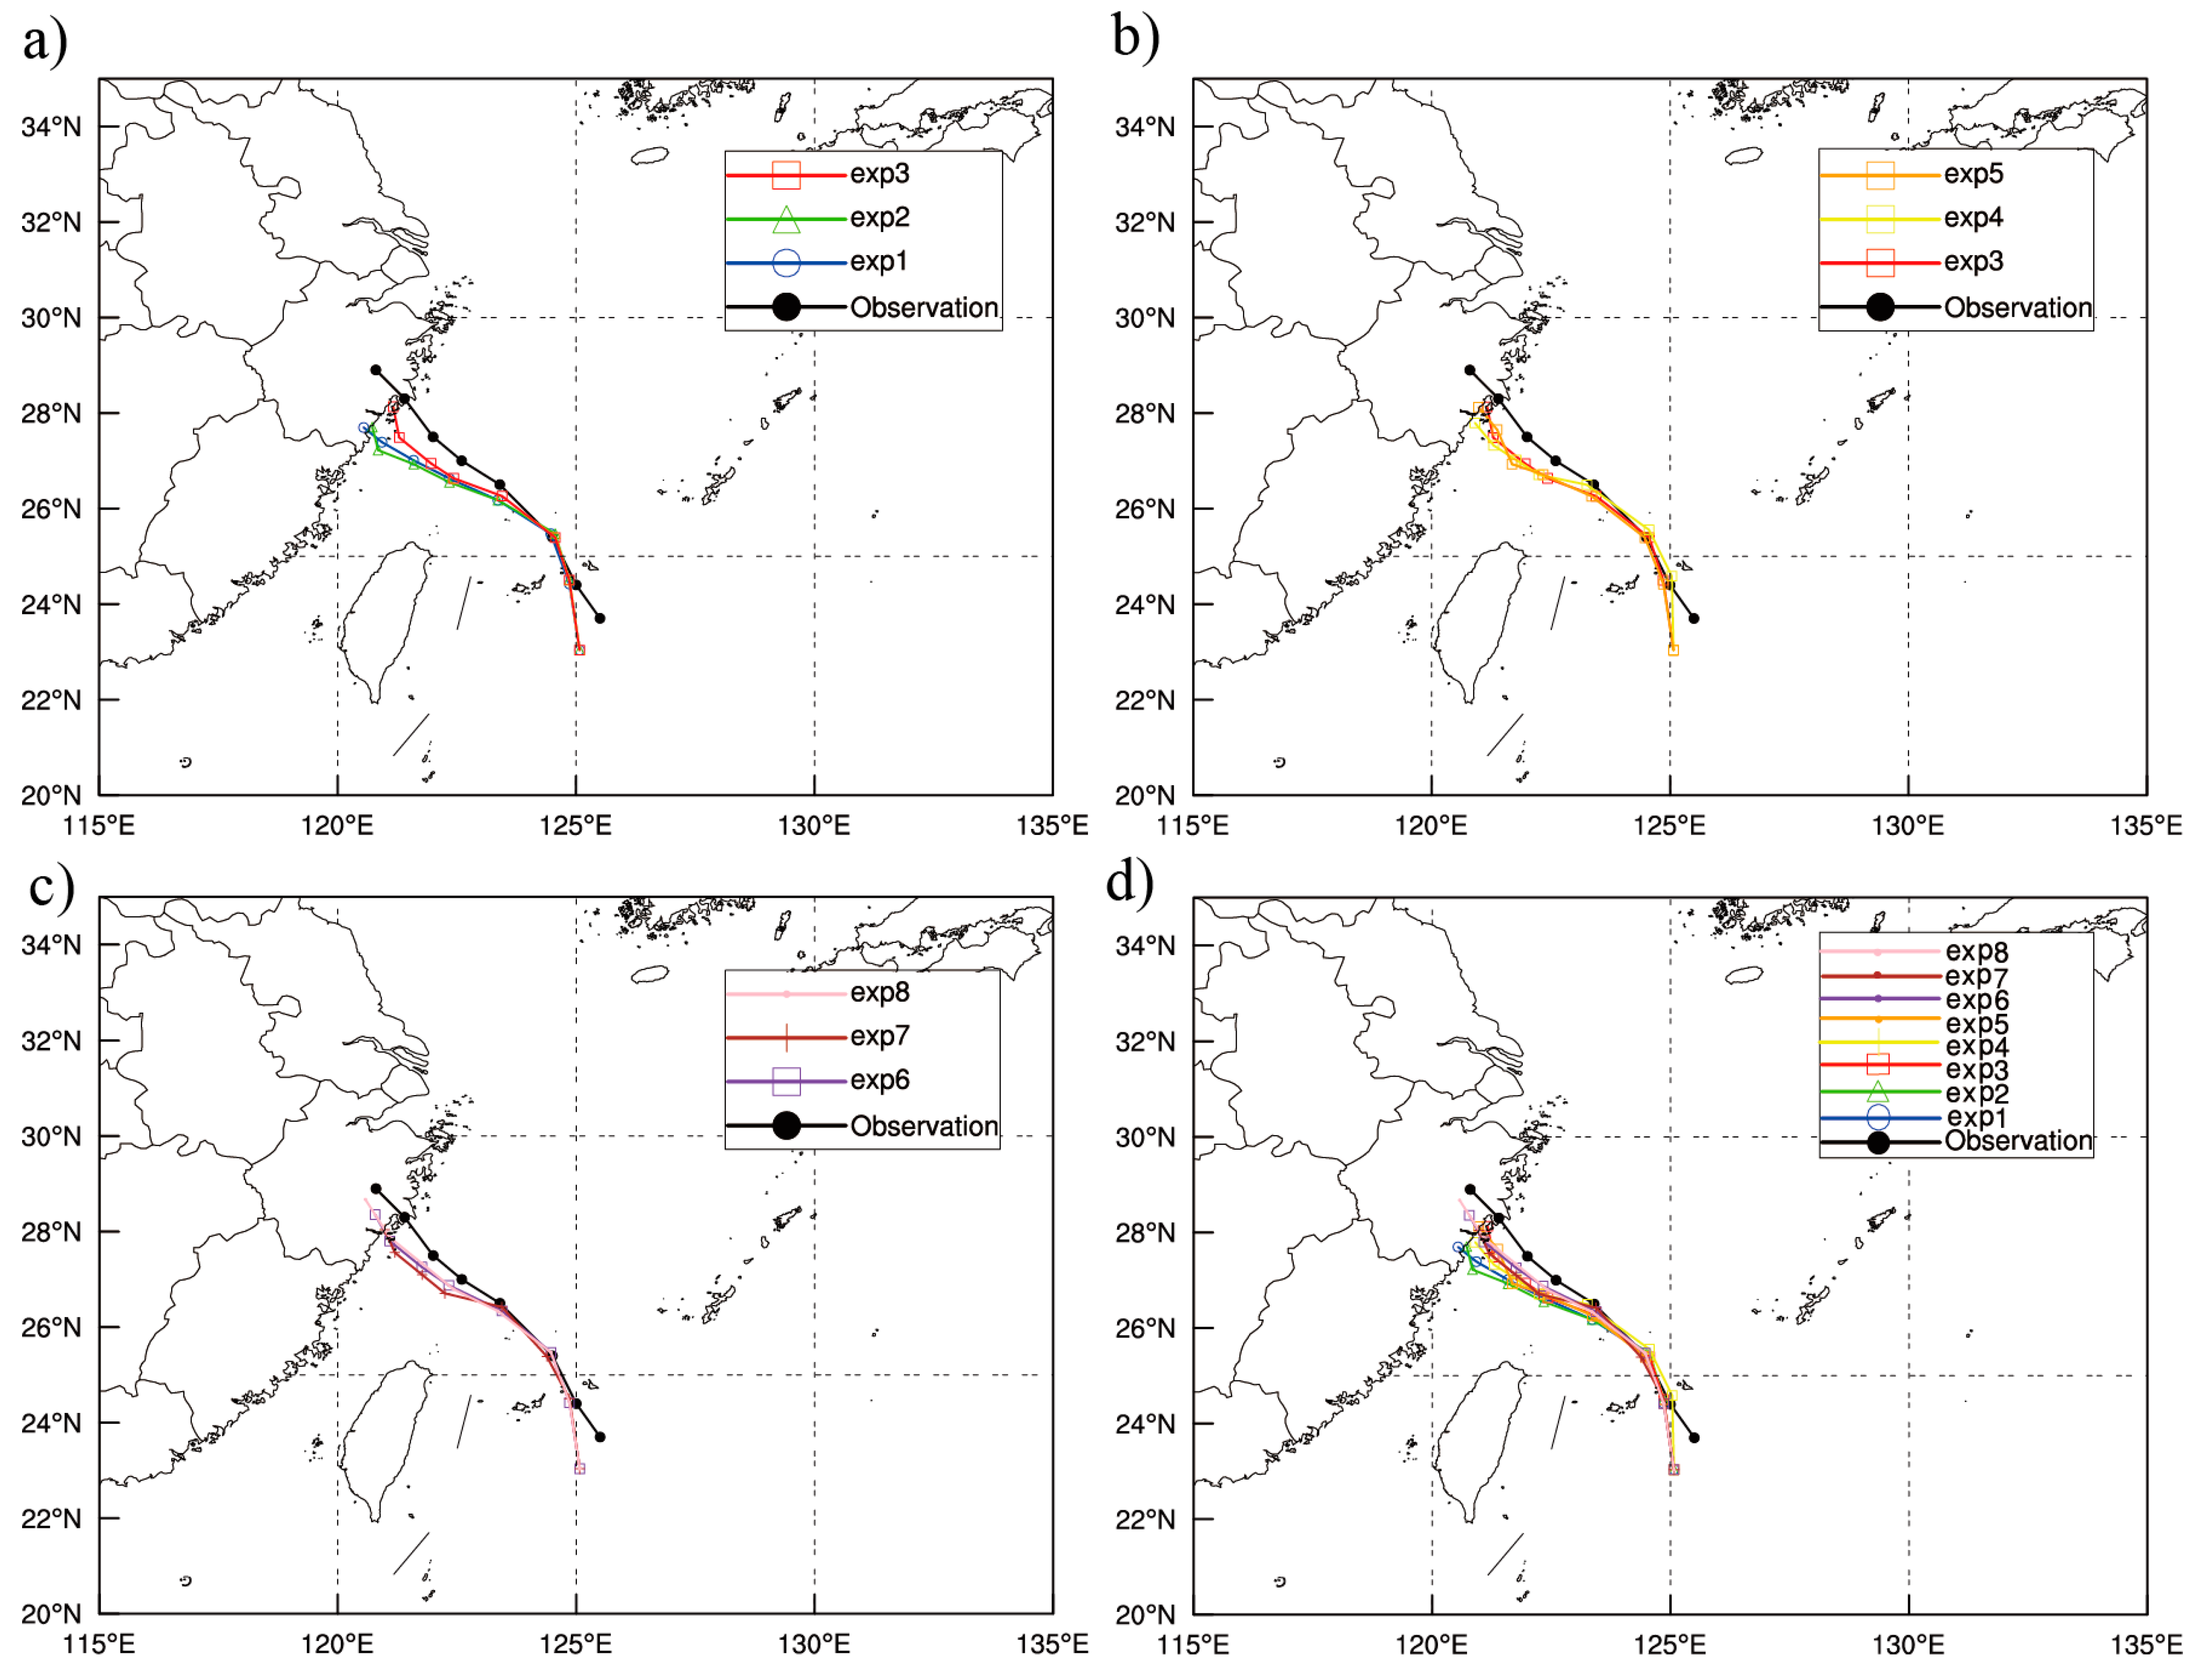
Figure 3 shows the comparison between the track of simulation and observation for a 42 h forecast from 0600 UTC 8 August to 0000 UTC 10 August. As shown in Figure 3a, among the track comparison of exp1, exp2 and exp3, the smallest average track error is found in the exp3 scheme. The results in experiments of exp1 and exp2 are rather consistent, since the same parametrization schemes are applied in exp1 and exp2, except for the RL-DS and RGSL radiation scheme. When applying different microphysics schemes in exp2 and exp3, exp3 yields better results with the Thompson scheme, indicating the microphysical process has a more significant impact on the typhoon than the radiation process.
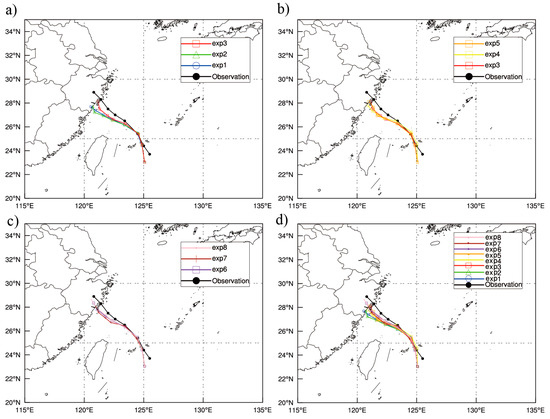
Figure 3.
The track for: (a) exp1, exp2, and exp3, (b) exp3, exp4, and exp5, (c) exp6, exp7, and exp8, (d) all the experiments for the 42 h forecasts from 0600 UTC 8 August to 0000 UTC 10 August 2019.
Figure 3b displays the experimental results of exp3, exp4, and exp5 with the same microphysical parameterization scheme, while the other parameterizations of physical process schemes are different in terms of the radiation scheme, the land surface physical scheme, the surface layer physics, and the planetary boundary layer scheme. The results of these three schemes are relatively similar, indicating that other physical process schemes have a slight impact on the track forecasts.
By comparing exp6–8 (Figure 3c), it is found that the track from the exp8 scheme is the most accurate. Among them, both exp6 and exp8 apply the same WSM6 scheme with the RL-DS scheme and the RGSL scheme, respectively, while WDM6 is used in exp7. The WDM6 scheme does not outperform the WSM6 scheme for the track forecast. A similar result was also found in other studies, which indicates that the empirical knowledge of the WDM6 microphysics scheme is probably not able to represent these microphysical processes in real tropical cyclone cases [34,35,36]. When comparing the results of exp6 and exp8, it can be found that their track forecasts are relatively similar, but the speed of exp8 is consistently better with the observed track. From Figure 3d, in general, among all schemes, the simulation track of the exp8 scheme has the lowest track error in both movement direction and speed. By contrast, the simulation results of the exp1 and exp2 are the worst. It is interesting to note that a southwest bias is commonly found in all the simulation tracks, which probably arise from the initial condition, the boundary condition, and the forecast model.
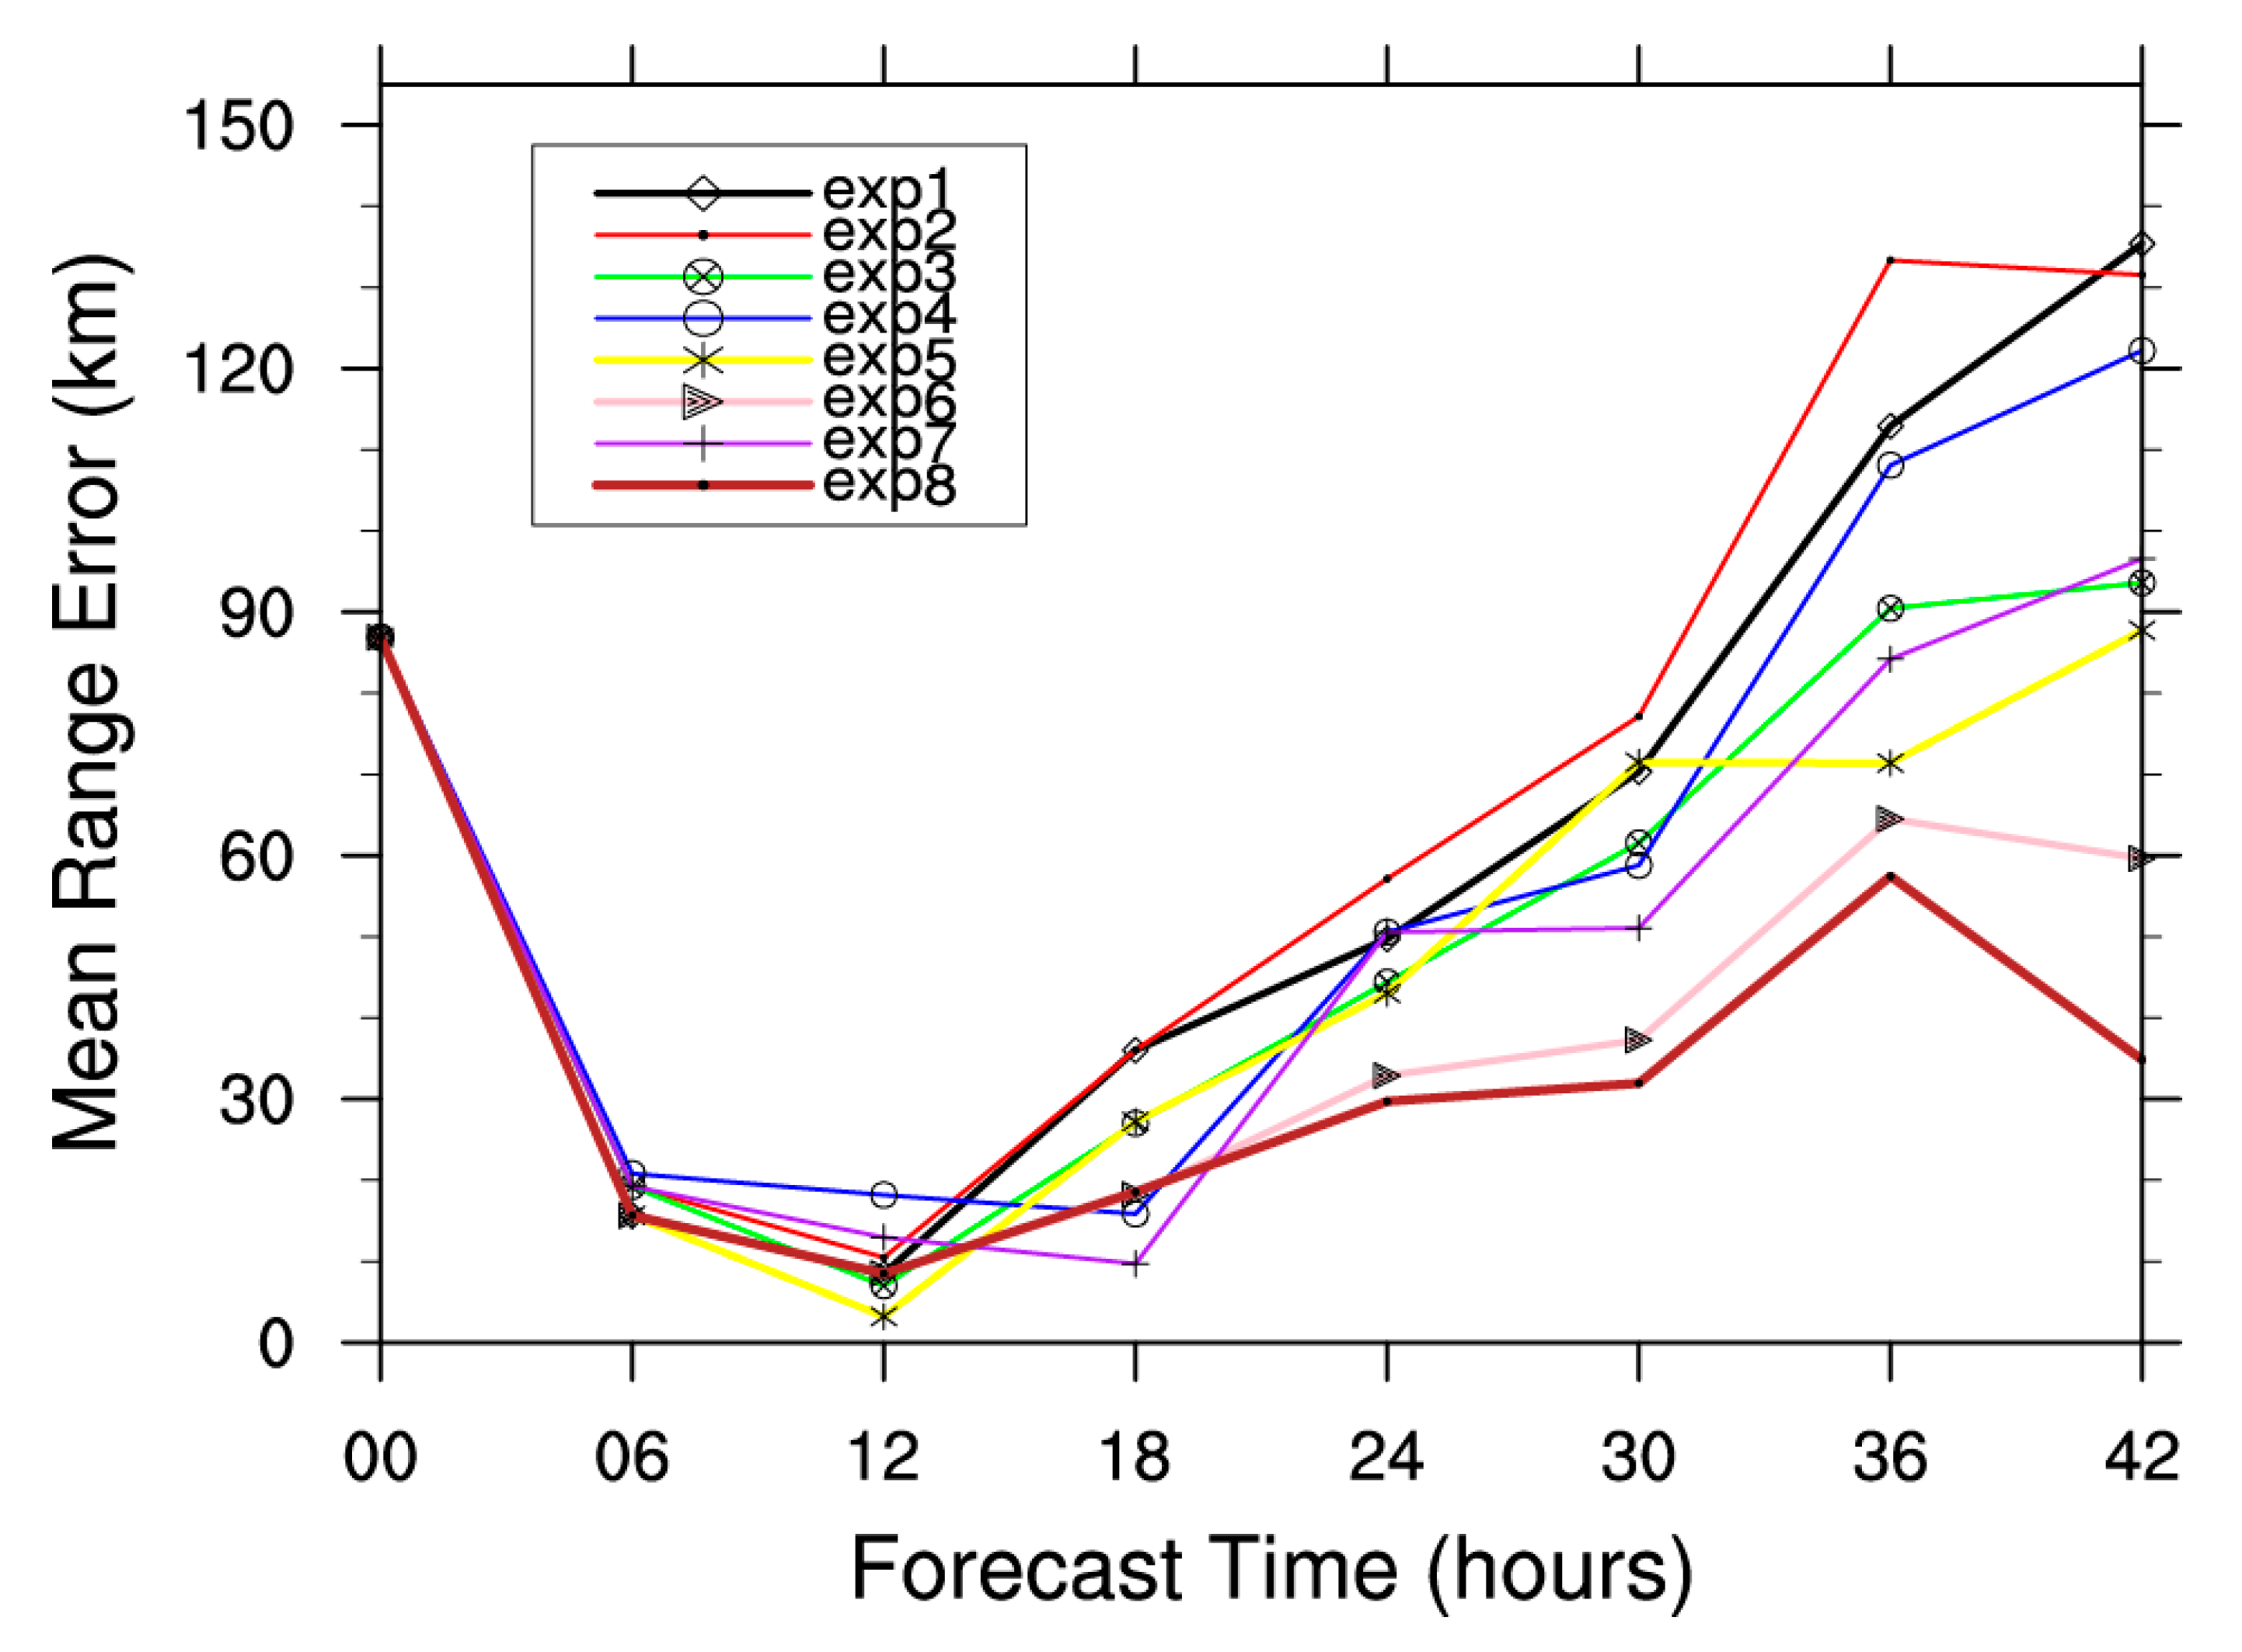
From Figure 4, the mean track error from exp2 is the highest. The experiment exp8 yields the smallest track error consistently. It proves that the selection of the microphysical process scheme has the greatest influence on the simulation of the typhoon’s track. It seems the WSM6 scheme is the main factor leading to a positive forecasting effect of the typhoon’s track. The combination of the WSM6 mp_physics, RMM5 sf_sfclay_physics, and the YSU bl_pbl_physics is the best.
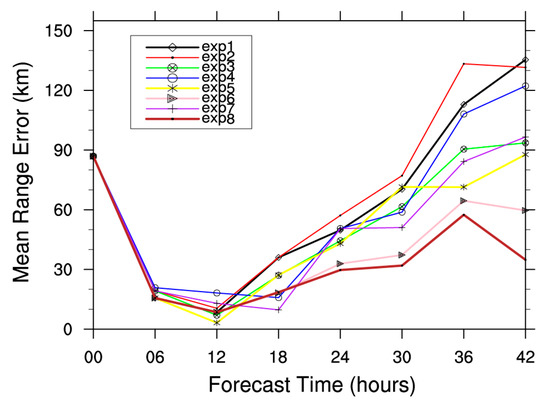
Figure 4.
The mean track error (units: km) with forecast leading time for different experiments from 0600 UTC 8 August to 0000 UTC 10 August 2019.
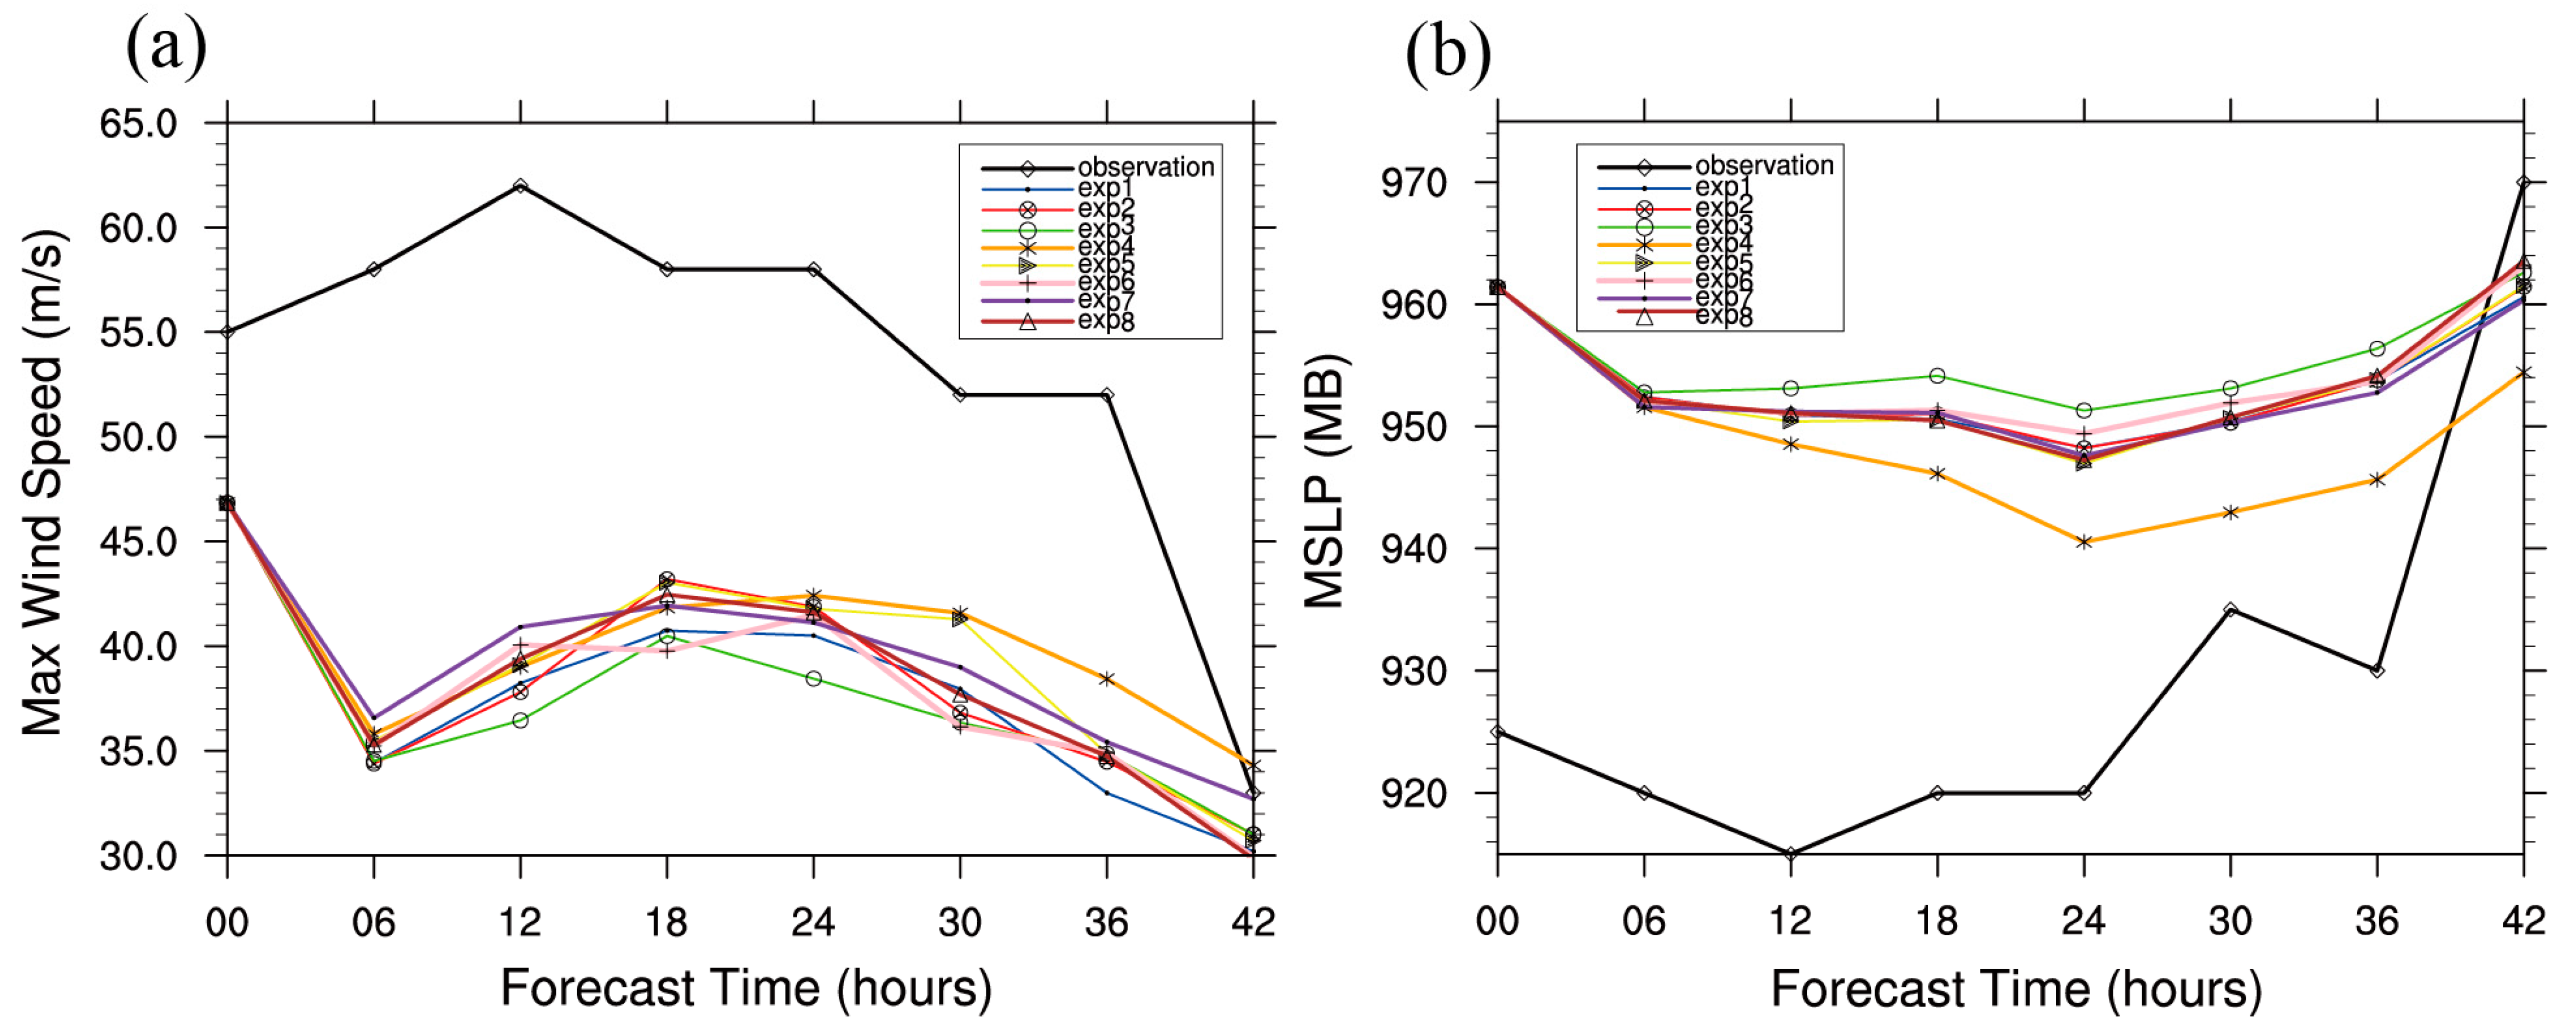
4.1.2. The Typhoon’s Intensity
Figure 5 shows the results of the typhoon intensity from the eight experiments along with the observed track. Overall, the intensity from the simulated typhoon is weaker than the observed track in terms of both MSLP and MWS. In Figure 5a, except for exp4, the results of other experiments are basically similar for the whole period. The largest average error is from exp3, due to the weakest predicted typhoon intensity. It seems that the selection of microphysical schemes has a slight effect on the simulation of the typhoon’s intensity. In general, the intensity of exp4 matches best with the observed track for both MSLP and MWS. The results show that the intensity of the simulated typhoon is more sensitive to surface physics schemes.
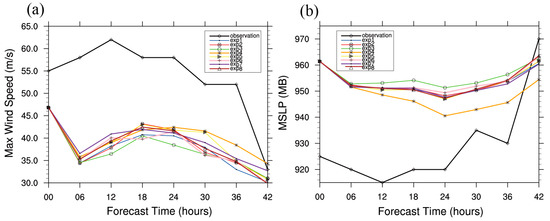
Figure 5.
(a) Max wind speed (units: m/s) and (b) minimum sea level pressure (units: MB) forecast errors by lead time from 0600 UTC 8 August to 0000 UTC 10 August 2019, initialized at 0600 UTC 8 August 2019 for the eight different sensitivity experiments.
4.2. MWHS-2 Data Assimilation Experiment
Based on the results of the typhoon’s track and intensity simulation, it seems the track forecast skill from the parameterization scheme in exp4 is rather positive in terms of both track error and intensity error, which is why it was further selected to provide the background field for the following MWHS-2 radiance data assimilation experiment. Using the WRF-3DVar model, the MWHS-2 radiance data onboard the FY-3D was assimilated for this case to improve the analysis and forecast skill.
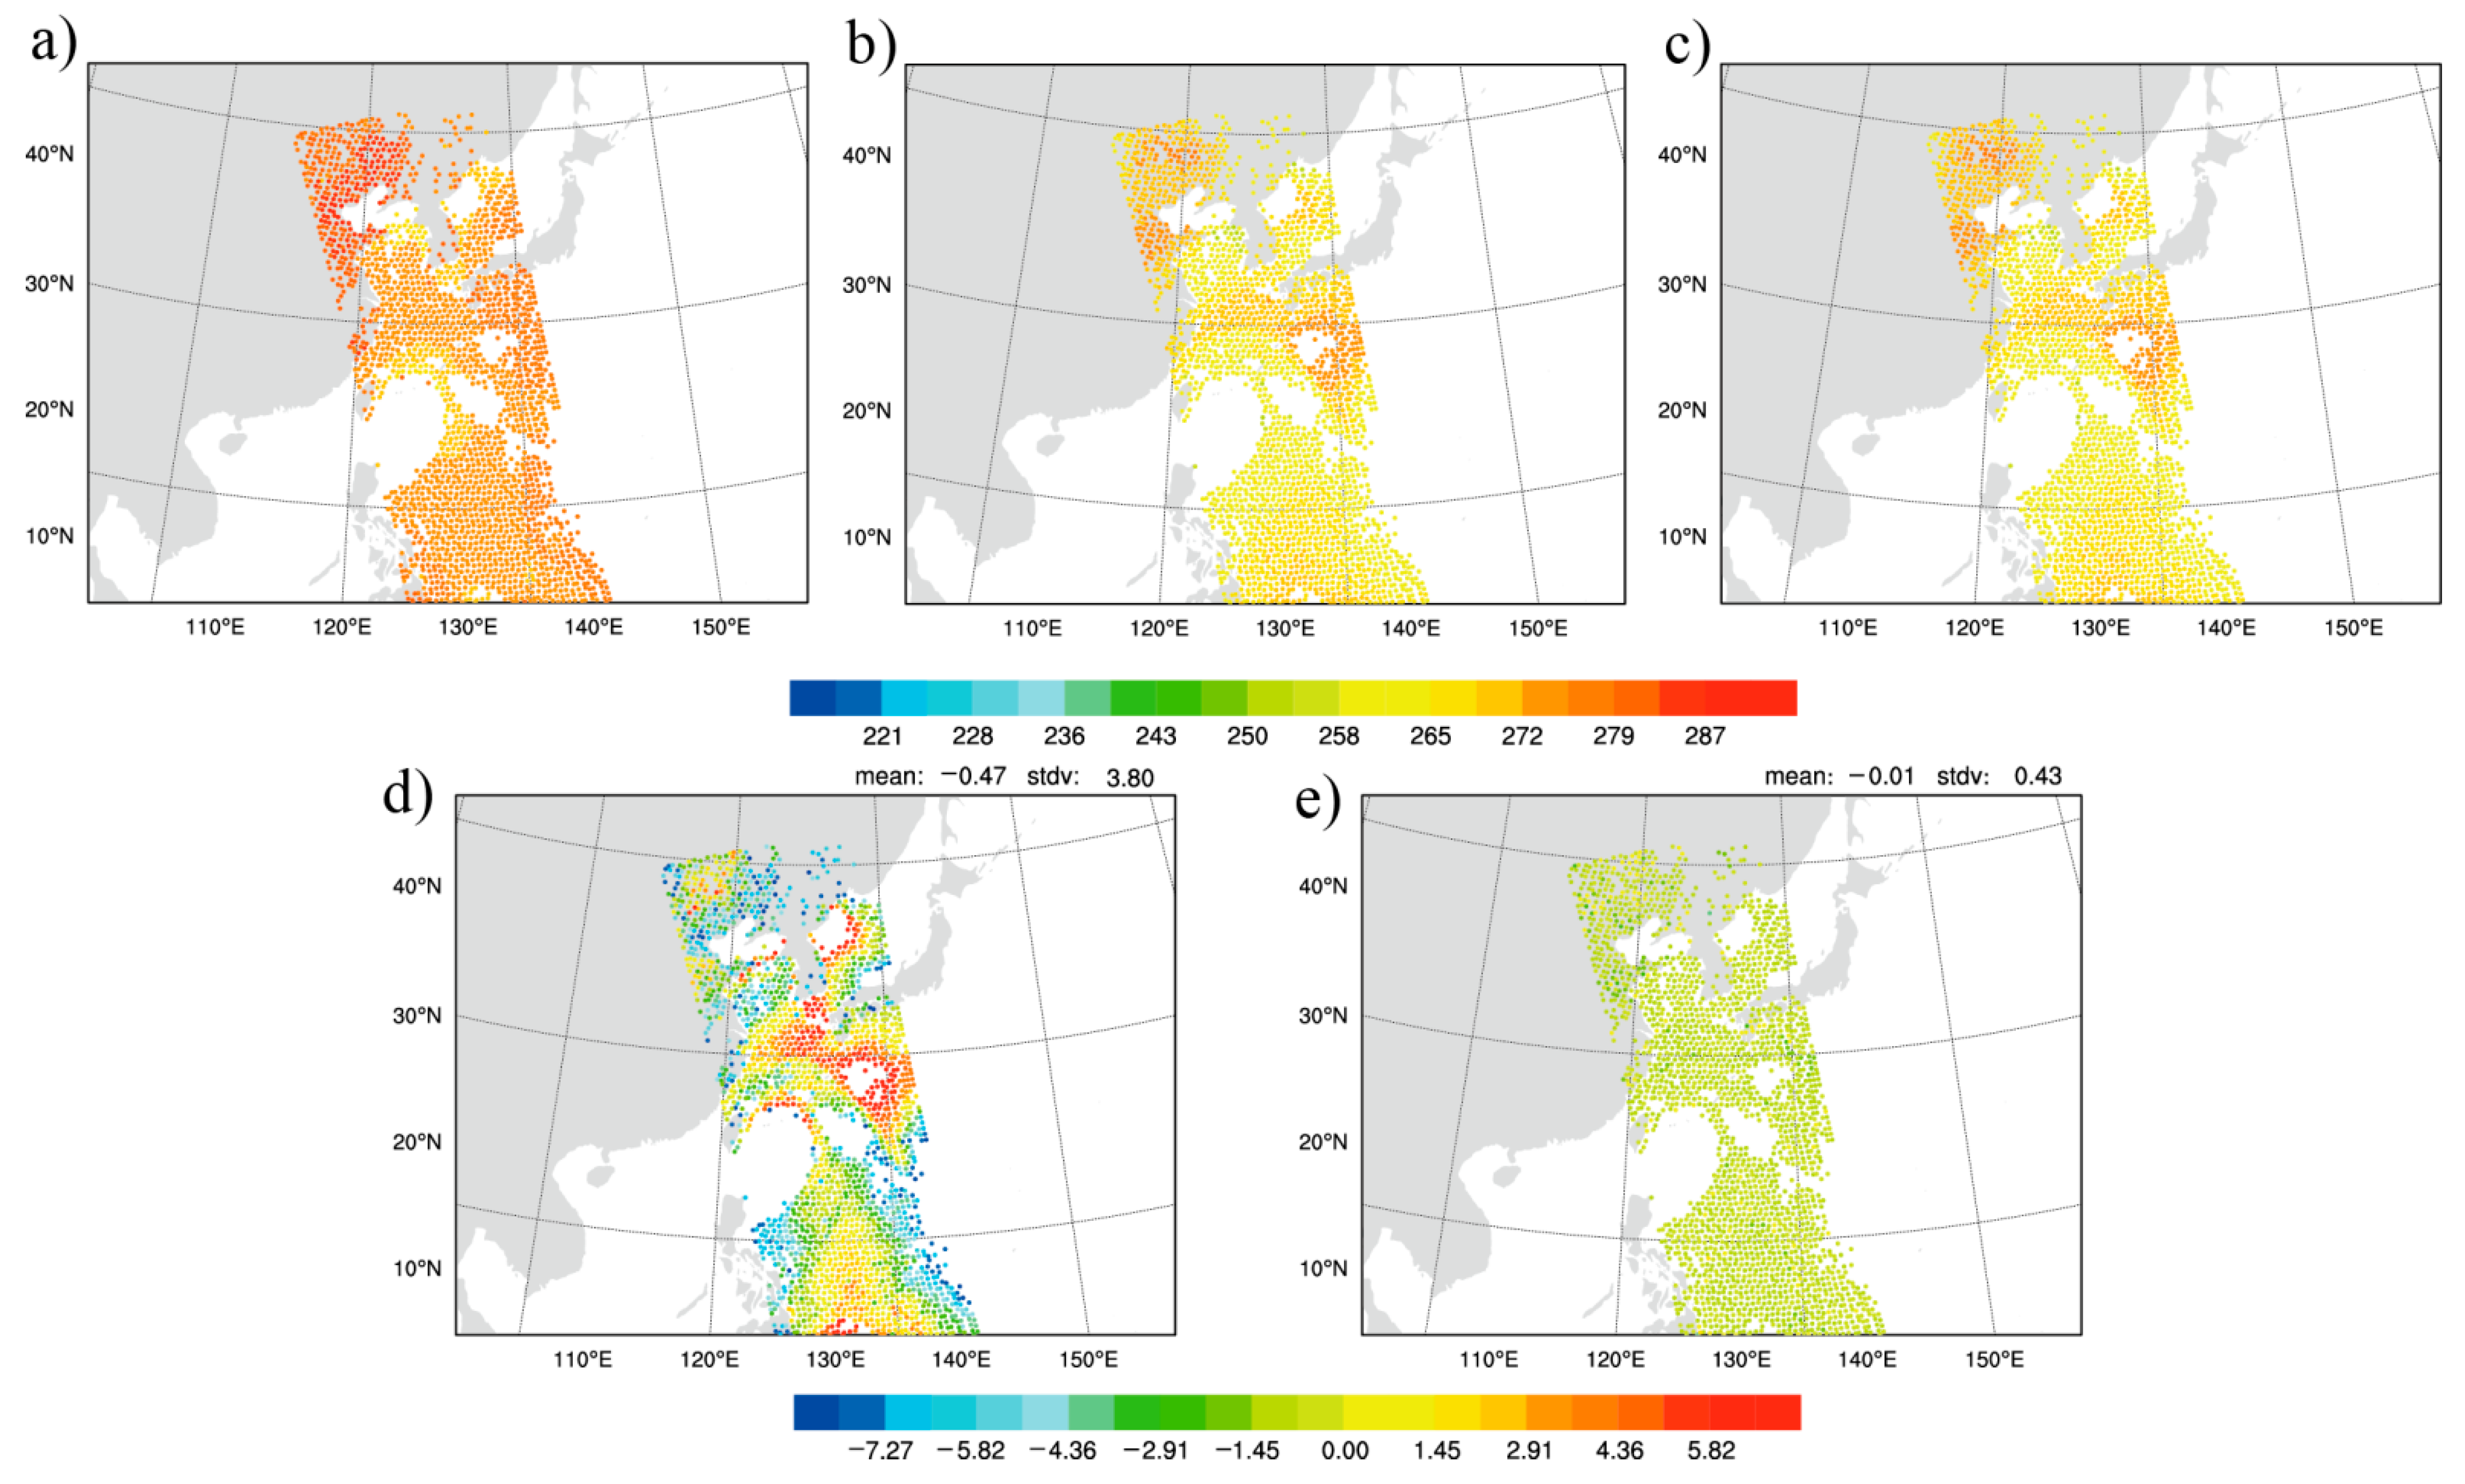
4.2.1. The Impact on the Analysis
The simulated Tb from the background and the analysis were compared with the observations along with the distribution of the observations minus background (OMB) and the observations minus analysis (OMA). From Figure 6a–c, the simulated Tb values of the background are notably warmer than the observed Tb values. After assimilating the MWHS radiance data, the simulated Tb is rather consistent with the observation. By comparing Figure 6d,e, it is shown that the magnitude of OMA is obviously smaller than that of OMB with the bias correction. In addition, the mean and standard deviation (stdv) of OMA are significantly less than those of OMB.

Figure 6.
The distribution of Tb (units: K) for: (a) the background, (b) the analysis, (c) the observation, (d) the observation minus the background with BC (bias correction), and (e) the observation minus the analysis, valid at 0600 UTC 8 August 2019.
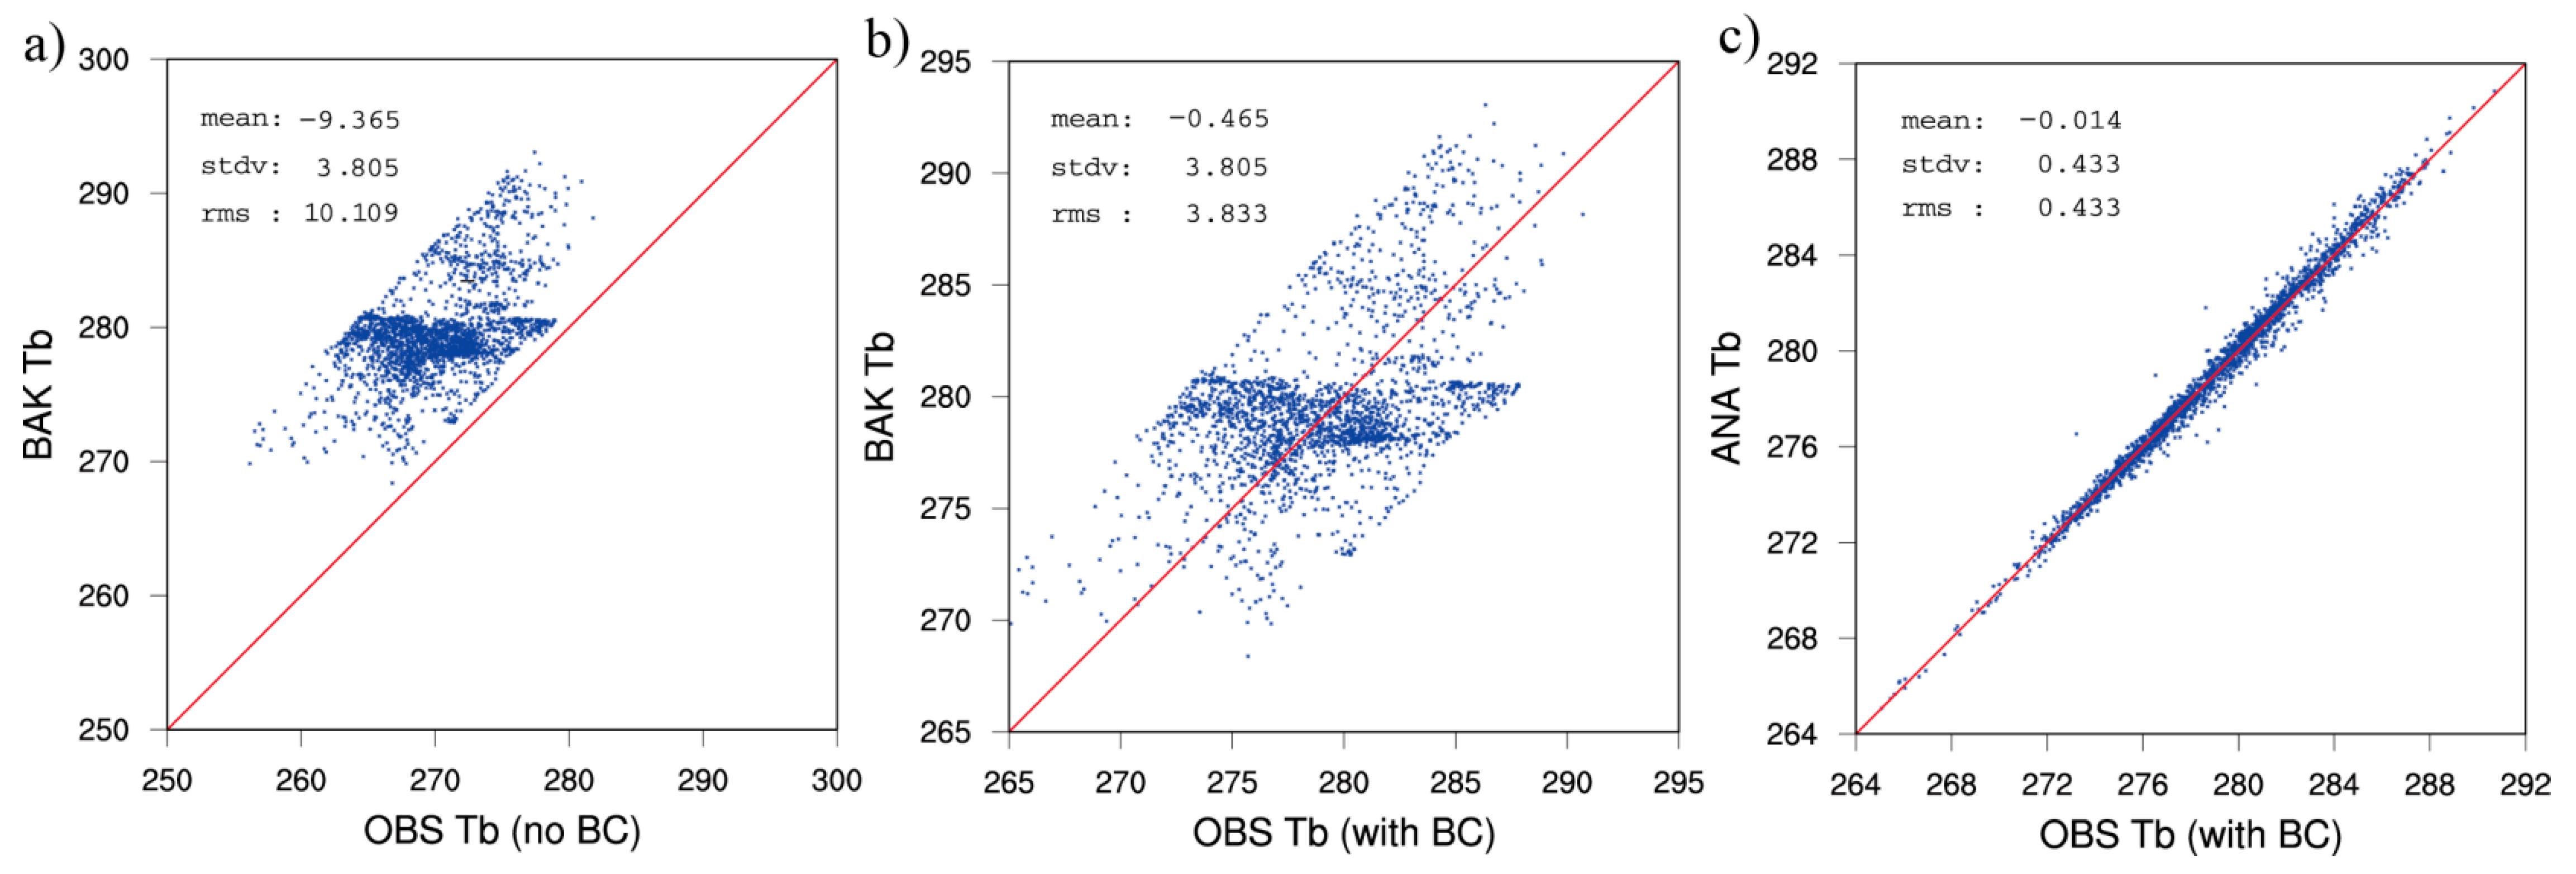
From the scatter plots of Figure 7a, almost all the scattered points lie above the contour line, indicating that the background simulated Tb values are higher than the observed Tb values. From Figure 7b, it is noted that the bias is largely corrected by comparing the observed Tb and the background Tb after the bias correction. Meanwhile, the root mean square (rms) error values of OMB are sharply decreased. Figure 7c shows the scatters of the analysis against the observation. Compared with Figure 7b, the distribution of scatter points around the isoline is denser and more convergent. Both the stdv and the rms of OMA are decreased to 0.433 K (Figure 7c), which indicates that the analysis better fits the observation.

Figure 7.
Scatterplots for MWHS-2 assimilation in (a) observation vs. background without BC, (b) observation vs. background with BC, (c) observation vs. analysis with BC, from channel 15, valid at 0600 UTC 8 August 2019.
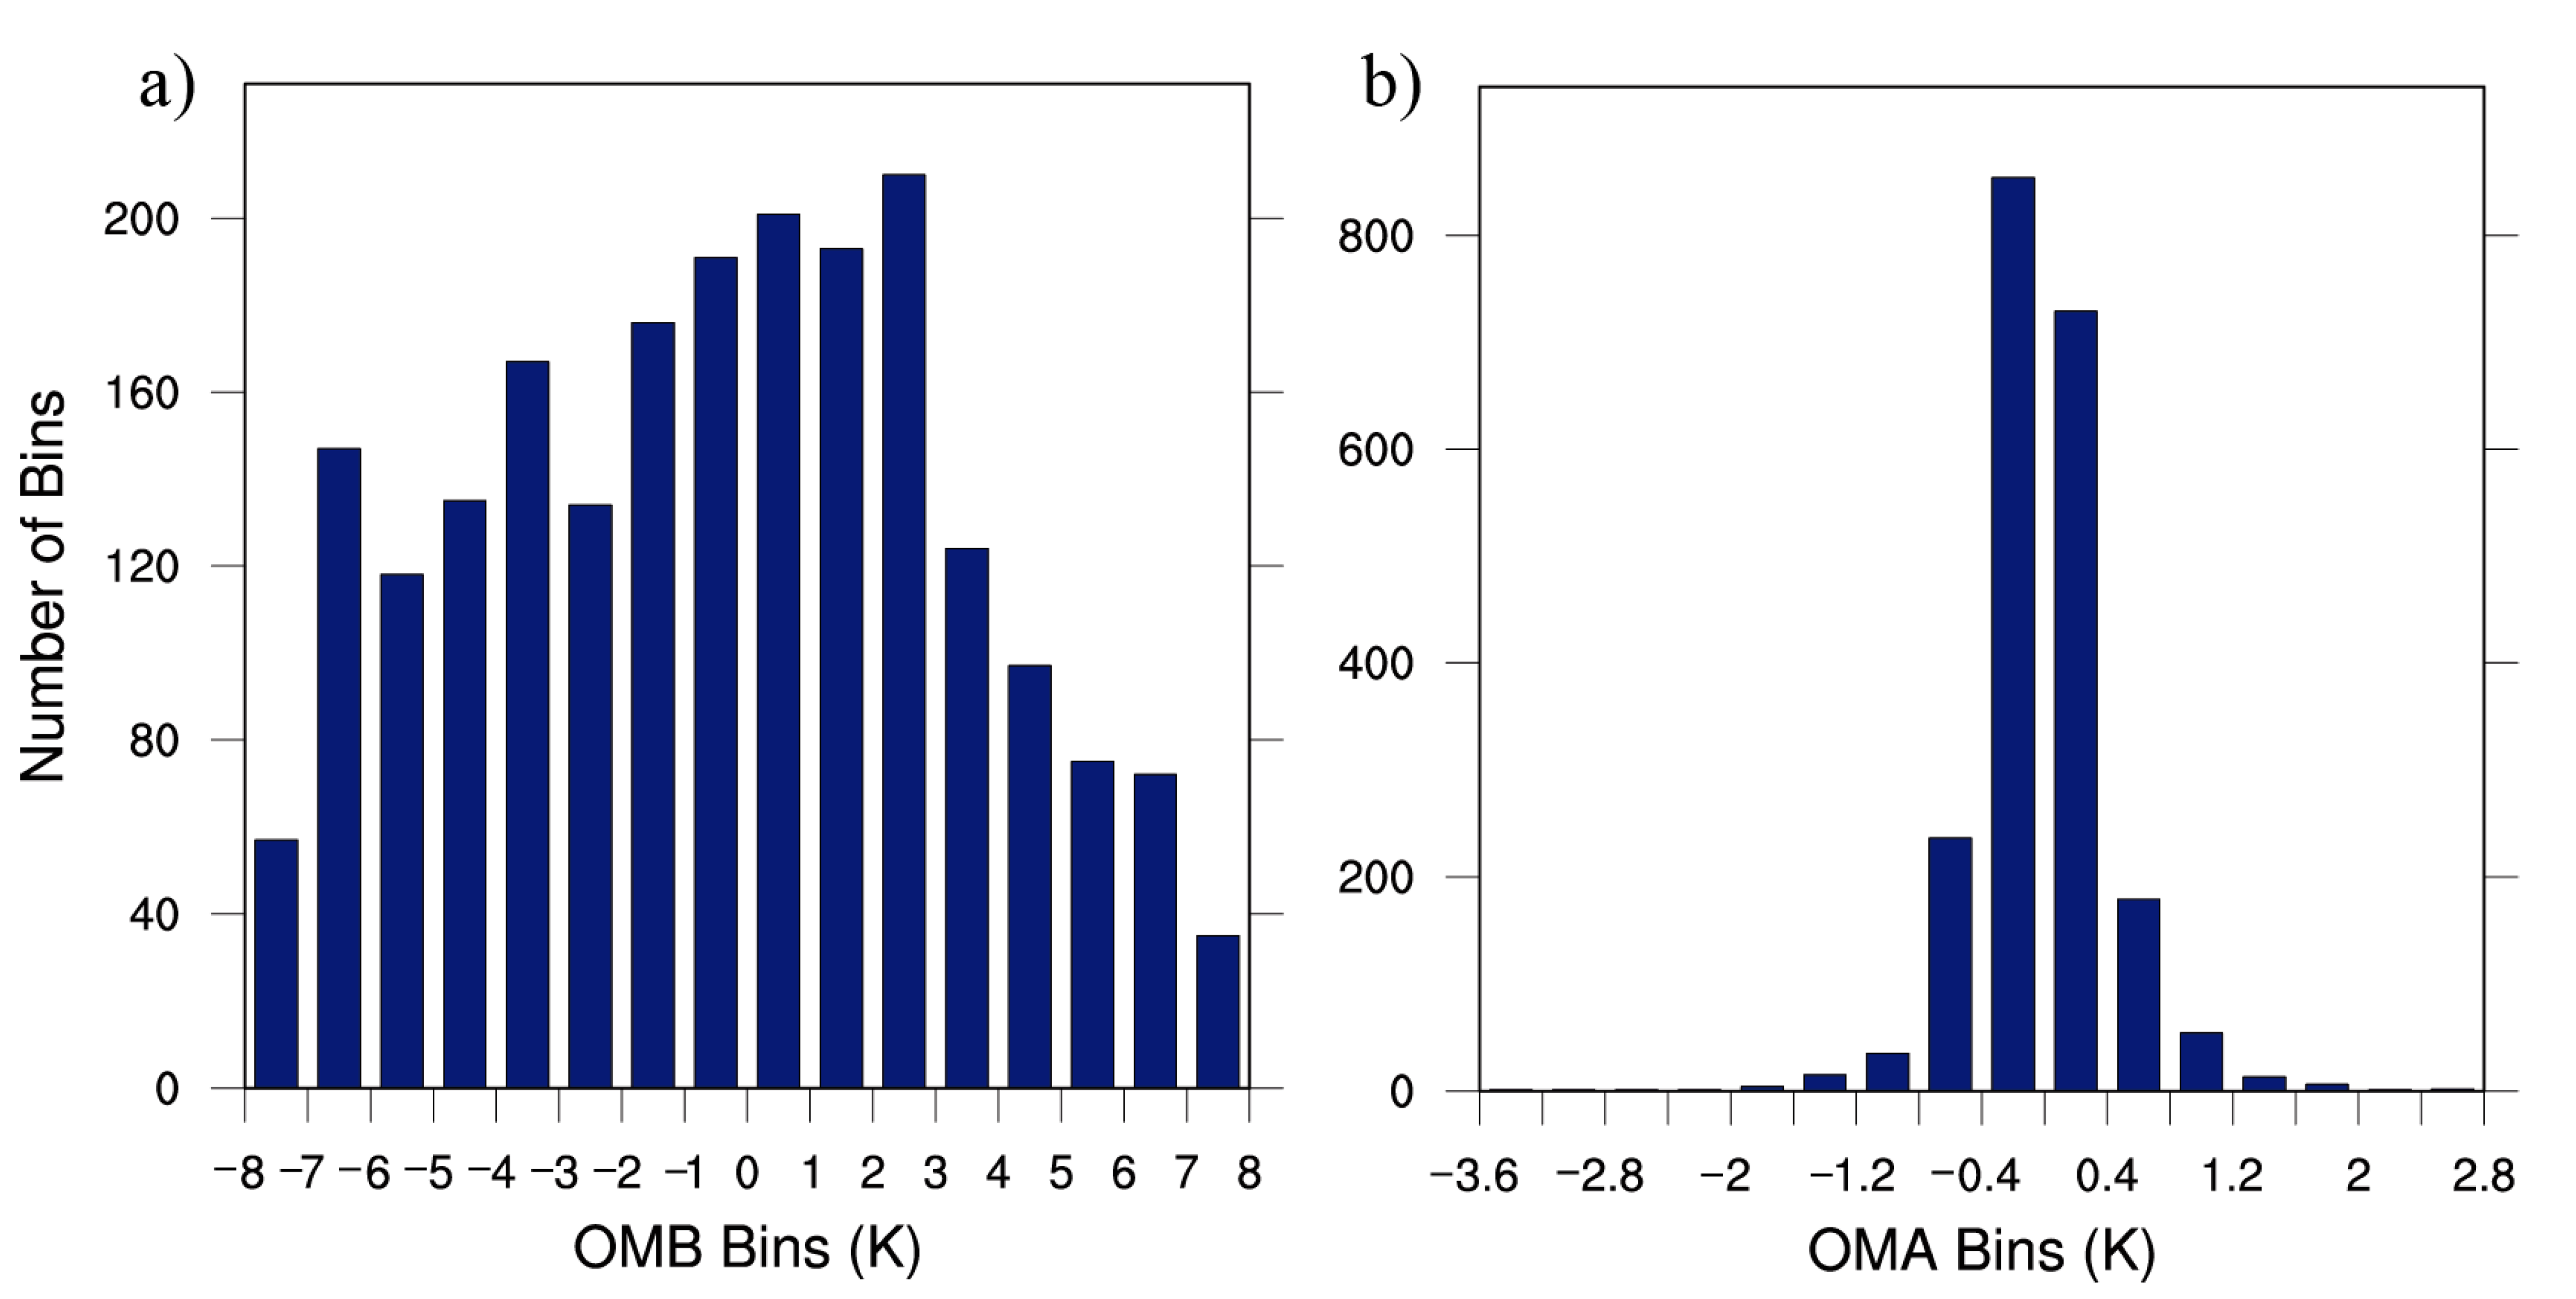
Figure 8a is the histogram of the difference between the observed Tb and the simulated Tb based on the background, while the difference between the observation and the assimilation analysis is provided in Figure 8b. It is found that the residual distribution of OMB is more discrete from −8 to 8, while the peak area of the OMA residual distribution is closer to 0 K.

Figure 8.
The histogram of residual frequency distribution at 0600 UTC 8 August 2019 for (a) OMB, (b) OMA.
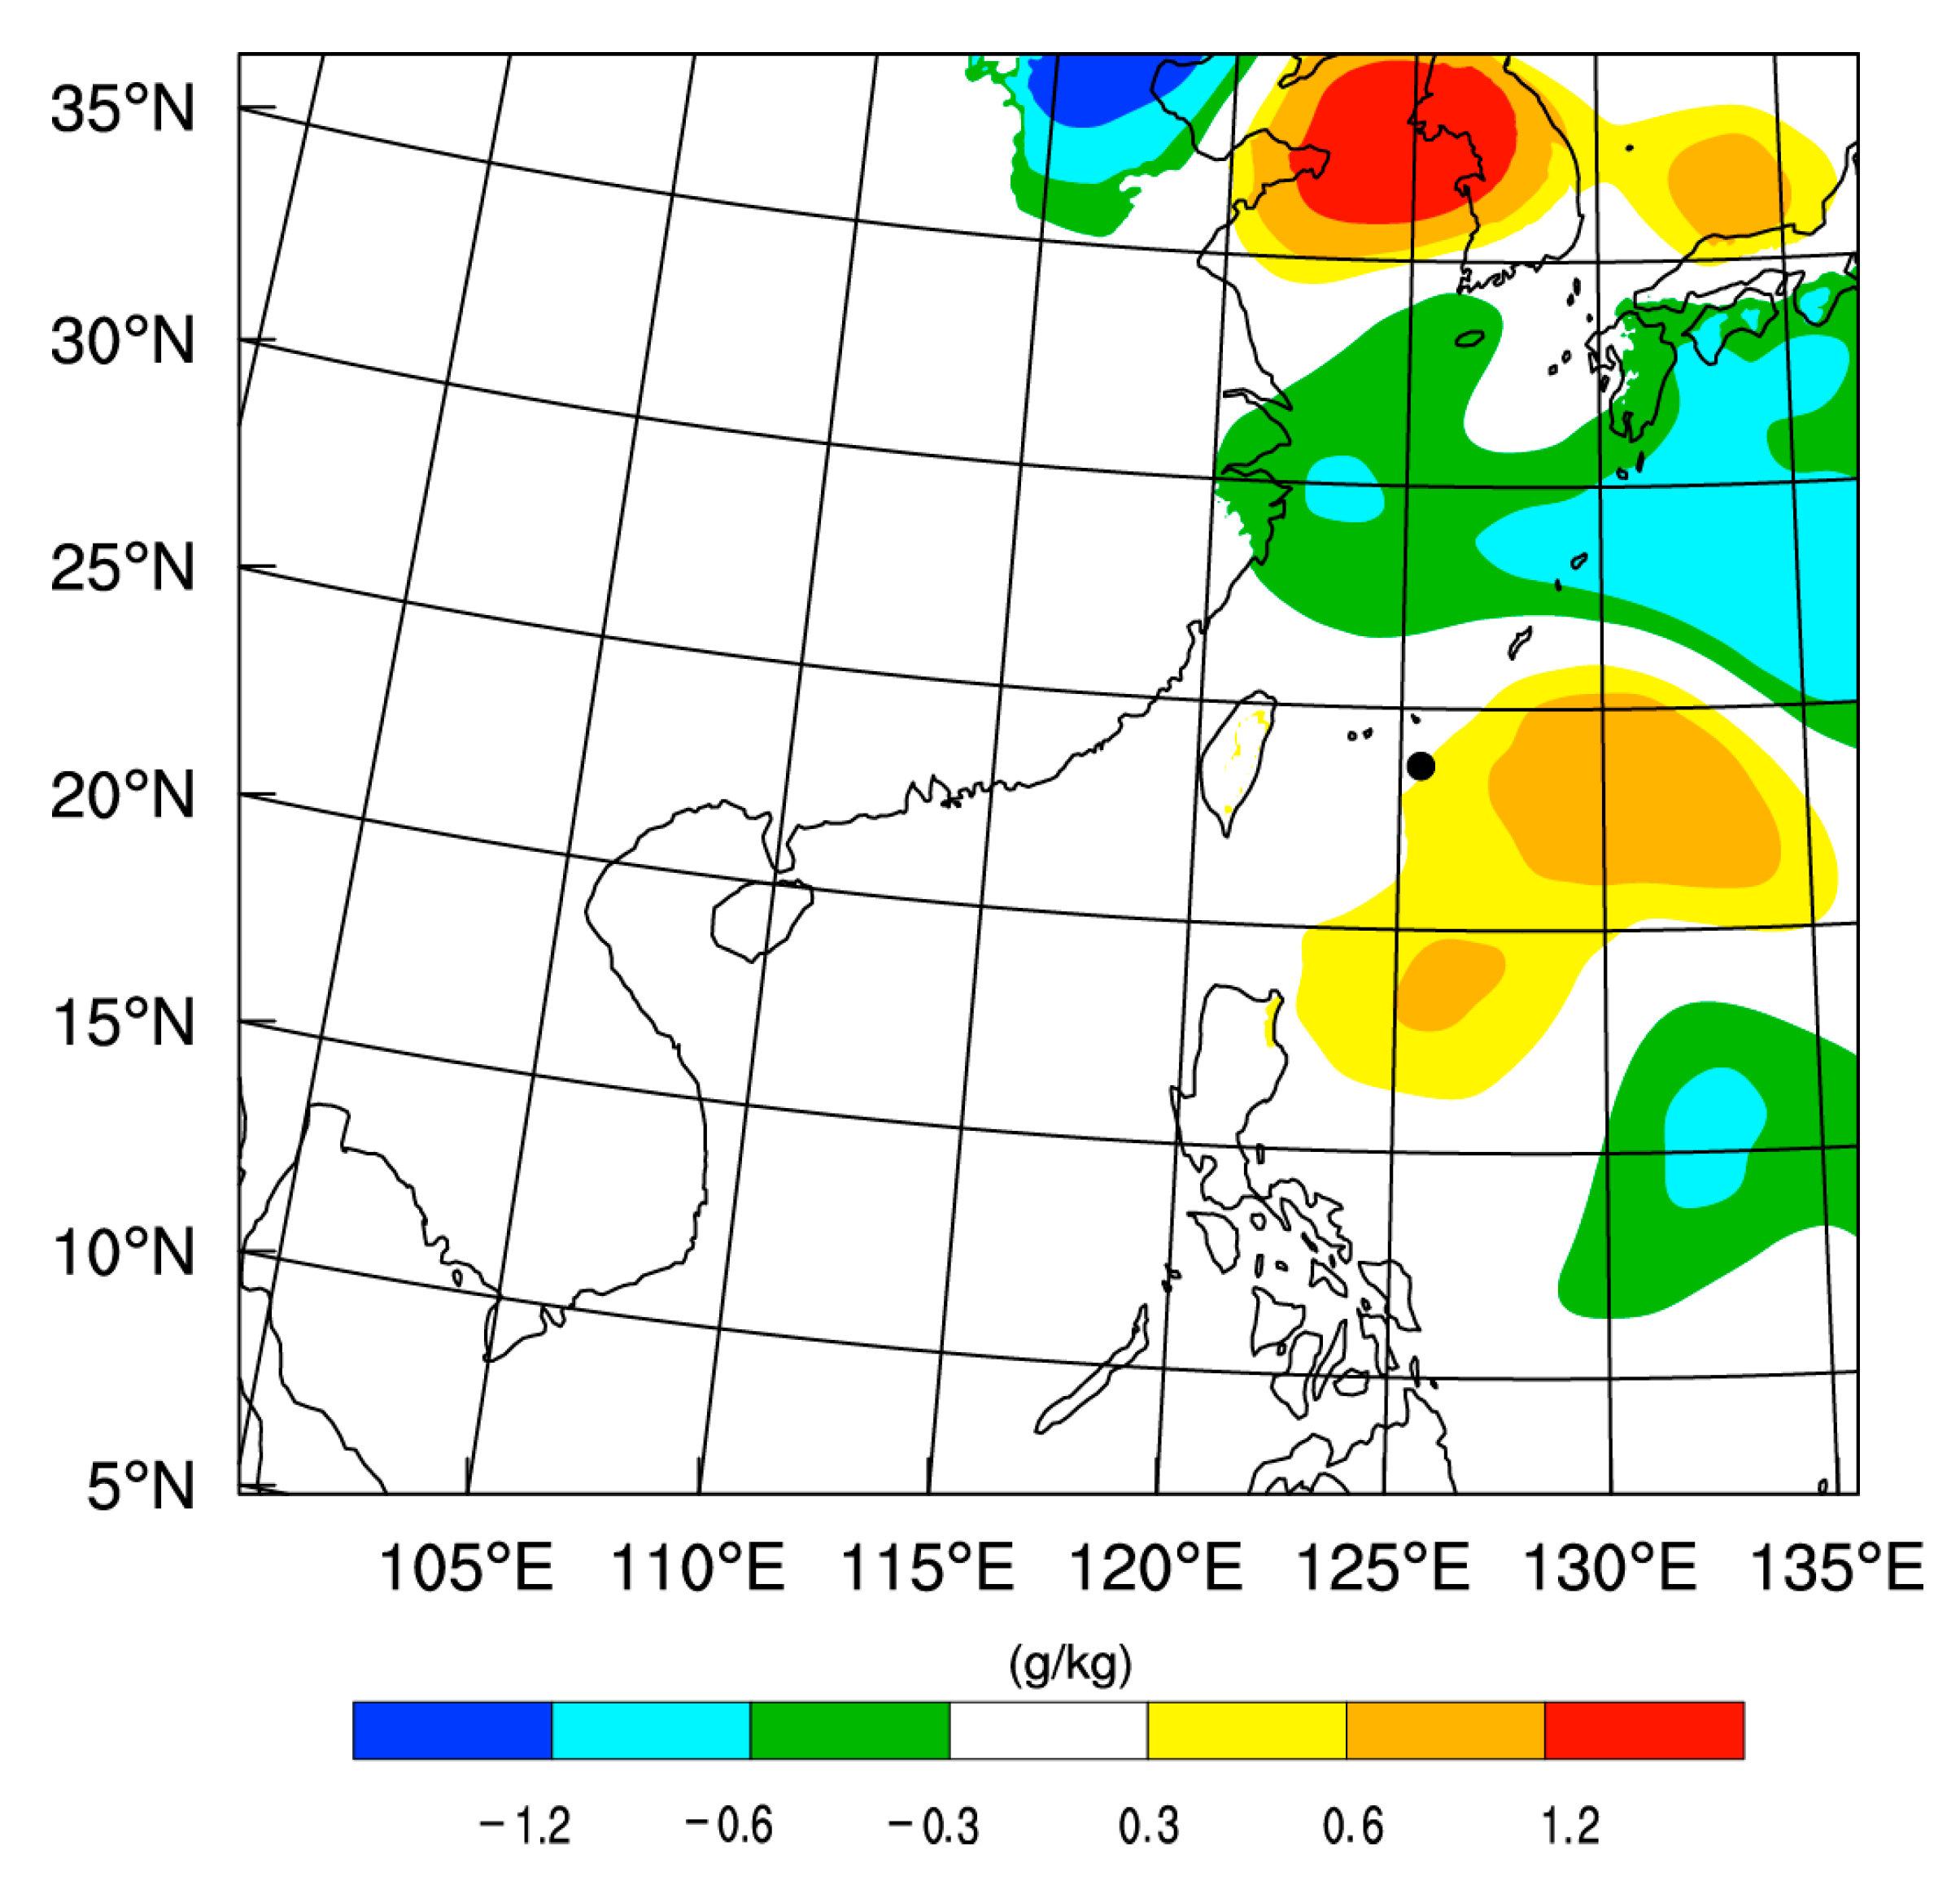
Figure 9 represents the water vapor increment (the analysis minus the background) at 850 hPa at 0600 UTC 8 August. The black dot in this figure depicts the location of the typhoon center (23.7°N, 125.5°E). The positive water vapor increment is distributed near the east and the south of the typhoon center (the black dot in Figure 9). Moreover, a high water vapor increment is also observed near the Korean peninsula. It illustrates that the assimilation of the FY-3D MWHS-2 satellite data increases the humidity around Lekima and may be conducive to the analysis conditions of the water vapor.
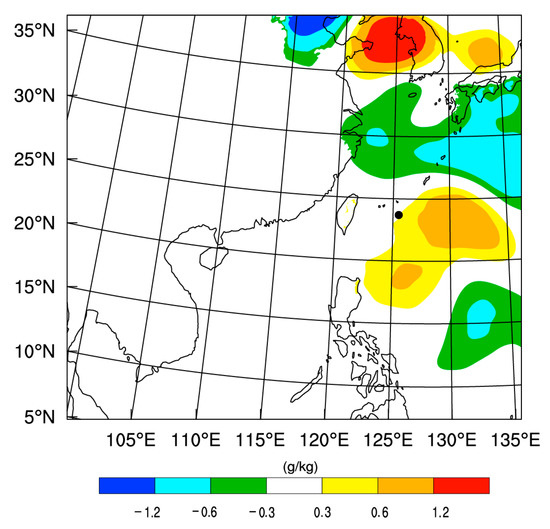
Figure 9.
The 850 hPa water vapor increment (units: g/kg) between the analysis and the background at 0600 UTC 8 August 2019.
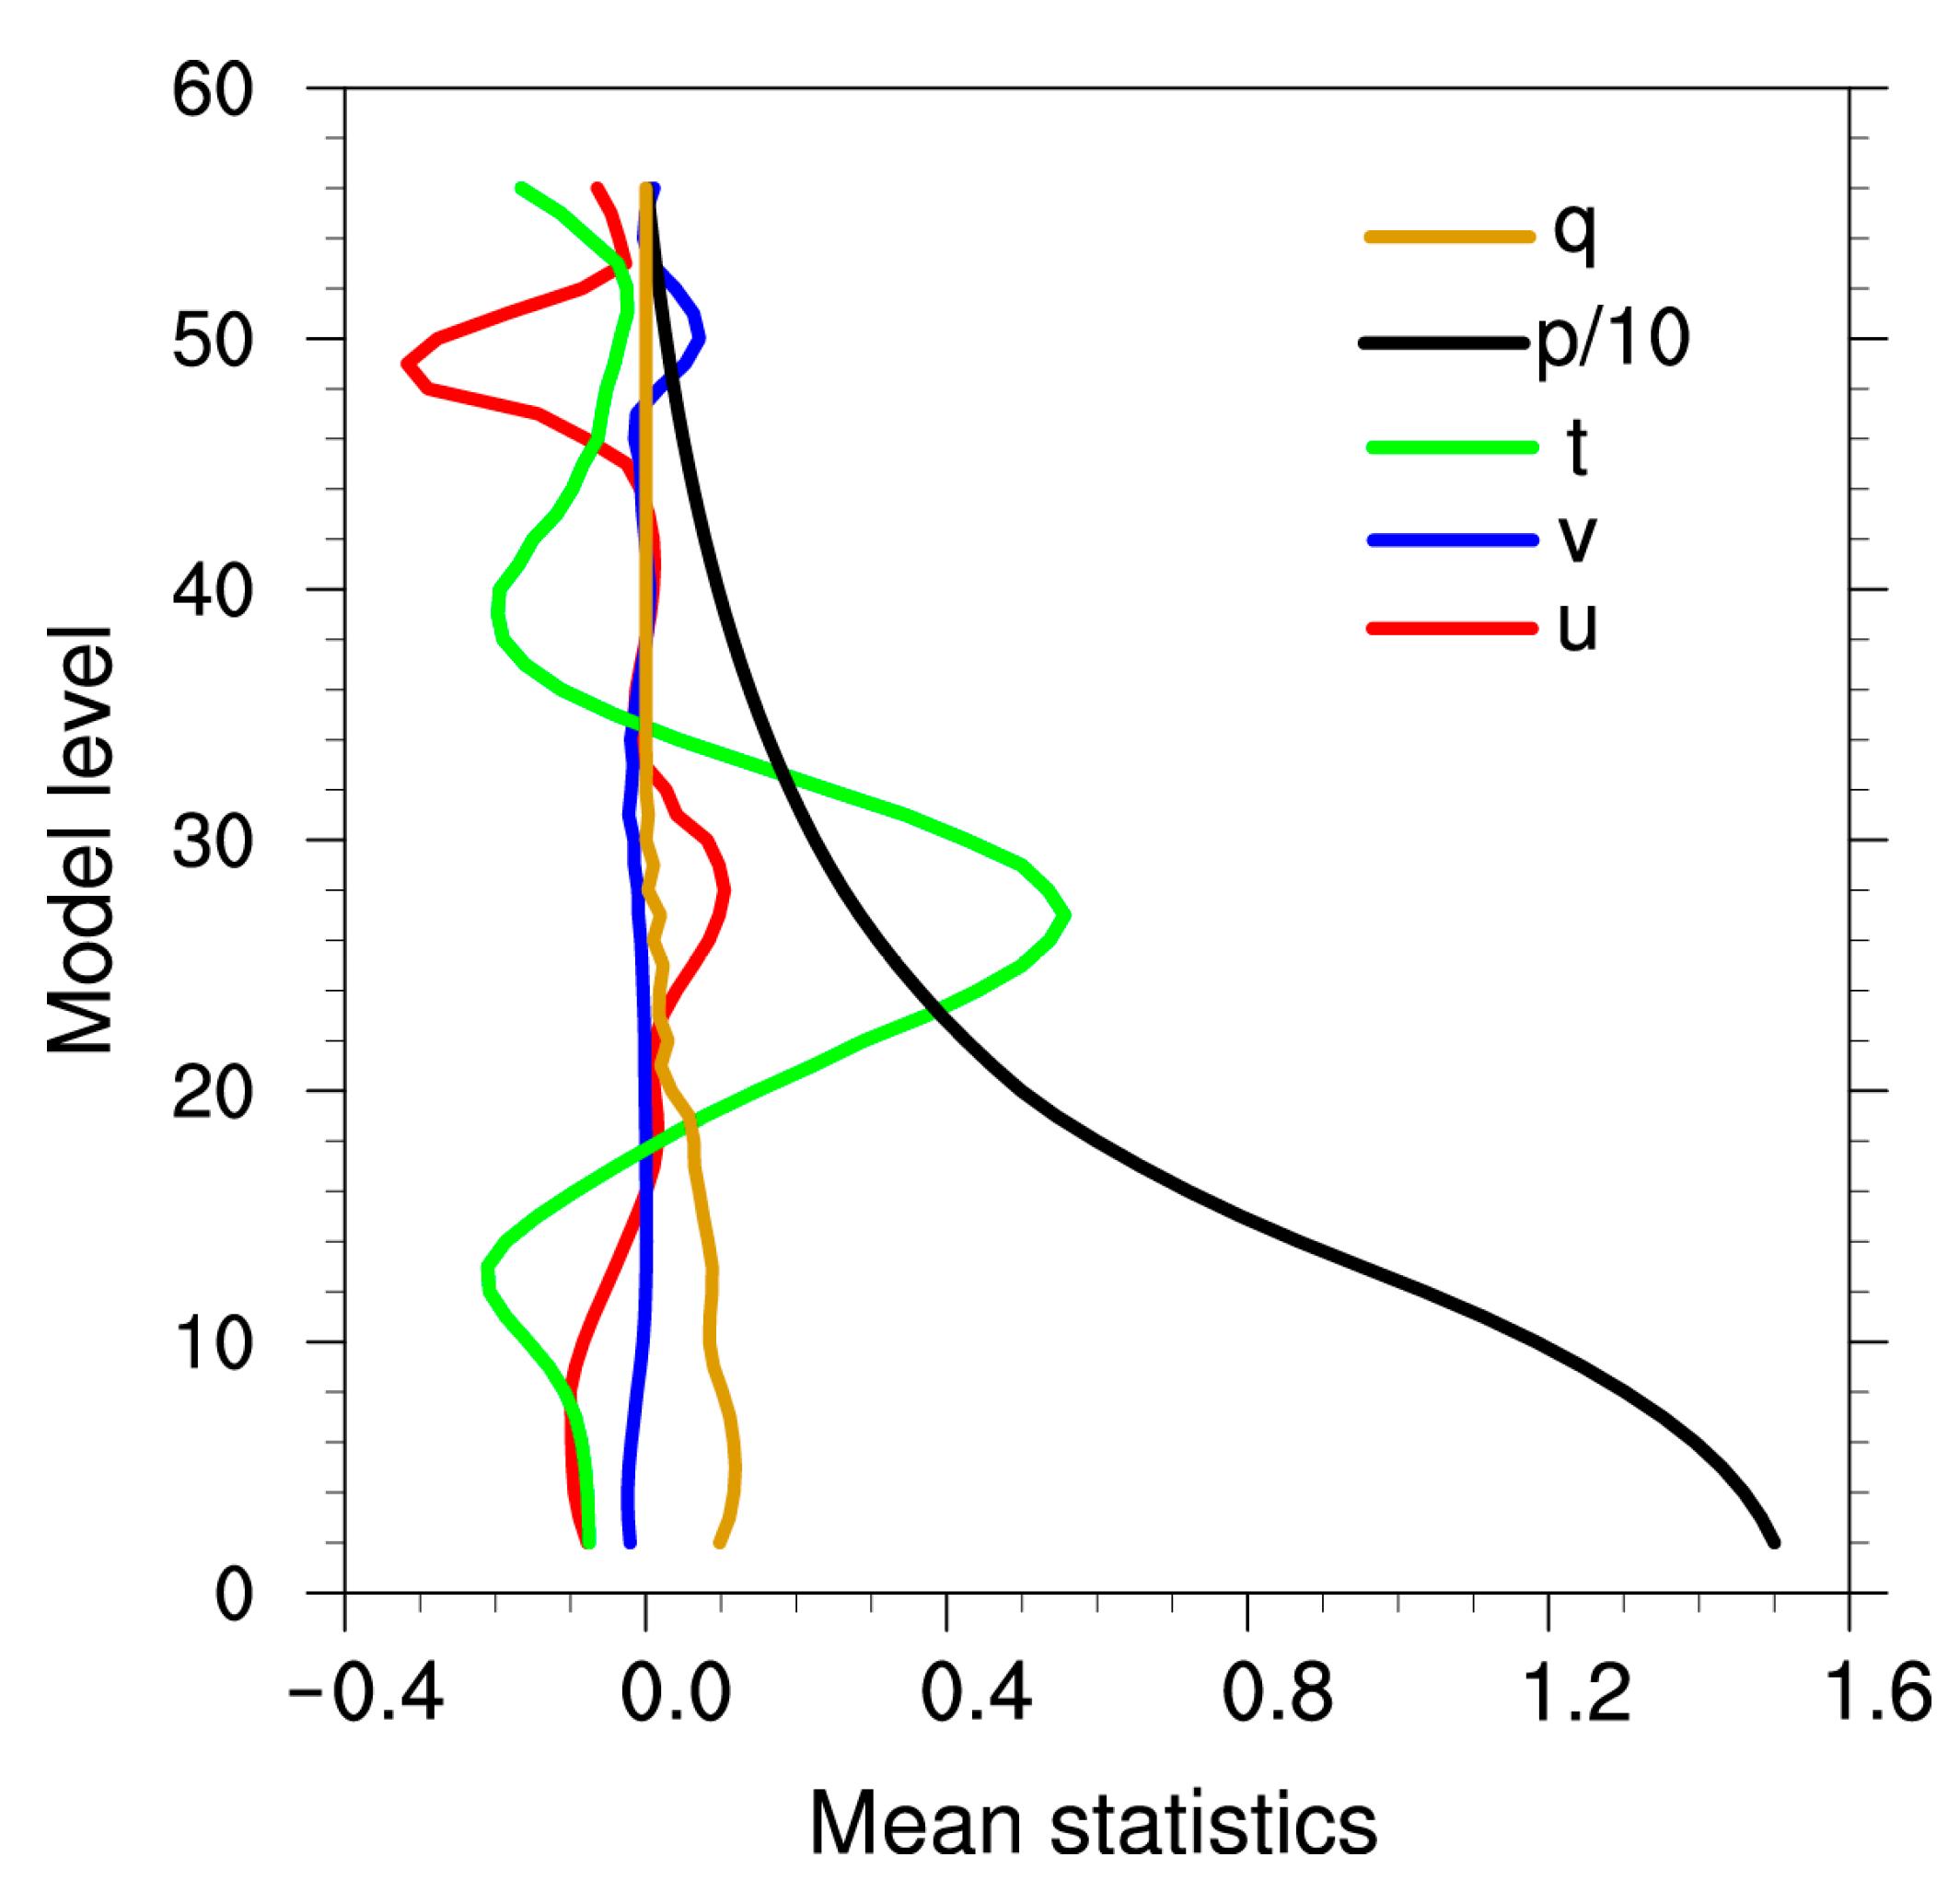
From the vertical profiles of the mean increment of different model variables over all the grid points on each level (Figure 10), notably analysis increments (the analysis minus the background) are observed for the humidity, the pressure, the temperature, and the wind velocity. In addition, the variability of temperature and pressure is most significant in the lower layer of the model. These curves show that after the assimilation of Tb, the distribution of the temperature and humidity profile are directly affected by the use of the RTTOV observation operator. Meanwhile, other variables are also effectively affected by the background error covariance.
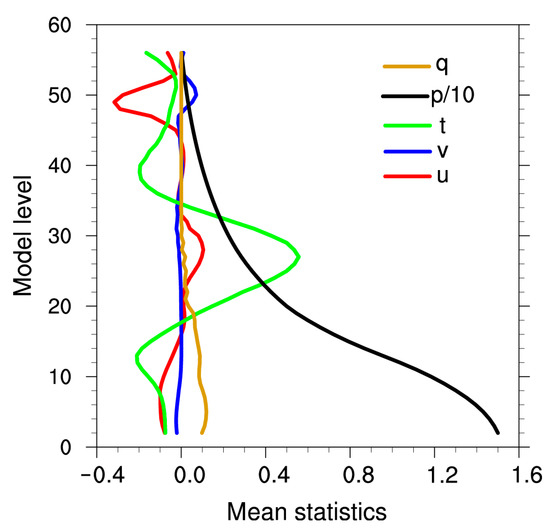
Figure 10.
Vertical profiles of the mean increment for different model variables at 0600 UTC 8 August 2019.
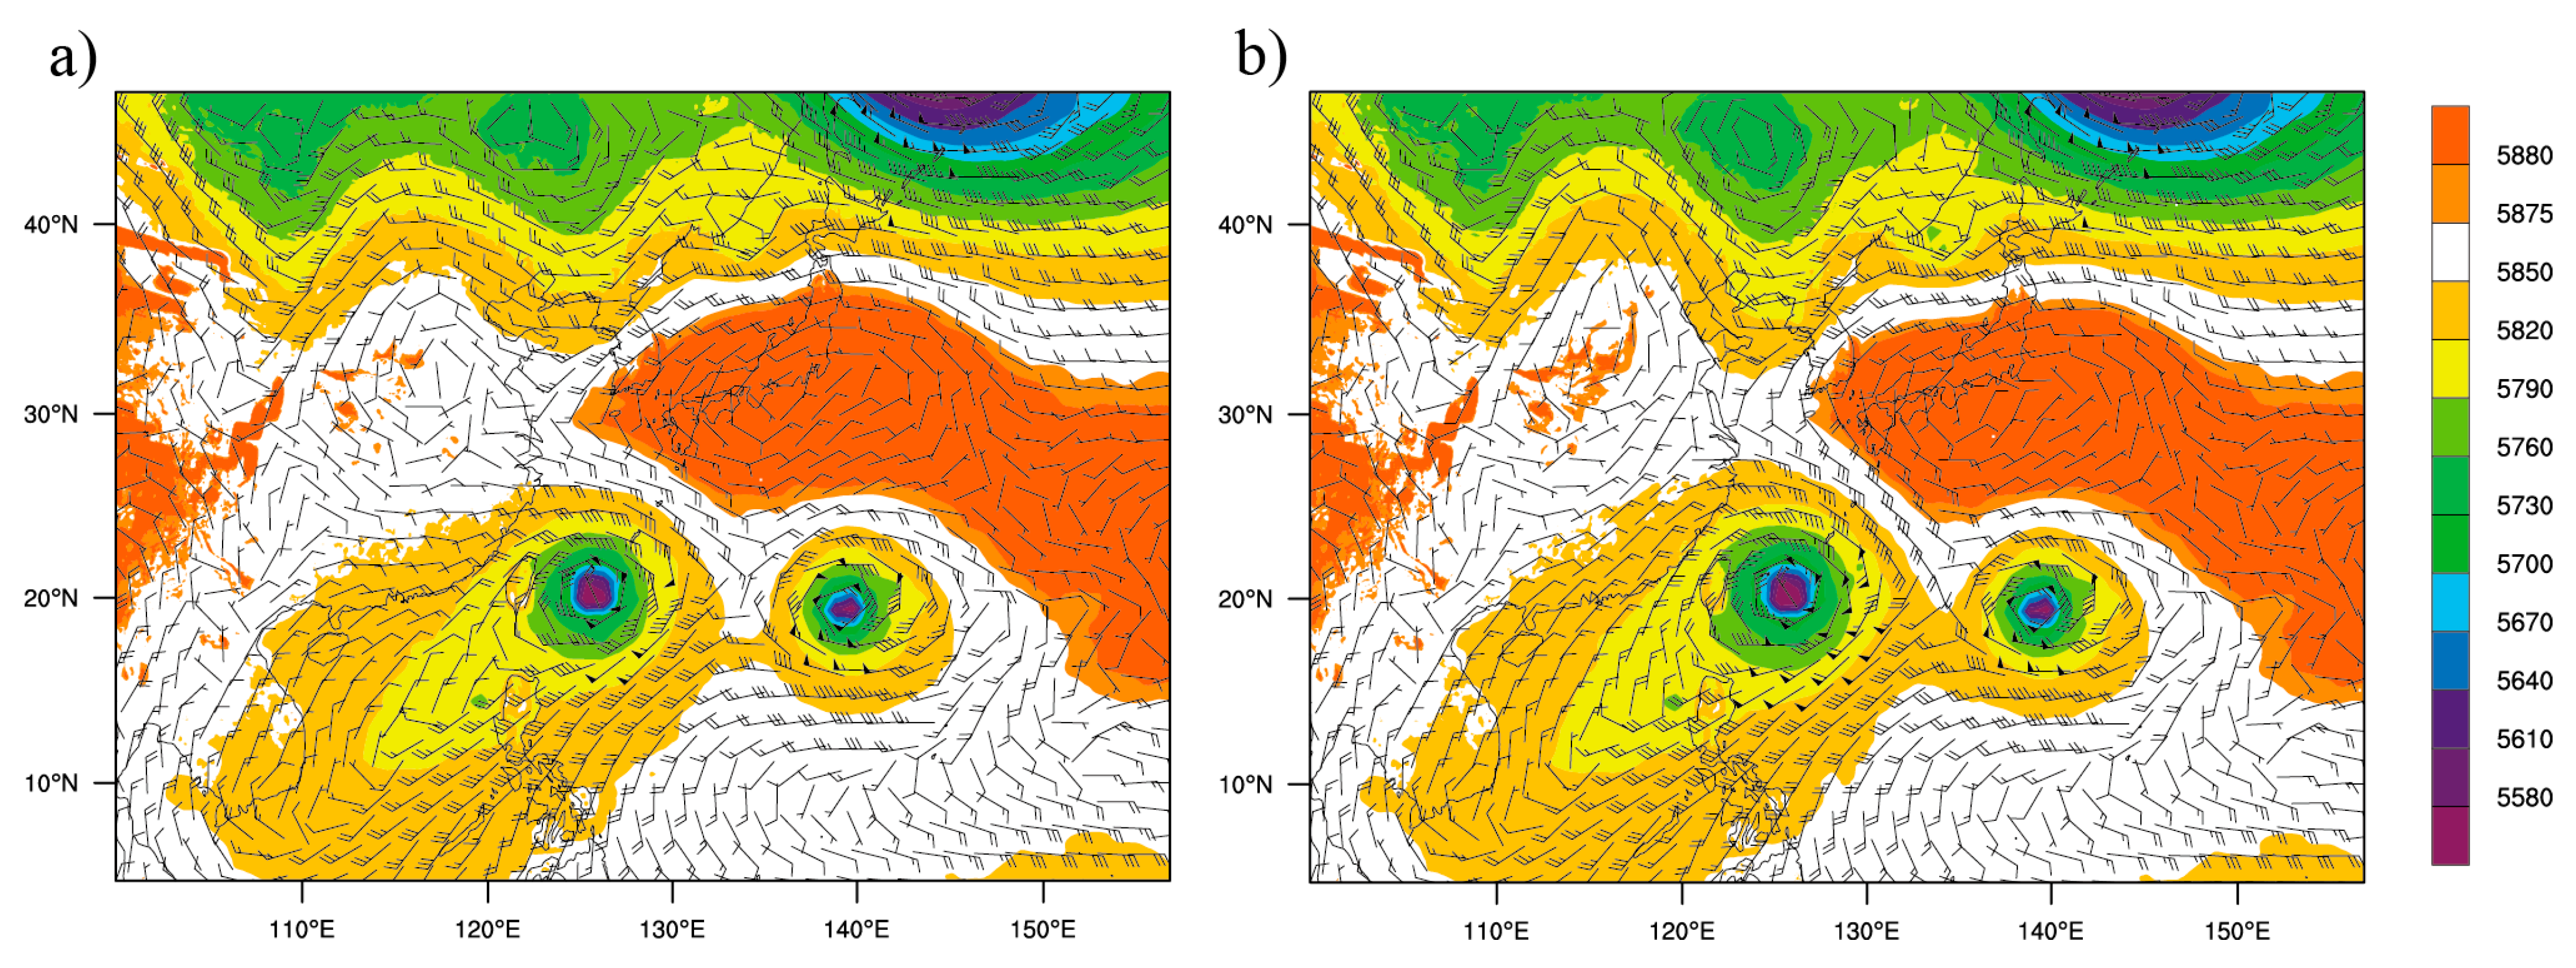
Finally, the circulation structures related to the typhoon evolution is analyzed to further explore the improvements of forecast accuracy, valid at 0600 UTC 8 August 2019. In Figure 11a,b, the geopotential height at 500 hPa is shown for the background and the analysis. The subtropical high in the analysis is further east than that in the background. The southeast airflow on the southwest side of the subtropical high contributes to the northwest movement of Lekima, which is consistent with that in Figure 12d of the simulated track.
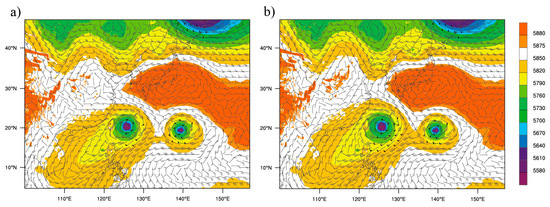
Figure 11.
The geopotential height (shaded, units: gpm) from (a) the background and (b) the analysis at 500 hPa, and wind (wind shaft, units: m/s) in the background at 0600 UTC 8 August 2019.
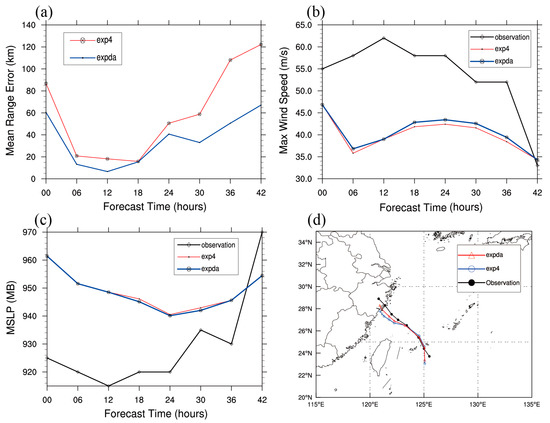
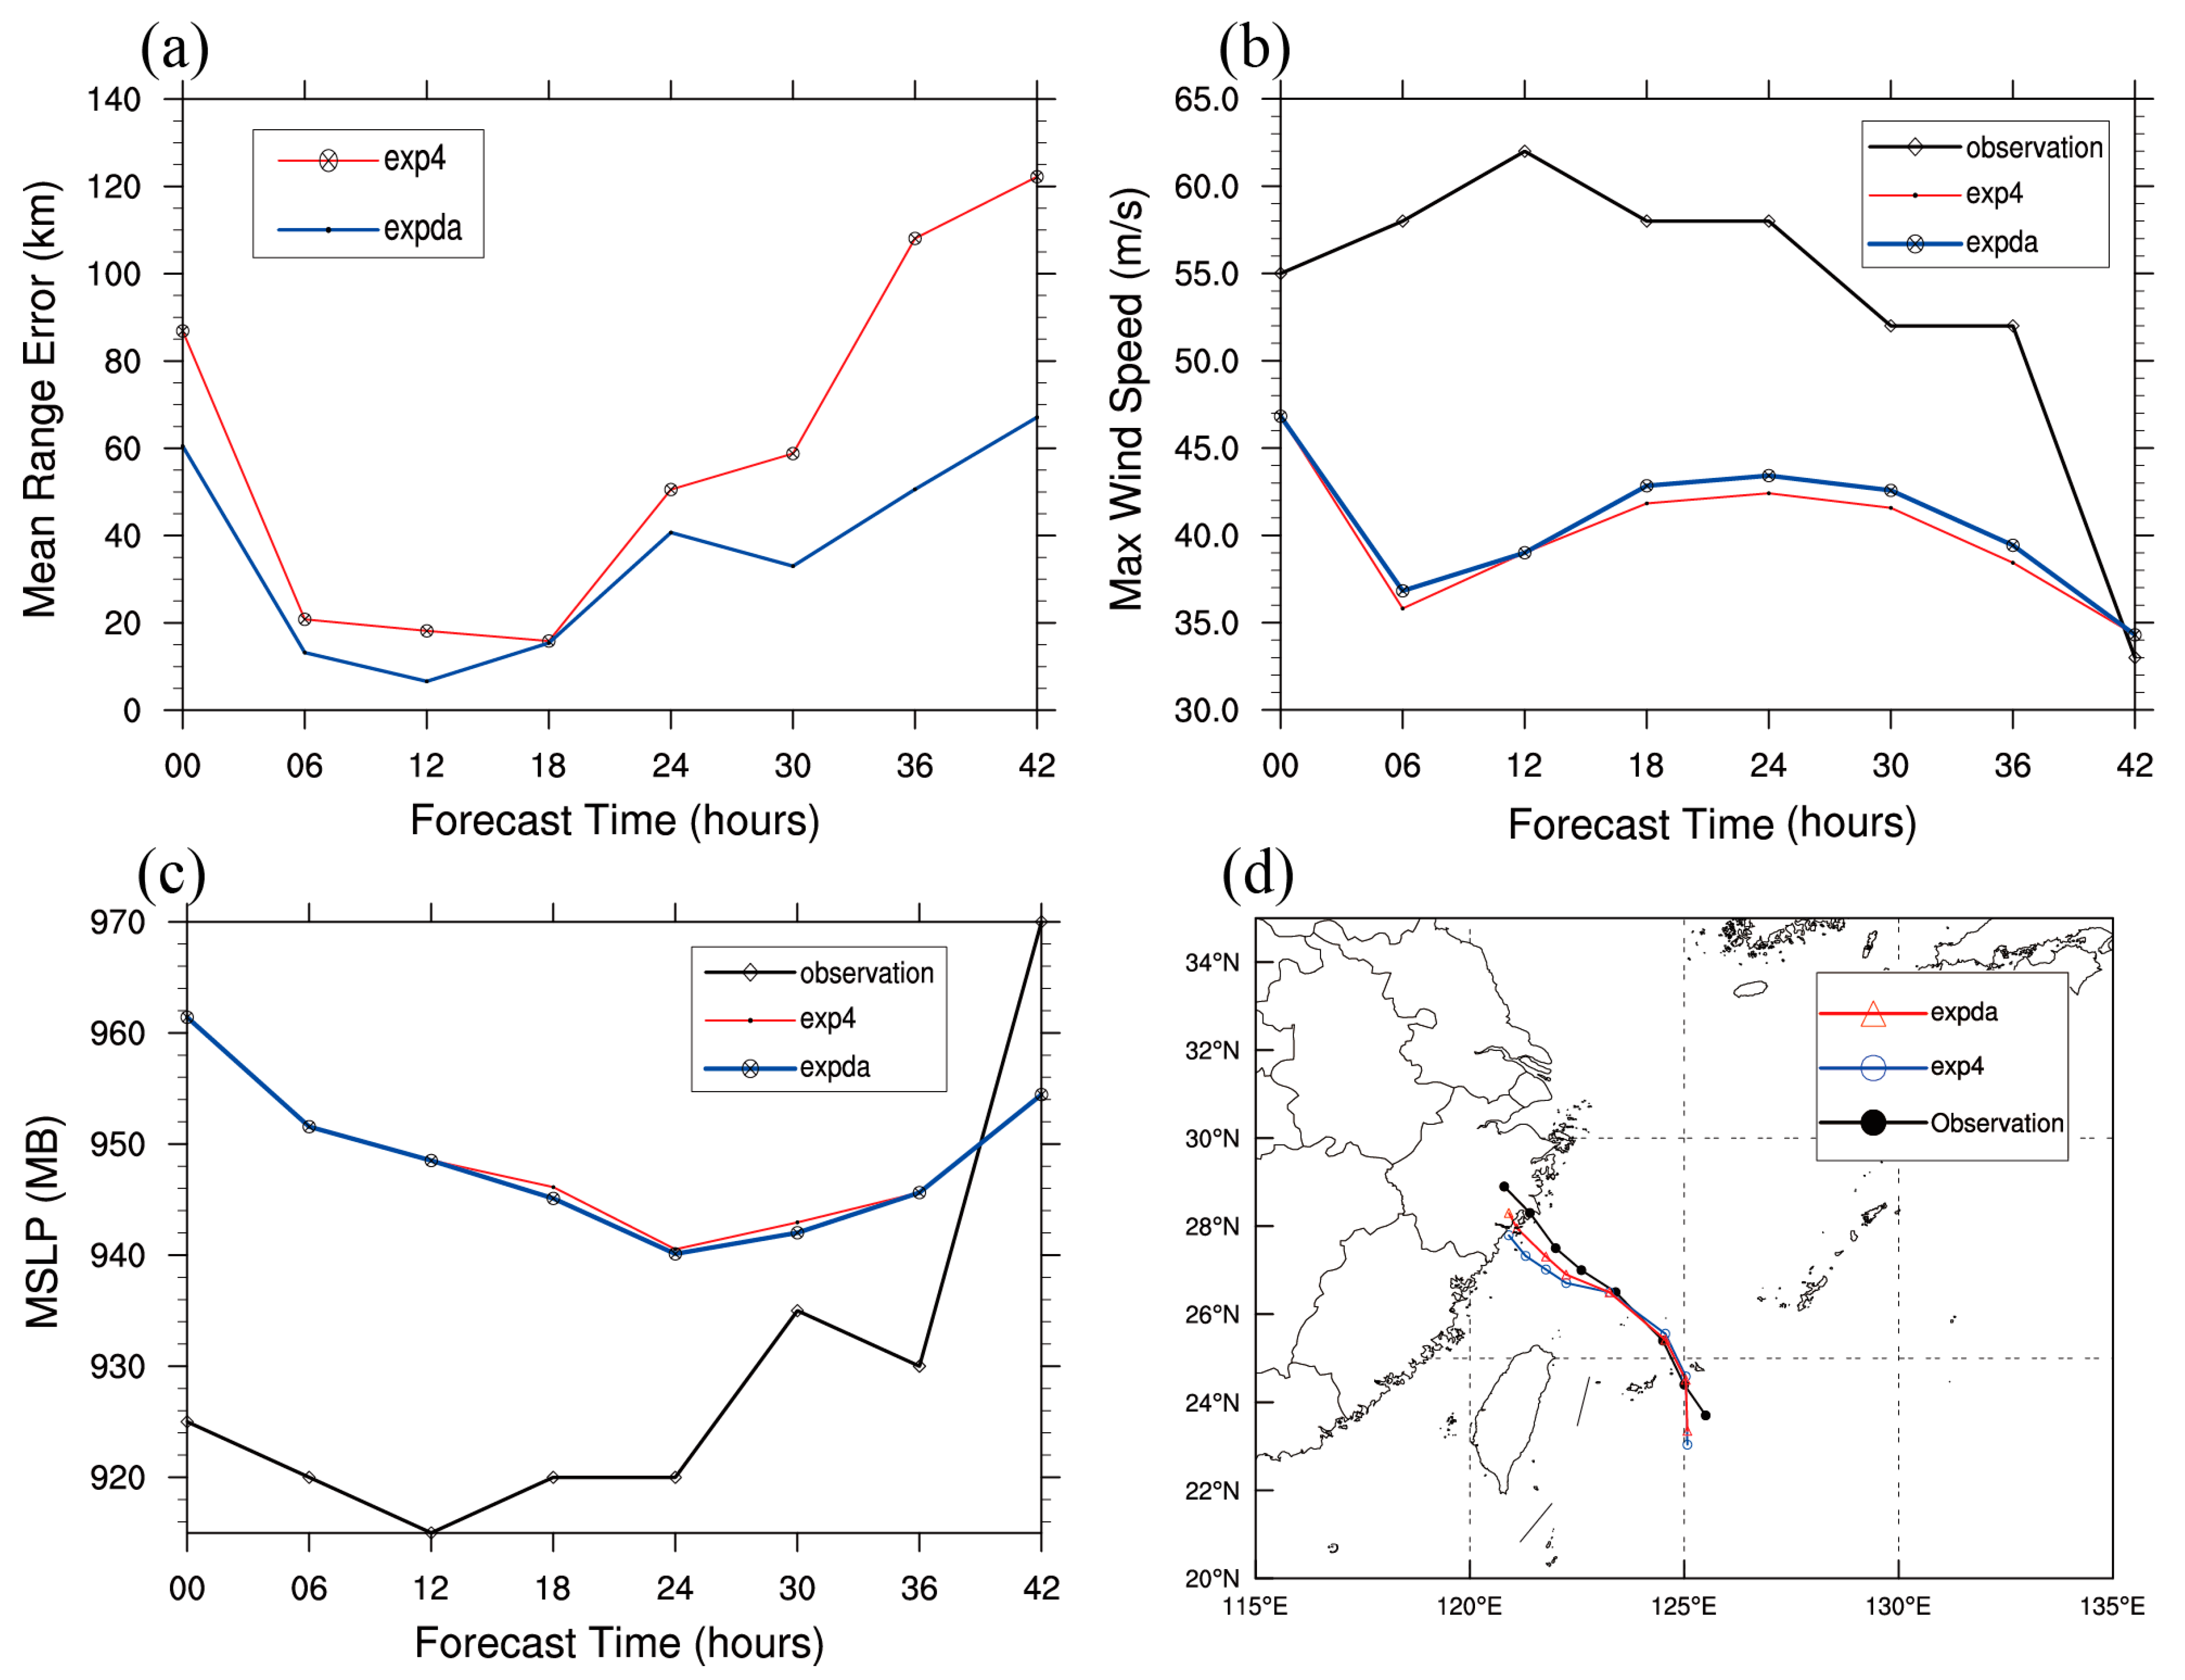
Figure 12.
(a) mean range error (units: km), (b) max wind speed (units: m/s), (c) minimum sea level pressure (units: MB), and (d) the typhoon’s tracks for numerical experiments and observed track from 0600 UTC 8 August to 0000 UTC 10 August 2019.
4.2.2. Track and Intensity Forecast
Figure 12a shows the average error of the simulated typhoon’s track by exp4 before and after the assimilation. The error is clearly reduced after the assimilation, especially after 24 h (Figure 12a). This track error is consistent with the track forecast in Figure 12d, in which the track from the experiment without the data assimilation shows a southwest bias. For the typhoon’s intensity (Figure 12b,c), the error of the MWS and the MSLP increased around 0–12 h and gradually decreased after 18 h for both experiments. The results of the MWS and the MSLP are more consistent with the observed track than those of the experiment without any data assimilation. It seems that assimilating the FY3D MWHS2 radiance data contributes more to the track than to the intensity of the typhoon system.
5. Summary
In this study, the WRF model was applied to simulate the evolution of super typhoon Lekima (2019). Using the reanalysis data from NCEP, the sensitivity experiments of different physical parameterization schemes were carried out. After the sensitivity experiments, the MWHS-2 radiance data onboard the FY-3D satellite were further assimilated based on one parameterization scheme using the 3DVar method for the Lekima case. Our conclusions are as follows:
(1) It seems the microphysical process had the greatest influence on the typhoon track simulation. The best simulation results were found using the parameterization schemes of WSM6, with a combination of RMM5 for near-surface layer process, UNLS for land surface process and YSU for boundary layer process. The results also showed that other physical parameterization schemes had a slight effect on the typhoon’s intensity simulation.
(2) In the data assimilation experiment, the simulated Tb based on the analysis better matched the observed Tb. Both the average and the standard deviation of OMA were decreased compared with OMB. The track and intensity of the data assimilation experiment were both more consistent with the observed track for super typhoon Lekima.
In this study, only one case of typhoon was studied with physical parameterization sensitivity experiments in the framework of the three-dimensional variational data assimilation method. Future research on data assimilation could be carried out by using various assimilation methods, such as the cyclic assimilation, the four-dimensional variation assimilation [37], hybrid-variation assimilation [25], or all-sky assimilation by using a symmetric observation bias model.
Author Contributions
Data curation, X.Z. (Xiaoran Zhuang); Formal analysis, H.L., H.W., A.S. and X.Z. (Xuewei Zhang); Investigation, H.W. and F.S.; Methodology, D.X.; Project administration, D.X.; Resources, D.X. and A.S.; Software, A.S., H.L., Y.W.; Validation, D.X., X.Z. (Xiaoran Zhuang); Visualization, Y.W.; Writing—original draft, X.Z. (Xuewei Zhang), A.S.; Writing—review & editing, F.S., H.L., H.W., A.S. All authors have read and agreed to the published version of the manuscript.
Funding
This research was primarily supported by the Chinese National Natural Science Foundation of China (G41805016, G41805070, G41805071), Program of Shanghai Academic/Technology Research Leader (21XD1404500), the research project of Heavy Rain and Drought-Flood Disasters in Plateau and Basin Key Laboratory of Sichuan Province in China (SZKT201901, SZKT201904), the research project of the Institute of Atmospheric Environment, China Meteorological Administration, Shenyang in China (2020SYIAE07, 2020SYIAE02), Jiangsu Province Natural Science Fund (BK20201506), the key research project of the Jiangsu Meteorological Bureau (Grant No. KZ202001), the Beijige foundation of NJIAS (BJG202103).
Institutional Review Board Statement
Not applicable.
Informed Consent Statement
Not applicable.
Data Availability Statement
The NCEP Global Forecast System (GFS) Analyses and Forecasts data can be freely obtained online (https://rda.ucar.edu/datasets/ds084.6/, accessed on 18 July 2021). The WRF model is provided by the NCAR MMM Laboratory (https://www2.mmm.ucar.edu/wrf/users/download/get_source.html, accessed on 25 October 2021), and the FY3D satellite data can be download from the website of China National Satellite Meteorological Center (http://satellite.nsmc.org.cn/portalsite/default.aspx, accessed on 25 October 2021).
Acknowledgments
The numerical calculations in this paper have been done on the supercomputing system in the Supercomputing Center of Nanjing University of Information Science & Technology.
Conflicts of Interest
The authors declare no conflict of interest.
References
- Li, J.G.; Wang, G.; Lin, W.S.; He, Q.H.; Feng, Y.R.; Mao, J.Y. Cloud-scale simulation study of Typhoon Hagupit (2008) part I: Microphysical processes of the inner core and three-dimensional structure of the latent heat budget. Atmos. Res. 2013, 120, 170–180. [Google Scholar] [CrossRef]
- Li, X.; Pu, Z. Sensitivity of numerical simulation of early rapid intensification of hurricane Emily (2005) to cloud microphysical and planetary boundary layer parameterizations. Mon. Wea. Rev. 2008, 136, 4819–4838. [Google Scholar] [CrossRef]
- Shen, F.; Xu, D.; Min, J. Effect of momentum control variables on assimilating radar observations for the analysis and forecast for Typhoon Chanthu (2010). Atmos. Res. 2019, 230, 104622. [Google Scholar] [CrossRef]
- Sawada, M.; Ma, Z.Z.; Mehra, A.; Tallapragada, V.; Oyama, R.; Shimoji, K. Impacts of assimilating high-resolution atmospheric motion vectors derived from Himawari-8 on tropical cyclone forecast in HWRF. Mon. Wea. Rev. 2019, 147, 3721–3740. [Google Scholar] [CrossRef]
- Xu, D.; Liu, Z.; Huang, X.; Min, J.; Wang, H. Impact of Assimilating IASI Radiance Observations on Forecasts of Two Tropical Cyclones. Meteorol. Atmos. Phys. 2013, 122, 1–18. [Google Scholar] [CrossRef] [Green Version]
- Xu, D.; Shen, F.; Min, J. Effect of background error tuning on assimilating radar radial velocity observations for the forecast of hurricane tracks and intensities. Meteorol. Appl. 2020, 27, e1820. [Google Scholar] [CrossRef] [Green Version]
- Ridal, M.; Dahlbom, M. Assimilation of multinational radar reflectivity data in a mesoscale model: A proof of concept. J. Appl. Meteor. Climatol. 2017, 56, 1739–1750. [Google Scholar] [CrossRef]
- Yang, C.; Liu, Z.; Gao, F.; Child, P.; Min, J. Impact of Assimilating GOES-Imager Clear-sky Radiance with a Rapid Refresh Assimilation System for Convection-Permitting forecast over Mexico. J. Geophys. Res. Atmos. 2017, 122, 5472–5490. [Google Scholar] [CrossRef] [Green Version]
- Jones, T.A.; Stensrud, D.; Wicker, L.; Minnis, P.; Palikonda, R. Simultaneous radar and satellite data storm-scale assimilation using an Ensemble Kalman Filter approach for 24 May 2011. Mon. Wea. Rev. 2015, 143, 165–194. [Google Scholar] [CrossRef]
- Wang, Y.B.; Liu, Z.; Yang, S.; Min, J.; Chen, L.; Chen, Y.; Zhang, T. Added value of assimilating Himawari-8 AHI water vapor radiances on analyses and forecasts for “7.19” severe storm over north China. J. Geophys. Res. Atmos. 2018, 123, 3374–3394. [Google Scholar] [CrossRef]
- Lai, A.; Min, J.; Gao, J.; Ma, H.; Cui, C.; Xiao, Y.; Wang, Z. Assimilation of Radar Data, Pseudo Water Vapor, and Potential Temperature in a 3DVAR Framework for Improving Precipitation Forecast of Severe Weather Events. Atmosphere 2020, 11, 182. [Google Scholar] [CrossRef] [Green Version]
- Moradi, I.; Evans, K.F.; McCarty, W.; Cordero-Fuentes, M.; Gelaro, R.; Black, R.A. Assimilation of satellite microwave observations over the rainbands of tropical cyclones. Mon. Wea. Rev. 2020, 148, 4729–4745. [Google Scholar] [CrossRef]
- Derber, J.C.; Wu, W. The use of TOVS cloud-cleared radiance in the NCEP SSI analysis system. Mon. Wea. Rev. 1998, 126, 2287–2299. [Google Scholar] [CrossRef]
- Zhu, Y.; Liu, E.; Mahajan, R.; Thomas, C.; Groff, D.; Van Delst, P.; Collard, A.; Kleist, D.; Treadon, R.; Derber, J.C. All-Sky Microwave Radiance Assimilation in the NCEP’s GSI Analysis System. Mon. Wea. Rev. 2016, 144, 4709–4735. [Google Scholar] [CrossRef]
- Lu, Q.F. Initial evaluation and assimilation of FY-3A atmospheric sounding data in the ECMWF System. Sci. China Earth Sci. 2011, 54, 1453–1457. [Google Scholar] [CrossRef]
- Lu, Q.; Bell, W.; Bauer, P.; Bormann, N.; Peubey, C. Characterizing the FY-3A microwave temperature sounder using the ECMWF model. J. Atmos. Ocean. Technol. 2011, 28, 1373–1389. [Google Scholar] [CrossRef]
- Chen, K.; English, S.J.; Bormann, N.; Zhu, J. Assessment of FY-3A and FY-3B MWHS observations. Wea. Forecast. 2015, 30, 1280–1290. [Google Scholar] [CrossRef]
- Lawrence, H.; Bormann, N.; Lu, Q.F.; Geer, A.J.; English, S.J. An Evaluation of FY-3C MWHS-2 at ECMWF. EUMETSAT/ECMWF Fellowship Programme Research Report (Report 37). 2015. Available online: https://www.ecmwf.int/sites/default/files/elibrary/2015/10668-evaluation-fy-3c-mwhs-2-ecmwf.pdf (accessed on 25 October 2021).
- Zhang, P.; Chen, L.; Xian, D.; Xu, Z. Recent progress of Fengyun meteorology satellites. Chin. J. Space Sci. 2018, 38, 788–796. [Google Scholar]
- Eyre, J.R.; Kelly, G.A.; McNally, A.P.; Andersson, E.; Persson, A. Assimilation of TOVS radiance information through one-dimensional variational analysis. Quart. J. Roy. Meteor. Soc. 1993, 119, 1427–1463. [Google Scholar] [CrossRef]
- Le Dimet, F.X.; Ngodock, H.E.; Luong, B.; Verron, J. Sensitivity analysis in variational data assimilation. J. Meteor. Soc. Japan. 1997, 75, 245–255. [Google Scholar] [CrossRef] [Green Version]
- Kleist, D.T.; Parrish, D.F.; Derber, J.C.; Treadon, R.; Wu, W.S.; Lord, S. Introduction of the GSI into the NCEP Global Data Assimilation System. Wea. Forecast. 2009, 24, 1691–1705. [Google Scholar] [CrossRef] [Green Version]
- Newman, K.M.; Schwartz, C.S.; Liu, Z.; Shao, H.; Huang, X.-Y. Evaluating forecast impact of assimilating microwave humidity sounder (MHS) radiances with a regional Ensemble Kalman Filter data assimilation system. Wea. Forecast. 2015, 30, 964–983. [Google Scholar] [CrossRef]
- Xu, D.; Min, J.; Shen, F.; Ban, J.; Chen, P. Assimilation of MWHS radiance data from the FY-3B satellite with the WRF Hybrid-3DVAR system for the forecasting of binary typhoons. J. Adv. Model. Earth Syst. 2016, 8, 1014–1028. [Google Scholar] [CrossRef] [Green Version]
- Sun, W.; Xu, Y.P. Assimilation of FY-3D MWHS-2 Radiances with WRF Hybrid-3DVAR System for the Forecast of Heavy Rainfall Evolution Associated with Typhoon Ampil. Mon. Wea. Rev. 2021, 149, 1419–1437. [Google Scholar] [CrossRef]
- Shi, D.L.; Chen, G.H.; Wang, K.; Bi, X.X.; Chen, K.X. Evaluation of two initialization schemes for simulating the rapid intensification of Typhoon Lekima (2019). Adv. Atmos. Sci. 2020, 37, 987–1006. [Google Scholar] [CrossRef]
- Li, J.; Liu, G. Direct assimilation of Chinese FY-3C Microwave Temperature Sounder-2 radiances in the global GRAPES system. Atmos. Meas. Tech. 2016, 9, 3095–3113. [Google Scholar] [CrossRef] [Green Version]
- Xian, Z.; Chen, K.; Zhu, J. All-sky assimilation of the MWHS-2 observations and evaluation the impacts on the analyses and forecasts of binary typhoons. J. Geophys. Res. Atmos. 2019, 124, 6359–6378. [Google Scholar] [CrossRef]
- Chen, Z.J.; Chen, X.E.; Liu, T. The effect of different parameterization schemes for the maximum wind speed and the lowest sea-level pressure of the typical typhoon for Southern Yellow Sea area. Period. Ocean Univ. China 2019, 49, 28–35. [Google Scholar]
- Barker, D.M.; Huang, W.; Guo, Y.R.; Bourgeois, A.J.; Xiao, Q.N. A Three-Dimensional Variational Data Assimilation System for MM5: Implementation and Initial Results. Mon. Wea. Rev. 2004, 132, 897–914. [Google Scholar] [CrossRef] [Green Version]
- Shao, C.L.; Wang, J.; Zhao, X. Application of Automatic Weather Station Data Quality Control Method in Data Assimilation. Meteor. Sci. Technol. 2017, 45, 583–589. (In Chinese) [Google Scholar]
- Zhu, Z.H.; Huang, N.L.; Wen, X.M. Diagnostic Analysis of Interaction between Binary Typhoons Tembin and Bolaven. Meteor. Sci. Technol. 2015, 43, 506–511. [Google Scholar]
- Yu, L.F.; Jiang, J.F.; Guo, J.Y.; Lin, Q. Process analysis and product testing for super typhoon Lekima. Trop. Agric. Eng. 2020, 44, 108–111. [Google Scholar]
- Mahala, B.K.; Mohanty, P.K.; Nayak, B.K. Impact of Microphysics Schemes in the Simulation of Cyclone Phailinusing WRF Model. Procedia Eng. 2015, 116, 655–662. [Google Scholar] [CrossRef] [Green Version]
- Wu, D.; Zhang, F.Q.; Chen, X.M.; Ryzhkov, A.; Zhao, K.; Kumjian, M.; Chen, X.C.; Chan, P.W. Evaluation of Microphysics Schemes in Tropical Cyclones Using Polarimetric Radar Observations: Convective Precipitation in an Outer Rainband. Mon. Wea. Rev. 2021, 149, 1055–1068. [Google Scholar] [CrossRef]
- Wang, C.X.; Ying, M. Impact of Different Cloud Microphysics Parameterization Schemes on Typhoon Intensity and Structure. J. Trop. Meteorol. 2021, 27, 109–124. [Google Scholar]
- Xiao, H.; Han, W.; Wang, H.; Wang, J.; Liu, G.; Xu, C. Impact of FY-3D MWRI Radiance Assimilation in GRAPES 4DVar on Forecasts of Typhoon Shanshan. J. Meteorol. Res. 2020, 34, 836–850. [Google Scholar] [CrossRef]

Publisher’s Note: MDPI stays neutral with regard to jurisdictional claims in published maps and institutional affiliations. |
© 2021 by the authors. Licensee MDPI, Basel, Switzerland. This article is an open access article distributed under the terms and conditions of the Creative Commons Attribution (CC BY) license (https://creativecommons.org/licenses/by/4.0/).