Technical Note

Improvements of ADAM3 by Incorporating New Dust Emission Reduction Formulations Based on Real-Time MODIS NDVI

1
Operational Systems Development Department, National Institute of Meteorological Sciences, Jeju 63568, Korea
2
Innovative Meteorological Research Department, National Institute of Meteorological Sciences, Jeju 63568, Korea
*
Author to whom correspondence should be addressed.
Remote Sens. 2021, 13(16), 3139; https://doi.org/10.3390/rs13163139
Submission received: 30 June 2021 / Revised: 4 August 2021 / Accepted: 5 August 2021 / Published: 8 August 2021

Abstract

:
Dust events in Northeast Asia have several adverse effects on human health, agricultural land, infrastructure, and transport. Wind speed is the most important factor in determining the total dust emission at the land surface; however, various land-surface conditions must be considered as well. Recently, the Korea Meteorological Administration updated the dust emission reduction factor (RF) in the Asian Dust Aerosol Model 3 (ADAM3) using data from the normalized difference vegetation index (NDVI) of the Moderate Resolution Imaging Spectroradiometer (MODIS). We evaluated the improvements of ADAM3 according to soil types. We incorporated new RF formulations in the evaluation based on real-time MODIS NDVI data obtained over the Asian dust source regions in northern China during spring 2017. This incorporation improved the simulation performance of ADAM3 for the PM10 mass concentration in Inner Mongolia and Manchuria for all soil types, except Gobi. The ADAM3 skill scores for sand, loess, and mixed types in a 24 h forecast increased by 6.6%, 20.4%, and 13.3%, respectively, compared with those in forecasts employing the monthly RF based on the NDVI data. As surface conditions in the dust source regions continually change, incorporating real-time vegetation data is critical to improving performance of dust forecast models such as ADAM3.

1. Introduction

In arid and semiarid regions, sand and dust storms occur when strong or turbulent winds combine with exposed dry surfaces with loose soil [1]. Dust events in Northeast Asia occur most frequently in spring (from March to May) [2,3,4]. As the dry areas of Eastern Mongolia and Manchuria have expanded, the frequency of Asian dust events has increased in South Korea and Japan, which are located leeward of the dry areas [5]. Sand and dust storms have several adverse effects on human health, agricultural land, infrastructure, and transport [1,6,7,8,9]. Recently, a new international coalition was launched to strengthen coordinated action against such sand and dust storms. The participating entities include the World Meteorological Organization (WMO), UN Convention to Combat Desertification (UNCCD), UN Development Program (UNDP), UN Environment Program (UNEP), UN Food and Agriculture Organization (FAO), World Health Organization (WHO), and the World Bank [10].
The Korea Meteorological Administration (KMA) has operated an Asian Dust Aerosol Model (ADAM) for forecasting Asian dust events since 2007. ADAM performance has been improved gradually by various studies [11,12,13,14,15]. Version 3 of ADAM (ADAM3) is currently an intercomparison model for Asian dust prediction within the Asian node of the Sand and Dust Storm Warning Advisory and Assessment System (SDS-WAS) of the WMO [1]. The Asian node of the WMO SDS-WAS compares Asian dust predictions through the KMA, China Meteorological Administration (CMA), European Center for Medium-Range Weather Forecasts, National Centers for Environmental Prediction, Japan Meteorological Agency, and the Finnish Meteorological Institute at the annual meetings of regional steering groups.
The soil types found in the Asian dust source regions in ADAM are Gobi, sand, loess, mixed, and Tibetan [12,13,16]. In ADAM, one of the most important controlling factors of the frequency and intensity of dust emissions is the reduction in emissions by the vegetation in regions with different surface soil types (such as Gobi, sand, loess, mixed, and Tibetan) [13]. The amount of dust lifted in the dust source regions may vary with the changes in ground surface properties caused by the growth of grass and crops in such regions over time. Recently, the KMA updated the dust emission reduction factor (RF) in ADAM3 employing data obtained for the normalized difference vegetation index (NDVI) of the Moderate Resolution Imaging Spectroradiometer (MODIS) to indicate the recent vegetation characteristics in Asian dust source regions [12]. The NDVI is known to have a high correlation with green biomass and the leaf area index [17]. The National Meteorological Satellite Center of the KMA receives MODIS NDVI data with a horizontal resolution of 500 m when a satellite passes over the Korean Peninsula once a day.
In this study, we aimed to investigate the effects of the alteration in RF on the accuracy of ADAM3 simulations according to the soil types in the dust source regions. To this end, we conducted two ADAM3 simulations, i.e., one using the monthly RF (OLD_RF) based on the 5 year mean (May 2007 to April 2012) NDVI obtained from the Spot4/vegetation data and the other (NEW_RF) using real-time daily MODIS NDVI data. We evaluated the performance of ADAM3 related to the new RF formulation by employing 6 h mean PM10 mass concentrations observed at 262 sites in the Asian dust source regions in Inner Mongolia and Manchuria during spring (March to May) 2017. Section 2 presents an overview of ADAM3, as well as the datasets used in our study. In Section 3, we describe the differences between OLD_RF and NEW_RF based on the Spot4/vegetation data and real-time MODIS NDVI data, respectively, relevant to the study area and period. Subsequently, we present an analysis of the changes in the simulated PM10 mass concentrations of ADAM3 related to the changes in the RF over the Asian dust source regions. Lastly, we provide an assessment of the performance of ADAM3 by renewing the dust emission RF according to the soil types of the Asian dust source regions. In Section 4 and Section 5, we present our discussion and concluding remarks.

2. Materials and Methods

2.1. Asian Dust Aerosol Model 3 (ADAM3)

The ADAM3 is a three-dimensional Eulerian atmospheric chemical dust transport model. It was developed by adding a dust emission scheme [16] to version 4.7.1 of the Community Multiscale Air Quality (CMAQ) regional chemical transport model of the United States Environmental Protection Agency (US/EPA) [18]. The emission of Asian dust in ADAM3 is determined by factors such as wind speed, relative humidity, surface temperature, and precipitation in the source regions of the dust. The dust source regions are defined on the basis of a statistical analysis of the WMO dust reporting data through a 3 h SYNOP report for 9 years (1998 to 2006) on different soil surfaces in the domain, as illustrated in Figure 1 [13]. The Asian dust source regions in ADAM3 are limited mainly to northern China, Mongolia, northern India, and Central Asia. Figure 1 shows the surface soil types over the Asian dust source regions in ADAM3 (Gobi, sand, loess, mixed, and Tibetan).
The dust mass concentrations in ADAM3 were calculated for nine representative particle diameters (0.50, 0.82, 1.35, 2.23, 3.67, 6.06, 10.0, 16.50, and 27.25 μm). The total dust flux (D) in μg·cm−2·s−1 raised from the surface was calculated using Equation (1), modified slightly from Park et al. [16].
D = ( 1 R ) × a × b × ( U * / 1.4 ) 4 ,
where U * is the friction velocity in m·s−1, a and b are weighting factors for the frozen effect and ground temperature, respectively, and R is the dust emission RF, which reflects changes in surface properties caused by the growth of grass and crops in the dust source regions over time. The lifted dust amount in ADAM3 is proportional to the fourth power of the friction velocity and was calculated only for grids within the dust source regions shown in Figure 1.
ADAM3 was developed by incorporating the following parameters into ADAM2 [13], the older version of ADAM3: anthropogenic and natural emissions, assimilations of surface-observed PM and satellite-observed aerosol optical depth (AOD), and the daily dust emission RF related to the vegetation cover. Anthropogenic emissions were implemented in ADAM3 through the Sparse Matrix Operator Kernel Emissions, version 3.1 [19], in conjunction with inputs from the Clean Air Policy Support System 2013 of the Korea Ministry of Environment for South Korea and the MICS-Asia 2010 data for regions outside South Korea. Natural emission amounts were determined using the Model of Emissions of Gases and Aerosols from Nature, version 2.0.4 [20]. Hourly surface PM10 concentrations were assimilated into the model grids using the optimal interpolation method with horizontal and vertical correlation lengths of 250 km and 400 m, respectively. The assimilated PM10 concentration data were observed at 1107 stations in Korea and China, and the data passed quality control steps. The KMA-COMS AOD data were assimilated using the same optimal interpolation method but with a horizontal correlation length of 25 km, once per day at 6:00 a.m. UTC. The satellite AOD data assimilation does not adapt to the ADAM3 simulations of this study. The meteorological fields to drive ADAM3 were obtained from the United Kingdom Met Office Unified Model [21], which is the global forecasting model used at the KMA. The current operational forecast of ADAM3 performs 72 h forecast cycles at 6 h intervals over an East Asian domain covered horizontally by a 25 km resolution 340 (east–west) × 220 (north–south) grid nest, using the Lambert conformal conic projection, and vertically by 49 irregularly spaced layers.

2.2. Method and Data

Up to ADAM2, the models contained monthly RF calculated using the 5 year mean (May 2007 to April 2012) NDVI from the Spot4/vegetation data [13] to reflect the reduction in dust emissions because of vegetation (grass and crops) in the Asian dust source regions. To reflect the realistic effects of real-time vegetation cover in the Asian dust source regions, Lee et al. [12] modified the RF in ADAM3 using a system to parameterize the daily RF on the basis of the MODIS NDVI data for the last 30 days. These authors used the monthly MODIS/Aqua product of NDVI (obtainable from https://e4ftl01.cr.usgs.gov/MOLA/MYD13C2.006 (accessed on 25 April 2017)), with a spatial resolution of 0.05° over a 10 year period from 2007 to 2016. To consider the daily vegetation effects, we used high-resolution NDVI data with a horizontal resolution of 500 m obtained from the National Meteorological Satellite Center Atmosphere of KMA every time the MODIS/Aqua satellite passed over the Korean Peninsula [12].
To evaluate the effects of incorporating real-time vegetation data into the dust emission RF to enhance the performance of ADAM3, two simulations were conducted using the monthly RF climatology (OLD_RF) and real-time daily RF (NEW_RF) data during the study period (March to May 2017). The OLD_RF and NEW_RF runs share a common experimental setup except for the RF. We evaluated the improvements of the model using the root-mean-square error (RMSE) and skill score (SS) at the 24, 48, and 72 h forecast times. The values were calculated using 6 h averaged PM10 mass concentrations observed at the 252 observation sites of the Ministry of Environment Protection (now Ministry of Ecology and Environment) of China and 10 KMA–CMA joint observatories over the Asian dust source regions in northern China for the OLD_RF and NEW_RF runs. The RMSE is a common accuracy measure that operates on a single pair of forecast/observation fields. The RMSE for a perfectly forecast field is zero, with a larger RMSE indicating lower accuracy. The RMSE retains the units of the forecast variable and is easily interpretable as a typical error magnitude. The SS, i.e., the relative accuracy measure of the form of Equation (2), could be appropriate to evaluate the improvement in the performance of the NEW_RF run compared with the OLD_RF run.
SS = ( 1 RMSE ( NEW _ RF ) / RMSE ( OLD _ RF ) ) × 100 % ,
where RMSE(NEW_RF) and RMSE(OLD_RF) are the RMSEs of the NEW_RF and OLD_RF runs, respectively. If RMSE(NEW_RF) < RMSE(OLD_RF), then SS > 0%, indicating an improvement in the NEW_RF run over the OLD_RF run. If RMSE(NEW_RF) = RMSE(OLD_RF), then SS = 0%, indicating no improvement. If the NEW_RF run is inferior to the OLD_RF, SS < 0%. A larger positive SS value is interpreted as a greater improvement in the new forecasting system [22].
We assessed the effects of real-time vegetation information on forecasting the dust concentration over the Asian dust source regions according to the soil types. The soil type of an observation site is determined by the most common soil type among the nine model grid boxes, i.e., the grid box in which the site is located and the eight grid boxes surrounding that box. In this way, we determined 11 sites in the Gobi soil type, four sites in the sand soil type, 107 sites in the loess soil type, and 140 sites in the mixed soil type. There are no observation stations are located in the Tibetan plateau area; thus, we disregarded the Tibetan soil type in the analyses.

3. Results

3.1. Dust Emission Reduction Factor

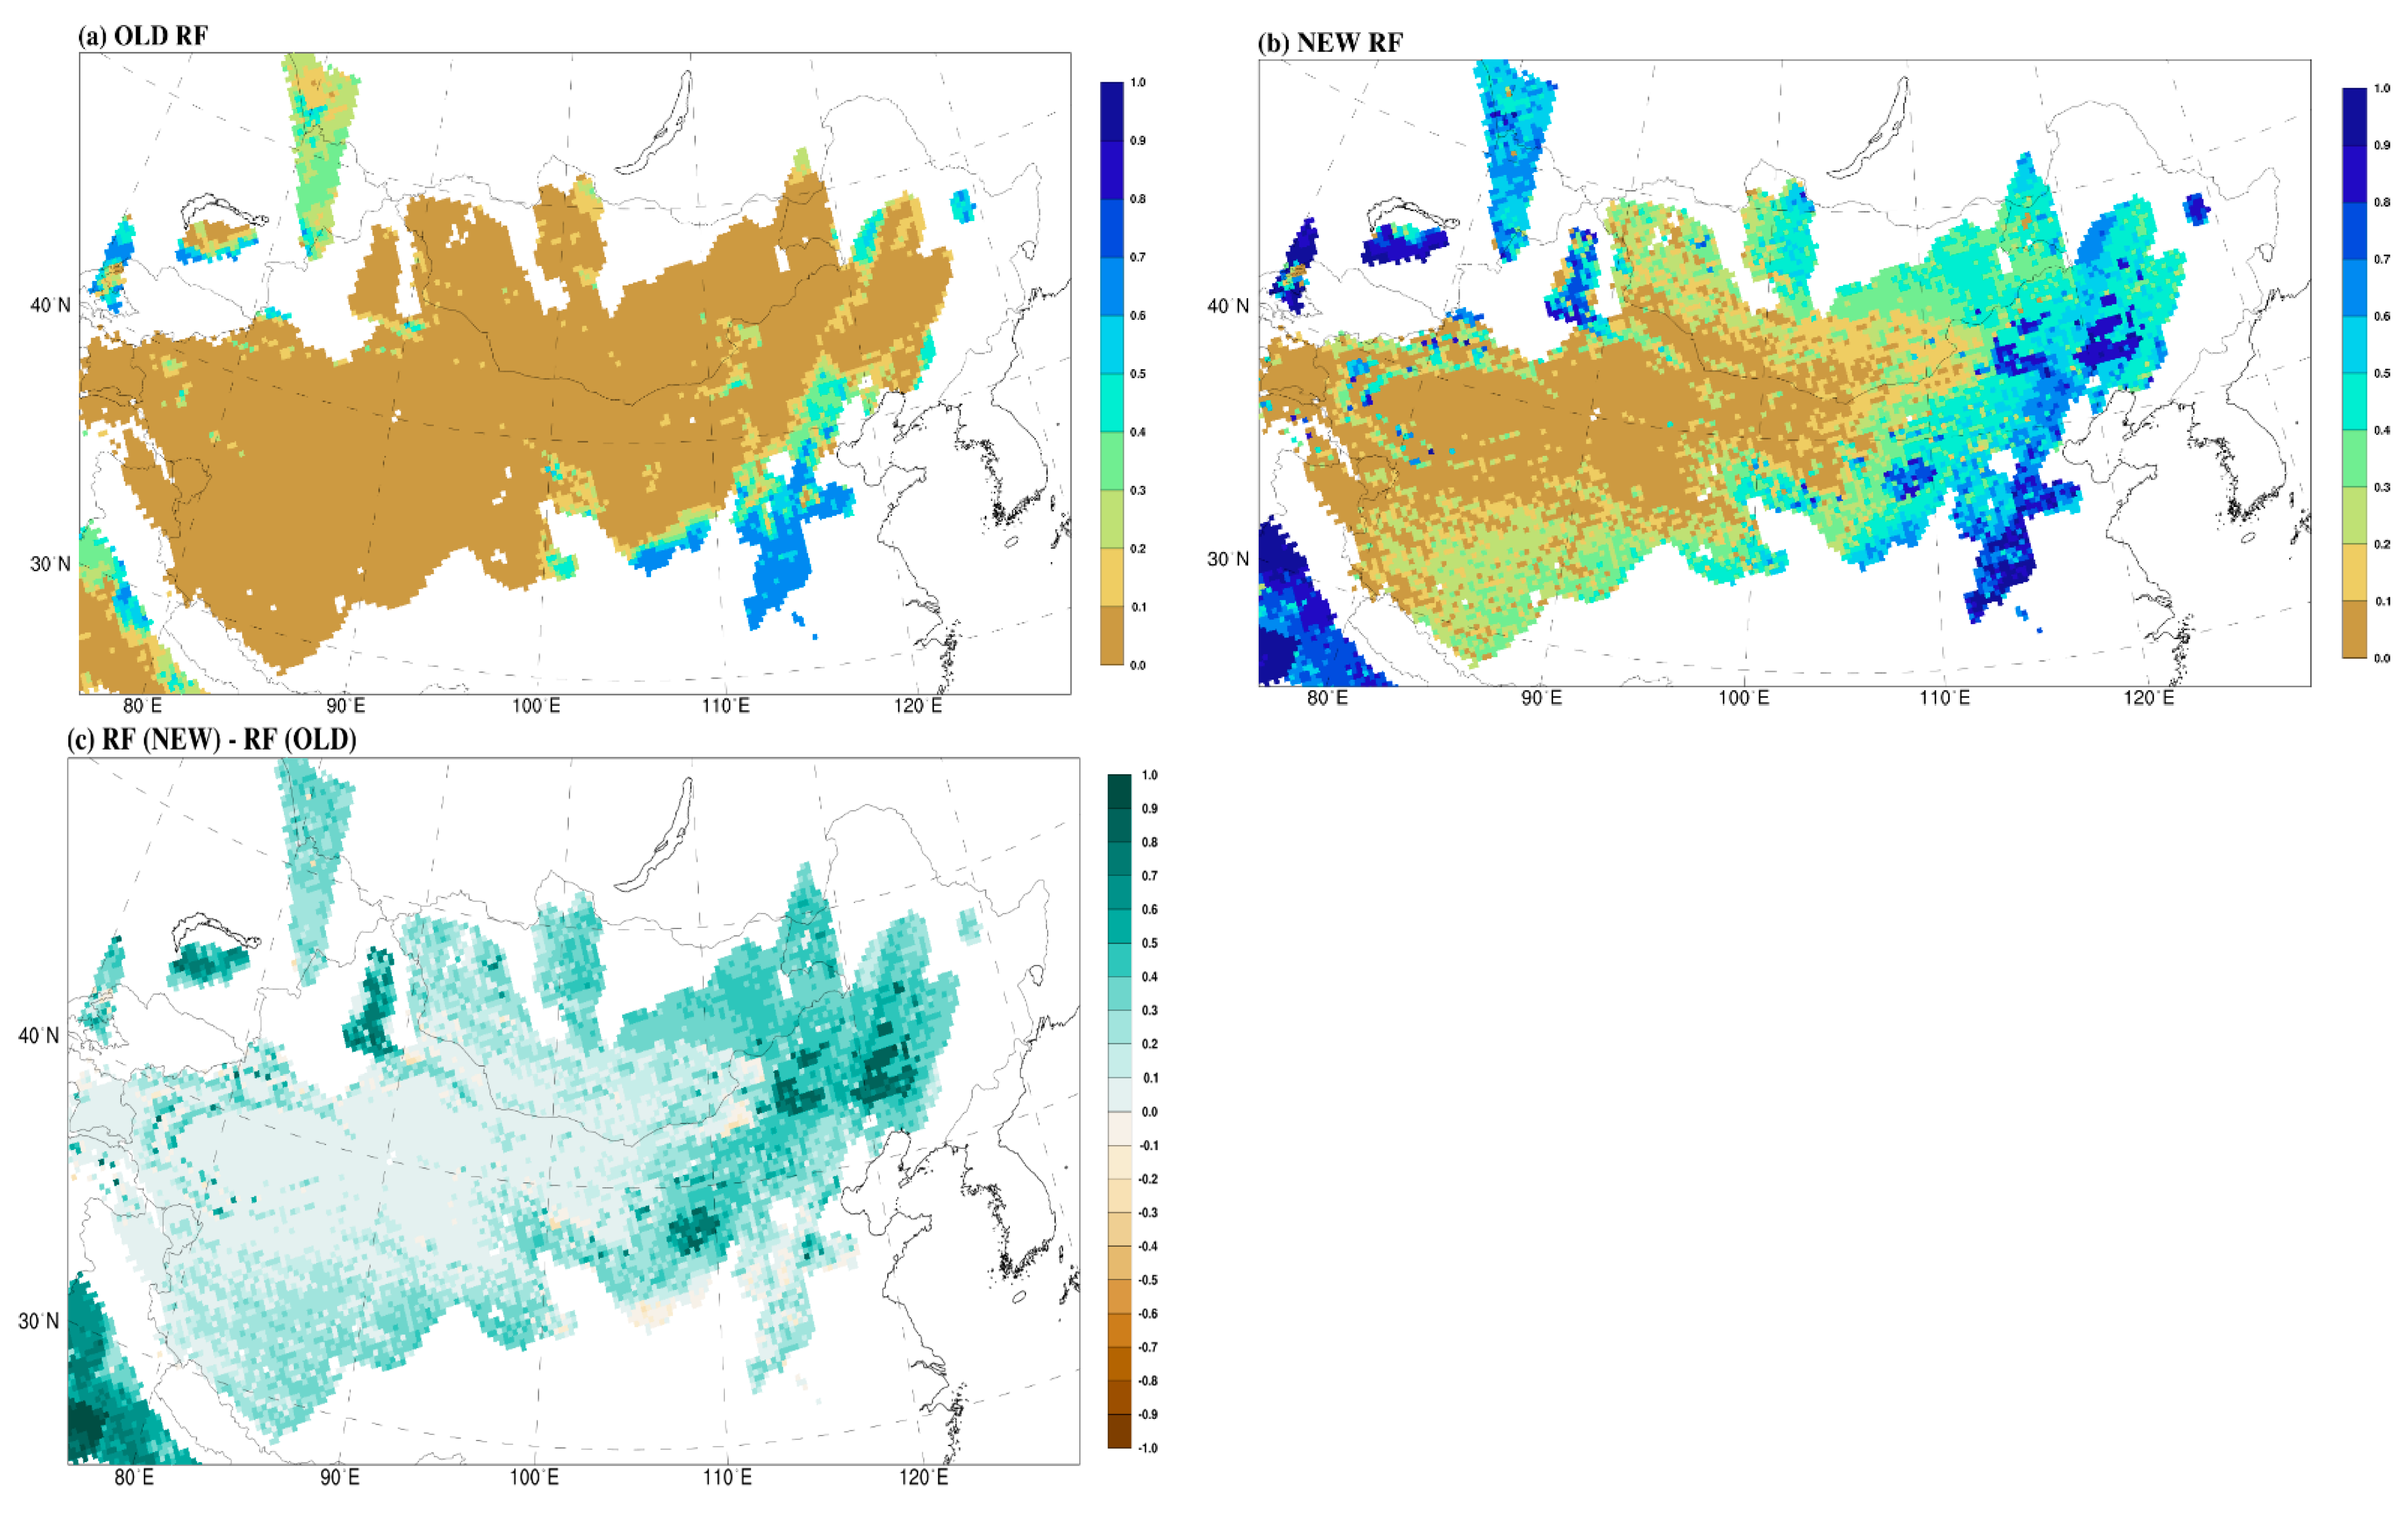
Figure 2a,b show the mean spatial distributions of the RF in OLD_RF and NEW_RF based on the Spot4/vegetation data and the real-time MODIS NDVI data, respectively. Figure 2c shows the RF difference between NEW_RF and OLD_RF. Employing real-time MODIS NDVI increased the RF in most of the Asian dust source regions during the study period, particularly in eastern Inner Mongolia and western Manchuria. Table 1 shows the soil-type-averaged RF in the Asian dust source regions. The RF difference between NEW_RF and OLD_RF for all soil types except Gobi (i.e., sand, loess, and mixed) exceeded 0.26. The RF differences for the soil type varied according to the region, with almost none in the large source regions from the Taklamakan Desert to the Gobi Desert, but significant differences in the regions including the Gurbantunggut, Mu Us, Otindag, and Horqin deserts in Central Asia, Manchuria, and the northern China plain, where a large-scale afforestation program has increased vegetation since 1978 [23,24]. Unfortunately, we could not examine the effects of real-time vegetation in these regions owing to a lack of observational PM10 data. However, it is expected that the large RF differences in the Asian dust source regions, including Inner Mongolia and Manchuria, would significantly affect the PM10 simulation by ADAM3.

3.2. ADAM3 PM10 Simulations

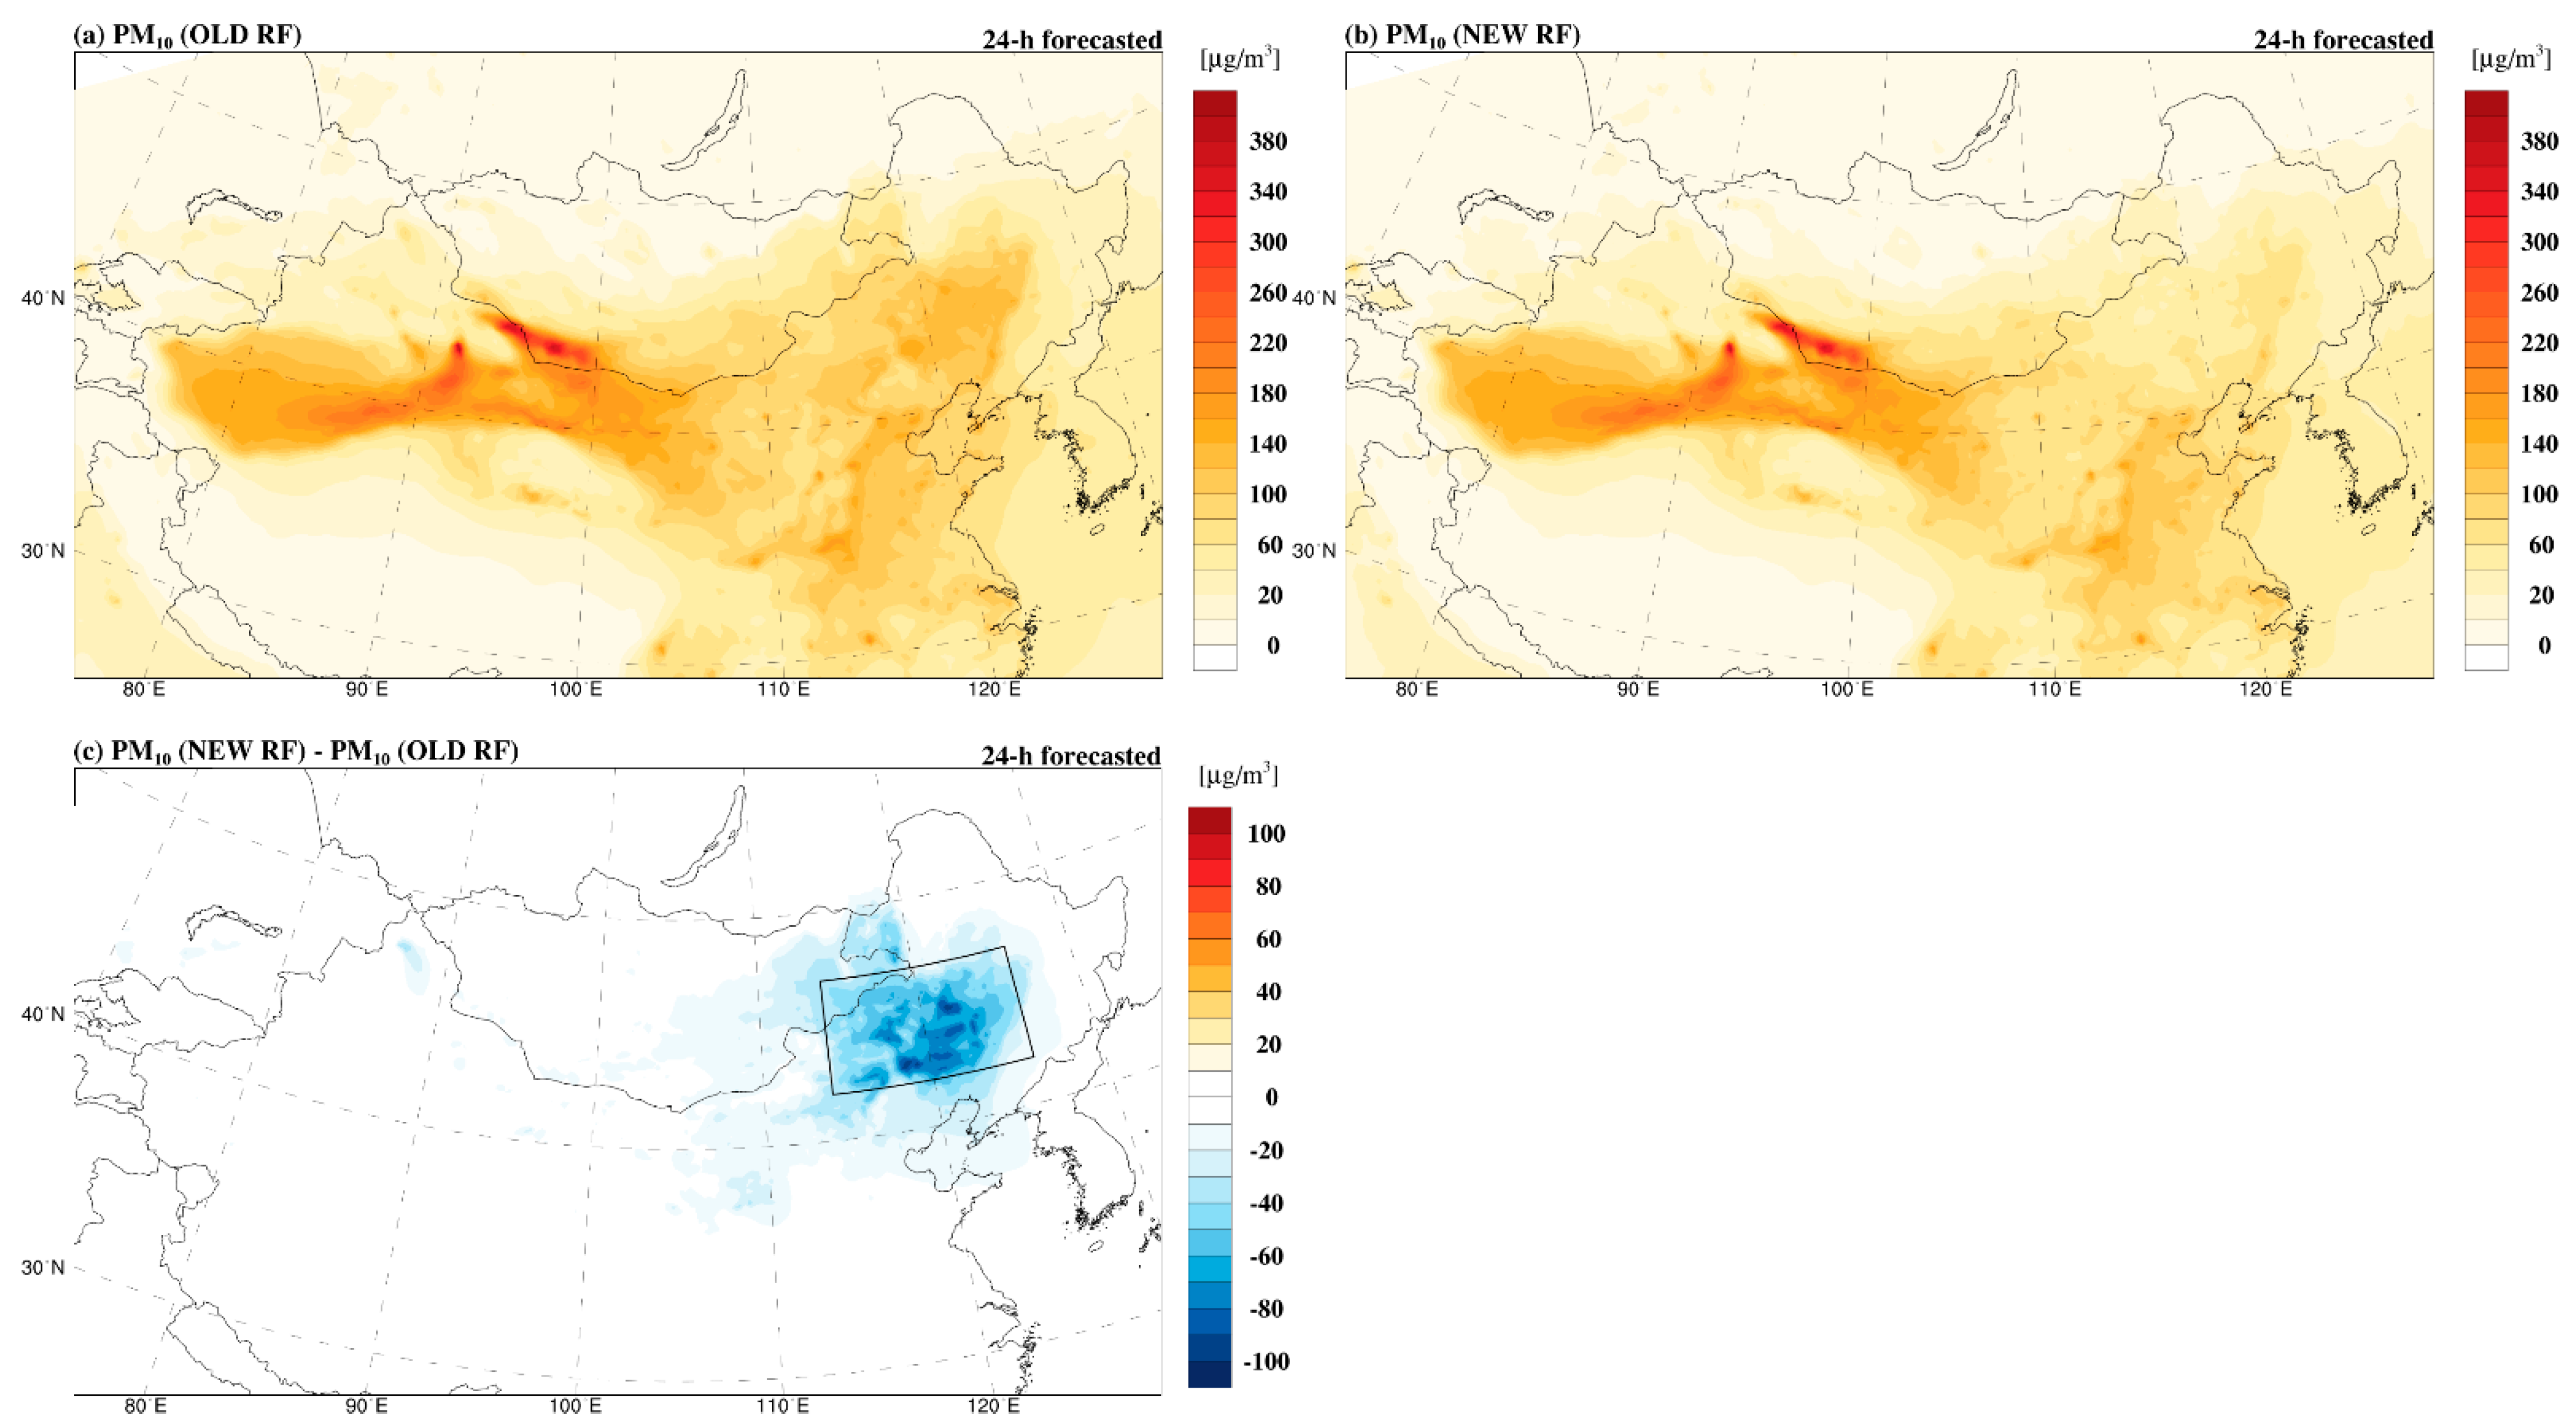
We analyzed the changes in the simulated PM10 mass concentrations related to the changes in the RF over the Asian dust source regions. Figure 3a,b show the comparison of the spatial distribution of the 6 h mean PM10 mass concentrations at the 24 h valid time averaged for the spring of 2017 in the OLD_RF and NEW_RF runs, respectively. The PM10 mass concentrations were the highest in northwestern China around the Taklamakan Desert, western part of Inner Mongolia, Manchuria, and the Loess Plateau. Figure 3c shows the spatial distribution of the PM10 differences between the NEW_RF and OLD_RF runs. Notable PM10 differences between the OLD_RF and NEW_RF runs were found over Manchuria, where the Otindag and Horqin deserts are located. The PM10 mass concentrations in the NEW_RF run were smaller than those in the OLD_RF run by 50.44 µg·m−3 (49.42%) in the area delineated by a box (42°–47° N, 114°–126° E) (Figure 3c). Therefore, the RF increase using real-time MODIS NDVI resulted in a reduction in the PM10 mass concentration in ADAM3 simulations. Similar changes in the simulated PM10 mass concentration occurred at the 48 h and 72 h valid times (not shown).

3.3. Assessments According to Surface Soil Type

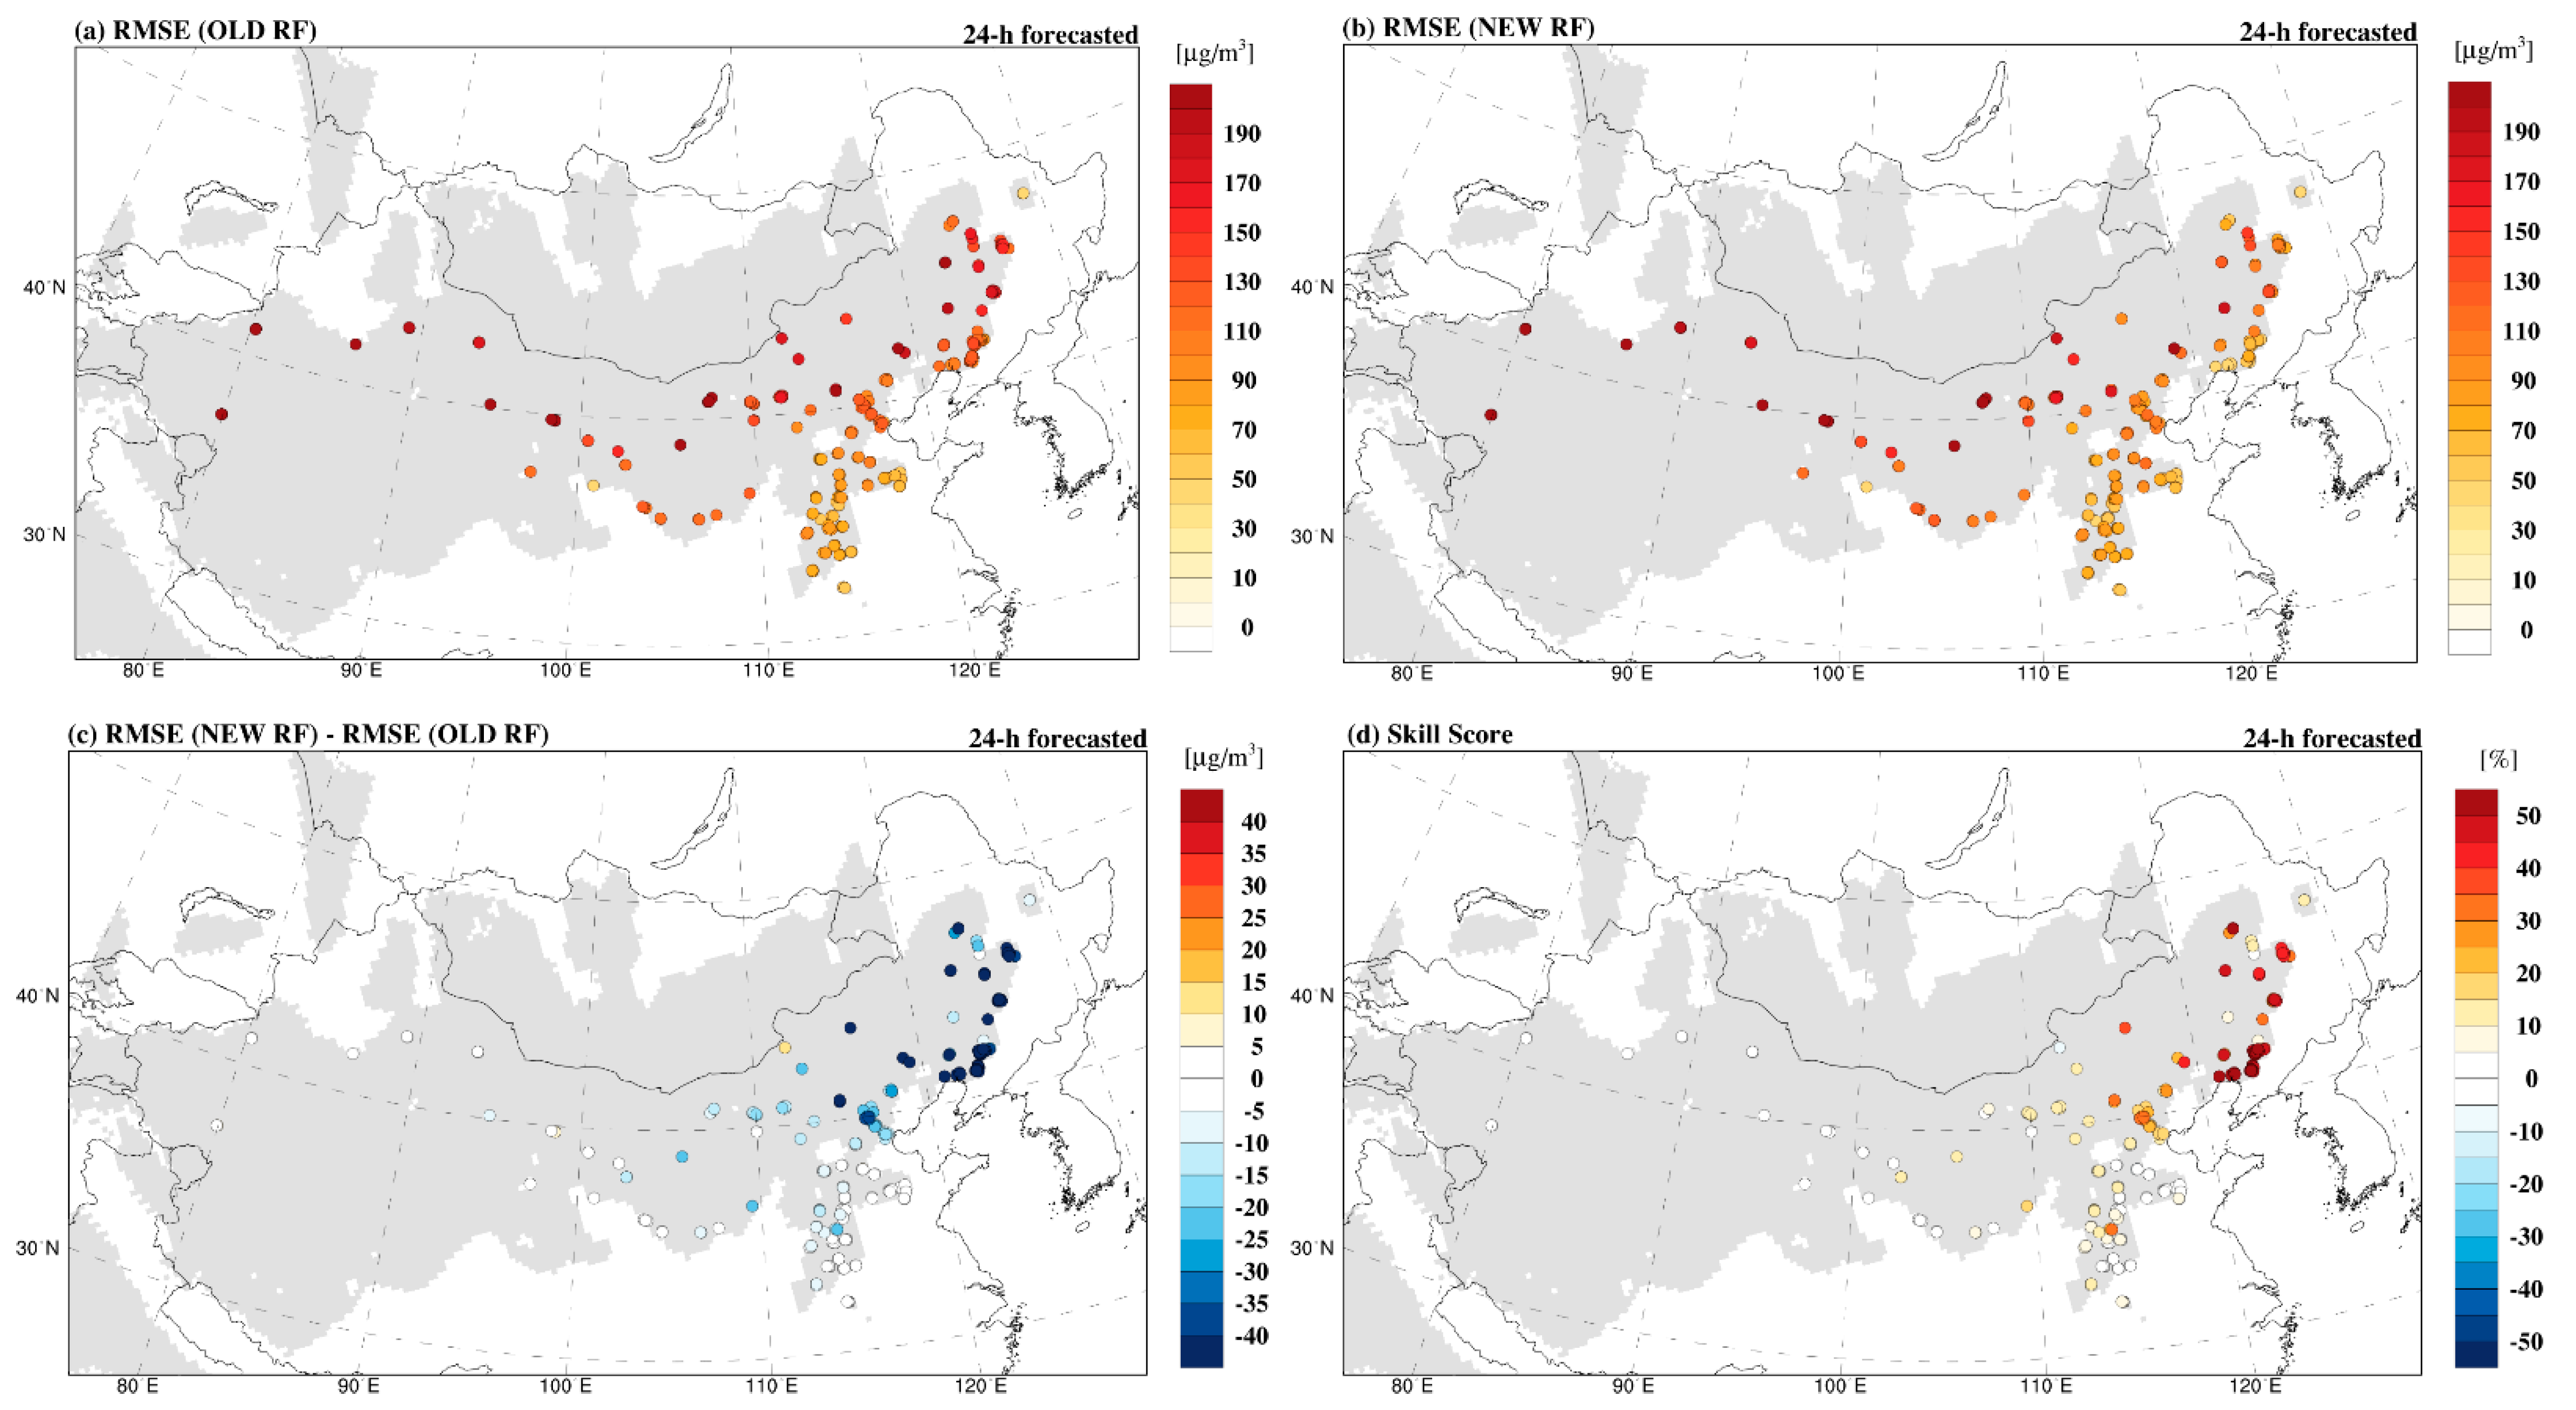
Figure 4a,b show the RMSE of the simulated PM10 concentrations at the 24 h valid time for the OLD_RF and NEW_RF runs, respectively, calculated at 262 sites over the Asian dust source regions in northern China. The RMSEs were relatively large at sites with high PM10 mass concentrations, as shown in Figure 3a,b. Figure 4c shows that the changes in the RF when using the real-time NDVI reduced the RMSE at most sites. Figure 4d shows the SS of the NEW_RF run over the OLD_RF run at the 24 h valid time, indicating an improvement in the performance of ADAM3 at most sites. The largest SSs were found at sites over Manchuria, with notable RF differences shown in Figure 3c.
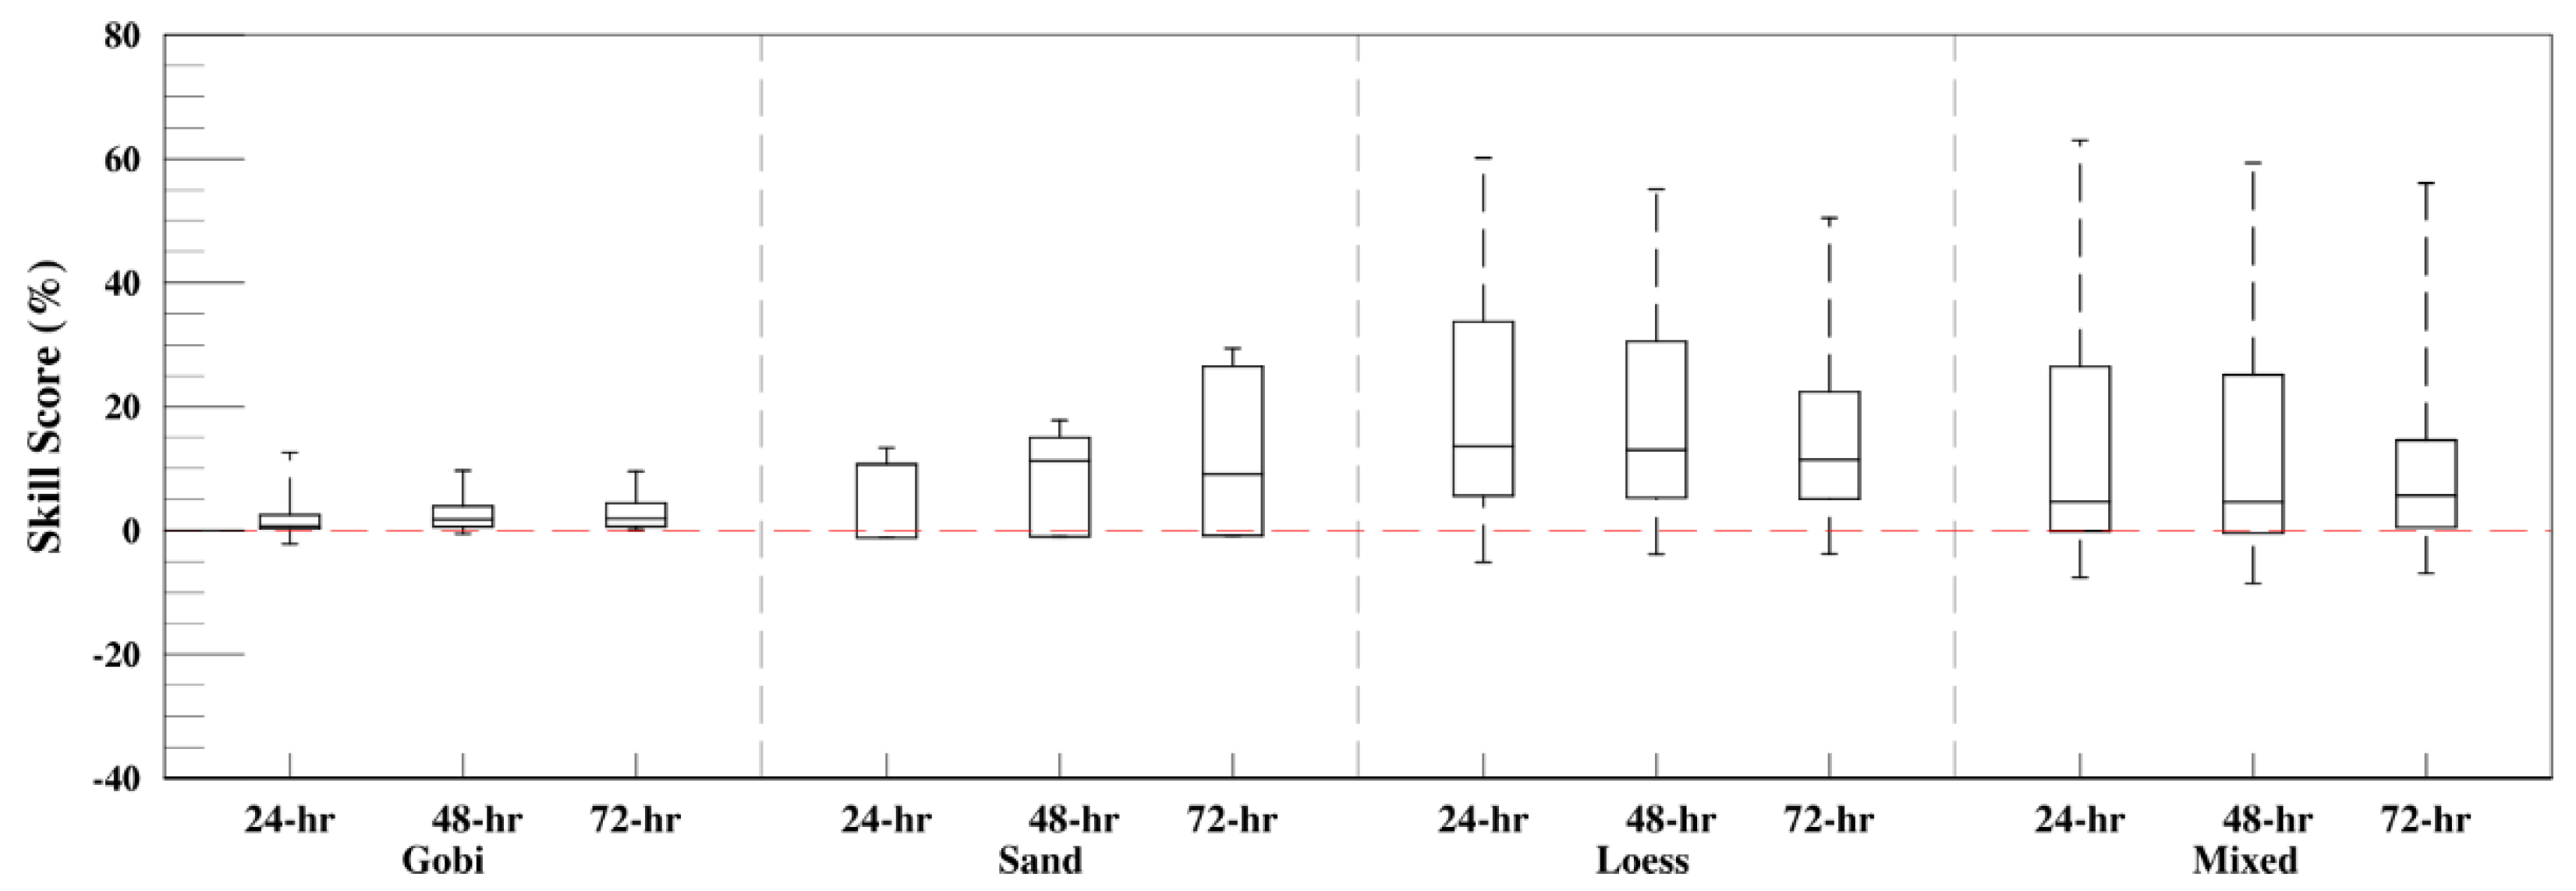
To assess the changes in the performance of ADAM3 related to the RF based on real-time vegetation data and according to the soil types in the dust source region, the RMSEs were categorized into four groups (Gobi, sand, loess, and mixed) according to the soil types at the observation sites (see Section 2.2). The results are shown and summarized in Figure 5. The figure shows the box-and-whisker plots of the SS of the NEW_RF run over the OLD_RF run at 24 h, 48 h, and 72 h valid times according to soil type, respectively. Bars from the top represent 100%, 75%, 50%, 25%, and 0% of the total data. Because the RF in NEW_RF was nearly the same as that in OLD_RF for the Gobi type region, the effects of NEW_RF on the ADAM3 performance were negligible.
However, for the sand, loess, and mixed types, the RF based on the real-time NDVI showed a notable decrease in the RMSE and an improvement in the SS in ADAM3. Owing to the small number (four) of sand type sites, the results were inconclusive for this soil type. This finding suggested that using the new RF based on real-time MODIS NDVI generally improved the performance of ADAM3 in simulating the PM10 mass concentration over the Asian dust source regions. The advantage of the new RF was particularly obvious for the loess soil type, with the new RF reducing the RMSE and increasing the SS by 15.38 µg·m−3 and 16.5% (at 24 h valid time), 13.42 µg·m−3 and 14.2% (at 48 h), and 12.02 µg·m−3 and 11.9% (at 72 h), respectively. The positive effects of the new RF for the loess and mixed types existed up to 72 h, despite a gradual decrease in the improvement with an increase in the forecast lead time. Figure 6 shows the scatterplots of the forecasted PM10 and observed PM10 before (OLD_RF run) and after (NEW_RF run), classified by soil type. Clearly, for the loess and mixed types, there was a notable increase in positive correlation. However, for the sand and Gobi types, positive correlations did not change before and after adopting the new RF. The lower slope of the linear regression line of the New_RF run compared with that of the Old_RF run for loess and mixed types resulted from a notable simulated PM10 decrease over Manchuria, as shown in Figure 3c.

4. Discussion

As shown in Equation (1), the total amount of dust generated in ADAM3 is proportional to the fourth power of the friction velocity and inversely proportional to the dust emission RF. These values reflect the changes in the surface properties caused by the growth of grass and crops in the dust source regions over time. The positive RF difference between the NEW_RF and OLD_RF in most of the Asian dust source regions (Figure 2 and Table 1) suggested that the amount of dust generated in ADAM3 using the new RF would be smaller than that using the old RF, particularly during the growing season. As mentioned, the RMSE decreased notably and SS improved substantially over the regions where the RF changed significantly after using the new RF based on real-time MODIS NDVI. These results emphasize the importance of incorporating accurate land-surface conditions into the dust simulation scheme. Doing so improves the accuracy of forecasting the amounts of dust generated in the dust model.
In addition, dead leaves remaining after the growing season could reduce the amount of dust emitted from the surface by wind erosion. Kang et al. [25] examined the effect of dead leaves on dust generation using the Weather Research and Forecasting (WRF) model coupled with Chemistry [26] using a dust emission scheme. These authors assumed that the number of dead leaves would decrease linearly from their peak month and would disappear the following April. In future studies, we plan to incorporate the dead leaf effect into the dust emission RF in ADAM and compare the performances of ADAM with/without the dead leaf effect in simulating PM10 mass concentrations over Asian dust source regions.
Although surface wind speed is the primary factor for determining dust emissions in the source regions, the effects of land surface conditions, particularly vegetation cover, are also important. The surface vegetation in the Asian dust source regions is currently changing owing to desertification, land degradation, and afforestation related to human activities and climatic change [23]. These changes in surface vegetation alter the frequency and intensity of dust storms, as the total amount of dust emissions uplifted from the surface changes. The rapidly changing vegetation landscapes in the Asian dust source regions necessitate incorporating real-time vegetation information in dust forecast models such as ADAM3.

5. Conclusion

In this study, we examined the changes in the performance of ADAM3-based dust forecasting related to using an improved RF. We used real-time daily MODIS NDVI data over the Asian dust source regions in Northeast Asia according to soil types. The study period was spring 2017. The RMSE at the 24, 48, and 72 h valid times was calculated using 6 h averaged PM10 mass concentrations observed at 262 observation sites over the Asian dust source regions for OLD_RF and NEW_RF runs. ADAM3 dust forecasts notably improved for the sand, loess, and mixed types using the new RF evaluated in terms of the SS (6.6%, 20.4%, and 13.3% at 24 h valid time, respectively); however, the changes for the sand soil type could not be evaluated because of the small number of evaluation sites. The results also show that the improvement in SS was most notable in the regions where the RF differences between NEW_RF and OLD_RF runs were large. It is worth noting that, over the Gobi region, where the RF differences between NEW_RF and OLD_RF were insignificant, the difference between the ADAM3 performance with old RF and new RF was negligible.
Using real-time daily RF (NEW_RF) based on MODIS NDVI generally improved the performance of ADAM3 for dust concentration forecasts compared with using the OLD_RF based on the 5 year mean (May 2007 to April 2012) NDVI from the Spot4/vegetation data that only consider the climatological annual cycle of vegetation cover. ADAM3 is a key Asian dust forecast model employed in model-intercomparison projects managed by the Asian node of WMO SDS-WAS. Accordingly, the findings of this study could provide valuable input to improve Asian dust forecasting efforts.

Author Contributions

Conceptualization, S.-B.R.; methodology, J.H.C.; software, J.H.C.; validation, S.-B.R. and J.K.; formal analysis, J.H.C.; investigation, S.-B.R.; data curation, J.H.C.; writing—original draft preparation, J.H.C., S.-B.R., and J.K.; writing—review and editing, S.-B.R. and J.K.; visualization, J.H.C. All authors read and agreed to the published version of the manuscript.

Funding

This research was funded by the Korea Meteorological Administration Research and Development Program “Development of Asian Dust and Haze Monitoring and Prediction Technology” under Grant KMA2018-00521 and “Development and Assessment of IPCC AR6 Climate Change Scenario” under Grant KMA2018-00321.

Data Availability Statement

The data presented in this study are available on request from the corresponding author. The data are not publicly available due to the data sharing policy of National Institute of Meteorological Sciences.

Conflicts of Interest

The authors declare no conflict of interest.

References

  1. UNEP; WMO; UNCCD. Global Assessment of Sand and Dust Storms; United Nations Environment Programme: Nairobi, Kenya, 2016; pp. 6–19. [Google Scholar]
  2. Chun, Y.; Boo, K.O.; Kim, J.; Park, S.-U.; Lee, M. Synopsis, transport, and physical characteristics of Asian dust in Korea. J. Geophys. Res. Atmos. 2001, 106, 18461–18469. [Google Scholar] [CrossRef] [Green Version]
  3. Kim, J. Transport routes and source regions of Asian dust observed in Korea during the past 40 years (1965~2004). Atmos. Environ. 2008, 42, 4778–4789. [Google Scholar] [CrossRef]
  4. Shao, Y.; Klose, M.; Wyrwoll, K.H. Recent global dust trend and connections to climate forcing. J. Geophys. Res. Atmos. 2013, 118, 11–107. [Google Scholar] [CrossRef]
  5. Lee, E.H.; Sohn, B.J. Recent increasing trend in dust frequency over Mongolia and Inner Mongolia regions and its association with climate and surface condition change. Atmos. Environ. 2011, 45, 4611–4616. [Google Scholar] [CrossRef]
  6. Giannadaki, D.; Pozzer, A.; Lelieveld, J. Modeled global effects of airborne desert dust on air quality and premature mortality. Atmos. Chem. Phys. 2014, 14, 957–968. [Google Scholar] [CrossRef] [Green Version]
  7. Kashima, S.; Yorifuji, T.; Bae, S.; Honda, Y.; Lim, Y.H.; Hong, Y.C. Asian dust effect on cause-specific mortality in five cities across South Korea and Japan. Atmos. Environ. 2016, 128, 20–27. [Google Scholar] [CrossRef]
  8. Kwon, H.J.; Cho, S.H.; Chun, Y.; Lagarde, F.; Pershagen, G. Effects of the Asian dust events on daily mortality in Seoul, Korea. Environ. Res. 2002, 90, 1–5. [Google Scholar] [CrossRef]
  9. Zhang, X.; Zhao, L.; Tong, D.; Wu, G.; Dan, M.; Teng, B. A systematic review of global desert dust and associated human health effects. Atmosphere 2016, 7, 158. [Google Scholar] [CrossRef] [Green Version]
  10. WMO. New International Coalition to Combat Sand and Dust Storms. 2019. Available online: http://public.wom.int/en/media/news/new-international-coalition-combat-sand-and-dust-storms (accessed on 24 June 2020).
  11. Lee, S.S.; Lee, E.H.; Sohn, B.J.; Lee, H.C.; Cho, J.H.; Ryoo, S.-B. Improved dust forecast by assimilating MODIS IR-based nighttime AOT in the ADAM2 model. SOLA 2017, 13, 192–198. [Google Scholar] [CrossRef] [Green Version]
  12. Lee, S.S.; Lim, Y.-K.; Cho, J.H.; Lee, H.C.; Ryoo, S.-B. Improved dust emission reduction factor in the ADAM2 model using real-time MODIS NDVI. Atmosphere 2019, 10, 702. [Google Scholar] [CrossRef]
  13. Park, S.-U.; Choe, A.; Lee, E.H.; Park, M.S.; Song, X. The Asian Dust Aerosol Model 2 (ADAM2) with the use of Normalized Difference Vegetation Index (NDVI) obtained from the Spot4/vegetation data. Theor. Appl. Climatol. 2010, 101, 191–208. [Google Scholar] [CrossRef]
  14. Ryoo, S.-B.; Lim, Y.-K.; Park, Y.-S. Seasonal Asian dust forecasting using GloSea5-ADAM. Atmosphere 2020, 11, 526. [Google Scholar] [CrossRef]
  15. Ryoo, S.-B.; Kim, J.; Cho, J.H. Performance of KMA-ADAM3 in identifying Asia dust days over Northern China. Atmosphere 2020, 11, 593. [Google Scholar] [CrossRef]
  16. Park, S.-U.; In, H.-J. Parameterization of dust emission for the simulation of the yellow sand (Asian dust) event observed in March 2002 in Korea. J. Geophys. Res. 2003, 108, 4618. [Google Scholar] [CrossRef]
  17. Wang, Q.; Adiku, S.; Tenhunen, J.; Granier, A. On the relationship of NDVI with leaf area index in a deciduous forest site. Rem. Sens. Environ. 2005, 94, 244–255. [Google Scholar] [CrossRef]
  18. Byun, D.; Schere, K.L. Review of the governing equations, computational algorithms, and other components of the Models-3 Community Multiscale Air Quality (CMAQ) modeling system. Appl. Mech. Rev. 2006, 59, 51–77. [Google Scholar] [CrossRef]
  19. Houyoux, M.R.; Vukovich, J.M. Updates to the Sparse Matrix Operator Kernel Emissions (SMOKE) modeling system and integration with Models-3. Emiss. Inventory Reg. Strateg. Future 1999, 1461, 1–11. [Google Scholar]
  20. Guenther, A.; Karl, T.; Harley, P.; Wiedinmyer, C.; Palmer, P.I.; Geron, C. Estimates of global terrestrial isoprene emissions using MEGAN (Model of Emissions of Gases and Aerosols from Nature). Atmos. Chem. Phys. 2006, 6, 3181–3210. [Google Scholar] [CrossRef] [Green Version]
  21. Davies, T.; Cullen, M.J.; Malcolm, A.J.; Mawson, M.H.; Staniforth, A.; White, A.A.; Wood, N. A new dynamical core for the Met Office’s global and regional modelling of the atmosphere. Q. J. R. Meteorol. Soc. 2005, 131, 1759–1782. [Google Scholar] [CrossRef]
  22. Wilks, D.S. Statistical Methods in Atmospheric Sciences; Academic Press: Cambridge, MA, USA, 1995; pp. 276–277. [Google Scholar]
  23. Tan, M.; Li, X. Does the Green Great Wall effectively decrease dust storm intensity in China? A study based on NOAA NDVI and weather station data. Land Use Policy 2015, 43, 42–47. [Google Scholar] [CrossRef]
  24. Wang, X.M.; Zhang, C.X.; Hasi, E.; Dong, Z.B. Has the Three Norths Forest Shelterbelt Program solved the desertification and dust storm problems in arid and semiarid China? J. Arid Environ. 2010, 74, 13–22. [Google Scholar] [CrossRef]
  25. Kang, J.Y.; Tanaka, T.Y.; Mikami, M. Effect of dead leaves on early spring dust emission in East Asia. Atmos. Environ. 2014, 86, 35–46. [Google Scholar] [CrossRef]
  26. Grell, G.A.; Peckham, S.E.; Schmitz, R.; McKeen, S.A.; Frost, G.; Skamarock, W.C.; Eder, B. Full coupled “online” chemistry within the WRF model. Atmos. Environ. 2005, 39, 6957–6975. [Google Scholar] [CrossRef]
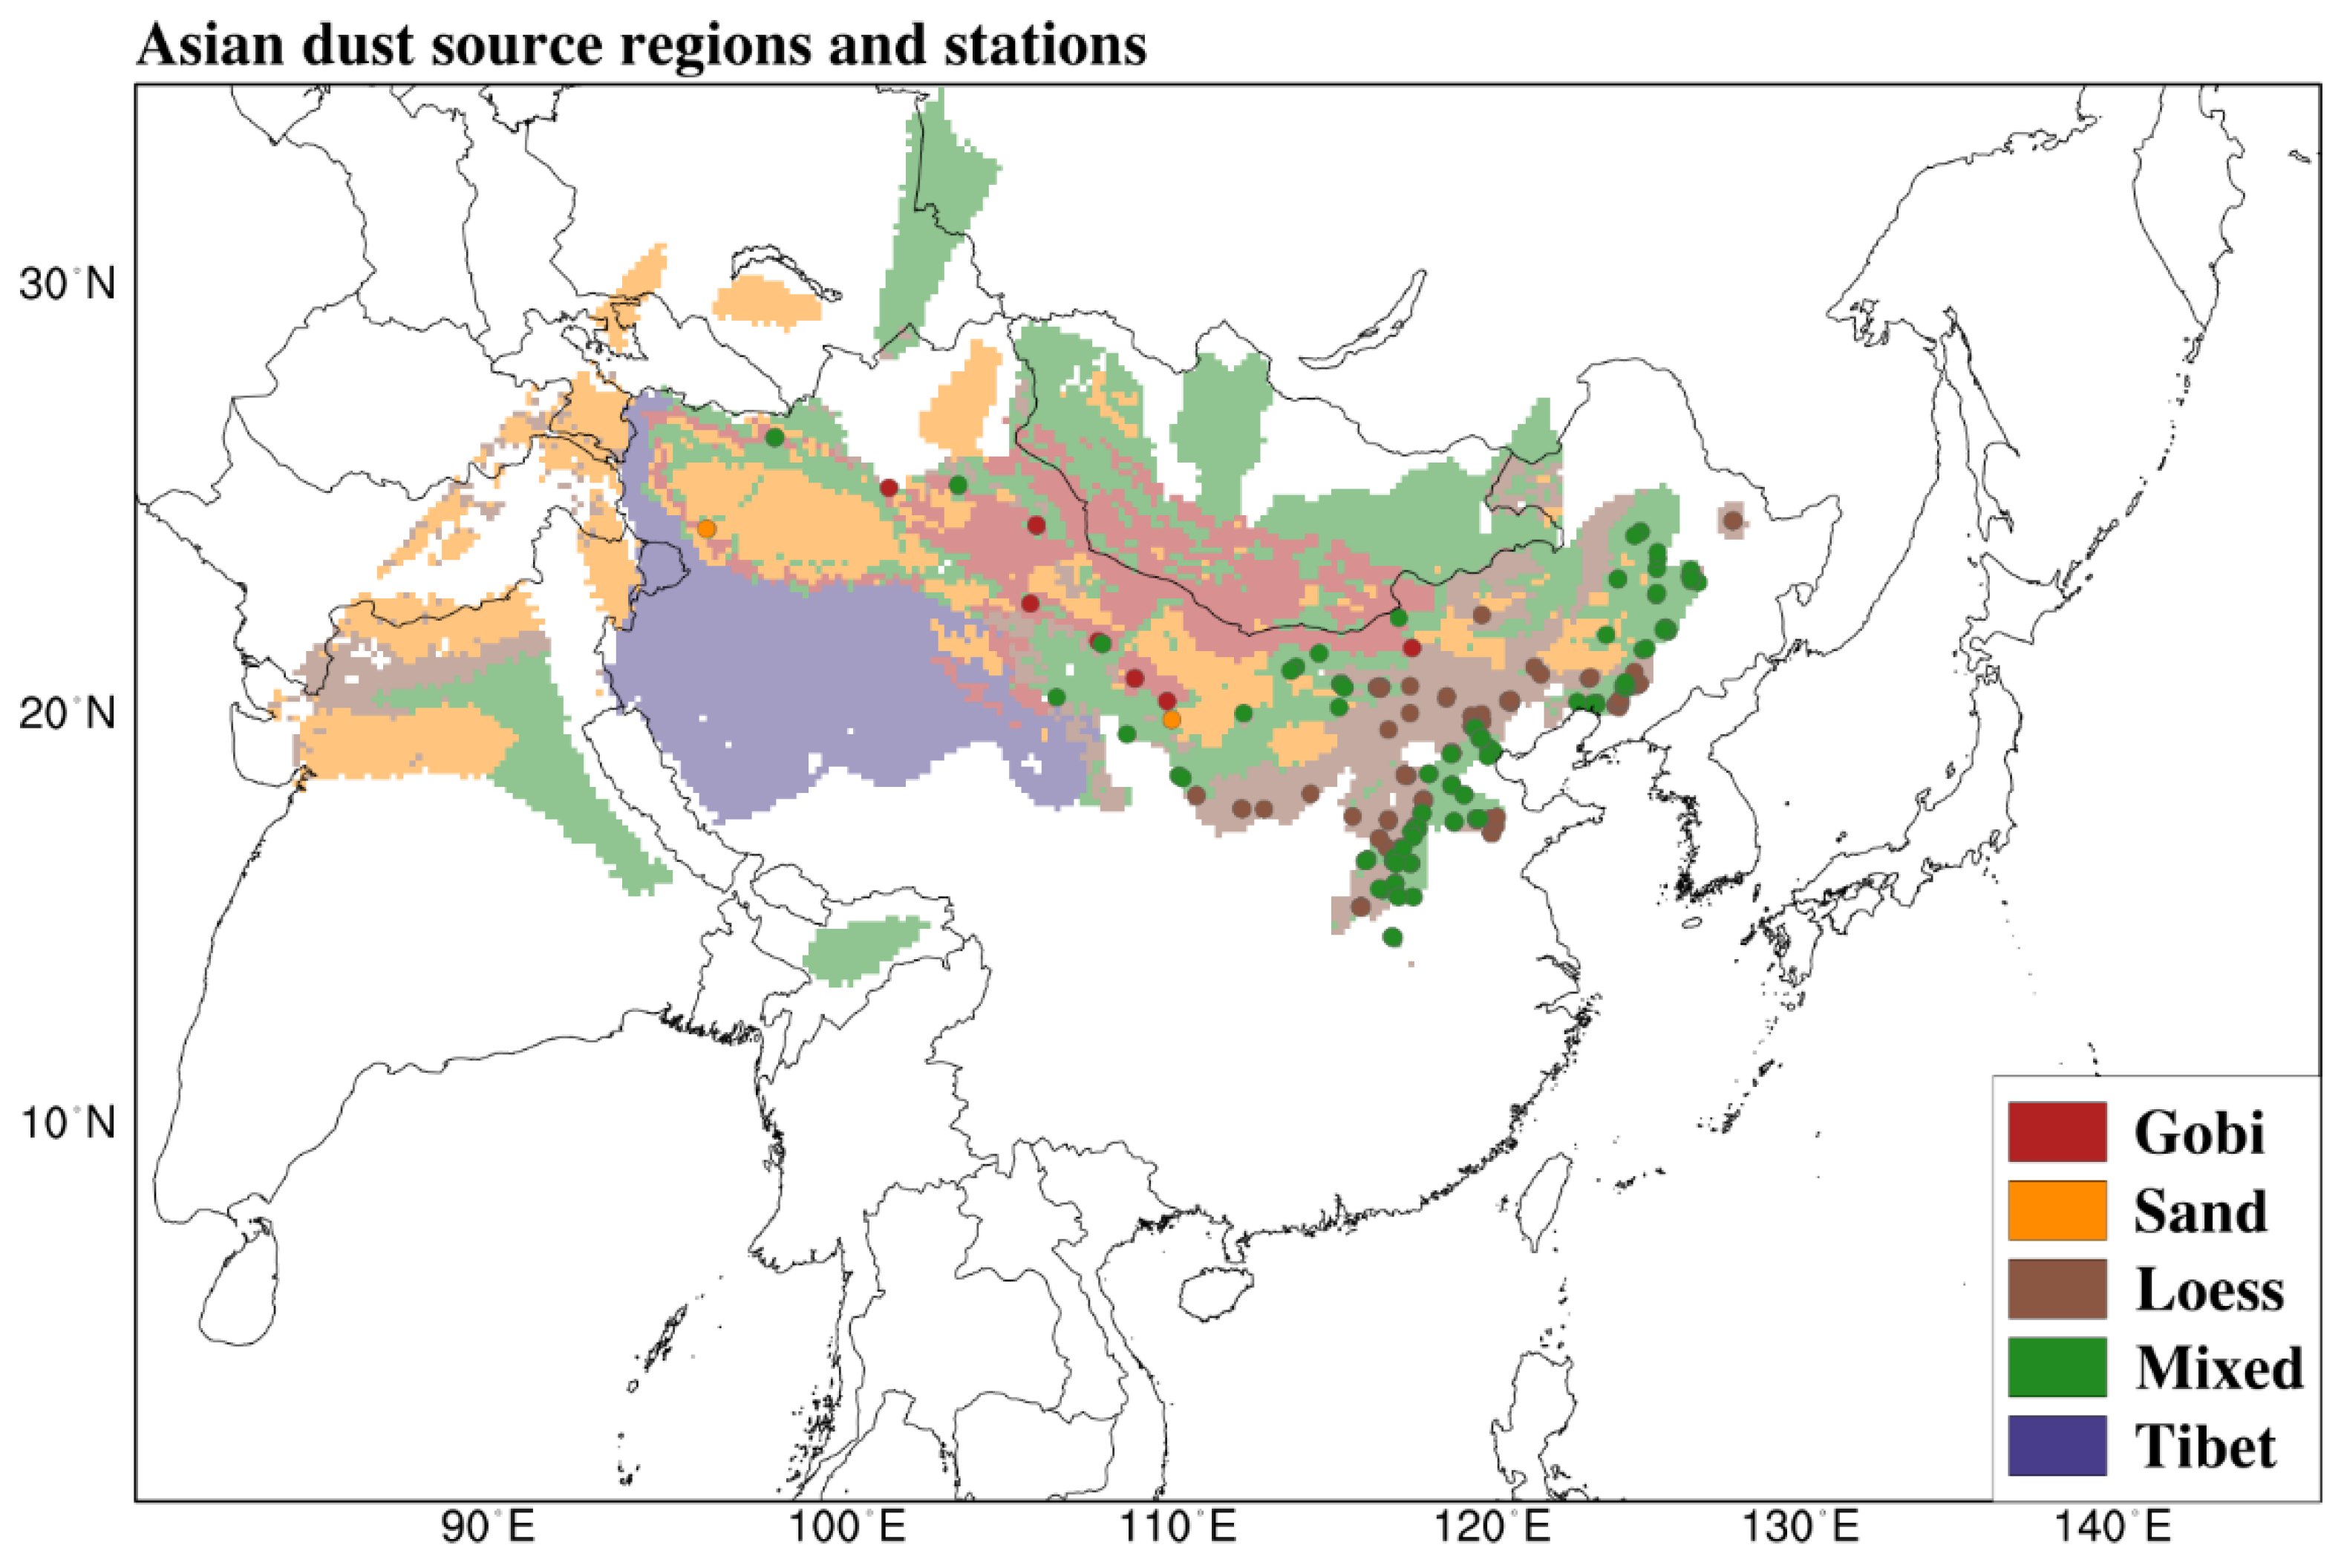
Figure 1. Spatial distribution of 262 observation sites (colored circles) and surface soil types (Gobi, sand, loess, mixed, and Tibetan) over the Asian dust source regions of the Asian Dust Aerosol Model 3 (ADAM3) (based on Figure 1 of Park and In, 2003).
Remotesensing 13 03139 g001
Figure 2. Spatial distribution of (a) OLD_RF and (b) NEW_RF over the Asian dust source regions retrieved from the Spot4/vegetation and real-time MODIS NDVI data, respectively. (c) Spatial distribution of the RF difference between NEW_RF and OLD_RF.
Remotesensing 13 03139 g002
Figure 3. Spatial distribution of (a) PM10 (OLD_RF) and (b) PM10 (NEW_RF), which are 6 h averaged PM10 mass concentrations at the 24 h valid time forecasted by the OLD_RF and NEW_RF runs, respectively, averaged during spring (March to May) 2017. (c) PM10 difference between PM10 (NEW_RF) and PM10 (OLD_RF).
Remotesensing 13 03139 g003
Figure 4. Spatial distribution of RMSE between predicted PM10 and measured PM10 for the ADAM3 performance with (a) OLD_RF and (b) NEW_RF. The circles designate 262 sites where PM10 measurements were taken. (c) RMSE difference between RMSE (NEW_RF) and RMSE (OLD_RF) and (d) skill scores of the NEW_RF run compared with the OLD_RF run at the 24 h valid time.
Remotesensing 13 03139 g004
Figure 5. Box-and-whisker plots of the skill scores of the NEW_RF run over the OLD_RF run at the 24 h, 48 h, and 72 h valid times according to soil types. Bars from the top represent 100%, 75%, 50%, 25%, and 0% of the total data, respectively.
Remotesensing 13 03139 g005
Figure 6. Scatter plot and linear regression lines of the observed PM10 and 24 h forecasted PM10 from OLD_RF and NEW_RF experiments in each Asian dust source region, namely, Gobi, sand, loess, and mixed.
Remotesensing 13 03139 g006
Table 1. Mean RF differences between the NEW_RF and OLD_RF over the areas with the specified soil types separately, as well as over the entire area of Asian dust sources during spring 2017.
Soil Type
GobiSandLoessMixedEntire Area of Dust Sources
NEW_RF to OLD_RF0.05350.31930.26760.32400.2734
Publisher’s Note: MDPI stays neutral with regard to jurisdictional claims in published maps and institutional affiliations.