Abstract
Ground deformation related to mining activities may occur immediately or many years later, leading to a series of mine geological disasters, such as ground fissures, collapses, and even mining earthquakes. Deformation monitoring has been carried out with techniques, such as multitemporal interferometric synthetic aperture radar (MTInSAR). Over the past decade, MTInSAR has been widely used in monitoring mining deformation, and it is still difficult to retrieve mining deformation over dense vegetation areas. In this study, we use multiple-platform SAR images to retrieve mining deformation over dense vegetation areas. The high-quality interferograms are selected by the coherence map, and the mining deformation is retrieved by the MSBAS-InSAR technique. SAR images from TerraSAR-X, Sentinel-1A, Radarsat-2, and PALSAR-2 over the Fengfeng mining area, Heibei, China, are used to retrieve the deformation of mining activities covered with dense vegetation. The results show that the subsidence in the Fengfeng mining area reaches up to 90 cm over the period from July 2015 to April 2016. The root-mean-square error (RMSE) between the results from InSAR and leveling is 83.5 mm/yr at two mining sites, i.e., Wannian and Jiulong Mines.
1. Introduction
Mining activities can break the original stress balance of the overlying rock layer, and lead to a series of geological and environmental problems, e.g., aquifer destruction, landslides, and ground structural damage [1,2,3], which inevitably lead to ground deformation. Thus, detecting and predicting such mining deformation is essential for analyzing the mechanism of mining activities and potential geological hazards. In general, mining deformation can be assessed quantitatively, by empirical and theoretical prediction models [3]. The accuracy of the predicted mining deformation of the models is limited by the input parameters related to the geological condition, geotechnical information, and deformation observed at sparse points. For example, the accuracy of the predicted deformation could range from 48% to 773%, without actual ground deformation information [4]. Therefore, monitoring ground deformation plays an essential role in exploring the deformation mechanism of the mining area.
Ground deformation can be measured by in situ observations from traditional geodetic surveying techniques, such as leveling and global navigation satellite system (GNSS). These techniques can monitor ground deformation with high accuracy; however, the spatial resolutions are normally poor, and they are often labor intensive. Mining prediction models highly rely on the resolution, sampling rate, and coverage of measurement points. Spaceborne interferometric synthetic aperture radar (InSAR) is an active remote sensing technique, and has become one of the most useful geodetic techniques for ground deformation monitoring [5,6,7,8,9]. Compared with traditional techniques, InSAR has proven its unique advantages through broad coverage and high spatial resolution [10,11]. To further improve the accuracy of traditional InSAR, multitemporal InSAR (MTInSAR) has been developed for analyzing the time series phase of point targets by a series of interferograms. For example, persistent scatter InSAR (PSInSAR) and small baseline subset (SBAS) methods were proposed to reduce the effect of unwanted phase contributions, such as atmosphere, decorrelation noise, and digital elevation model (DEM) phase residual, and to retrieve more accurate ground deformation [12,13]. Currently, MTInSAR has been widely applied in monitoring the time series of deformation in different scenarios, such as seismic motion, landslides, and ground subsidence [14,15,16,17,18,19,20,21,22]. In addition to mining activities, MTInSAR offers great potential for promoting studies of mining deformation, such as mechanism interpretation, parameter inversion, and deformation prediction [3].
In 1996, Carnec et al. [23] generated the first deformation map caused by underground mining, using InSAR. Then, many applications have been carried out to monitor mining deformation with InSAR in recent decades. For example, in 1999, Wright et al. [4] obtained elevation changes induced by mining activity with two ERS SAR datasets. In 2010, Milan et al. [24] retrieved a series of mining deformations in the area of the Ostrava-Karviná Revier in the Czech Republic using the Stanford method for persistent scatterers (StaMPS). Since mining deformation often occurs in three-dimensional (3D) space, studies with individual SAR datasets using the SAR techniques, such as multi-aperture InSAR [25], and pixel offset tracking [26], can only be dedicated to measuring one-/two-dimensional (1D/2D) deformation along the radar line of sight (LOS) and/or azimuth directions, by which the real pattern of mining deformation is difficult to elucidate. To solve this problem, several methods have been proposed to reconstruct 3D mining displacements, by combining InSAR observations from multitrack or multiplatform systems. For example, in 2011, Hay-Man Ng et al. [27] retrieved the 3D deformation of the southern highland coalfield in New South Wales, Australia, with multiplatform SAR datasets. In 2013, Samsonov et al. [2] proposed the MSBAS method to retrieve the 2D time series of ground deformation of postmining activities along the French-German border.
MTInSAR has been widely used to monitor mining deformation, but it is still limited by environmental issues, such as dense vegetation and extreme weather. Mining areas are often located in rural regions, which are usually covered with dense vegetation, which raises the significant decorrelation of InSAR interferograms and leads to spatial and temporal gaps for mining deformation monitoring [28]. In this article, we carried out a case study of deformation monitoring in a mining area with dense vegetation coverage. We use multiplatform SAR images and MSBAS-InSAR technology to retrieve the mining deformation. The dataset from different SAR platforms is integrated into the MTSBAS-InSAR to estimate the mining deformation. High-quality interferograms are selected according to their coherence maps and weather conditions. The generalized deformation maps of 36 mining sites in the Fengfeng mining area, Hebei, China are obtained by combining the SAR images of TerraSAR-X, Sentinel-1A, Radarsat-2, and PALSAR-2. The deformation results are verified with the measurements from leveling and indicate that the high accuracy of the deformation can be achieved with multiplatform SAR images.
The remainder of this paper is structured as follows. In Section 2, the background of the Fengfeng mining area and SAR datasets used are introduced. Section 3 gives the strategy of data processing and the MSBAS-InSAR method. The result and discussion are shown in Section 4 and Section 5 respectively. Section 6 gives the conclusions of this study.
2. Study Area and SAR Datasets
2.1. Background of Fengfeng Mining Area
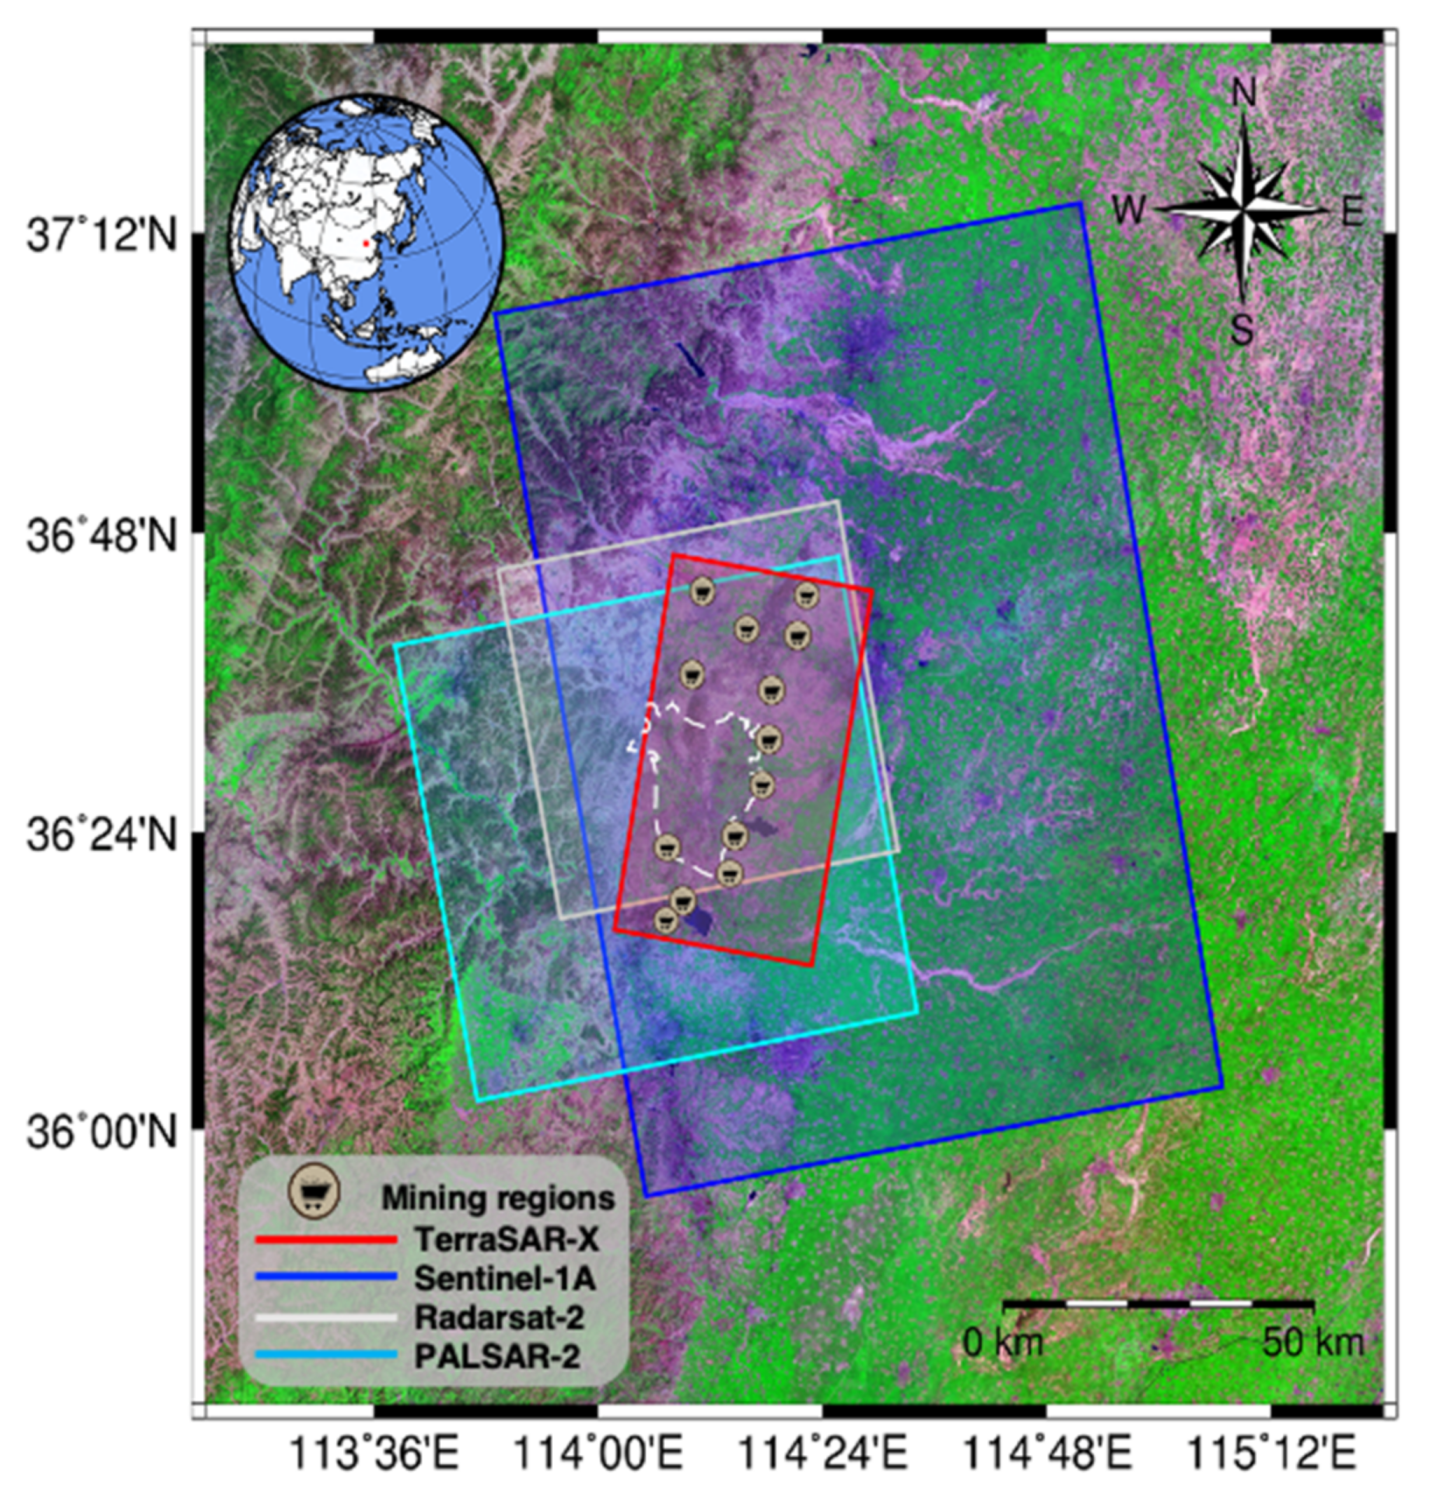
The Fengfeng mining area is located in the southwestern part of Handan city, China, as shown in Figure 1. Approximately 36 sites and significant subsidence (see Figure 1b) have been reported in and around this area [29,30]. According to the field work photo of Fengfeng mining area in Figure 1b, the ground surface is covered with dense vegetation, e.g., crops and weeds, leading the InSAR interferogram to be easily decorrelated. Especially in the summer period, vegetation grows quickly, and some vegetation is over the height of a man. In addition, the ongoing mining activities has generated large gradient subsidence that cause difficulties to InSAR for monitoring of deformation.
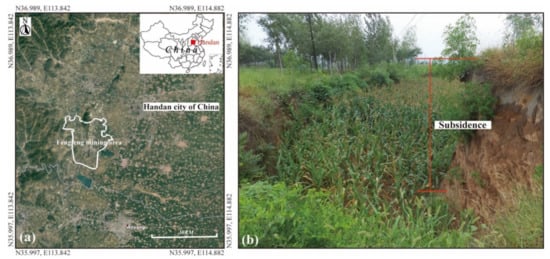
Figure 1.
(a) Geolocation of the Fengfeng mining area, framed by the white polygon; (b) the picture of the field mining area indicates large subsidence and dense ground vegetation.
2.2. SAR Datasets
Multisensor spaceborne SAR satellite datasets from both ascending and descending tracks over the Fengfeng area were collected to measure the mining deformation, as outlined in Table 1. The coverage of these data and the distribution of the main mining regions are shown in Figure 2. A digital elevation model (DEM) from shuttle radar topography missions (SRTM), provided by the United States Geological Survey (USGS) with a spatial resolution of 30 m, is adopted for topography compensation and geocoding. We also collected measurements of 152 leveling stations in the 6 phases at two mining sites, i.e., Jiulong and Wannian Mines, to validate the InSAR results.

Table 1.
SAR datasets used in this study.

Figure 2.
Coverage of SAR satellite datasets used in this study. The main mining regions are marked with symbols. The background image is a false color composite from Landsat-8.
3. Methodology
3.1. Interferometric Processing
The data preprocessing of each SAR dataset used in this study was carried out using GAMMA software [31], including single look complex (SLC) image extraction and coregistration, interferogram generation, flat-earth phase removal, phase noise filtering, phase unwrapping, and geocoding.
3.2. Retrieval of Time-Series Deformation
In this study, the MSBAS technique in [2] was used to retrieve the time-series deformation of the Fengfeng mining area. MSBAS is an advanced extension of the traditional SBAS [13], that extends the deformation retrieval from the line-of-sight (LOS) direction to the two-dimensional direction, i.e., the horizontal (east-west direction) and vertical (up-down direction) deformation. In addition to the advantage of 2D deformation, MSBAS can significantly improve the temporal sampling of deformation time series with multiplatform SAR images. The difference from the SBAS method is that before time-series analyzing, all unwrapped interferograms must be geocoded and interpolated into a common grid with the same spatial resolution, as shown in Figure 3. The lower resolution of the SAR dataset is usually chosen as the resolution of the common grid, which is the final spatial resolution of the deformation result. Both SBAS and MSBAS are briefly introduced in the following sections.
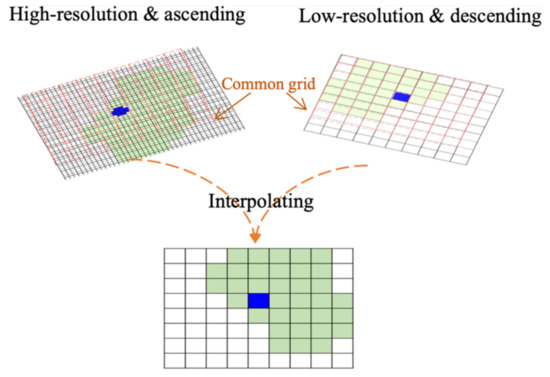
Figure 3.
Schematic diagram of interpolating the multiplatform SAR interferogram to a common georeferenced grid.
3.2.1. SBAS Technique
For each SAR data processing, it is assumed that SAR images from a single platform are obtained at the time order of . M differential interferograms (where ) with a short multimaster baseline are generated and well phase unwrapped. The unwrapped phase () of one pixel on an interferogram can be written as:
where is the deformation phase in the LOS direction between the period of two SAR acquisitions; is the topographic residual phase, caused by the imperfection of the external DEM; is the phase related to the orbital error that can be compensated by the orbital model and external information [32,33]; and are the atmospheric phase screen (APS) and decorrelation noise phase, respectively; and , , , , and R are the radar wavelength, deformation, incident angle, perpendicular baseline, and slant range distance between the radar sensor and ground target, respectively.
After compensating for the orbital error () and part of the atmospheric phase (i.e., altitude-related), Equation (1) can be expressed in the form of matrices when all interferograms are taken into consideration:
where is the unwrapped phase vector of a pixel in all interferograms with the dimension of , is the unknown parameter vector that is used to model the deformation phase () and DEM error (H) [13], is the noise phase component mainly including the atmospheric phase and decorrelation noise, is a design matrix linking the unknows and unwrapped phase, which has rows and columns. Generally, the solution can be estimated using least-square inversion, i.e., . Regularization methods, such as Tikhonov, can also be used to solve the problem when design matrix A is rank deficient [34].
The LOS deformation from an individual SAR geometry or platform can be expressed as [35],
where is the azimuth angle of the flight direction. , , and are the deformation vectors along the up-down, north-south, and east-west directions, respectively. Equation (3) can be rewritten in the form of a matrix as:
where S is the LOS unit vector with north, east, and up components, i.e., , , and . For individual SAR geometry, the result in Equations (3) or (4) cannot be decomposed into 3D displacements. The SBAS methodology can be modified to generate an approximate solution of time series displacement in two or three dimensions, when SAR images are obtained from more than one acquisition geometry [36].
3.2.2. MSBAS Technique
In MSBAS method, each SAR dataset should have an overlap period in time and with different observation geometries. After the data processing with SBAS method, the DEM errors, orbital errors, and atmospheric errors related to altitude are compensated from the unwrapped interferograms for each SAR dataset to achieve the deformation interferograms. Then, the unwrapped deformation interferograms of each SAR dataset are interpolated into the common grid, as shown in Figure 3. The 3D displacement time series on the common grid point can then be resolved as:
where is the unwrapped phase vector generated by the multiplatform SAR images, A is the coefficient matrix, and depending on the interferograms generated, is the LOS unit vector containing geometric information. Currently, most spaceborne SAR satellites have near-polar sun-synchronous orbits, the SAR sensor is relatively insensitive to displacement in the north-south direction, compared to the vertical and east-west directions. The deformation in the north-south direction can be often ignored [36], and Equation (5) can be then rewritten as:
where the coefficient matrix is updated to , is the regularization factor, and is the unit matrix. Similar to the SBAS method, equation system (6) may be a rank-deficient problem. Transactive singular value decomposition (TSVD) and Tikhonov regularization can be used to find the least square solution in the sense of the minimum norm. In MSBAS, Tikhonov regularization is applied. However, due to the effect of atmospheric phase and decorrelation noise, the solution of Equation (6) can be biased when the time period between each SAR dataset does not overlap or match very well [36]. Therefore, the displacement can be modelled by the deformation model with unknown parameters. For example, an interval deformation velocity model is used to model the 3D displacement, Equation (5) can be rewritten as
where and are the interval deformation velocities in consecutive SAR acquisitions along the east-west and vertical directions, respectively. is the coefficient matrix, and contains the time intervals between consecutive SAR acquisition. The solution of Equation (7) is solved by applying Tikhonov regularization of a second order. In the regularization parameter, is used to produce a smooth solution. The cumulative displacement of the 2D time series can be recovered by the deformation model according to time. For the interval linear deformation velocity model, the 2D displacement time series can be recovered by Equation (8).
The accuracy of MSBAS is highly dependent on the quality of the observation, i.e., . The phase quality of an interferogram is easily affected by decorrelation and atmospheric artifacts. The selection of interferograms is therefore essential in MSBAS data processing. For this reason, all interferograms in which the spatiotemporal baselines were within the given thresholds (see the detailed threshold value in Table A1 in Appendix A) were generated from the available SAR images in this case study. A multilook operation was carried out to suppress the phase noise. Due to the dense vegetation cover during the observation period, we removed interferograms with low coherence in the mining area (mean coherence smaller than 0.28). Phase unwrapping was performed using the MCF method in GAMMA software. In addition, since the decorrelation effect caused by dense vegetation heavily affected the usage of SAR images with different wavelengths, in this case study, we attempted to gradually integrate the multiplatform SAR interferograms with high phase quality into the MSBAS estimator, to reduce the effect of decorrelation for retrieval of mining deformation. Detailed results are presented in Section 4.
4. Results
4.1. Deformation with Single SAR Platform
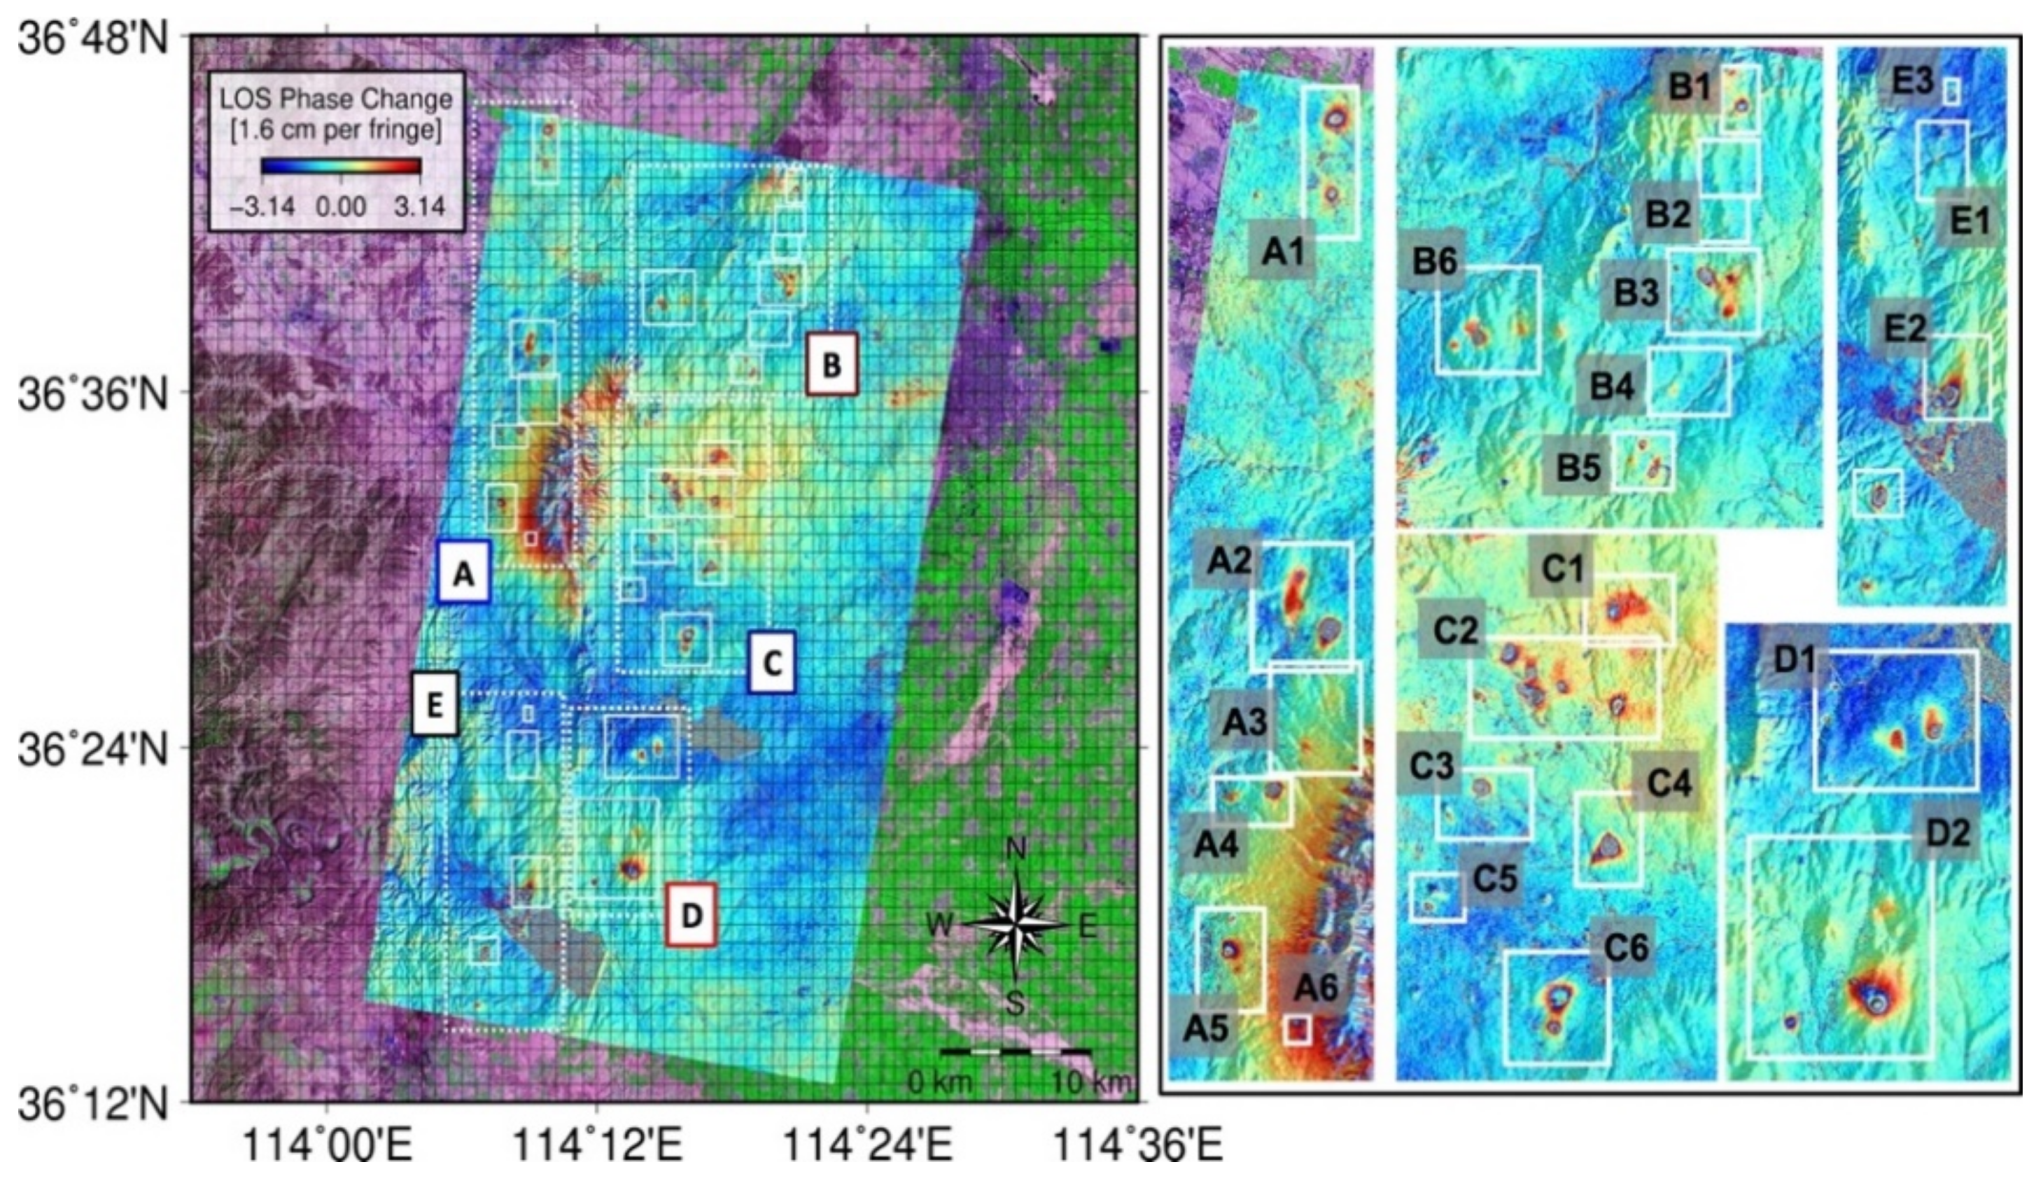
The mining area suffering ground deformation was identified first, before InSAR time-series data processing. We used two TerraSAR-X images with a 22-day revisit period to generate the deformation interferogram. The results in Figure 4 show that many de-formation areas probably induced by mining activities were identified. Five segmentation areas (i.e., A, B, C, D, and E, as shown in Figure 4 with white rectangles) were divided to clarify the mining regions, which was used to identify the phase quality of the interferograms in the mining area.

Figure 4.
The deformation map of the mining areas estimated by two TerraSAR-X images with a 22-day revisit period.
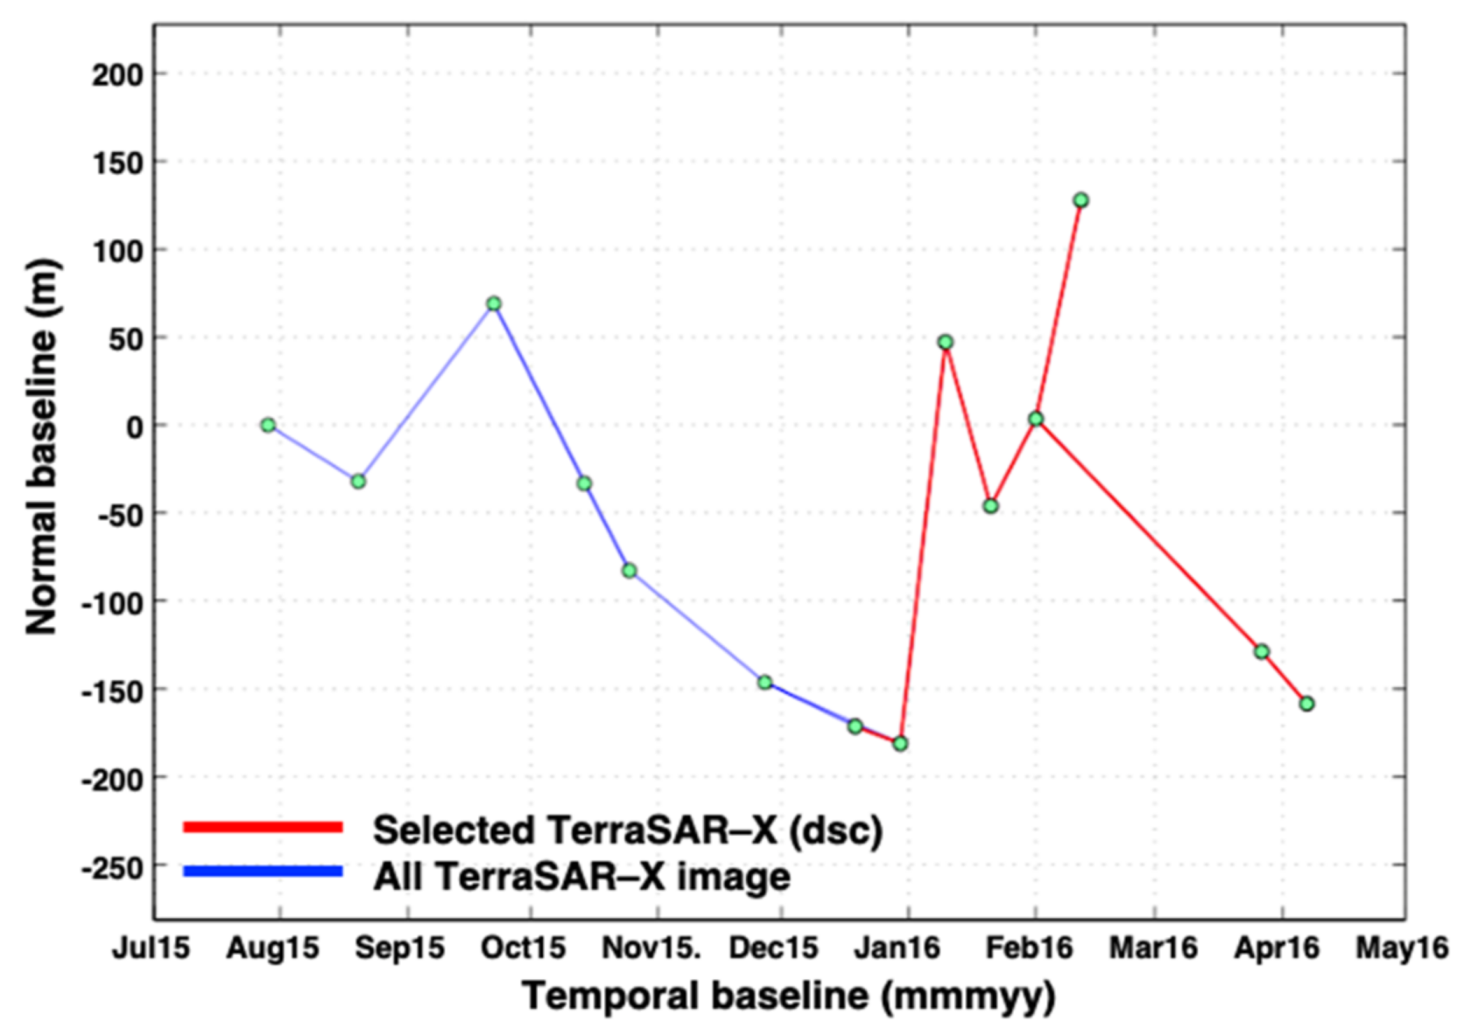
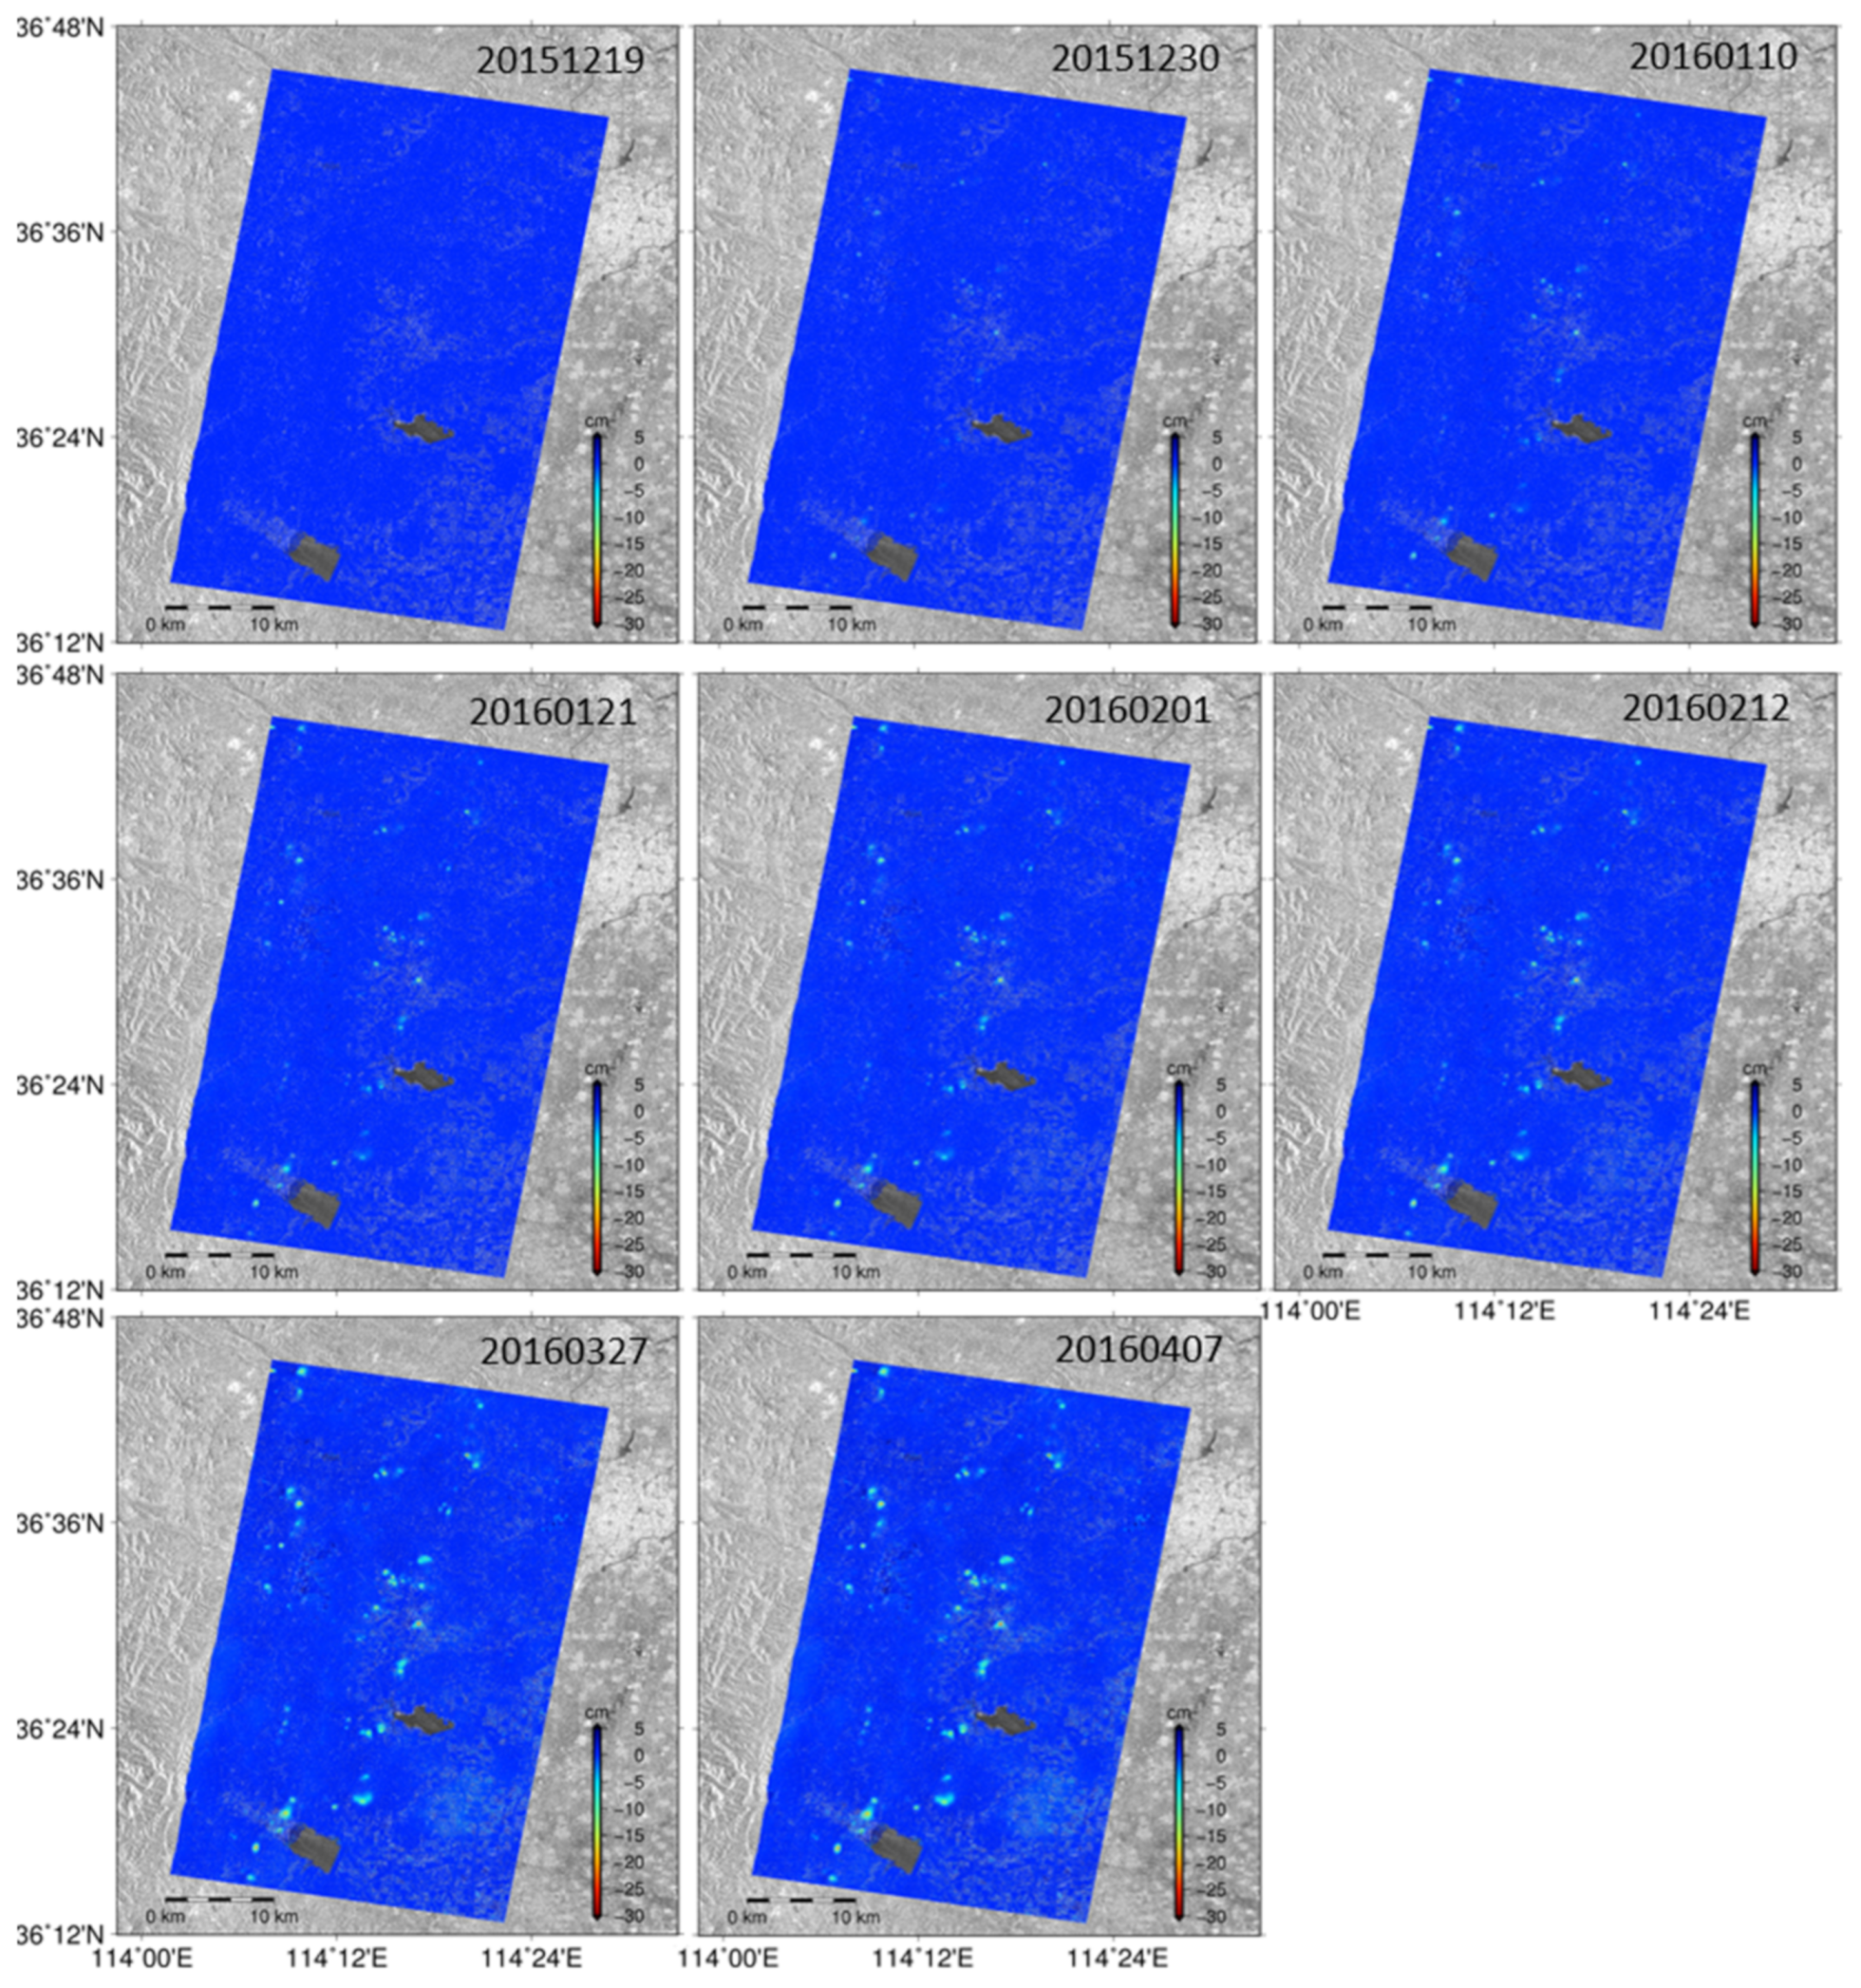
After the identification of the mining site, we used 14 TerraSAR-X images from June 2015 to April 2016 to estimate the ground deformation over the Fengfeng mining area. Thirteen interferograms with short baseline information were generated, as shown in Figure 5. The coherence maps of each segmentation area were used to select the high-quality interferograms for the MSBAS method, and some examples of coherence maps are given in Figure A1 of Appendix A. According to the coherence maps, the interferogram with 11-day and 22-day time intervals was more effective in monitoring mining deformation with dense vegetation. In addition, due to the heavy weather conditions shown in Figure A2, the surface crops may have changed rapidly during the observation period, leading the backscattering coefficient of the object to vary greatly, and some interferograms with short spatiotemporal baselines may still be affected. If interferograms with longer temporal baselines were included, we could not obtain many coherent pints in the central area of mines, due to the decorrelation caused by dense vegetation. Therefore, we have made corresponding adjustments to only use the data from December 2015 to April 2016 with mainly 11-day baseline interference pairs, to eliminate severe decorrelation in large areas. Seven interferograms with good phase quality were generated according to the spatiotemporal baseline in Figure 5 with a red network.
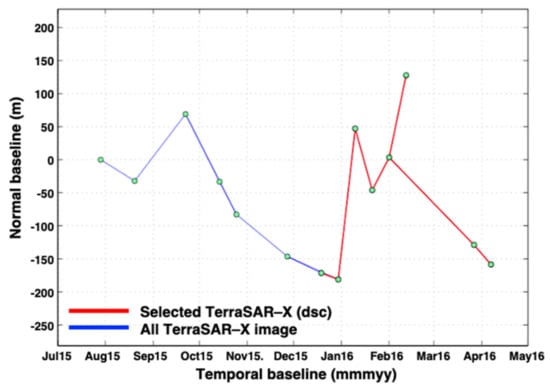
Figure 5.
The baseline configuration of the TerraSAR–X dataset.
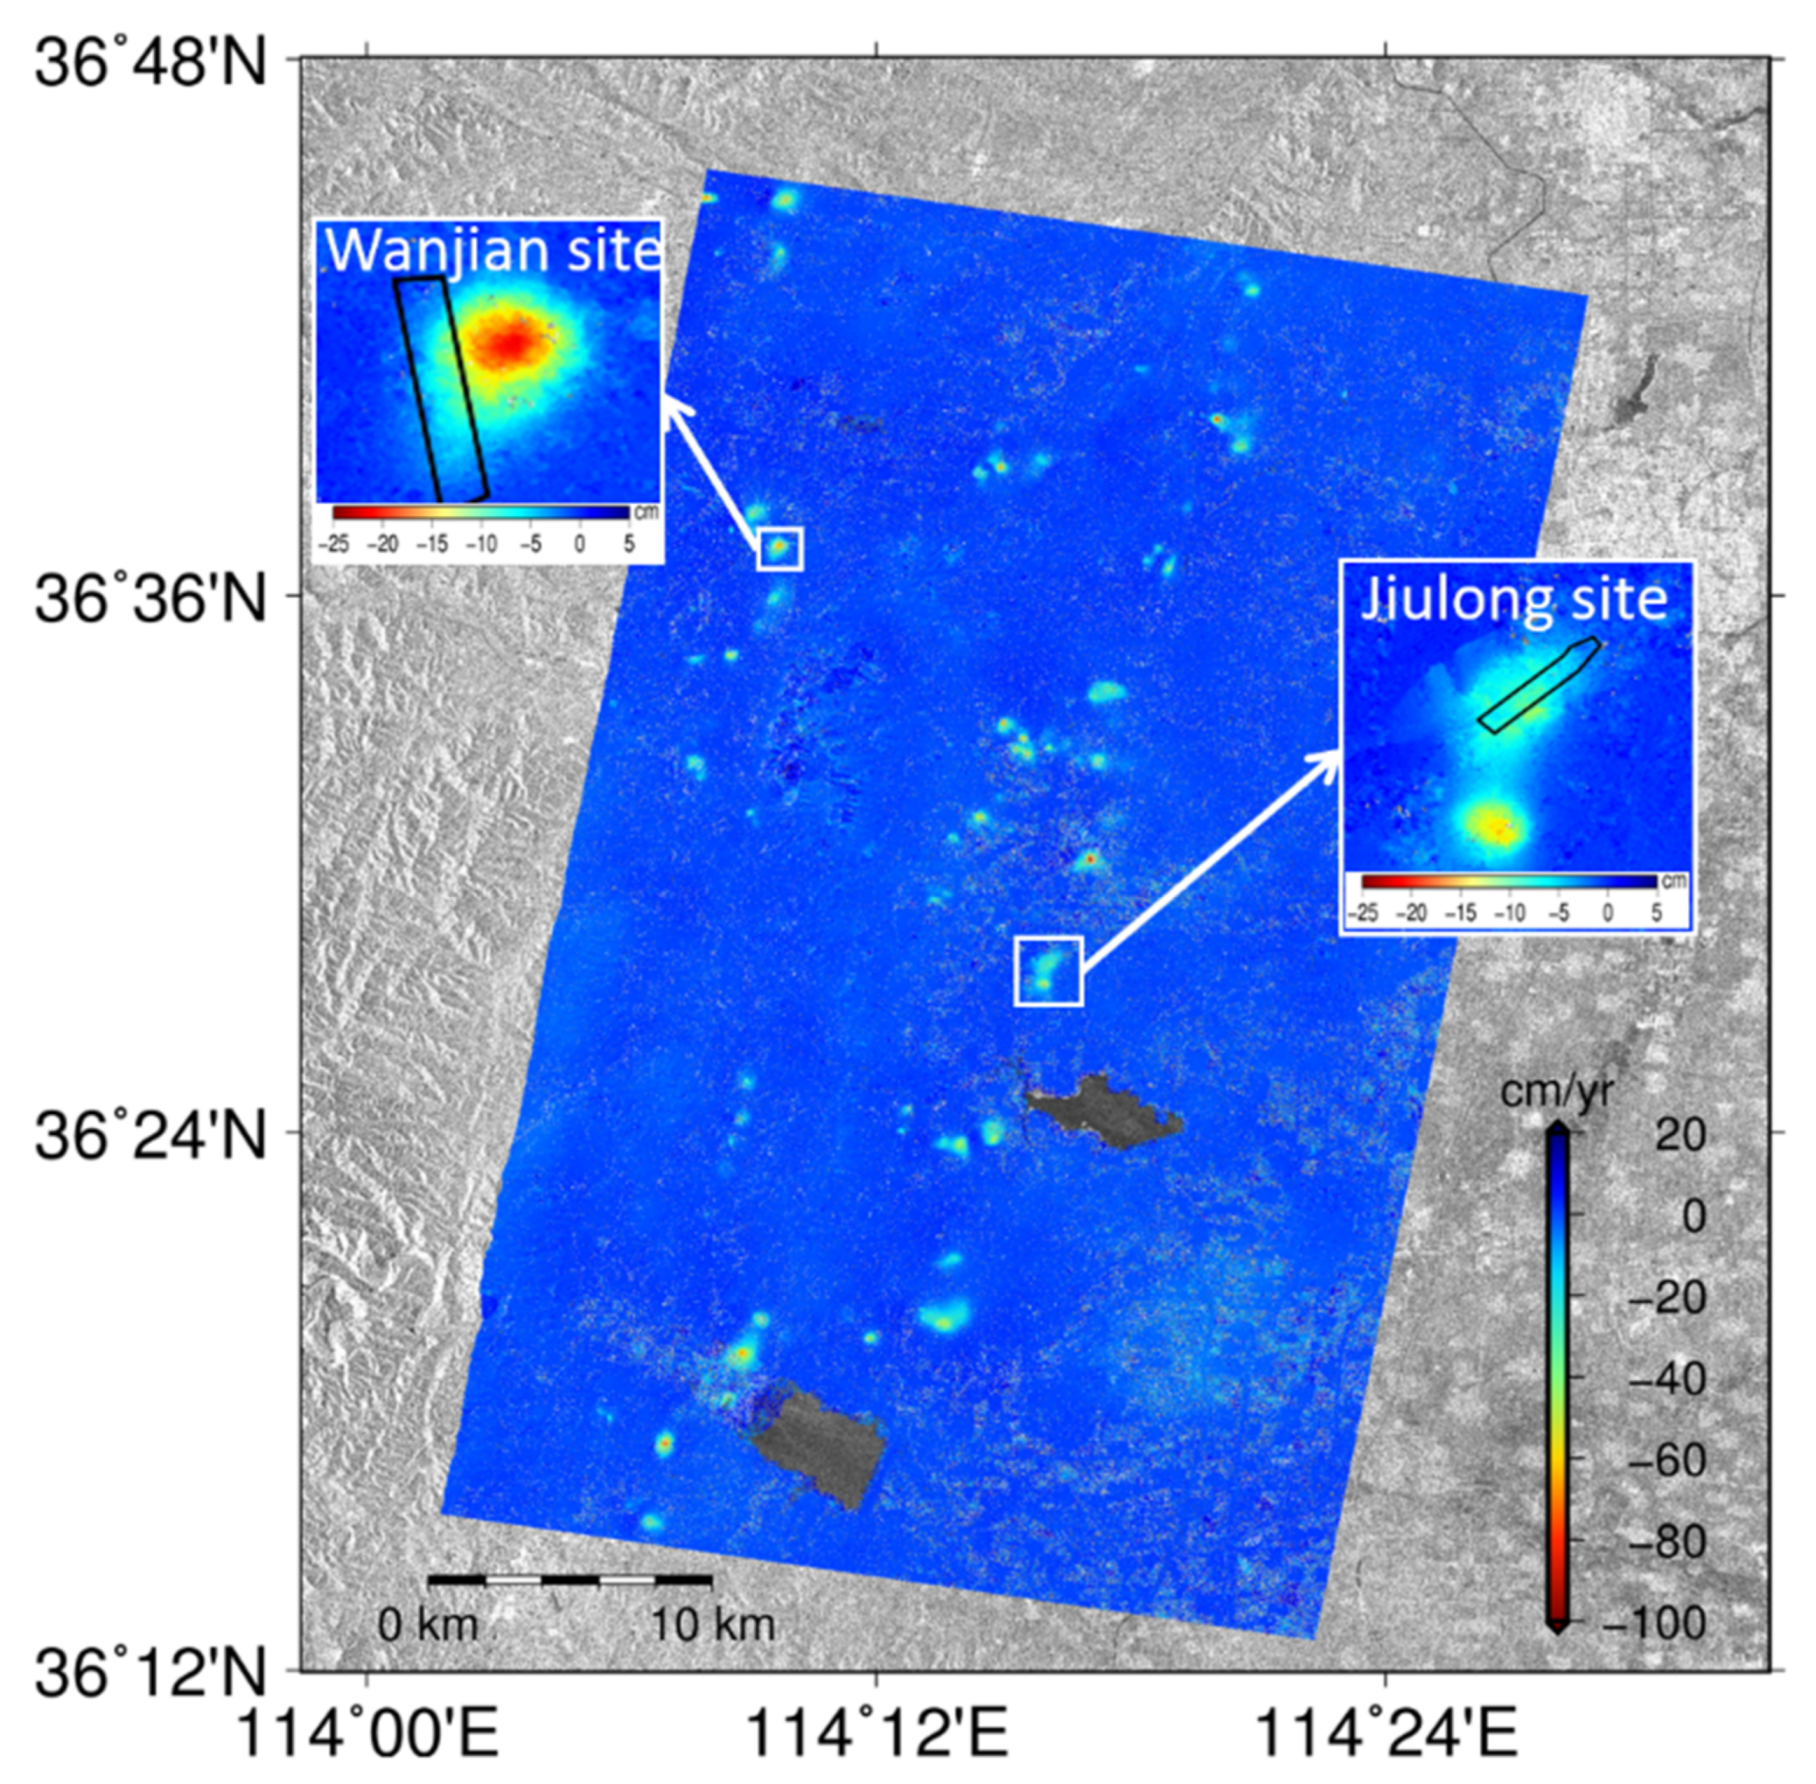
Since only the TerraSAR–X SAR dataset was used in this section, the SBAS method was used to retrieve the mining deformation. Figure 6 displays the LOS deformation velocity map of the investigated area. The whole area remained stable over the observed period, except for the significant mining deformation over the mine area. The mining deformation of five segmentation regions was well retrieved. Denser mining areas were identified separately, and the deformation boundary of two closer mining areas were also identified, indicating the applicability of the TerraSAR–X in mining deformation areas during the winter period. The maximum deformation among the mining sites reached approximately 100 cm/yr. Two mining sites, Wannian and Jiulong, are displayed in the subfigure of Figure 6. The maximum LOS deformations of these two sites were approximately 23 cm and 16 cm, respectively.
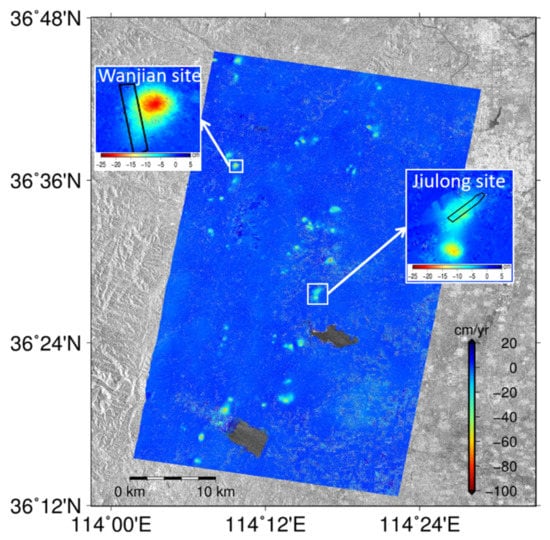
Figure 6.
The deformation velocity between December 2015 and April 2016 was estimated with TerraSAR–X data.
The time-series deformation of the Fengfeng mine is shown in Figure 7. During the observed period, all the mining sites suffered significant deformation, and the deformation of each mining site started at different moments, which indicates that mining activities were carried out in all mining areas during the observation period, and the scale of mining activities and working hours varied. The maximum LOS deformation related to mining activities was approximately 30 cm.

Figure 7.
The deformation time series between September 2015 and April 2016, estimated with TerraSAR–Xdata.
4.2. Deformation with Two SAR Platforms
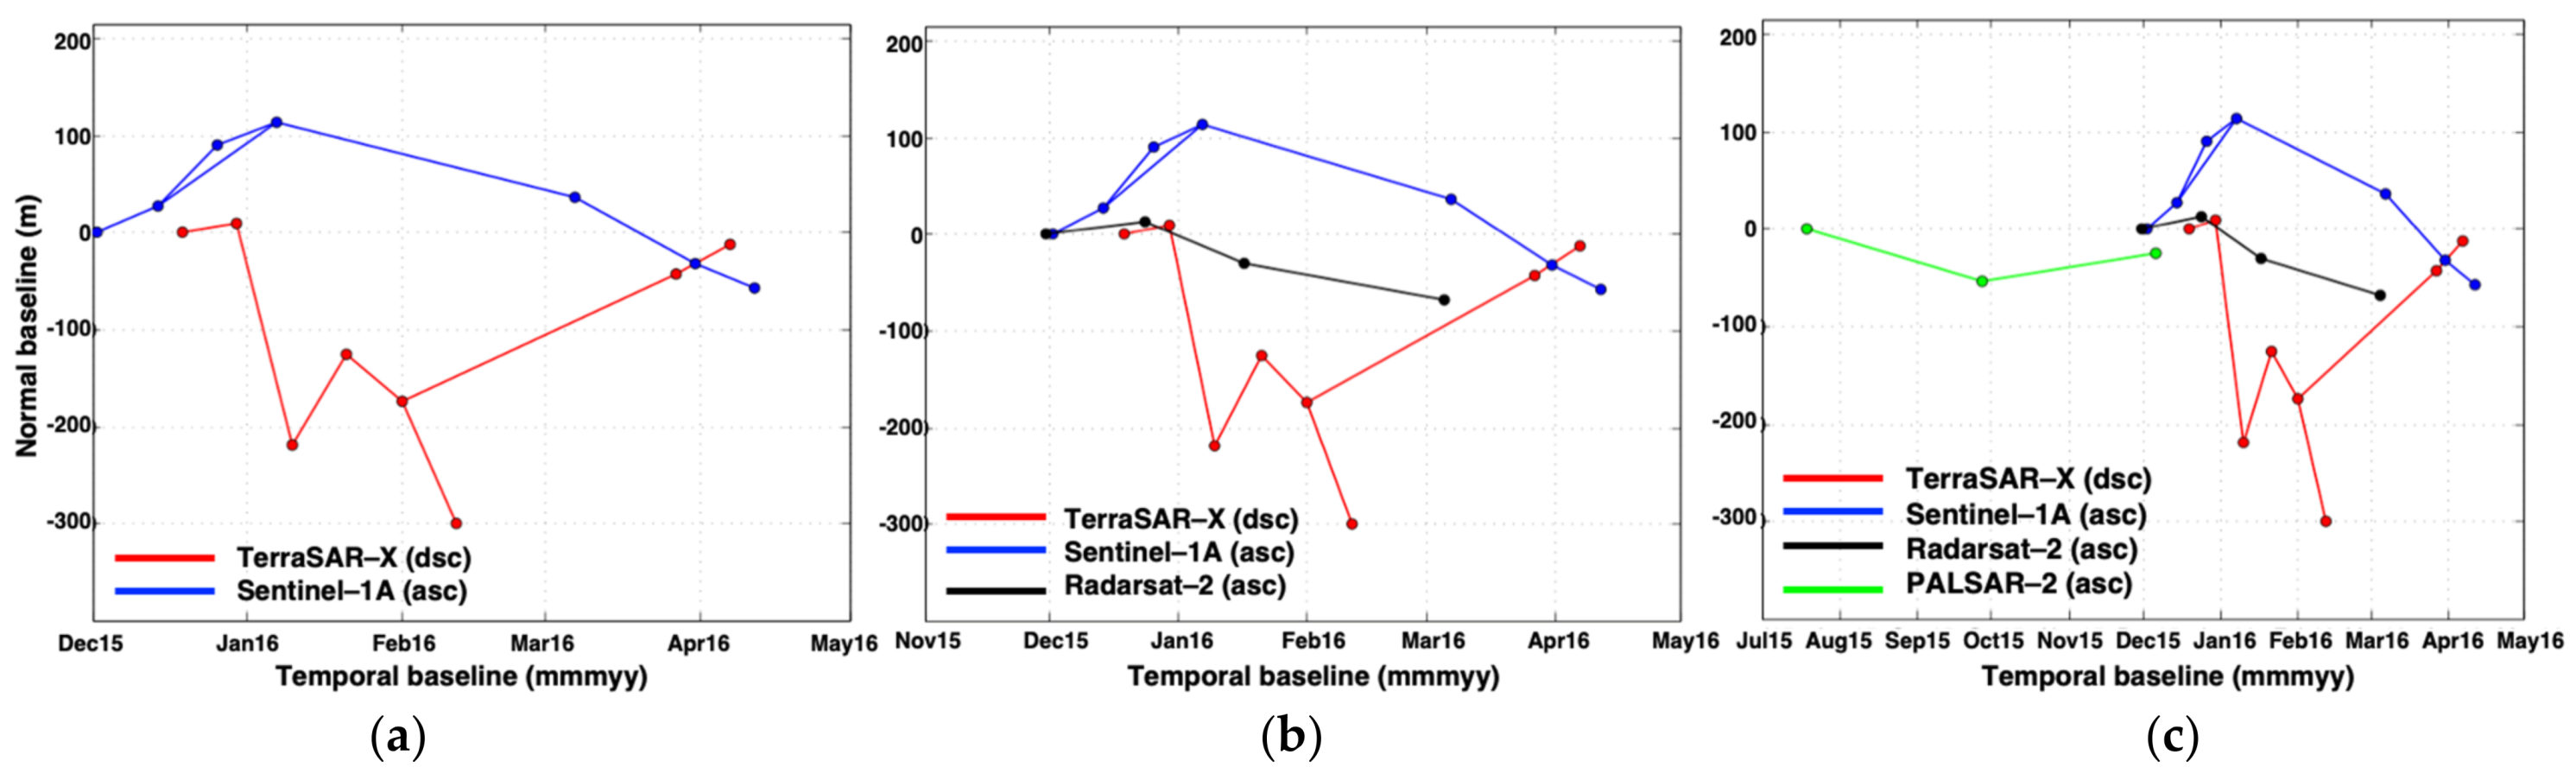
To retrieve the 2D displacement of the Fengfeng mine, the Sentinel-1A dataset from the ascending orbital direction between December 2015 and April 2016 was used for estimation, together with the TerraSAR–X dataset. The spatiotemporal baseline configuration of the two SAR datasets is shown in Figure 8a, in which the temporal baseline of both datasets was well matched. Thus, the MSBAS technique in Section 3.2 was used to retrieve the 2D mining displacement. Since the coverage of Sentinel-1A is larger than the coverage of TerraSAR–X, the common area of the displacement has the same coverage as the TerraSAR–X dataset. The retrieved 2D displacement of the Fengfeng mine is shown in Figure 9. The maximum accumulated subsidence in Figure 9a reached 33 cm during the observed period. Due to the surface subsidence of the mining area, the edges of the subsidence area collapsed toward the center area, resulting in a horizontal east-west displacement that moved to the center area. Therefore, each mining site suffered from not only subsidence but also horizontal displacement. Figure 9b shows that the relative horizontal displacement of the Fengfeng mining area reached a maximum of 20 cm. Since InSAR is insensitive to horizontal deformation in the north-south direction, the horizontal displacement corresponding to the north-south direction was difficult to retrieve.
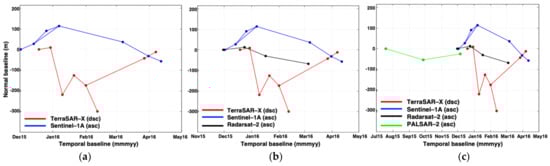
Figure 8.
The baseline configuration of (a) the TerraSAR–X and Sentinel-1A datasets, (b) the TerraSAR–X and Sentinel-1A datasets and Radarsat-2, and (c) the TerraSAR–X and Sentinel-1A datasets, Radarsat-2, and PALSAR-2.
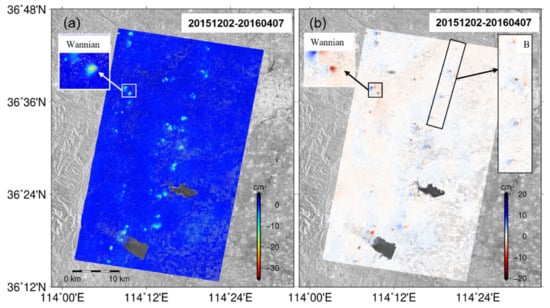
Figure 9.
(a) The subsidence map and (b) horizontal displacement map of the Fengfeng mine area with TerraSAR–X and Sentinel-1A from 20151219 to 20160407.
4.3. Deformation with Three SAR Platforms
Since Sentinel-1A is susceptible to the influence of the atmosphere, we added a set of Radarsat-2 images with the C-band to detect the corresponding 2D displacement results. The baseline configuration is displayed in Figure 8b. The coverage of Radarsat-2 could not fully cover TerraSAR–X data, as shown in Figure 2, and the 2D displacement of some research areas could not be retrieved. The final 2D displacement is shown in Figure 10. The maximum accumulated subsidence in Figure 10a reached 33 cm during the observed period. The vertical subsidence of the Wannian mining site was enlarged, and the horizontal displacement of the B mining region was more significant.
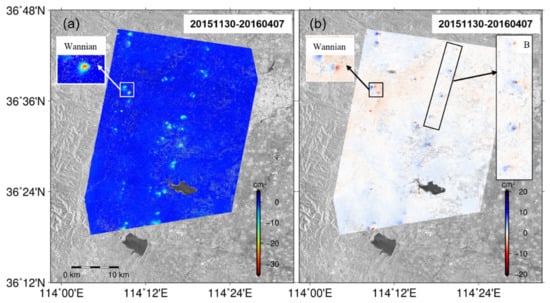
Figure 10.
(a) The subsidence map and (b) horizontal displacement map of the Fengfeng mine area with TSX, Sentinel-1A and Radarsat-2 from 20151219 to 20160407.
4.4. Deformation with All SAR Platforms
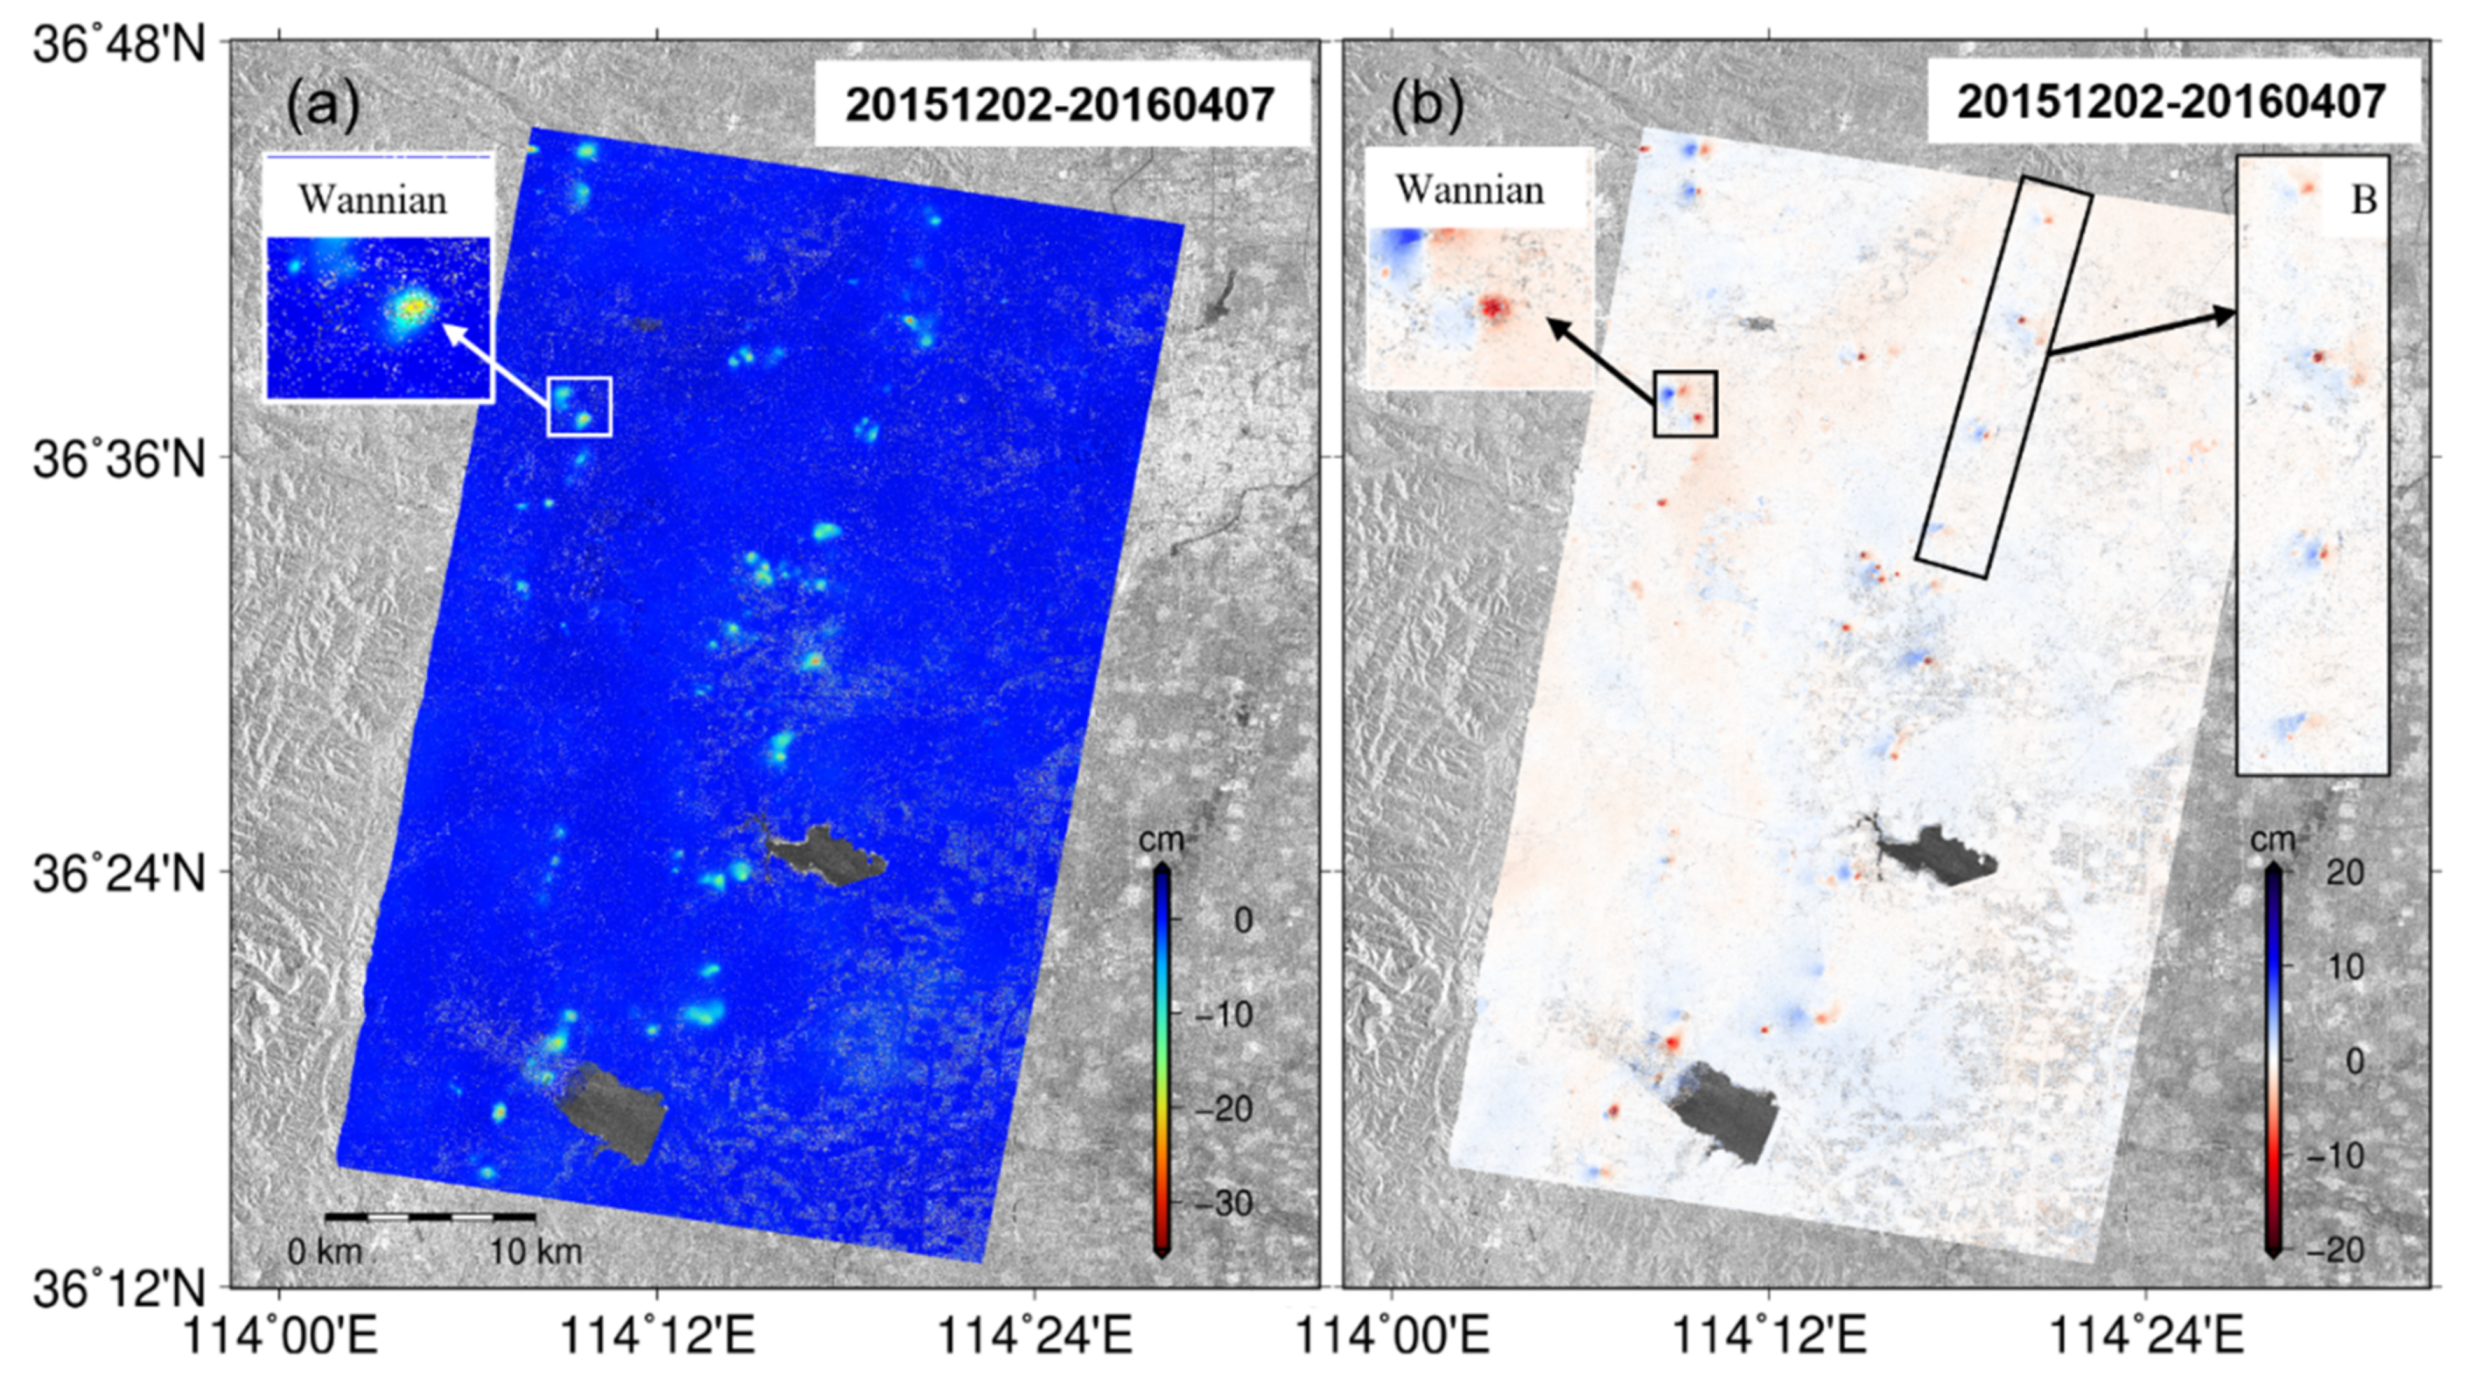
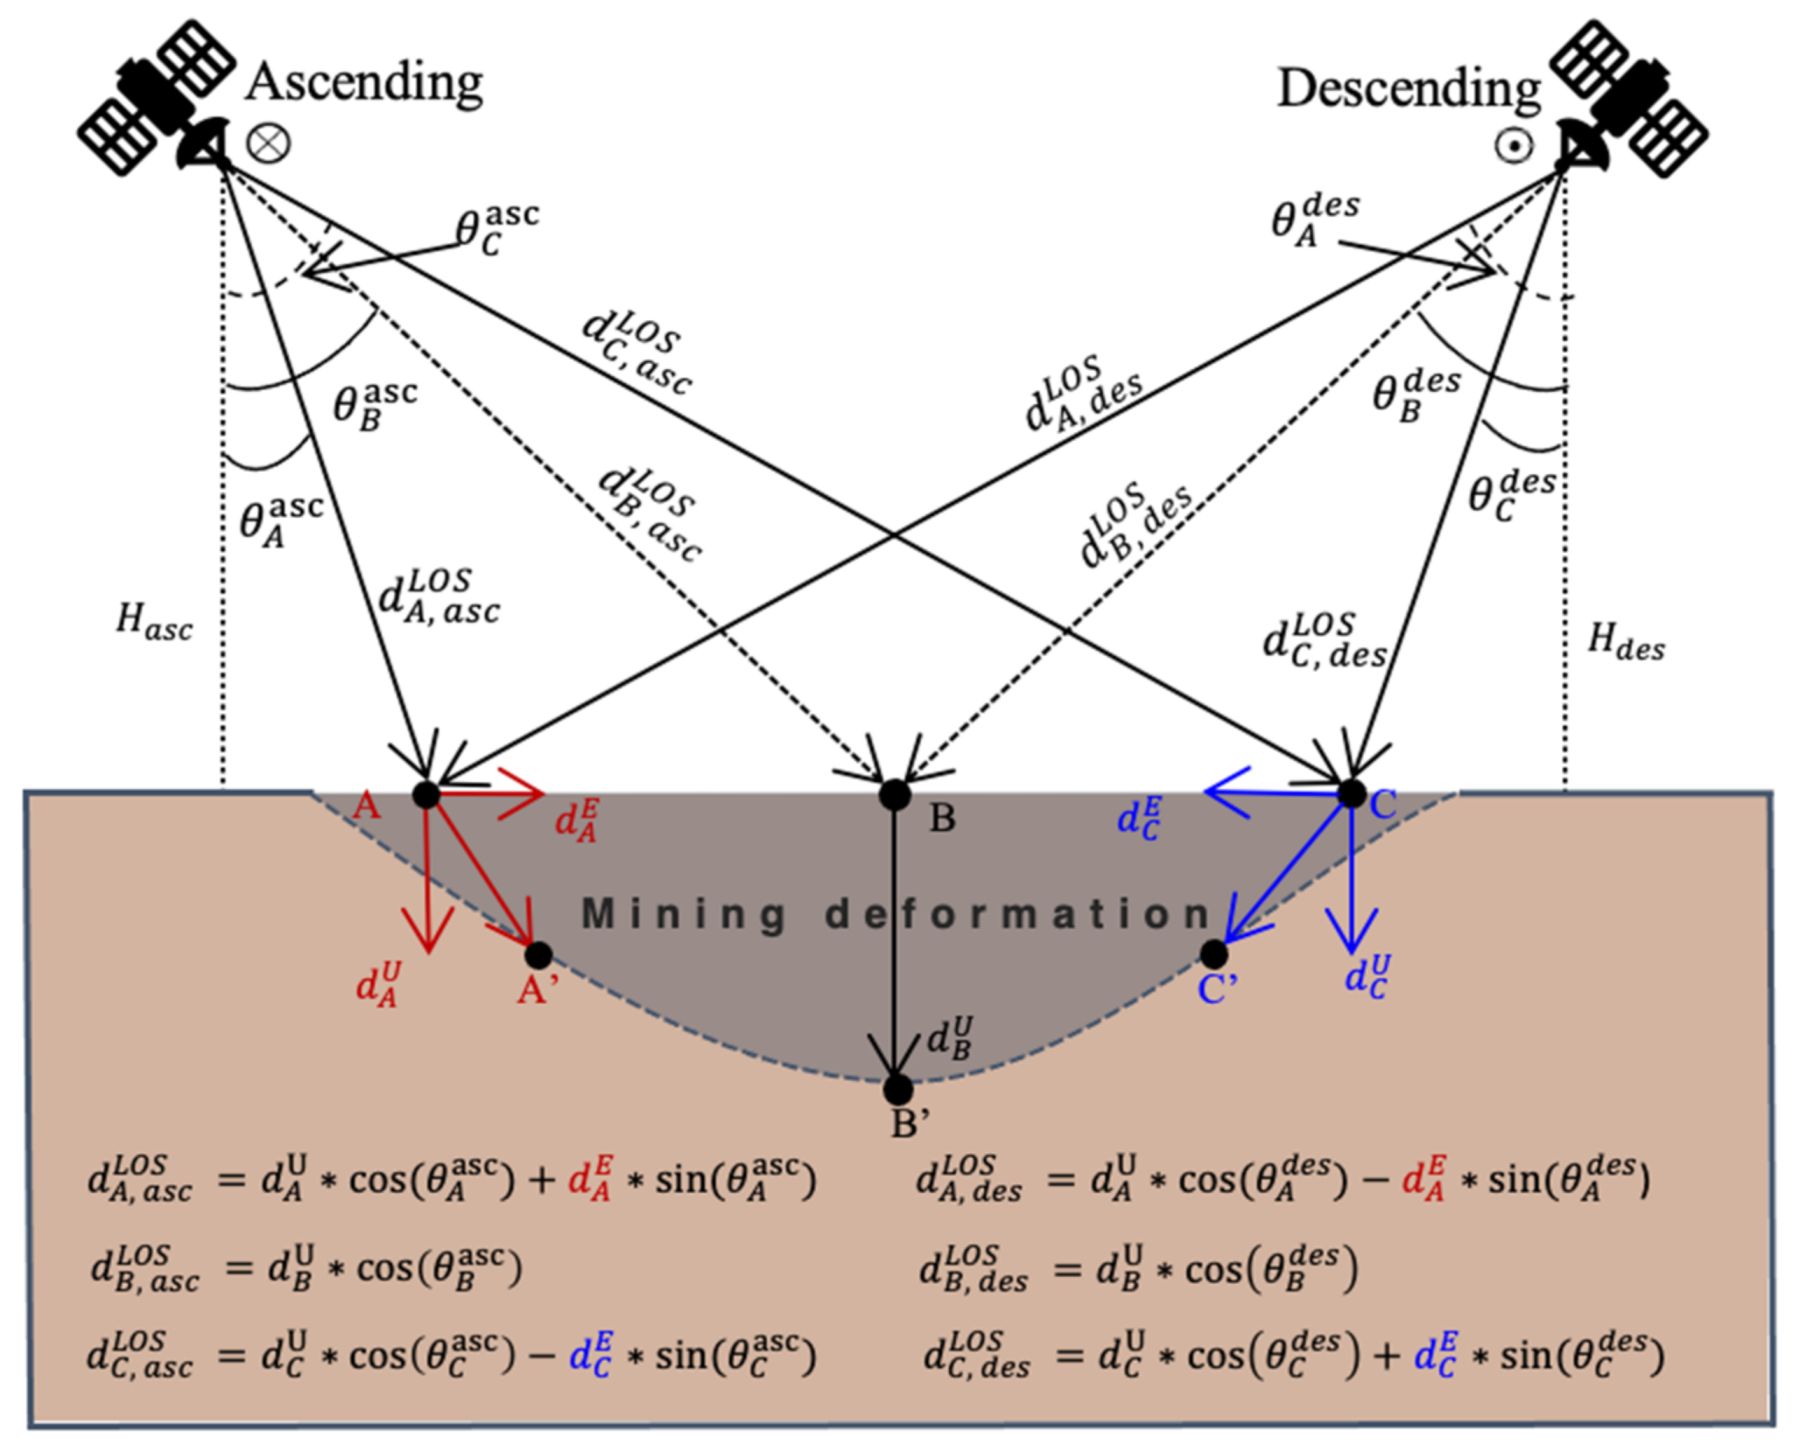
PALSAR-2 data use a long radar wavelength in L-band, and can penetrate part of the vegetation. We therefore used three available PALSAR-2 data to retrieve the mining deformation in the summer period, and extended the deformation time series for MSBAS. The ground deformation in mining areas often produced regional subsidence that funnel along its dig working face, as sketched in Figure 11. Largest vertical subsidence suffered in the regions near the center axis of the dig working face, while horizontal displacements of these regions was close to zero, as the results of the Wannian mining area show in Figure 9 and Figure 10. For ascending and descending orbital geometry, the horizontal deformation of the area near the mining center caused completely opposite effects, as shown by points A and C in the Figure 11. With multiplatform SAR images from opposite observed geometries in a common period, the influence on the combined deformation results will be weakened. Therefore, we ignored the horizontal displacement and converted all the LOS direction deformations into vertical, to solve the longer time series of mining subsidence.

Figure 11.
Schematic diagram of mining deformation monitoring with multiplatform SAR from ascending and descending orbital directions.
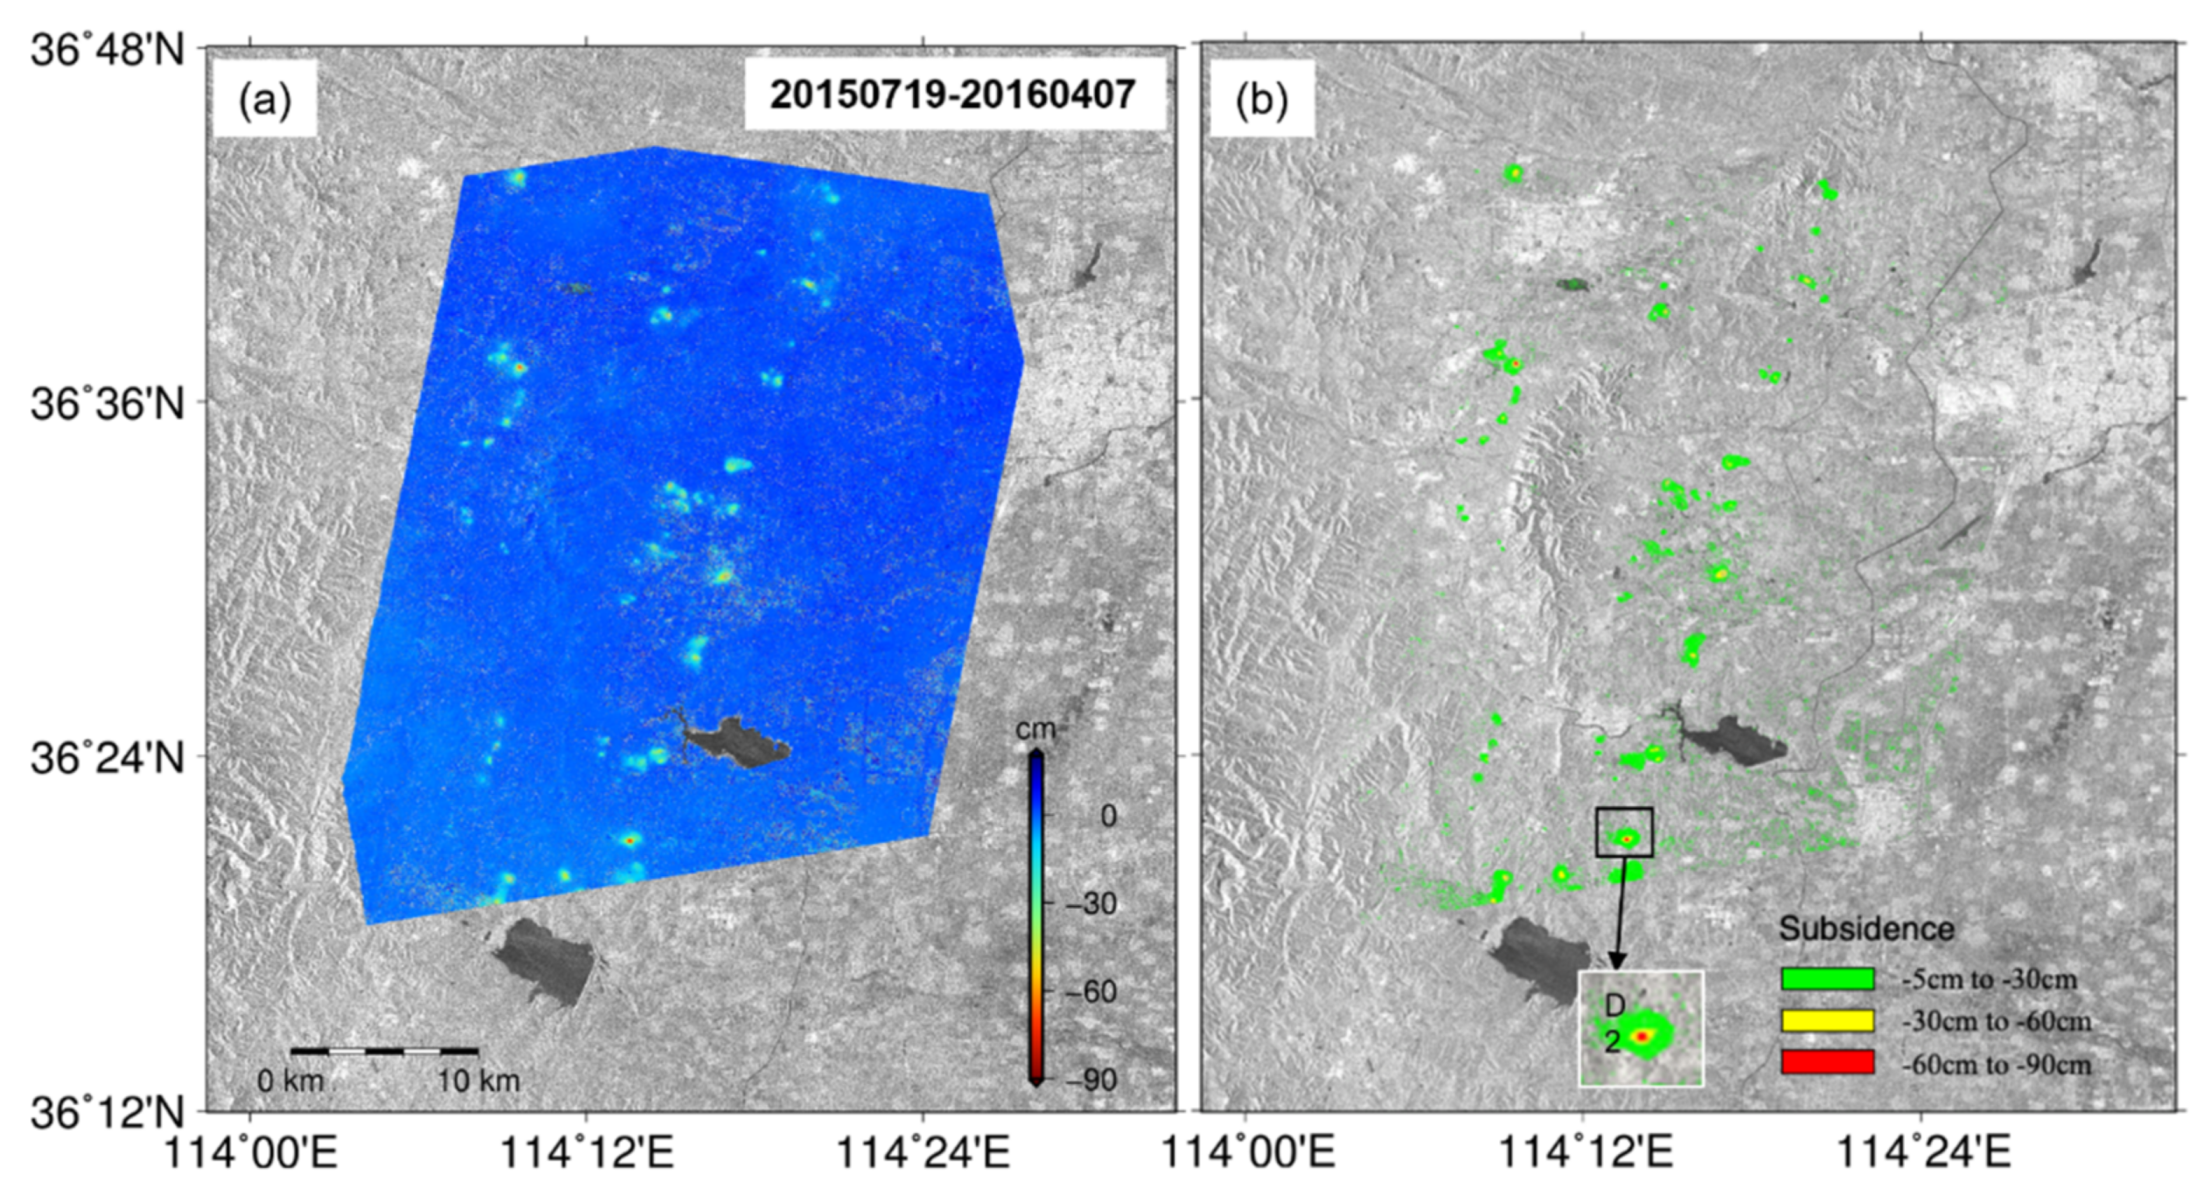
The subsidence of the Fengfeng mine from July 2015 to April 2016 is shown in Figure 12a. Due to the difference between the coverage of each SAR dataset, the deformation map was reshaped again. The subsidence of most of the Fengfeng mining regions was retrieved, and the maximum subsidence was approximately 90 cm. The subsidence map larger than 5 cm is displayed in Figure 12b. In total, 36 deformed mining sites were revealed, and their time-series subsidence is shown in Figure A3 and Figure A4 of the Appendix A. The maximum subsidence of each mining site is listed in Table A2 of the Appendix A. The maximum subsidence occurred in the D2 mining region and reached 88.8 cm. The ground coverage of the subsidence with different intervals is listed in Table A2. Compared with the official report investigation in 2016 [37], the deformation areas from the InSAR results were larger than the report provided by the government, indicating that the subsidence area has increased, due to underground mining activities. It also demonstrated the usability of the InSAR method in the mining area with denser vegetation coverage.

Figure 12.
(a) Vertical deformation of the Fengfeng mining area from 20150719 to 20160407. (b) The subsidence of mining sites larger than 5 cm.
5. Discussion
5.1. Accuracy Validation
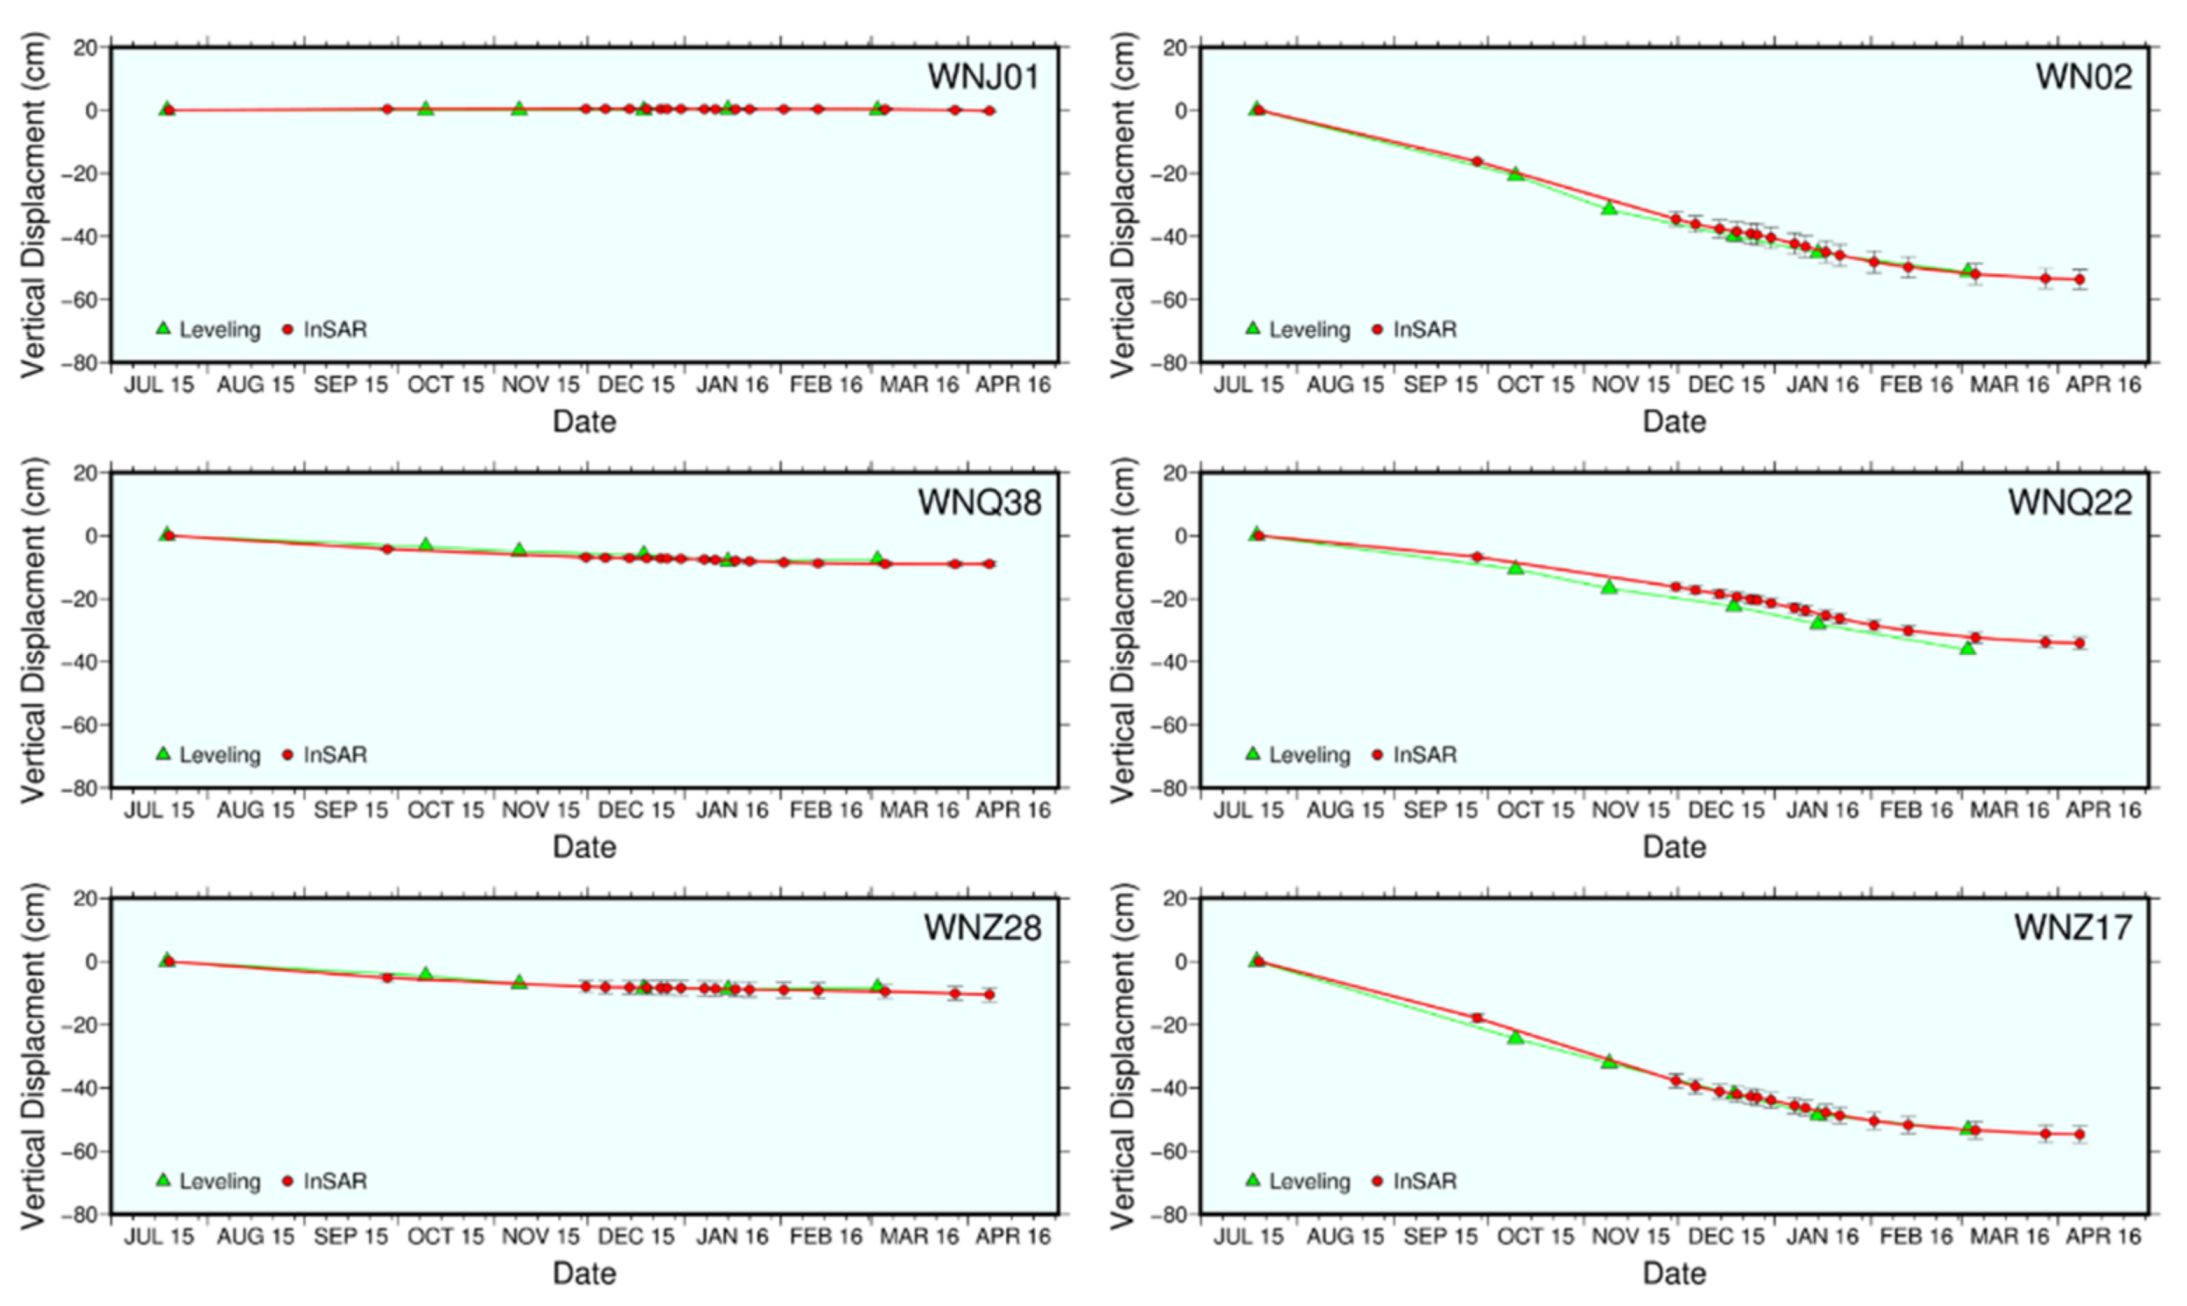
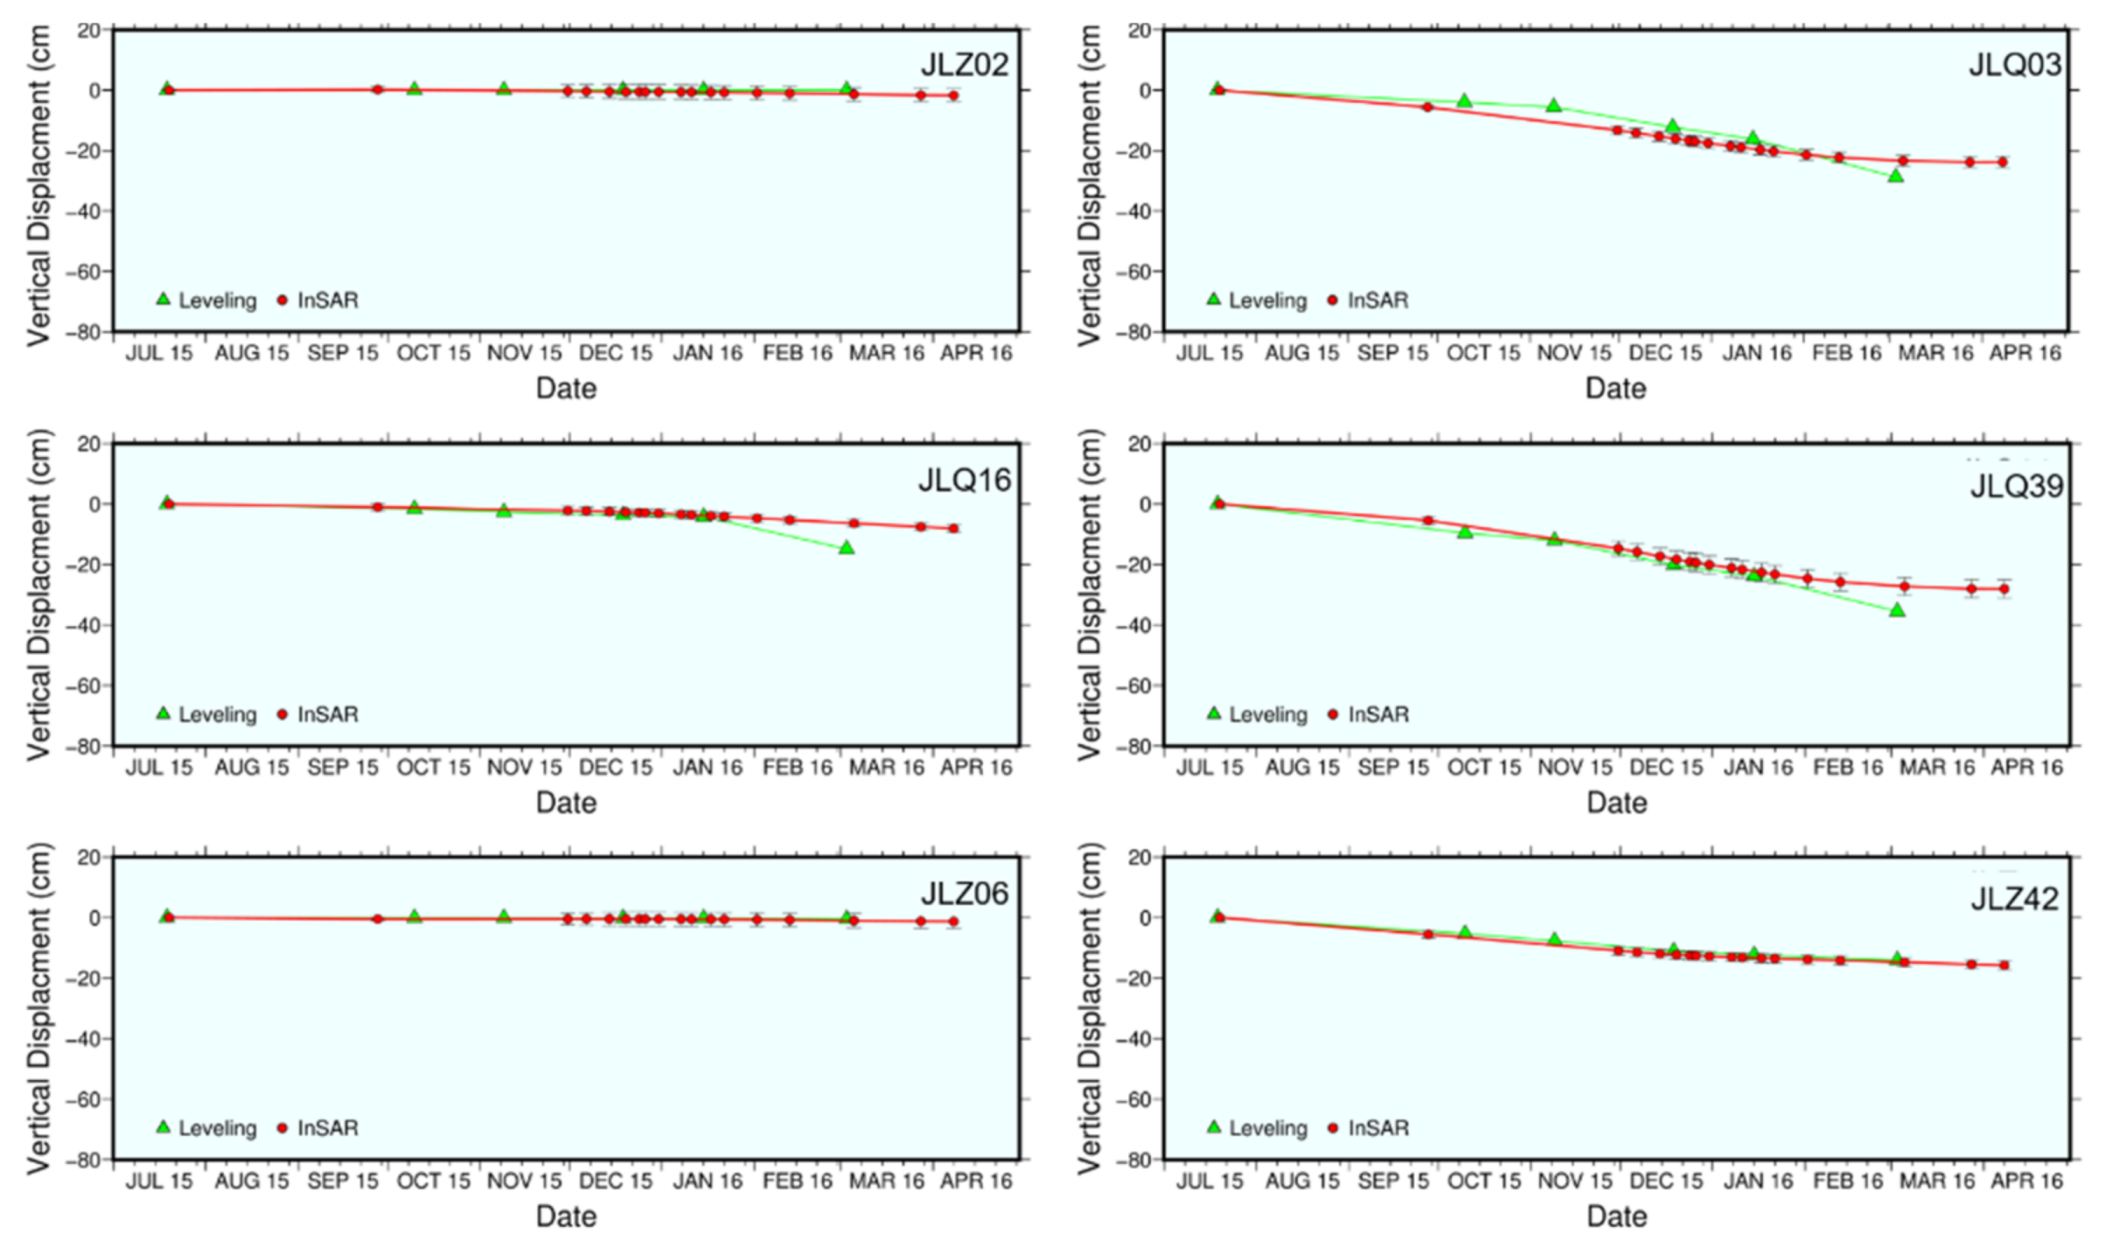
We used the subsidence results of ground leveling measurements at two mining sites, Wanjian and Jiulong Mines, to validate the results derived from the multiplatform SAR datasets. The location of the leveling points is shown with the white dots on in Figure 13. The path of the leveling stations was along the side part of the mining area, to obtain ground subsidence. We compared the time-series subsidence between the MSBAS-derived results and the leveling on twelve selected points, which were distributed uniformly over the mining area, as labeled in Figure 13. Because the resolution of the MSBAS-derived results depends on the common reference grid of the multiplatform SAR dataset, we selected MSBAS measurements with distances to leveling stations smaller than 100 m, to compare with the leveling data of the two sites. All qualified MSBAS measurements were used to calculate the uncertainty and are displayed in Figure 14 and Figure 15. The results of MSBAS agreed well with the leveling measurements. The differences between them might relate to the uncertainty of the atmospheric delays, decorrelation effect, and differences in location and time between the InSAR and leveling data, such as the unmatched data in the last period of the two leveling stations at the Jiulong site, i.e., JL03 and JLQ39.
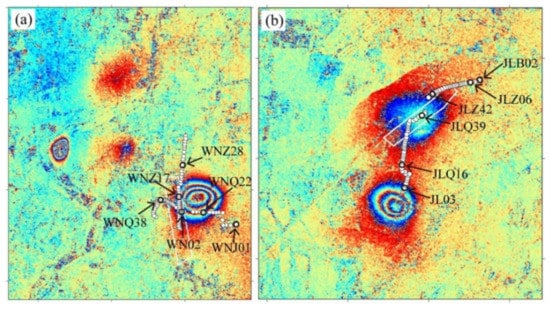
Figure 13.
The distribution of the leveling stations marked with white dots of the (a) Wannian site and (b) Jiulong site. The background is one of the wrapped TerraSAR–X interferograms.
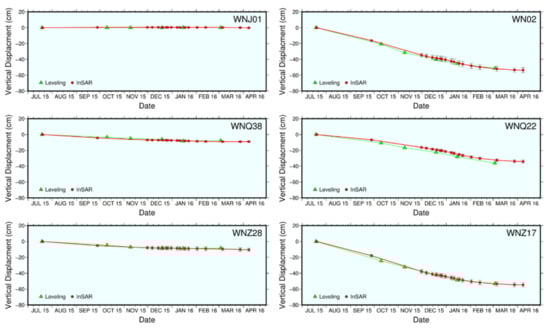
Figure 14.
Comparison of time-series subsidence between leveling data and MSBAS results at the selected points of the Wannian site.
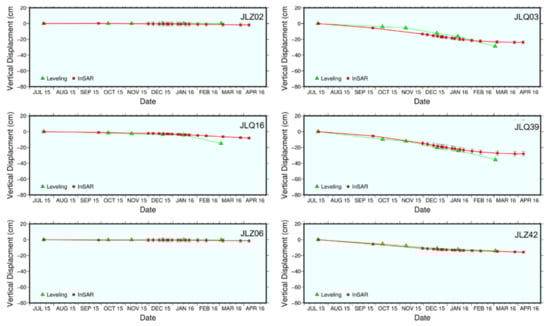
Figure 15.
Comparison of time-series subsidence between leveling data and MSBAS results at the selected points of the Jiulong site.
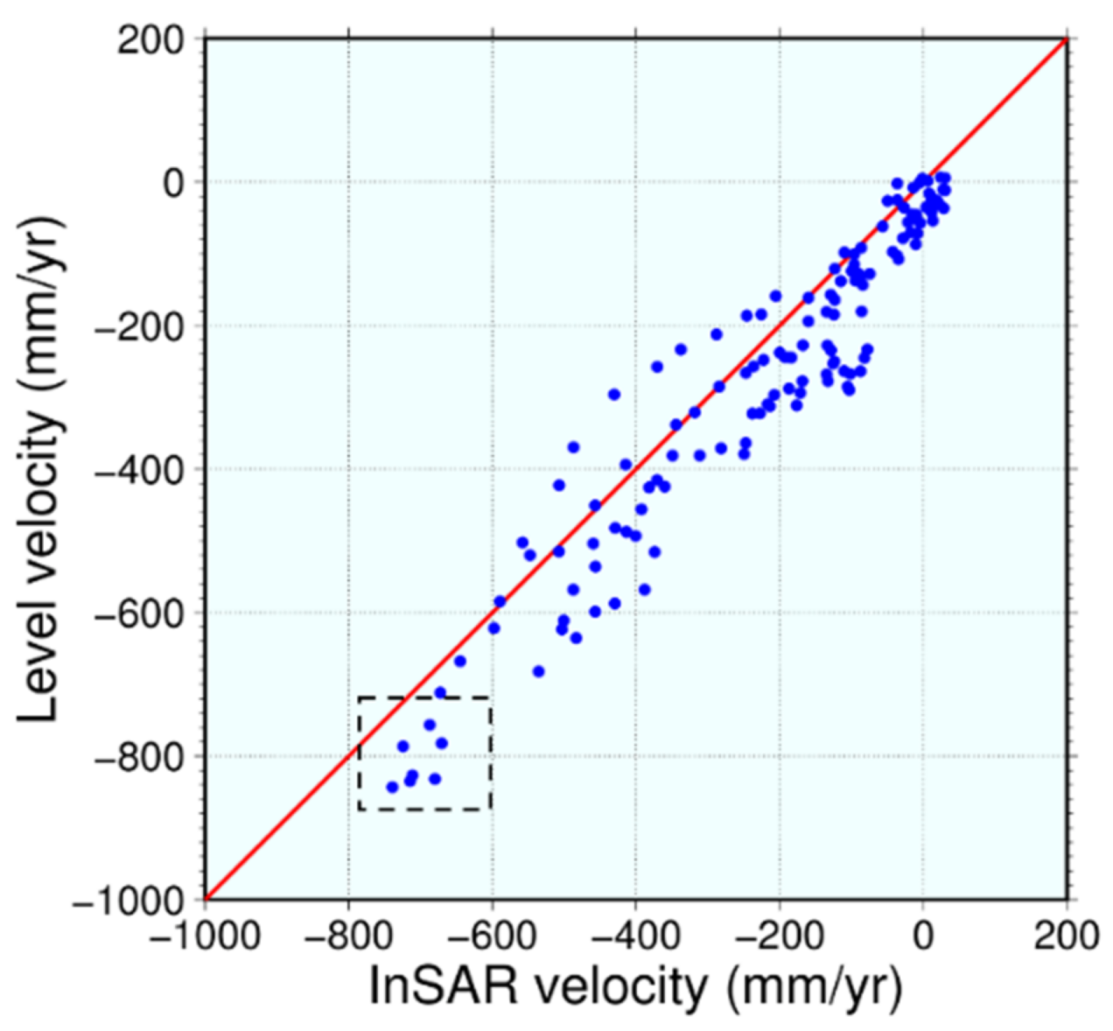
Since the date of the acquisition of leveling and the SAR images were quite different, it was difficult to compare the exact value between them, thus, the deformation velocity was used to make the cross validation. We therefore calculated the subsidence velocity with the leveling data. The points of MSBAS measurements with a distance smaller than 100 m were compared with the leveling data, to reduce the effect of the shift in geolocation. Figure 16 gives the scatterplots between the leveling and the results of InSAR at the two mining sites. The corresponding RMSE is 83.51 mm/year. Due to the limited number of interferograms used in retrieving the deformation, the RMSE between InSAR and leveling results is a little bit large. This value could be further reduced if more high-quality interferograms with short temporal baseline can be obtained from multiplatform SAR, however, it is difficult for the monitoring scenario like the region in this study with the state-of-the-art SAR missions. The significant difference of leveling stations that is framed with a dashed black rectangle, may be caused by the large gradient deformation in the center of the mining site that is leading to the unwrapping error [3]. According to the presented studies in [4,38], it has been suggested that the accuracy of mining subsidence measured by InSAR are from millimeters to few centimeters. Therefore, the accuracy of mining deformation detected by the MSBAS and multiplatform SAR datasets is acceptable for this study.

Figure 16.
Comparison of the subsidence velocity between the MSBAS-InSAR results and the leveling measurements at the two mining sites of Jiulong and Wannian.
5.2. Advantages of Multiplatform SAR Data in Mining Deformation Monitoring
Because mining areas are often located in rural areas covered with dense vegetation, ground coverage, extreme weather, and large gradients of deformation will raise the decorrelation of InSAR interferograms and lead to incomplete spatial coverage with information gaps for mining deformation monitoring. It is worth noting from this study that the L-band PALSAR-2 data were effective for mining deformation monitoring, even in summer, and pairs with long baselines can be included in the interferometric analysis; therefore, it would be good to use the L-band data for mining deformation monitoring. However, the revisit period (i.e., from 40 to 90 days) of PALSAR-2 is too long to achieve enough temporal samples of the deformation for further analysis of the mechanism of mining activities. The objective of our contribution was to show that important improvements to these limitations are still possible. In denser vegetation areas, the mining deformation can be retrieved by properly selecting the high-quality interferograms from multiplatform SAR datasets. The fusion processing of multiplatform data can not only obtain the vertical subsidence of the mining area but also obtain the horizontal displacement. Meanwhile, a more satisfactory coverage of spatial monitoring and the increased temporal sampling of the deformation can be obtained, compared with the single SAR platform dataset.
6. Conclusions
Deformation associated with mining activities is usually difficult to precisely monitor in regard to both time and space because of the diverse topography, large-gradient ground subsidence, and dense vegetation coverage. These problems possibly result in decorrelation in InSAR, and therefore limit the application of InSAR in mining areas. In this study, we used multiplatform SAR data and MSBAS technique to monitor mining deformation over the Fengfeng mining area, China, from July 2015 to April 2016. The derived results indicated that the Fengfeng mining area experienced serious ground subsidence caused by mining activities during the observed period. The largest subsidence reached 88.8 cm. Joint analysis of the InSAR-derived subsidence and the ground true leveling data proved the high accuracy of the MSBAS results. The study suggests that using multiplatform SAR datasets helps to retrieve the ground deformation in mining areas with dense vegetation.
Author Contributions
Conceptualization, B.Z., S.W. and C.W.; methodology, B.Z.; software, B.Z. and S.W.; validation, B.Z. and S.W.; formal analysis, S.W., B.Z. and X.D.; investigation, C.W.; resources, B.Z. and X.D.; data curation, B.Z. and S.W.; writing—original draft preparation, S.W. and B.Z.; writing—review and editing, S.W. and B.Z.; supervision, S.W., X.D., J.Z. and Q.L.; project administration, B.Z. and X.D.; funding acquisition, B.Z. and X.D. All authors have read and agreed to the published version of the manuscript.
Funding
This research was supported the National Key Research and Development Program of China (2018YFB2101005), the Guangdong Basic and Applied Basic Research Foundation (No. 2021A1515011427), the Research Grants Council (RGC) of Hong Kong (PolyU 152232/17E, PolyU 152164/18E, and PolyU 15223319/19E), the Research Institute for Sustainable Urban Development (RISUD) (1-BBWB), the National Natural Science Foundation of China (41974006), the Shenzhen Scientific Research and Development Funding Program (JCYJ20200807110745001, KQJSCX20180328093453763, and JCYJ20180305125101282), the Research Program from the Department of Education of Guangdong Province (grant No. 2018KTSCX196), and the National Administration of Surveying, Mapping and Geoinformation of China (Grant 201412016).
Data Availability Statement
Not applicable.
Acknowledgments
The authors would like to thank the DLR for providing the TerraSAR-X dataset under the science proposal LAN2979 and GEO3603, and the ESA/Copernicus for providing the Sentinel-1A SAR images, respectively. The Radarsat-2 was from CSA. The PALSAR-2 was provided by the JAXA under the science proposal PI3380. The authors would like to thank the China University of Mining and Technology for providing leveling data. The authors would also like to thank the anonymous reviewers for their constructive comments and suggestions.
Conflicts of Interest
The authors declare no conflict of interest.
Appendix A
This appendix has shown the details and data supplemental to the main text.
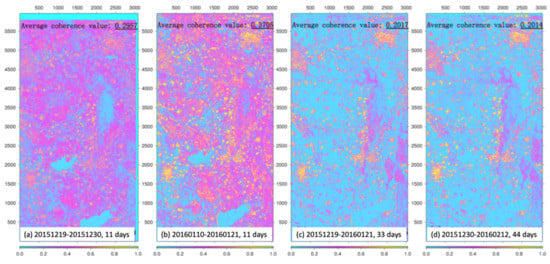
Figure A1.
The examples of the coherence maps of TSX datasets.
Figure A1.
The examples of the coherence maps of TSX datasets.
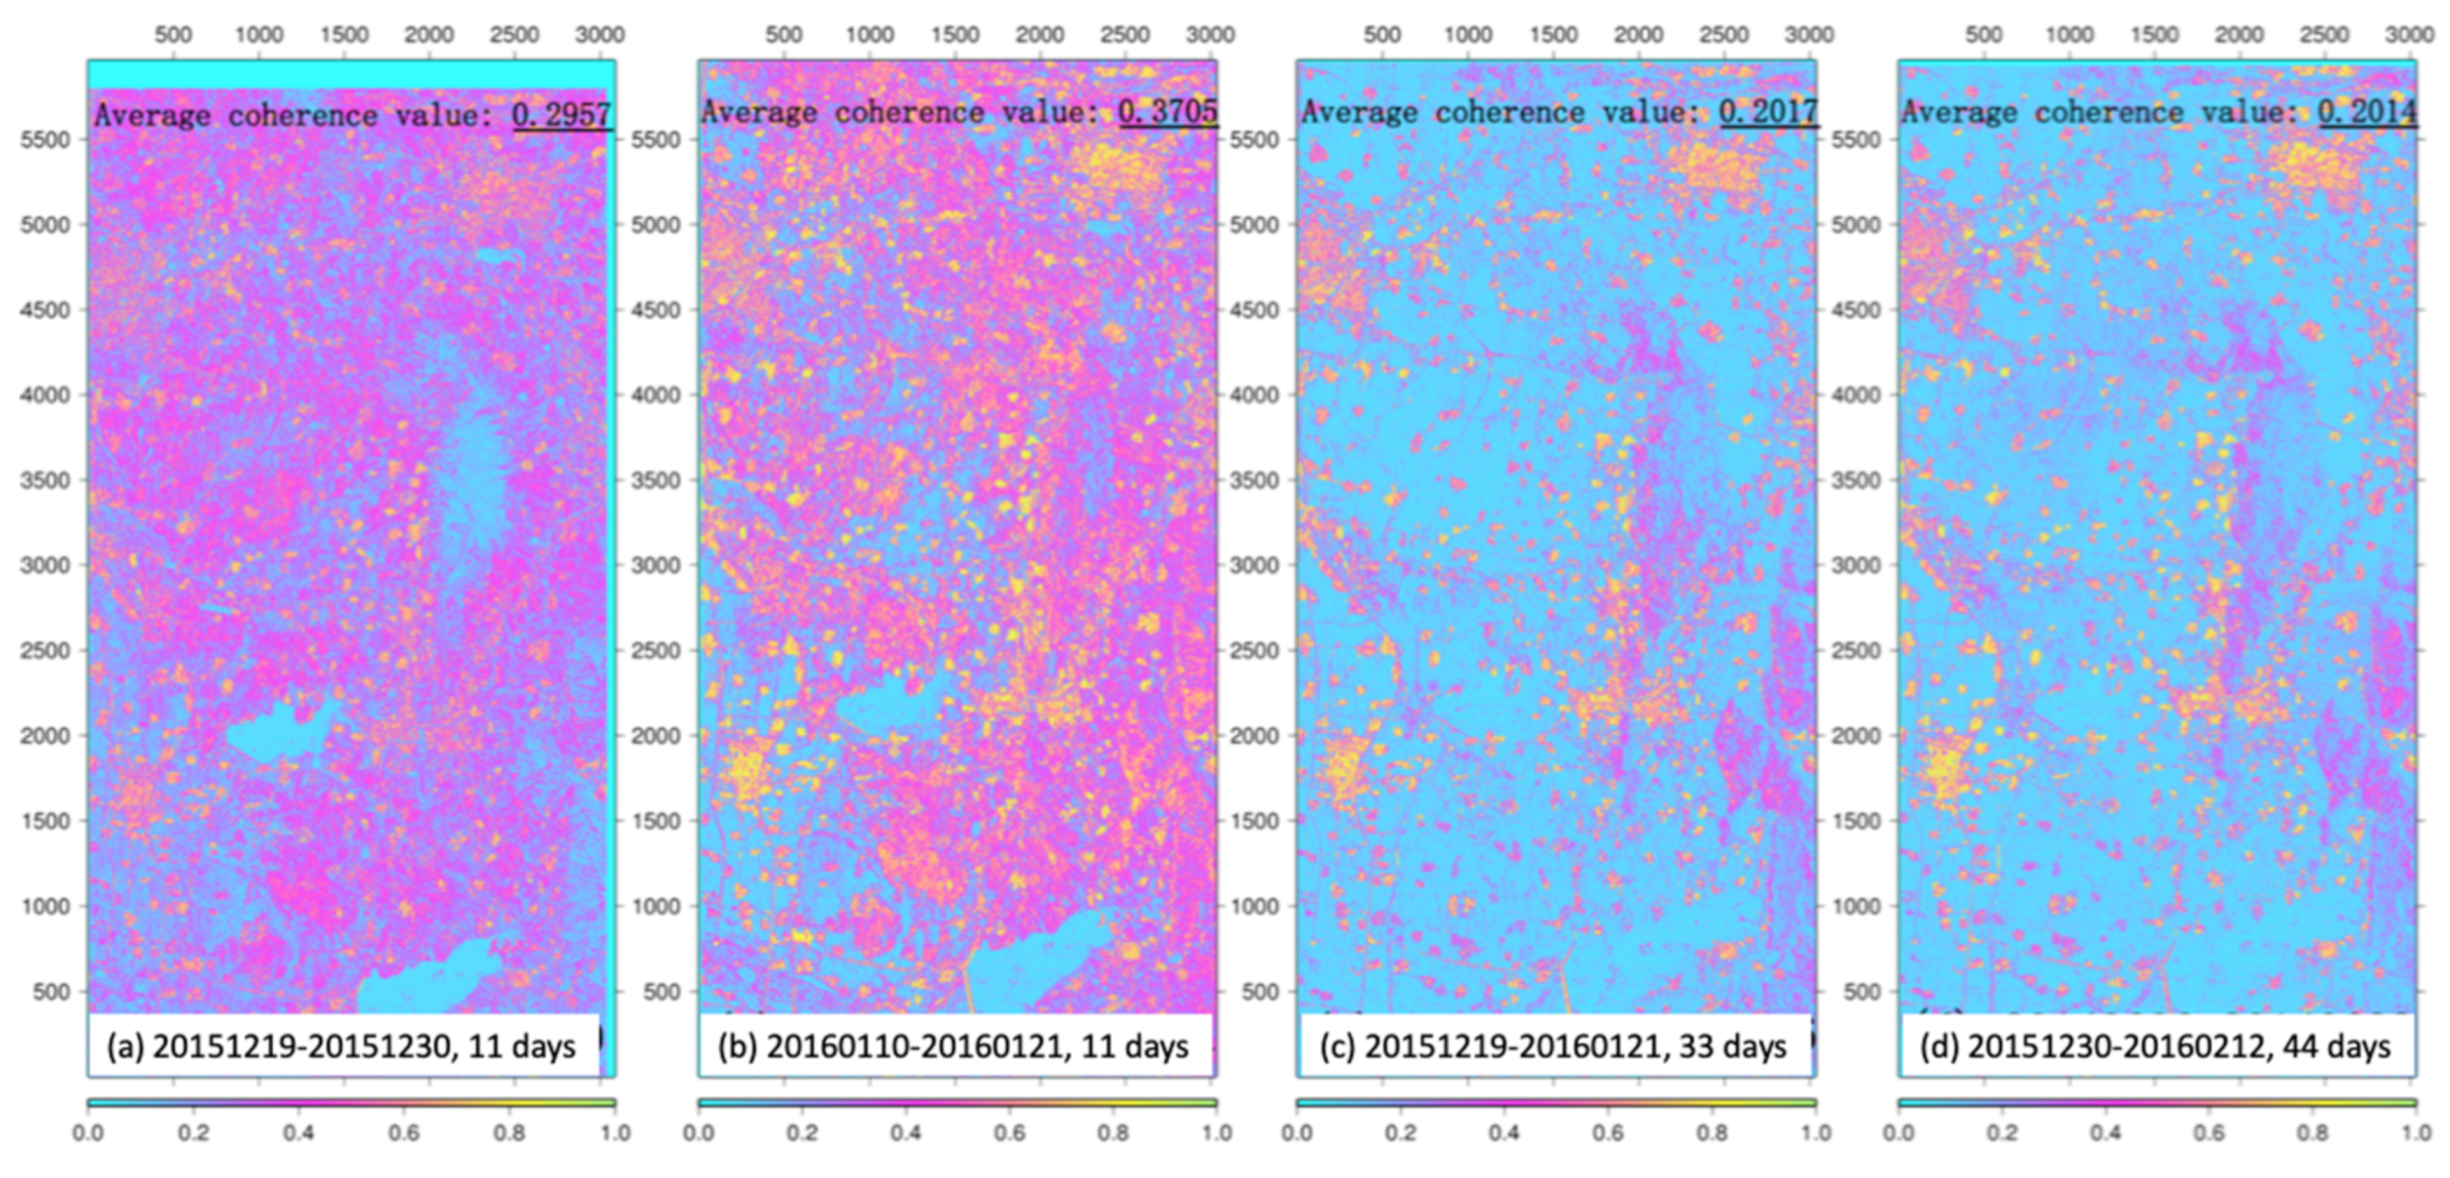

Figure A2.
The examples of the weather condition on three TSX acquisition dates i.e., 20150729, 20150820, and 20160201.
Figure A2.
The examples of the weather condition on three TSX acquisition dates i.e., 20150729, 20150820, and 20160201.
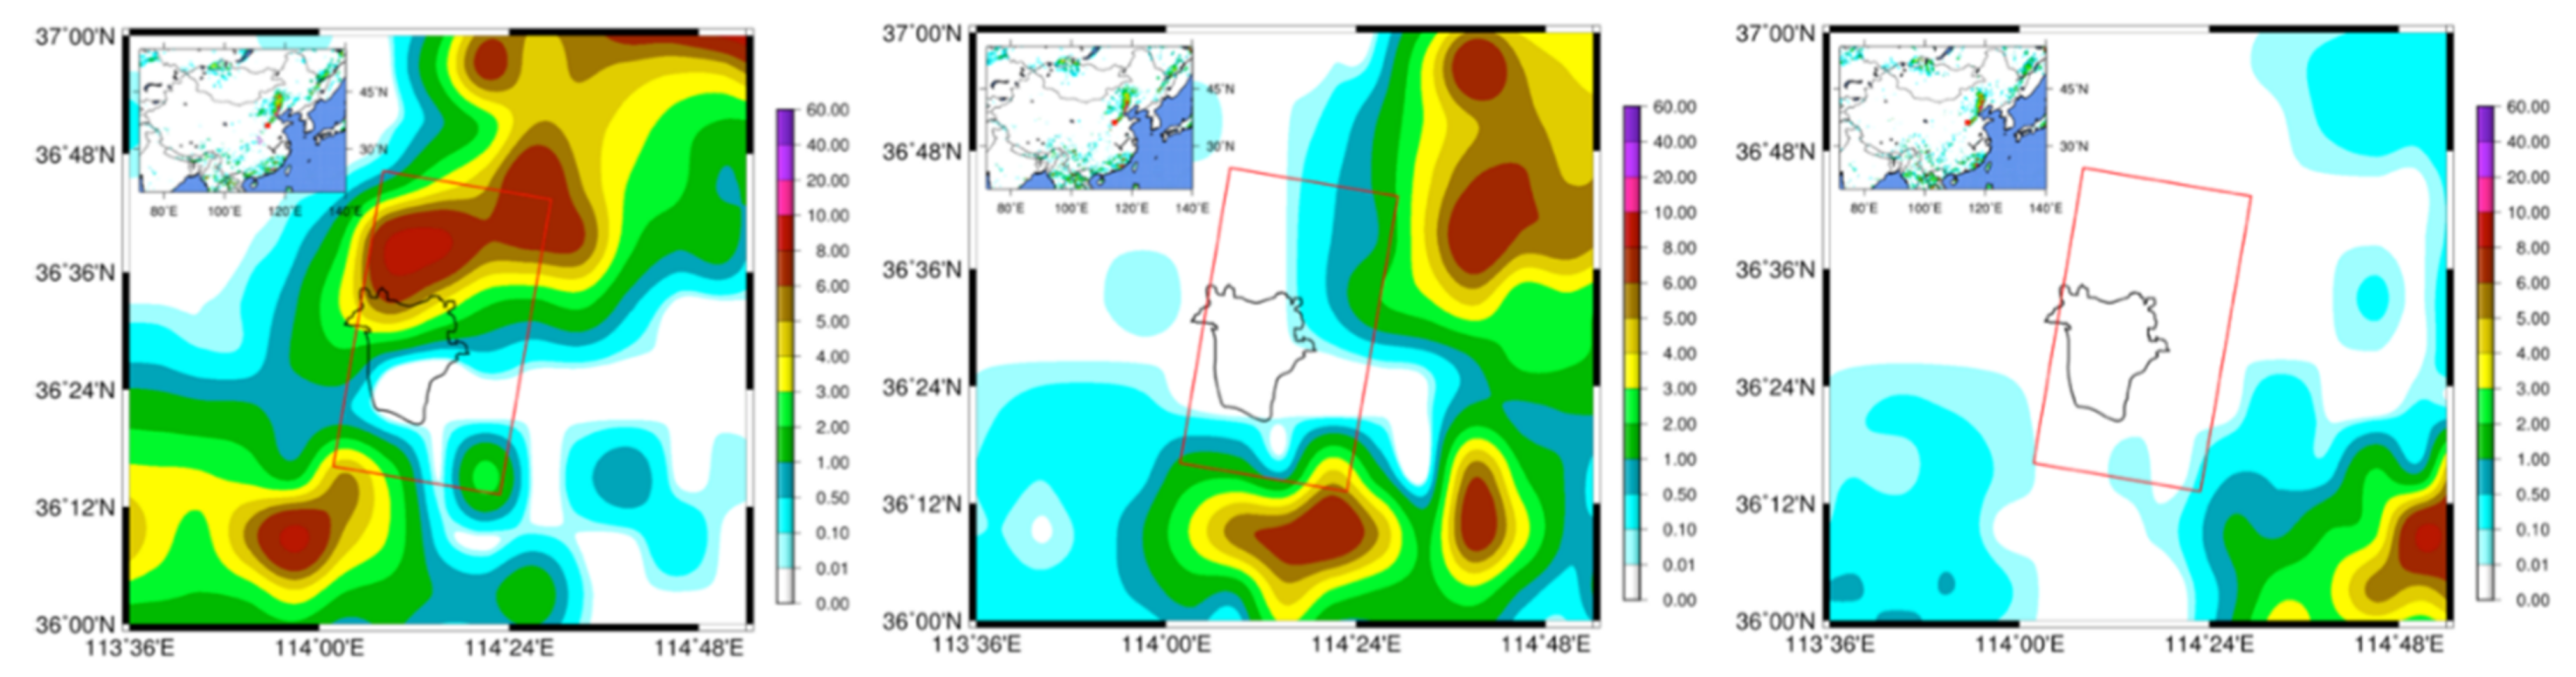
Table A1.
The threshold of spatiotemporal baseline for each SAR data processing.
Table A1.
The threshold of spatiotemporal baseline for each SAR data processing.
| SAR Data | Temporal Baseline (Days) | Perpendicular Baseline (m) |
|---|---|---|
| TSX | 60 | 300 |
| Sentinel-1A | 100 | 100 |
| Radarsat-2 | 100 | 300 |
| PALSAR-2 | 300 | 200 |
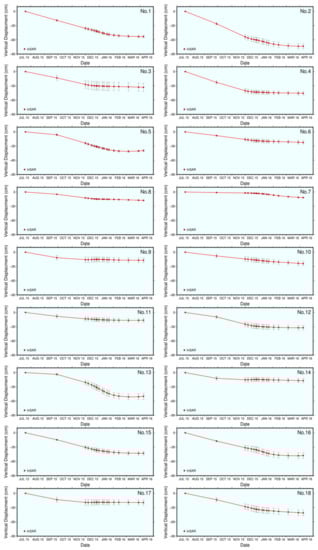
Figure A3.
The subsidence time series of mining sites from No.1 to No.18.
Figure A3.
The subsidence time series of mining sites from No.1 to No.18.
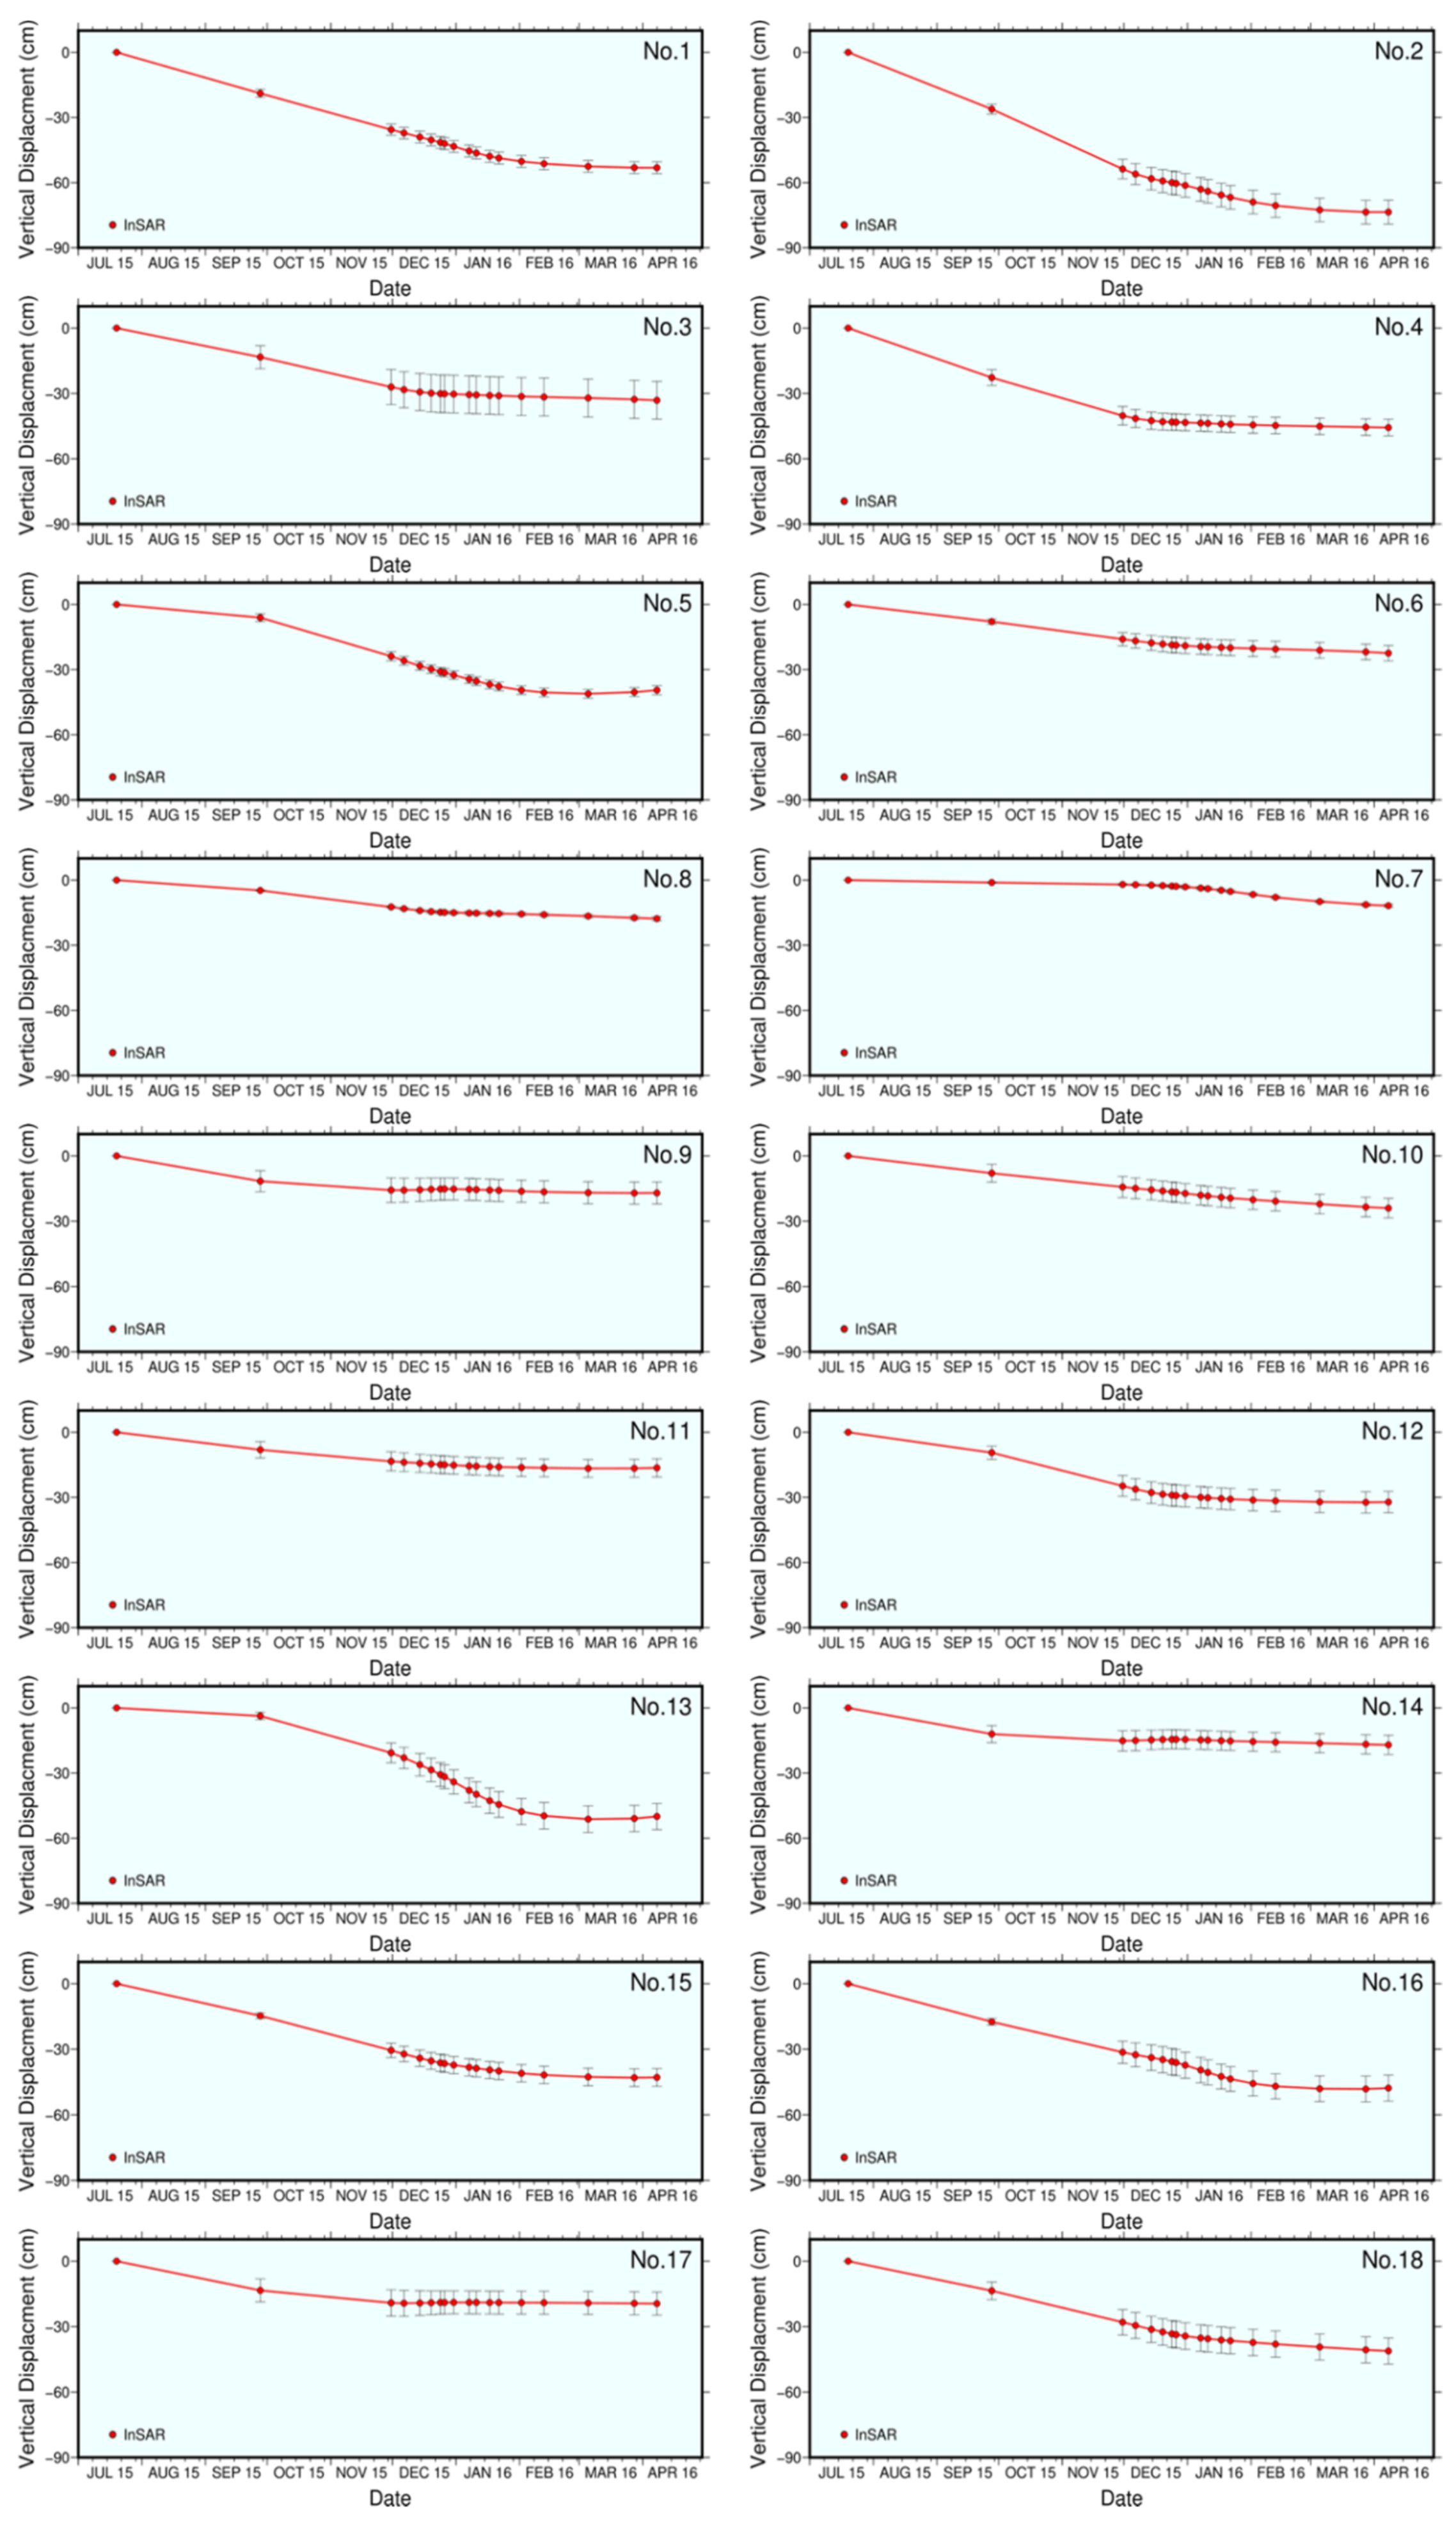
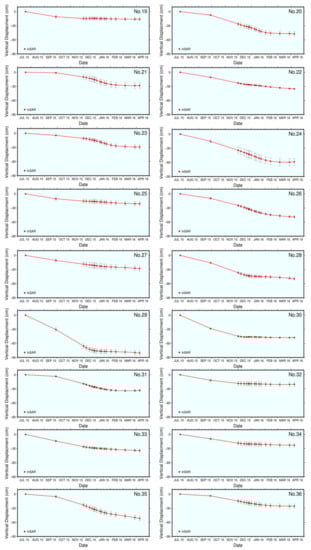
Figure A4.
The subsidence time series of mining sites from No.19 to No.36.
Figure A4.
The subsidence time series of mining sites from No.19 to No.36.
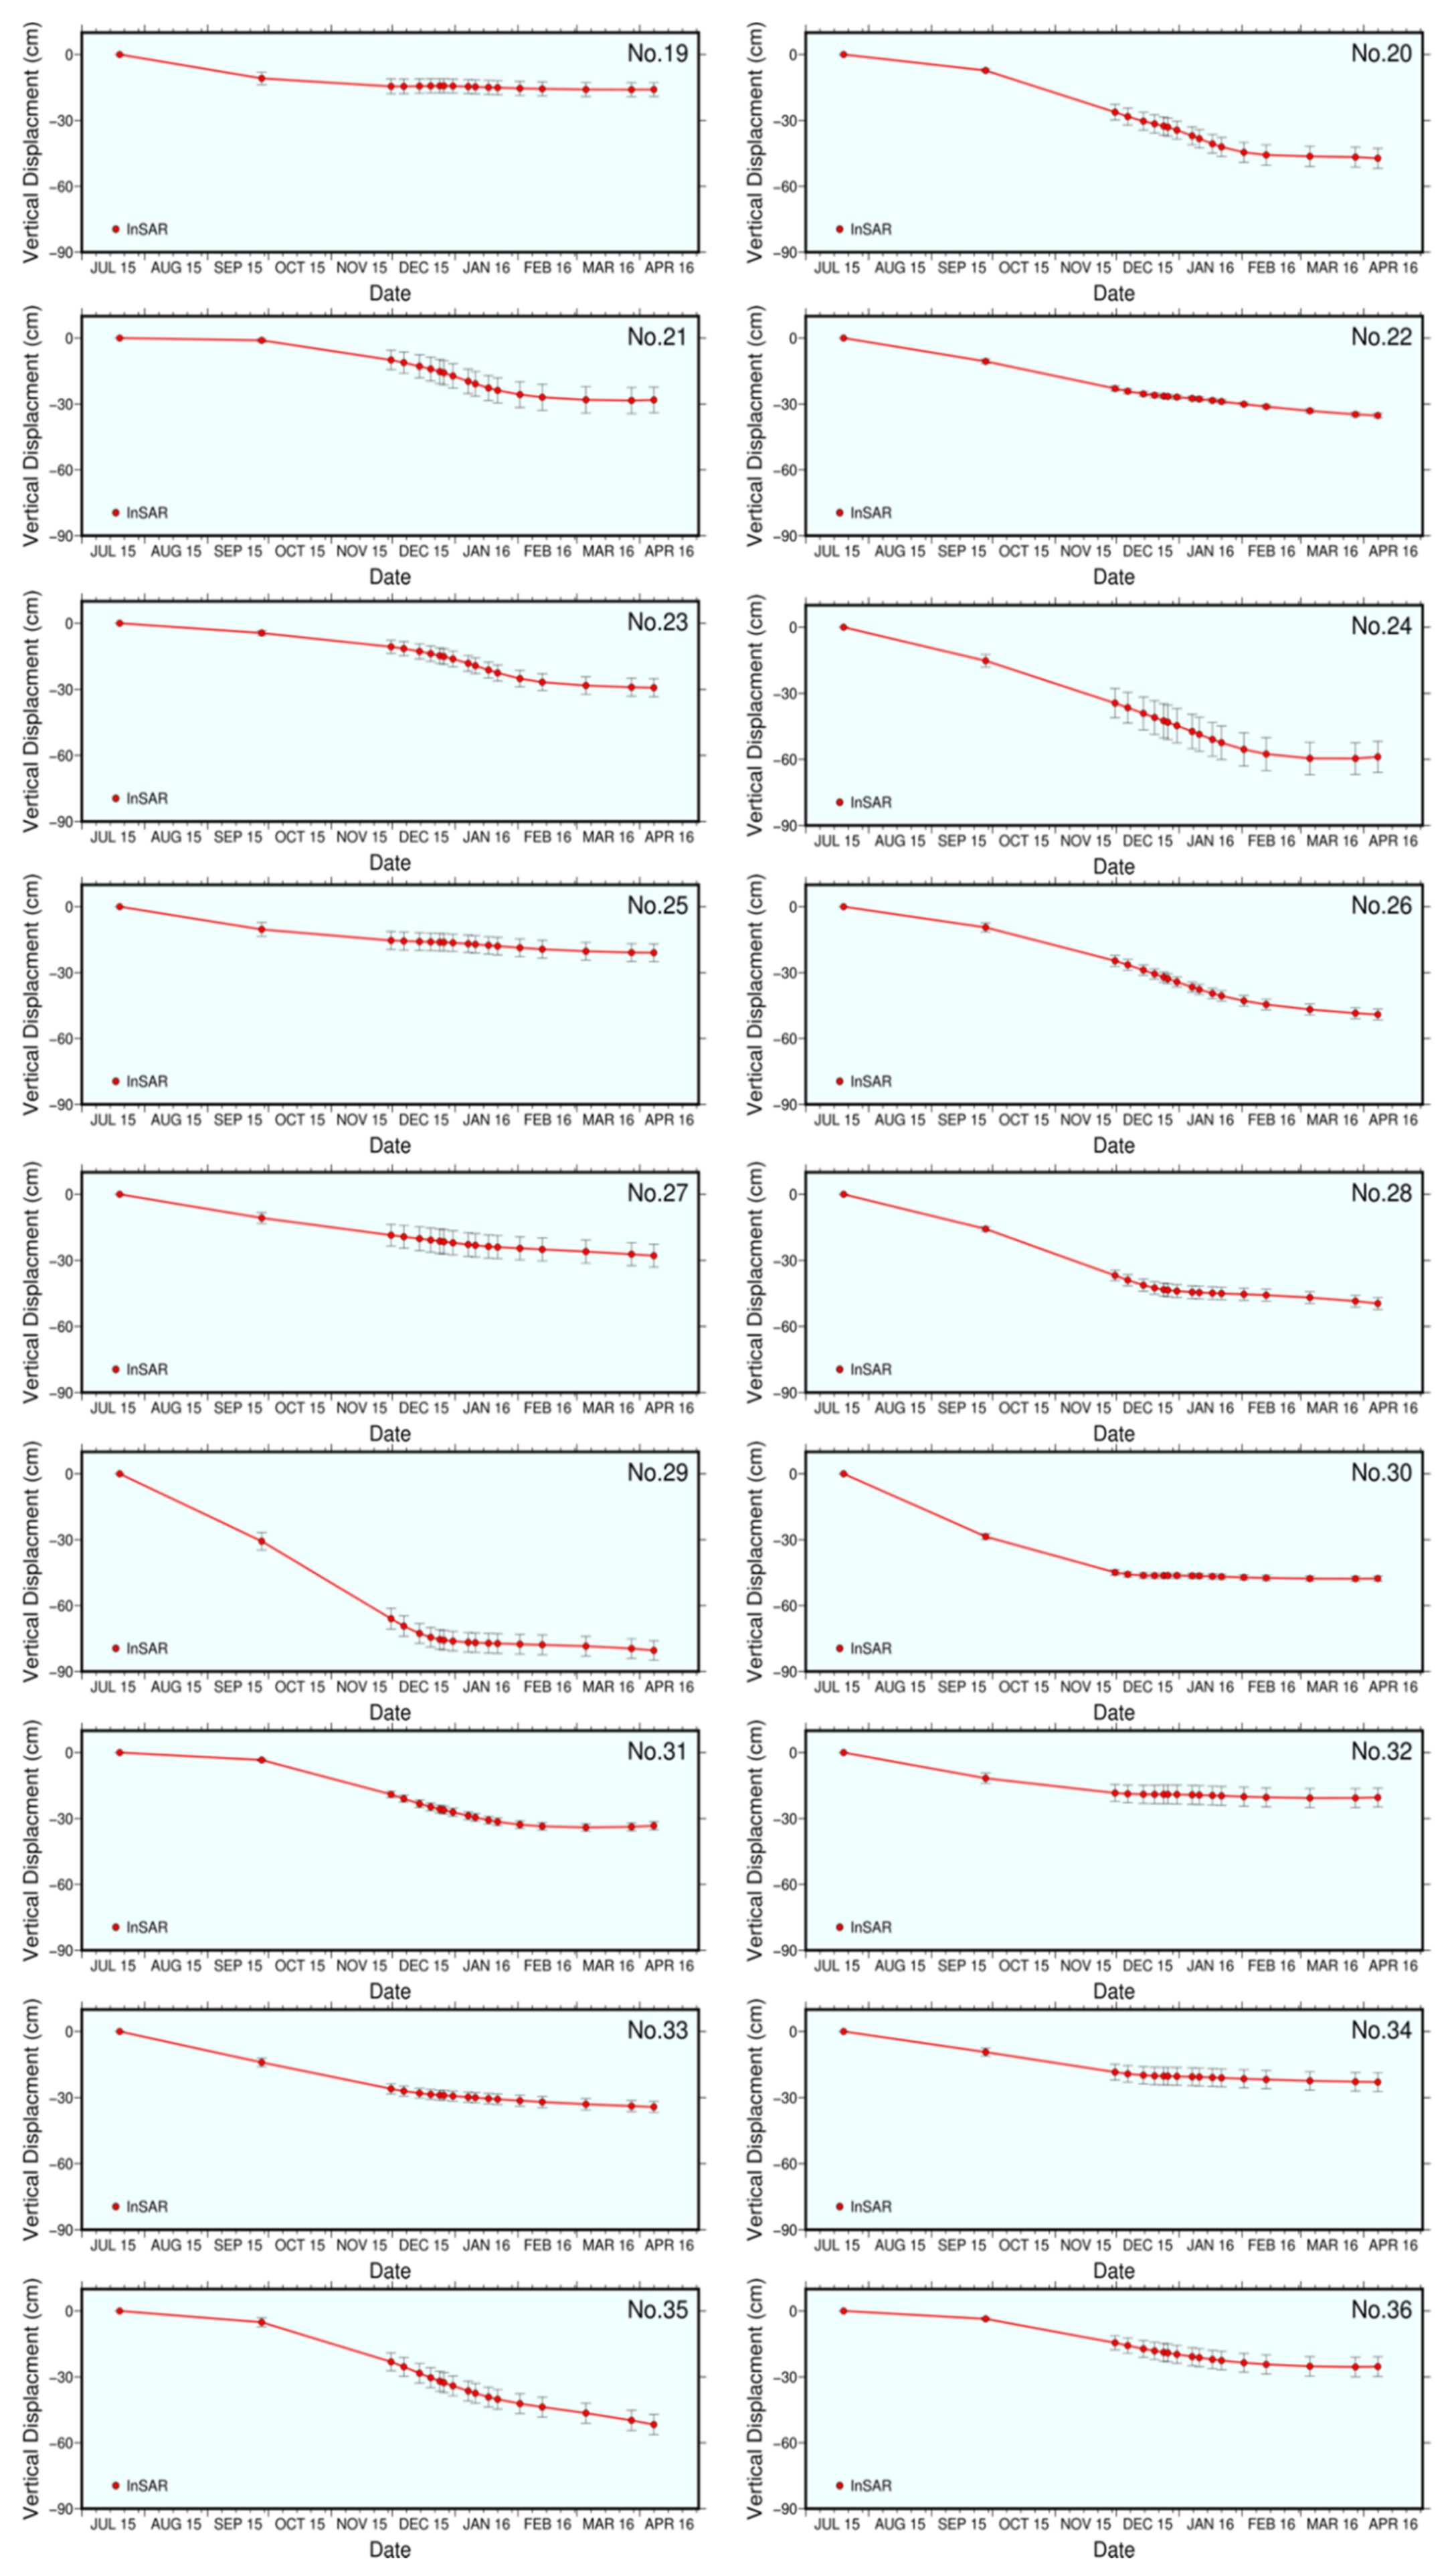
Table A2.
The detailed information of displacement in 36 mining sites.
Table A2.
The detailed information of displacement in 36 mining sites.
| Regions | No. | No. of Deformed Areas | Ground Coverage [km2] | Maximum Displacement [cm] | ||
|---|---|---|---|---|---|---|
| −5 cm to −30 cm | −30 cm to −60 cm | −60 cm to −90 cm | ||||
| A1 | 1 | 1 | 0.861 | 0.1436 | 0.000038 | −61.56 |
| A2 | 2 | 1 | 0.6036 | 0.1074 | 0.0371 | −81.81 |
| 3 | 1 | 1.1483 | 0.0368 | 0 | −47.99 | |
| A3 | 4 | 1 | 0.2919 | 0.0306 | 0 | −51.83 |
| A4 | 5 | 1 | 0.1973 | 0.0187 | 0 | −46.68 |
| 6 | 1 | 0.1617 | 0 | 0 | −29.37 | |
| A5 | 7 | 1 | 0.1415 | 0 | 0 | −13.58 |
| 8 | 1 | 0.1217 | 0 | 0 | −19.49 | |
| A6 | 9 | 2 | 0.0874 | 0 | 0 | −24.56 |
| B1 | 10 | 2 | 0.7195 | 0.0001 | 0 | −33.93 |
| B2 | 11 | 1 | 0.2147 | 0 | 0 | −21.29 |
| 12 | 1 | 0.1072 | 0.0014 | 0 | −41.66 | |
| B3 | 13 | 3 | 0.7566 | 0.0869 | 0 | −58.38 |
| B4 | 14 | 1 | 0.0563 | 0 | 0 | −23.59 |
| B5 | 15 | 3 | 0.5722 | 0.03 | 0 | −49.31 |
| B6 | 16 | 2 | 0.6993 | 0.0581 | 0 | −56.46 |
| 17 | 1 | 0.1465 | 0 | 0 | −28.01 | |
| C1 | 18 | 1 | 0.9503 | 0.0673 | 0 | −49.08 |
| C2 | 19 | 1 | 0.0928 | 0 | 0 | −22.41 |
| 20 | 4 | 1.4109 | 0.0884 | 0 | −54.42 | |
| 21 | 2 | 0.2545 | 0.00068 | 0 | −35.59 | |
| 22 | 1 | 0.4426 | 0.0166 | 0 | −36.82 | |
| C3 | 23 | 1 | 0.4461 | 0.0112 | 0 | −38.34 |
| C4 | 24 | 1 | 1.0695 | 0.2351 | 0.00084 | −66.5 |
| C5 | 25 | 2 | 0.3035 | 0.00003 | 0 | −30.35 |
| C6 | 26 | 2 | 1.6334 | 0.0739 | 0 | −52.55 |
| D1 | 27 | 3 | 0.3516 | 0.0012 | 0 | −36.45 |
| 28 | 4 | 2.0048 | 0.1332 | 0 | −55.03 | |
| D2 | 29 | 1 | 1.4196 | 0.1339 | 0.0427 | −88.8 |
| 30 | 1 | 0.7794 | 0.112 | 0 | −51.34 | |
| 31 | 1 | 0.1956 | 0.0054 | 0 | −36.9 | |
| 32 | 2 | 1.9831 | 0 | 0 | −28.35 | |
| E1 | 33 | 1 | 0.2088 | 0.0153 | 0 | −39.63 |
| 34 | 1 | 0.2129 | 0.0002 | 0 | −30.73 | |
| E2 | 35 | 2 | 2.2508 | 0.1558 | 0.0001 | −60.84 |
| E3 | 36 | 1 | 0.2996 | 0.0003 | 0 | −32.64 |
References
- Liu, G.; Guo, H.D.; Hanssen, R.; Perski, Z.; Li, X.W.; Yue, H.Y.; Fan, J.H. The application of InSAR technology to mining area subsidence monitoring. Remote Sens. Land Res. 2008, 20, 51–55. [Google Scholar]
- Samsonov, S.; D’Oreye, N.; Smets, B. Ground deformation associated with post-mining activity at the French-German border revealed by novel InSAR time series method. Int. J. Appl. Earth Obs. Geoinf. 2013, 23, 142–154. [Google Scholar] [CrossRef]
- Yang, Z.; Li, Z.; Zhu, J.; Wang, Y.; Wu, L. Use of SAR/InSAR in mining deformation monitoring, parameter inversion, and forward predictions: A review. IEEE Geosci. Remote Sens. Mag. 2020, 8, 71–90. [Google Scholar] [CrossRef]
- Wright, P.; Stow, R. Detecting mining subsidence from space. Int. J. Remote Sens. 1999, 20, 1183–1188. [Google Scholar] [CrossRef]
- Bamler, R.; Hartl, P. Synthetic aperture radar interferometry. Inverse Probl. 1998, 14, R1. [Google Scholar] [CrossRef]
- Rosen, P.A.; Hensley, S.; Joughin, I.R.; Li, F.K.; Madsen, S.N.; Rodriguez, E.; Goldstein, R.M. Synthetic aperture radar inter-ferometry. Proc. IEEE 2000, 88, 333–382. [Google Scholar] [CrossRef]
- Massonnet, D.; Feigl, K.L. Radar interferometry and its application to changes in the Earth’s surface. Rev. Geophys. 1998, 36, 441–500. [Google Scholar] [CrossRef] [Green Version]
- Eldhuset, K.; Andersen, P.H.; Hauge, S.; Isaksson, E.; Weydahl, D.J. ERS tandem InSAR processing for DEM generation, glacier motion estimation and coherence analysis on Svalbard. Int. J. Remote Sens. 2003, 24, 1415–1437. [Google Scholar] [CrossRef]
- Ding, X.L.; Liu, G.X.; Li, Z.W.; Li, Z.L.; Chen, Y.Q. Ground subsidence monitoring in Hong Kong with satellite SAR inter-ferometry. Photogramm. Eng. Remote Sens. 2004, 70, 1151–1156. [Google Scholar] [CrossRef]
- Burgmann, R.; Rosen, P.A.; Fielding, E.J. Synthetic aperture radar interferometry to measure earth’s surface topography and its deformation. Annu. Rev. Earth Planet. Sci. 2000, 28, 169–209. [Google Scholar] [CrossRef]
- Hanssen, R.F. Radar Interferometry: Data Interpretation and Error Analysis; Kluwer Academic Publishers: Dordrecht, The Netherlands, 2001. [Google Scholar]
- Ferretti, A.; Prati, C.; Rocca, F. Permanent scatterers in SAR interferometry. IEEE Trans. Geosci. Remote Sens. 2001, 39, 8–20. [Google Scholar] [CrossRef]
- Berardino, P.; Fornaro, G.; Lanari, R.; Sansosti, E. A new algorithm for surface deformation monitoring based on small baseline differential SAR interferograms. IEEE Trans. Geosci. Remote Sens. 2002, 40, 2375–2383. [Google Scholar] [CrossRef] [Green Version]
- Wu, S.; Zhang, L.; Ding, X.; Perissin, D. Pixel-Wise MTInSAR Estimator for integration of coherent point selection and unwrapped phase vector recovery. IEEE Trans. Geosci. Remote Sens. 2018, 57, 2659–2668. [Google Scholar] [CrossRef]
- Xu, W.; Wu, S.; Materna, K.; Nadeau, R.; Floyd, M.; Funning, G.; Chaussard, E.; Johnson, C.W.; Murray, J.R.; Ding, X.; et al. Interseismic ground deformation and fault slip rates in the greater san francisco bay area from two decades of space geodetic data. J. Geophys. Res. Solid Earth 2018, 123, 8095–8109. [Google Scholar] [CrossRef]
- Wu, S.; Yang, Z.; Ding, X.; Zhang, B.; Zhang, L.; Lu, Z. Two decades of settlement of Hong Kong International Airport measured with multi-temporal InSAR. Remote Sens. Environ. 2020, 248, 111976. [Google Scholar] [CrossRef]
- Sun, Q.; Zhang, L.; Ding, X.L.; Hu, J.; Liang, H.Y. Investigation of slow-moving landslides from ALOS/PALSAR images with TCPInSAR: A case study of Oso, USA. Remote Sens. 2014, 7, 72–88. [Google Scholar] [CrossRef]
- Pepe, A.; Bonano, M.; Zhao, Q.; Yang, T.; Wang, H. The use of C-/X-band time-gapped sar data and geotechnical models for the study of shanghai’s ocean-reclaimed lands through the SBAS-DInSAR technique. Remote Sens. 2016, 8, 911. [Google Scholar] [CrossRef] [Green Version]
- Zhang, B.; Wang, C.; Ding, X.; Zhu, W.; Wu, S. Correction of ionospheric artifacts in SAR data: Application to fault slip inversion of 2009 southern Sumatra earthquake. IEEE Geosci. Remote Sens. Lett. 2018, 15, 1327–1331. [Google Scholar] [CrossRef]
- Duan, M.; Xu, B.; Li, Z.W.; Wu, W.H.; Cao, Y.M.; Liu, J.H.; Wang, G.Y.; Hou, J.X. A new weighting method by considering the physical characteristics of atmospheric turbulence and decorrelation noise in SBAS-InSAR. Remote Sens. 2020, 12, 2557. [Google Scholar] [CrossRef]
- Xiong, S.T.; Wang, C.S.; Qin, X.Q.; Zhang, B.C.; Li, Q.Q. Time-series analysis on persistent scatter-interferometric synthetic aperture radar (PS-InSAR) derived displacements of the Hong Kong-Zhuhai-Macao bridge (HZMB) from sentinel-1A observations. Remote Sens. 2021, 13, 546. [Google Scholar] [CrossRef]
- Qin, X.Q.; Zhang, L.; Yang, M.S.; Luo, H.; Liao, M.S.; Ding, X.L. Mapping surface deformation and thermal dilation of arch bridges by structure-driven multi-temporal D-InSAR analysis. Remote Sens. Environ. 2018, 216, 71–90. [Google Scholar] [CrossRef]
- Carnec, C.; Massonnet, D.; King, C. Two examples of the use of SAR interferometry on displacement fields of small spatial extent. Geophys. Res. Lett. 1996, 23, 3579–3582. [Google Scholar] [CrossRef]
- Lazecký, M. InSAR used for subsidence monitoring of mining area OKR, Czech Republic. In Fringe 2009, Proceedings of the Workshop, Frascati, Italy, 30 November–4 December 2009; ESA Communications: Noordwijk, The Netherlands, 2010. [Google Scholar]
- Bechor, N.B.D.; Zebker, H.A. Measuring two-dimensional movements using a single InSAR pair. Geophys. Res. Lett. 2006, 33. [Google Scholar] [CrossRef] [Green Version]
- Michel, R.; Avouac, J.-P.; Taboury, J. Measuring ground displacements from SAR amplitude images: Application to the landers earthquake. Geophys. Res. Lett. 1999, 26, 875–878. [Google Scholar] [CrossRef] [Green Version]
- Ng, A.H.-M.; Ge, L.; Zhang, K.; Chang, H.-C.; Li, X.; Rizos, C.; Omura, M. Deformation mapping in three dimensions for underground mining using InSAR—Southern highland coalfield in New South Wales, Australia. Int. J. Remote Sens. 2011, 32, 7227–7256. [Google Scholar] [CrossRef]
- Wegmuller, U.; Werner, C.; Strozzi, T.; Wiesmann, A. Monitoring mining induced surface deformation. IEEE Int. Geosci. Remote Sens. 2004, 3, 1933–1935. [Google Scholar]
- Diao, X.; Wu, K.; Hu, D.; Li, L.; Zhou, D. Combining differential SAR interferometry and the probability integral method for three-dimensional deformation monitoring of mining areas. Int. J. Remote Sens. 2016, 37, 5196–5212. [Google Scholar] [CrossRef]
- Xia, Y.; Wang, Y. InSAR- and PIM-based inclined goaf determination for illegal mining detection. Remote Sens. 2020, 12, 3884. [Google Scholar] [CrossRef]
- Werner, C.; Wegmüller, U.; Strozzi, T.; Wiesmann, A. Gamma SAR and interferometric processing software. Remote Sens. 2000, 1620, 1620. [Google Scholar]
- Zhang, L.; Ding, X.L.; Lu, Z.; Jung, H.S.; Hu, J.; Feng, G.C. A novel multitemporal InSAR model for joint estimation of de-formation rates and orbital errors. IEEE Int. Geosci. Remote Sens. 2014, 52, 3529–3540. [Google Scholar] [CrossRef] [Green Version]
- Baehr, H. Orbital Effects in Spaceborne Synthetic Aperture Radar Interferometry; KIT Scientific Publishing: Karlsruhe, Germany, 2013. [Google Scholar]
- Schmidt, D.A.; Bürgmann, R. Time-dependent land uplift and subsidence in the Santa Clara valley, California, from a large interferometric synthetic aperture radar data set. J. Geophys. Res. Space Phys. 2003, 108, 9. [Google Scholar] [CrossRef] [Green Version]
- Hu, J.; Li, Z.-W.; Ding, X.; Zhu, J.; Zhang, L.; Sun, Q. Resolving three-dimensional surface displacements from InSAR measurements: A review. Earth-Sci. Rev. 2014, 133, 1–17. [Google Scholar] [CrossRef]
- Samsonov, S.; D’Oreye, N. Multidimensional time-series analysis of ground deformation from multiple InSAR data sets applied to Virunga Volcanic province. Geophys. J. Int. 2012, 191, 1095–1108. [Google Scholar] [CrossRef] [Green Version]
- General Office of the Municipal Government. Notice of the General Office of Handan Municipal People’s Government on Issuing Handan’s 2016 Geological Disaster Prevention Plan. Available online: https://www.hd.gov.cn/hdzfxxgk/gszbm/auto23692/201808/t20180802_799421.html?keywords=%E5%9C%B0%E8%B4%A8%E7%81%BE%E5%AE%B3.2016 (accessed on 15 May 2021).
- Raucoules, D.; Maisons, C.; Carnec, C.; Le Mouelic, S.; King, C.; Hosford, S. Monitoring of slow ground deformation by ERS radar interferometry on the Vauvert salt mine (France): Comparison with ground-based measurement. Remote Sens. Environ. 2003, 88, 468–478. [Google Scholar] [CrossRef]


Publisher’s Note: MDPI stays neutral with regard to jurisdictional claims in published maps and institutional affiliations. |
© 2021 by the authors. Licensee MDPI, Basel, Switzerland. This article is an open access article distributed under the terms and conditions of the Creative Commons Attribution (CC BY) license (https://creativecommons.org/licenses/by/4.0/).