
Mechanism of Land Subsidence Mutation in Beijing Plain under the Background of Urban Expansion

 ,
,  and
and
Abstract
:
1. Introduction
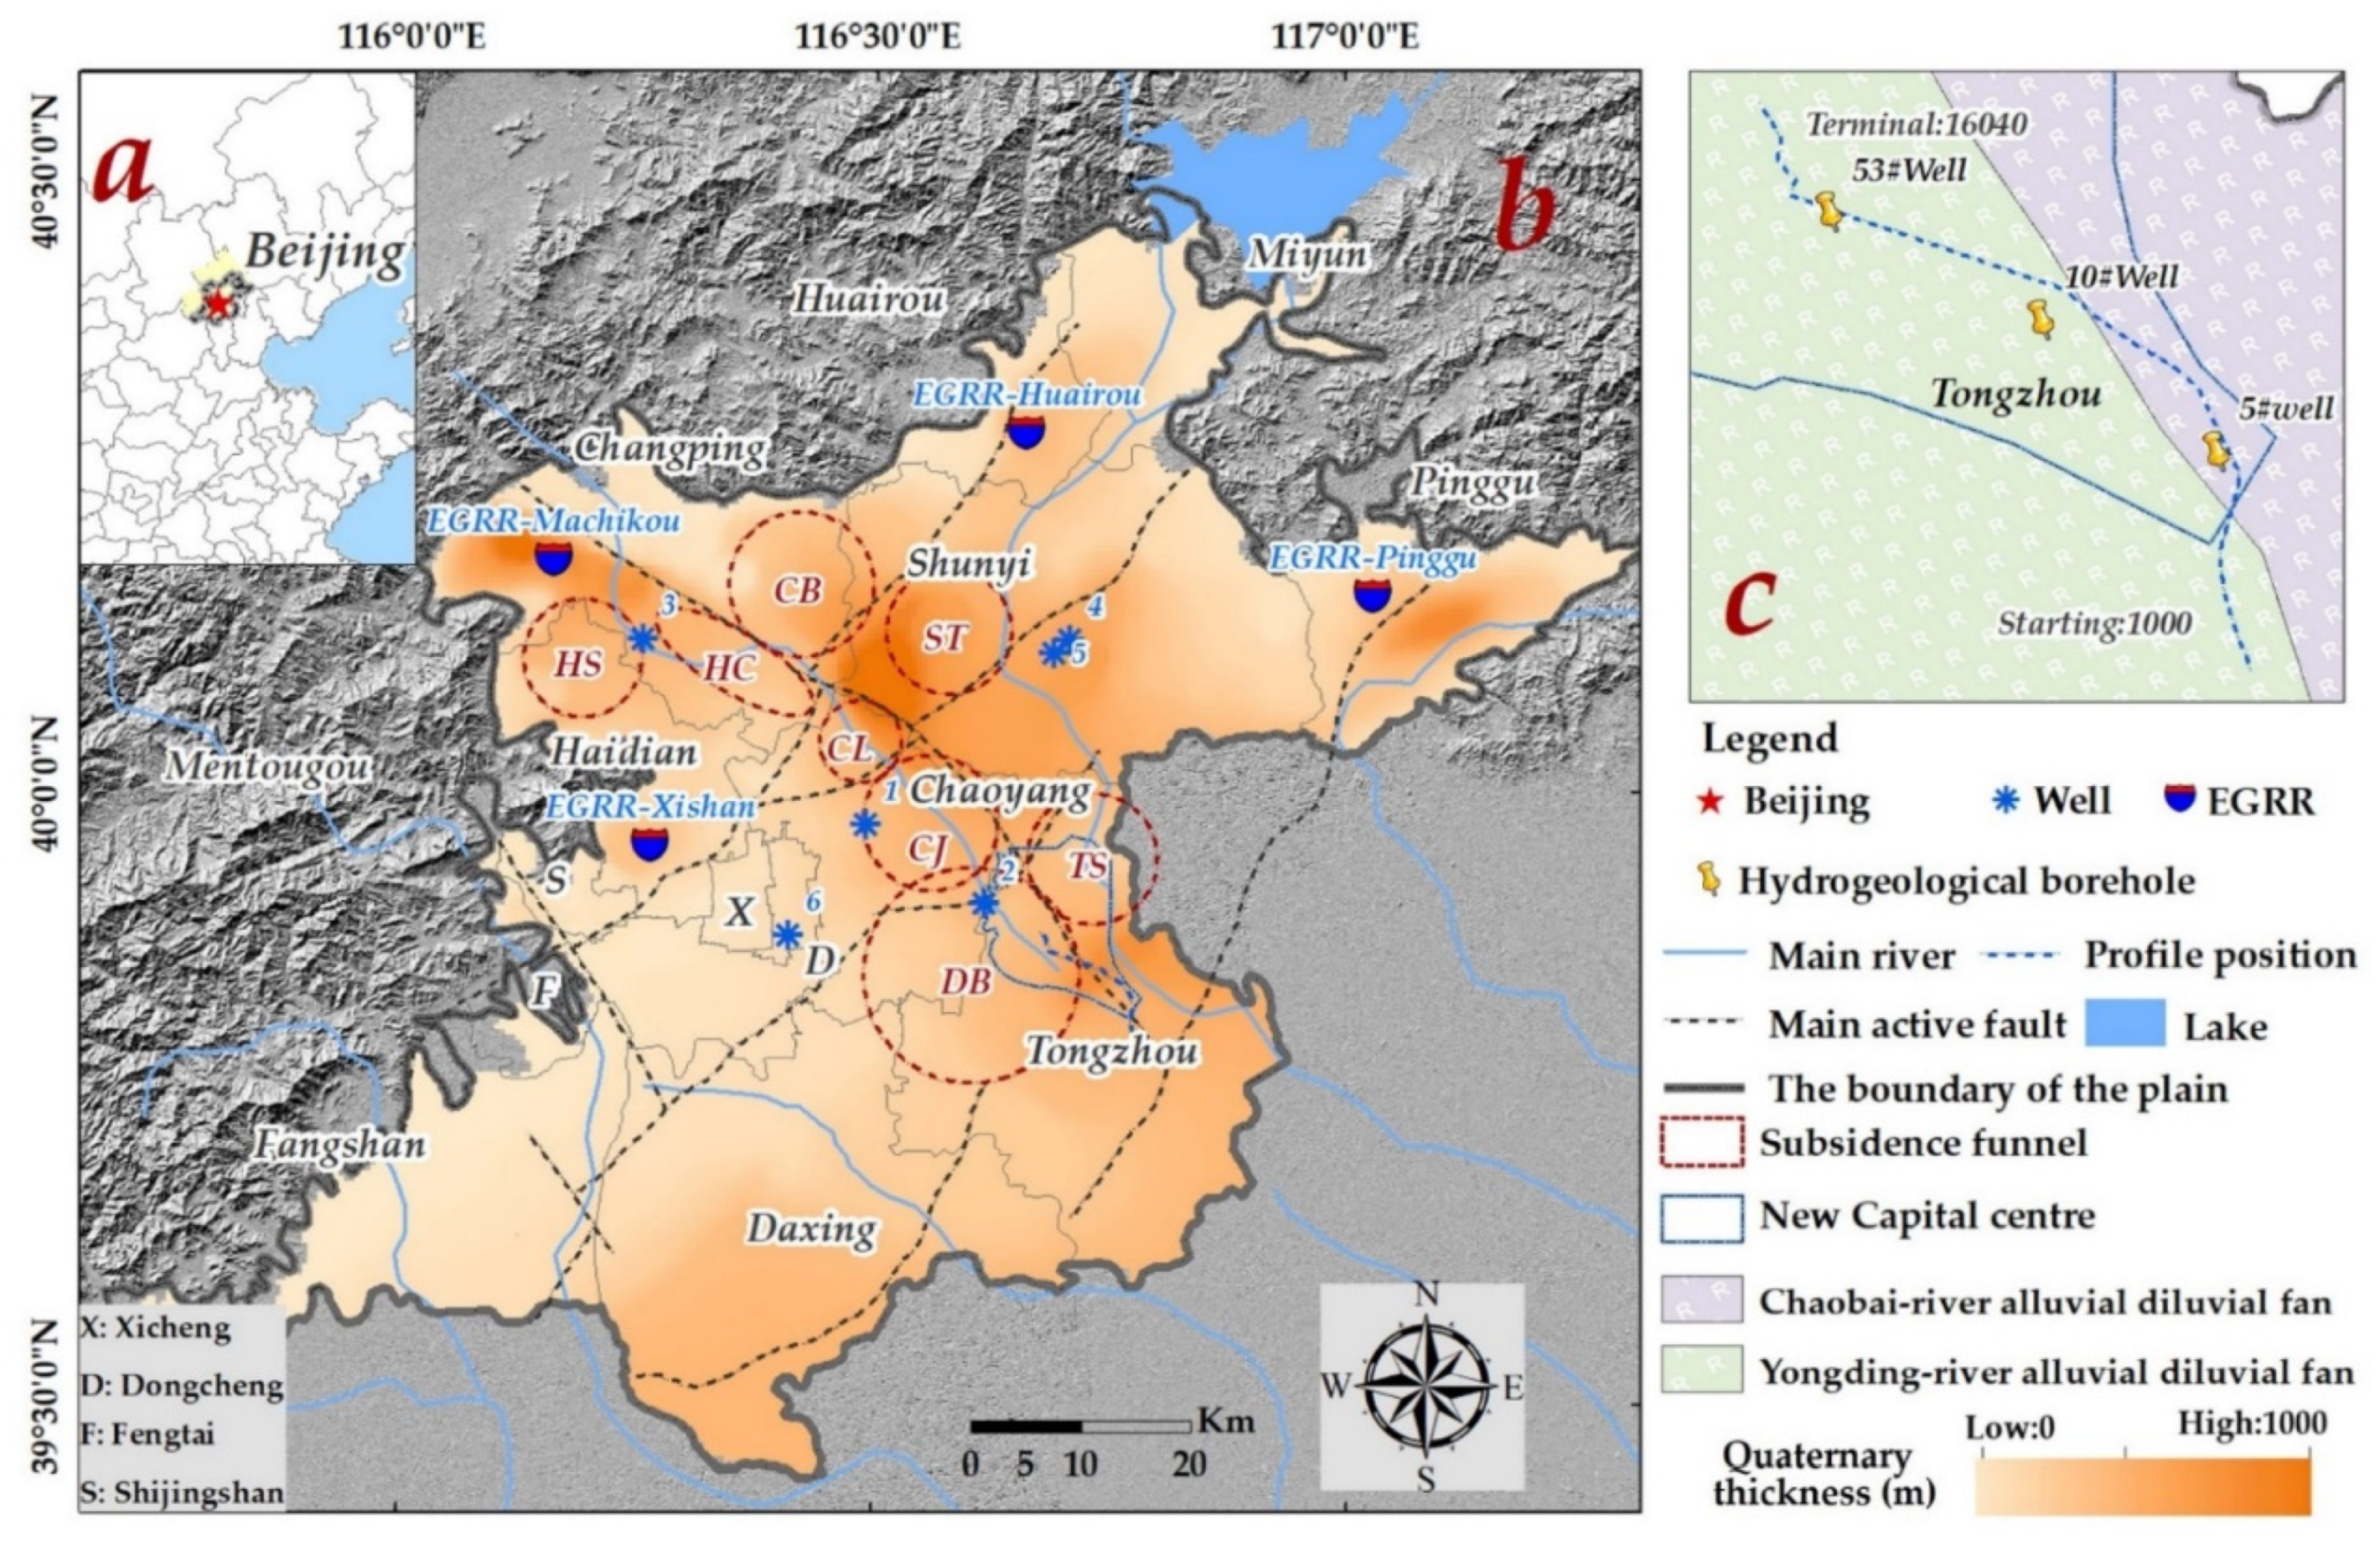
2. Study Area
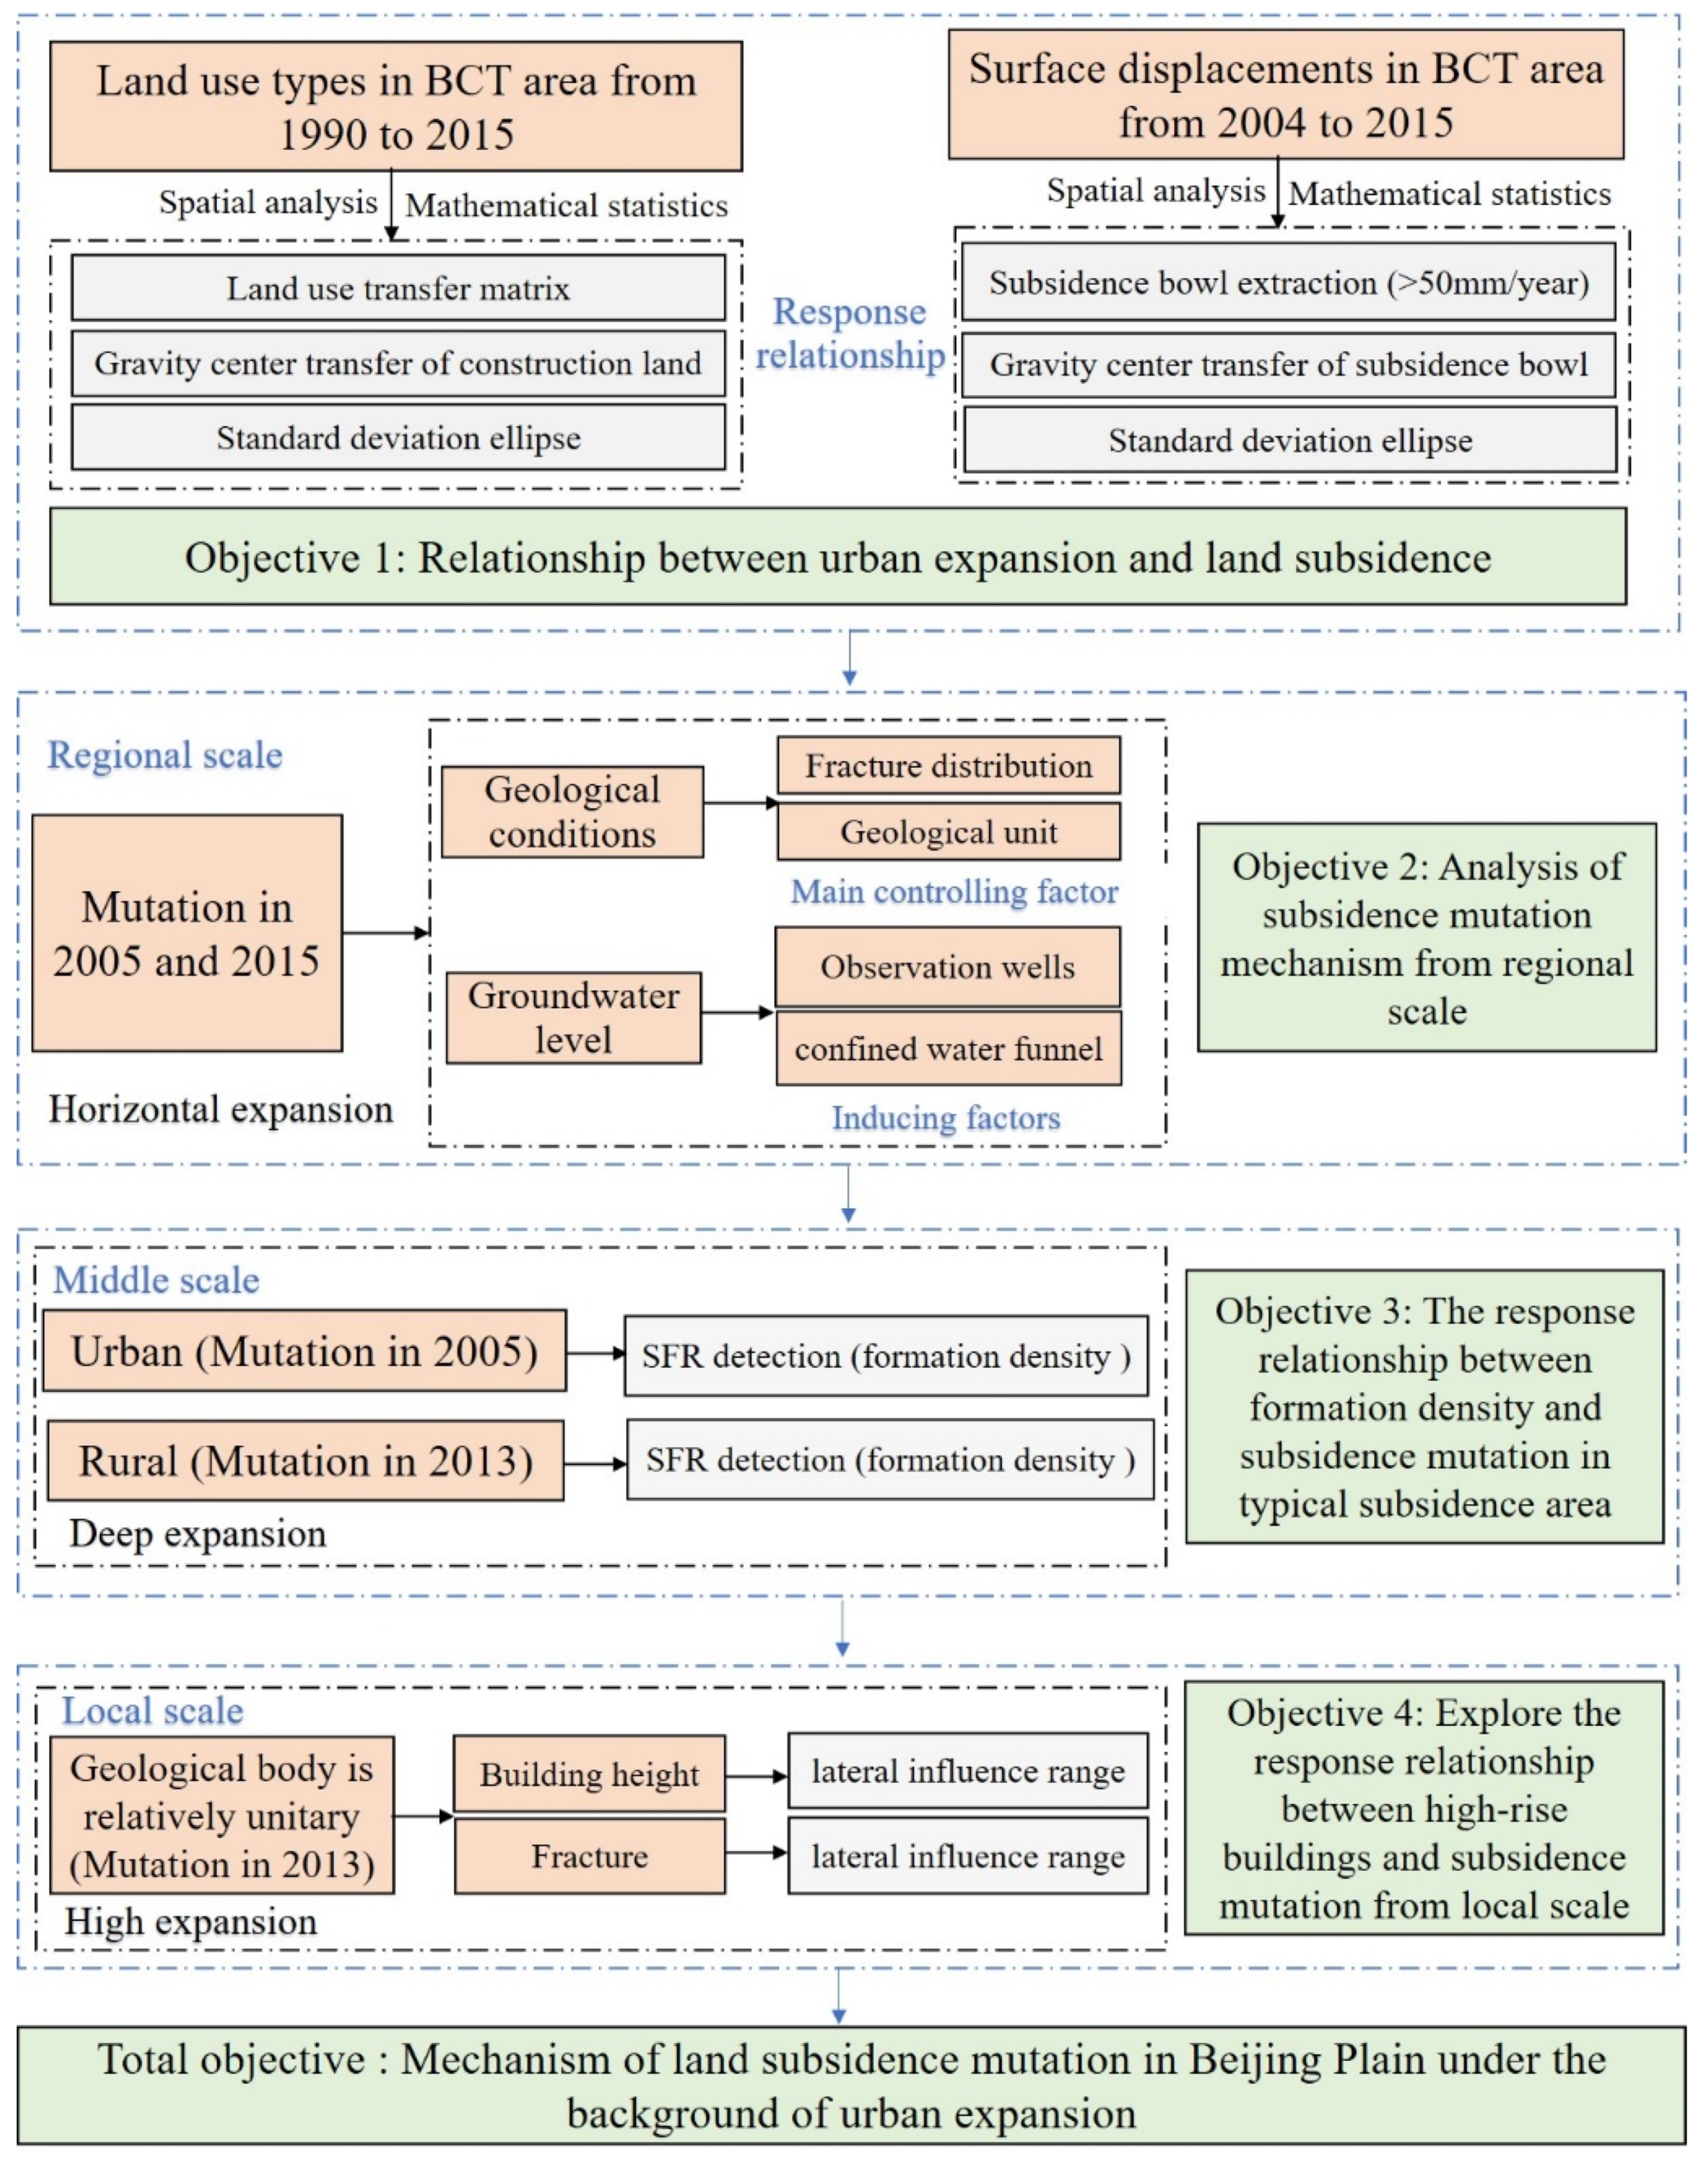
3. Materials and Methods
3.1. Material
3.1.1. SAR Data
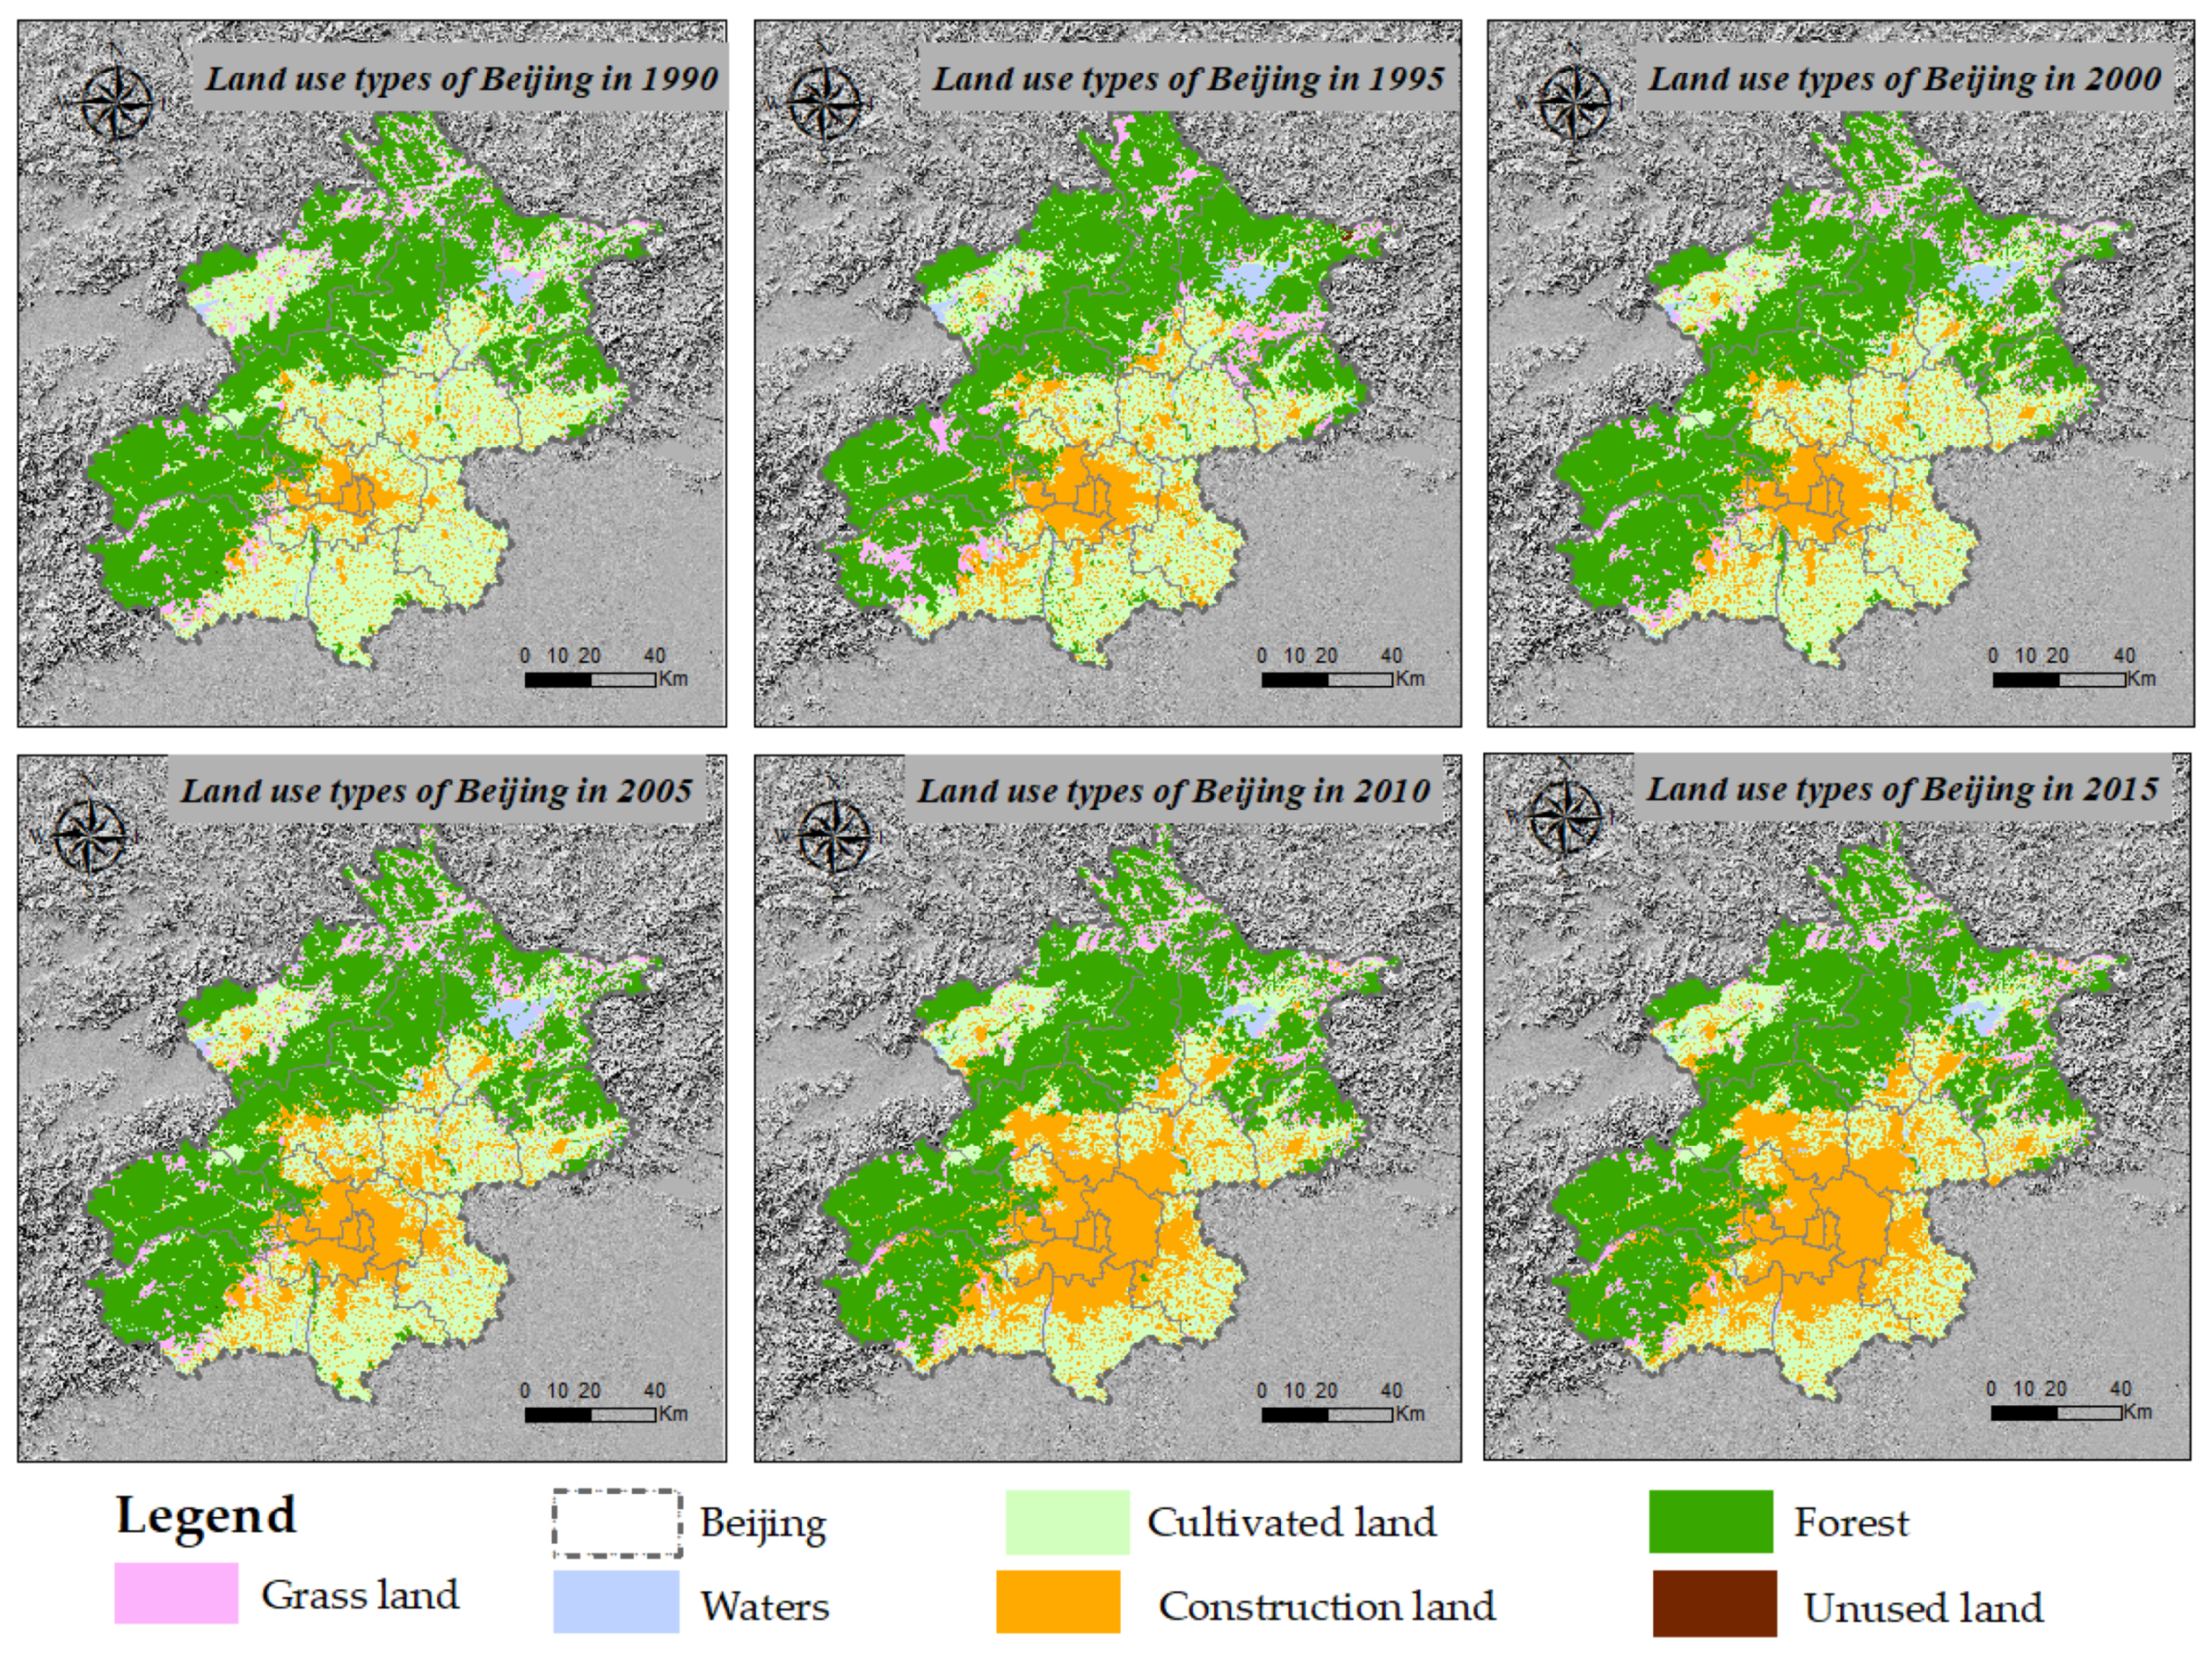
3.1.2. Land-Use Data
3.1.3. Groundwater Level Data
3.1.4. SFR Data
3.1.5. Building Height Data
3.2. Methods
3.2.1. Land-Use Transfer Matrix
3.2.2. Gravity Center Migration Model
3.2.3. Standard Deviation Ellipse Analysis
4. Results
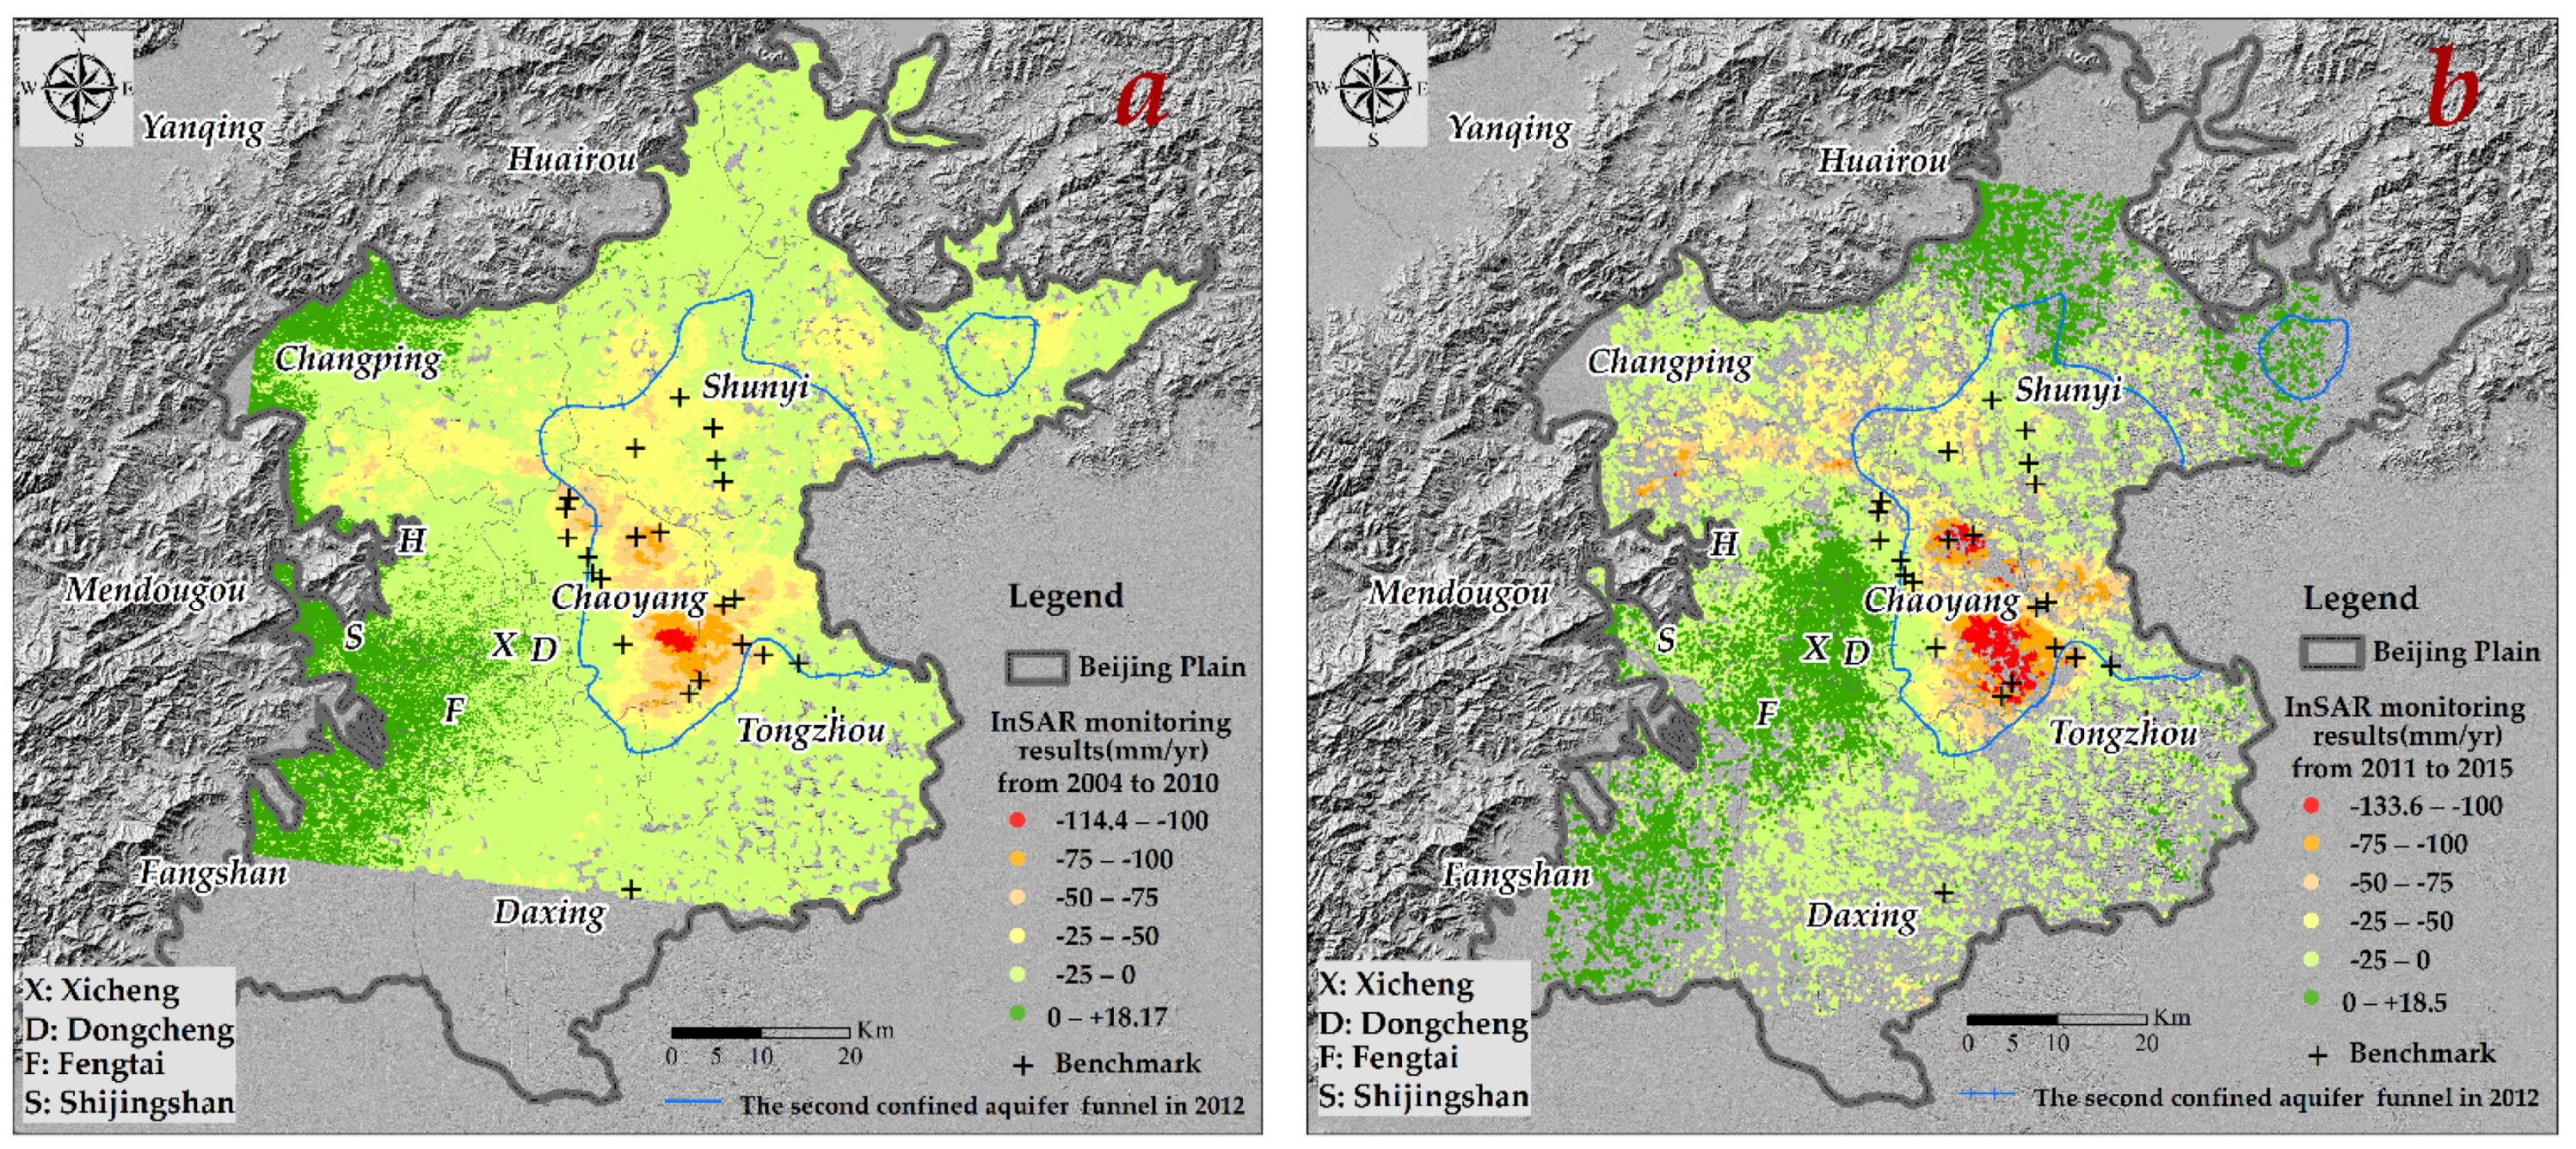
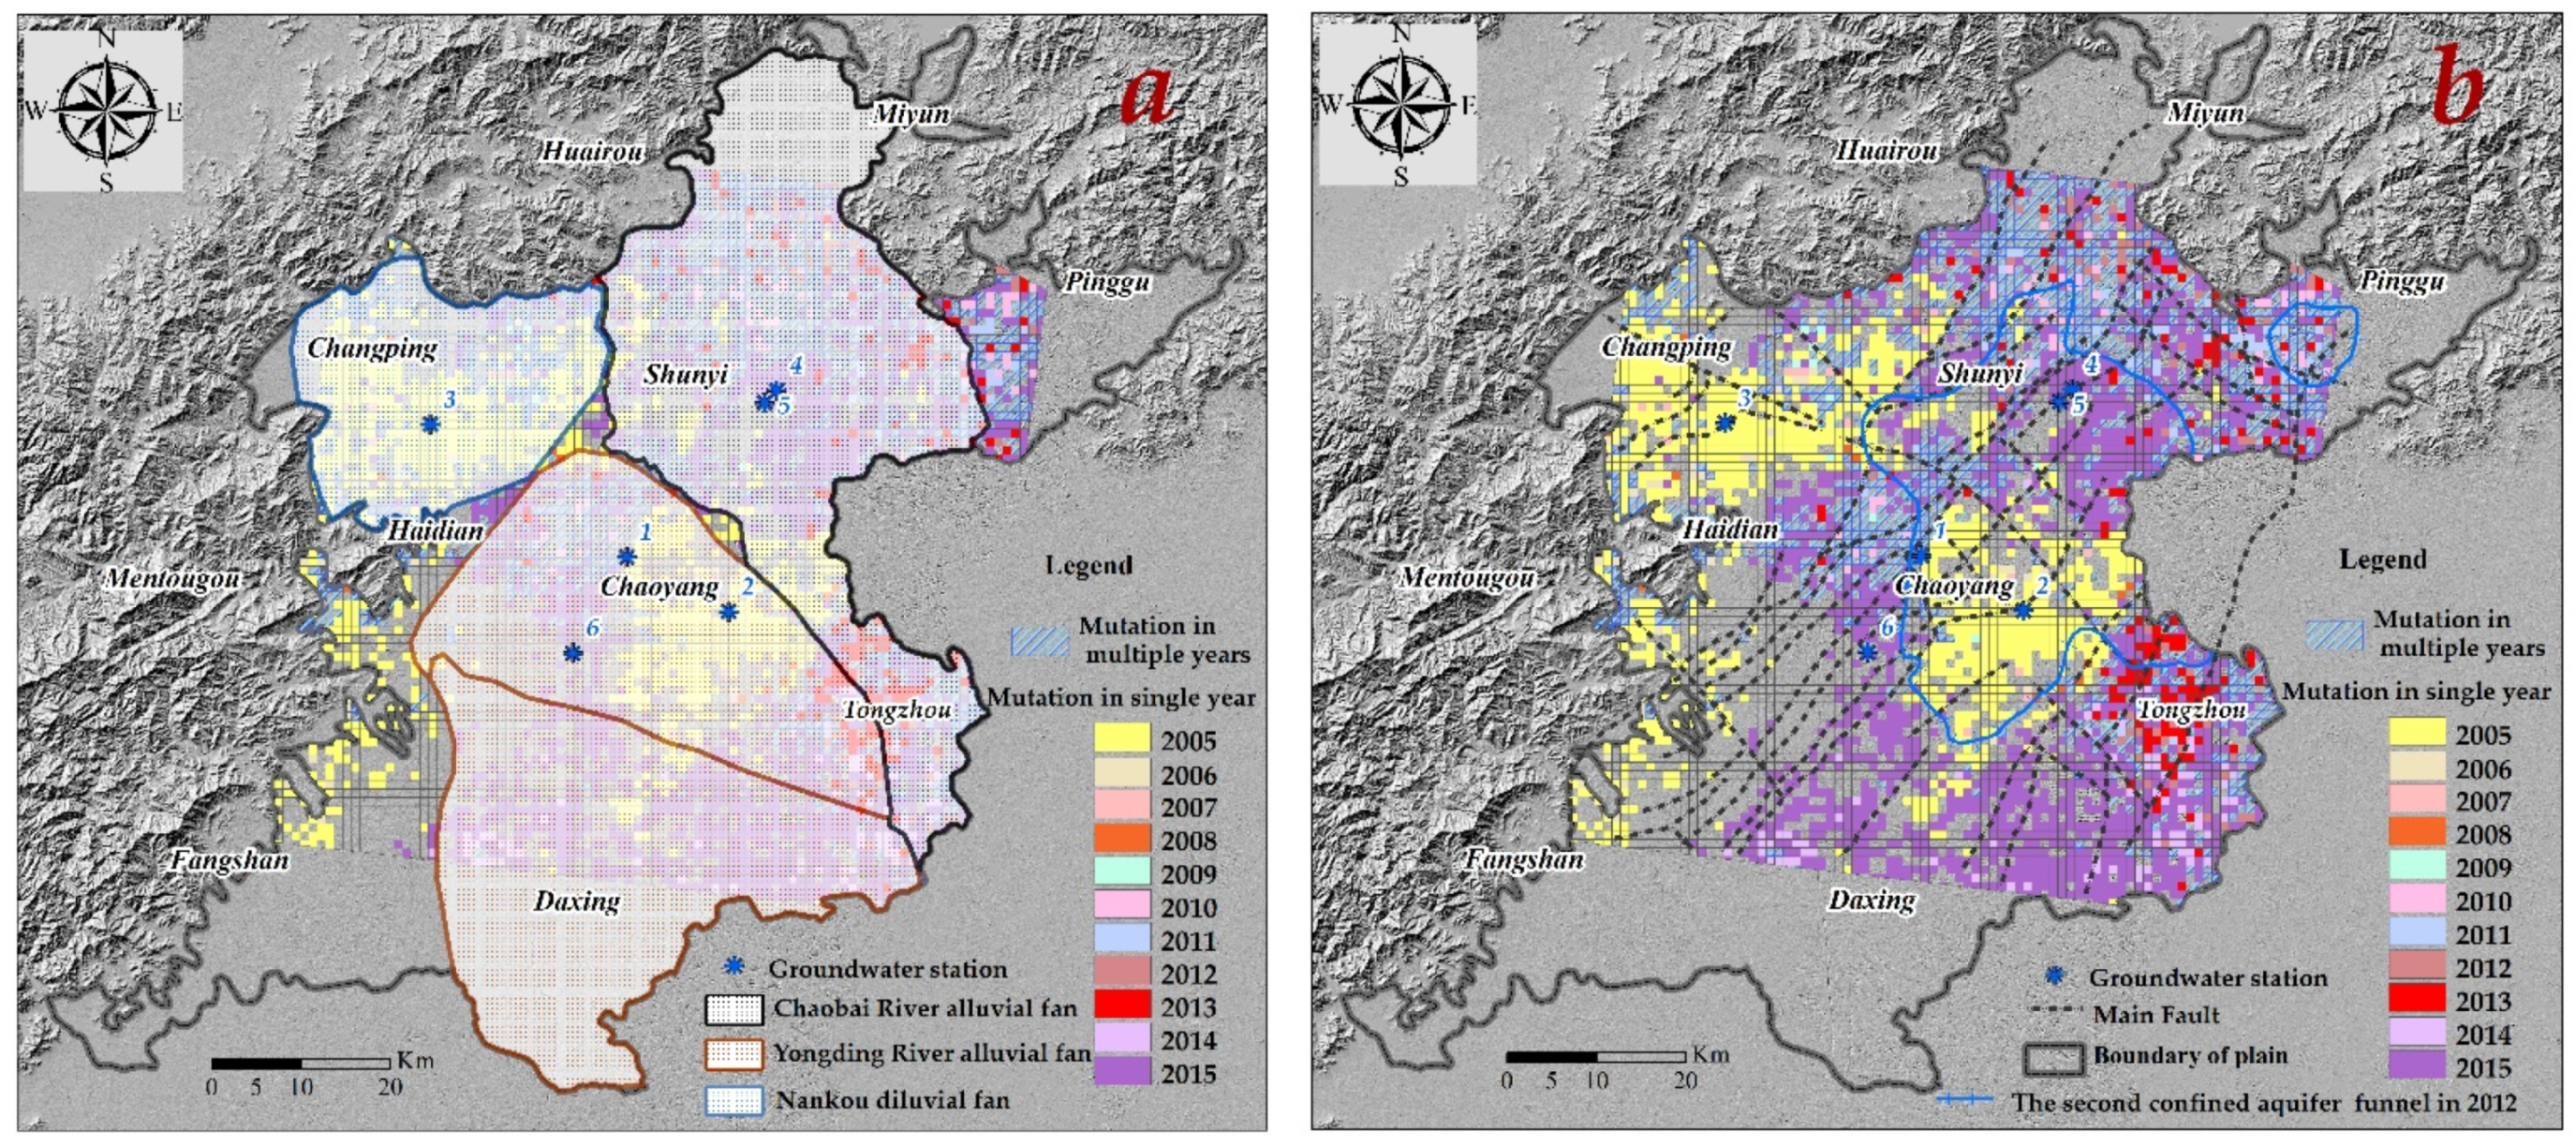
4.1. Surface Displacements and Subsidence Mutation in Beijing Plain from 2004 to 2015
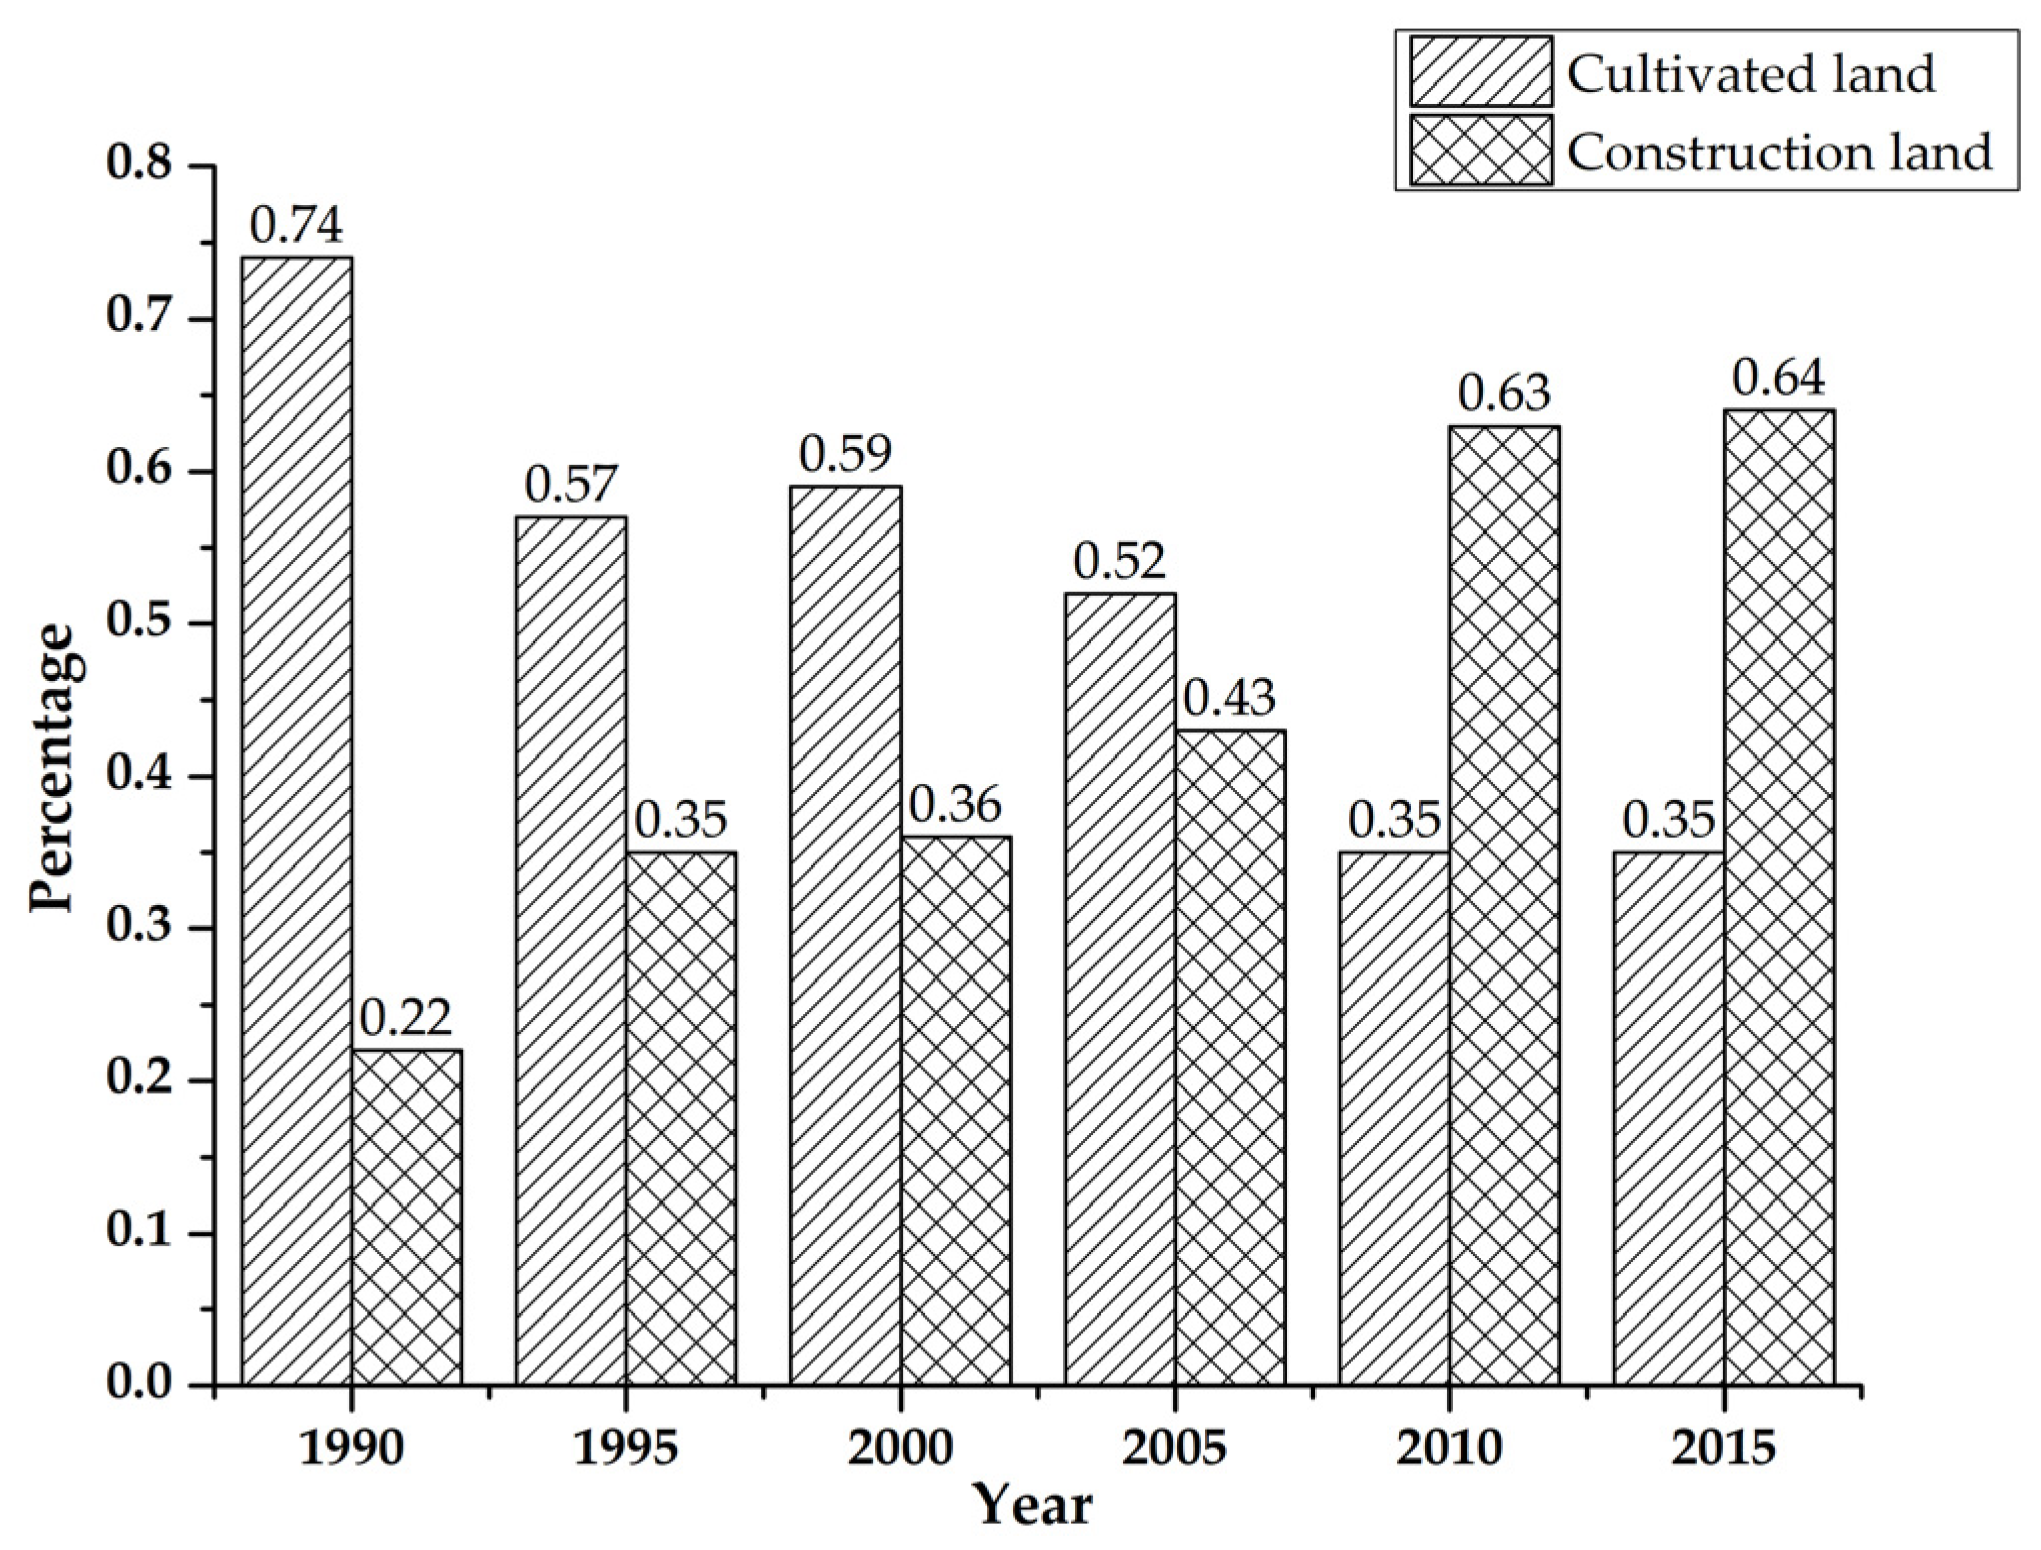
4.2. Urban Expansion in BCT Region from 1990 to 2015
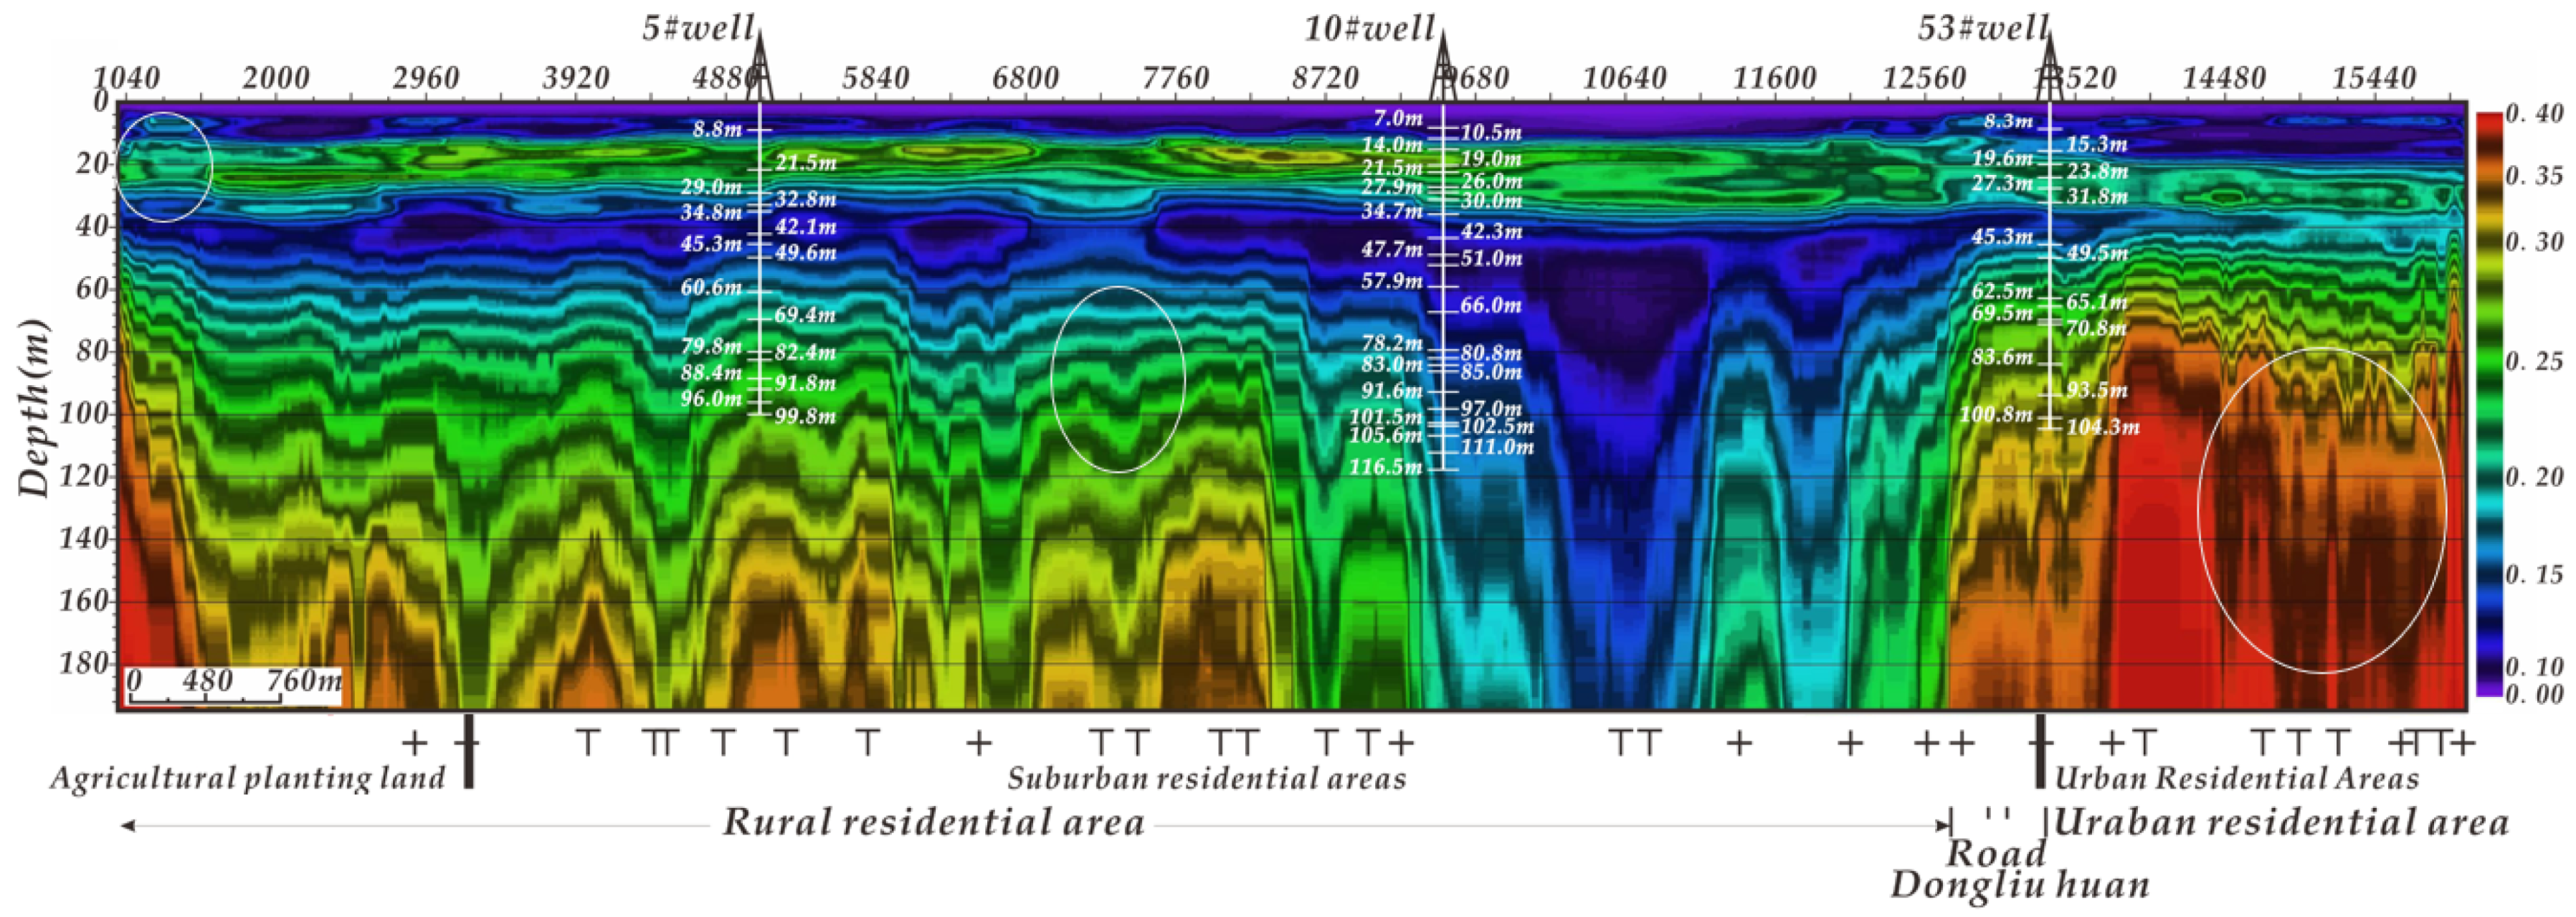
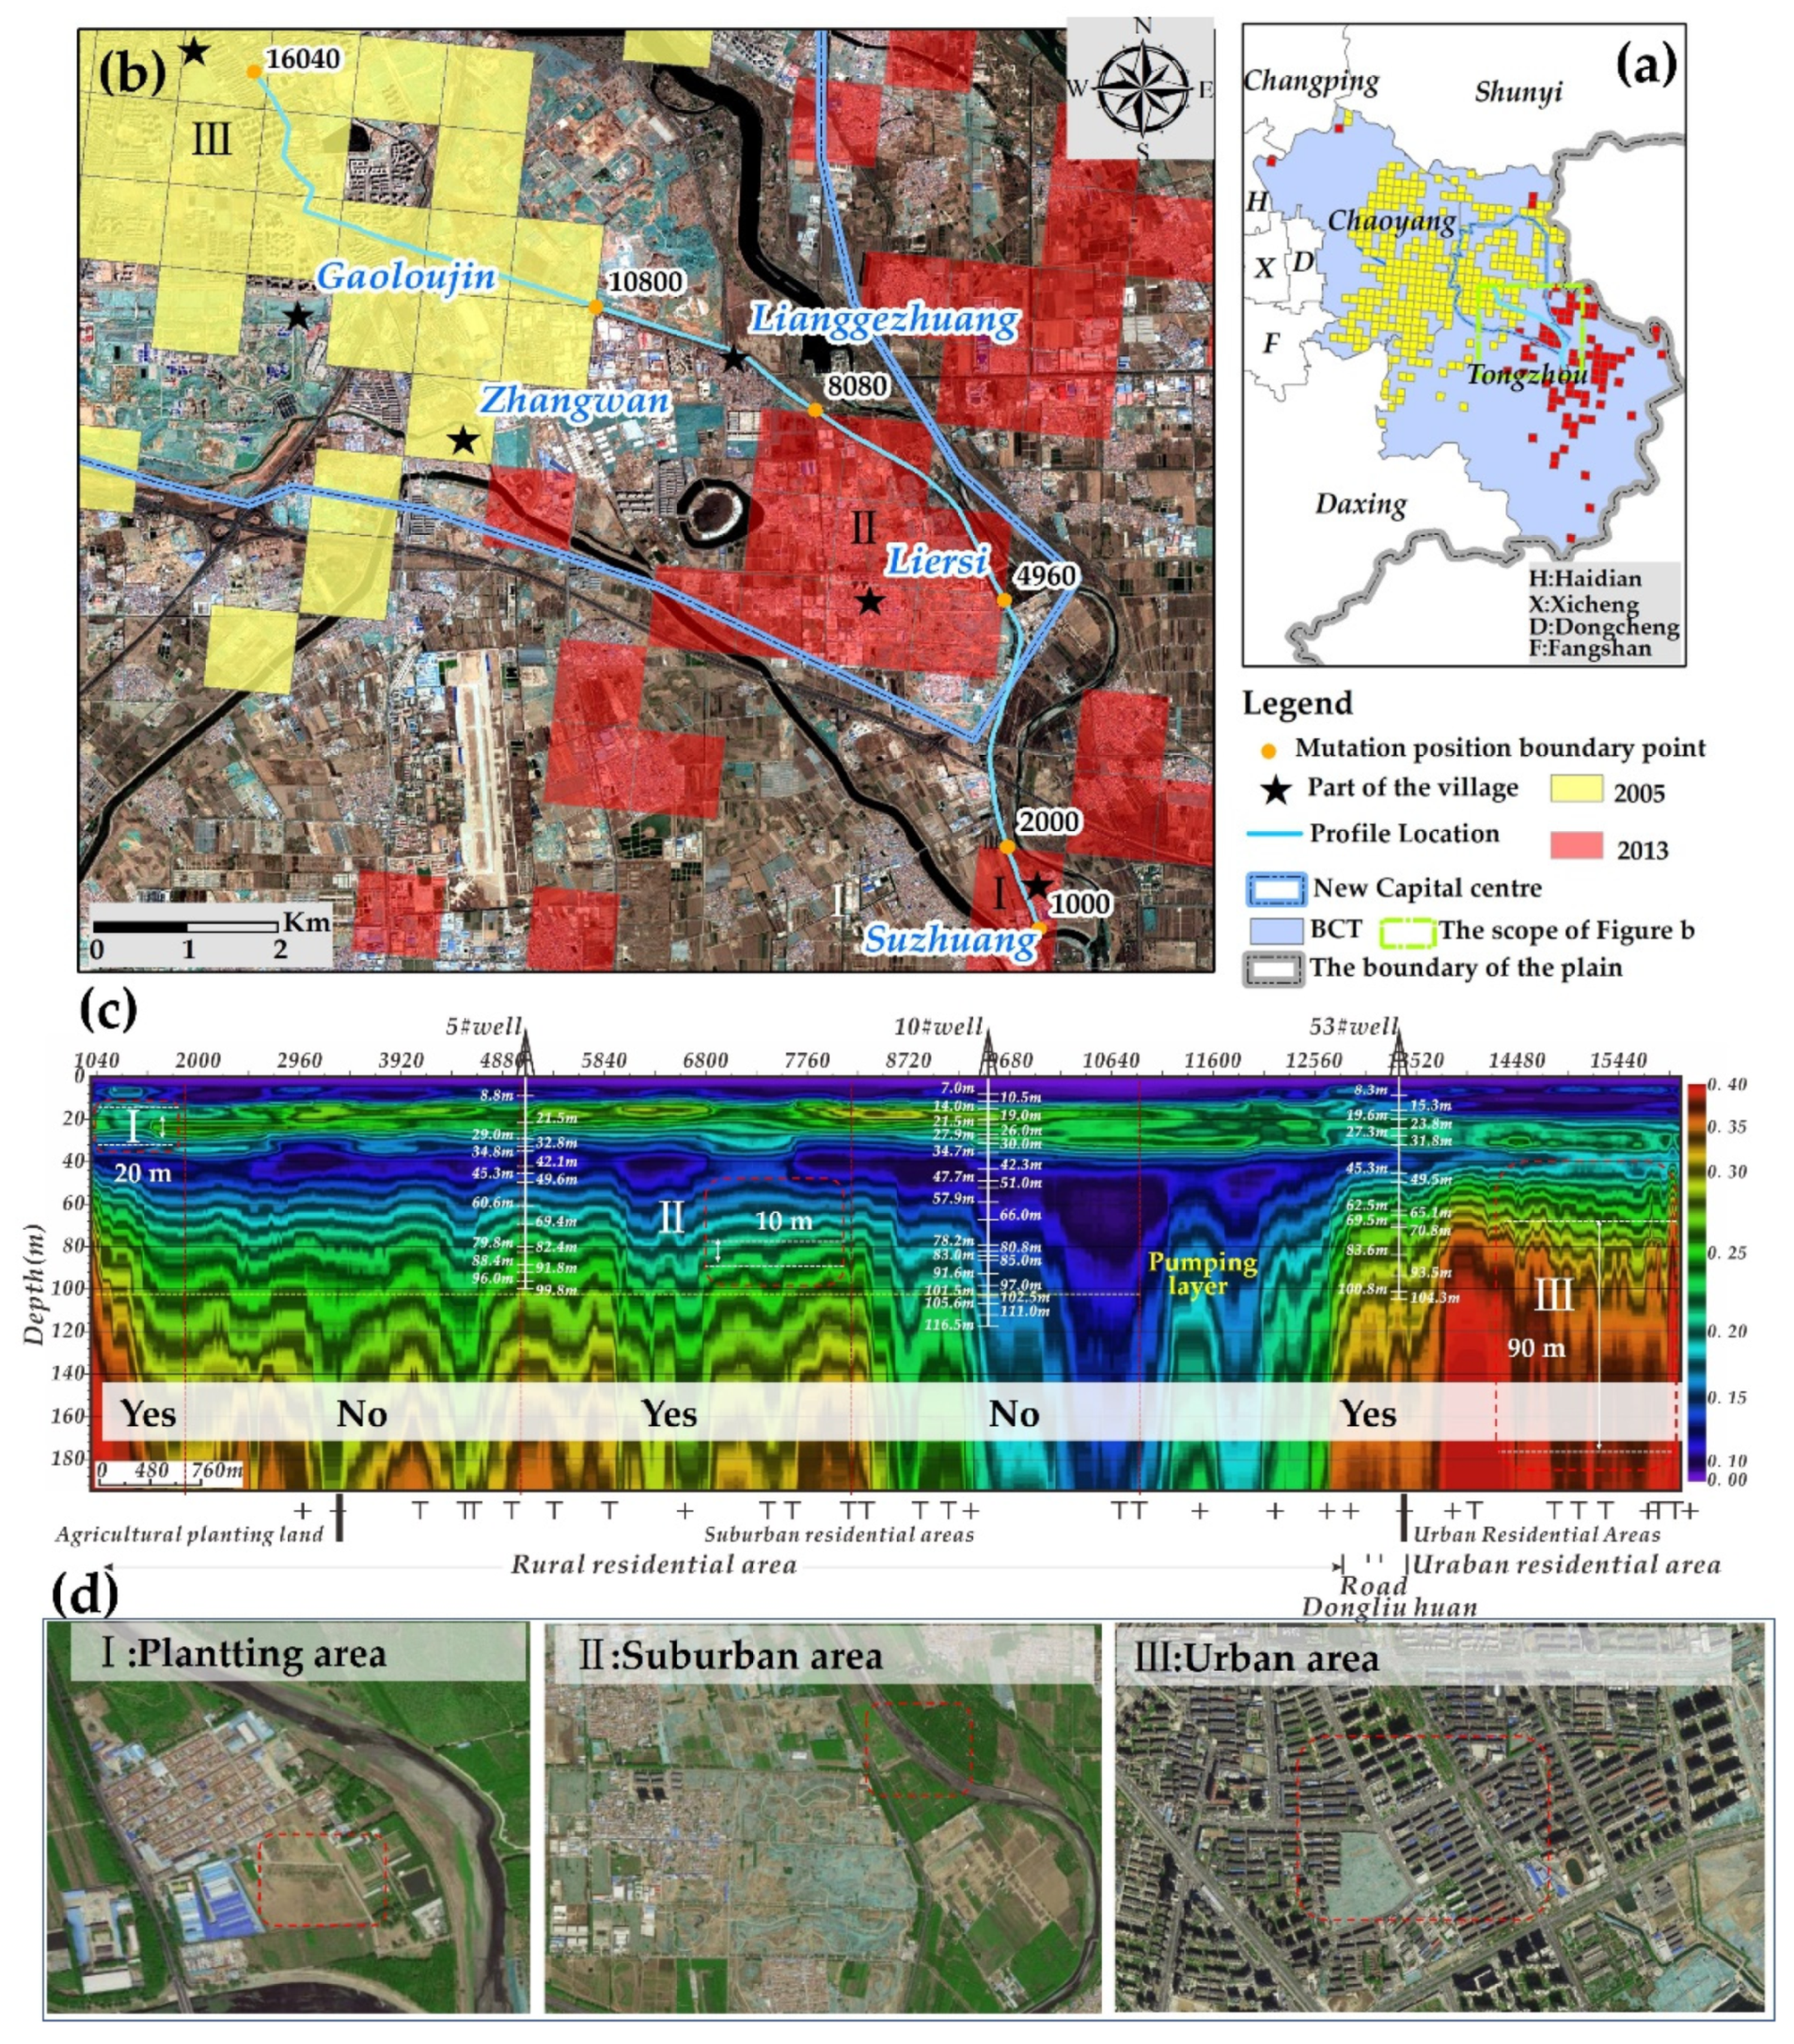
4.3. The Result of Formation Density in Typical Subsidence Area via SFR
5. Discussion
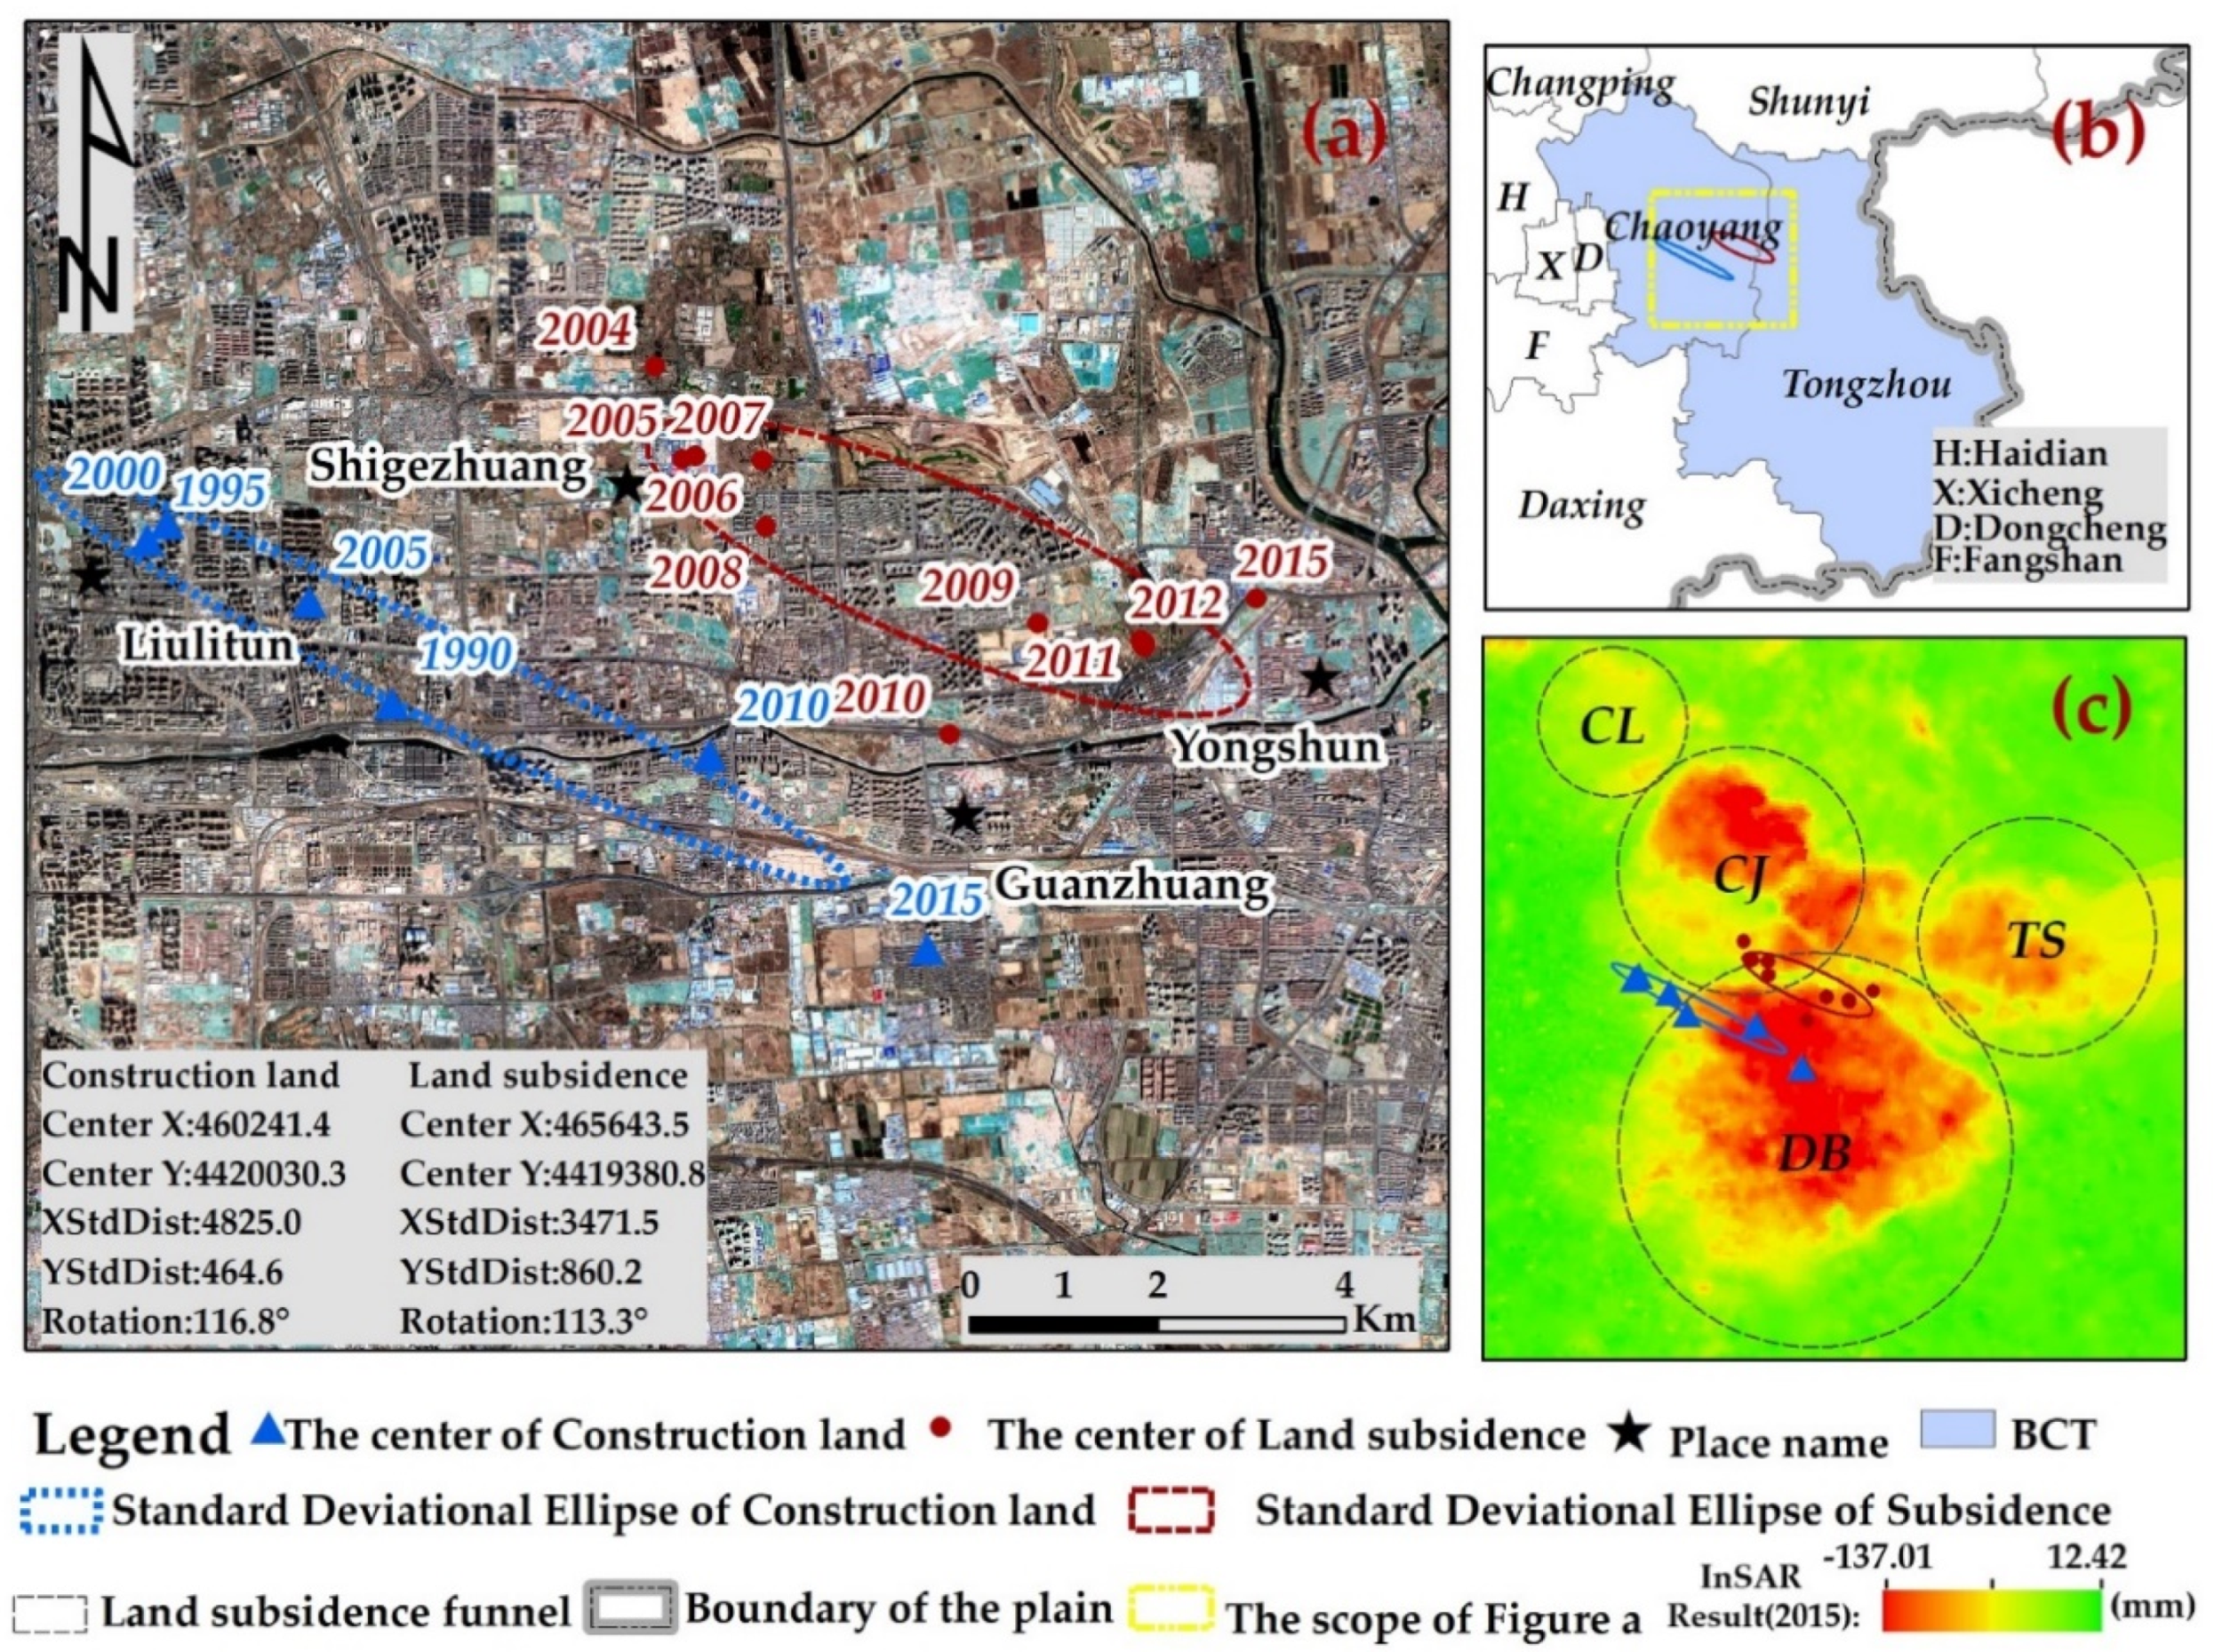
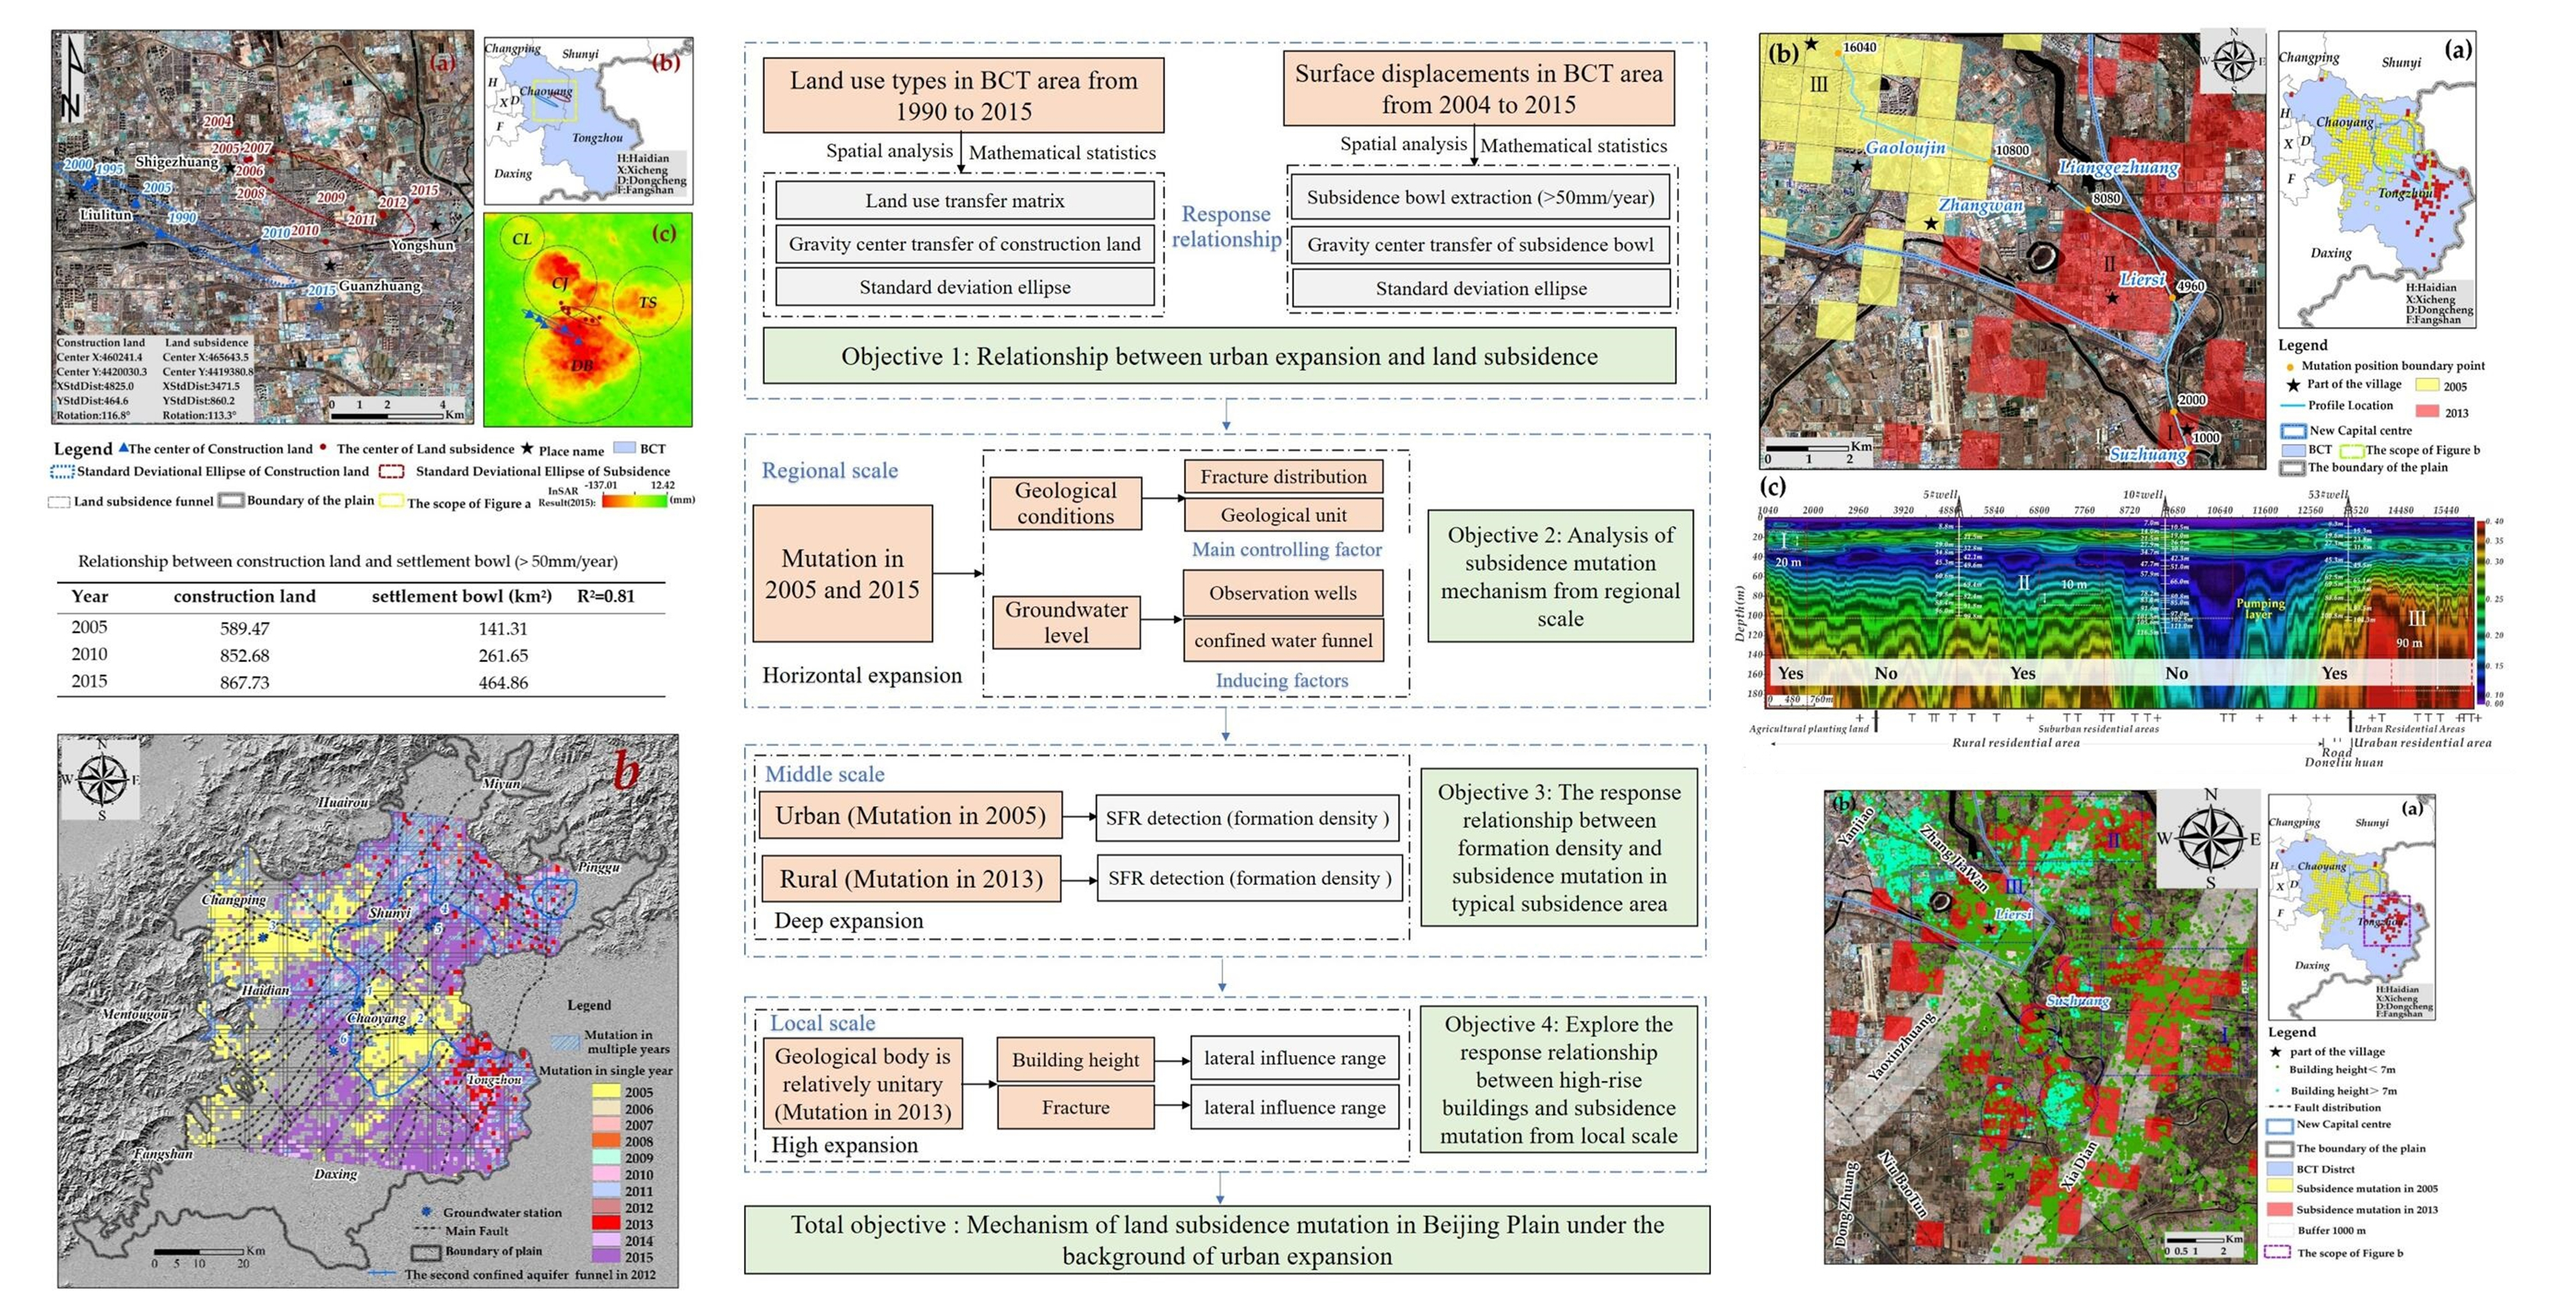
5.1. Relationship between Urban Expansion and Land Subsidence
5.2. Analysis of Subsidence Mutation Mechanism at Regional Scale
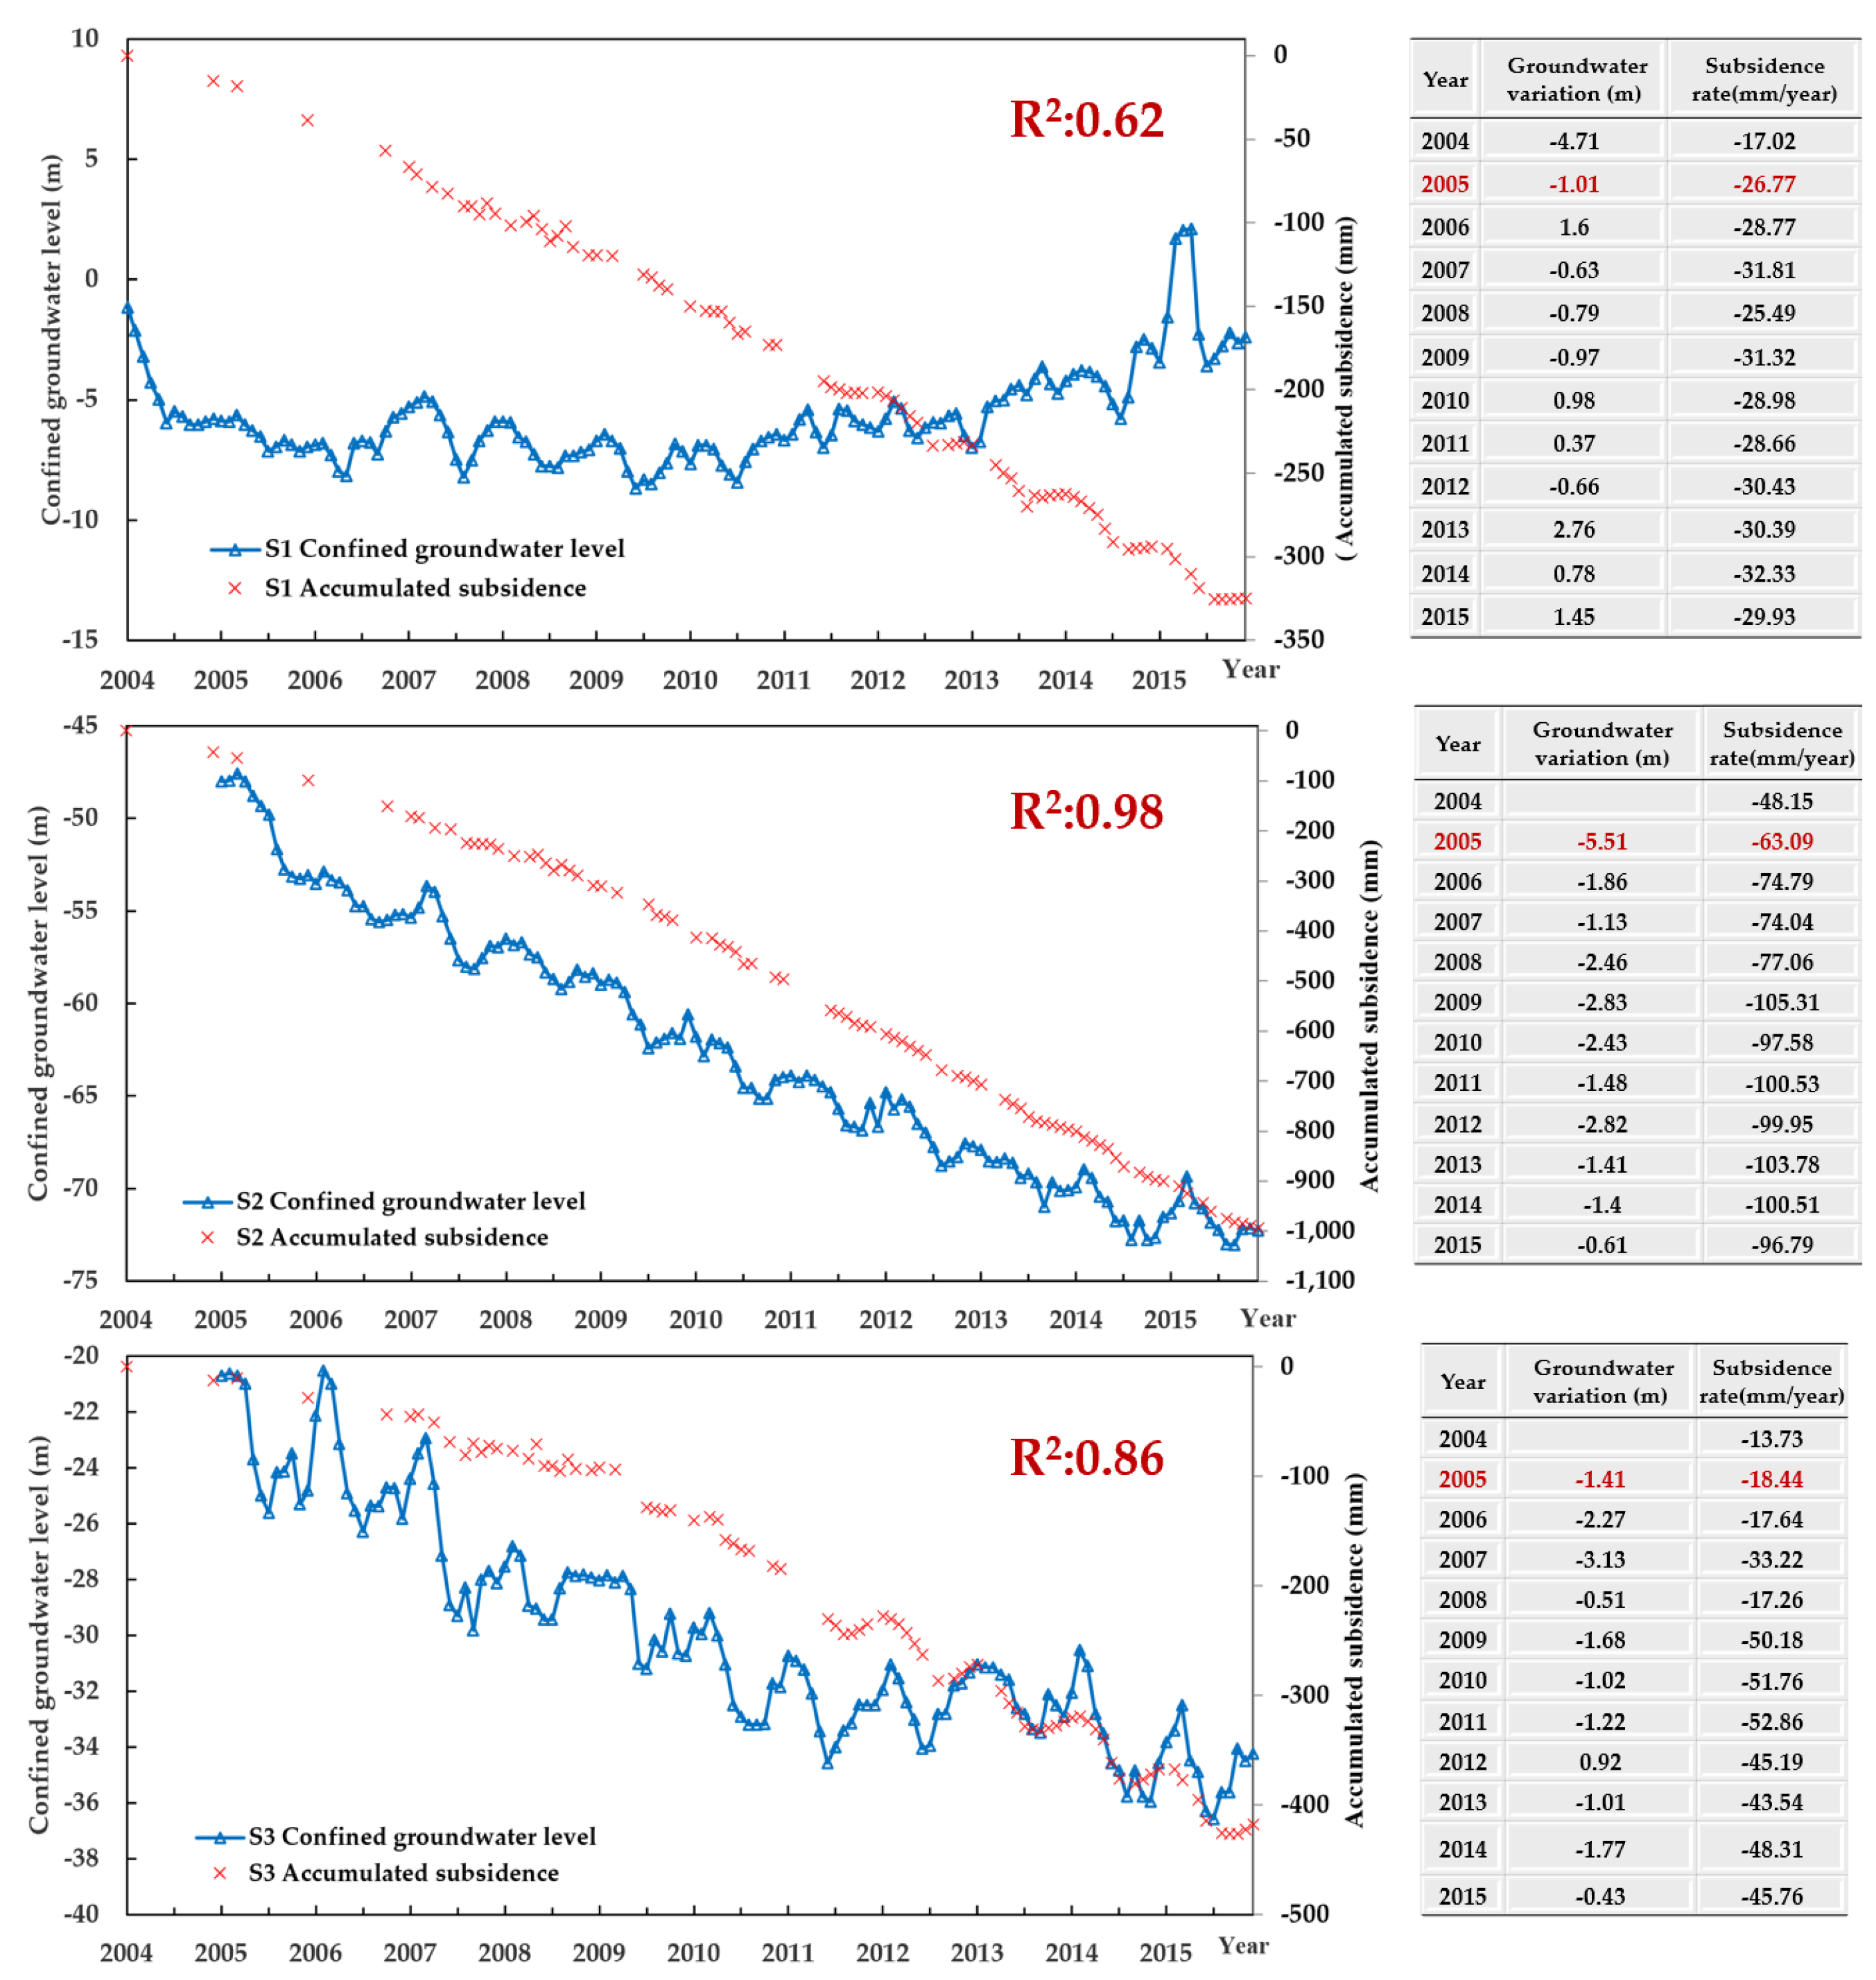
5.2.1. The Land Subsidence Mutation in 2005
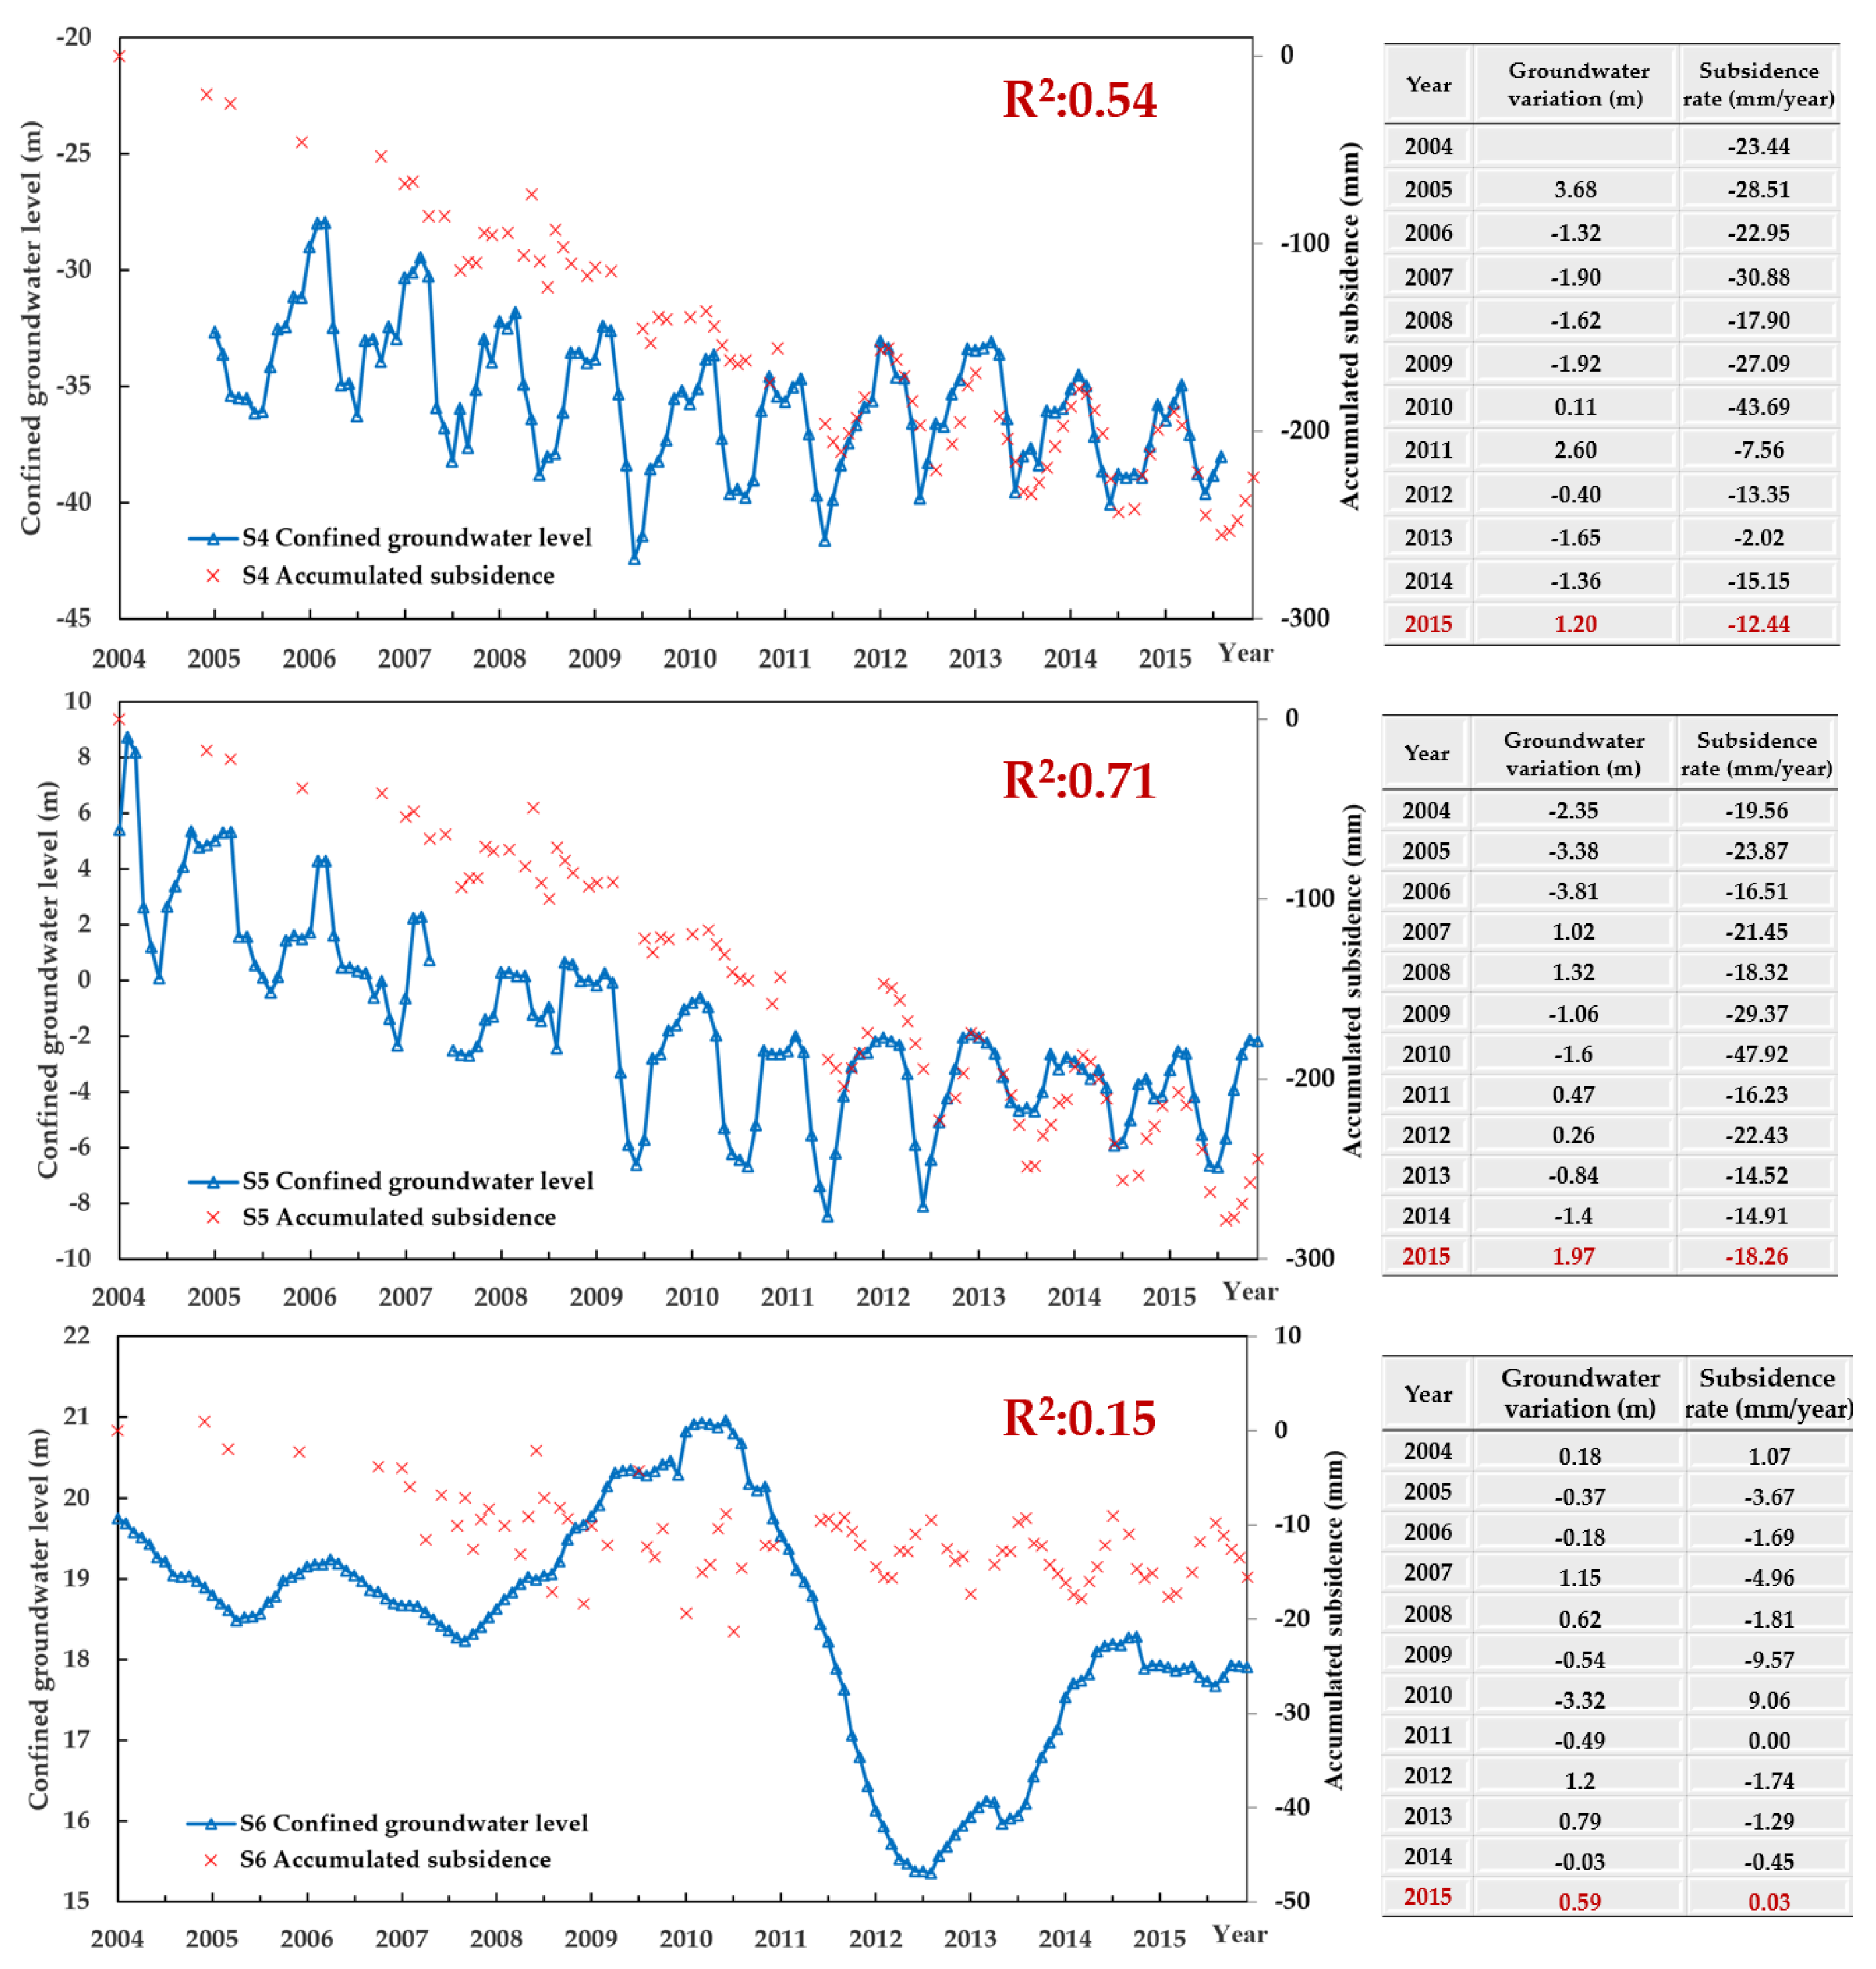
5.2.2. The Land Subsidence Mutation in 2015
5.3. The Response Relationship between Formation Density and Subsidence Mutation in Tongzhou Typical Subsidence Area
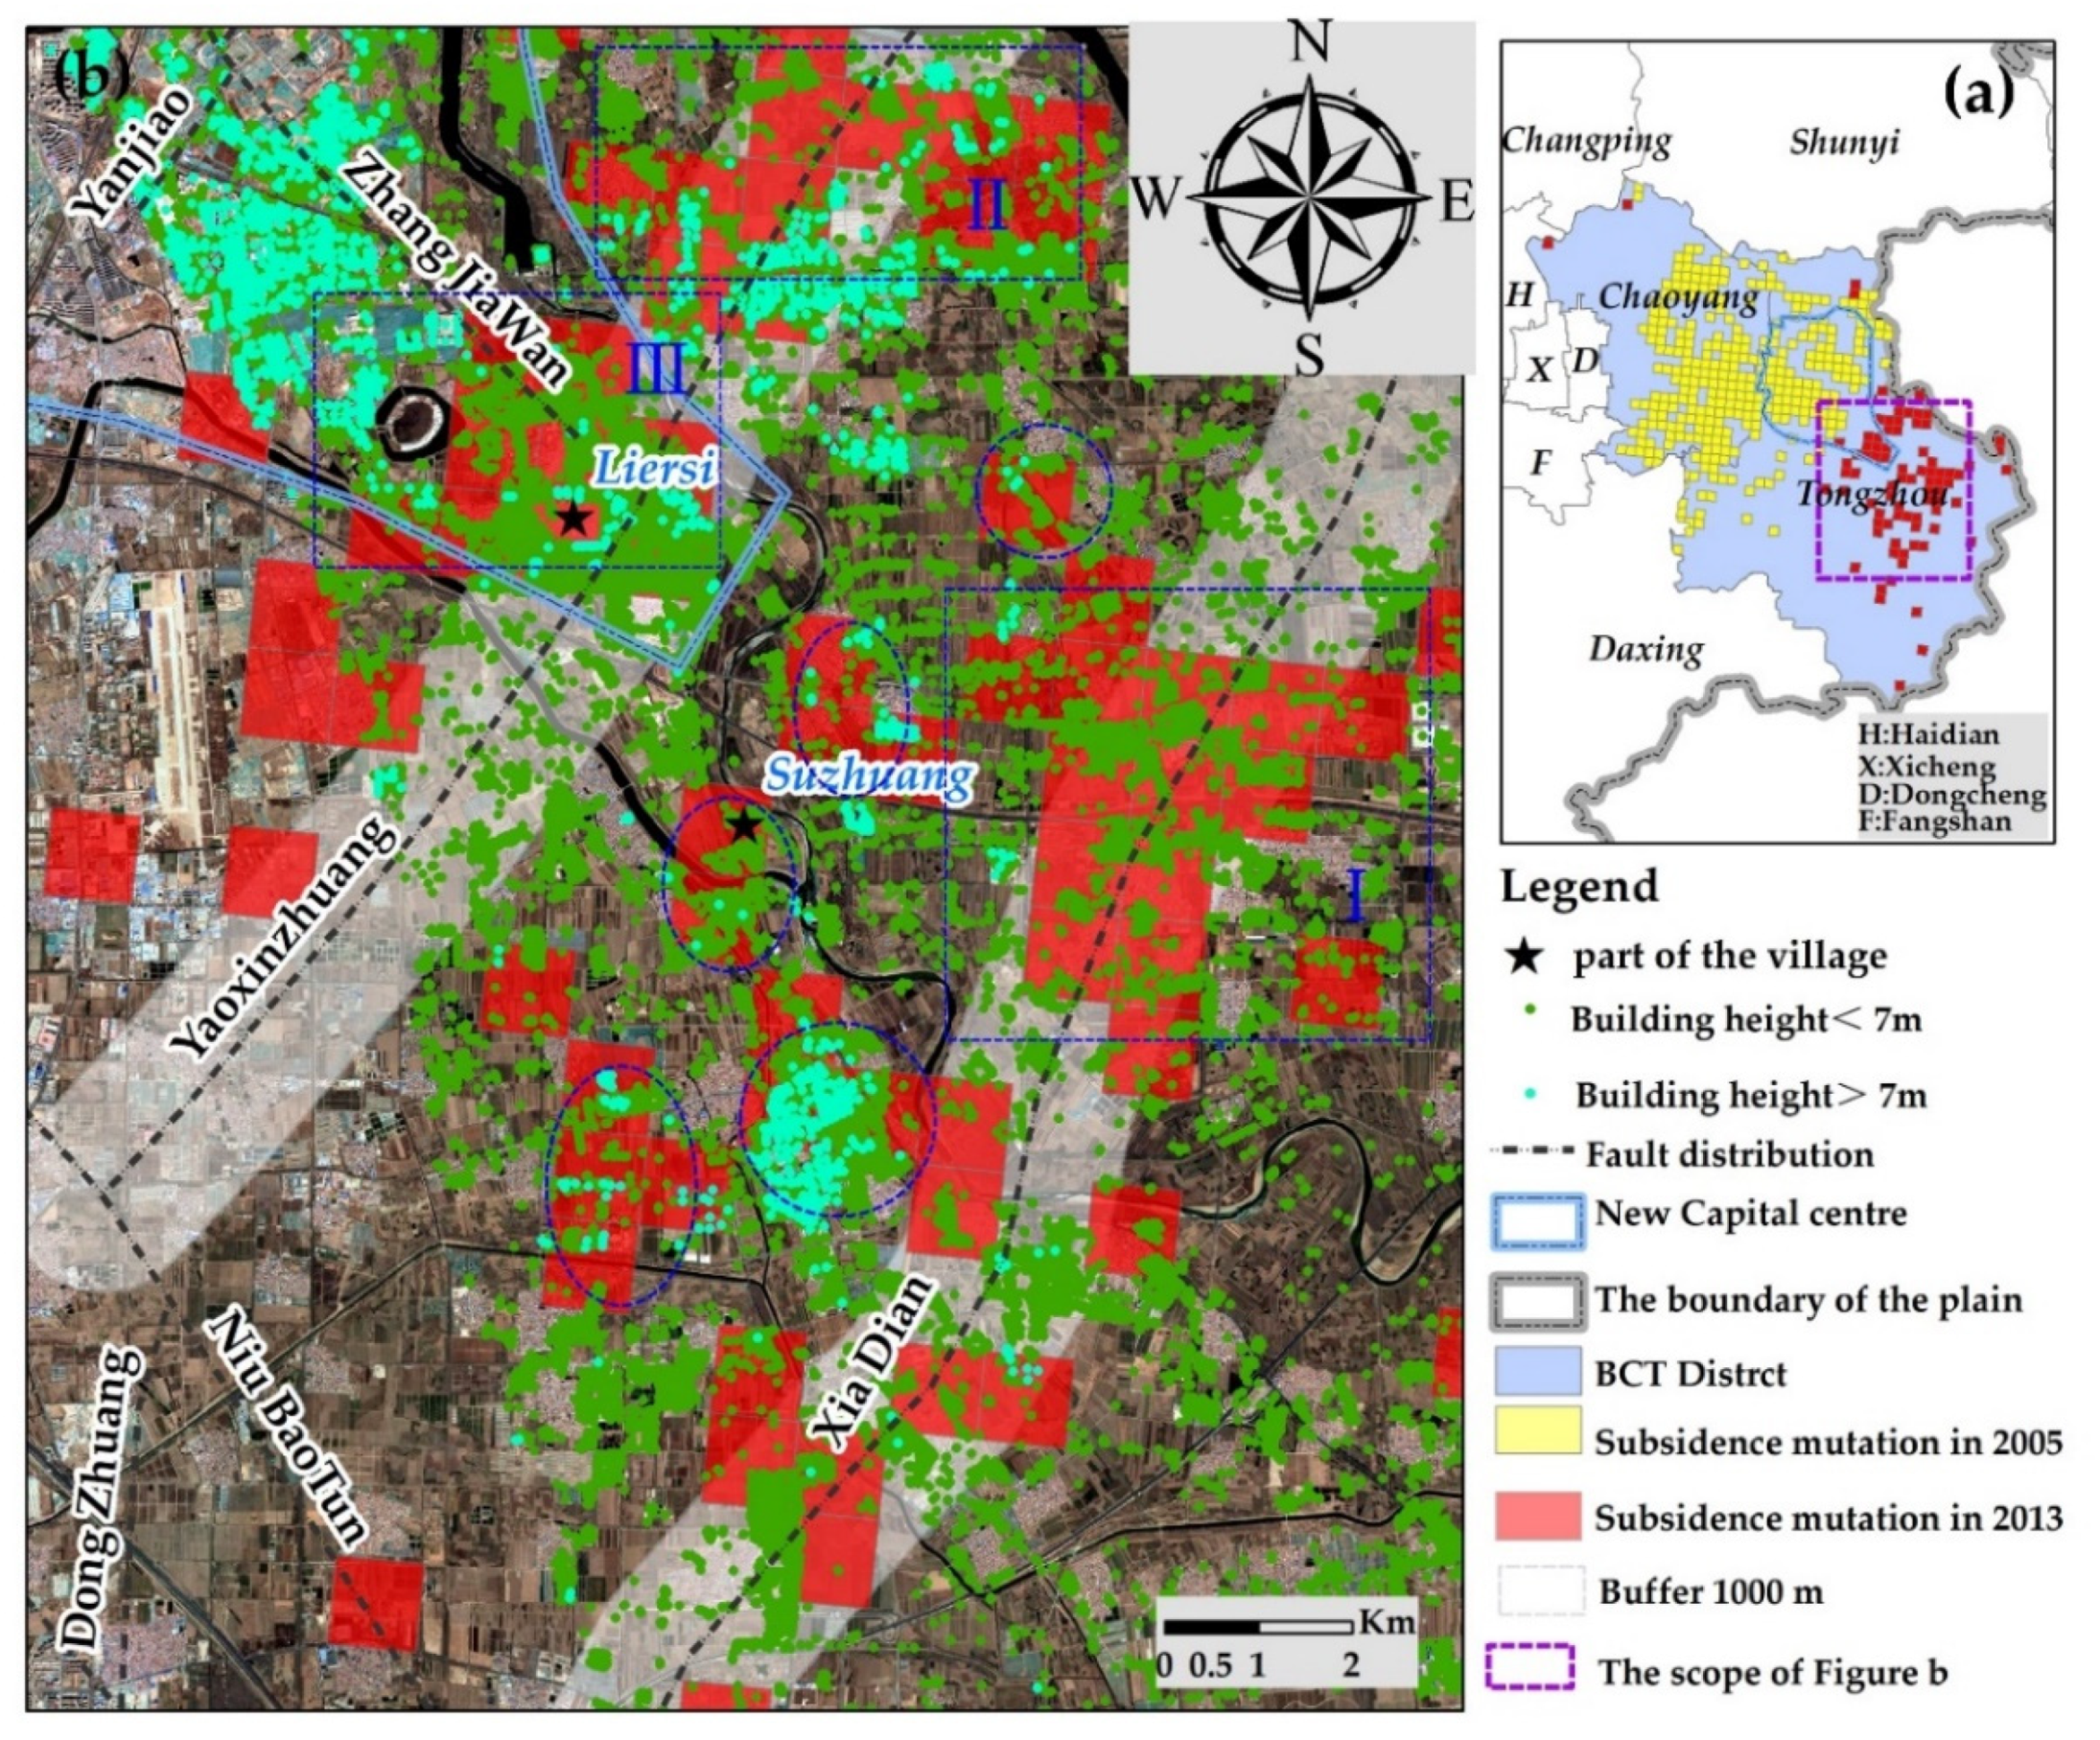
5.4. Explore the Response Relationship between High-Rise Buildings and Subsidence Mutation from Local Scale
6. Conclusions
Author Contributions
Funding
Data Availability Statement
Conflicts of Interest
References
- Zhu, L.; Gong, H.; Li, X.; Wang, R.; Chen, B.; Dai, Z.; Teatini, P. Land subsidence due to groundwater withdrawal in the northern Beijing plain, China. Eng. Geol. 2015, 193, 243–255. [Google Scholar] [CrossRef]
- Castellazzi, P.; Arroyo-Domínguez, N.; Martel, R.; Calderhead, A.I.; Normand, J.C.L.; Gárfias, J.; Rivera, A. Land subsidence in major cities of Central Mexico: Interpreting InSAR-derived land subsidence mapping with hydrogeological data. Int. J. Appl. Earth Obs. Geoinf. 2016, 47, 102–111. [Google Scholar] [CrossRef]
- Fiaschi, S.; Fabris, M.; Floris, M.; Achilli, V. Estimation of land subsidence in deltaic areas through differential SAR interferometry: The Po River Delta case study (Northeast Italy). Int. J. Remote Sens. 2018, 39, 8724–8745. [Google Scholar] [CrossRef]
- Motagh, M.; Shamshiri, R.; Haghshenas Haghighi, M.; Wetzel, H.-U.; Akbari, B.; Nahavandchi, H.; Roessner, S.; Arabi, S. Quantifying groundwater exploitation induced subsidence in the Rafsanjan plain, southeastern Iran, using InSAR time-series and in situ measurements. Eng. Geol. 2017, 218, 134–151. [Google Scholar] [CrossRef]
- Yastika, P.E.; Shimizu, N.; Abidin, H.Z. Monitoring of long-term land subsidence from 2003 to 2017 in coastal area of Semarang, Indonesia by SBAS DInSAR analyses using Envisat-ASAR, ALOS-PALSAR, and Sentinel-1A SAR data. Adv. Space Res. 2019, 63, 1719–1736. [Google Scholar] [CrossRef]
- Corbau, C.; Simeoni, U.; Zoccarato, C.; Mantovani, G.; Teatini, P. Coupling land use evolution and subsidence in the Po Delta, Italy: Revising the past occurrence and prospecting the future management challenges. Sci. Total Environ. 2019, 654, 1196–1208. [Google Scholar] [CrossRef]
- Guo, L.; Gong, H.; Li, J.; Zhu, L.; Xue, A.; Liao, L.; Sun, Y.; Li, Y.; Zhang, Z.; Hu, L.; et al. Understanding Uneven Land Subsidence in Beijing, China, Using a Novel Combination of Geophysical Prospecting and InSAR. Geophys. Res. Lett. 2020, 47. [Google Scholar] [CrossRef]
- Zhou, C.; Gong, H.; Chen, B.; Gao, M.; Cao, Q.; Cao, J.; Duan, L.; Zuo, J.; Shi, M. Land Subsidence Response to Different Land Use Types and Water Resource Utilization in Beijing-Tianjin-Hebei, China. Remote Sens. 2020, 12, 457. [Google Scholar] [CrossRef] [Green Version]
- Herrera-García, G.; Ezquerro, P.; Tomás, R.; Béjar-Pizarro, M.; López-Vinielles, J.; Rossi, M.; Mateos, R.M.; Carreón-Freyre, D.; Lambert, J.; Teatini, P.; et al. Mapping the global threat of land subsidence. Science 2021, 371, 34–36. [Google Scholar] [CrossRef]
- Chen, B.; Gong, H.; Chen, Y.; Li, X.; Zhou, C.; Lei, K.; Zhu, L.; Duan, L.; Zhao, X. Land subsidence and its relation with groundwater aquifers in Beijing Plain of China. Sci. Total Environ. 2020, 735, 139111. [Google Scholar] [CrossRef]
- Gong, H.; Pan, Y.; Zheng, L.; Li, X.; Zhu, L.; Zhang, C.; Huang, Z.; Li, Z.; Wang, H.; Zhou, C. Long-term groundwater storage changes and land subsidence development in the North China Plain (1971–2015). Hydrogeol. J. 2018, 26, 1417–1427. [Google Scholar] [CrossRef] [Green Version]
- Ng, A.; Wang, H.; Dai, Y.; Pagli, C.; Chen, W.; Ge, L.; Du, Z.; Zhang, K. InSAR Reveals Land Deformation at Guangzhou and Foshan, China between 2011 and 2017 with COSMO-SkyMed Data. Remote Sens. 2018, 10, 813. [Google Scholar] [CrossRef] [Green Version]
- Qu, F.; Zhang, Q.; Lu, Z.; Zhao, C.; Yang, C.; Zhang, J. Land subsidence and ground fissures in Xi’an, China 2005–2012 revealed by multi-band InSAR time-series analysis. Remote Sens. Environ. 2014, 155, 366–376. [Google Scholar] [CrossRef]
- Yin, J.; Yu, D.; Wilby, R. Modelling the impact of land subsidence on urban pluvial flooding: A case study of downtown Shanghai, China. Sci. Total Environ. 2016, 544, 744–753. [Google Scholar] [CrossRef] [PubMed] [Green Version]
- Guo, L.; Gong, H.; Zhu, F.; Zhu, L.; Zhang, Z.; Zhou, C.; Gao, M.; Sun, Y. Analysis of the Spatiotemporal Variation in Land Subsidence on the Beijing Plain, China. Remote Sens. 2019, 11, 1170. [Google Scholar] [CrossRef] [Green Version]
- Berardino, P.; Fornaro, G.; Lanari, R.; Sansosti, E. A new algorithm for surface deformation monitoring based on small baseline differential SAR interferograms. IEEE Trans. Geosci. Remote Sens. 2002, 40, 2375–2383. [Google Scholar] [CrossRef] [Green Version]
- Sansosti, E.; Berardino, P.; Bonano, M.; Calò, F.; Castaldo, R.; Casu, F.; Manunta, M.; Manzo, M.; Pepe, A.; Pepe, S.; et al. How second generation SAR systems are impacting the analysis of ground deformation. Int. J. Appl. Earth Obs. Geoinf. 2014, 28, 1–11. [Google Scholar] [CrossRef] [Green Version]
- Hooper, A. A multi-temporal InSAR method incorporating both persistent scatterer and small baseline approaches. Geophys. Res. Lett. 2008, 35. [Google Scholar] [CrossRef] [Green Version]
- Maghsoudi, Y.; van der Meer, F.; Hecker, C.; Perissin, D.; Saepuloh, A. Using PS-InSAR to detect surface deformation in geothermal areas of West Java in Indonesia. Int. J. Appl. Earth Obs. Geoinf. 2018, 64, 386–396. [Google Scholar] [CrossRef]
- Shamshiri, R.; Nahavandchi, H.; Motagh, M.; Hooper, A. Efficient Ground Surface Displacement Monitoring Using Sentinel-1 Data: Integrating Distributed Scatterers (DS) Identified Using Two-Sample t-Test with Persistent Scatterers (PS). Remote Sens. 2018, 10, 794. [Google Scholar] [CrossRef] [Green Version]
- Chen, B.; Gong, H.; Lei, K.; Li, J.; Zhou, C.; Gao, M.; Guan, H.; Lv, W. Land subsidence lagging quantification in the main exploration aquifer layers in Beijing plain, China. Int. J. Appl. Earth Obs. Geoinf. 2019, 75, 54–67. [Google Scholar] [CrossRef]
- Gao, M.; Gong, H.; Chen, B.; Li, X.; Zhou, C.; Shi, M.; Si, Y.; Chen, Z.; Duan, G. Regional Land Subsidence Analysis in Eastern Beijing Plain by InSAR Time Series and Wavelet Transforms. Remote Sens. 2018, 10, 365. [Google Scholar] [CrossRef] [Green Version]
- Chaussard, E.; Wdowinski, S.; Cabral-Cano, E.; Amelung, F. Land subsidence in central Mexico detected by ALOS InSAR time-series. Remote Sens. Environ. 2014, 140, 94–106. [Google Scholar] [CrossRef]
- Ge, L.; Ng, A.H.-M.; Li, X.; Abidin, H.Z.; Gumilar, I. Land subsidence characteristics of Bandung Basin as revealed by ENVISAT ASAR and ALOS PALSAR interferometry. Remote Sens. Environ. 2014, 154, 46–60. [Google Scholar] [CrossRef]
- Haghshenas Haghighi, M.; Motagh, M. Ground surface response to continuous compaction of aquifer system in Tehran, Iran: Results from a long-term multi-sensor InSAR analysis. Remote Sens. Environ. 2019, 221, 534–550. [Google Scholar] [CrossRef]
- Zuo, J.; Gong, H.; Chen, B.; Liu, K.; Zhou, C.; Ke, Y. Time-series evolution patterns of land subsidence in the eastern Beijing Plain, China. Remote Sens. 2019, 11, 539. [Google Scholar] [CrossRef] [Green Version]
- Chen, B.; Gong, H.; Li, X.; Lei, K.; Zhu, L.; Gao, M.; Zhou, C. Characterization and causes of land subsidence in Beijing, China. Int. J. Remote Sens. 2016, 38, 808–826. [Google Scholar] [CrossRef]
- Hu, L.; Dai, K.; Xing, C.; Li, Z.; Tomás, R.; Clark, B.; Shi, X.; Chen, M.; Zhang, R.; Qiu, Q.; et al. Land subsidence in Beijing and its relationship with geological faults revealed by Sentinel-1 InSAR observations. Int. J. Appl. Earth Obs. Geoinf. 2019, 82. [Google Scholar] [CrossRef]
- Lyu, M.; Ke, Y.; Guo, L.; Li, X.; Zhu, L.; Gong, H.; Constantinos, C. Change in regional land subsidence in Beijing after south-to-north water diversion project observed using satellite radar interferometry. GIScience Remote Sens. 2019, 57, 1–17. [Google Scholar] [CrossRef]
- Zhou, C.; Gong, H.; Chen, B.; Li, X.; Li, J.; Wang, X.; Gao, M.; Si, Y.; Guo, L.; Shi, M.; et al. Quantifying the contribution of multiple factors to land subsidence in the Beijing Plain, China with machine learning technology. Geomorphology 2019, 335, 48–61. [Google Scholar] [CrossRef]
- Zhu, L.; Franceschini, A.; Gong, H.; Ferronato, M.; Dai, Z.; Ke, Y.; Pan, Y.; Li, X.; Wang, R.; Teatini, P. The 3-D Facies and Geomechanical Modeling of Land Subsidence in the Chaobai Plain, Beijing. Water Resour. Res. 2020, 56. [Google Scholar] [CrossRef]
- Parker, D.C.; Manson, S.M.; Janssen, M.A.; Hoffmann, M.J.; Deadman, P. Multi-Agent Systems for the Simulation of Land-Use and Land-Cover Change: A Review. Ann. Assoc. Am. Geogr. 2008, 93, 314–337. [Google Scholar] [CrossRef] [Green Version]
- Shi, Y.; Song, H.; Shang, M.; Shao, M.; Lei, H. Analysis of Land Cover and Landscape Pattern Change in Beijing-Tianjin-Hebei Region Based on Globeland30 Data. J. Geogr. Inf. Syst. 2020, 12, 241–255. [Google Scholar] [CrossRef]
- Li, Y.; Gong, H.; Zhu, L.; Li, X.; Wang, R.; Guo, G. Characterizing land displacement in complex hydrogeological and geological settings: A case study in the Beijing Plain, China. Nat. Hazards 2017, 87, 323–343. [Google Scholar] [CrossRef]
- Lefever, D.W. Measuring Geographic Concentration by Means of the Standard Deviational Ellipse. Am. J. Sociol. 1926, 32, 88–94. [Google Scholar] [CrossRef]
- Wang, B.; Shi, W.; Miao, Z. Confidence analysis of standard deviational ellipse and its extension into higher dimensional euclidean space. PLoS ONE 2015, 10, e0118537. [Google Scholar] [CrossRef]
- Deng, Z.; Ke, Y.; Gong, H.; Li, X.; Li, Z. Land subsidence prediction in Beijing based on PS-InSAR technique and improved Grey-Markov model. GIScience Remote Sens. 2017, 54, 797–818. [Google Scholar] [CrossRef]
- Ng, A.H.-M.; Ge, L.; Li, X.; Zhang, K. Monitoring ground deformation in Beijing, China with persistent scatterer SAR interferometry. J. Geod. 2011, 86, 375–392. [Google Scholar] [CrossRef]


| Code ID | Groundwater Type | Well Depth (m) | Observation Period |
|---|---|---|---|
| S1 | Confined water | 112.33 | 2004.01–2015.12 |
| S2 | Confined water | 238.4 | 2005.01–2015.12 |
| S3 | Confined water | 151.28 | 2005.01–2015.12 |
| S4 | Confined water | 150 | 2005.01–2015.12 |
| S5 | Confined water | 80 | 2004.01–2015.12 |
| S6 | Confined water | 85.06 | 2004.01–2015.12 |
| Cultivated Land | Forest | Waters | Construction Land | Total | |
|---|---|---|---|---|---|
| Cultivated land | 450.62 | 5.93 | 3.42 | 10.05 | 470.02 |
| Forest | 0.01 | 0.93 | 0.16 | 0.00 | 1.10 |
| Grass land | 2.78 | 0.00 | 0.00 | 0.04 | 2.82 |
| Waters | 5.25 | 0.01 | 9.67 | 0.47 | 15.41 |
| Construction land | 541.74 | 5.97 | 29.62 | 290.40 | 867.73 |
| Unused land | 0.94 | 0.00 | 0.00 | 0.00 | 0.94 |
| Total | 1001.34 | 12.84 | 42.88 | 300.96 | 1358.02 |
| Year | Construction Land (km2) | Settlement Bowl (km2) R2 = 0.81 |
|---|---|---|
| 2005 | 589.47 | 141.31 |
| 2010 | 852.68 | 261.65 |
| 2015 | 867.73 | 464.86 |
| Code ID | Observation Period | Mutation Year | Thickness of Compressible Layer (m) | Hydrogeological Unit | Subsidence Location |
|---|---|---|---|---|---|
| S1 | 2004.01–2015.12 | 2005 | 110–140 | Middle–upper part of YDRAF | CJ subsidence bowl |
| S2 | 2005.01–2015.12 | 2005 | 170–200 | Interlacing position of CBRAF and YDRAF | DB subsidence bowl |
| S3 | 2005.01–2015.12 | 2005 | 200–230 | Middle part of NKDF | HS subsidence bowl |
| S4 | 2005.01–2015.12 | 2015 | 170–200 | Middle–upper part of CBRAF | Outside of ST subsidence bowl |
| S5 | 2004.01–2015.12 | 2015 | 170–200 | Middle-upper part of CBRAF | Outside of ST subsidence bowl |
| S6 | 2004.01–2015.12 | 2015 | 50–80 | Middle–upper part of YDRAF | Non-subsidence area |
Publisher’s Note: MDPI stays neutral with regard to jurisdictional claims in published maps and institutional affiliations. |
© 2021 by the authors. Licensee MDPI, Basel, Switzerland. This article is an open access article distributed under the terms and conditions of the Creative Commons Attribution (CC BY) license (https://creativecommons.org/licenses/by/4.0/).
Share and Cite
Guo, L.; Gong, H.; Ke, Y.; Zhu, L.; Li, X.; Lyu, M.; Zhang, K. Mechanism of Land Subsidence Mutation in Beijing Plain under the Background of Urban Expansion. Remote Sens. 2021, 13, 3086. https://doi.org/10.3390/rs13163086
Guo L, Gong H, Ke Y, Zhu L, Li X, Lyu M, Zhang K. Mechanism of Land Subsidence Mutation in Beijing Plain under the Background of Urban Expansion. Remote Sensing. 2021; 13(16):3086. https://doi.org/10.3390/rs13163086
Chicago/Turabian StyleGuo, Lin, Huili Gong, Yinghai Ke, Lin Zhu, Xiaojuan Li, Mingyuan Lyu, and Ke Zhang. 2021. "Mechanism of Land Subsidence Mutation in Beijing Plain under the Background of Urban Expansion" Remote Sensing 13, no. 16: 3086. https://doi.org/10.3390/rs13163086
APA StyleGuo, L., Gong, H., Ke, Y., Zhu, L., Li, X., Lyu, M., & Zhang, K. (2021). Mechanism of Land Subsidence Mutation in Beijing Plain under the Background of Urban Expansion. Remote Sensing, 13(16), 3086. https://doi.org/10.3390/rs13163086