Article

Targeted Rock Slope Assessment Using Voxels and Object-Oriented Classification

by
Ioannis Farmakis
1,*,
David Bonneau
1,
D. Jean Hutchinson
1 and
Nicholas Vlachopoulos
2
1
Department of Geological Sciences and Geological Engineering, Queen’s University, Kingston, ON K7L 3N6, Canada
2
Department of Civil Engineering, Royal Military College of Canada, Kingston, ON K7K 7B4, Canada
*
Author to whom correspondence should be addressed.
Remote Sens. 2021, 13(7), 1354; https://doi.org/10.3390/rs13071354
Submission received: 22 January 2021 / Revised: 24 March 2021 / Accepted: 25 March 2021 / Published: 1 April 2021
(This article belongs to the Special Issue Remote Sensing Analysis of Geologic Hazards)

Abstract

:
Reality capture technologies, also known as close-range sensing, have been increasingly popular within the field of engineering geology and particularly rock slope management. Such technologies provide accurate and high-resolution n-dimensional spatial representations of our physical world, known as 3D point clouds, that are mainly used for visualization and monitoring purposes. To extract knowledge from point clouds and inform decision-making within rock slope management systems, semantic injection through automated processes is necessary. In this paper, we propose a model that utilizes a segmentation procedure which delivers segments ready to classify and be retained or rejected according to complementary knowledge-based filter criteria. First, we provide relevant voxel-based features based on the local dimensionality, orientation, and topology and partition them in an assembly of homogenous segments. Subsequently, we build a decision tree that utilizes geometrical, topological, and contextual information and enables the classification of a multi-hazard railway rock slope section in British Columbia, Canada into classes involved in landslide risk management. Finally, the approach is compared to machine learning integrating recent featuring strategies for rock slope classification with limited training data (which is usually the case). This alternative to machine learning semantic segmentation approaches reduces substantially the model size and complexity and provides an adaptable framework for tailored decision-making systems leveraging rock slope semantics.

1. Introduction

Reality capture technologies, such as both terrestrial and aerial laser scanning and dense stereo-matching (also known as close-range sensing [1]), have become increasingly popular for visualization and monitoring purposes for geohazard assessment along rock slopes. Such technologies provide accurate and high-resolution (a few centimeters) n-dimensional spatial representations of our physical world, known as 3D point clouds. Many advances in the utilization of 3D point clouds have occurred over the last fifteen years [2,3]. These advances have predominantly focused on survey planning and optimization, pre-processing, registration, and change detection among periodically acquired datasets providing critical geometrical and geographical information of rock slopes. Such information includes: the exact change positioning [4,5,6], change volume (loss/gain) and shape [7,8], and motion kinematics [9,10]. These derivatives have proven quite useful for enriching the failure inventory building pipelines with valuable additional information with regard to landslide risk management. In addition, a significant amount of the workflow from data acquisition to processing and change detection has been automated [11]. There are, however, still efficiencies in automation that can be realized.
As CS discipline has been advancing rapidly, geoscientists have been interested in automated semantic labelling of 3D point clouds depicting natural scenes of geological and geotechnical engineering interest. As such, there has been a push to work within a multidisciplinary framework with a view to incorporate such computer advances within the geological realm. Although semantic segmentation is a well-investigated field in 2D image analysis [12,13,14] (including rasterized 2.5D representations such as DEMs), sound preliminary results for slope-scale landslide analysis purposes are now being published [15]. However, 3D point cloud semantic labelling is a relatively unexplored research area.
In rock slope management, only minor interest has been shown in knowledge extraction from 3D point clouds. A common yet very time-consuming practice includes the manual annotation of the content of a 3D point cloud. Masking processes have been adopted for semantic injection to point cloud time-series [8]. However, due to the amount of filtering and editing required, coupled with the users’ subjectivity, and the dynamic nature of a certain setting it might not always be a practical solution. Moreover, in datasets that do not include colour information the task becomes even more challenging. As a result, there is a great need to automate such processes to speed up current analysis frameworks and allow practitioners to interact with the computer more efficiently and make interpretations more quickly. This requires the integration of semantic segmentation approaches to extract the appropriate information for a certain task. However, the semantic concepts that are attached to case studies can vary depending on site-specific reasoning (e.g., considering a rock outcrop as the object, or its discontinuity planes, overhanging blocks, eroded areas.), and thus a single model cannot directly satisfy all the objectives. The engagement of semantic meaning into virtual 3D natural scenes including different geomaterials (rock, talus, soil, vegetation), landslide elements (i.e., scarp, deposition zone, toe, overhanging blocks), and other geomorphological features such as rock outcrops and debris channels is critical for an enhanced landslide risk assessment and management. The missing parts required for the completion of this enhanced management framework based on object identification are: interoperability, integration, and automation.
In this paper, an object-oriented knowledge-based semantic segmentation framework utilizing a voxel-based point cloud clustering approach [16] is proposed. The goal is to extract segments of the voxel grid (supervoxels or objects) in a way that the information is both transferable and reproducible, and one that permits flexible usage to benefit different application objectives. The approach aims to extract meaningful semantic information from a rock slope by replicating expert reasoning and knowledge. The final objective is to integrate spatio-semantic reasoning to landslide risk management frameworks by means of a geo-database that would directly link GIS concepts to 3D point clouds. The knowledge extraction phase includes the partitioning of the dataset into semantic objects and their characterization by means of geometrical, topological, and contextual descriptors, followed by a site-specific set of informed sequences, filters and rules used for classification. At this point, the lack of ground-truth reference datasets for training and validation discourages supervised learning in rock slope point cloud semantic segmentation. Object-oriented analysis is expected to bridge the gap towards the development of semantically rich point clouds of rock slope settings. It proposes a framework for the extraction of informative features and the incorporation of simple knowledge-based rules without overcomplicating the task. This study provides insights into the reliability challenges in rock slope semantic segmentation due to the absent of solid methodologies for generating and ensuring the quality of reference datasets and the suitability of traditional performance assessment protocols.

2. Current State and Related Works

Due to the increasing use of 3D point clouds in geosciences research, a wide range of very-high-resolution information has become available, including geographical, spectral, intensity, and full waveform data sets. However, point cloud analyses for geo-engineering purposes typically aim to exploit geographical information (XYZ) by means of geometric and topographic signatures using low-level local descriptors at user-defined point neighbourhoods. To semantically label complex natural scenes, local descriptors are usually assigned to the neighbourhoods’ origin points which are then fed to ML classifiers. Low-level descriptors refer to features that can be understood by an end-user without any previous processing knowledge, but do not carry any semantic meaning. Such descriptors (also known as features or attributes) are typically computed based on PCA by encoding the XYZ point sets into a 3D structure tensor (3 × 3 covariance matrix), and calculating its eigenvalues (λ1, λ2, λ3) and eigenvectors [17]. Other features, such as intensity and/or colour, can be used for specific analyses but are rarely applied since intensity requires a series of non-trivial corrections to be applied in order to be consistently reliable and the latter is not a usable discriminator except where contrast results from different rock or soil formations, the products of rock weathering or vegetation cover.
The geometric and topographic low-level local descriptors are products of the eigenvalues and eigenvectors derived from PCA applied on the XYZ space of the point neighbourhoods. Such descriptors have been commonly accepted by the geosciences community and the expeditious calculation of them has been recently enabled within the popular open-source 3D point cloud processing software CloudCompare v.2.10. These geometric descriptors are: normalized eigenvalues (p1, p2, p3), omnivariance, linearity, planarity, sphericity, anisotropy, eigenentropy, and sum of eigenvalues (definitions of these parameters can be found in [18]). Additional eigen-based descriptors are the parameters of slope and aspect that are computed based on the orientation of the eigenvector corresponding to the lowest eigenvalue (normal vector). The subsequent ML-based classification of the 3D point cloud can be conducted based on low-level local descriptors calculated within one of the three types of point neighbourhoods (Figure 1) listed below:
  • Single-sized point neighbourhoods;
  • Multi-sized point neighbourhoods; and,
  • Adjusted-sized point neighbourhoods.
In geosciences research involving scenes of geo-engineering interest, only the first two types of point neighbourhoods, as shown in Figure 1a,b, have been considered so far in the literature. In particular, [19] proposed the CANUPO methodology that includes a SVM [20] classification based on the dimensionality (normalized eigenvalues) of single-sized point neighbourhoods. The size of the point neighbourhood is determined based on the analysis of the balanced accuracy of the SVM classifier over a range of different sizes. The CANUPO approach has had high prediction scores among classes such as defining ground and vegetation as well as fine- and coarse-grained debris areas [21].
More recently, [22] employed a RF [23] classification based on a large number of low-level local descriptors derived from multi-sized point neighbourhoods (Figure 1c) utilizing an approach adopted in point cloud processing (e.g., [24,25,26,27]). In particular, they examined the suitability of geometric, topographic, intensity, and difference descriptors to the classification of areas of rock, talus, vegetation, and snow on rock cuts adjacent to highways in Colorado, USA. The descriptors used were calculated within point neighbourhoods of ten different sizes between 0.1 m and 5 m. Their analysis of the aforementioned four classes (bedrock, talus, vegetation, and snow) found that a combination of geometric and topographic descriptors generates high discriminating power between bedrock and talus. In detail, the descriptors used are: normalized eigenvalues (p1, p2, p3) as geometric descriptors, as well as the mean, standard deviation, skewness, and kurtosis of slope as topographic descriptors, resulting in a total of 70 feature vectors. The calculation of the above slope statistics requires the normal vector calculation for individual points in each neighbourhood, based on another smaller neighbourhood. The performance of that model was compared to the SVM-based CANUPO model showing 0.07, 0.1, and 0.14 higher F1-score for vegetation, talus, and bedrock classes, respectively. F1-score is a weighted average of precision and recall and ranges up to 1, with higher values indicating better performance. The formulation of the different evaluation metrics is provided in 5.1.
The third type of point neighbourhoods (adjusted-sized: Figure 1c) has been used by [18] in an urban scene classification problem. This approach incorporates the estimation of the optimal neighbourhood size for each point. The optimization is achieved by minimizing the Shannon entropy (a measure of unpredictability) [28] within each point’s neighbourhood through the evaluation of a range of sizes. This approach inspired the voxel size selection process incorporated in the proposed method and is also considered as a featuring strategy for the ML model in the comparison section.
An alternative approach published by [29] includes the application of an object-oriented framework in the field of landslide geomorphology. They investigated a rotational landslide through object-based erosion monitoring on a soil slope, utilizing geometrical information derived from TLS point clouds. The process was initiated with a primary over-segmentation of the scene by means of k-means clustering at the point level, followed by a seeded region growing algorithm with randomly selected seed points. In addition to the clustering process, a 2D (x, y coordinates) maximum distance to the seed point threshold was applied in order to keep the segments (objects) small. The subsequent object classification is performed based on a RF classifier using 43 object descriptors as well as expert-based topological refinement rules for corrections, achieving an overall F1-score of 0.82.
The work by [30] on the development of a point cloud based rockfall hazard assessment methodology also includes a morphology classification component. In their study, the authors proposed an unsupervised rule-based rock slope classification scheme based on a decision tree applied to a grid structure projected to the best-fit plane of the entire point cloud. The scheme includes classes such as intact, closely- and widely- spaced, and fragmented rock, as well as talus and overhangs based on each cell’s (0.05 m) slope angle and roughness (i.e., low roughness cells are classified as either intact rock or talus based on a slope threshold). However, the classification result was only qualitatively evaluated and thus no performance metrics are available.

3. Materials and Methods

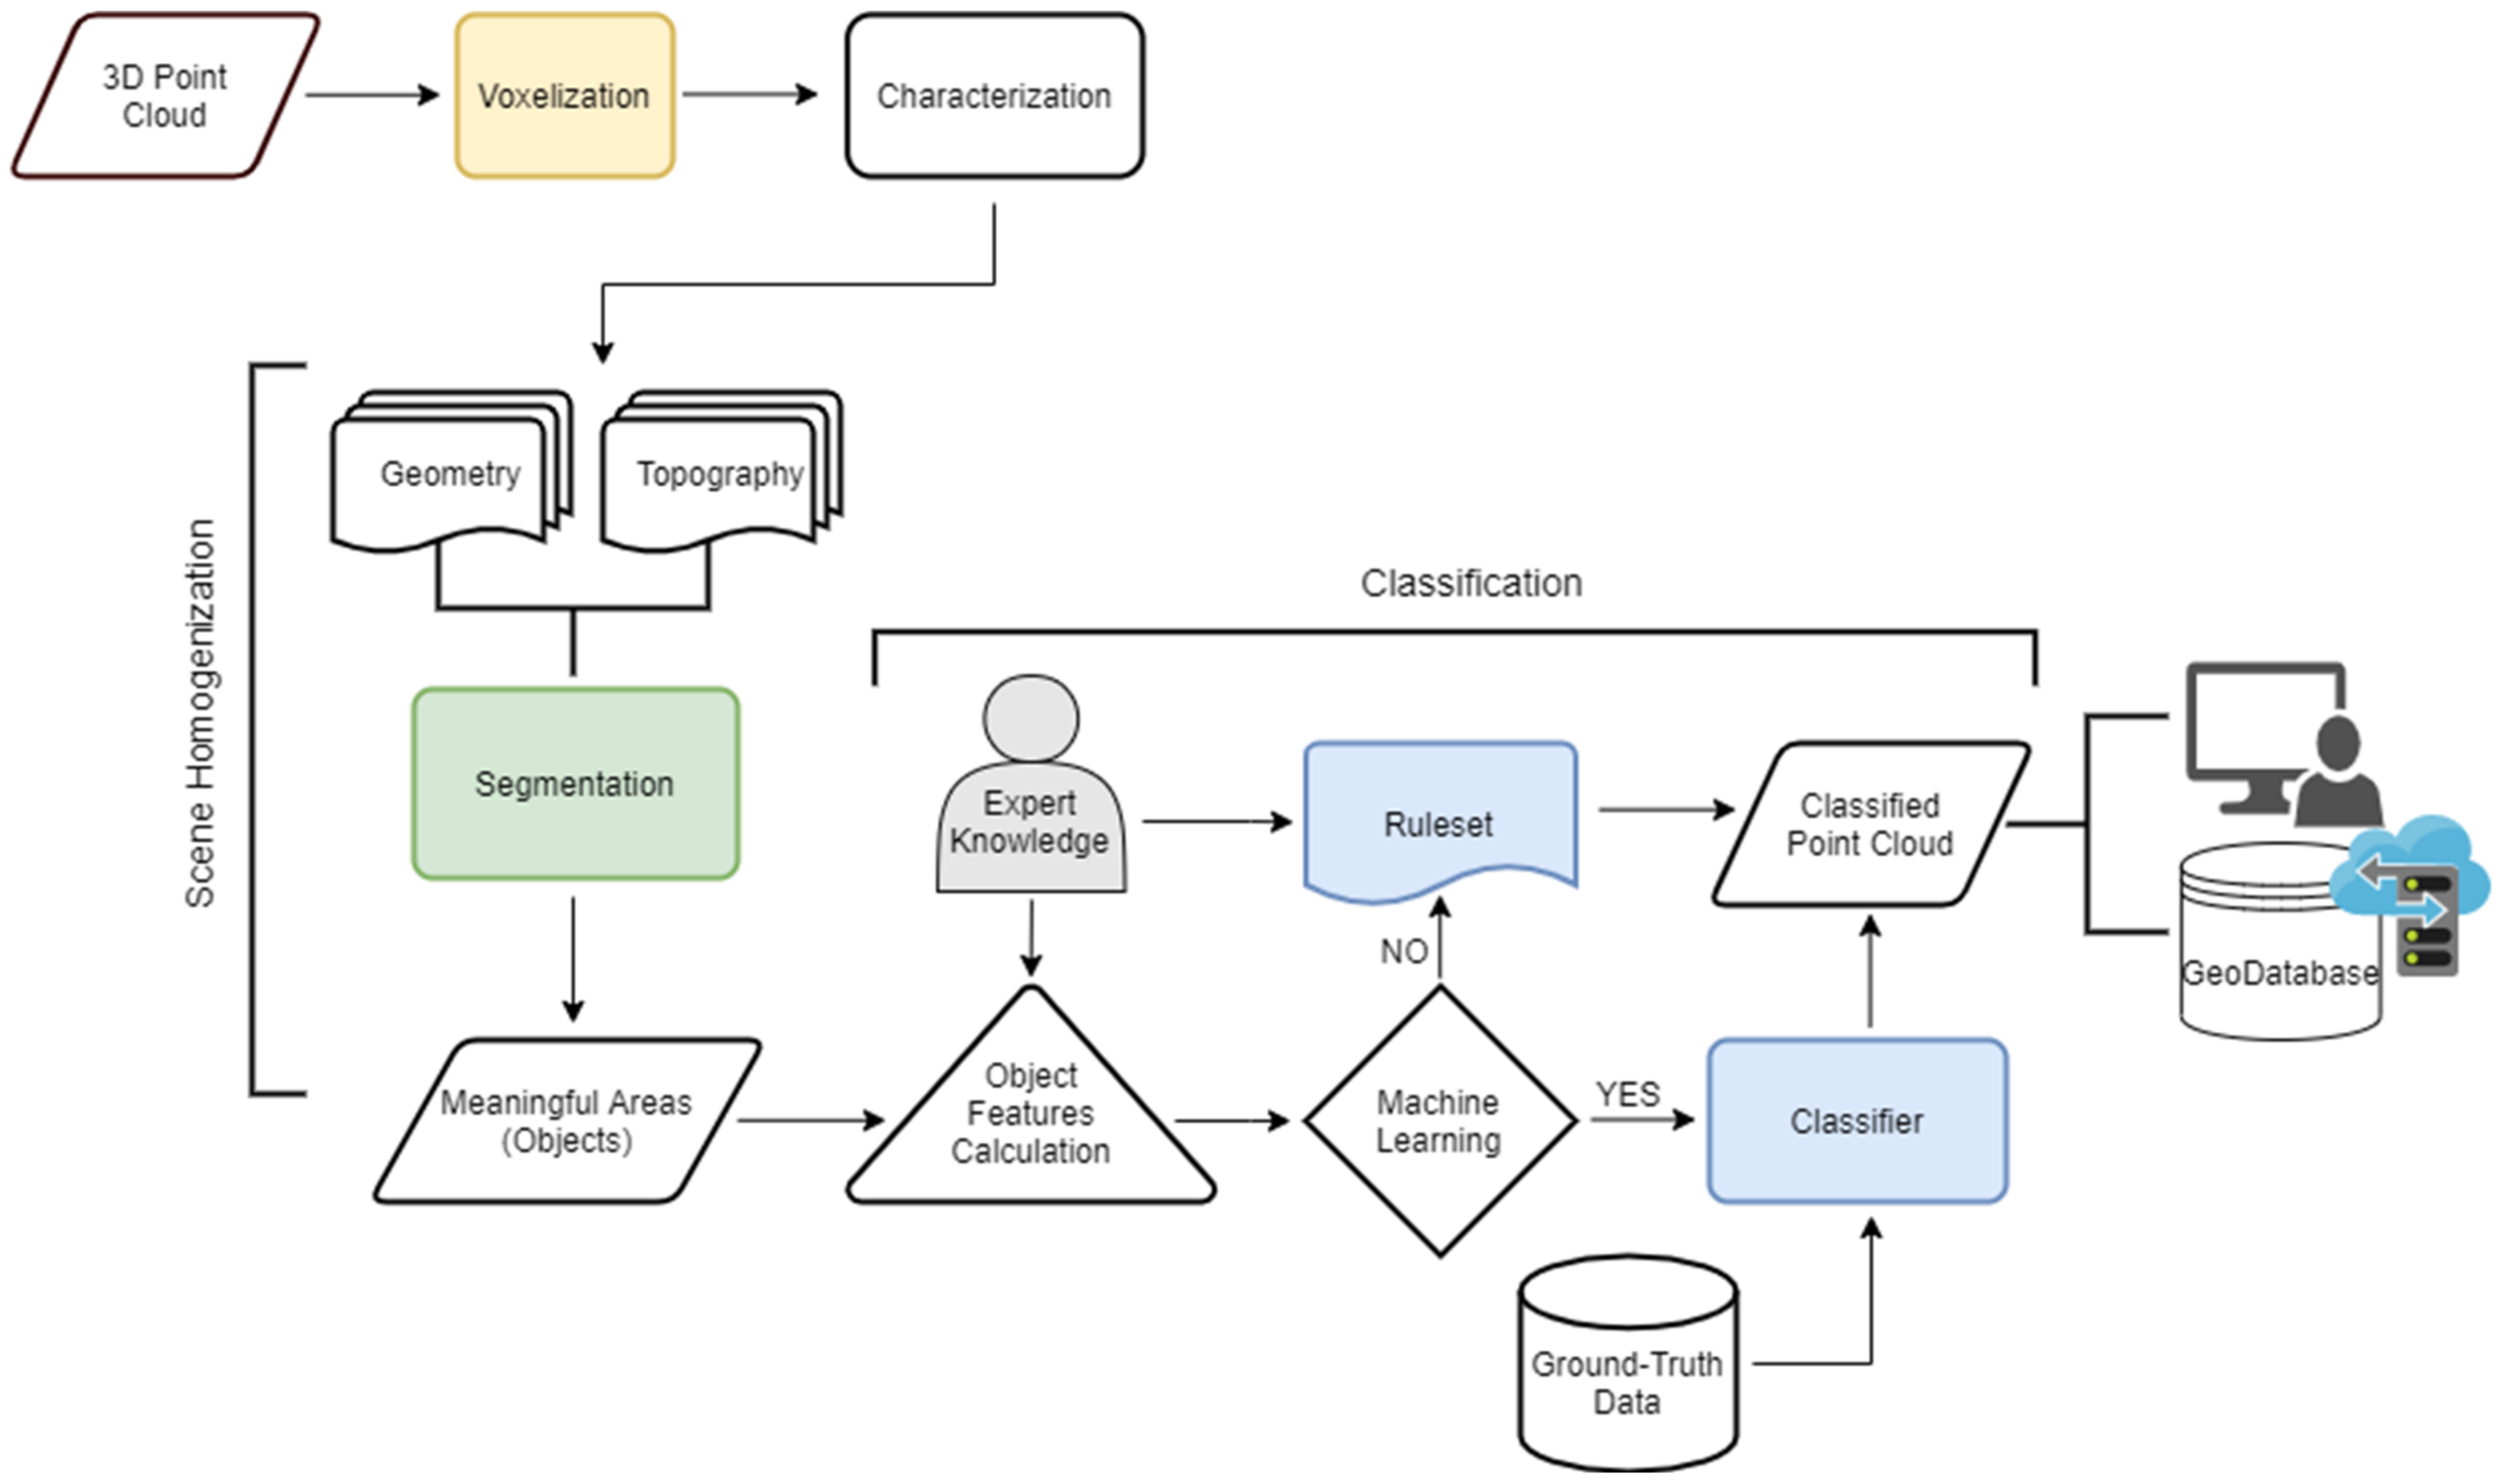
The proposed object-oriented framework is focused on addressing the inherent lack of structure and semantic meaning of 3D point clouds, as pointed out by [29]. The primary objective of the model is to replicate the human perception. This is achieved by homogenizing the raw 3D point cloud to delineate perceptually meaningful segments or semantic object primitives (homogenous and meaningful areas with respect to the geometry and topography of the whole scene) using an unsupervised segmentation process. These segments aim at balancing the conflicting goals of reducing the complexity of a scene while avoiding under-segmentation and can be essentially extracted by any segmentation algorithm. Semantic objects can be combined in application-dependent classes within the subsequent knowledge-based classification task substituting the initial mapping unit (e.g., spherical point neighbourhoods or voxels). Many methods for object recognition rely on the organization of the scene into semantic objects since they are better aligned with edges than a sphere or cube. This is essentially the principal of the object-oriented model, leveraging the new properties that these newly formed object primitives yield. The methodology can be summarized in three steps: voxelization, scene homogenization, and classification. A detailed schematic representation of the entire proposed semantic segmentation workflow is provided in Figure 2.

3.1. Study Dataset

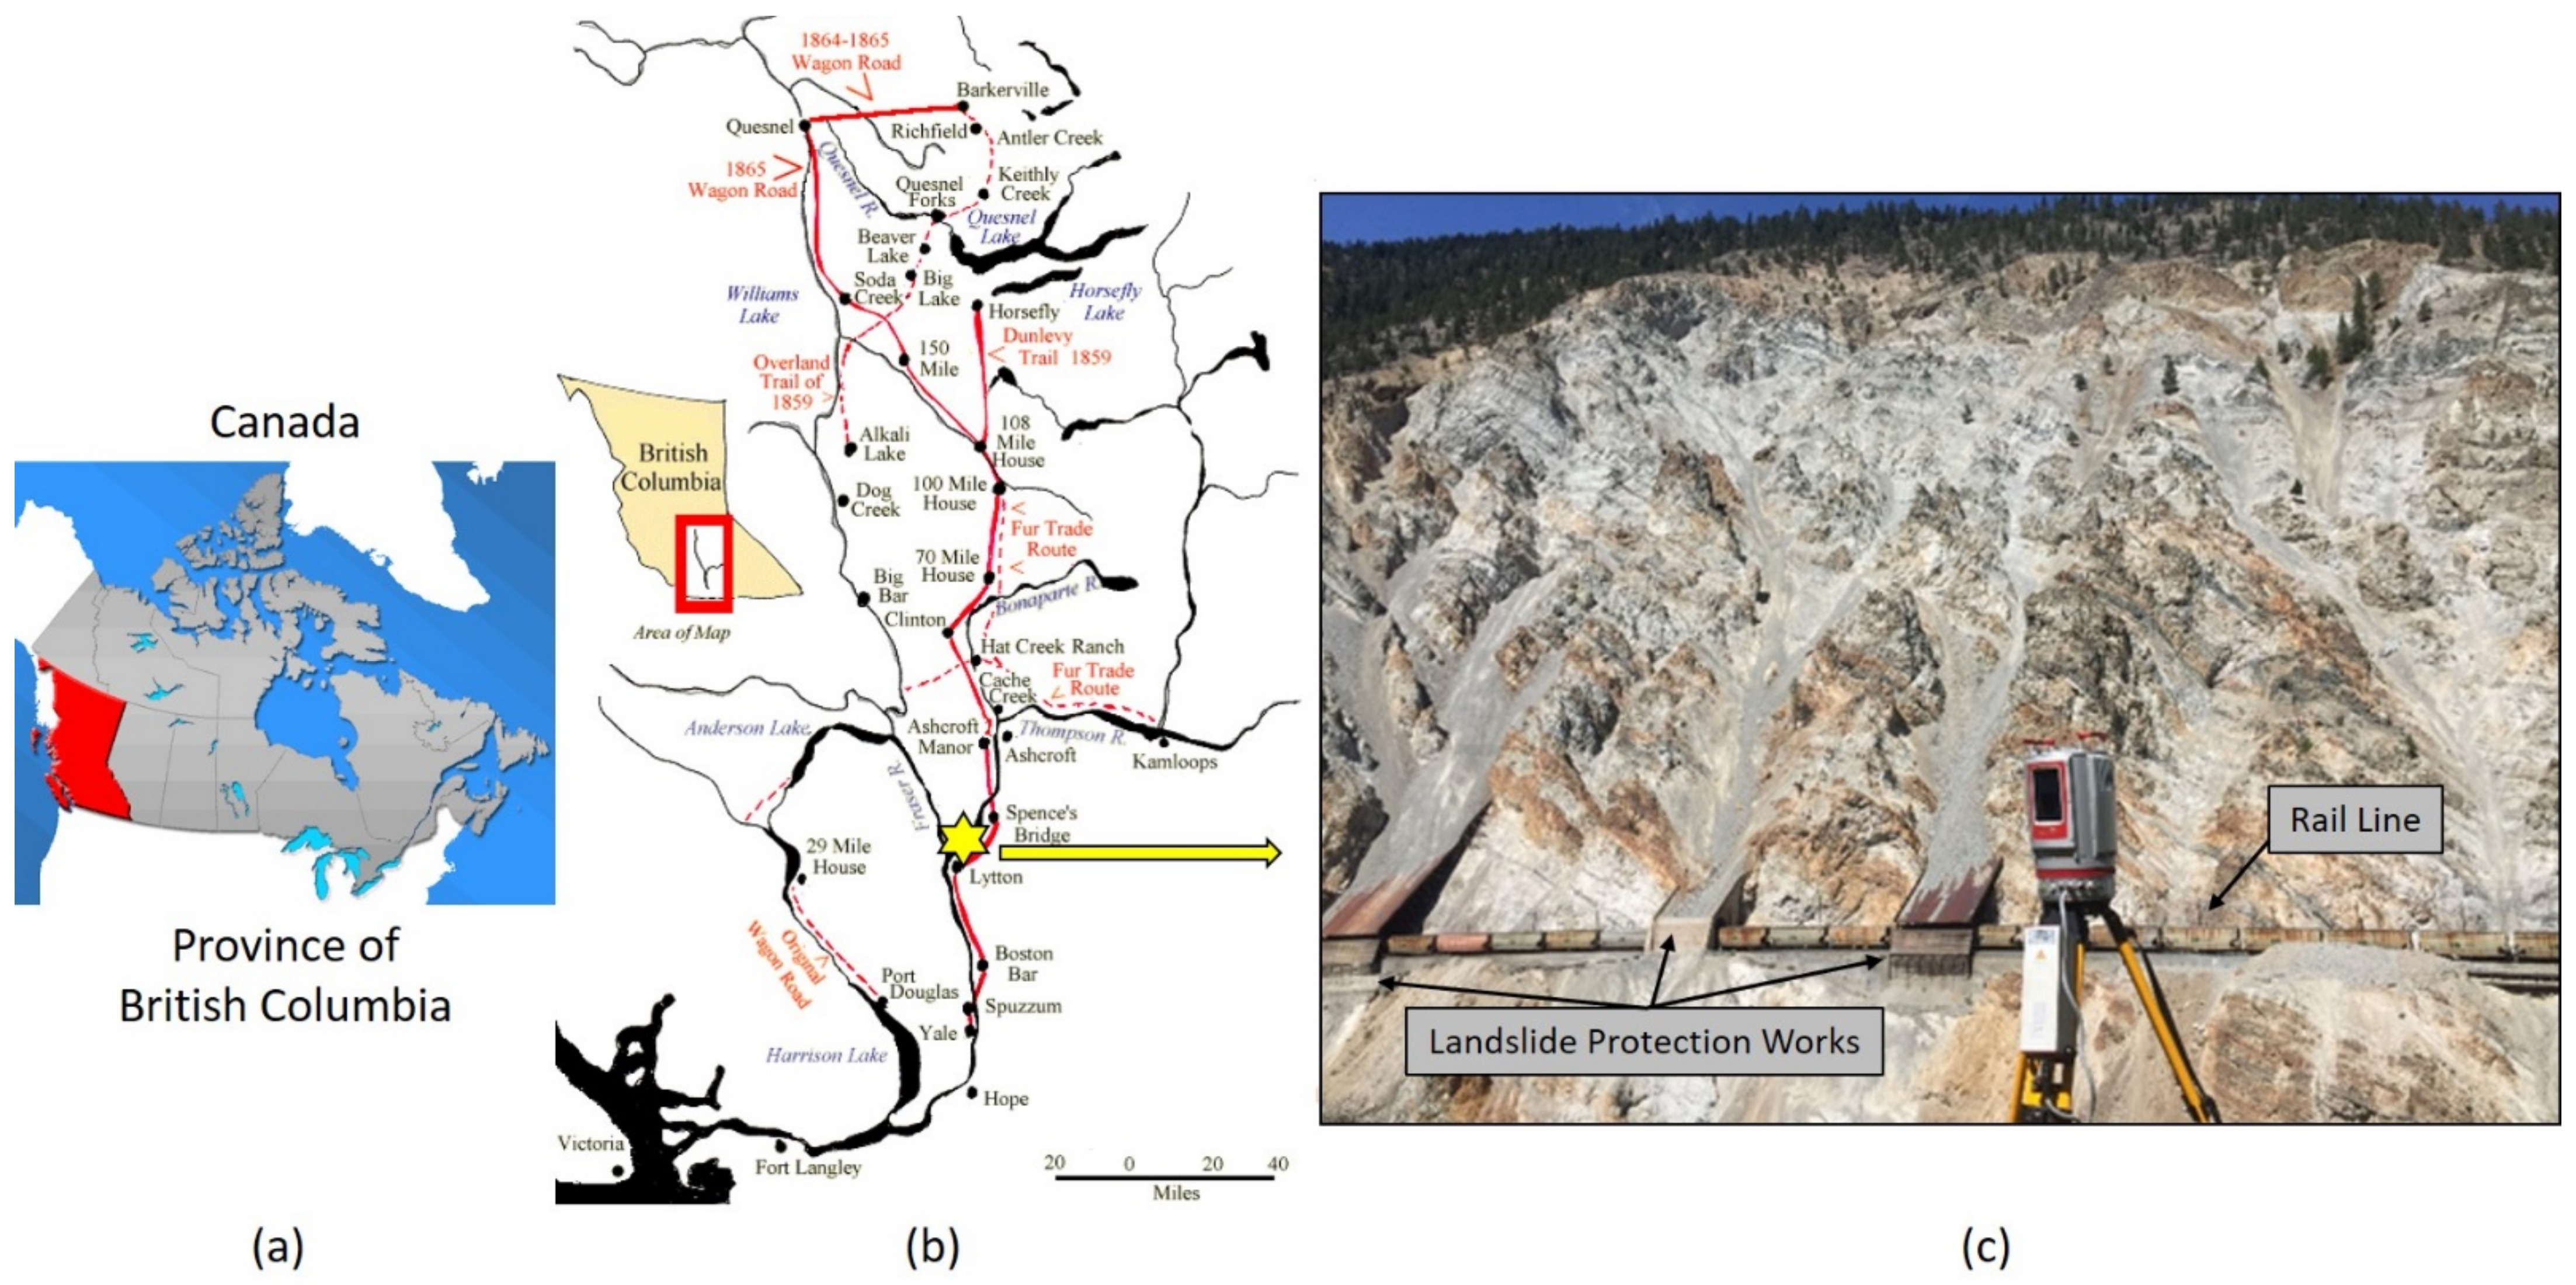
A section of a steep natural slope in the White Canyon, British Columbia, Canada as shown in Figure 3 is investigated for the purposes of this study. The terrain mainly consists of large rock exposures and debris accumulations on a 500 m high slope above the railway line running adjacent to the Thompson River. The setting, without vegetation, and with a clear line-of-sight for the scanner, is an ideal case to demonstrate the identification of the two major material classes and the associated geomorphological features observed along natural rock slopes. Large and long debris channels are present between the rock outcrops which generate regular rockfalls. Both rockfalls and debris flows can impact the railway line, which is protected by rocksheds, ditches, and slide detector fences as shown in Figure 3. As part of the Canadian Railway Ground Hazard Research Program (RGHRP), the site has been scanned multiple times each year since 2012 [31]. Each scanning campaign includes multiple vantage points, and the different point clouds are aligned based on the ICP algorithm [32] and the fine registration routine in RiScan Pro software following a manual coarse registration. The final dataset is then resampled using a space-based resampling algorithm resulting in an approximately evenly distributed point spacing of 5 cm. The latter aims to provide a standardized distribution of the quality of the extracted local information within the dataset.

3.2. Voxelization

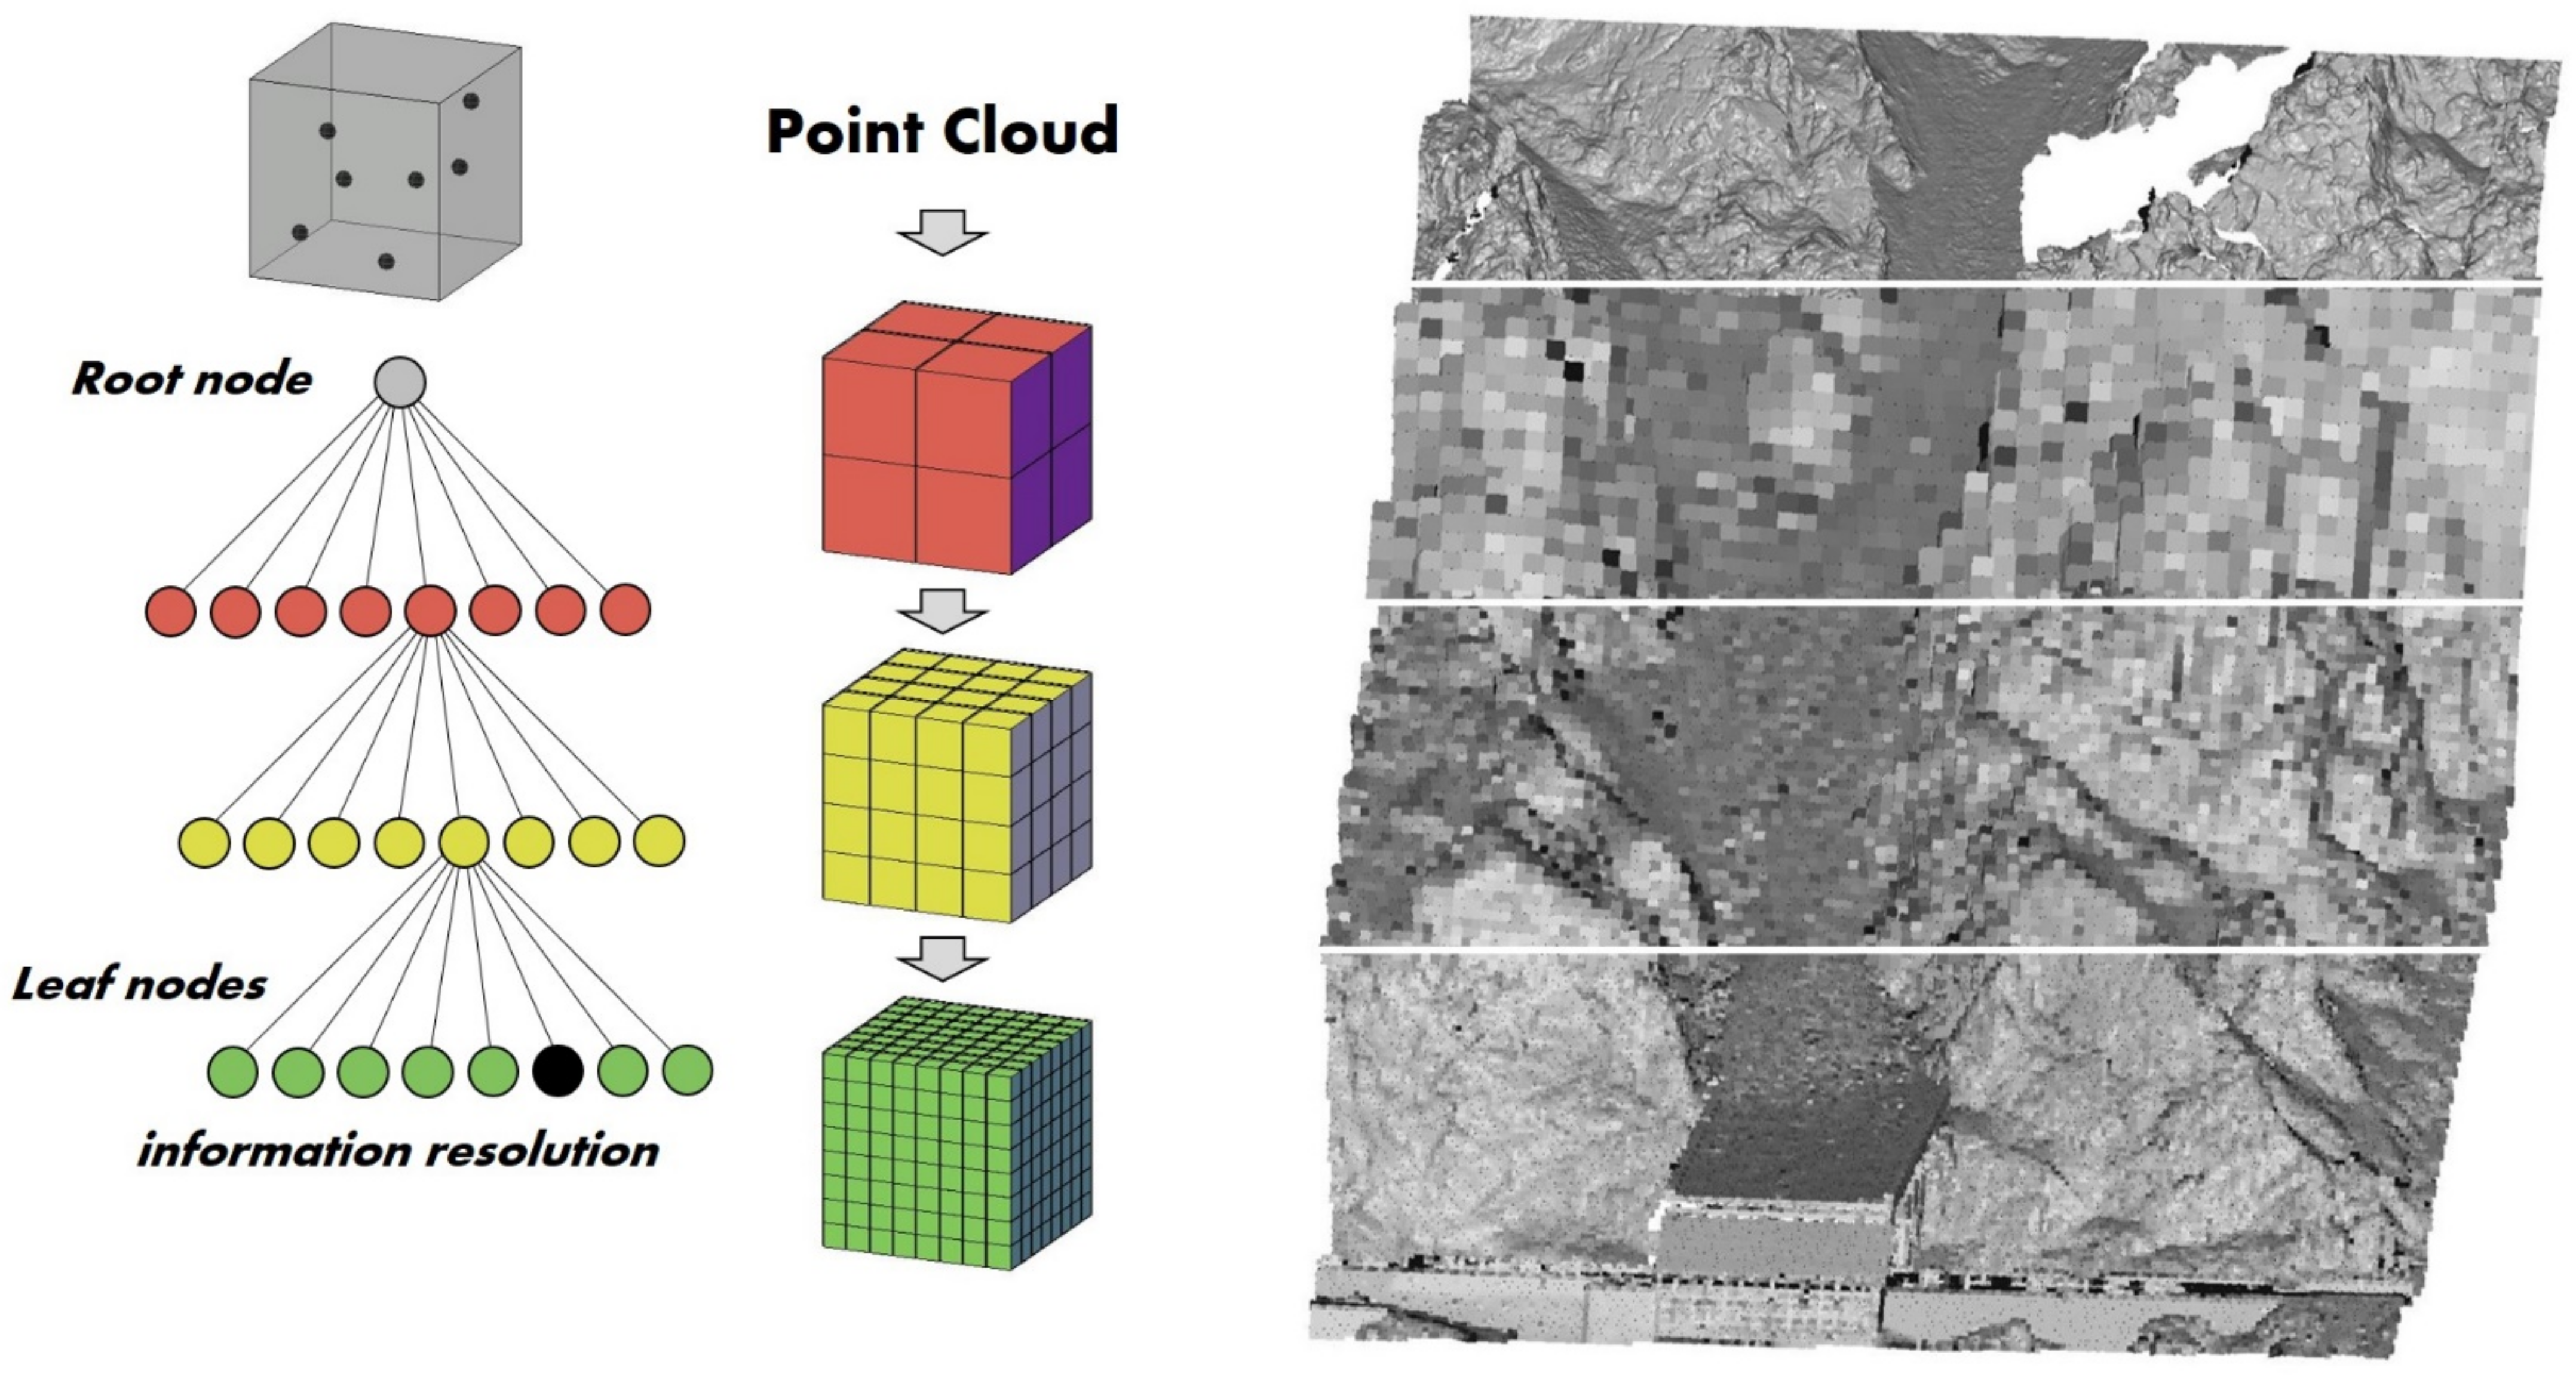
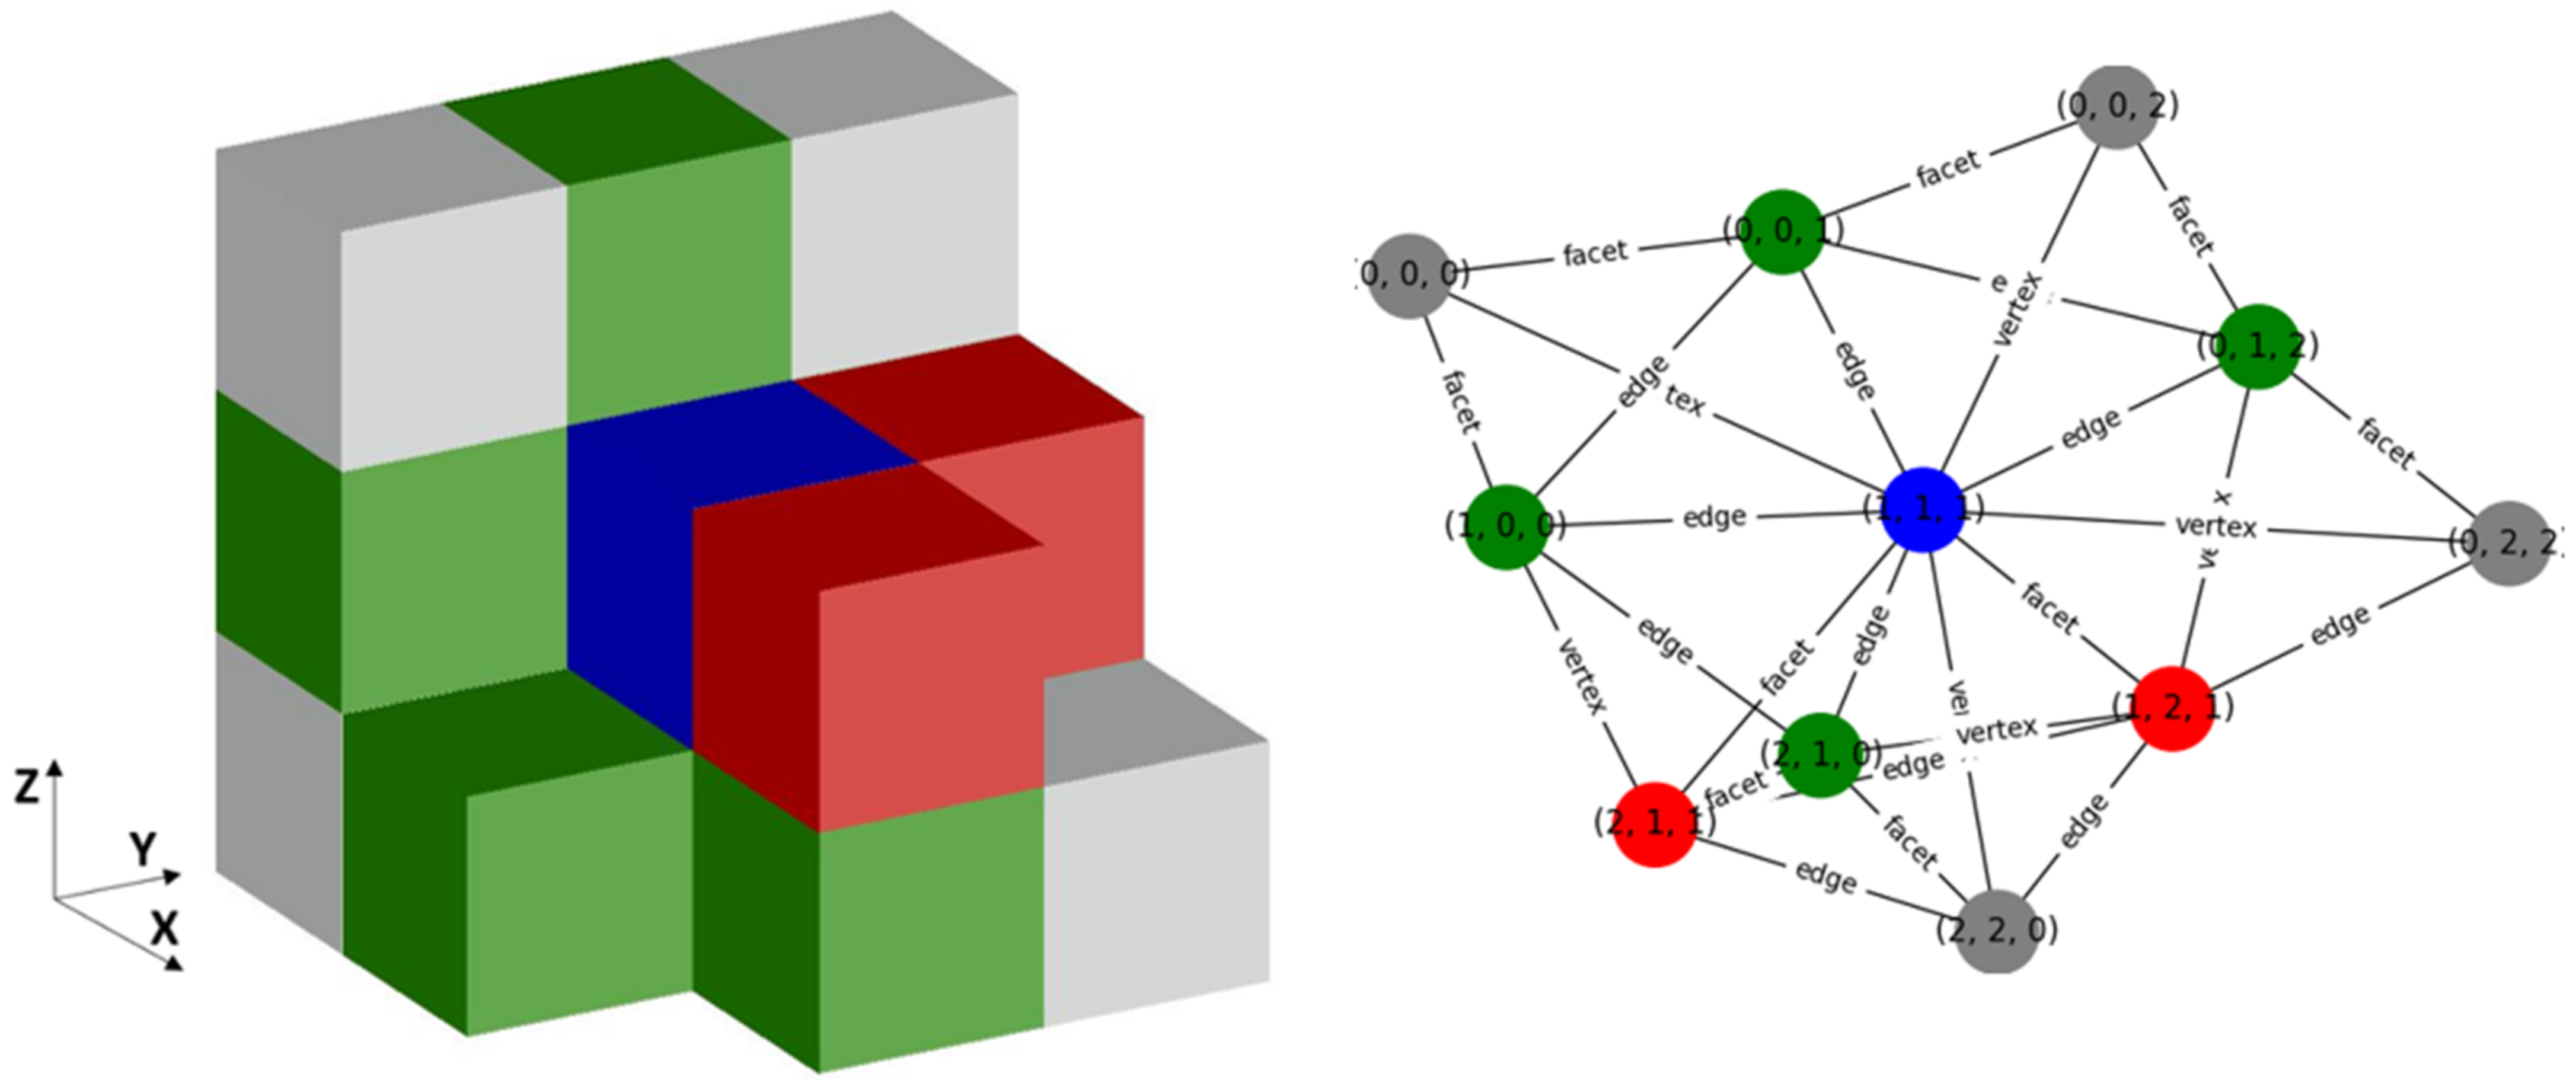
The point cloud is first stored into a voxel grid, using an octree as shown in Figure 4. The octree is a 3D data structure within which the bounding box of the dataset (root node) is recursively subdivided into eight child voxels. The size of the initial root node is technically defined by the bounding box of the input point cloud. From the resulting child voxels of each subdivision level (known as depth level), only those containing points proceed to further sub-division, while the rest are rejected. The sub-division continues until a termination criterion is met. There are several termination criteria that can be used such as: the voxel size, the depth level, or the minimum number of points per voxel. The advantage of voxelization is that it provides the dataset with an organization and structure which enables neighbourhood searches by means of adjacency graph representations. Voxel adjacency in the 3D space can be modeled in two ways: (i) shared facets (6-connectivity), and (ii) shared facets, edges, and vertices (26-connectivity; Figure 5).
In the methodology proposed in this paper, the termination criterion is based on the voxel size and is defined by minimizing the mean voxel eigenentropy via the Shannon entropy [28], similar to the definition of optimal point neighbourhoods used by [18]. This defines the resolution of the extracted information which technically means that structures smaller than this size are not “visible”. This optimization procedure aims to increase the probability that the XYZ information is distributed along the voxel grid in a way that local geometric differences are highlighted with the minimum resolution cost. However, user interpretation regarding the desired level of detail is still a key factor that controls the selection of the voxel size range to be optimized.

3.3. Characterization

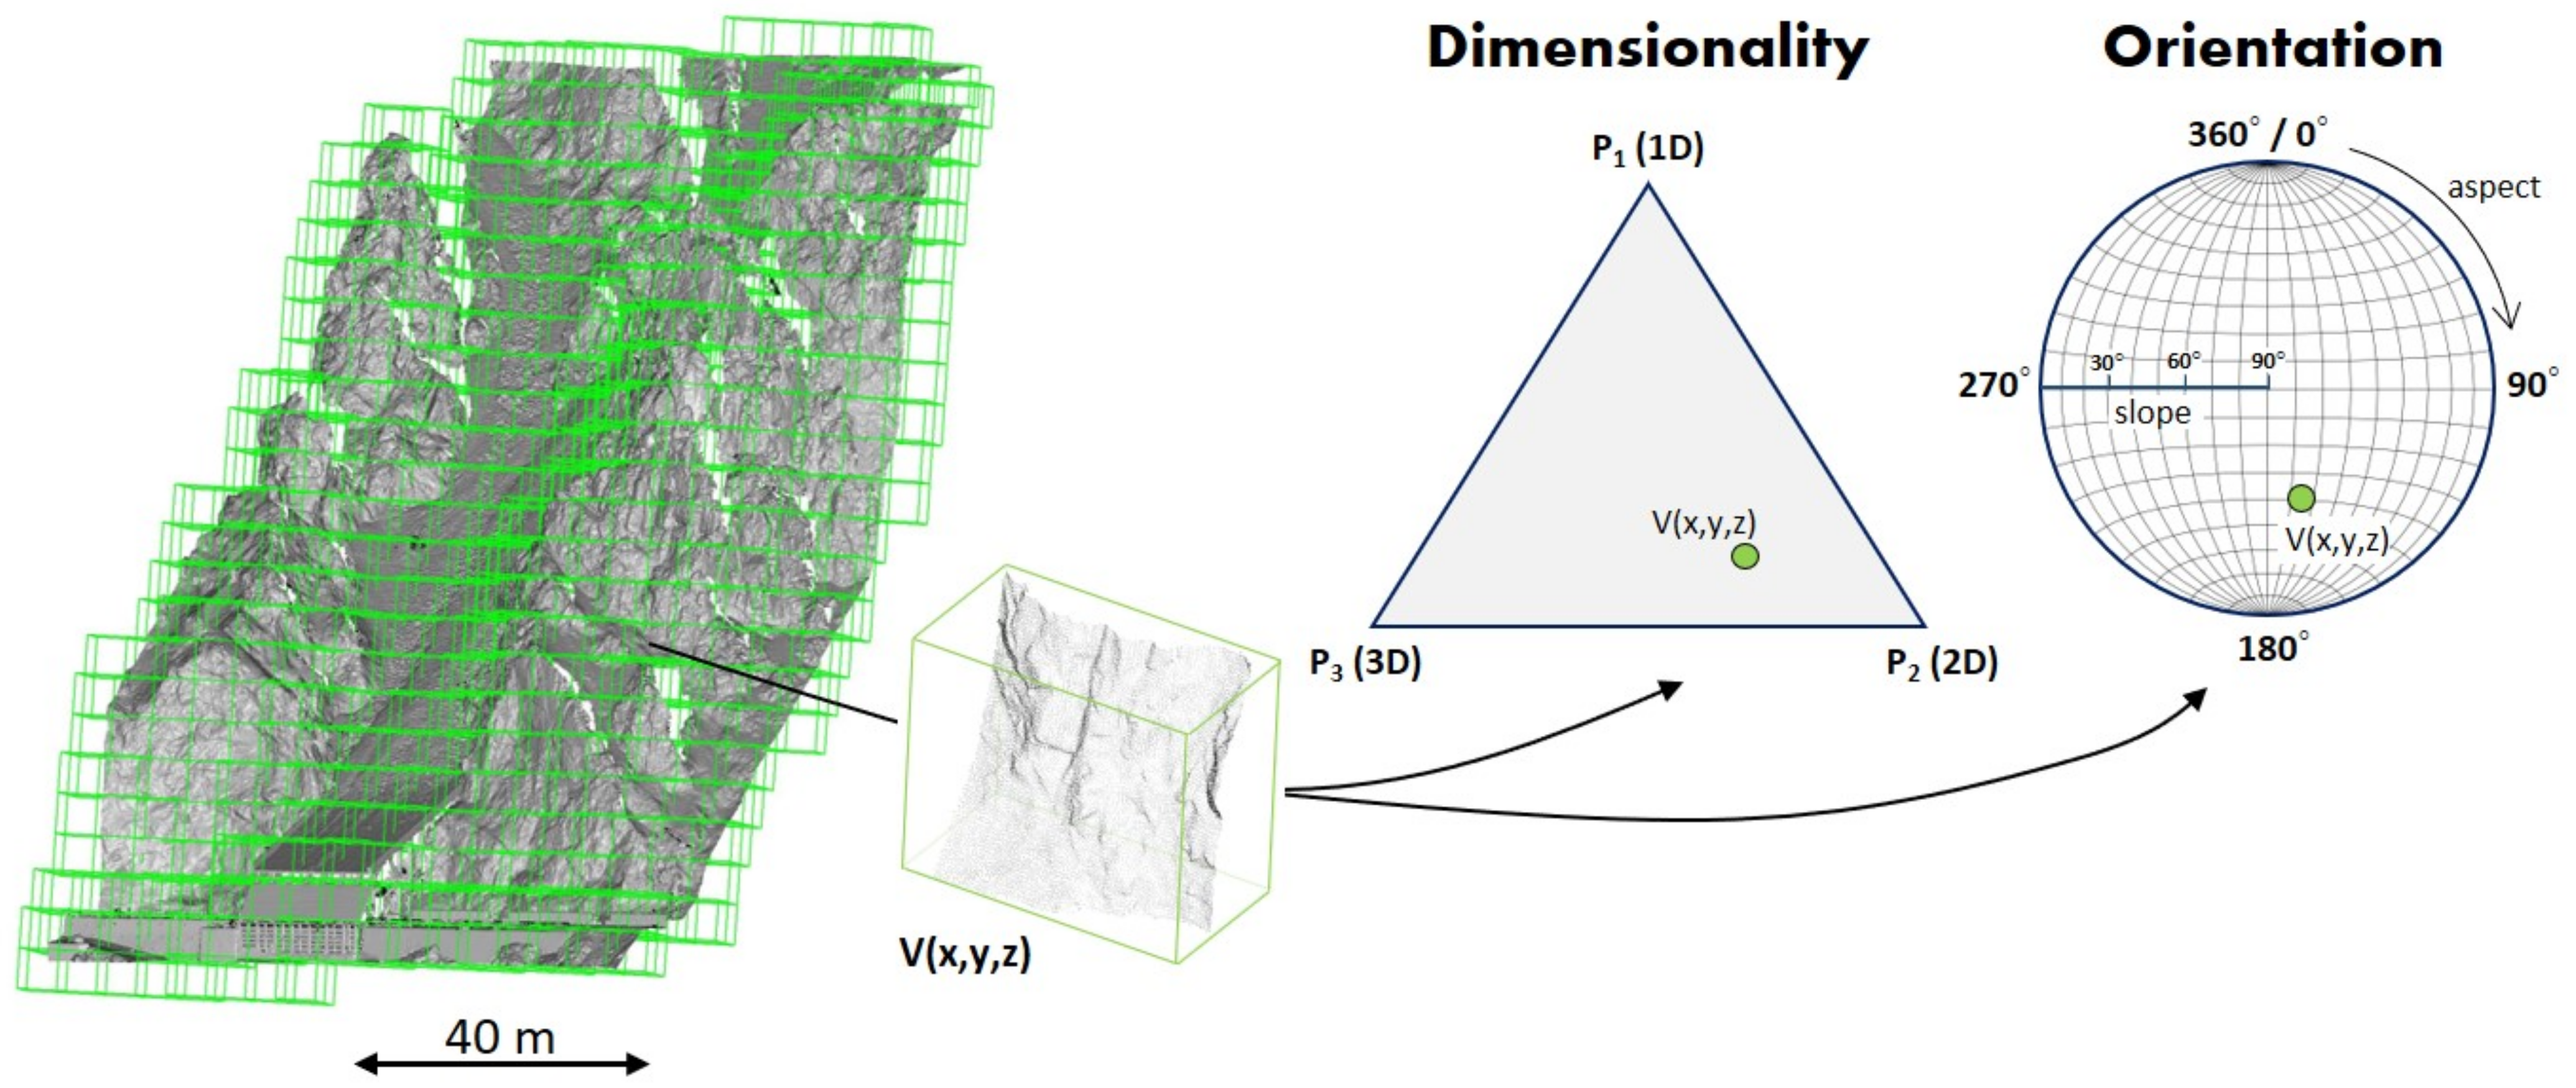
As in the case of an image where each pixel is characterized by the RGB values, this methodology aims to extract robust descriptors to characterize each leaf voxel within the generated 3D structure. The information can be propagated in the same way to different levels of the octree (Figure 4). The descriptors used in this method do not contain spectral information but rather are focused on utilizing exclusively XYZ-based geometric and topographic information. In order to provide a framework dedicated to the analysis of natural terrain of geo-engineering interest, the local geometry is expressed by means of dimensionality, as used previously in natural terrain classifications [19] and the topography through orientation, which is key information in any geological investigation.
The normalized eigenvalues (p1, p2, p3) and the normal vector ( n x, n y, n z) are calculated for each voxel describing its dimensionality and orientation, respectively. This process includes the application of SVD and PCA to the covariance matrix (Q) calculated at the point level as follows:
Q = i = 1 n X i X ¯ X i X ¯ T n 1 ,
Figure 6 provides a schematic representation of the descriptors used to express the geometry and topography of the scene. The relative proportions of the eigenvalues indicate whether the content of a voxel is closer to being 1-, 2-, or 3-dimensional thereby defining the dimensionality. The orientation of the point set included within a voxel can be represented by the slope and aspect using an equal area stereonet plot. The dataset is therefore characterized by means of geometry and topography and provided with structure. The feature vectors are then normalized in a [0:1] range using the Min-Max normalization method to prevent outweighing and to equalize their contribution to the following object partitioning process:
X i = X i min X max X min X ,

3.4. Scene Homogenization

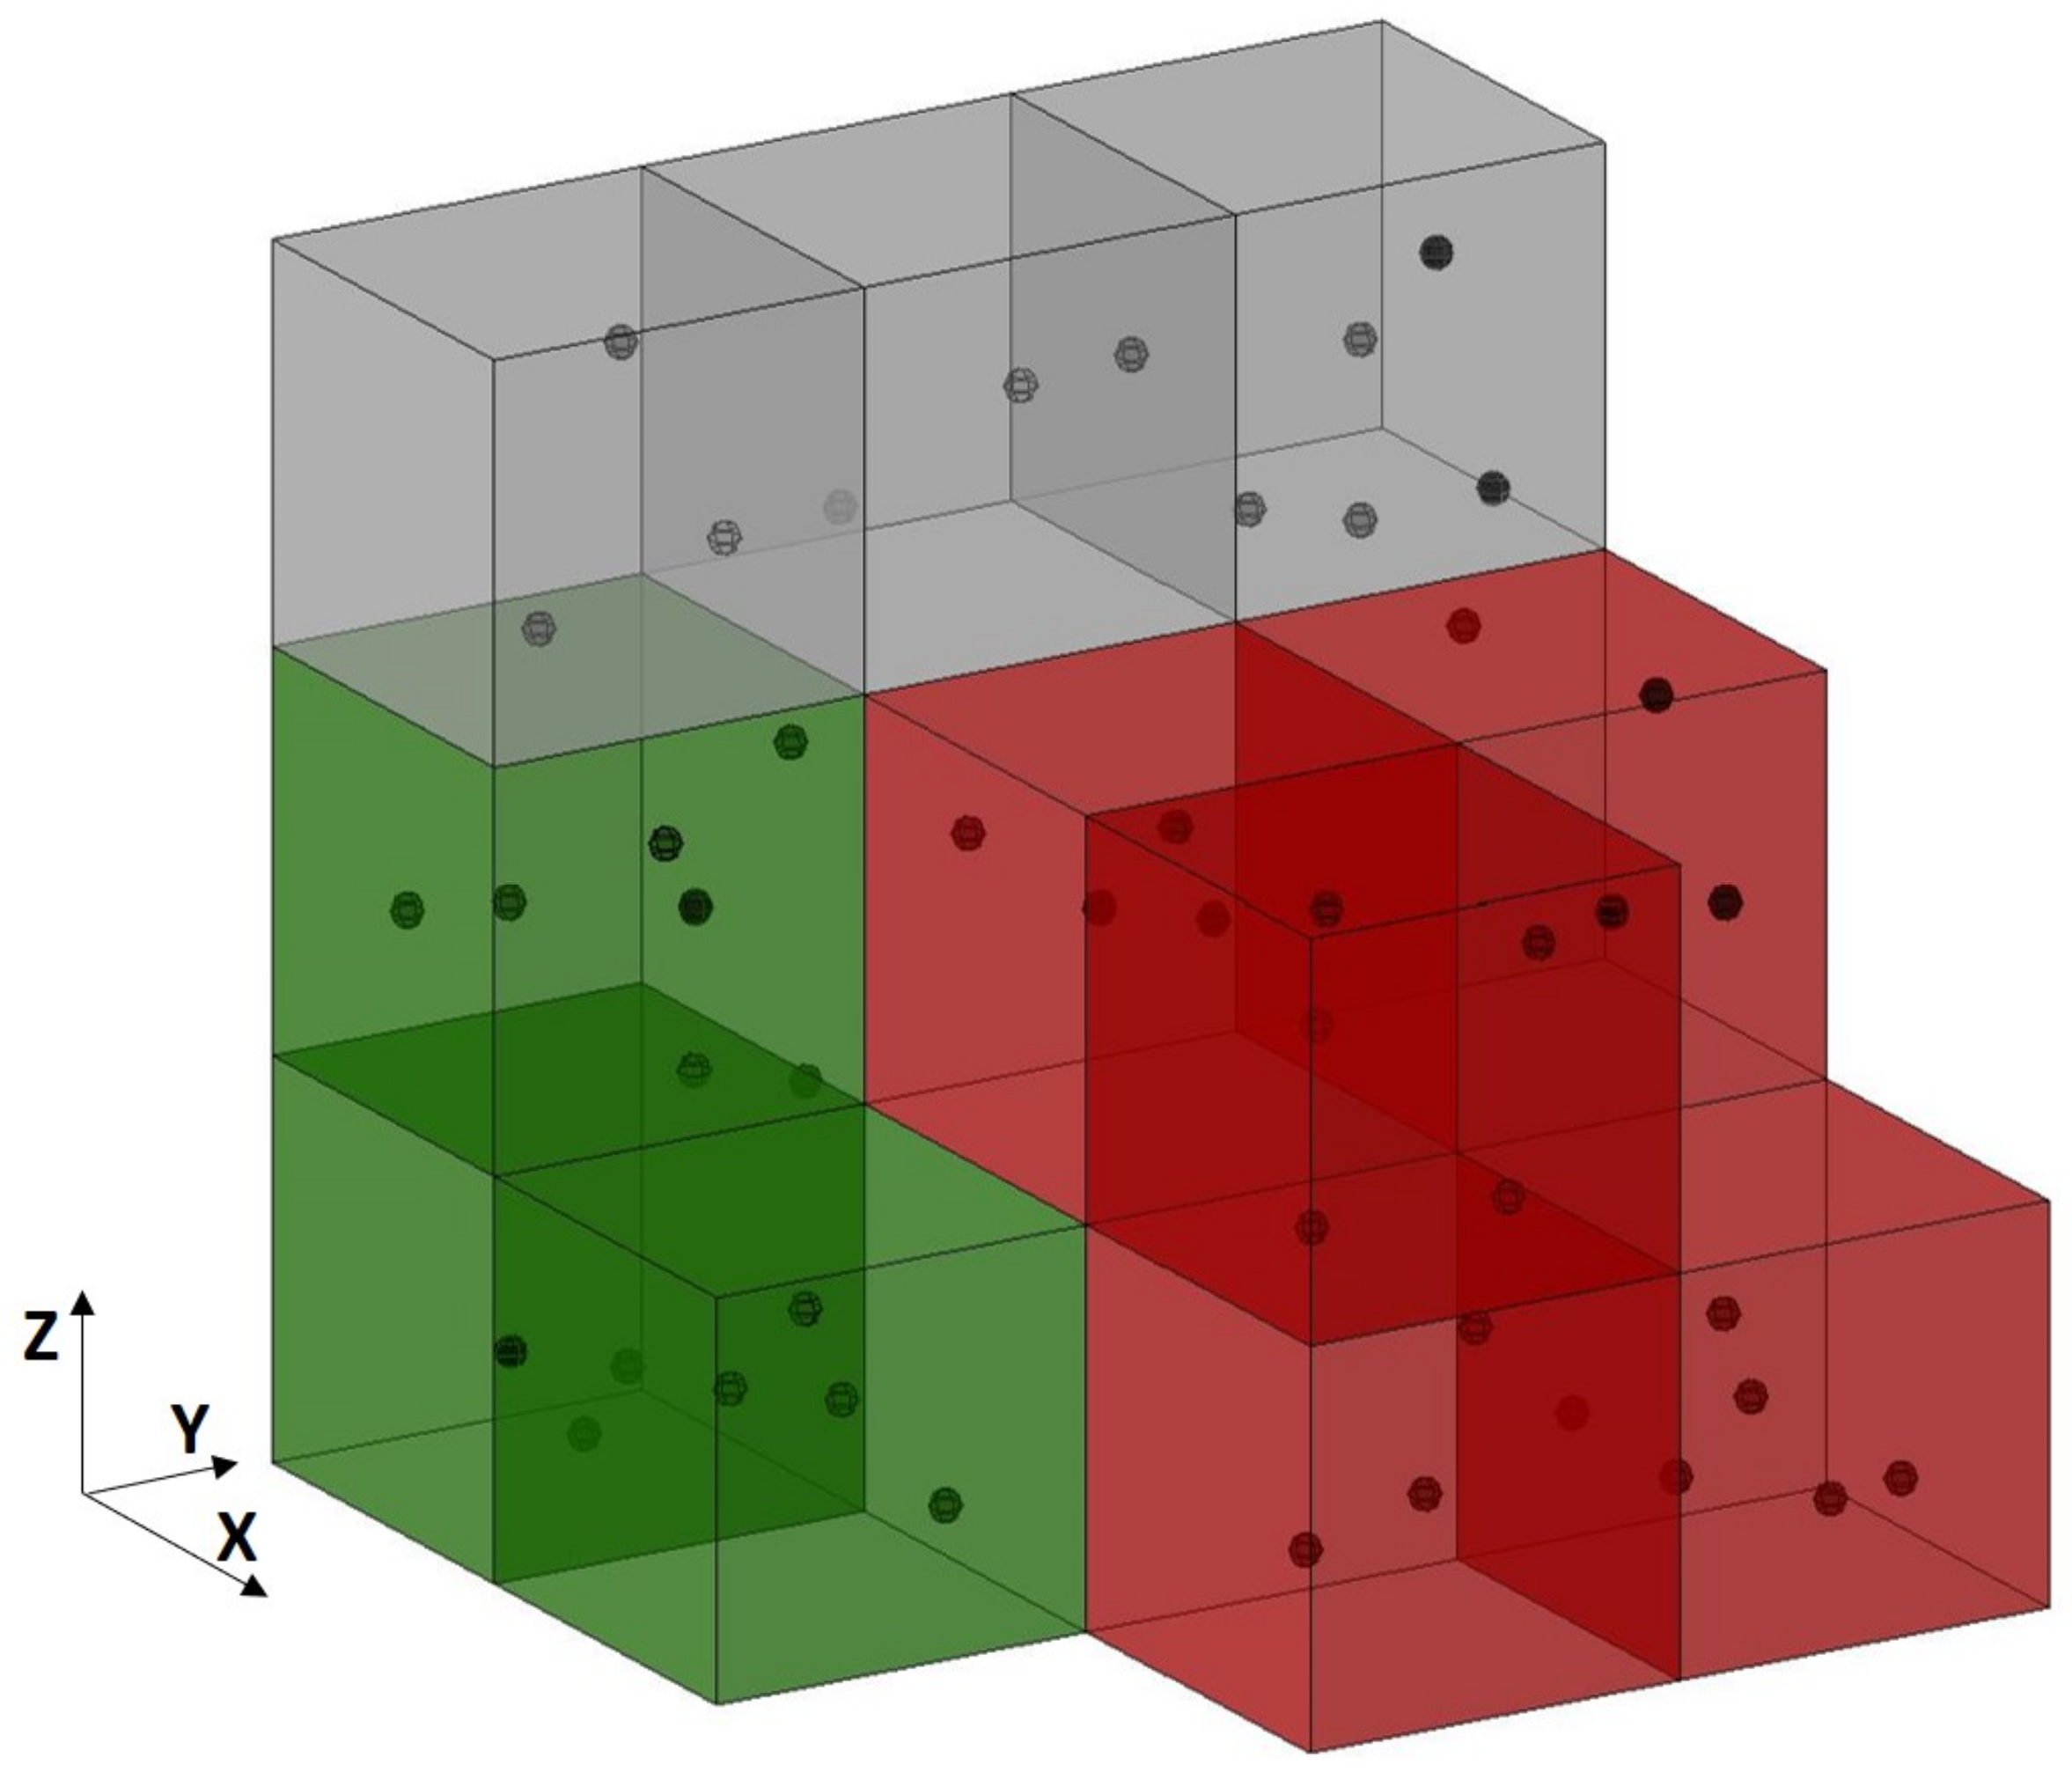
The clustering of a scene into homogenous segments (segmentation) is a fundamental process in image understanding with a variety of algorithms proposed for this specific task (i.e., chessboard, region merging, model-fitting, k-means, hierarchical, graph cut), mainly for pixel grids. In this study, the objective was to integrate data-driven segmentation into the object-oriented model. For this reason, we employed a non-seeded region merging procedure which starts with the initial voxels and proceeds to a pairwise merging of connected voxels at each iteration, forming an assembly of semantic objects, the so-called supervoxels (Figure 7). This step aims to provide an initial over-segmentation while simultaneously generating new properties to support the subsequent classification step. The main difference when compared to point neighbourhoods and voxels, is that the size and shape of supervoxels are formed according to the content of the scene, and they are unique for each object.
To ensure that the process is reproducible, and to avoid using seed points, local mutual best-fitting heuristics are employed [33]. Local mutual best-fitting assures that each merge is the best possible in the local vicinity of any object. The merging criterion, similar to [34], evaluates the balanced sum of the overall dimensionality and orientation variation between neighbouring objects and the merge only happens with the neighbour where the minimum score is achieved. This score represents the degree of homogenization of a certain object and is technically a factor that defines the object size. A task-adjustable parameterization methodology for region merging based segmentation of 2D images has been proposed [35]. After each iteration, and when all of the objects have been examined, the overall LV of the scene is calculated and compared to the previous iteration LV. The process terminates when the LV is lower or equal to the previous. In detail, it is assumed that as long as the LV is increasing the homogenization is progressing up to the point where the peak LV value is recorded.
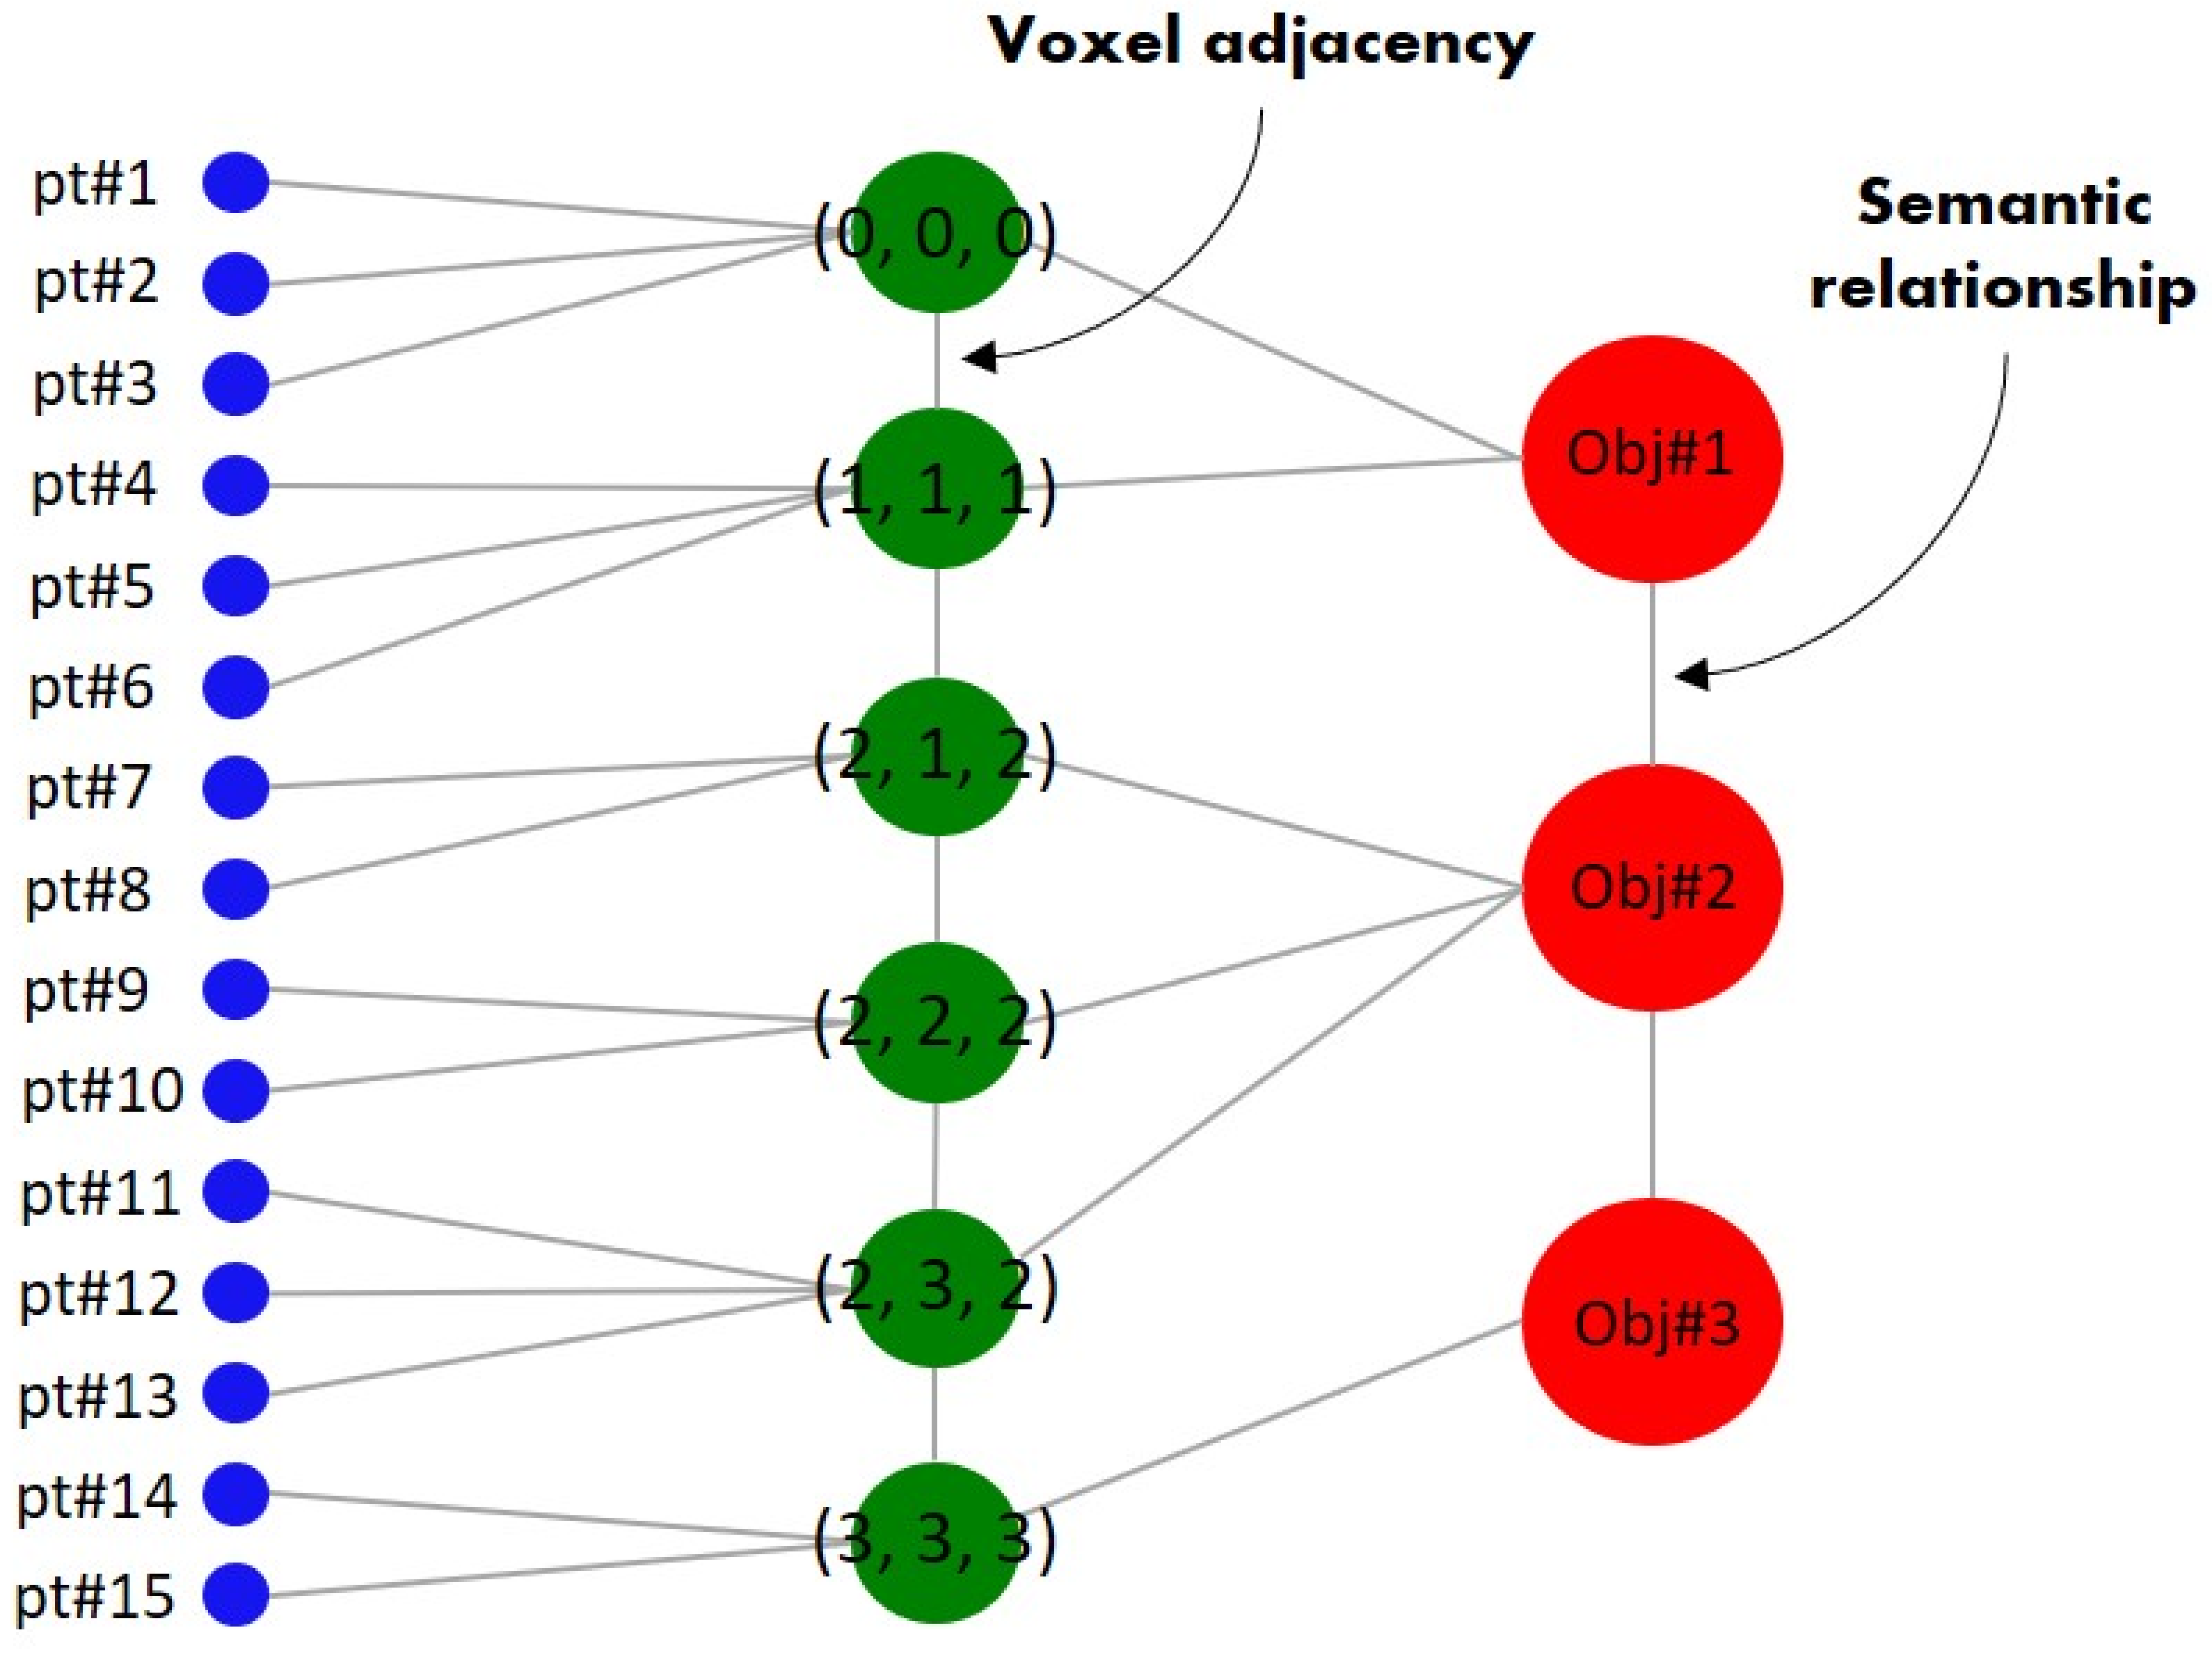
New graphs are thus constructed in order to retain inter-relationships among the objects, as well as link the object with the voxel level (Figure 8). Such representation allows each object to know the spatio-semantic relationships with both its neighbours and its previous level content by means of the initial characterization. This semantic information enables classification of complex scenes by assigning labels to the graph edges and extracting subgraphs via connected components hierarchically based on specific ontologies.

3.5. Classification

After the dataset has been partitioned into semantic objects, they can be classified. The classification can be conducted in two ways within the current object-oriented model. It can be either ML- or knowledge-based. For ML-based classification, the collection and preparation of training, validation, and test datasets is required prior to the application of the model. In contrast, knowledge-based classification is built on domain knowledge applied directly to the extracted objects. In the current knowledge-based classification scheme, object features are first selected based on domain conceptualization and by visualizing each feature layer as a scalar field through an experimental process. These features can vary from the previously described low-level local descriptors to higher-level descriptors such as shape and size measures, neighbourhood relations, or even statistics on finer levels. In contrast to both point neighbourhoods and voxels, the latter is possible within the current methodology since each generated object has a unique shape and size and also retains topological knowledge via the graph representation (Figure 5). Therefore, objects can be characterized based on their geometry, topology, content, and also their semantic relation to their neighbourhood. The use of voxel-based objects is also favoured over point neighbourhoods because it is a time-consuming and computationally expensive process to either perform distance searches within the cloud or manually segment out and correct misclassified points.
The object descriptors proposed for the current knowledge-based classification and the reasoning behind their selection are listed in Table 1. The rules are applied hierarchically, and the graphs are updated at each step providing additional semantic information to be used in the establishment of the next step rule. A semantic network is thus constructed in order to represent the scene at multiple levels of detail.
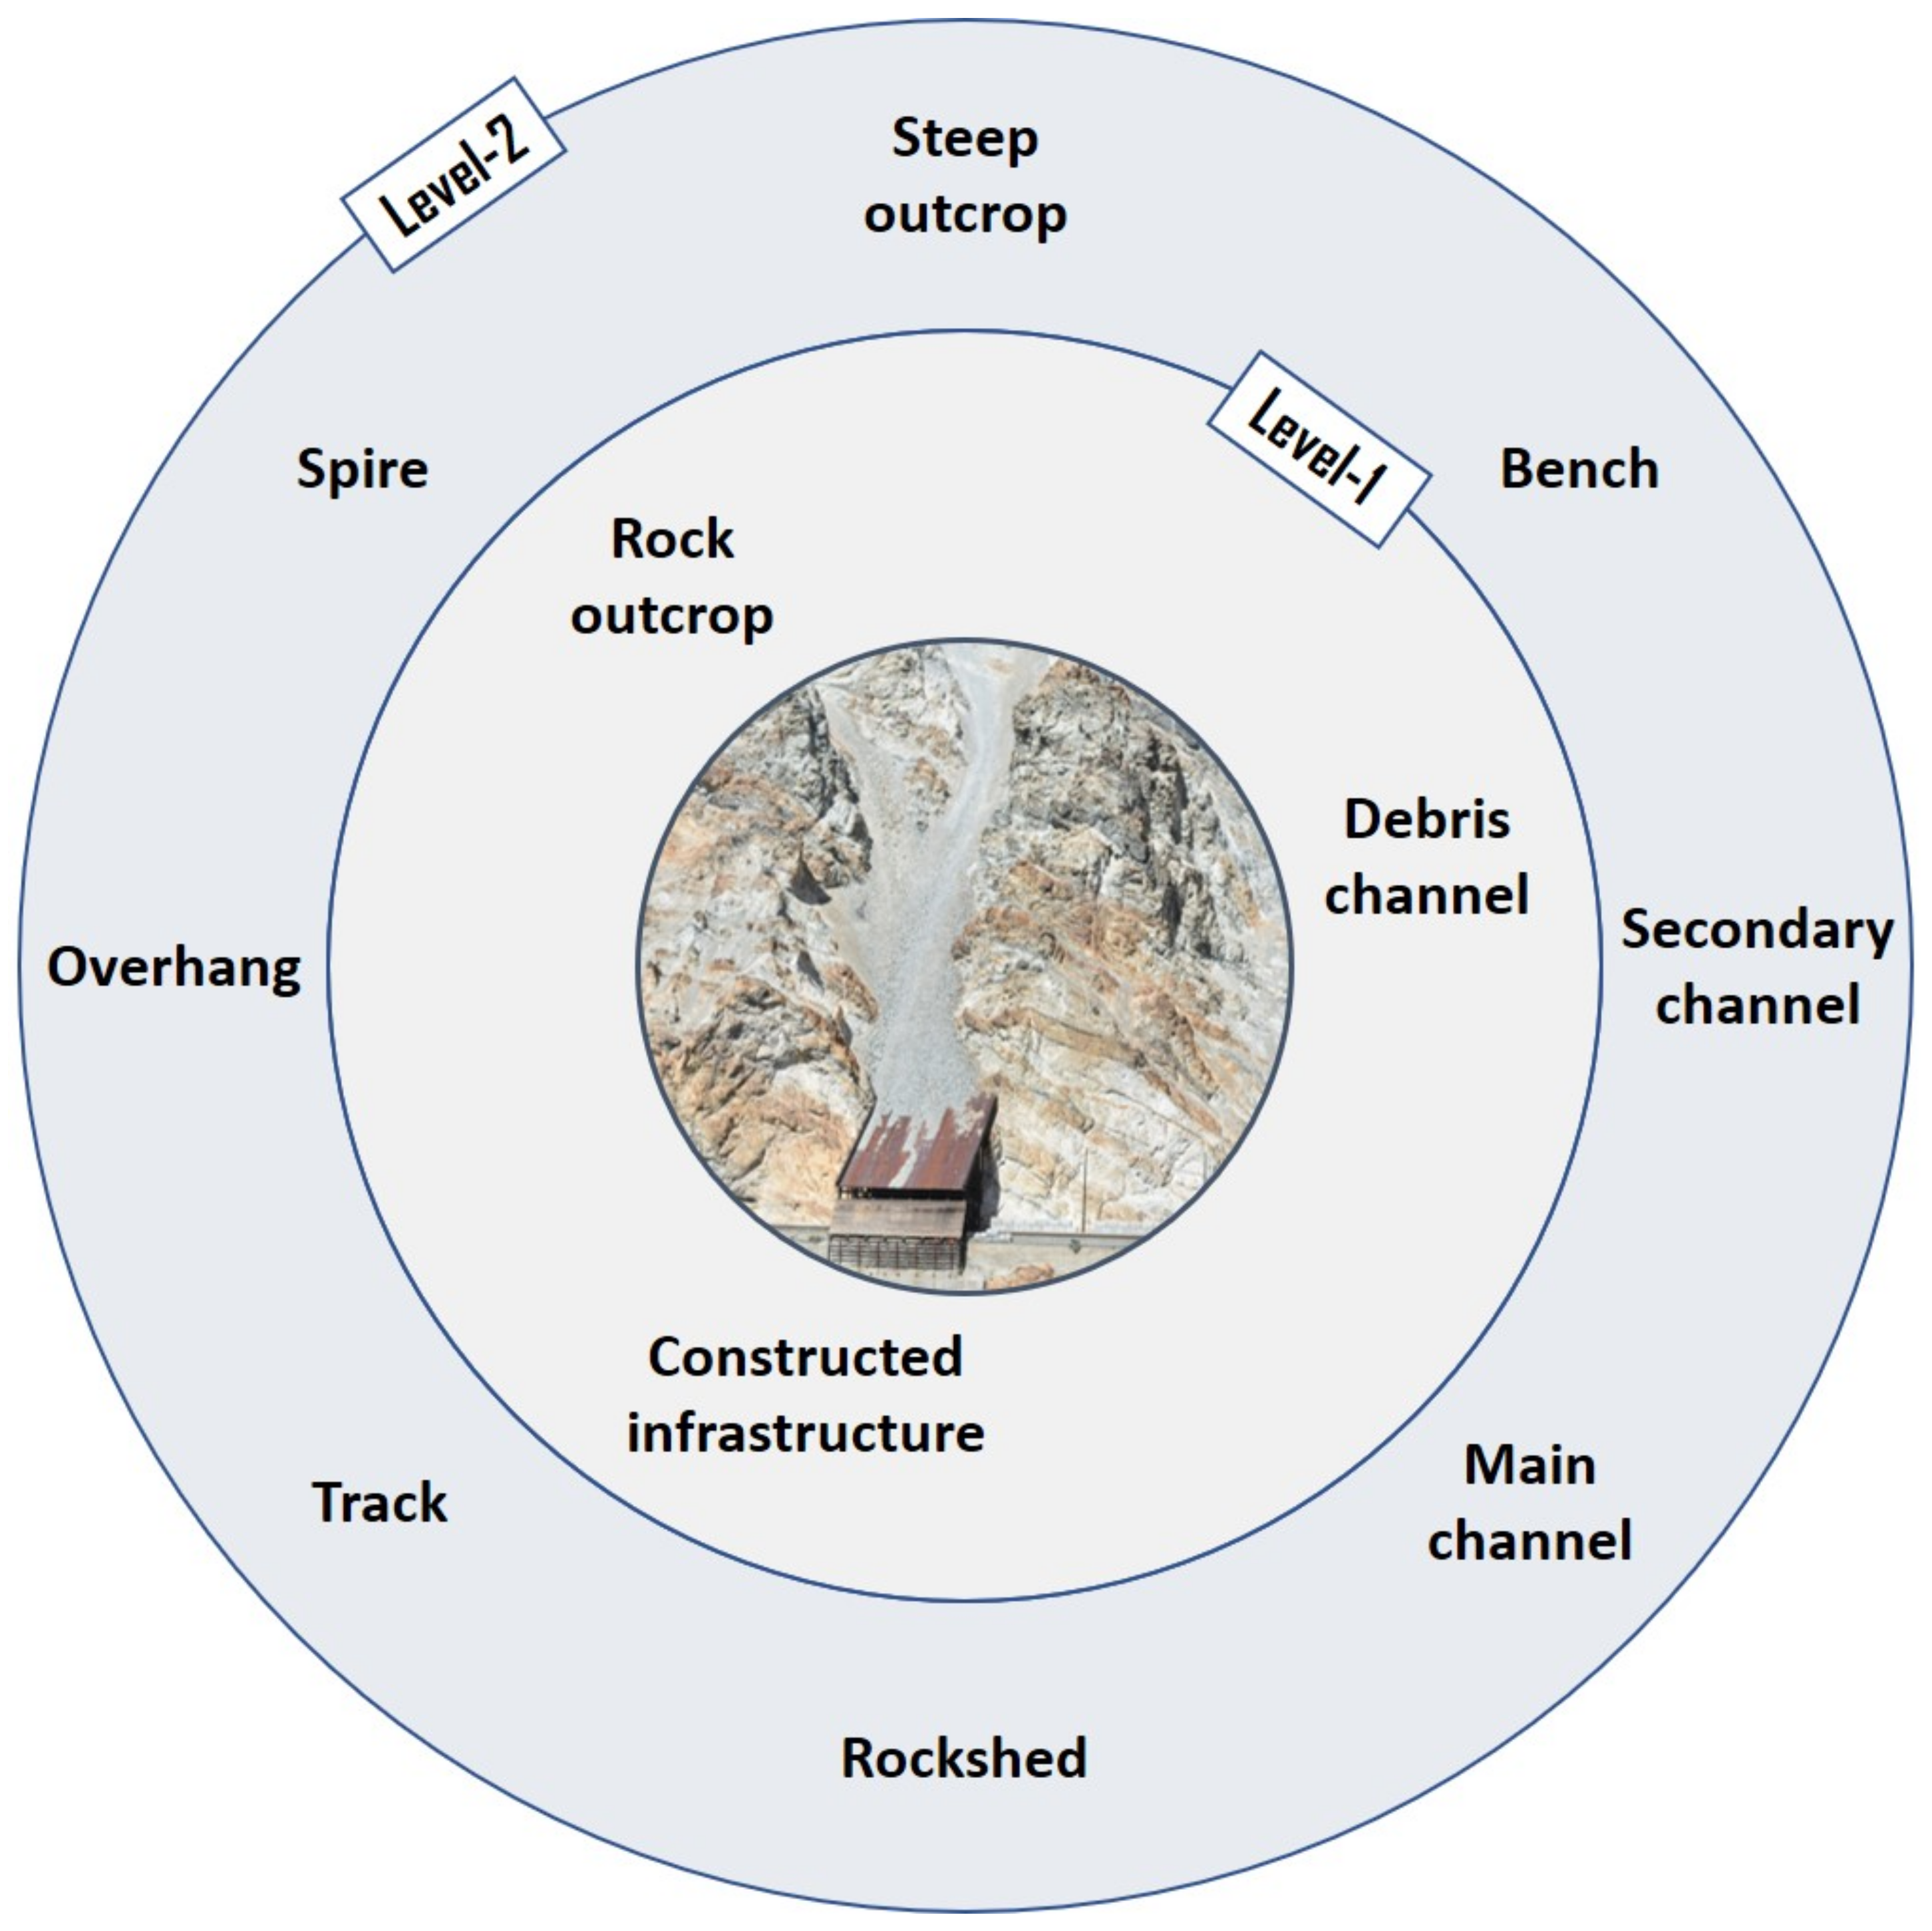
This process allows the model developer to design a domain-knowledge-driven classification schema by means of ontologies specifically focused on the needs of the project. In Figure 9, an idealized schematic representation of a steep railway rock slope ontology is depicted. It includes knowledge formalization regarding different materials, geomorphological features, and constructed structures involved in landslide risk management. The current classification procedure incorporates such an ontology-based conceptualization of railway rock slopes. Connecting ontologies to classification schemas allows information to be generalized more easily. The different aspects of knowledge generated through the process can either be used in rule establishment, be output as knowledge representation at the corresponding level, or both. The latter depends on the desired level of detail and the scope of each project.
The slope value used for the primary detection of the “debris channel” objects is based on the range of angles of repose related to such structures, linearity is required for the extraction of the elongated rail lines and barrier walls, and the 2D compactness is used to identify the rockshed parts that are more square-shaped and platy than other natural objects. Furthermore, all the classification steps are followed by semantic refinement rules based on spatio-semantic relationships among objects through graph-based clustering and connected components. At a finer level of detail, rock benches within the rock outcrop class are detected using the aspect at the object level. Since such features are usually formed along planes of weakness (i.e., foliation, shear, or fault zones) traversing the slope, they are likely to be oriented sub-perpendicular to the main slope orientation compared to the rest of rock outcrop objects.

4. Analysis and Results

The developed algorithms were used for the semantic segmentation of a section of the railway rock slope described in Section 3.1. The aim was to automatically identify the areas that represent different landslide hazard source zones while ensuring that the model was as simple as possible. The goal was to highlight the potential of simple and explainable automated knowledge-based workflows for effective and efficient multi-hazard monitoring and management. The results of the segmentation process, without using training data, were compared to different ML models trained with limited data from a separate portion of the same site. Selected areas of interest within the slopes include the debris channels and rock outcrops which generate debris flows and rockfalls, respectively, under the appropriate conditions. Such landslide hazards may impact the constructed infrastructure directly during an event when the main channel flushes or an event may fill a secondary channel which in time will contribute debris to the main channel. Therefore, secondary channels or rock benches comprise a lower-granularity class of interest within the semantic network of this site. Constructed infrastructure is another important class since it represents the main element at risk in almost any risk scenario in the study area.

4.1. Metrics

Semantic segmentation results are typically evaluated based on valid labeled data repositories depicting the classes of interest. However, in engineering geology, which deals with natural environments, the availability of such repositories is very limited or non-existent. Although some attempts have been made in regional scale mapping (i.e., SLIDO) utilizing ALS point clouds and satellite imagery, there is no commonly accepted slope-scale annotated 3D point cloud repository at this time. For this reason, the authors suggest that at this point, performing a visual interpretation and assessment together with providing the reader with a detailed representation of the area of interest for clarity, is the most pragmatic approach and better reflects the current state of geoscience practice, as in [30].
A quantitative assessment of the performance of the proposed algorithms was also conducted for completeness. The reference dataset was generated by manual mapping of the study dataset based on gigapixel imagery and point cloud interpretation, as well as field observations. The assessment was conducted at the point level, in order to also account for the voxelization impact and scene homogenization quality. This was based on the following metrics extracted from a confusion matrix which provides visualization of the performance of a classification algorithm by plotting the predicted against the true instances of the four classes (rock outcrop, debris channel, benches/secondary channels, and constructed infrastructure):
R e c a l l = T P T P + F N ,
P r e c i s i o n = T P TP + FP ,
F 1 s c o r e = 2 T P 2 TP + FP + FN ,
where,
  • TP: Instances correctly predicted to be positive.
  • TN: Instances correctly predicted to be negative.
  • FP: Instances erroneously predicted to be positive.
  • FN: Instances erroneously predicted to be negative.
Accuracy is the most intuitive performance measure, reflected by the ratio of correctly predicted instances divided by the total. However, accuracy provides solid estimates only for symmetric datasets where values of FP and FN are almost the same. Therefore, other metrics should complement the performance assessment of a model. Precision reflects the ability of the model to avoid FP, recall is the ability of the model to predict the positive instances, and F1-score is essentially a weighted average of precision and recall and is usually preferred over accuracy for uneven class distribution datasets.

4.2. Evaluation

4.2.1. Predictions

In this Section, the final semantic segmentation result of the examined White Canyon section, based on the proposed methodology, is presented and evaluated both qualitatively and quantitively. A hierarchical classification of the generated objects was implemented based on domain knowledge and according to the site-specific conceptualization depicted in Figure 9. Two different ML models were also trained based on one half of the study site (split symmetrically) and used to evaluate differences of the semantic segmentation results compared to the proposed knowledge-based model.
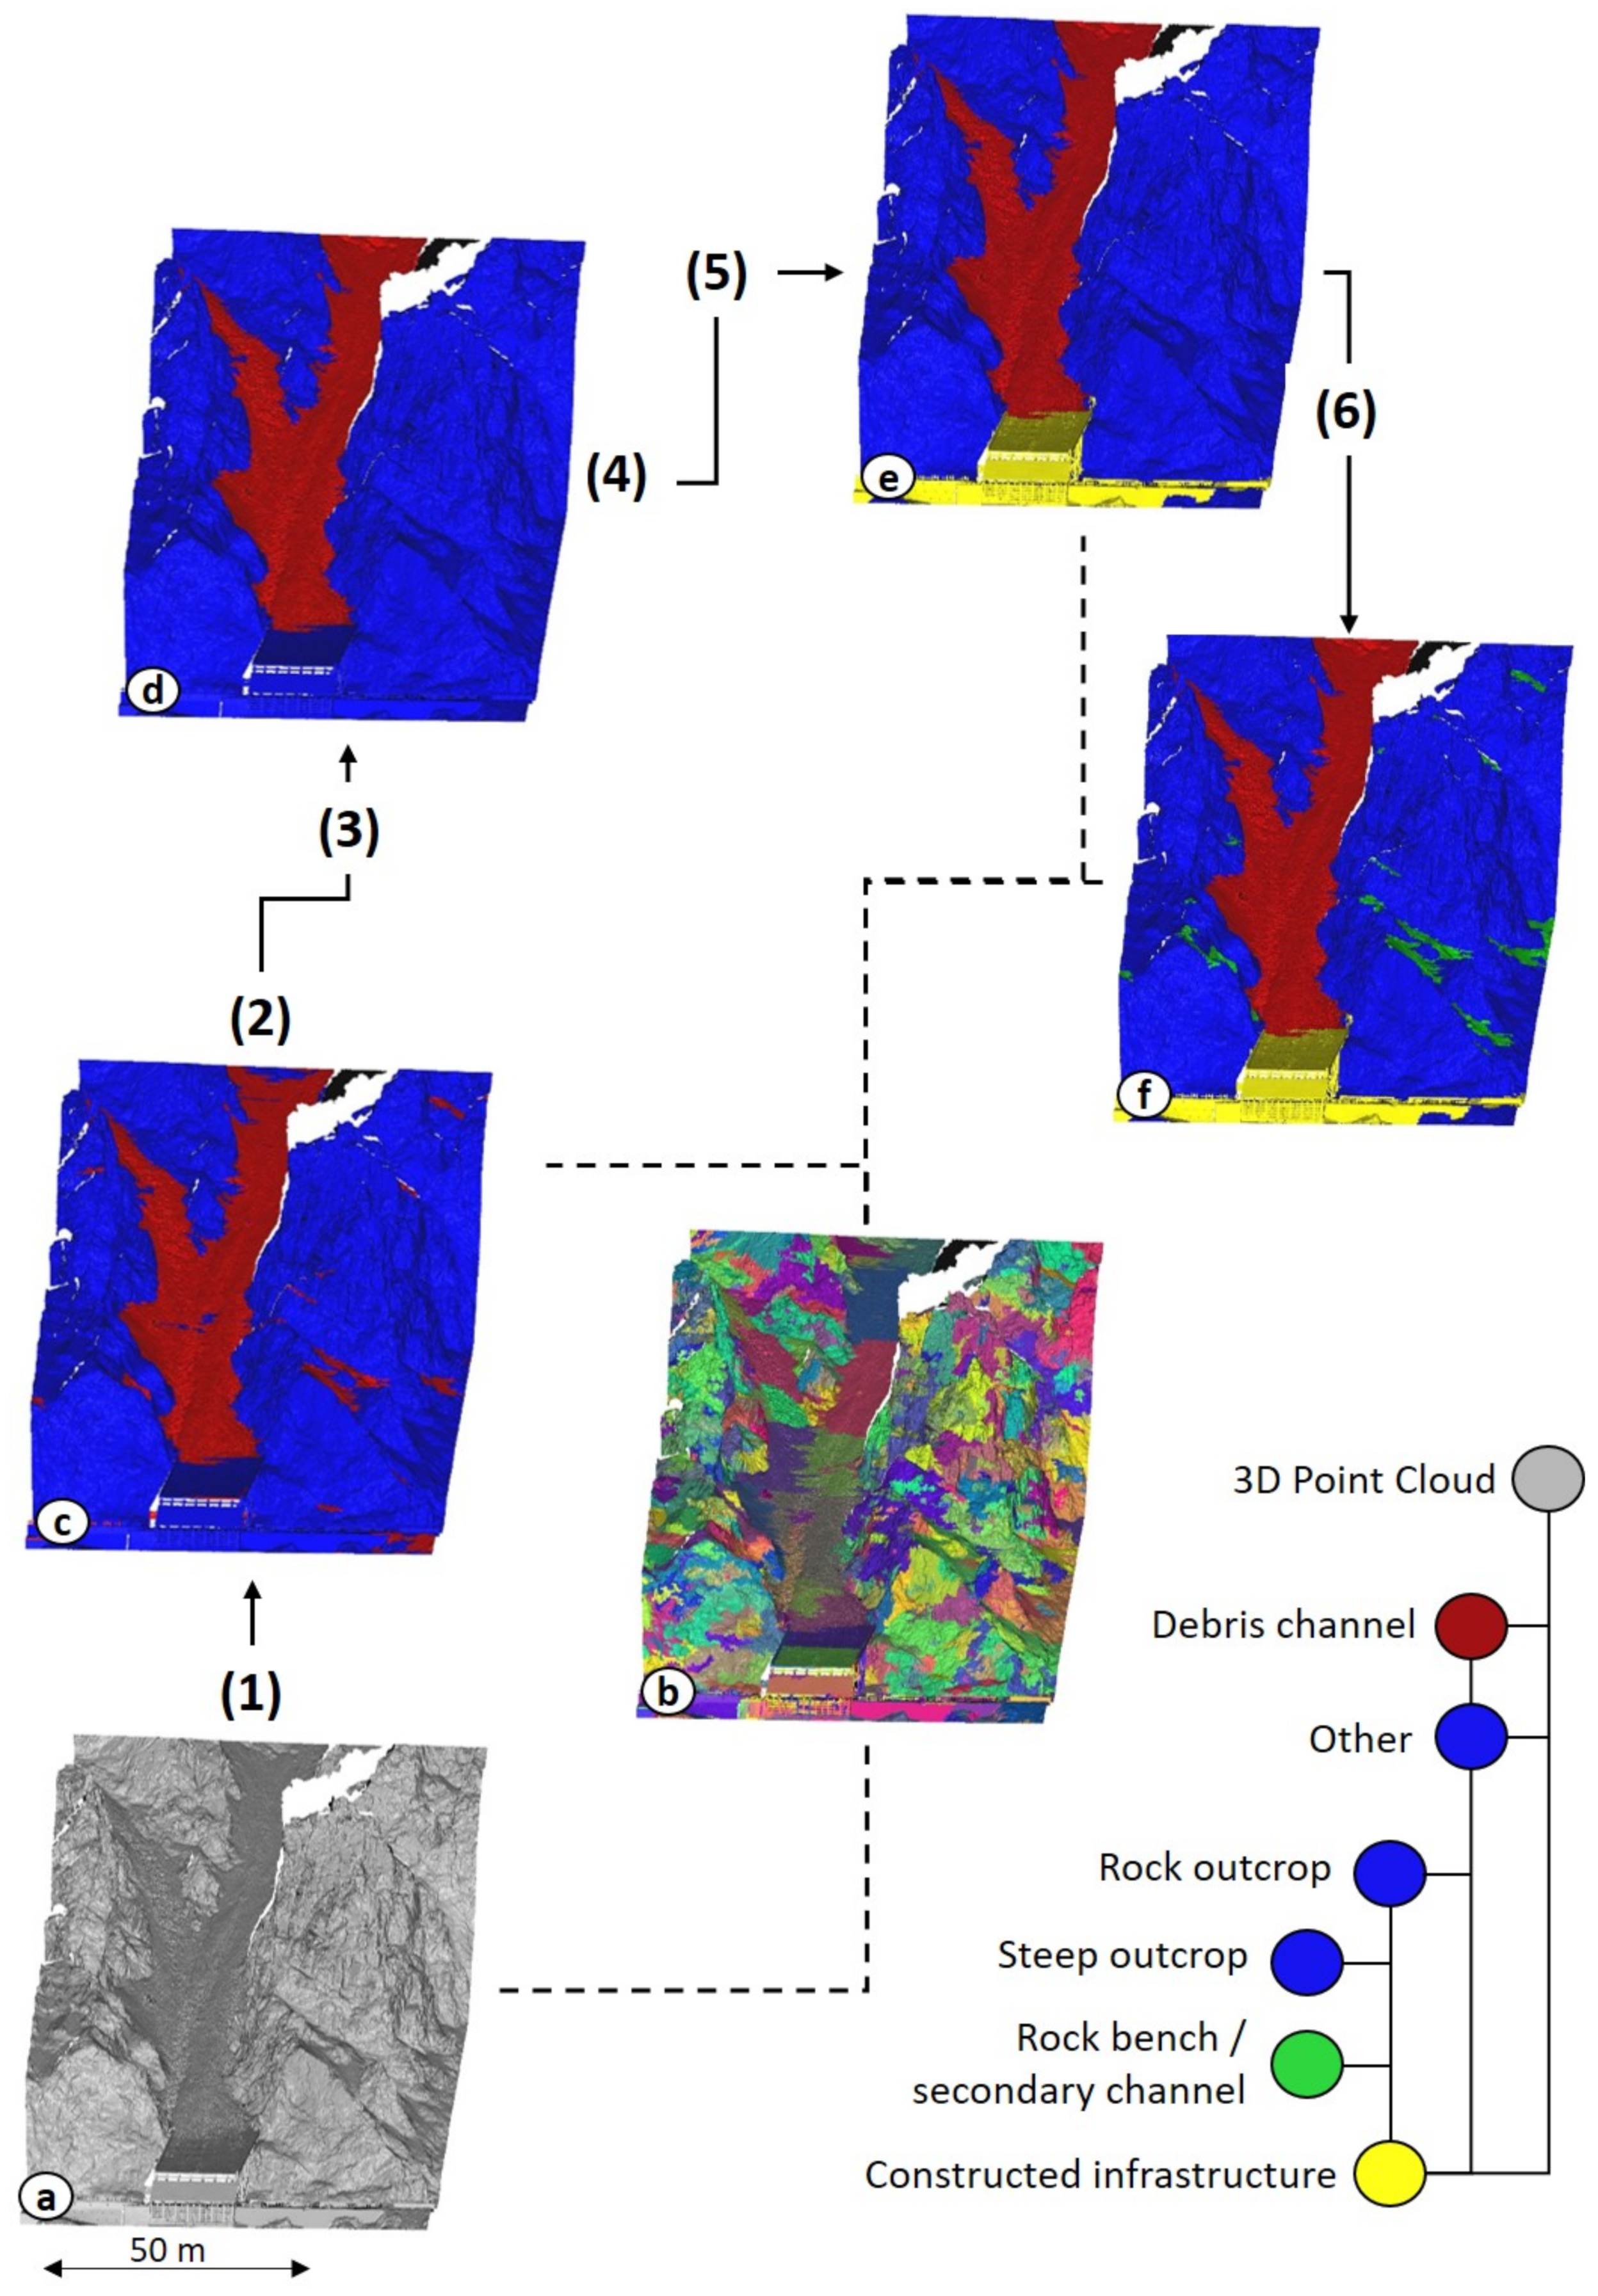
Figure 10 provides a step-by-step demonstration of the classification of the objects generated by the homogenization process based on the following simple rules:
4.
“Debris channel” candidate segments are labeled based on their slope. Debris channels represent features generated by erosion and usually dip at lower angles relative to the rest of the slope.
5.
Non-debris channel candidate segments surrounded by “debris channel” candidates are aggregated and refined. This includes potential large rock boulders within the main channel.
6.
A refined object is then tagged “debris channel” if its Z-axis range at the point level is higher than a length threshold.
7.
A linear or compact object located lower than the “debris channel” is tagged “constructed infrastructure”. Rail lines and barrier walls along the track are aggregated as linear elements while rockshed components are defined as compact.
8.
Remaining objects surrounded by “constructed infrastructure” are incorporated and refined. The remaining objects are tagged “rock outcrop”. This rule is applied to prevent potential misclassifications of parts of the infrastructure as natural features.
9.
At a lower-granularity level, lower-slope “rock outcrop” objects dipping at an aspect (sub)-perpendicular to the average rock slope aspect are tagged “rock bench/secondary channel”.
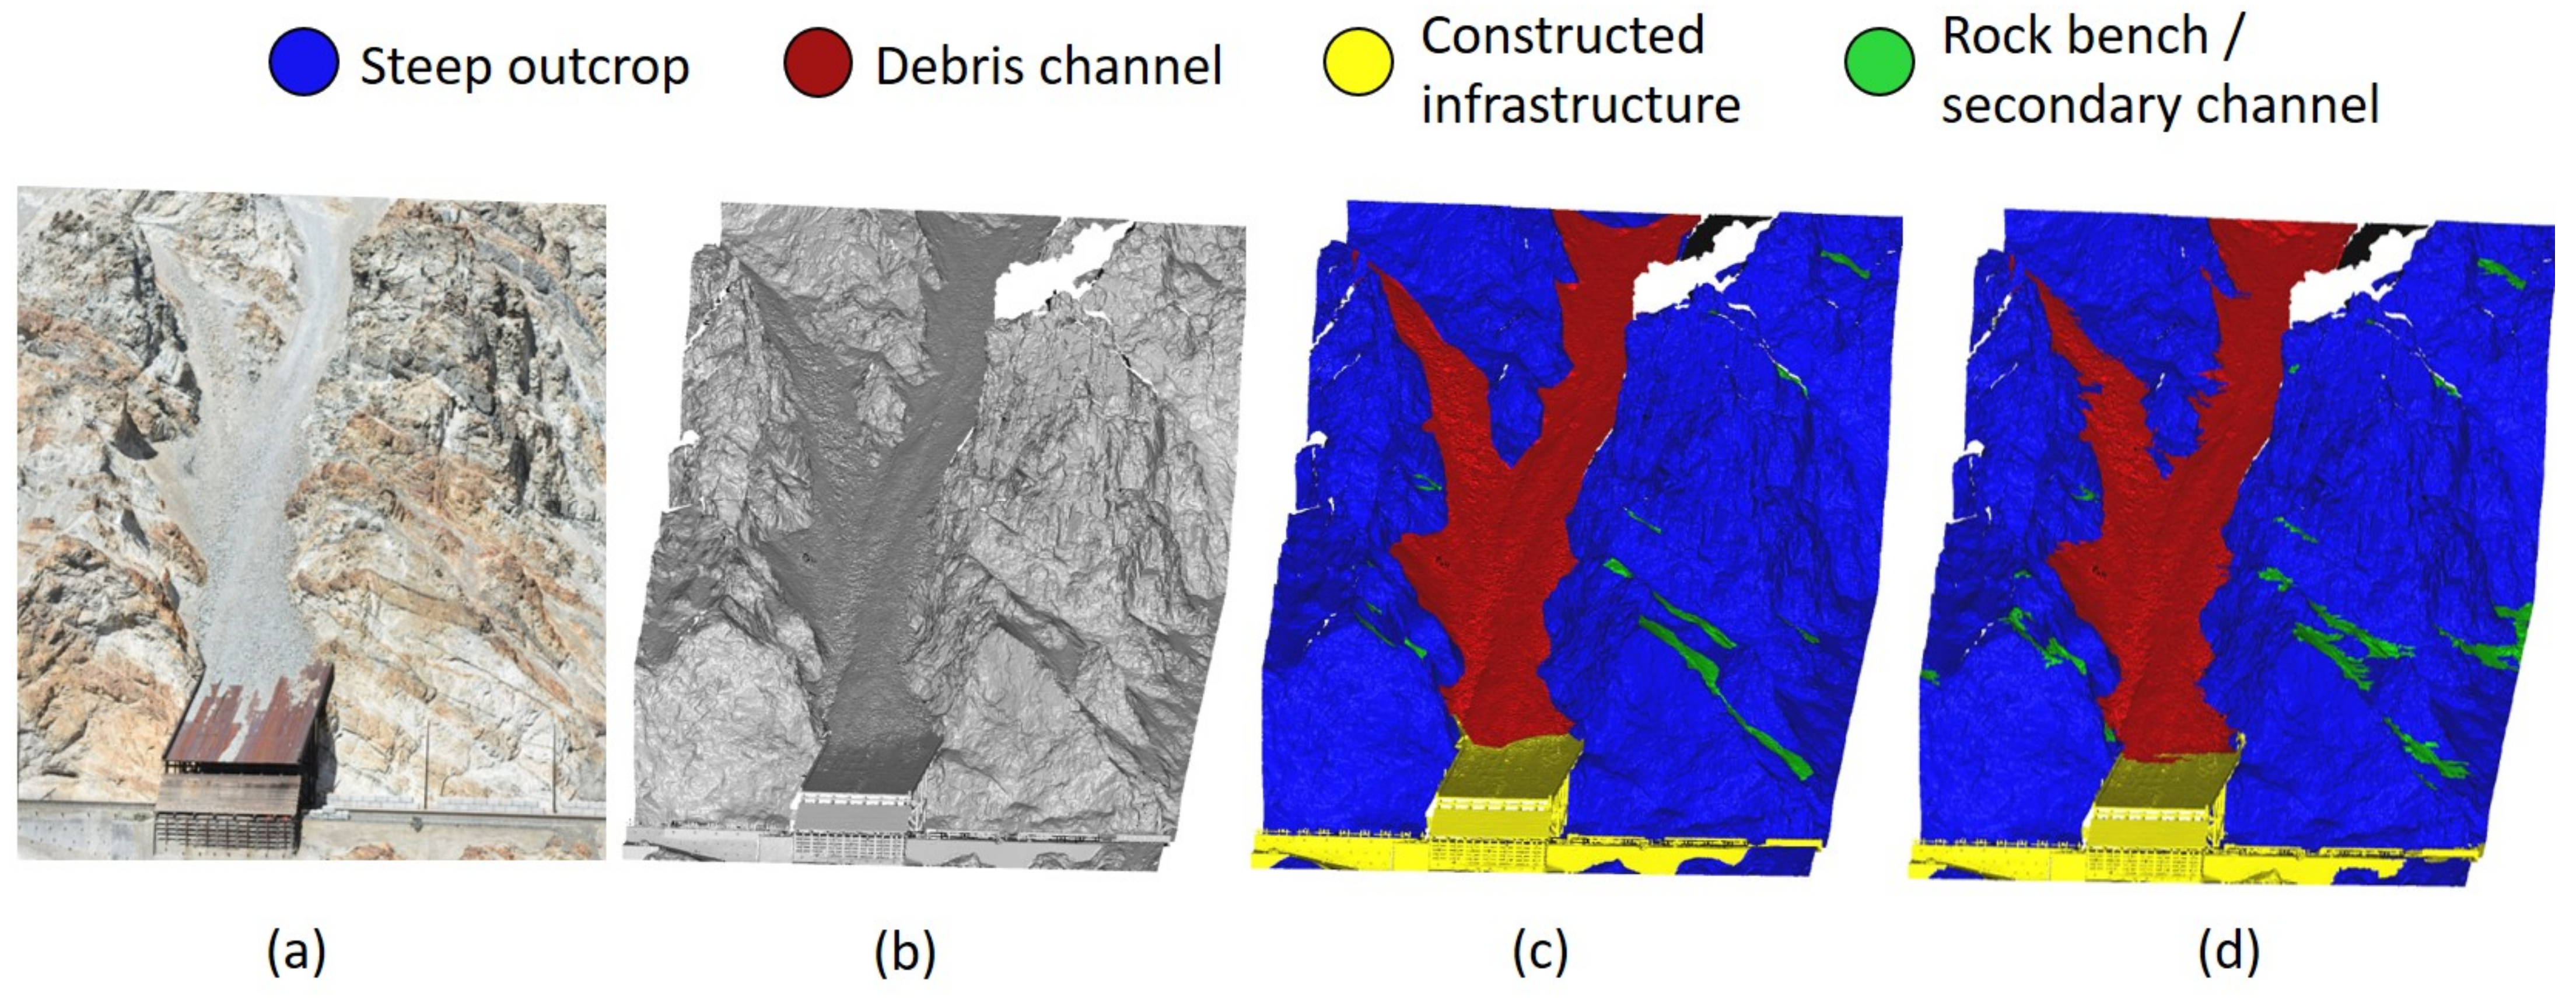
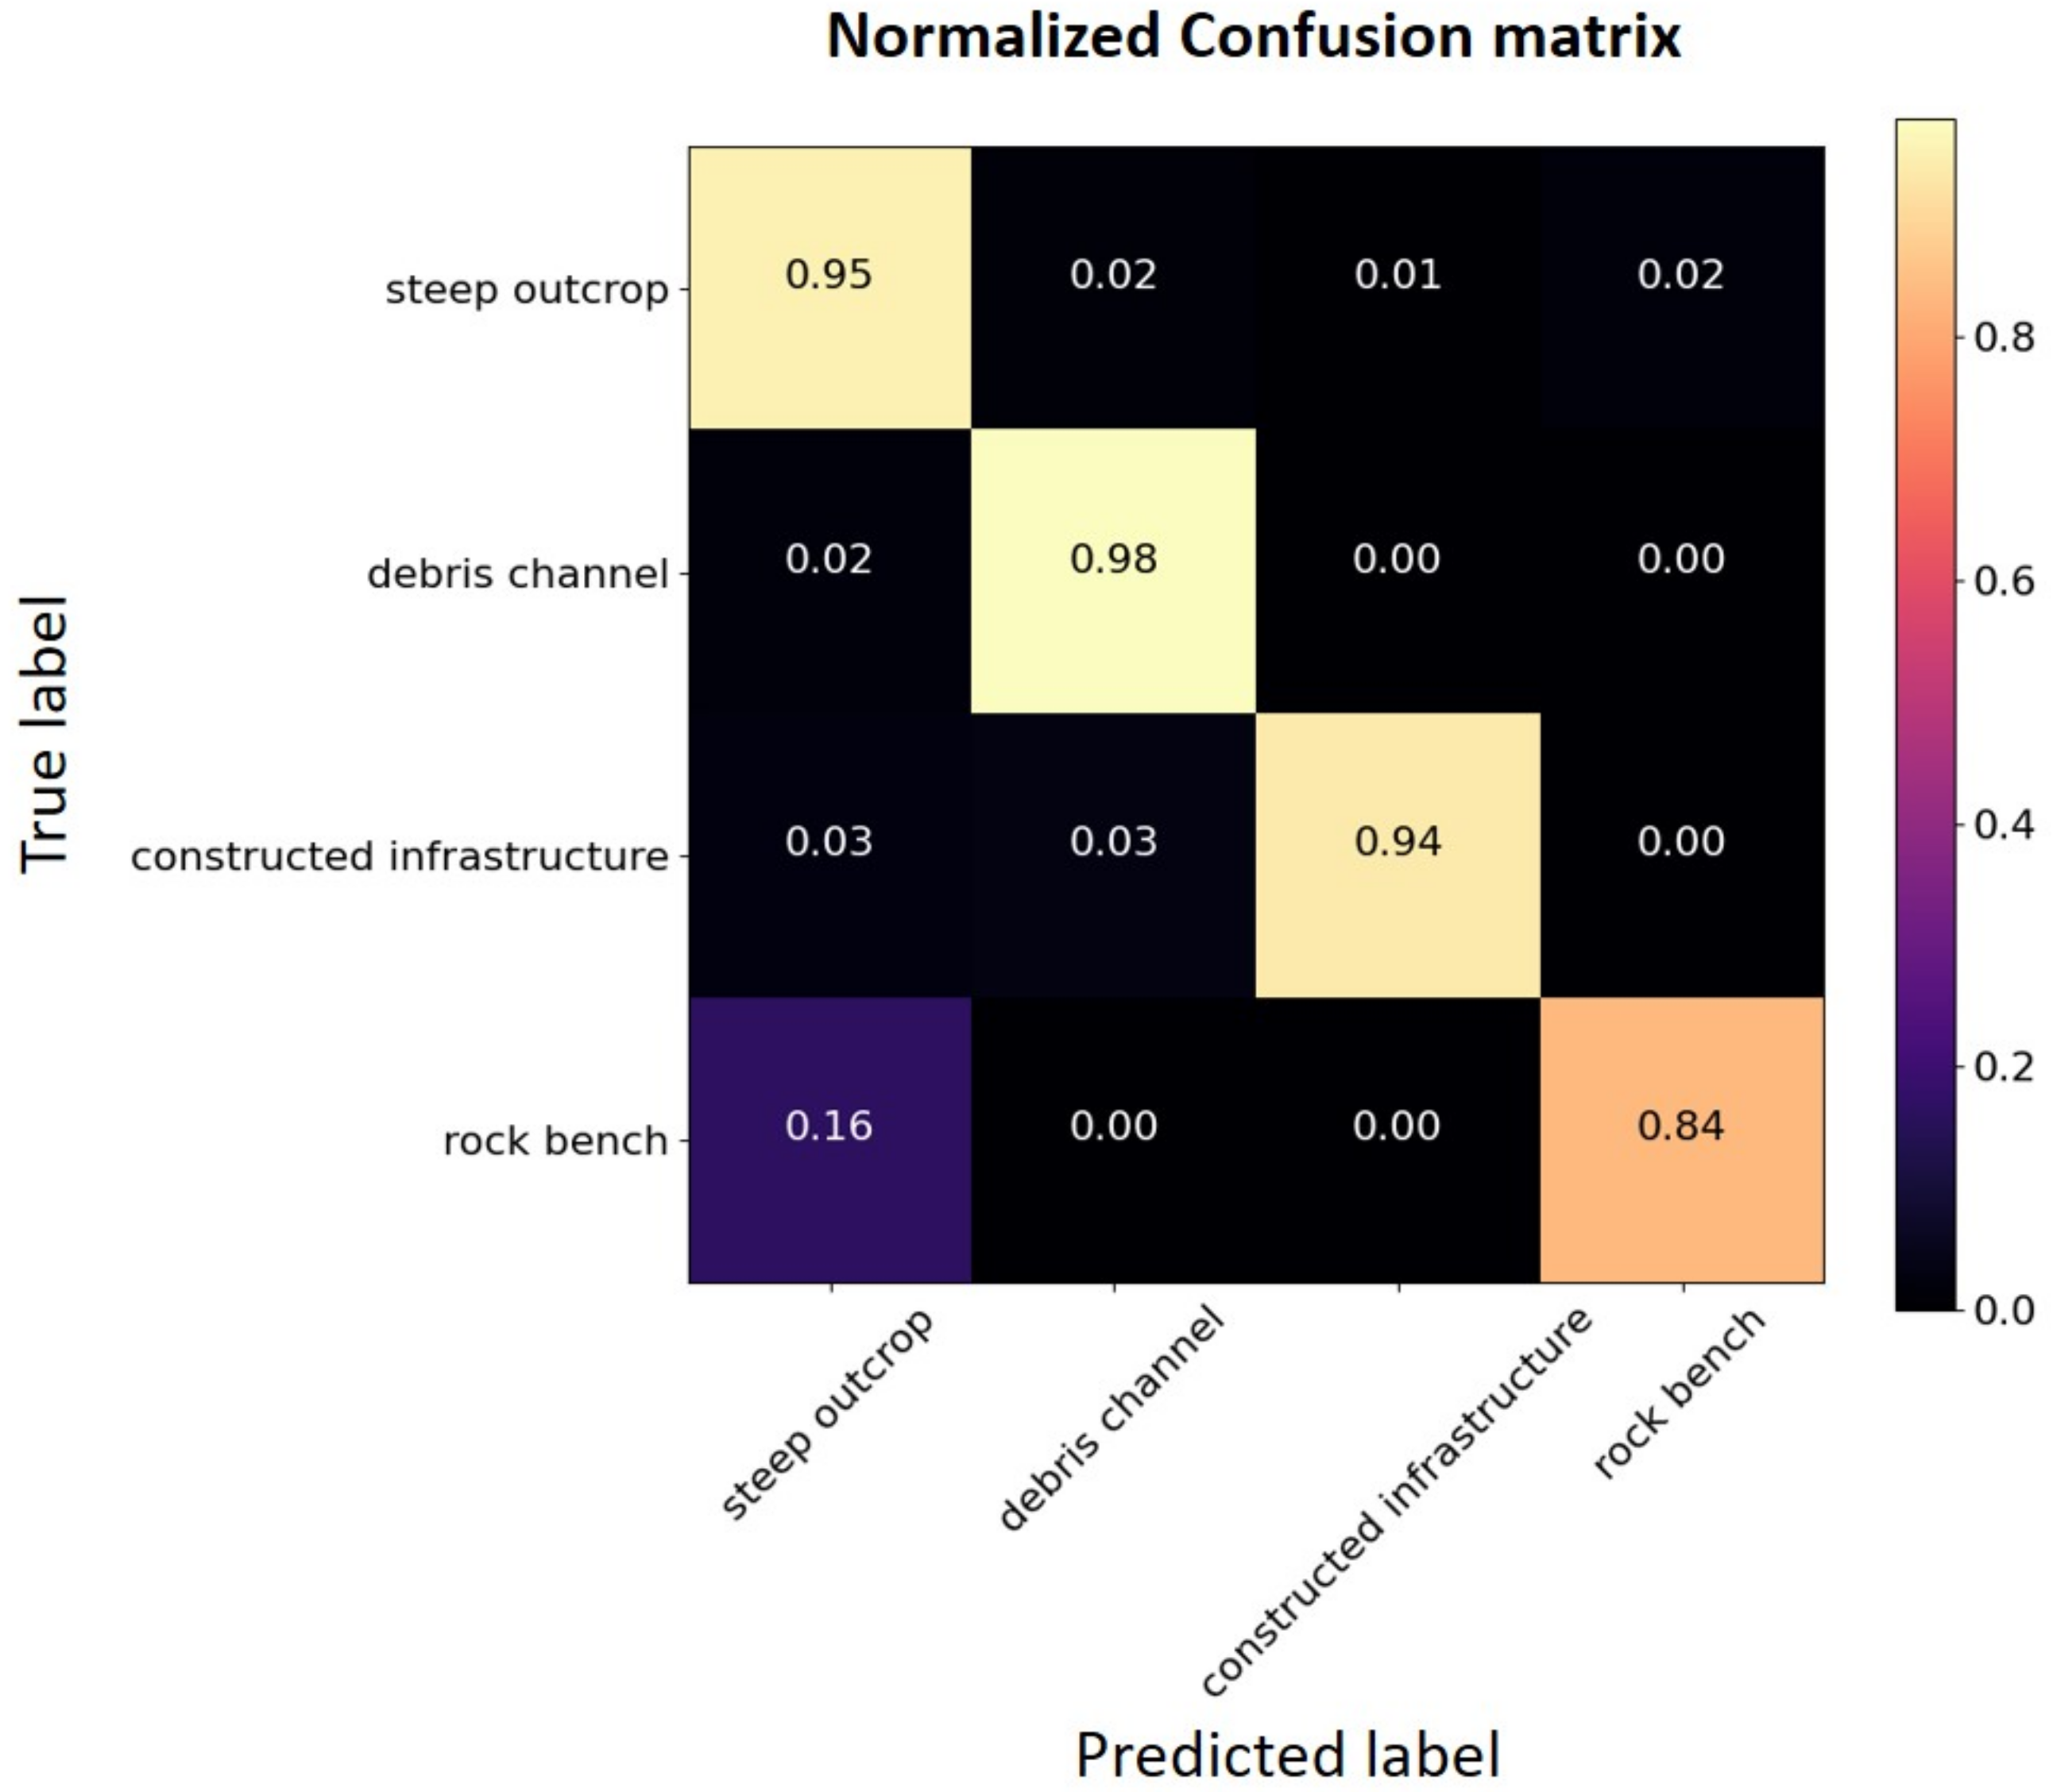
In Figure 11, the results of the proposed semantic segmentation are presented together with a RGB photo of the site, the raw point cloud representation, and the ground truth dataset for qualitative visual assessment. In addition, both the confusion matrix in Figure 12 and Table 2 provide a quantitative assessment of the performance of the proposed semantic segmentation over the White Canyon dataset and a per-class classification report, respectively. The analysis shows very high-performance scores (e.g., >94% F1-score) for steep outcrop, debris channel, and constructed infrastructure with the minimum observed value (64%) associated with the rock bench/secondary channel class (Table 2). The latter also highlights the effect of occlusion due to the orientation of the rock benches and secondary channels with respect to the scanner location that potentially leads to misrepresentation of these specific features. Please note that, although the dataset includes only one debris channel, the fact that almost its entire extent is well-separated from the rest of the outcrop identifies as a unique semantic feature (no matter its non-consistent geometry). This finding is of particular importance for the subsequent multi-temporal analyses of the site due to the local geometric changes caused by mass wasting processes in time. Misclassified “debris channel” or “rock outcrop” areas would lead to false assessments regarding movement of the debris within the channel or rockfall activity, respectively, within an automated monitoring workflow similar to the method discussed in Section 4.3.

4.2.2. Comparison to Point-Based Machine Learning

The knowledge-based semantic segmentation model is also assessed against ML using the limited available training data, which is typically the case with rock slope point clouds. In particular, a RF classifier trained with both multi- and adjusted-sized point neighbourhood descriptors was employed. The examined point neighbourhood sizes were picked from existing methodologies in rock slope classification. In detail, both a wide point neighbourhood size range (0.1 to 5 m) and the optimal point neighbourhoods discussed in [18] are evaluated together in a geological environment. The tested descriptors consist of the eigen-based dimensionality features as well as slope statistics as discussed in [22].
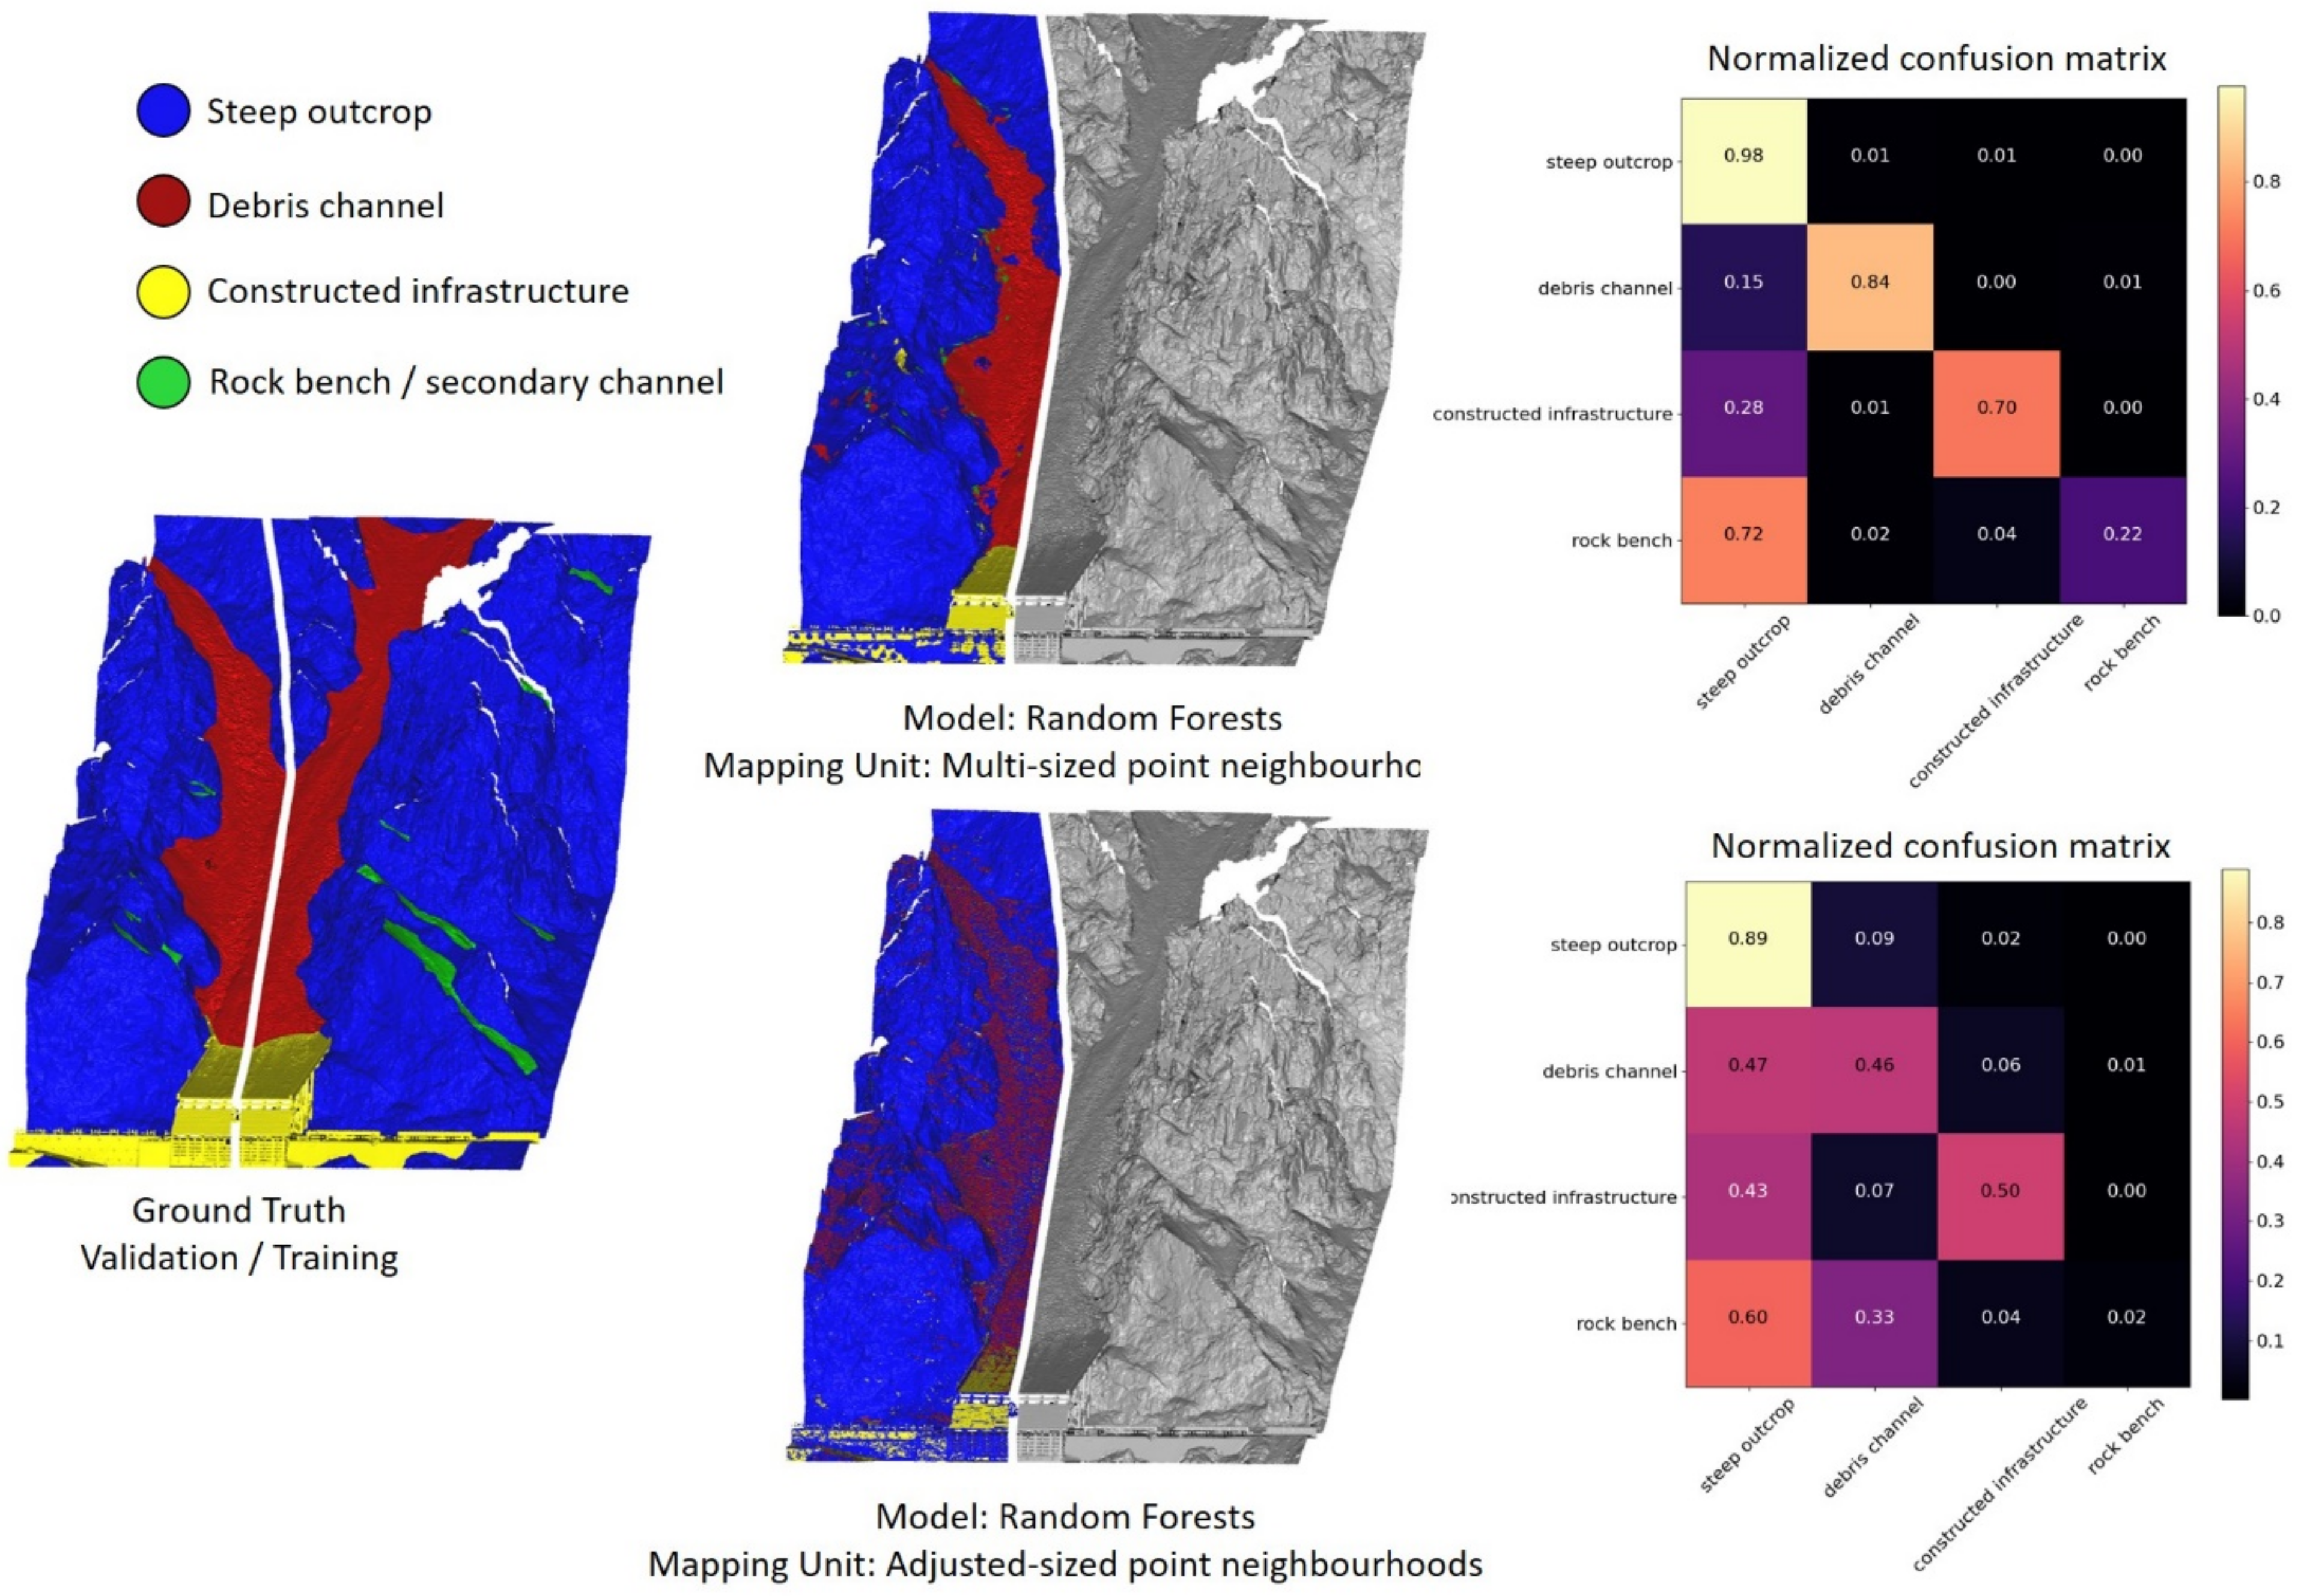
For the purposes of the analysis, the study dataset was split proportionally into training and validation sets (Figure 13). The split was vertical to represent the variations in down-slope geometry and topography in both the training and validation processes. The models were trained and implemented using the open-source ML Python package named scikit-learn. Although the multi-sized neighbourhood model performs significantly better than the adjusted-sized, there are still important misclassifications observed (Figure 13). For instance, constructed infrastructure is predicted to be rock outcrop sections and vice versa, which might cause issues and lead to incorrect decision-making if adopted in the design of a future intelligent management system of the site.
Table 3 provides a quantitative per-class assessment of two of the ML models as compared to the knowledge-based semantic segmentation approach based on the F1-score. The analysis shows that the multi-sized neighbourhood RF model performs almost equally as well for almost all the classes regardless of the limited training data. For the rock outcrop and debris channel classes, a 3% and 6% difference were observed, respectively, while the difference is wider for the constructed infrastructure (13%) and rock bench/secondary channel (41%) as can be seen in Figure 13. It is, however, important to note that the significantly higher difference in the “rock bench/secondary channel” class may be due to occlusion bias. This is due to the vantage point of the LiDAR scanner located across the valley, reducing the amount of data collected from horizontal surfaces located above the elevation of the scanner. Additional training data may be needed in order to compare the classification performances more confidently for this particular class.
Therefore, it is clear that the integration of multiple point neighbourhood sizes better characterizes the scene, however, the object-oriented conceptualization provides significant advantages. Apart from the pure arithmetic assessment, it is also important to see the location of the errors in both methods. Constructed structures, predicted as rock outcrop exist within the actual constructed infrastructure class (Figure 13). The same applies more or less to all the four classes. In contrast, in the object-oriented approach the errors are only observed on the boundaries, especially between rock outcrop and debris channels. The scene homogenization component of this method provides strong support to knowledge-based feature engineering by adding structure to the data and yielding new properties. The scene complexity is minimized, and the dataset can be modeled as a graph where the nodes represent the different objects and the edges the semantic relationships (rules). This supports the conceptualization, prevents mixed-class features, and restricts the errors to the boundaries.

4.3. Application

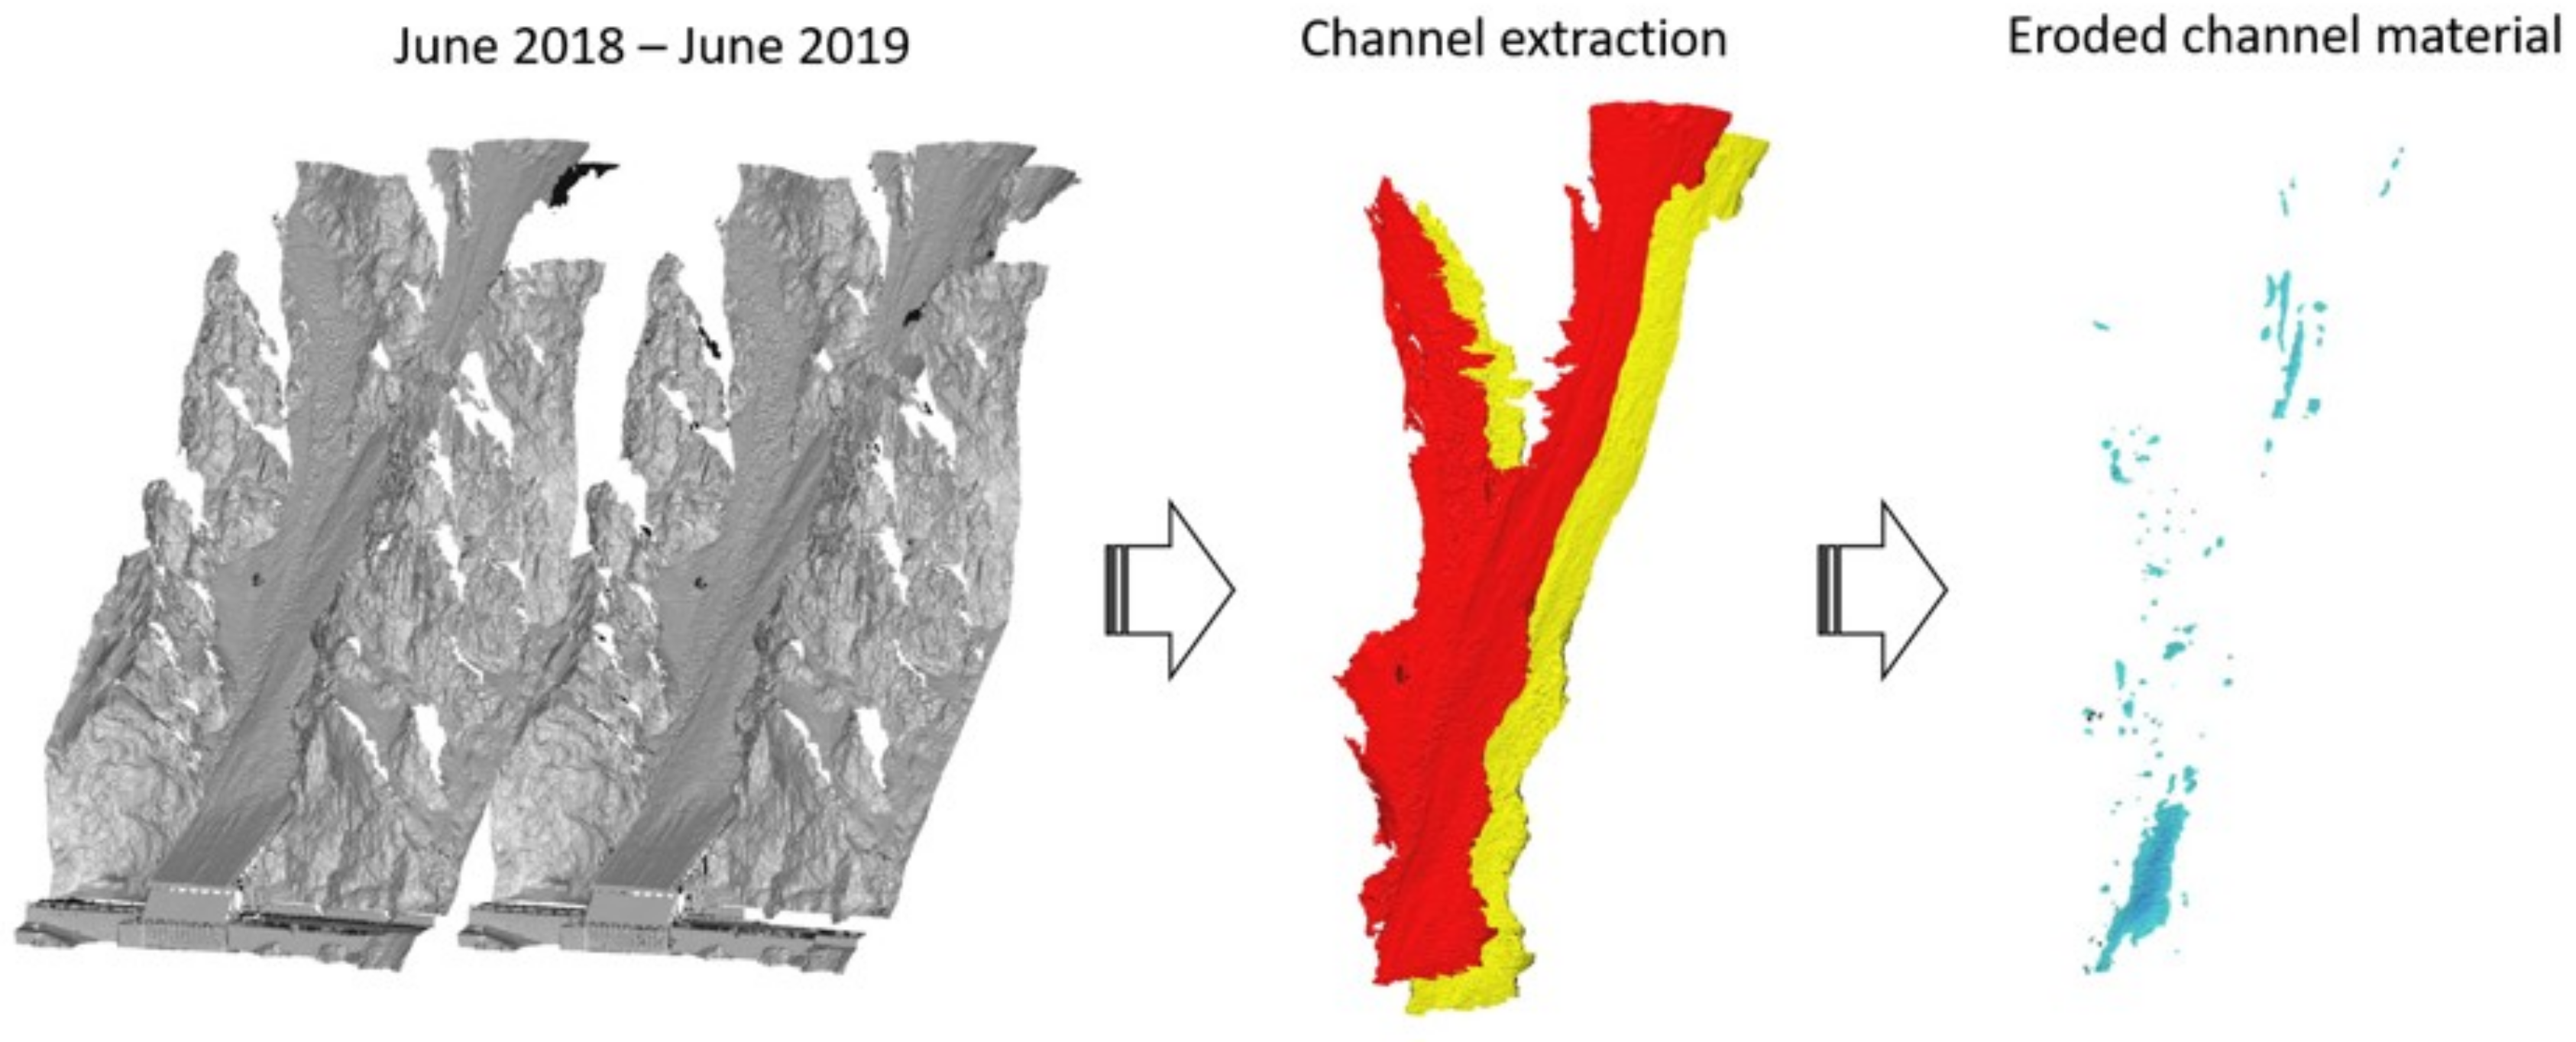
The current object-based semantic segmentation model was used for the example analysis presented in Figure 14. It includes the change detection between point clouds of the study area captured in June 2018 and June 2019, respectively. Employing the proposed model, the debris channel areas are automatically extracted without any user intervention and the changes are subsequently detected through M3C2 algorithm [36] by filtering the negative values. The output provides a direct estimate and visualization of the eroded channel material volume which can be used for further filing and interpretations.

5. Discussion

To extract knowledge from 3D point clouds and inform decision-making within rock slope management systems, semantic injection though automated processes is being developed. Advances in CV have provided promising and novel approaches for semantic injection into 3D urban scenes and every-day objects [37,38,39,40] but the adaptation of such techniques for engineering geology purposes seems to be facing some challenges. DL/ML models typically require large volumes of diverse training data to be able to generalize well and produce reproducible and reliable results. To date, publicly available ground-truth rock slope point cloud data are not available. In contrast, research on anthropogenic objects of interest (urban scenes), such as constructed infrastructure, for instance, benefits from numerous publicly available ground-truth datasets and the explicitly defined outlines and geometric relationships of such objects within anthropogenic ontologies like houses (e.g., Semantic3D [41], S3DIS [42]). It is clear that ground-truthing natural scenes involves a high degree of subjectivity and it is quite a challenge to put together a commonly accepted dataset. The lack of implicit quantitative definitions regarding the classes involved in rock slope processes makes the ground-truthing of such scenes a challenge, considering the high degree of subjectivity among different researchers. The latter also relies on the statement made by [14] saying that: “the term ‘agreement’ instead of ‘accuracy’ is better fitted in landslide mapping procedures”. Due to the above reason, researchers tend to evaluate the performance of their algorithms based on their own hand-mapped datasets. According to [34] (p. 4), “as segmentation procedures are used for automation, they are replacing the activity of visual digitizing. No segmentation result-even if quantitatively proofed-will convince if it does not satisfy the human eye”. In addition, due to the dynamic and varying nature of the geologic environments, the ability to model site-specific concepts seems critical in rock slope semantic segmentation.
Although some researchers have proposed strategies for integrating engineering geological knowledge into 3D point clouds for further reasoning (refer to ML-based methods in Figure 13), little has been done in the data structuration and knowledge organization. Effective segmentation methods which are able to partition the point cloud into semantically meaningful areas, are very helpful to model a scene [42]. To accomplish this, the point cloud needs to be structured retaining both spatial and relational information. The proposed method provides semantic structure to the 3D point cloud (Figure 4 and Figure 5), which promotes the development of a multi-level graph representation. Thus, robust object-based descriptors can be incorporated in the workflow following tailored conceptualizations in order to address the substantial complexity observed in rock slopes.
The main limitation that such an unsupervised semantic segmentation model has to overcome is the fact that, in engineering geology, ontologies are not explicitly defined. As a result, the design of such models is based on the modeler’s conceptualization and has to be adjusted to the specific environment based on expert characterization, potential geological and geomorphological processes and the ensuing reasoning each time. However, expert mapping does not always provide coherent validation due to the bias associated with expert perception subjectivity. Therefore, researchers might be discouraged to investigate the potential of incorporating automatic semantic segmentation into engineering geology workflows due to the need to prepare their own reference datasets for validation and/or training. Without defined ontologies, and a collective effort to develop annotations, semantic segmentation results may remain undeveloped and satisfactory levels of interoperability may not be achieved. However, and previous from this study, the conceptual framework for integrating formalized knowledge within rock slope point cloud processing was also largely absent.

6. Summary and Conclusions

This paper proposes a rock slope assessment methodology based on LiDAR point cloud processing. Specifically, it includes a knowledge-based object-oriented framework for tailored rock slope semantic segmentation using raw XYZ information (Figure 2). The investigated site is a steep railway rock slope in British Columbia, Canada, where different types of mass wasting mechanisms occur periodically (Figure 3). The proposed methodology, which has been developed based on a data-driven homogenization procedure generating meaningful object primitives, supports the extraction of informative descriptors able to replicate expert perception. The developed rule-base leverages geometric, topographic, and contextual features to extract specific classes of the investigated scheme by employing regulation through tailored rules (Table 1). This methodology provides an alternative to existing supervised ML-based semantic segmentation approaches [22] in cases where sufficient amounts of annotated reference data are not available or higher-level conceptualization is needed (apart from texture identification). For this reason, a comparison with two different ML models was performed to validate the capabilities of the proposed model (Figure 13 and Table 3). The results demonstrate that one can efficiently segment a rock slope point cloud, in a knowledge-based fashion, by employing only a few informative features, without overcomplicating the task. The classification was performed based on an experts’ conceptualization scheme of the site (Figure 9). The application of the method to temporally different instances of the study site, showcases its incorporation of it into automatic multi-temporal analysis workflows for targeted rock slope assessment (Figure 14).
This study shows that in engineering geology, satisfactory tailored semantic segmentation can be achieved even without the employment of ML classifiers and the associated largely time-consuming need for training data collection. This, however, requires proper conceptualization for the selection of object features and the definition of the ruleset. The model demonstrates almost equal performance to ML, with over 90% scores for three of the four classes examined. However, although ML approaches using multi-sized point neighbourhood descriptors performed very well in identifying different materials/textures, they cannot accommodate expert conceptualization. It has been proven that bedrock and talus can be identified as different materials using ML, but the general concept is missed (e.g., is the talus accumulation detected to rest on a channel or bench?). Knowledge-based object-oriented models value quality over quantity in descriptor selection and thus complexity is reduced and explainability increased. This analytic knowledge can then be efficiently represented through specific data structures. In contrast, point-based procedures analyze every point in the context of its spherical neighbourhood(s), without being able to leverage spatial or contextual information related to the point of interest since the point cloud data inherently lacks structure and semantic meaning.
The paper shows the potential of object-oriented models to be used in rock slope assessment and highlights new aspects of further research in this direction and especially in knowledge formalization through ontologies. Considerations for future work include the extension of the object-oriented model to deeper levels of the examined rock slope conceptualization, as well as the calibration to other rock slope sites within different geomorphologic settings and concepts to test the sensitivity of the rulesets. In addition, comparison between point- and object-based ML models using rich and varying training data would provide interesting insights. Colour information from photogrammetric point clouds will also be considered in future tests together with the potential of other segmentation methods to be integrated for the supervoxel generation.
Another interesting future challenge is the investigation of the processes modelling potential, utilizing semantic relationships within multi-temporal semantically-rich point clouds of a rock slope. The latter consideration aims to provide deeper insights regarding future potential hazardous zones based on a certain slope dynamic behaviour and eventually contributes to the establishment of quantitative definitions of different rock slope elements. The development of computer-aided methodologies that can accommodate expert-reasoning is considered essential in such a site-specific domain as landslide research, and knowledge formalization is necessary towards this direction.

Author Contributions

Conceptualization, I.F.; methodology, I.F.; software, I.F. and D.B.; formal analysis, I.F.; investigation, I.F. and D.B.; resources, N.V. and D.J.H.; data curation, I.F.; writing—original draft preparation, I.F.; writing—review and editing, D.B., D.J.H., and N.V.; visualization, I.F.; supervision, D.J.H. and N.V. All authors have read and agreed to the published version of the manuscript.

Funding

This research is supported by the RMC Green Team and the Canadian Department of National Defense as well as the Canadian Railway Ground Hazard Research Program (CN Rail, CP Rail, Transport Canada, Geological Survey of Canada) which is funded through a Natural Sciences and Engineering Research Council of Canada (NSERC) Alliance grant.

Acknowledgments

The authors would like to thank the three anonymous reviewers for helping to improve the quality of the manuscript with their comments and suggestions.

Conflicts of Interest

The authors declare no conflict of interest. The funders had no role in the design of the study; in the collection, analyses, or interpretation of data; in the writing of the manuscript, or in the decision to publish the results.

Abbreviations

2, 2.3, 3D2-, 2.5, 3-dimensional;
CScomputer science;
CVcomputer vision;
DEMdigital elevation model;
GISgeographic information system;
MLmachine learning;
PCAprincipal component analysis;
SVMsupport vector machine;
RFrandom forests;
TLSterrestrial laser scanner;
SCVsingular value decomposition;
LVlocal variance;
ICPiterative closest point;
SLIDOstatewide landslide information database for Oregon;
TPtrue positive;
TNtrue negative;
FPfalse positive;
FNfalse negative;
RGBred-green-blue;
M3C2Multi-scale model to model cloud comparison;
DLdeep learning.

References

  1. Rutzinger, M.; Höfle, B.; Lindenbergh, R.; Oude Elberink, S.; Pirotti, F.; Sailer, R.; Scaioni, M.; Stötter, J.; Wujanz, D. Close-Range Sensing Techniques in Alpine Terrain. ISPRS Ann. Photogramm. Remote Sens. Spat. Inf. Sci. 2016, III–6, 15–22. [Google Scholar] [CrossRef] [Green Version]
  2. Scaioni, M.; Longoni, L.; Melillo, V.; Papini, M. Remote sensing for landslide investigations: An overview of recent achievements and perspectives. Remote Sens. 2014, 6, 9600–9652. [Google Scholar] [CrossRef] [Green Version]
  3. Hutchinson, D.J.; Lato, M.; Gauthier, D.; Kromer, R.; Ondercin, M.; Van Veen, M.; Harrap, R. Applications of remote sensing techniques to managing rock slope instability risk. In Proceedings of the 68th Canadian Geotechnical Conference-GEOQuébec 2015, Quebec City, QC, Canada, 21–23 September 2015; p. 10. [Google Scholar]
  4. Abellán, A.; Jaboyedoff, M.; Oppikofer, T.; Vilaplana, J.M. Detection of millimetric deformation using a terrestrial laser scanner: Experiment and application to a rockfall event. Nat. Hazards Earth Syst. Sci. 2009, 9, 365–372. [Google Scholar] [CrossRef] [Green Version]
  5. Kromer, R.A.; Hutchinson, D.J.; Lato, M.J.; Gauthier, D.; Edwards, T. Identifying rock slope failure precursors using LiDAR for transportation corridor hazard management. Eng. Geol. 2015, 195, 93–103. [Google Scholar] [CrossRef]
  6. Lato, M.; Diederichs, M.S.; Hutchinson, D.J.; Harrap, R. Optimization of LiDAR scanning and processing for automated structural evaluation of discontinuities in rockmasses. Int. J. Rock Mech. Min. Sci. 2009, 46, 194–199. [Google Scholar] [CrossRef]
  7. Bonneau, D.A.; Jean Hutchinson, D.; DiFrancesco, P.M.; Coombs, M.; Sala, Z. Three-dimensional rockfall shape back analysis: Methods and implications. Nat. Hazards Earth Syst. Sci. 2019, 19, 2745–2765. [Google Scholar] [CrossRef] [Green Version]
  8. Bonneau, D.; DiFrancesco, P.M.; Jean Hutchinson, D. Surface reconstruction for three-dimensional rockfall volumetric analysis. ISPRS Int. J. Geo-Inf. 2019, 8, 548. [Google Scholar] [CrossRef] [Green Version]
  9. Rowe, E.; Hutchinson, D.J.; Kromer, R.A. An analysis of failure mechanism constraints on pre-failure rock block deformation using TLS and roto-translation methods. Landslides 2018, 15, 409–421. [Google Scholar] [CrossRef]
  10. Oppikofer, T.; Jaboyedoff, M.; Blikra, L.; Derron, M.H.; Metzger, R. Characterization and monitoring of the Åknes rockslide using terrestrial laser scanning. Nat. Hazards Earth Syst. Sci. 2009, 9, 1003–1019. [Google Scholar] [CrossRef] [Green Version]
  11. Williams, J.G.; Rosser, N.J.; Hardy, R.J.; Brain, M.J.; Afana, A.A. Optimising 4-D surface change detection: An approach for capturing rockfall magnitude-frequency. Earth Surf. Dyn. 2018, 6, 101–119. [Google Scholar] [CrossRef] [Green Version]
  12. Martha, T.R.; Kerle, N.; Jetten, V.; van Westen, C.J.; Kumar, K.V. Characterising spectral, spatial and morphometric properties of landslides for semi-automatic detection using object-oriented methods. Geomorphology 2010, 116, 24–36. [Google Scholar] [CrossRef]
  13. Feizizadeh, B.; Blaschke, T. A semi-automated object based image analysis approach for landslide delineation. In Proceedings of the 2013 European Space Agency Living Planet Symposium, Edinburgh, UK, 9–13 September 2013; pp. 9–13. [Google Scholar] [CrossRef]
  14. Hölbling, D.; Eisank, C.; Albrecht, F.; Vecchiotti, F.; Friedl, B.; Weinke, E.; Kociu, A. Comparing manual and semi-automated landslide mapping based on optical satellite images from different sensors. Geosciences 2017, 7, 37. [Google Scholar] [CrossRef] [Green Version]
  15. Karantanellis, E.; Marinos, V.; Vassilakis, E.; Christaras, B. Object-based analysis using unmanned aerial vehicles (UAVs) for site-specific landslide assessment. Remote Sens. 2020, 12, 1711. [Google Scholar] [CrossRef]
  16. Farmakis, I.; Bonneau, D.; Hutchinson, D.J.; Vlachopoulos, N. Supervoxel-Based Multi-Scale Point Cloud Segmentation Using FNEA for Object-Oriented Rock Slope Classification Using TLS. Int. Arch. Photogramm. Remote Sens. Spat. Inf. Sci. 2020, 43, 1049–1056. [Google Scholar] [CrossRef]
  17. Pauly, M.; Keiser, R.; Gross, M. Multi-scale Feature Extraction on Point-Sampled Surfaces. Comput. Graph. Forum 2003, 22, 281–289. [Google Scholar] [CrossRef] [Green Version]
  18. Weinmann, M.; Jutzi, B.; Hinz, S.; Mallet, C. Semantic point cloud interpretation based on optimal neighborhoods, relevant features and efficient classifiers. ISPRS J. Photogramm. Remote Sens. 2015, 105, 286–304. [Google Scholar] [CrossRef]
  19. Brodu, N.; Lague, D. 3D terrestrial lidar data classification of complex natural scenes using a multi-scale dimensionality criterion: Applications in geomorphology. ISPRS J. Photogramm. Remote Sens. 2012, 68, 121–134. [Google Scholar] [CrossRef] [Green Version]
  20. Bosser, B.; Guyon, I.; Vapnik, V. A Training Algorithm for Optimal Margin Classifiers. In Proceedings of the Fifth Annual Workshop on Computational Learning Theory, New York, NY, USA, 27–29 July 1992; pp. 144–152. [Google Scholar]
  21. Bonneau, D.A.; Hutchinson, D.J. The use of terrestrial laser scanning for the characterization of a cliff-talus system in the Thompson River Valley, British Columbia, Canada. Geomorphology 2019, 327, 598–609. [Google Scholar] [CrossRef]
  22. Weidner, L.; Walton, G.; Kromer, R. Classification methods for point clouds in rock slope monitoring: A novel machine learning approach and comparative analysis. Eng. Geol. 2019, 263, 105326. [Google Scholar] [CrossRef]
  23. Breiman, L. Random Forests. Mach. Learn. 2001, 45, 5–32. [Google Scholar] [CrossRef] [Green Version]
  24. Feng, C.C.; Guo, Z. Automating parameter learning for classifying terrestrial LiDAR point cloud using 2D land cover maps. Remote Sens. 2018, 10, 1192. [Google Scholar] [CrossRef] [Green Version]
  25. Blomley, R.; Weinmann, M.; Leitloff, J.; Jutzi, B. Shape distribution features for point cloud analysis—A geometric histogram approach on multiple scales. ISPRS Ann. Photogramm. Remote Sens. Spat. Inf. Sci. 2014, II–3, 9–16. [Google Scholar] [CrossRef] [Green Version]
  26. Thomas, H.; Goulette, F.; Deschaud, J.E.; Marcotegui, B.; Gall, Y. Le Semantic classification of 3d point clouds with multiscale spherical neighborhoods. In Proceedings of the 2018 International conference on 3D vision (3DV), Verona, Italy, 5–8 September 2018; pp. 390–398. [Google Scholar] [CrossRef] [Green Version]
  27. Ioannou, Y.; Taati, B.; Harrap, R.; Greenspan, M. Difference of normals as a multi-scale operator in unorganized point clouds. In Proceedings of the 2012 Second International Conference on 3D Imaging, Modeling, Processing, Visualization & Transmission, Zurich, Switzerland, 13–15 October 2012; pp. 501–508. [Google Scholar] [CrossRef] [Green Version]
  28. Shannon, C.E. A Mathematical Theory of Communication. Bell Syst. Tech. J. 1948, 27, 623–656. [Google Scholar] [CrossRef]
  29. Mayr, A.; Rutzinger, M.; Bremer, M.; Oude Elberink, S.; Stumpf, F.; Geitner, C. Object-based classification of terrestrial laser scanning point clouds for landslide monitoring. Photogramm. Rec. 2017, 32, 377–397. [Google Scholar] [CrossRef] [Green Version]
  30. Dunham, L.; Wartman, J.; Olsen, M.J.; O’Banion, M.; Cunningham, K. Rockfall Activity Index (RAI): A lidar-derived, morphology-based method for hazard assessment. Eng. Geol. 2017, 221, 184–192. [Google Scholar] [CrossRef] [Green Version]
  31. Hutchinson, D.J.; Lato, M.; Gauthier, D.; Kromer, R.; Ondercin, M.; MacGowan, T.; Edwards, T. Rock Slope Monitoring and Risk Management for Railway Infrastructure in the White Canyon, British Columbia, Canada. In Engineering Geology for Society and Territory; Springer International Publishing: Cham, Switzerland, 2015; Volume 2, pp. 435–439. [Google Scholar]
  32. Besl, P.J.; McKay, N.D. A method for registration of 3-D shapes. IEEE Trans. Pattern Anal. Mach. Intell. 1992, 14, 239–256. [Google Scholar] [CrossRef]
  33. Wu, L.; Wang, Y.; Long, J.; Liu, Z. Image and Graphics; Zhang, Y.-J., Ed.; Lecture Notes in Computer Science; Springer International Publishing: Cham, Switzerland, 2015; Volume 9217, ISBN 9783319219776. [Google Scholar]
  34. Baatz, M.; Schape, A. Object-Oriented and Multi-Scale Image Analysis in Semantic Networks. In Proceedings of the 2nd International Symposium on Operationalization of Remote Sensing, ITC, Enschede, The Netherlands, 16–20 August 1999. [Google Scholar]
  35. Drǎguţ, L.; Csillik, O.; Eisank, C.; Tiede, D. Automated parameterisation for multi-scale image segmentation on multiple layers. ISPRS J. Photogramm. Remote Sens. 2014, 88, 119–127. [Google Scholar] [CrossRef] [Green Version]
  36. Lague, D.; Brodu, N.; Leroux, J. Accurate 3D comparison of complex topography with terrestrial laser scanner: Application to the Rangitikei canyon (N-Z). ISPRS J. Photogramm. Remote Sens. 2013, 82, 10–26. [Google Scholar] [CrossRef] [Green Version]
  37. Charles, R.Q.; Su, H.; Kaichun, M.; Guibas, L.J. PointNet: Deep Learning on Point Sets for 3D Classification and Segmentation. In Proceedings of the 2017 IEEE Conference on Computer Vision and Pattern Recognition (CVPR), Honolulu, HI, USA, 21–26 July 2017; IEEE: Piscataway Township, NJ, USA, 2017; pp. 77–85. [Google Scholar]
  38. Qi, C.R.; Yi, L.; Su, H.; Guibas, L.J. PointNet++: Deep Hierarchical Feature Learning on point sets in a metric space. arXiv 2017, arXiv:1706.02413, 5105–5114. [Google Scholar]
  39. Maturana, D.; Scherer, S. VoxNet: A 3D Convolutional Neural Network for Real-Time Object Recognition. In Proceedings of the 2015 IEEE/RSJ International Conference on Intelligent Robots and Systems (IROS), Hamburg, Germany, 28 September–2 October 2015; IEEE: Piscataway Township, NJ, USA, 2015; pp. 922–928. [Google Scholar]
  40. Ben-Shabat, Y.; Lindenbaum, M.; Fischer, A. 3DmFV: Three-Dimensional Point Cloud Classification in Real-Time Using Convolutional Neural Networks. IEEE Robot. Autom. Lett. 2018, 3, 3145–3152. [Google Scholar] [CrossRef]
  41. Hackel, T.; Savinov, N.; Ladicky, L.; Wegner, J.D.; Schindler, K.; Pollefeys, M. Semantic3D.Net: A New Large-Scale Point Cloud Classification Benchmark. In Proceedings of the ISPRS Annals of the Photogrammetry, Remote Sensing and Spatial Information Sciences, Melbourne, Australia, 26–27 October 2017; Volume 4, pp. 91–98. [Google Scholar]
  42. Hu, S.M.; Cai, J.X.; Lai, Y.K. Semantic labeling and instance segmentation of 3d point clouds using patch context analysis and multiscale processing. IEEE Trans. Vis. Comput. Graph. 2018, 14, 2485–2498. [Google Scholar] [CrossRef] [Green Version]
Figure 1. Schematic representation of different types of point neighbourhoods used in point cloud featuring approaches: (a) single-sized neighbourhoods calculate features within a fixed volume around individual points; (b) multi-sized neighbourhoods calculate features within multiple volumes, around individual points; (c) adjusted-sized neighbourhoods calculate features within a volume adjusted to the local geometry of individual points.
Remotesensing 13 01354 g001
Figure 2. The flowchart representing the proposed semantic segmentation framework. The three main processes of the workflow are: voxelization (yellow), scene homogenization (green), and classification (blue), as discussed in Section 3.2, Section 3.3 and Section 3.4, respectively.
Remotesensing 13 01354 g002
Figure 3. Study area (a) Province of British Columbia (BC); (b) White Canyon Site Location within BC; (c) Picture of the Scheme 2019.
Remotesensing 13 01354 g003
Figure 4. Representation of the octree data structure and the effect of resolution on the spatial information. The size of the leaf nodes (green) represents the resolution of the final voxel grid created based on the octree data structure.
Remotesensing 13 01354 g004
Figure 5. Voxel adjacency graph representation of a given voxel (blue). The different adjacency types of a voxel in 3D space are shown using different colours: shared facet (red), edge (green), vertex (grey).
Remotesensing 13 01354 g005
Figure 6. Illustration of the proposed descriptor extraction process for point cloud characterization by means of local geometry and topography. Non-empty voxels allow for the calculation of the desired descriptors at the point level.
Remotesensing 13 01354 g006
Figure 7. Schematic representation of supervoxel assembly. Different colours (red, green, and grey) represent the supervoxels, cubes represent voxels, and black dots are the points within each voxel.
Remotesensing 13 01354 g007
Figure 8. Graph representation of the semantic network with interrelationships within different levels of organization of the 3D point cloud (blue: point cloud, green: voxel grid, red: object assembly).
Remotesensing 13 01354 g008
Figure 9. Railway rock slope ontology representation of the White Canyon slopes. Semantic representation of the geometrical knowledge permits definition of materials, geomorphological structures, and anthropogenic objects.
Remotesensing 13 01354 g009
Figure 10. Object-oriented classification results of the study site. (a) 3D point cloud; (b) initial segmentation (objects are assigned random RGB values); (c) detection of “debris channel” candidates; (d) “debris channel” tagging; (e) extraction of “constructed infrastructure”; (f) extraction of guest rock outcrop features (rock benches) at a lower ontology level. The numbers (1–6) correspond to the classification rules, respectively.
Remotesensing 13 01354 g010
Figure 11. Results of the proposed object-oriented semantic segmentation on a White Canyon section. (a) RGB photo; (b) Raw point cloud; (c) Ground Truth; (d) Prediction using the process shown in Figure 10.
Remotesensing 13 01354 g011
Figure 12. Normalized confusion matrix of the proposed unsupervised object-based classification approach over the study White Canyon section.
Remotesensing 13 01354 g012
Figure 13. Semantic segmentation of the study site based on Machine Learning using multi- and adjusted-sized point neighbourhood features and a RF classifier.
Remotesensing 13 01354 g013
Figure 14. Application of the proposed semantic segmentation for automated change detection with semantics. The red and yellow information in the channel extraction panel display debris channel point cloud data taken from different times. The difference between the two instances is the change that records the erosion and deposition processes on the slope, Figure 5.
Remotesensing 13 01354 g014
Table 1. Presentation and description of both the lower- and higher-level descriptors used within the proposed object-oriented framework.
Descriptor NameDescriptionPurpose/Expert Reasoning
SlopeDip angle between 0–90° to the horizontal plane. Is used to describe slope variations associated with the objects of interest.Eroded areas such as debris channels usually retain lower slope angles than the surrounding rock mass.
Constructed infrastructure is usually vertical or horizontal.
AspectAngle between 0–360° (North). Is used to describe the alignment of the various objects based on the azimuth.Features such as rock benches formed from the bedrock structure are usually oriented perpendicular to the main slope dip direction.
LinearityThe difference of the two major axes of a 3D shape divided by the longest.Transportation corridor structures appear to be more elongated than geological structures.
2D compactnessExpresses how close to a square is a 3D shape projected to its best-fitting plane.Constructed infrastructure appears to be more squared-shaped and platy than geological structures.
Relative adjacent classExpresses the object based to its adjacent classes.Topological rules used for refinement.
Relative elevation to classObject’s position along Z-axis relative to other class objects.Topological rules used for refinement.
Table 2. Per-class classification report of the proposed semantic segmentation on the study dataset.
PrecisionRecallF1-Score
Steep outcrop0.990.950.97
Debris channel0.910.980.95
Constructed infrastructure0.950.940.94
Rock bench/secondary
channel
0.510.840.64
Table 3. Quantitative F1-score-based per-class comparison of proposed Machine Learning models to the proposed unsupervised semantic segmentation.
ModelSteep OutCropDebris ChannelConstructed
Infrastructure
Rock Bench/
Secondary
Channel
Multi-sized RF0.940.890.810.23
Adjusted-sized RF0.830.520.580.03
Knowledge-based0.970.950.940.64
Publisher’s Note: MDPI stays neutral with regard to jurisdictional claims in published maps and institutional affiliations.