Abstract
In this study, building extraction in aerial images was performed using csAG-HRNet by applying HRNet-v2 in combination with channel and spatial attention gates. HRNet-v2 consists of transition and fusion processes based on subnetworks according to various resolutions. The channel and spatial attention gates were applied in the network to efficiently learn important features. A channel attention gate assigns weights in accordance with the importance of each channel, and a spatial attention gate assigns weights in accordance with the importance of each pixel position for the entire channel. In csAG-HRNet, csAG modules consisting of a channel attention gate and a spatial attention gate were applied to each subnetwork of stage and fusion modules in the HRNet-v2 network. In experiments using two datasets, it was confirmed that csAG-HRNet could minimize false detections based on the shapes of large buildings and small nonbuilding objects compared to existing deep learning models.
1. Introduction
Building extraction has been studied for a long time as a major topic in the utilization of high-resolution images. Building information from high-resolution aerial images is used for urban policy planning, regional management, and disaster analysis [1]. In recent years, many deep learning networks have been studied along with improvements in graphics processing unit (GPU) performance and the emergence of a large number of public datasets for training deep learning models. With the development of the fully convolutional network (FCN) architecture, deep learning algorithms have been adopted for various applications in the computer vision field, such as medical care, autonomous driving, remote sensing, and security. In particular, in the field of remote sensing, applications such as object detection, cloud detection, pansharpening, change detection, superresolution, land cover classification, and feature extraction are being studied [2,3,4,5,6,7]. Image segmentation extracts meaningful information from an image pixel by pixel, and image segmentation capabilities have been confirmed using various deep learning architectures, such as FCN [8], SegNet [9], and U-Net [10]. Building on this, many related studies are being conducted. An FCN-based model that can restore the original resolution of an input image can be obtained by replacing the fully connected layer in the existing network with an upsampling layer. SegNet uses 13 layers of VGG-16 [11] as an encoder network and uses an upsampling architecture such as FCN as a decoder network with additional pooling indices. U-Net consists of a contracting path to obtain context using convolutional and pooling layers and an expanding path for accurate localization of features. In addition, it uses the concept of skip connections [12] to concatenate the feature maps of deep layers with those of shallow layers. DeepLab-v3+ [13] was proposed based on the use of atrous separable convolution, which is a combination of depthwise separable convolution and atrous convolution. A fully convolutional densely connected convolutional network (FC-DenseNet) has been applied for segmentation based on the DenseNet [14] structure, using the entire feature map from the previous layer [15].
Recently, various deep learning architectures based on the addition of self-attention gates have been proposed to improve the performance of networks on computer vision tasks such as classification, object detection, and segmentation [16,17,18]. Wang et al. [16] proposed a residual attention network for obtaining attention-aware features by stacking the proposed network in multiple layers. Lim et al. [17] proposed object detection algorithms with an attention mechanism to focus on the objects in an image while including contextual information from the target layer. Fu et al. [18] proposed a dual attention network (DANet) by appending two types of attention modules corresponding to the spatial and channel dimensions on top of a dilated FCN.
The traditional method for extracting buildings in image processing is to apply spatial and texture filters in order to directly extract various features, such as color [19], texture [20], shape [21], edge [22], and shadow [23] features. However, the accuracy of traditional image processing depends on the image quality and characteristics, such as the level of illumination, the shapes of buildings, and textures. In recent years, various building extraction techniques using deep learning have been studied. In DR-Net, a densely connected convolutional neural network (DCNN) and a ResNet structure based on a DeepLab-v3+ network are combined to mix features with high spatial resolution in the decoder module to compensate for the loss of detailed regional information of building boundaries due to the stride of the convolution operation [24]. Wagner et al. [25] proposed the U-Net-Id structure, which includes three parallel paths corresponding to three adjacent networks with individual U-Net structures by using three labeled masks consisting of a building mask, a border mask, and an inner segmentation mask. Ma et al. [26] developed a global and multiscale encoder-decoder network to learn global and regional features for explaining the shapes of buildings and learning multisize information. Guo et al. [27] proposed a multiloss neural network based on U-Net to improve the model sensitivity by means of an attention block and suppressing the background influence of irrelevant feature areas. In addition, this model was trained with multiple losses, including a cross-entropy loss, a Dice loss, a pixel-based loss and a Jaccard loss. Shao et al. [28] proposed BRRNet, consisting of a prediction module and a residual refinement module. The prediction module, based on an encoder–decoder structure, uses an atrous convolution block to extract more global features by increasing the receptive field during feature extraction. For the residual refinement module, the output of the prediction module is used as an input to improve the accuracy of building boundaries. Zhang et al. [29] proposed an improved boundary-aware perceptual (BP) loss, which consists of a loss network and transfer loss functions. Yi et al. [30] proposed DeepResUnet by changing the convolutional layers of the U-Net architecture to ResBlocks with skip connections, thereby adopting the deep residual learning approach to facilitate training in order to alleviate the degradation problem that often occurs in the model training process. Liu et al. [31] proposed De-Net, which consists of four modules, namely, an inception-style downsampling module, an encoding module comprising six linear residual blocks with a scaled exponential linear unit (SELU) activation function, a compression module to reduce the number of feature channels, and a dense upsampling module that enables the network to encode spatial information within the feature maps. Wang et al. [32] proposed an efficient nonlocal residual U-shaped network (ENRU-Net) to overcome the limitation on the performance improvement of building extraction due to a lack of global contextual information and careless upsampling. Li et al. [33] confirmed the possibility of building extraction using the SpaceNet building datasets and geographic information system (GIS) data through modifications to U-Net. Zhang et al. [34] improved mask R-CNN through the fusion of a CNN with an edge detection algorithm. Through the CNN, approximate location and pixel classification are conducted, and then, semantic segmentation is performed using the Sobel edge detection algorithm. Since many deep learning models focus on increasing accuracy by means of an excessive number of parameters and complex structural design, they incur large computational costs and run at low speeds. To solve these problems, various CNN-based architectures have been proposed. Liu et al. [35] proposed ARC-Net, including residual blocks with asymmetric convolution (RBACs), to reduce the computational cost and the model size. In addition, Jin et al. [36] studied a boundary-aware refined network consisting of a gated-attention refined fusion unit, a denser atrous spatial pyramid pooling module, and a boundary-aware loss to address the challenge of unstable multisize sets due to insufficient combinations of multisize features and a lack of segmentation boundaries. Wu et al. [37] proposed an improved anchor-free instance segmentation method based on a center mask with spatial and channel attention-guided mechanisms. Yang et al. [38] proposed a dense-attention network (DAN) by using a lightweight DenseNet and a spatial attention fusion module. This network effectively exploits high-level feature information to suppress low-level features and noise. Ye et al. [39] showed that the direct reuse of features through skip connections without processing can cause performance degradation, and to solve this problem, RFU-Net with attention-based reweighting was proposed. Deng et al. [40] proposed a model for progressively and effectively extracting and restoring features by combining a stable encoder–decoder architecture with a grid-based attention gate and an atrous pyramid pooling module. He et al. [41] introduced spatial variation fusion (SVF) to establish interactions between the two tasks of building extraction and boundary detection and strengthen the network by adopting a convolutional block attention module (CBAM) during training on these two tasks simultaneously. Moreover, research using generative adversarial networks (GANs) has also been developed. Sun et al. [42] proposed two adversarial networks that individually generate background and target information to reduce the differences between classes in order to maintain generality. Abdollahi et al. [43] improved model performance in the presence of complex backgrounds and barriers through adversarial training methods using bidirectional convolutional long short-term memory (BiConvLSTM) and SegNet models.
In state-of-the-art deep learning architectures for building extraction, various convolutional layers have been used to optimize the model performance and extraction accuracy. However, since the same objects with various shapes, textures, and sizes exist in high-resolution satellite images, an optimized deep learning model that can be effectively applied to the remote sensing field is needed. For example, some large buildings and building roofs have colors similar to those of impervious areas, such as roads and asphalt. In addition, during the training process, buildings larger than the image patch size may not be detected properly. To solve these problems, we attempted to improve the model performance by adding attention gates to HRNet-v2, which was a representative semantic segmentation technique. By adding channel-spatial attention gate (csAG) modules to individual stages and modules of HRNet-v2, the detection accuracy for complex buildings and large buildings with characteristics similar to those of surrounding areas was increased. This manuscript is organized as follows: The proposed methodology is described in Section 2. Section 3 presents the datasets used to train and test the deep learning network, the experimental evaluation metrics, and the experimental results. Finally, Section 4 presents a discussion of the proposed model, and Section 5 presents a summary and conclusion.
2. Methodology
In this study, we modified the HRNet-v2 model by using csAG modules to improve the accuracy of building extraction in very high resolution (VHR) imagery. Through the addition of csAG modules in accordance with the network structure, the information of each feature map was consolidated.
2.1. HRNet-v2
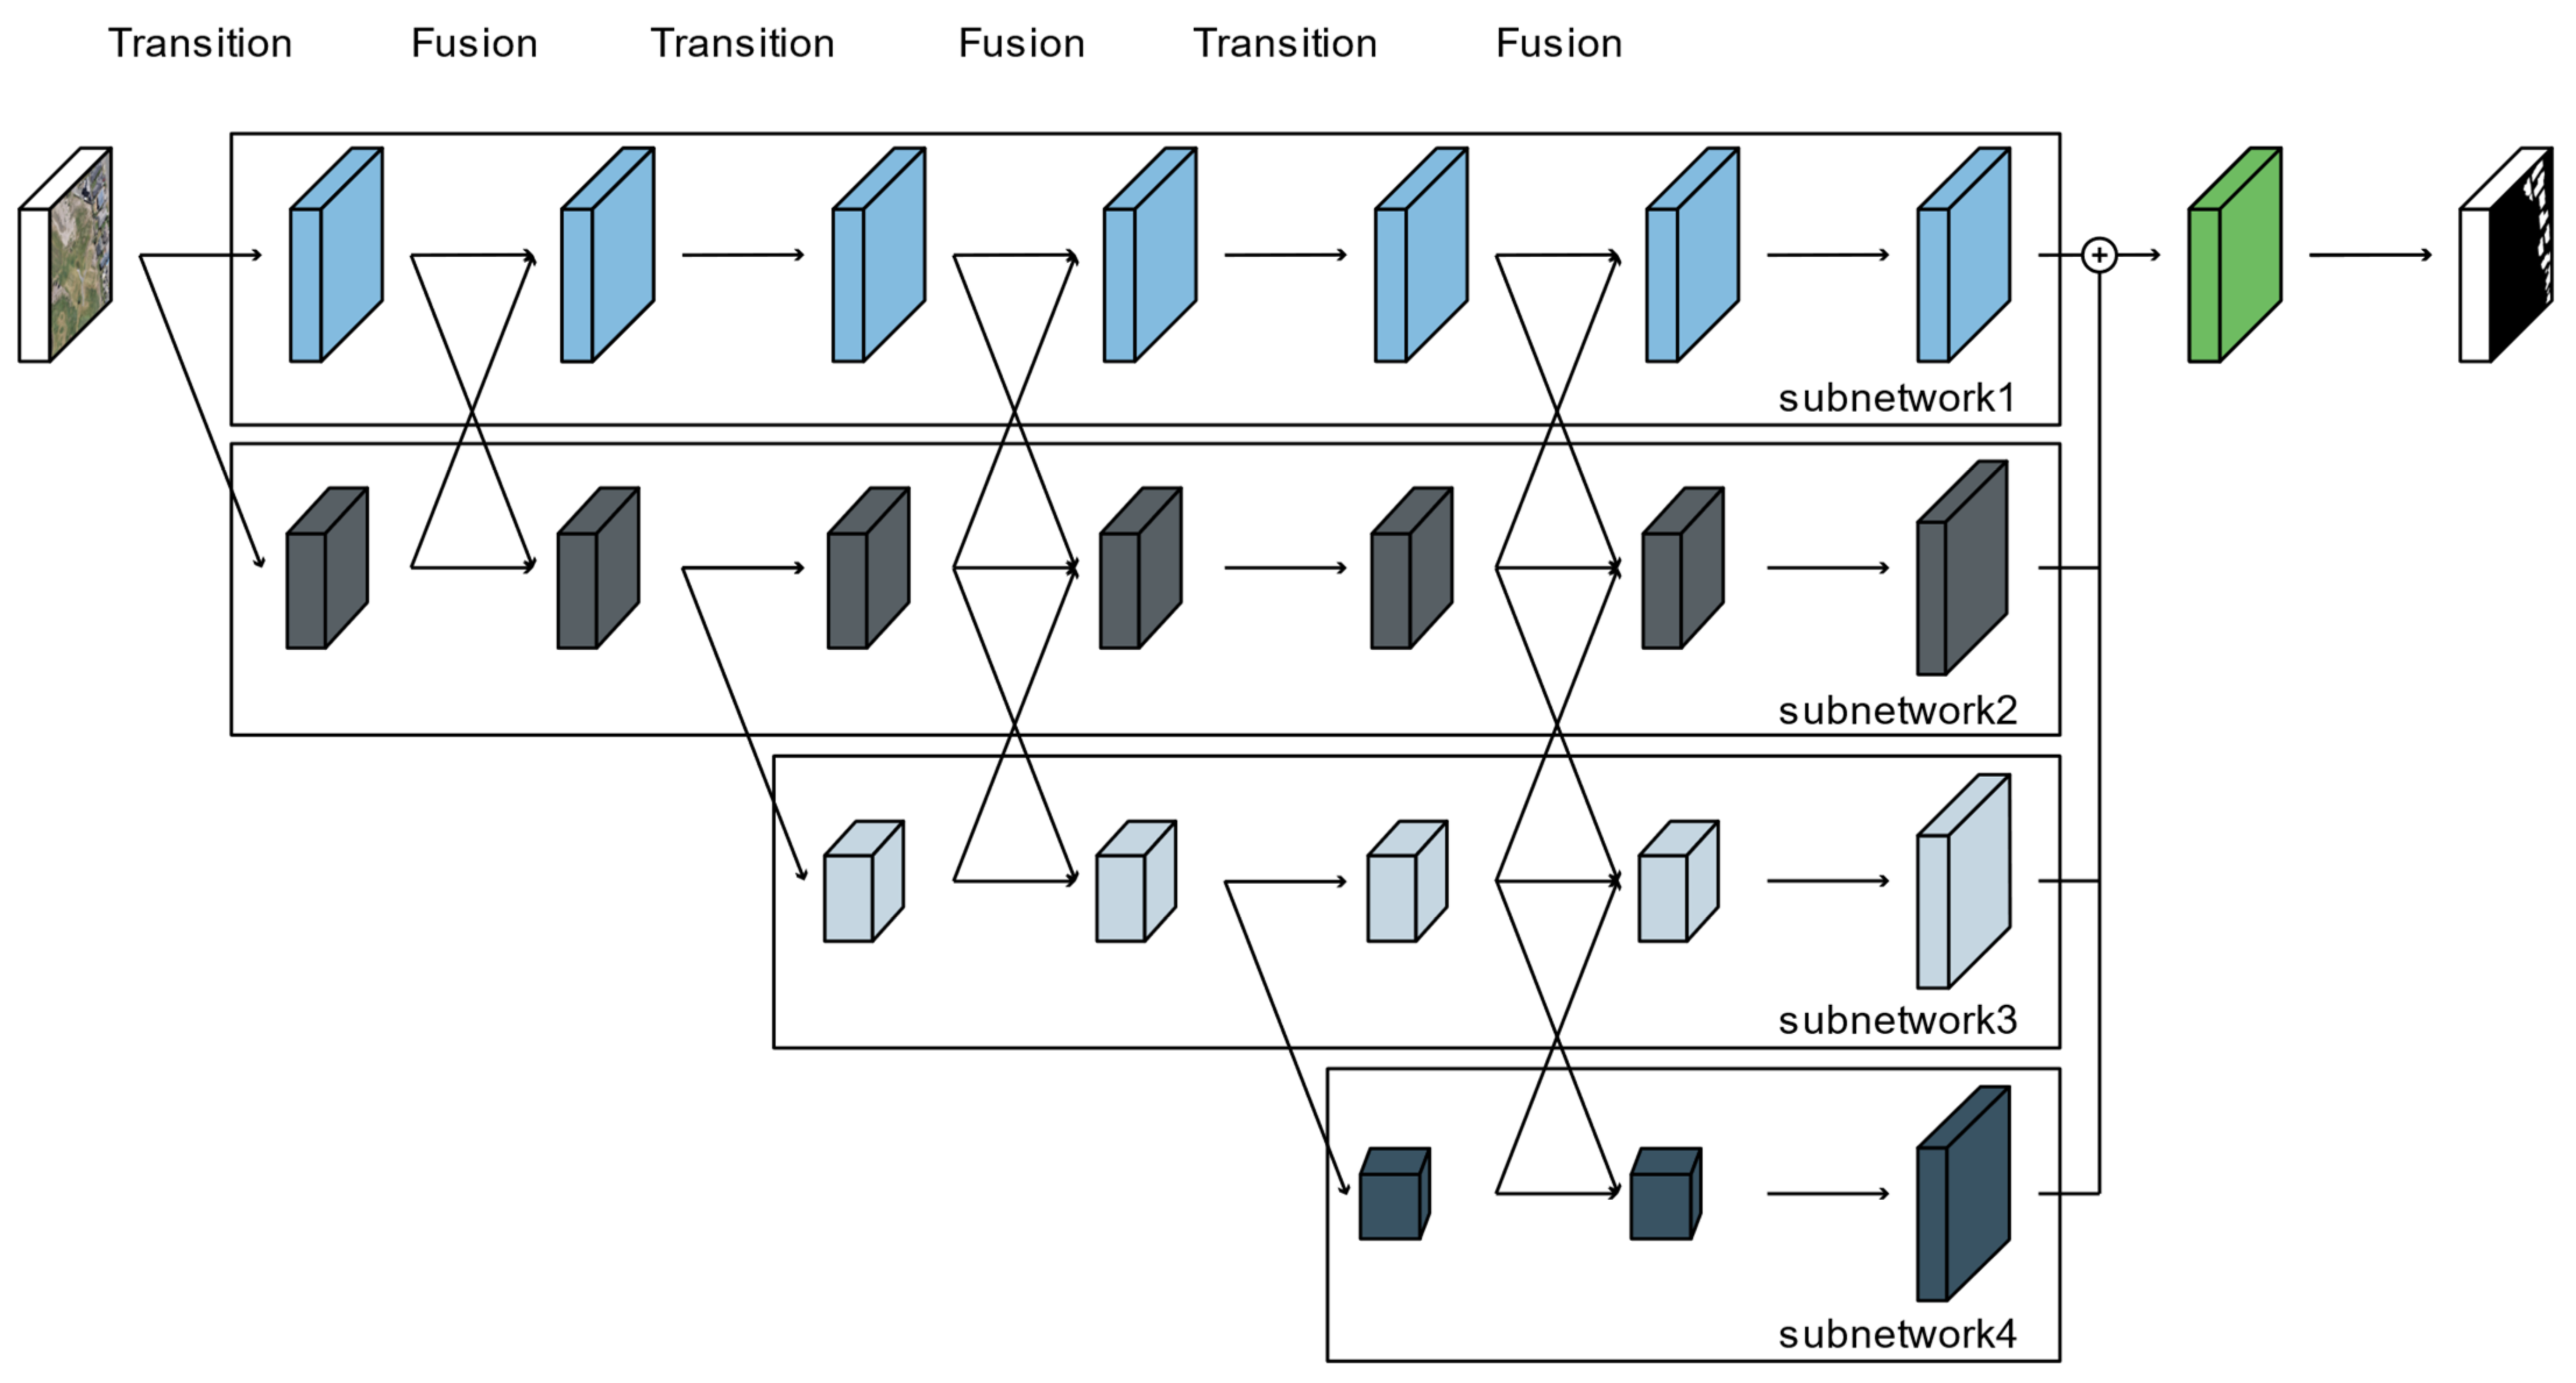
The HRNet-v2 model was developed to estimate human poses in high-resolution images [44]. Most deep learning networks for semantic segmentation include a process of spatial downsampling for the extraction of features from an image, followed by a restoration process to recover the original spatial resolution [9,10,11,12,13,14,15]. In contrast, HRNet-v2 consists of subnetworks based on images decomposed into multiple spatial resolutions in parallel, and the feature maps are constructed by repeatedly using modules to fuse the outputs of the subnetworks [44,45]. As shown in Figure 1, HRNet-v2 is composed of transition and fusion modules based on subnetworks formed of residual blocks. In the transition process, to learn and extract more comprehensive features, a subnetwork in which the number of channels is doubled but the resolution of the feature map is halved is added on the basis of the subnetwork with the smallest spatial resolution. In each subnetwork, a ResNet structure composed of a 3 × 3 convolutional layer, batch normalization, rectified linear unit (ReLU) activation, and a skip connection is applied. A fusion module is then applied to exchange the information among the multiresolution layers generated by the transition module. The features of each subnetwork are fused by adjusting the spatial resolution and the number of channels to those of the standard subnetwork [44]. Finally, the multiresolution layers of the final fusion module are concatenated, and then the output is determined by a convolutional layer.
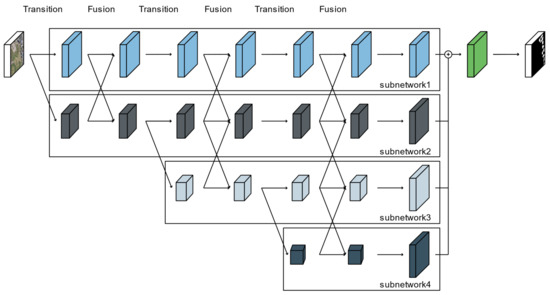
Figure 1.
Architecture of the HRNet-v2 model.
2.2. csAG Module
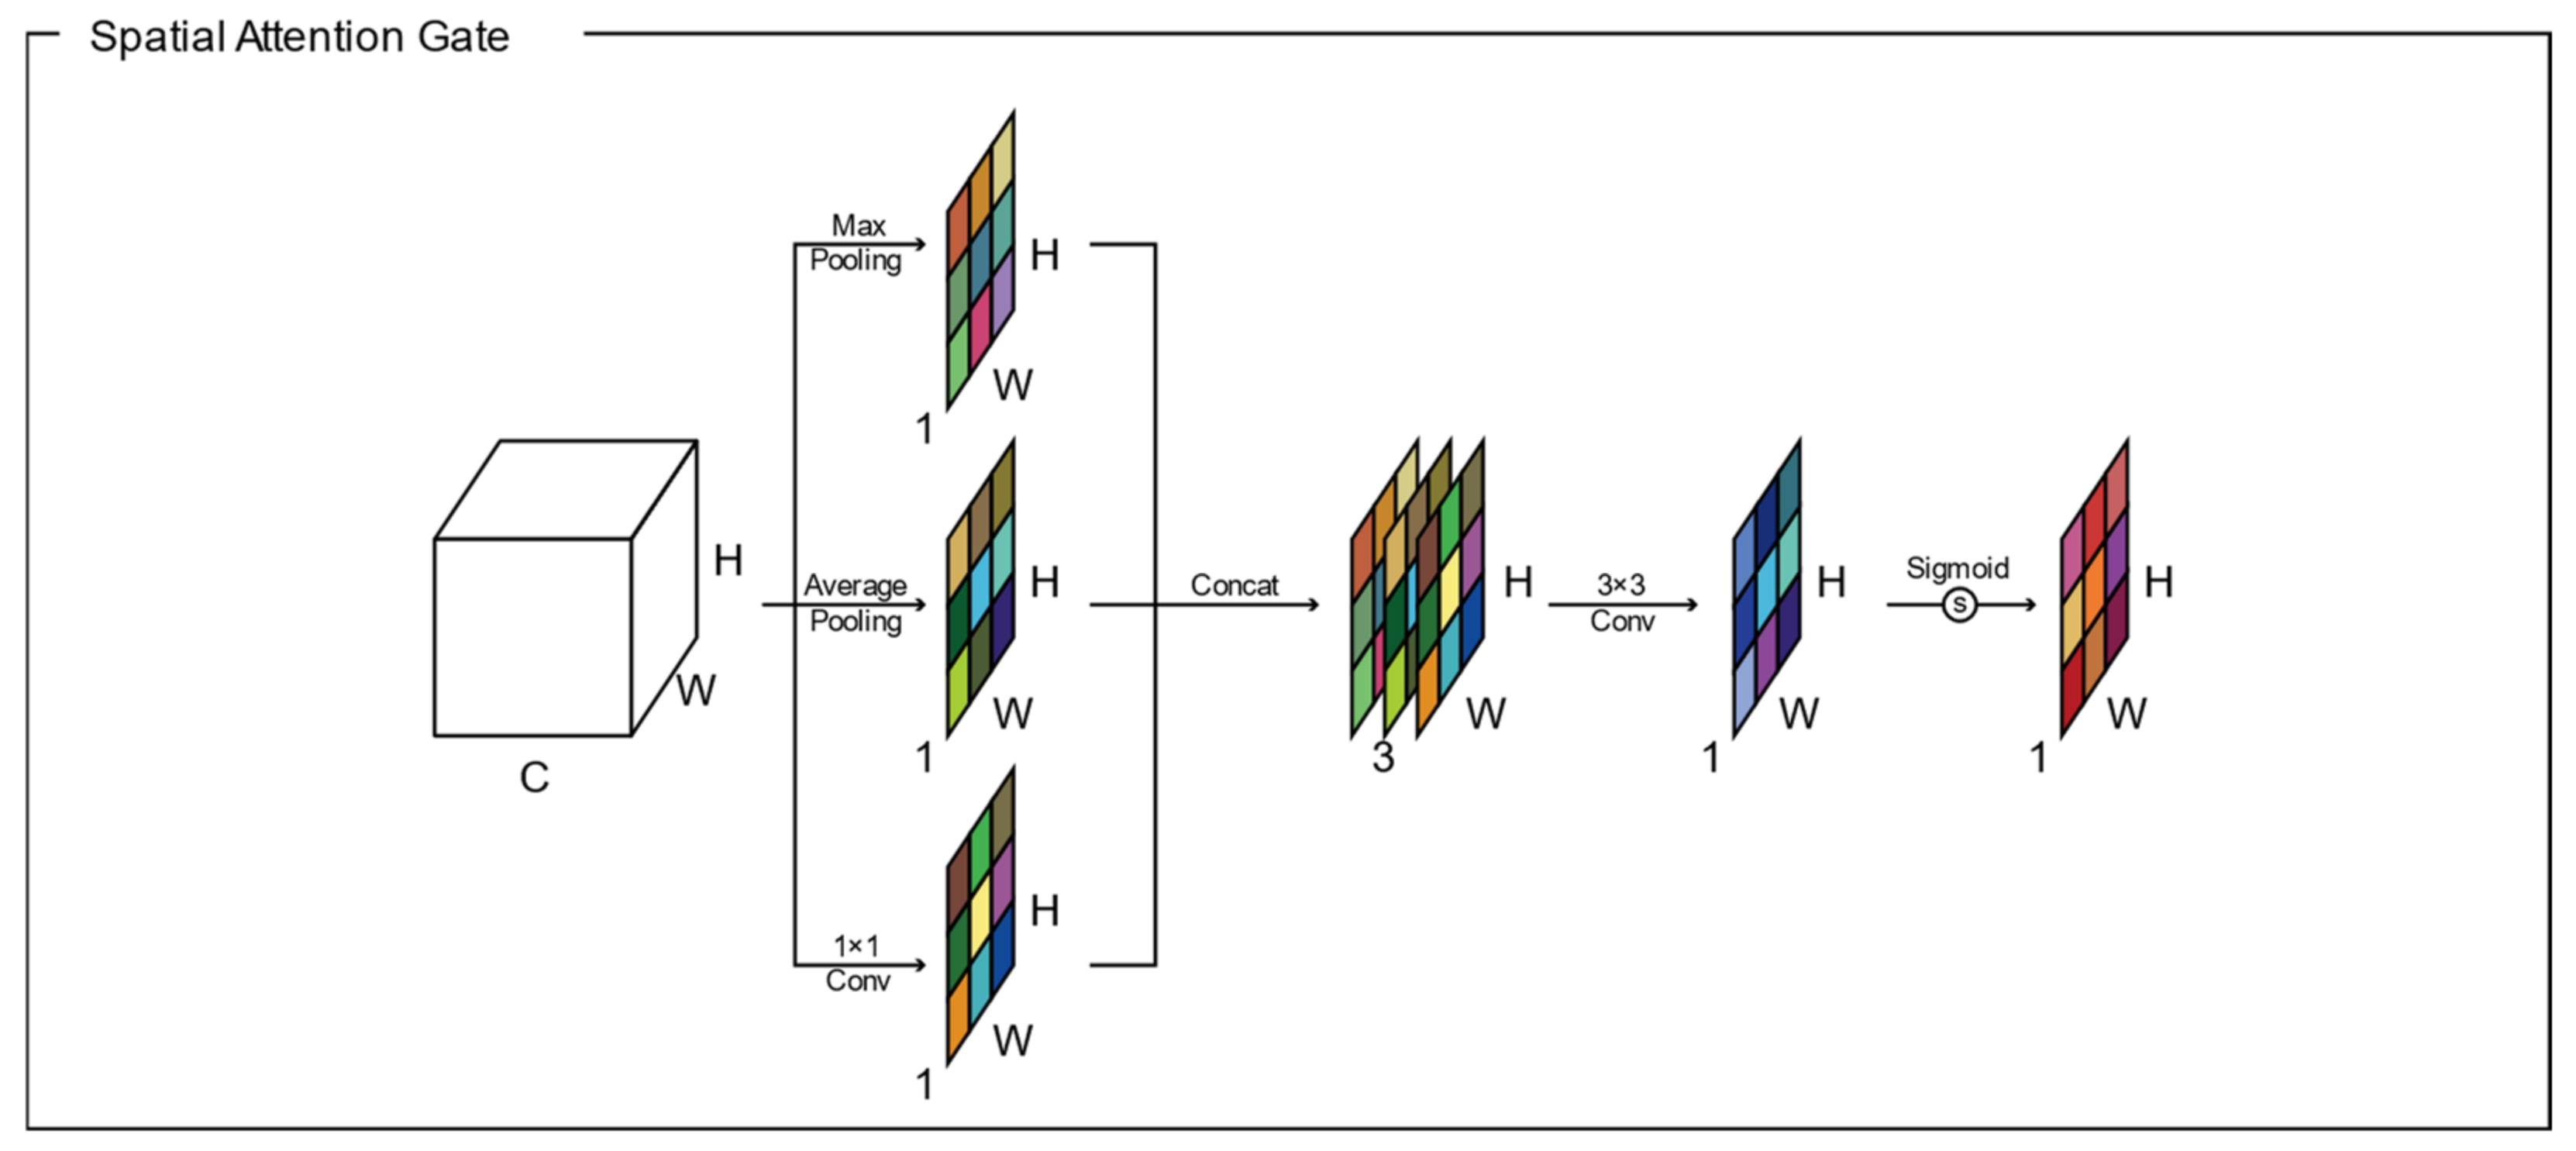
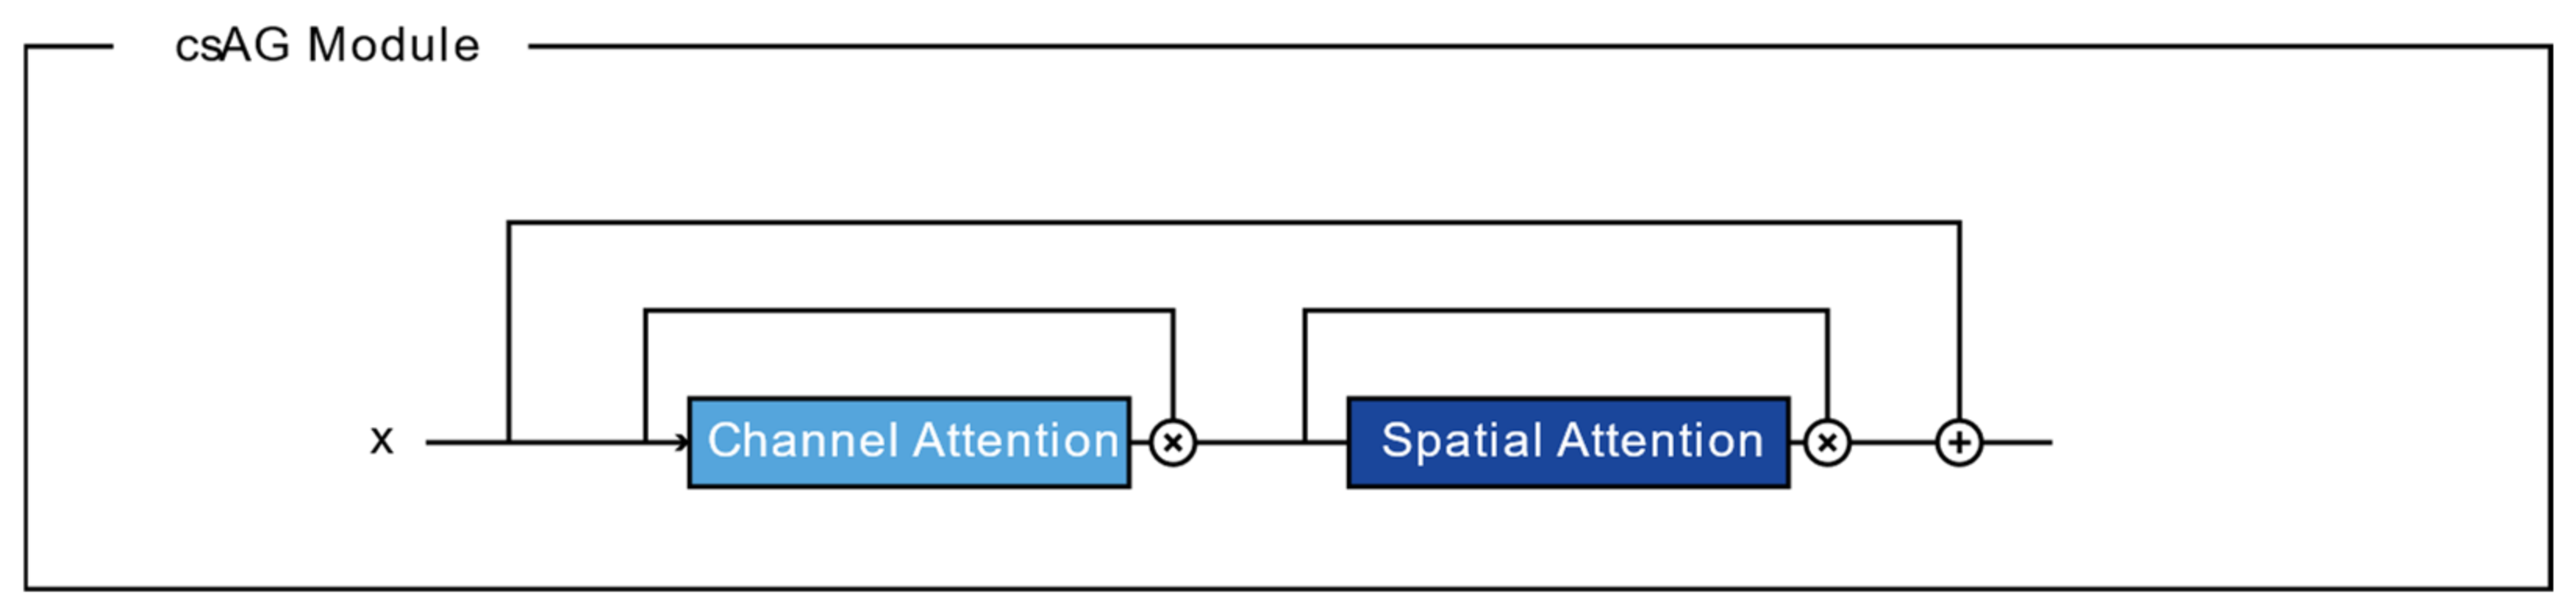
The structure of the csAG module is composed of a channel attention gate and a spatial attention gate. Generally, attention gates generate a context vector that assigns weights to the input data. Therefore, they highlight the features of interest and suppresses irrelevant areas [11]. A channel attention gate selects a representative value for each channel using global pooling and dense layers. In this manuscript, we modify the channel attention gate proposed by Khanh et al. [46]. Figure 2 presents the structure of the channel attention gate used in our algorithm. Through global max pooling and average pooling layers, input with dimensions of is reshaped to feature maps with dimensions of to aggregate the spatial information of the input. The average-pooled and max-pooled features are condensed by a multilayer perceptron based on a reduction ratio , and then each feature map is merged using elementwise summation. Finally, the feature map of the channel attention gate is determined using a multilayer perceptron and the sigmoid function. Each value of the channel attention-gated layer represents the weight of a channel for feature extraction. Meanwhile, a spatial attention gate selects representative values for all channels located in the corresponding pixel. As shown in Figure 3, through the concatenation of feature maps from two pixelwise pooling and convolutional layers, input with dimensions of is reshaped to a feature map with dimensions of to highlight the information-containing regions in the feature map. The final output of the spatial attention-gated layer is generated by a convolutional layer and the sigmoid function. The csAG module focuses on highlighting the channels and locations of the important information in the feature map. The csAG module is constructed with a sequential arrangement, as shown in Figure 4. In particular, the csAG module uses a residual structure, and the values from the channel and spatial attention gates are applied to the feature map through elementwise multiplication.
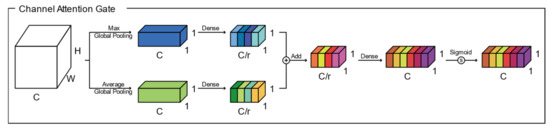
Figure 2.
Channel attention gate.
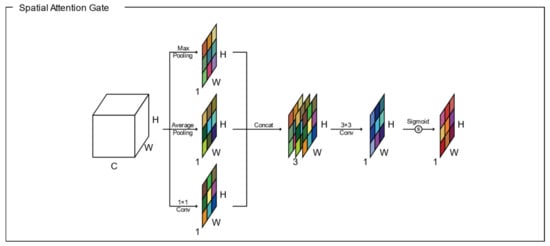
Figure 3.
Spatial attention gate.

Figure 4.
Structure of the csAG module.
2.3. csAG-HRNet
HRNet-v2 learns features through the fusion of parallel subnetworks with multiple resolutions. However, in HRNet-v2, inaccurate data might be added or important features might be lost when a subnetwork of a low resolution is fused with a subnetwork of a high resolution. To solve this problem, the csAG module is inserted into the HRNet-v2 network in two ways. The csAG module is used to extract the most important features during the learning process. As shown in Figure 5, the proposed csAG-HRNet model has a structure similar to that of HRNet-v2. However, we insert the csAG module into the basic block of HRNET-v2, the subnetworks of multiple resolutions in the fusion process, and the convolutional layer for the concatenation of the multiresolution subnetworks.
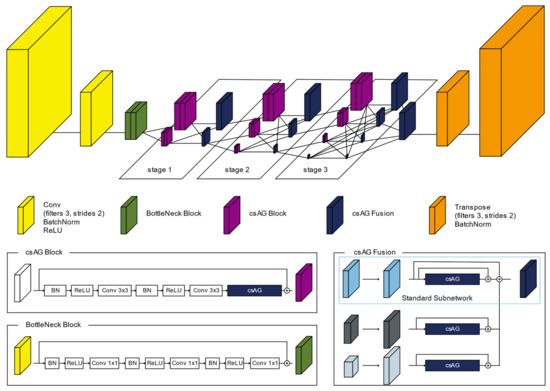
Figure 5.
Architecture of the csAG-HRNet model.
First, to reduce the overall network size, a convolutional layer of stride 2 is repeated twice to reduce the spatial resolution to one quarter that of the input image. Then, features are extracted using a bottleneck block. Bottleneck block uses a 1 × 1 convolution layer to use more layers with lower computing resources. In addition, more activation functions were included in the bottleneck block in order to apply more nonlinearities to learn features [47]. Subnetworks corresponding to each stage are created through a transition module, and features are extracted in each subnetwork through a csAG block. In the csAG block, after a set consisting of batch normalization, ReLU, and convolutional layers is repeated twice, the csAG module is applied. The feature map output by the csAG module is added to the input features, which are passed through by a skip connection. By applying the csAG module, more important information is effectively learned and extracted. This block structure is applied twice in each subnetwork for each stage. After feature extraction in each subnetwork through the csAG block, the information from each subnetwork is fused using the csAG fusion structure. The spatial resolution and number of channels of the feature map of each subnetwork are adjusted in accordance with the spatial resolution and number of channels corresponding to the standard subnetwork for the fusion process. In the case of a feature map with a smaller resolution relative to the multiresolution feature maps created in the transition module, the number of channels is adjusted using a convolutional layer, and the spatial resolution is adjusted using an upsampling layer. In contrast, for a feature map with a relatively high resolution in the transition module, the number of channels and the spatial resolution are adjusted by a convolutional layer of stride 2. Then, the csAG module is applied to the adjusted feature map from each subnetwork. To fuse the multiresolution feature maps, each feature map from the csAG module is added to all the others. After all three stages, including the stage and fusion modules based on the csAG module, all features are collected using a single csAG fusion process. In this final csAG fusion process, each feature map output by the csAG module is integrated and then a transpose layer of stride 2 is repeated twice to restore the spatial resolution of the input image.
3. Experiments and Results
3.1. Datasets and Settings
3.1.1. South Korea Building Dataset Including Orthophoto and Vector Data
We constructed the training and test datasets using the national geospatial data provided by the National Geographic Information Institute (NGII) of South Korea. First, vector data including each building boundary polygon at a scale of 1:5000 and orthophotos of three bands (RGB) with a 0.25 m spatial resolution and 8-bit radiometric resolution were used to generate the training and test datasets. The regions covered by the dataset are located in Ansan and Siheung, Korea, where houses, apartments, and factories all exist. The middle part of the image of site 1, consisting of 9122 × 8892 pixels, was used as the training dataset, as shown in Figure 6. Testing was conducted using the parts of the image above and below the training data, consisting of 9122 × 1000 pixels, and the orthophoto of site 2, consisting of 8890 × 11,126 pixels. For the ground-truth data for testing, the building layer of the digital topographic map provided by the NGII was used. We generated 5712 training patches and 1428 validation patches of 512 × 512 pixels in size.
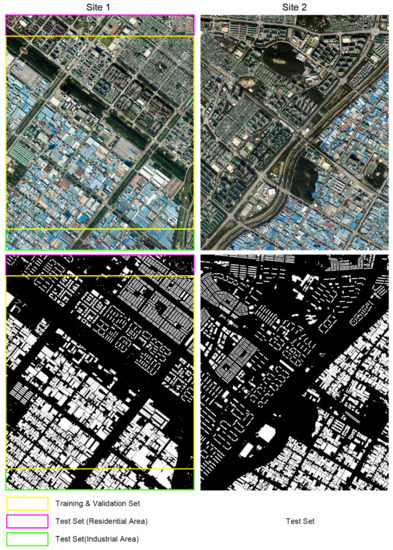
Figure 6.
Aerial images from Ansan and Siheung, South Korea.
3.1.2. WHU Building Dataset
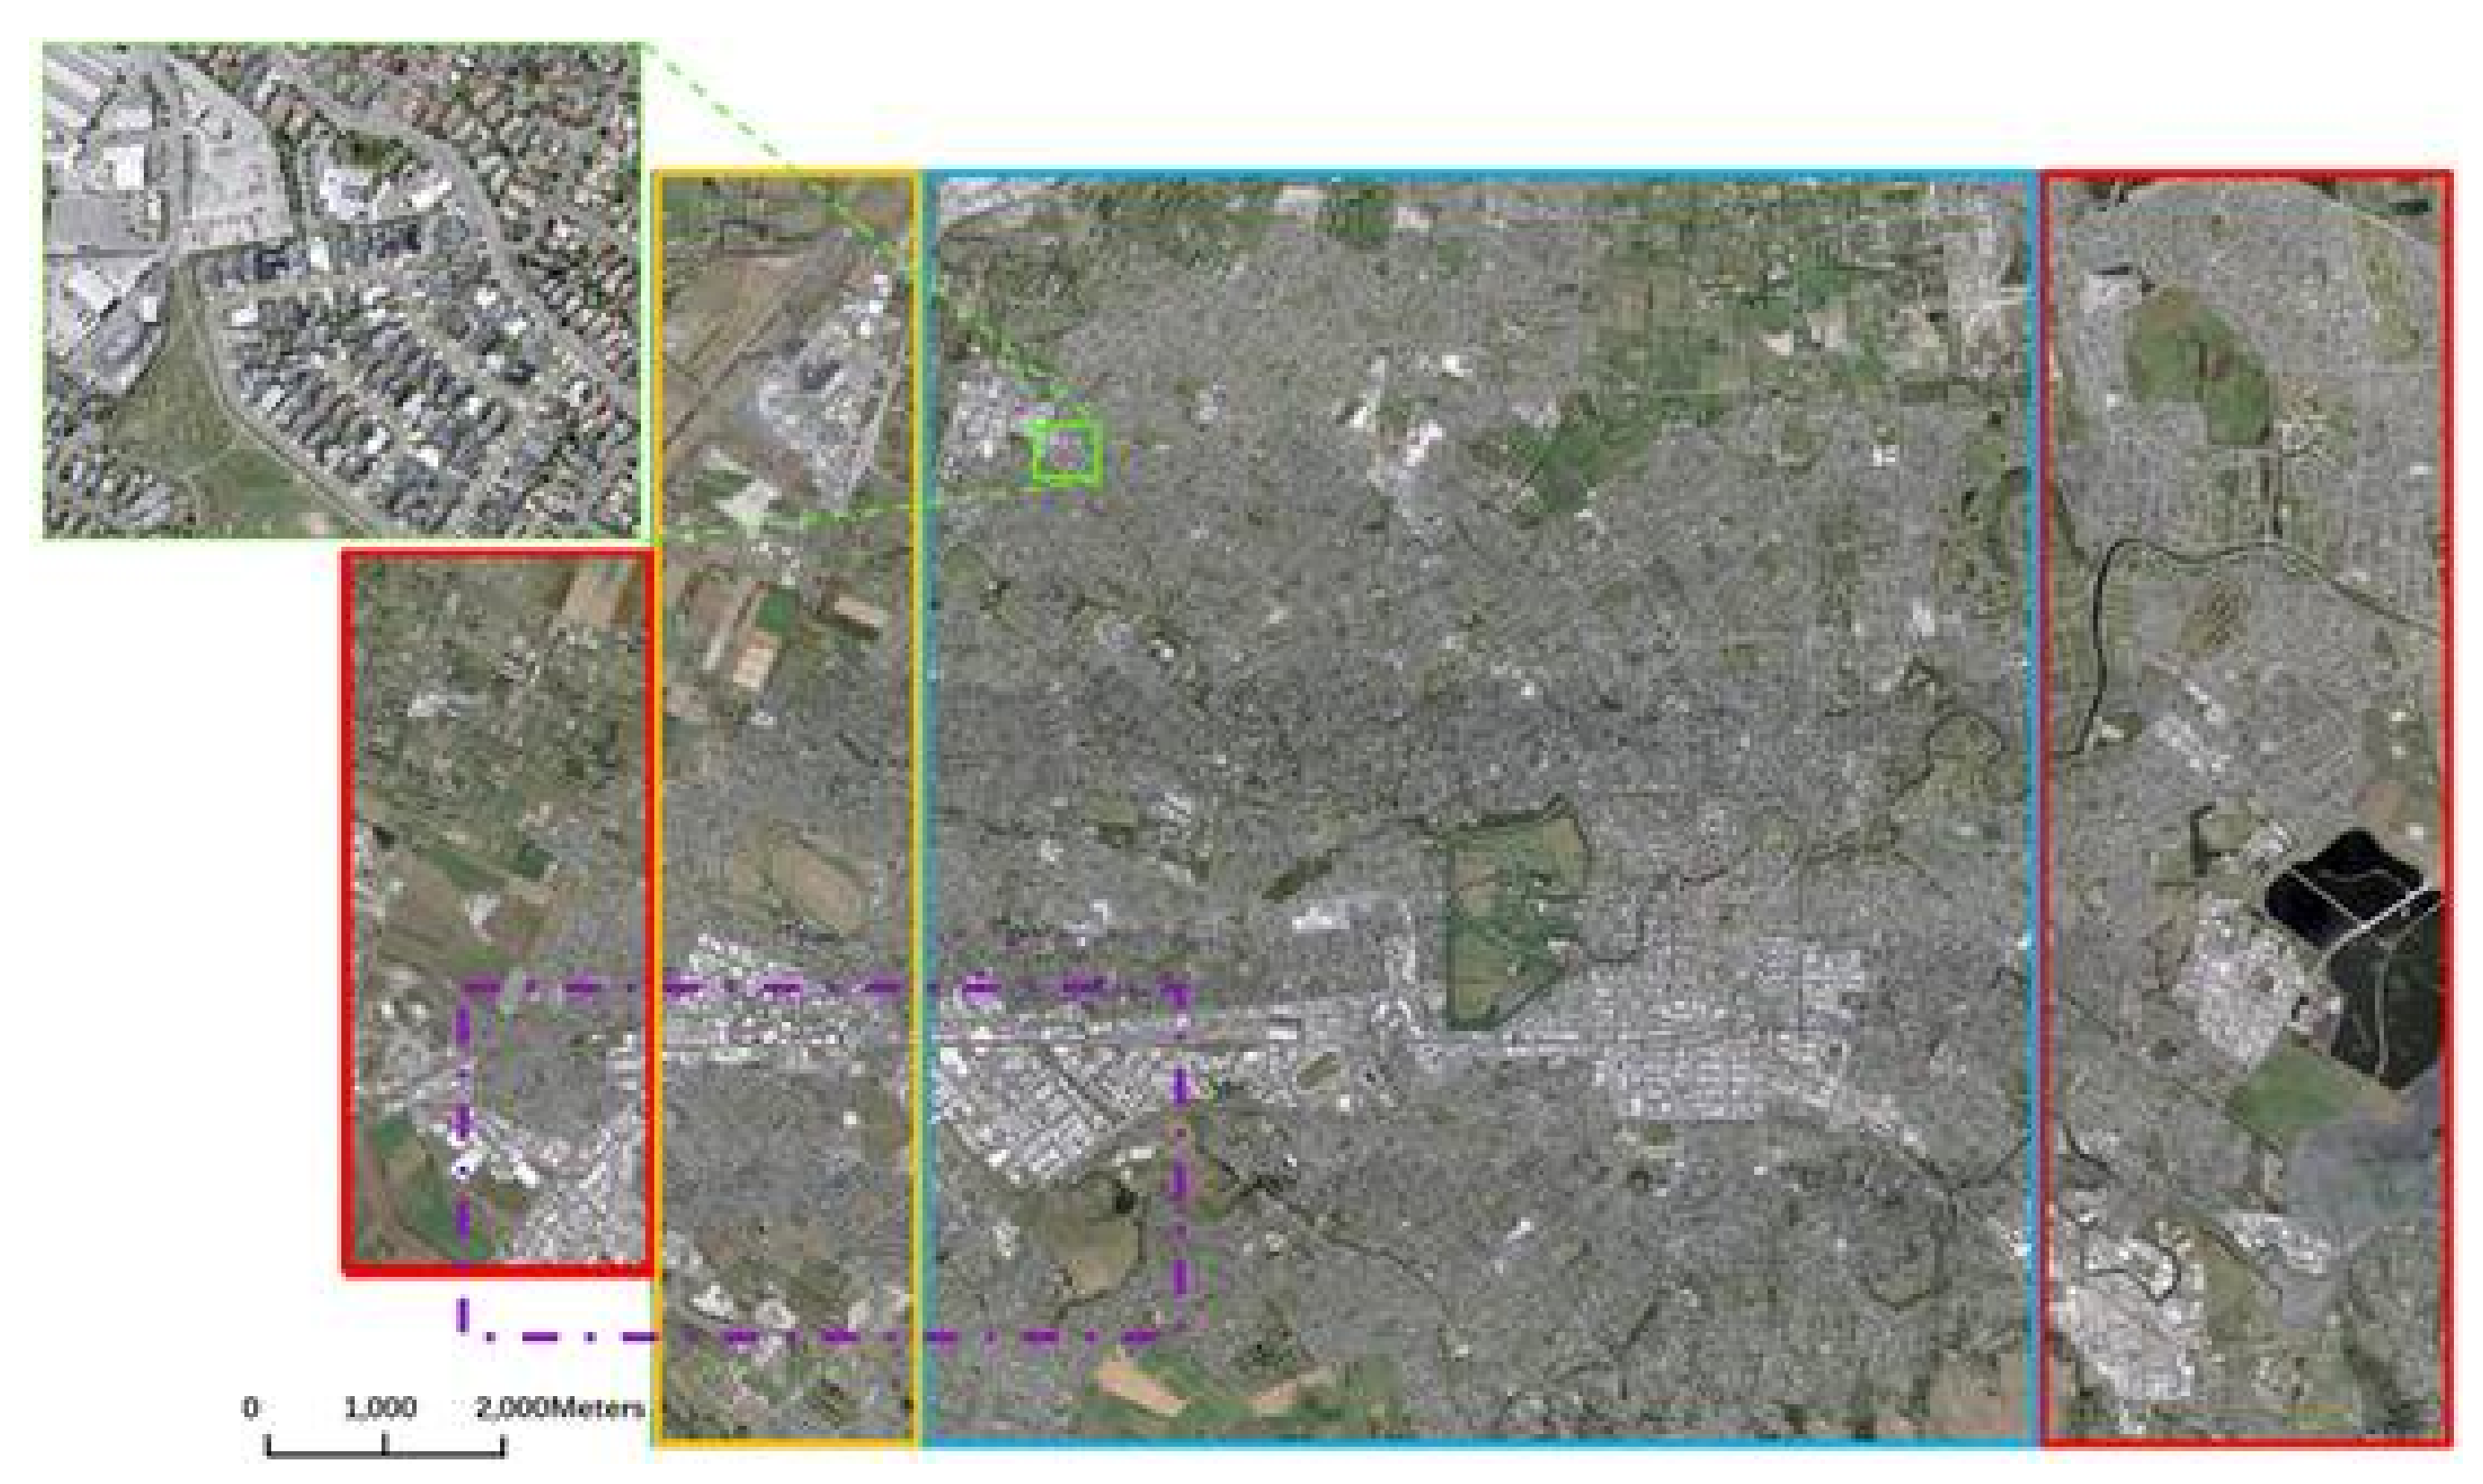
The WHU building dataset is composed of polygon data corresponding to individual building boundaries and aerial images (RGB bands) with a 0.3 m spatial resolution and 8-bit radiometric resolution collected by Land Information New Zealand (LINZ) [48]. It consists of more than 220,000 buildings extracted from aerial images with a 0.075 m spatial resolution covering a 450 km2 area in Christchurch, New Zealand [48]. The dataset is downsampled to a 0.3 m spatial resolution. It provides a total of 8189 patches of 512 × 512 pixels in size and consists of a training set of 4736 patches with 130,500 buildings, a validation set of 1036 patches with 14,500 buildings, and a test set of 2416 patches with 42,000 buildings, as shown in Figure 7. The ground-truth data were constructed through manual editing of Christchurch’s building vector data.
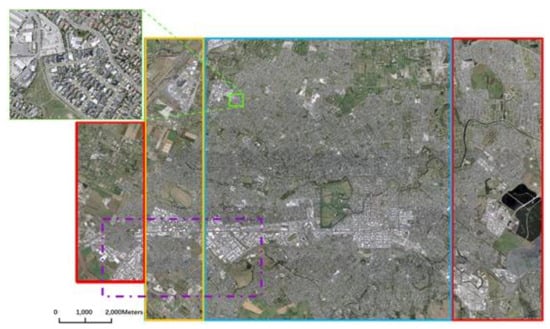
Figure 7.
WHU dataset (blue box: training area, green box: validation area, red boxes: test areas).
3.1.3. Experimental Settings
In this study, the proposed deep learning model was implemented in TensorFlow (version 2.2.0) on an NVIDIA RTX Titan GPU × 2 platform. During training, the Adam optimizer with a 0.001 learning rate was used. In addition, a binary cross-entropy function was used as the loss function for training. The batch size was set to 30 for images with dimensions of 512 × 512, and training was conducted for a total of 60 epochs. We performed comparisons and evaluations using SegNet [9], U-Net [10], FC-DenseNet [15], and the original HRNet-v2 [44], which are representative deep learning networks for semantic segmentation, including building extraction applications. Trained models were applied to test datasets with 512 × 512 pixel size in the case of the WHU dataset. However, for the Korean building datasets (Site 1 and Site 2), we extracted building objects over the entire area using overlap (172 pixels) between 512 × 512 tiles.
3.2. Accuracy Assessment
3.2.1. Evaluation Metrics
To evaluate the performance of the proposed algorithm, we estimated the accuracy of the building extraction results based on the confusion matrix. The form of the confusion matrix is shown in Table 1. In the confusion matrix, the true positive (TP) entry refers to the number of positives that are predicted to be positive, the false positive (FP) entry indicates the number of negatives that are predicted to be positive, the true negative (TN) entry is the number of negatives that are predicted to be negative, and the false negative (FN) entry gives the number of positives that are predicted to be negative.

Table 1.
Confusion matrix.
Based on the confusion matrix, we adopted four evaluation metrics to measure the performance of the proposed csAG-HRNet: overall accuracy, precision, recall, and F1-score. The overall accuracy is evaluated by matching all pixels 1:1. It is difficult to determine the accuracy when the data are concentrated in one category. The overall accuracy is calculated as shown in Equation (1).
The precision is the ratio of the true positives to all positives predicted by the model. The calculation of the precision is shown in Equation (2). The recall is the proportion of true positives among the actually positive data, as shown in Equation (3). The F1-score is the harmonic average of the precision and recall, as shown in Equation (4).
3.2.2. Evaluation Results for the South Korea Building Dataset
Residential Area of Site 1
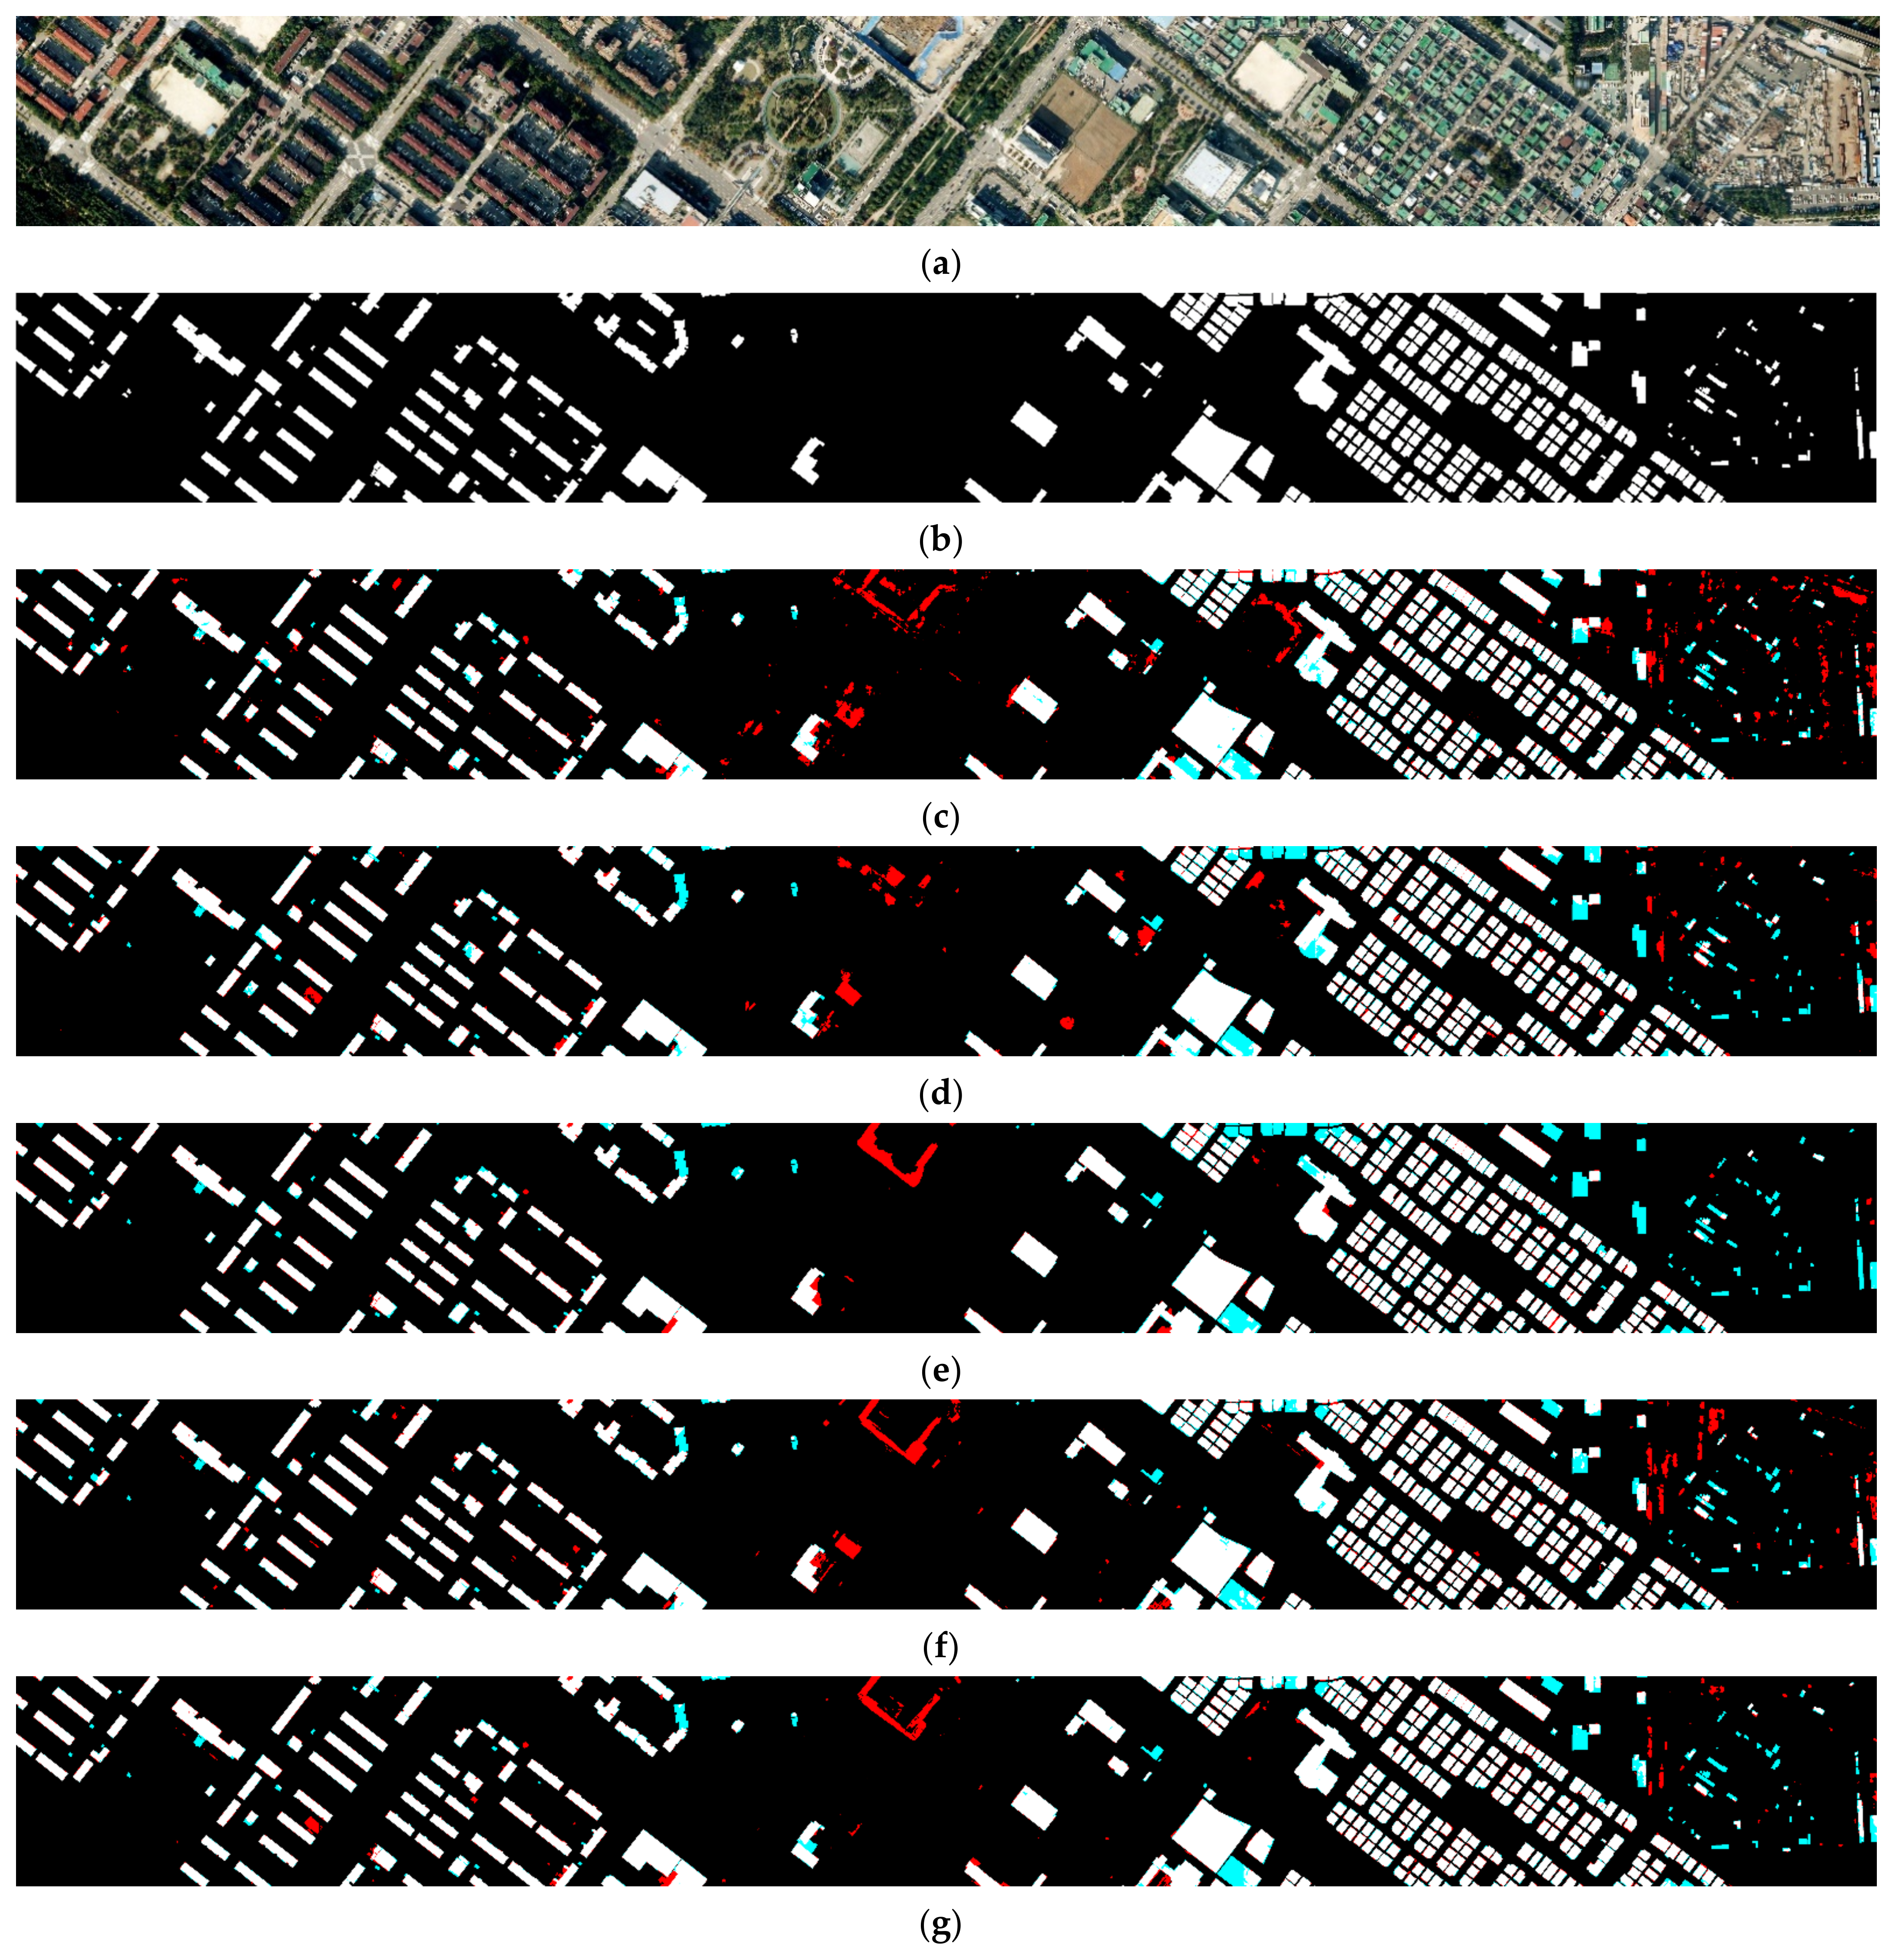
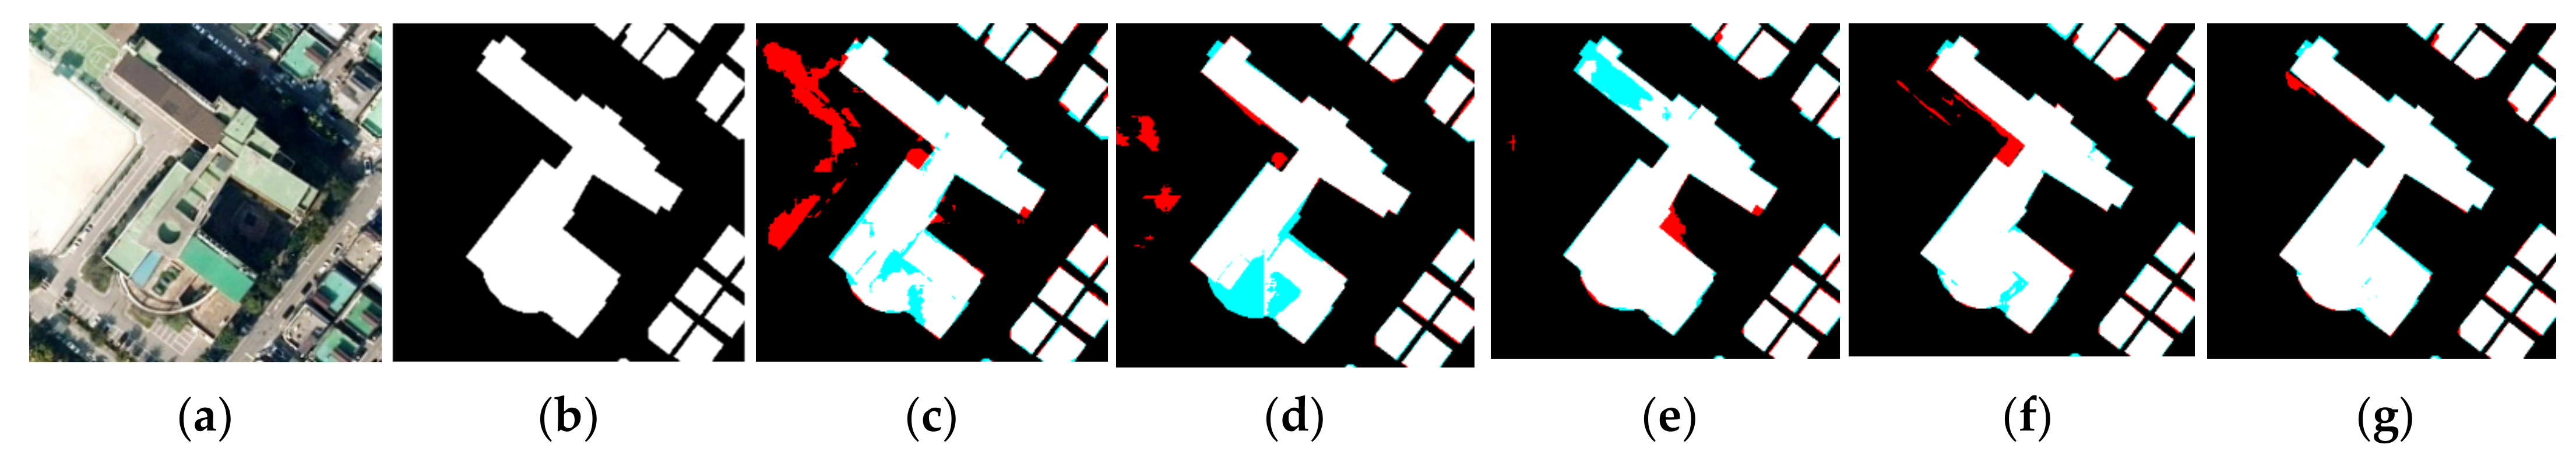
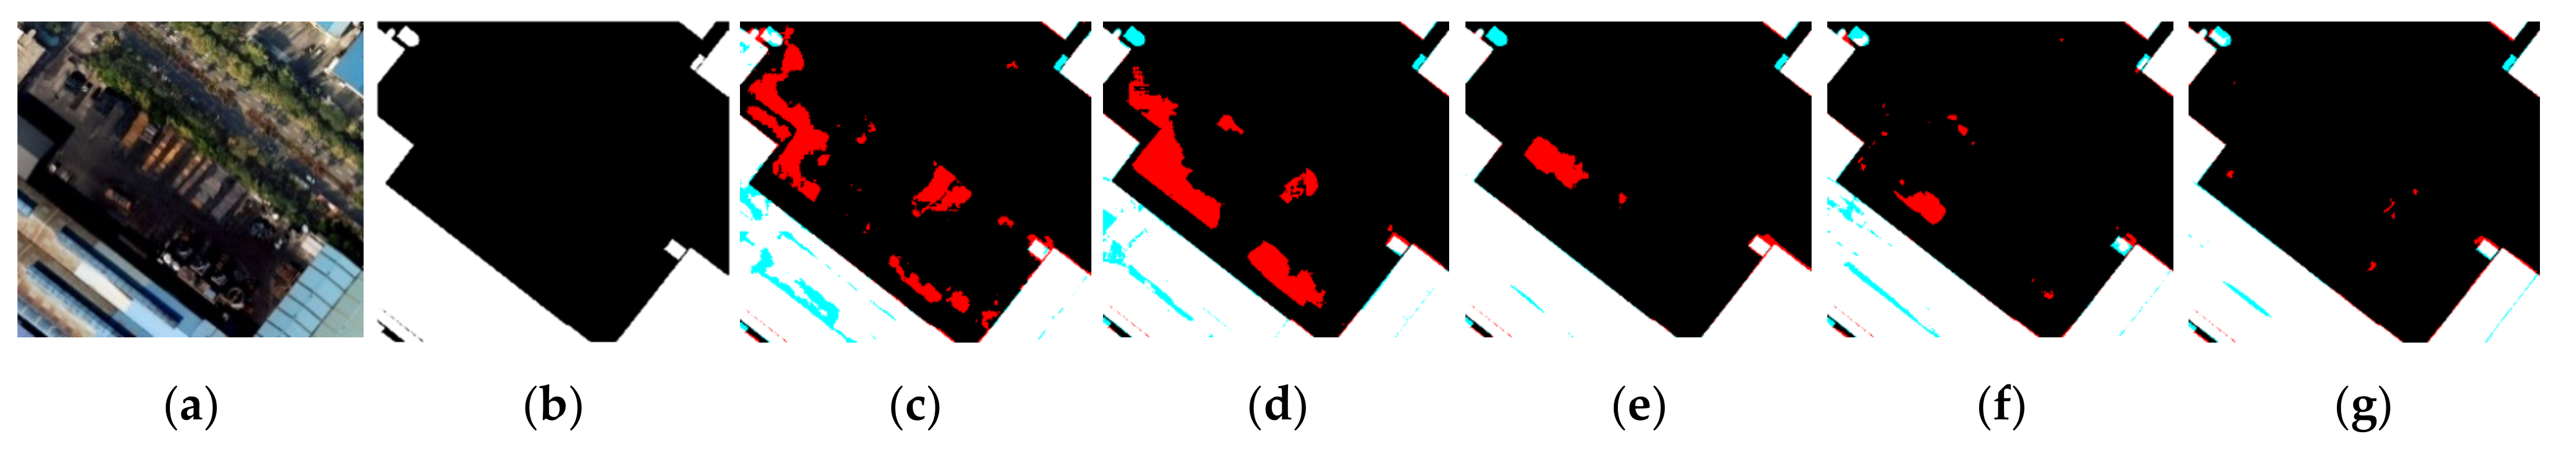
The apartments and houses area of site 1 is adjacent to the area used for the generation of the training dataset. Thus, it has characteristics similar to those of the training dataset. As shown in Figure 8c–g, some construction sites in the upper center were falsely detected as buildings. The upper right area includes many containers or small buildings, which are difficult to distinguish. However, compared to the other deep learning methods, the proposed method detected fewer nonbuilding areas, as highlighted in red. In particular, the false detection area of the proposed method was smaller than that of HRNet-v2. Figure 9 shows detailed results for the apartments and houses area of site 1. As shown in Figure 9c,d, SegNet and U-Net falsely detected pixels corresponding to the vacant lot next to a building as building pixels. Additionally, the unusual surface at the bottom of the image could not be detected as part of the building. As shown in Figure 9e, FC-DenseNet could not detect some building pixels and falsely detected shadow pixels as building pixels. HRNet-v2 also falsely detected some shadow pixels between buildings as building pixels, as shown in Figure 9f. In contrast, with the csAG-HRNet method proposed in this manuscript, false detection and non-detection were less common than with the other deep learning networks.
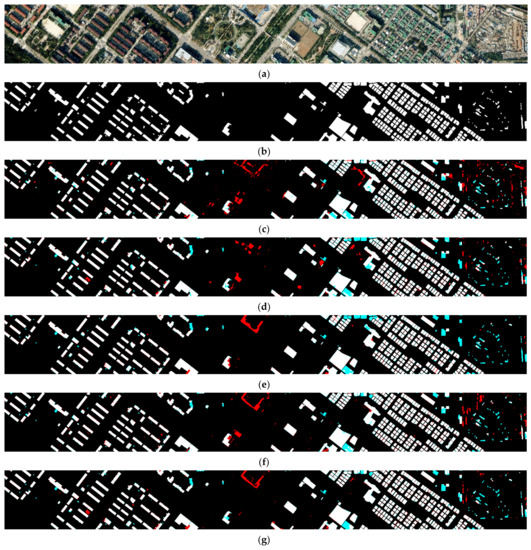
Figure 8.
Building extraction results for site 1 (residential area) according to each deep learning model. The red and cyan regions indicate false positives and false negatives, respectively. (a) Original image. (b) Ground-truth labels. (c) Results of SegNet. (d) Results of U-Net. (e) Results of FC-DenseNet. (f) Results of HRNet-v2. (g) Results of csAG-HRNet.
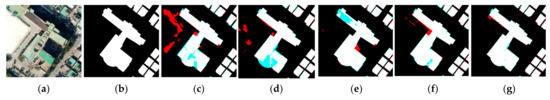
Figure 9.
Detailed results for site 1 (residential area) according to each deep learning model. Red indicates false positives, and cyan indicates false negatives. (a) Original image. (b) Ground-truth labels. (c) Results of SegNet. (d) Results of U-Net. (e) Results of FC-DenseNet. (f) Results of HRNet-v2. (g) Results of csAG-HRNet.
Table 2 shows the evaluation metrics for the residential area of site 1. The overall accuracy and F1-score of csAG-HRNet are the highest among the deep learning models, as shown in Table 2. FC-DenseNet has the highest precision value of 0.9344, indicating that it generates fewer false positives than the other networks. This is because the results of FC-DenseNet include few false positives for buildings under construction in the center of the image, for containers in the upper right corner of the image, and for small buildings. Moreover, the F1-score is highest for csAG-HRNet, with a value of 0.9123, while HRNet-v2 has the highest recall value of 0.9062.
Table 2.
Quantitative building extraction results for site 1 (residential area) according to each deep learning model.
Industrial Area of Site 1
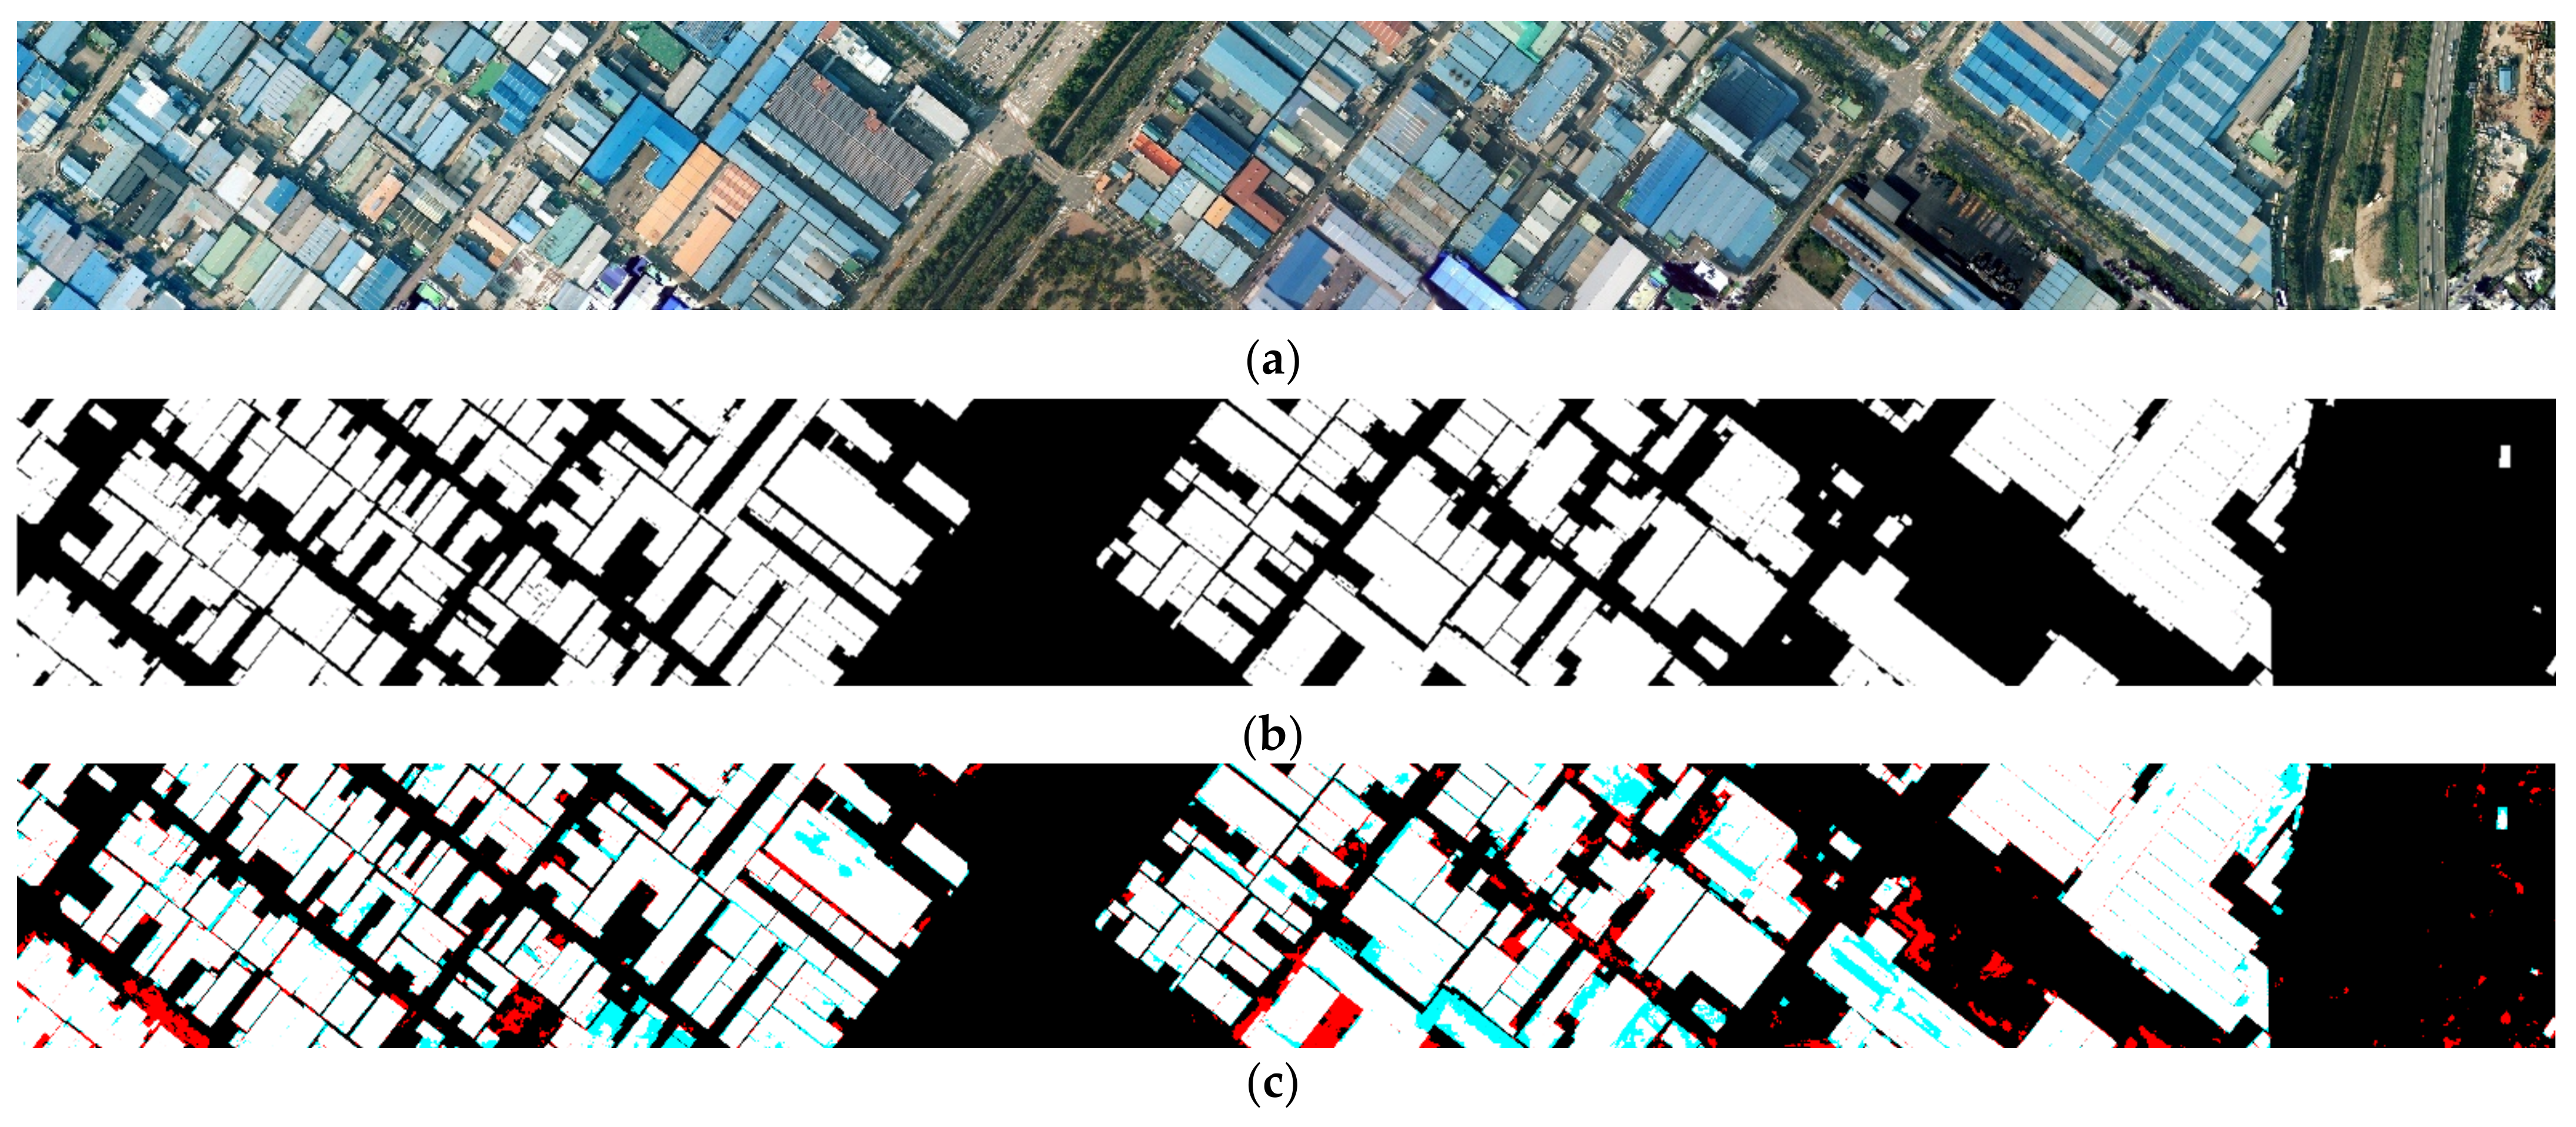
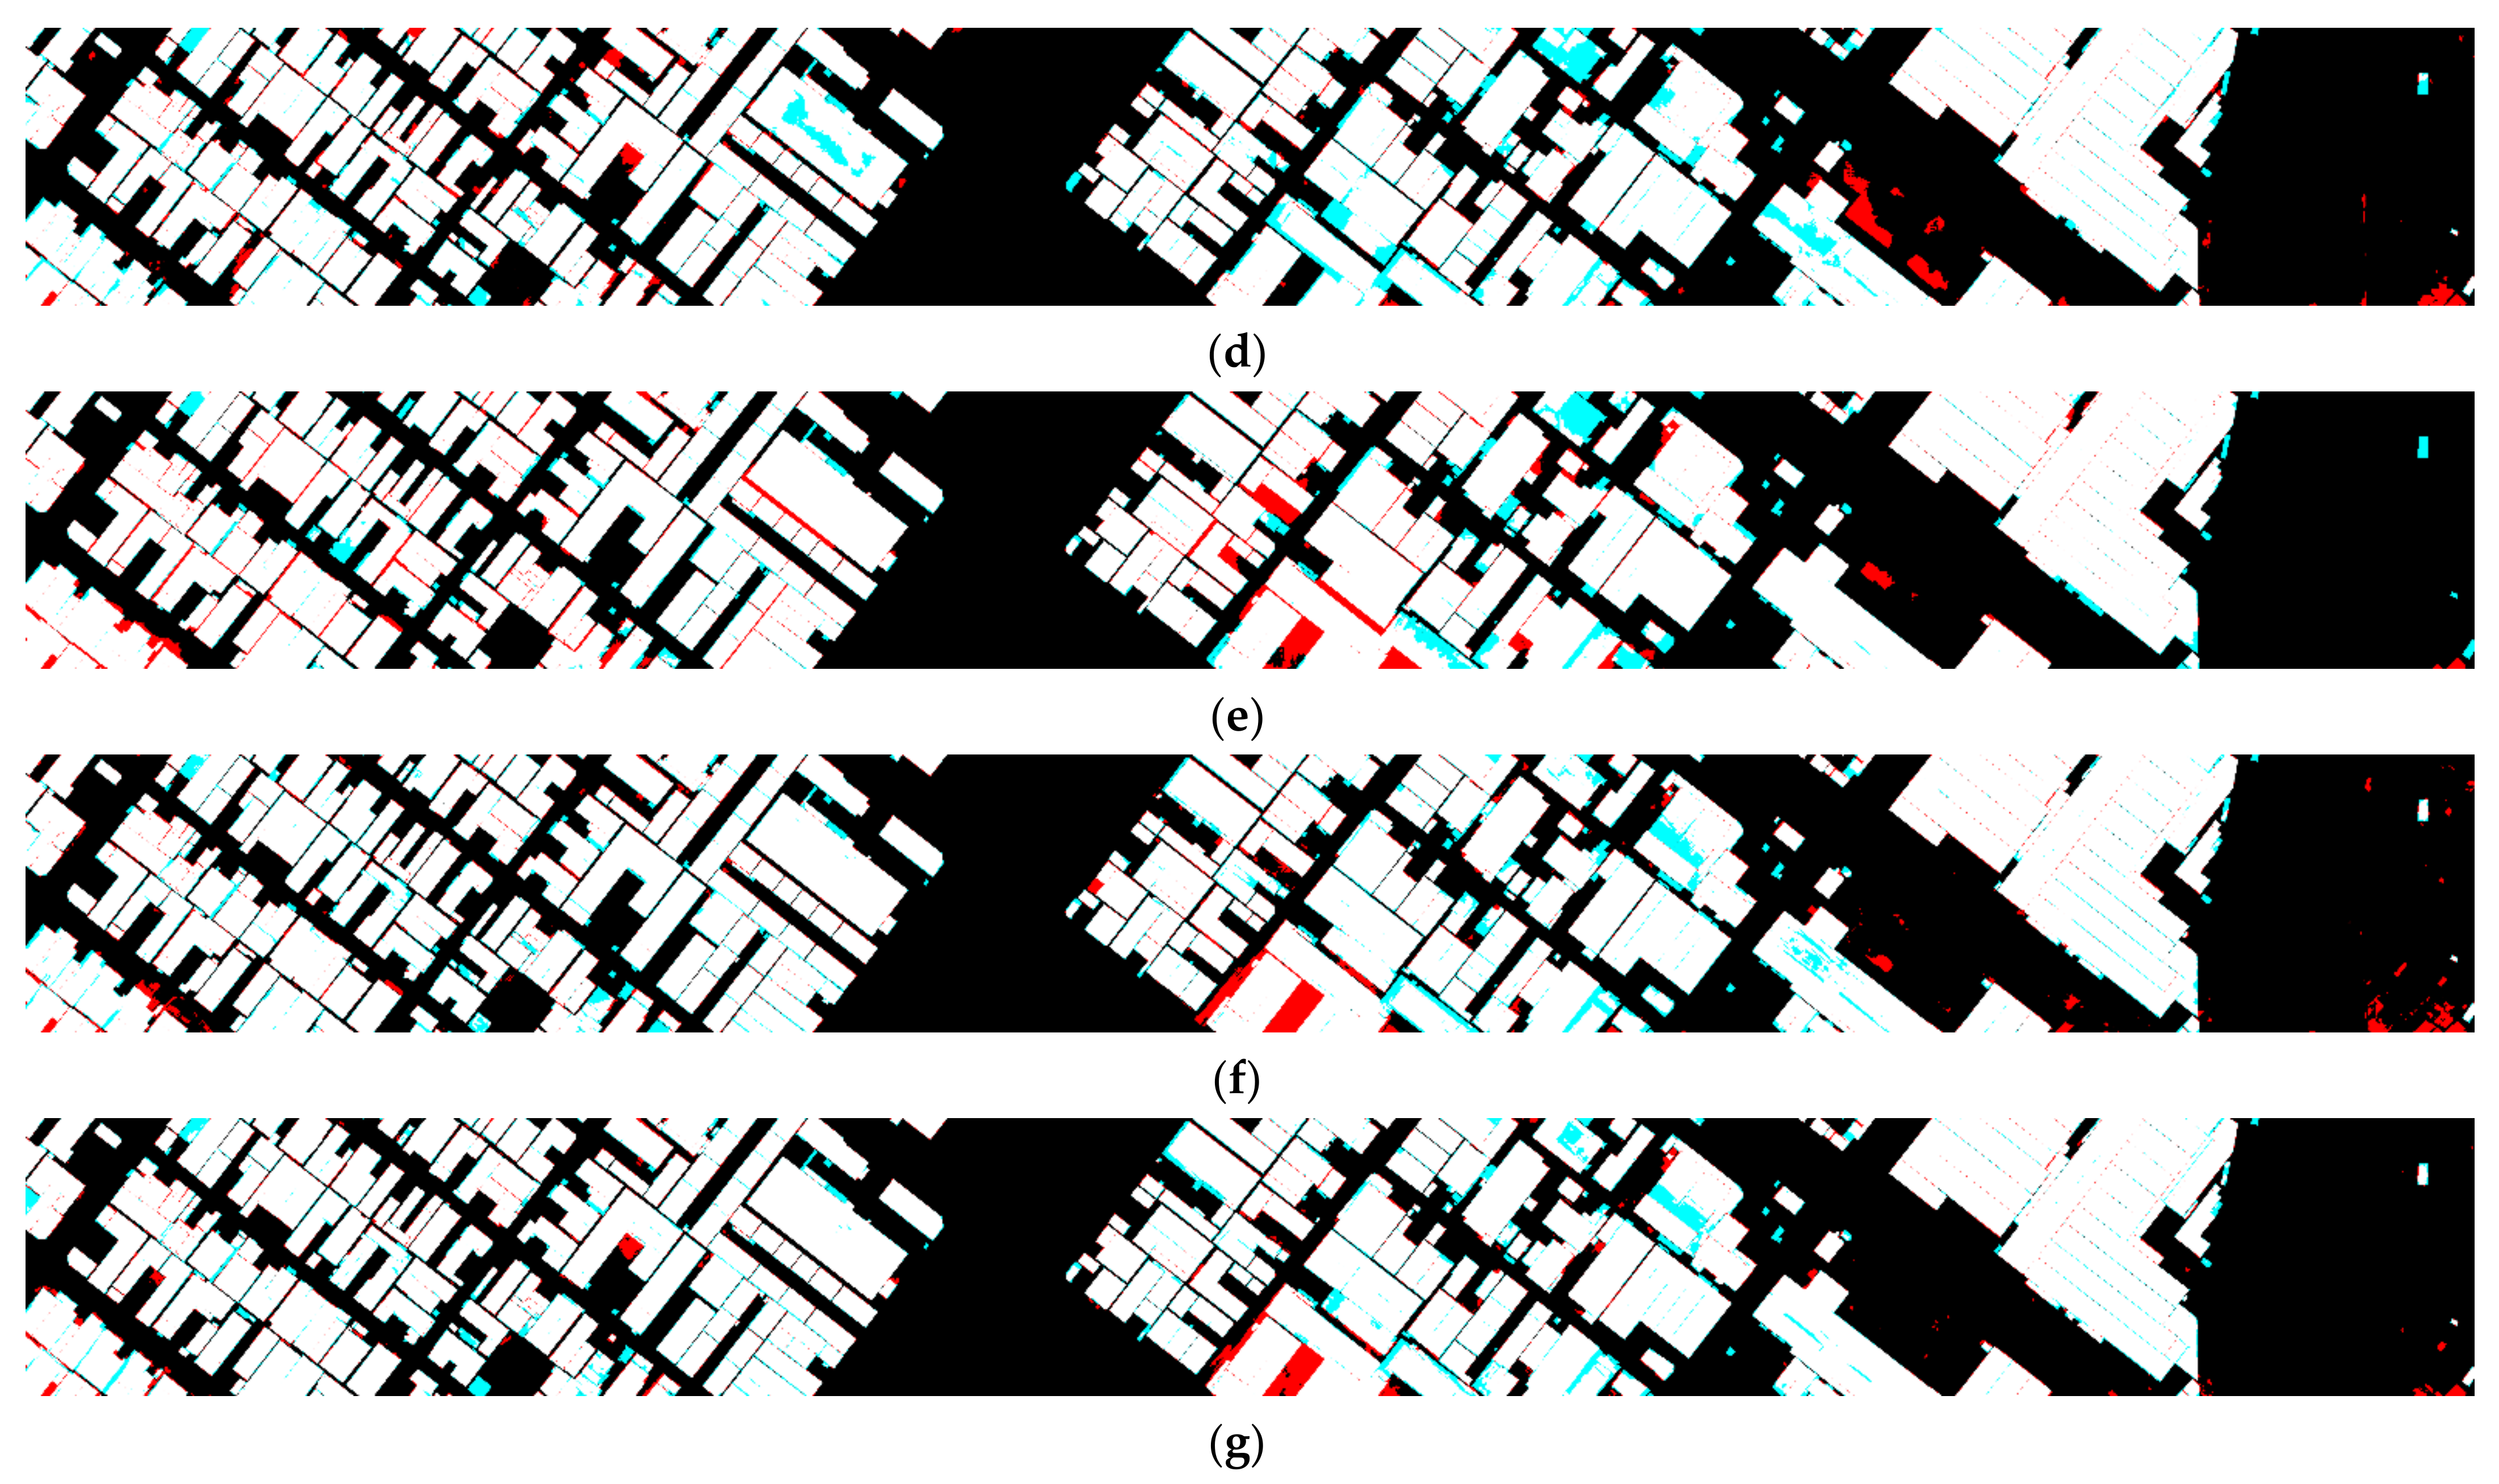
The industrial area of site 1 is also adjacent to the training dataset. Figure 10 shows the results predicted for site 1 by each deep learning model, including the proposed algorithm. Many parking lot pixels between buildings in the bottom center area are falsely detected as building pixels in the cases of SegNet, U-Net, FC-DenseNet and HRNet-v2. Figure 11 shows detailed results for the industrial area of site 1. There was a case of misrecognizing a location for the storage of materials such as cut timber as a building, except for csAG-HRNet, as shown in Figure 11c–f. Among the networks, csAG-HRNet generated the fewest false positives. Table 3 shows the evaluation metrics for the industrial area of site 1. The overall accuracy and F1-score are the highest for csAG-HRNet, with values of 0.9561 and 0.9547, respectively, and the precision is also the highest at 0.9667. This means that csAG-HRNet exhibits the best performance for building extraction among the compared deep learning models.
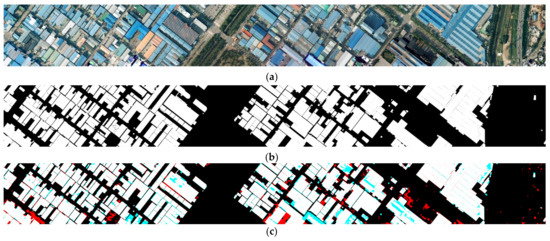
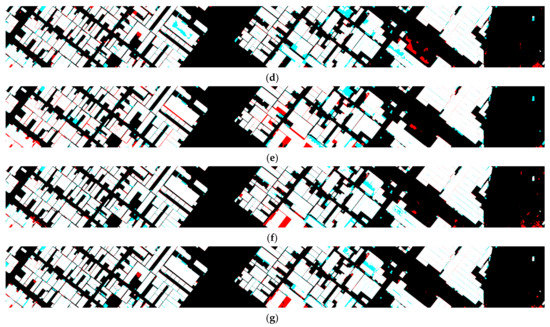
Figure 10.
Building extraction results for test dataset 2 (industrial area) according to each deep learning model. The red and cyan regions indicate false positives and false negatives, respectively. (a) Original image. (b) Ground-truth labels. (c) Results of SegNet. (d) Results of U-Net. (e) Results of FC-DenseNet. (f) Results of HRNet-v2. (g) Results of csAG-HRNet.
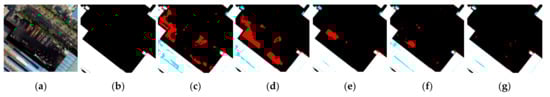
Figure 11.
Detailed results for site 1 (industrial area) according to each deep learning model. Red indicates false positives, and cyan indicates false negatives. (a) Original image. (b) Ground-truth labels. (c) Results of SegNet. (d) Results of U-Net. (e) Results of FC-DenseNet. (f) Results of HRNet-v2. (g) Results of csAG-HRNet.
Table 3.
Quantitative building extraction results for site 1 (industrial area) according to each deep learning model.
Site 2
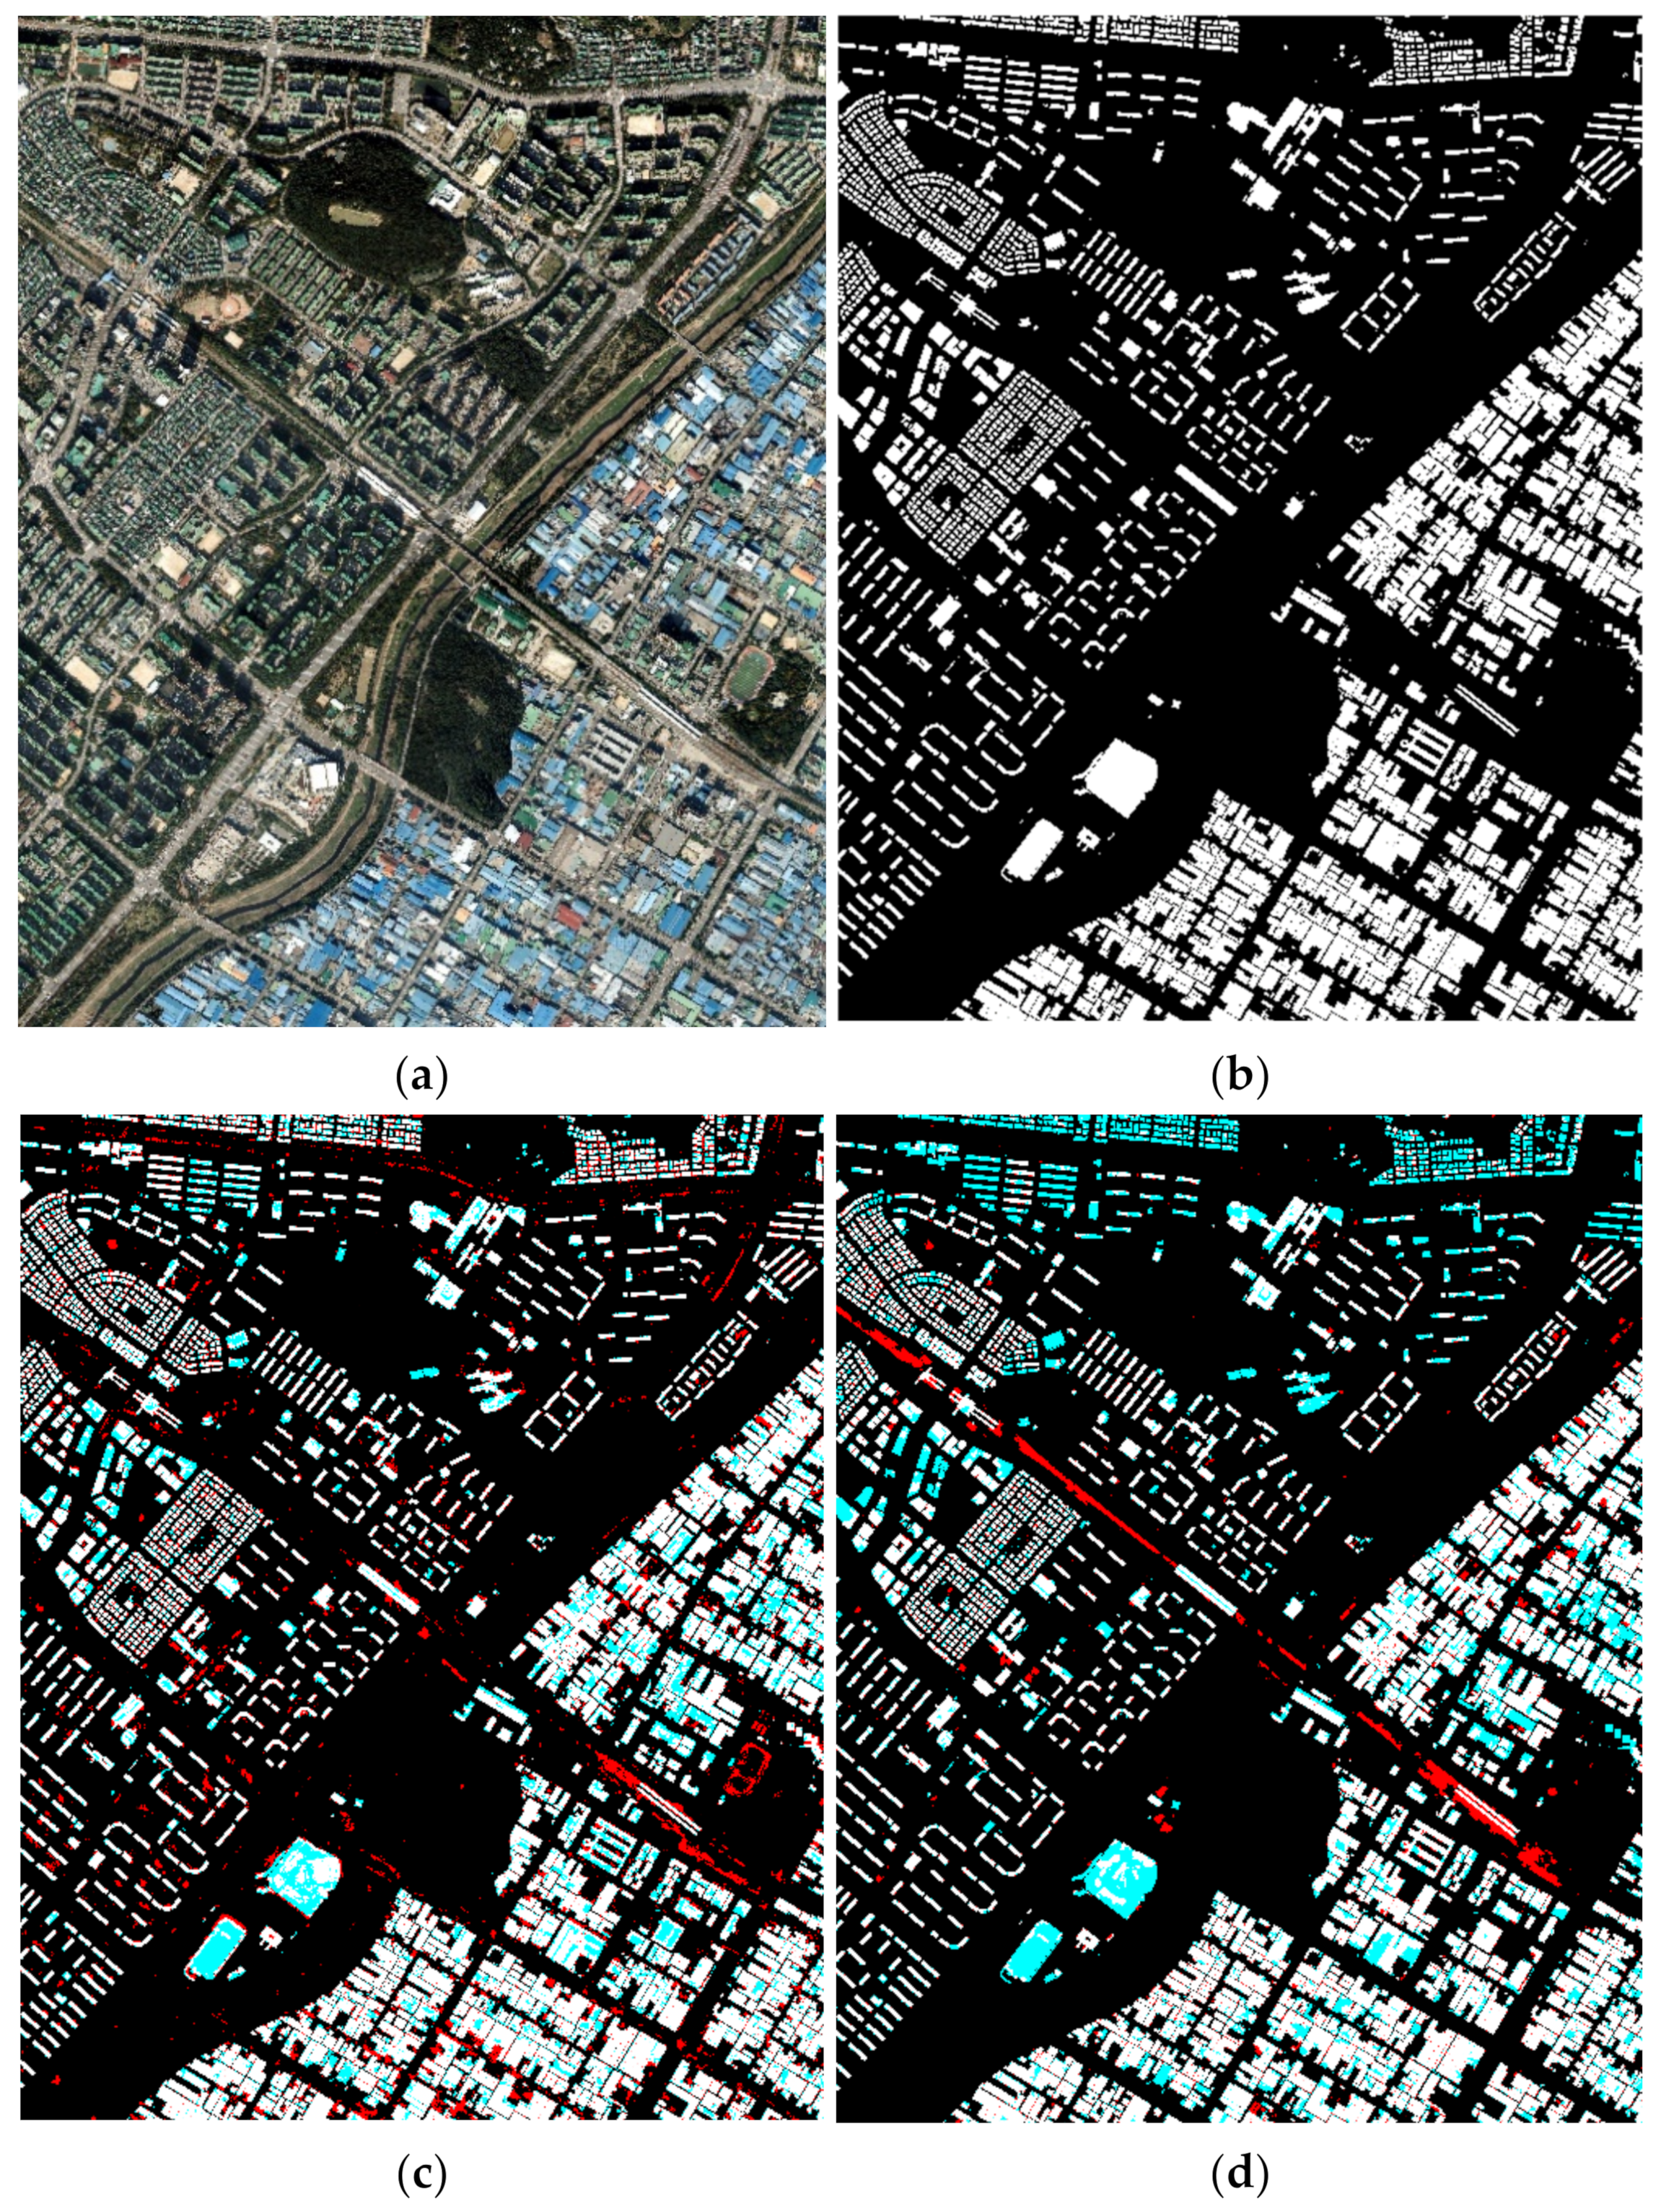
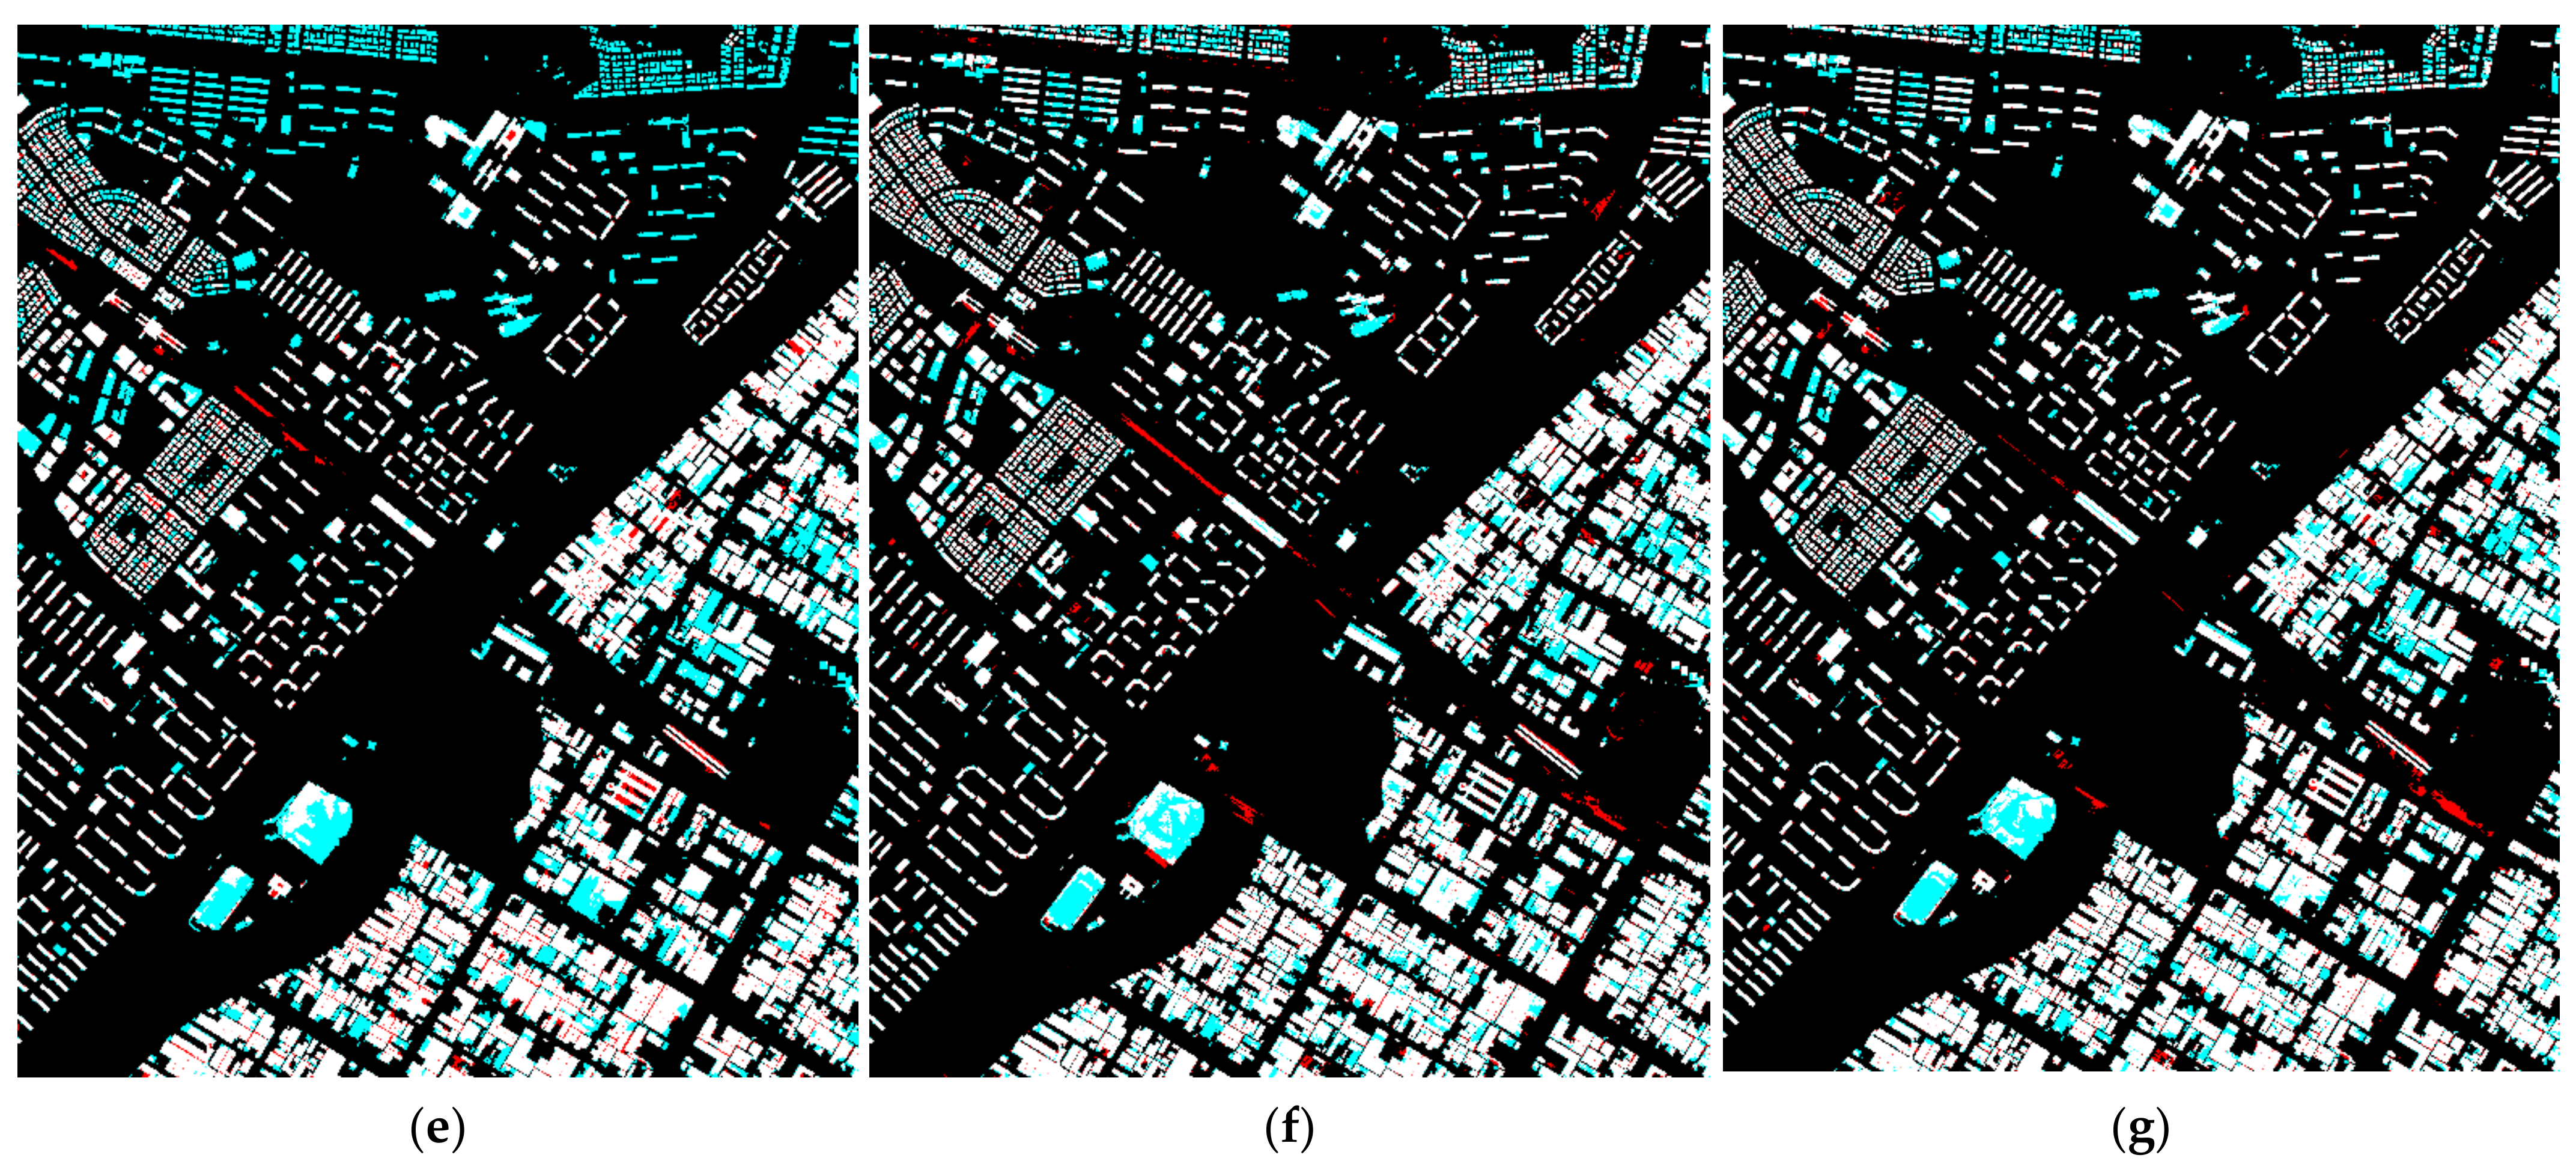
The test dataset of site 2 is taken from a different area than the training dataset, and the composition and characteristics of the buildings are different. Figure 12 shows the results predicted for site 2 by each deep learning model, including the proposed algorithm. By most deep learning models, except for csAG-HRNet, the railroad in the central area was falsely detected as a building. The results of SegNet include many undetected regions in the industrial area. In contrast, HRNet-v2 and csAG-HRNet showed a tendency to detect building regions well, and csAG-HRNet falsely detected fewer railroad pixels as building pixels than HRNet-v2. Table 4 shows the evaluation metrics for site 2. The overall accuracy is the highest for csAG-HRNet, with a value of 0.9417, and the precision and F1-score of the results produced by csAG-HRNet are also the highest. This is because there are fewer false positive detections of railroad track pixels as building pixels than with the other networks, as shown in Figure 12g. Therefore, from the experiments based on this building dataset including orthophoto and vector data from South Korea, we can conclude that our proposed csAG-HRNet can efficiently extract building regions compared to existing deep learning models. In addition, we could successfully modify the original HRNet-v2 using our csAG module.
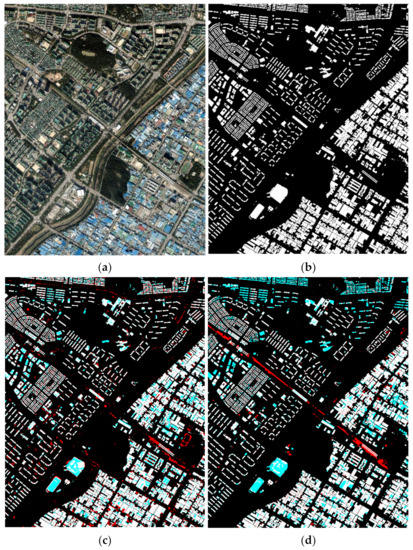
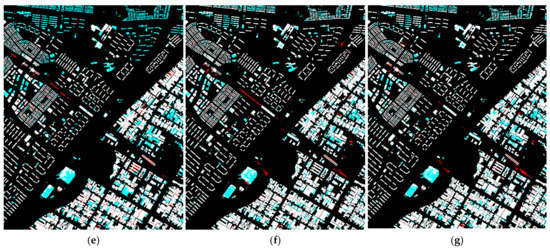
Figure 12.
Building extraction results for site 2 according to each deep learning model. The red and cyan regions indicate false positives and false negatives, respectively. (a) Original image. (b) Ground-truth labels. (c) Results of SegNet. (d) Results of U-Net. (e) Results of FC-DenseNet. (f) Results of HRNet-v2. (g) Results of csAG-HRNet.
Table 4.
Quantitative building extraction results for site 2 according to each deep learning model.
3.2.3. WHU Dataset Results
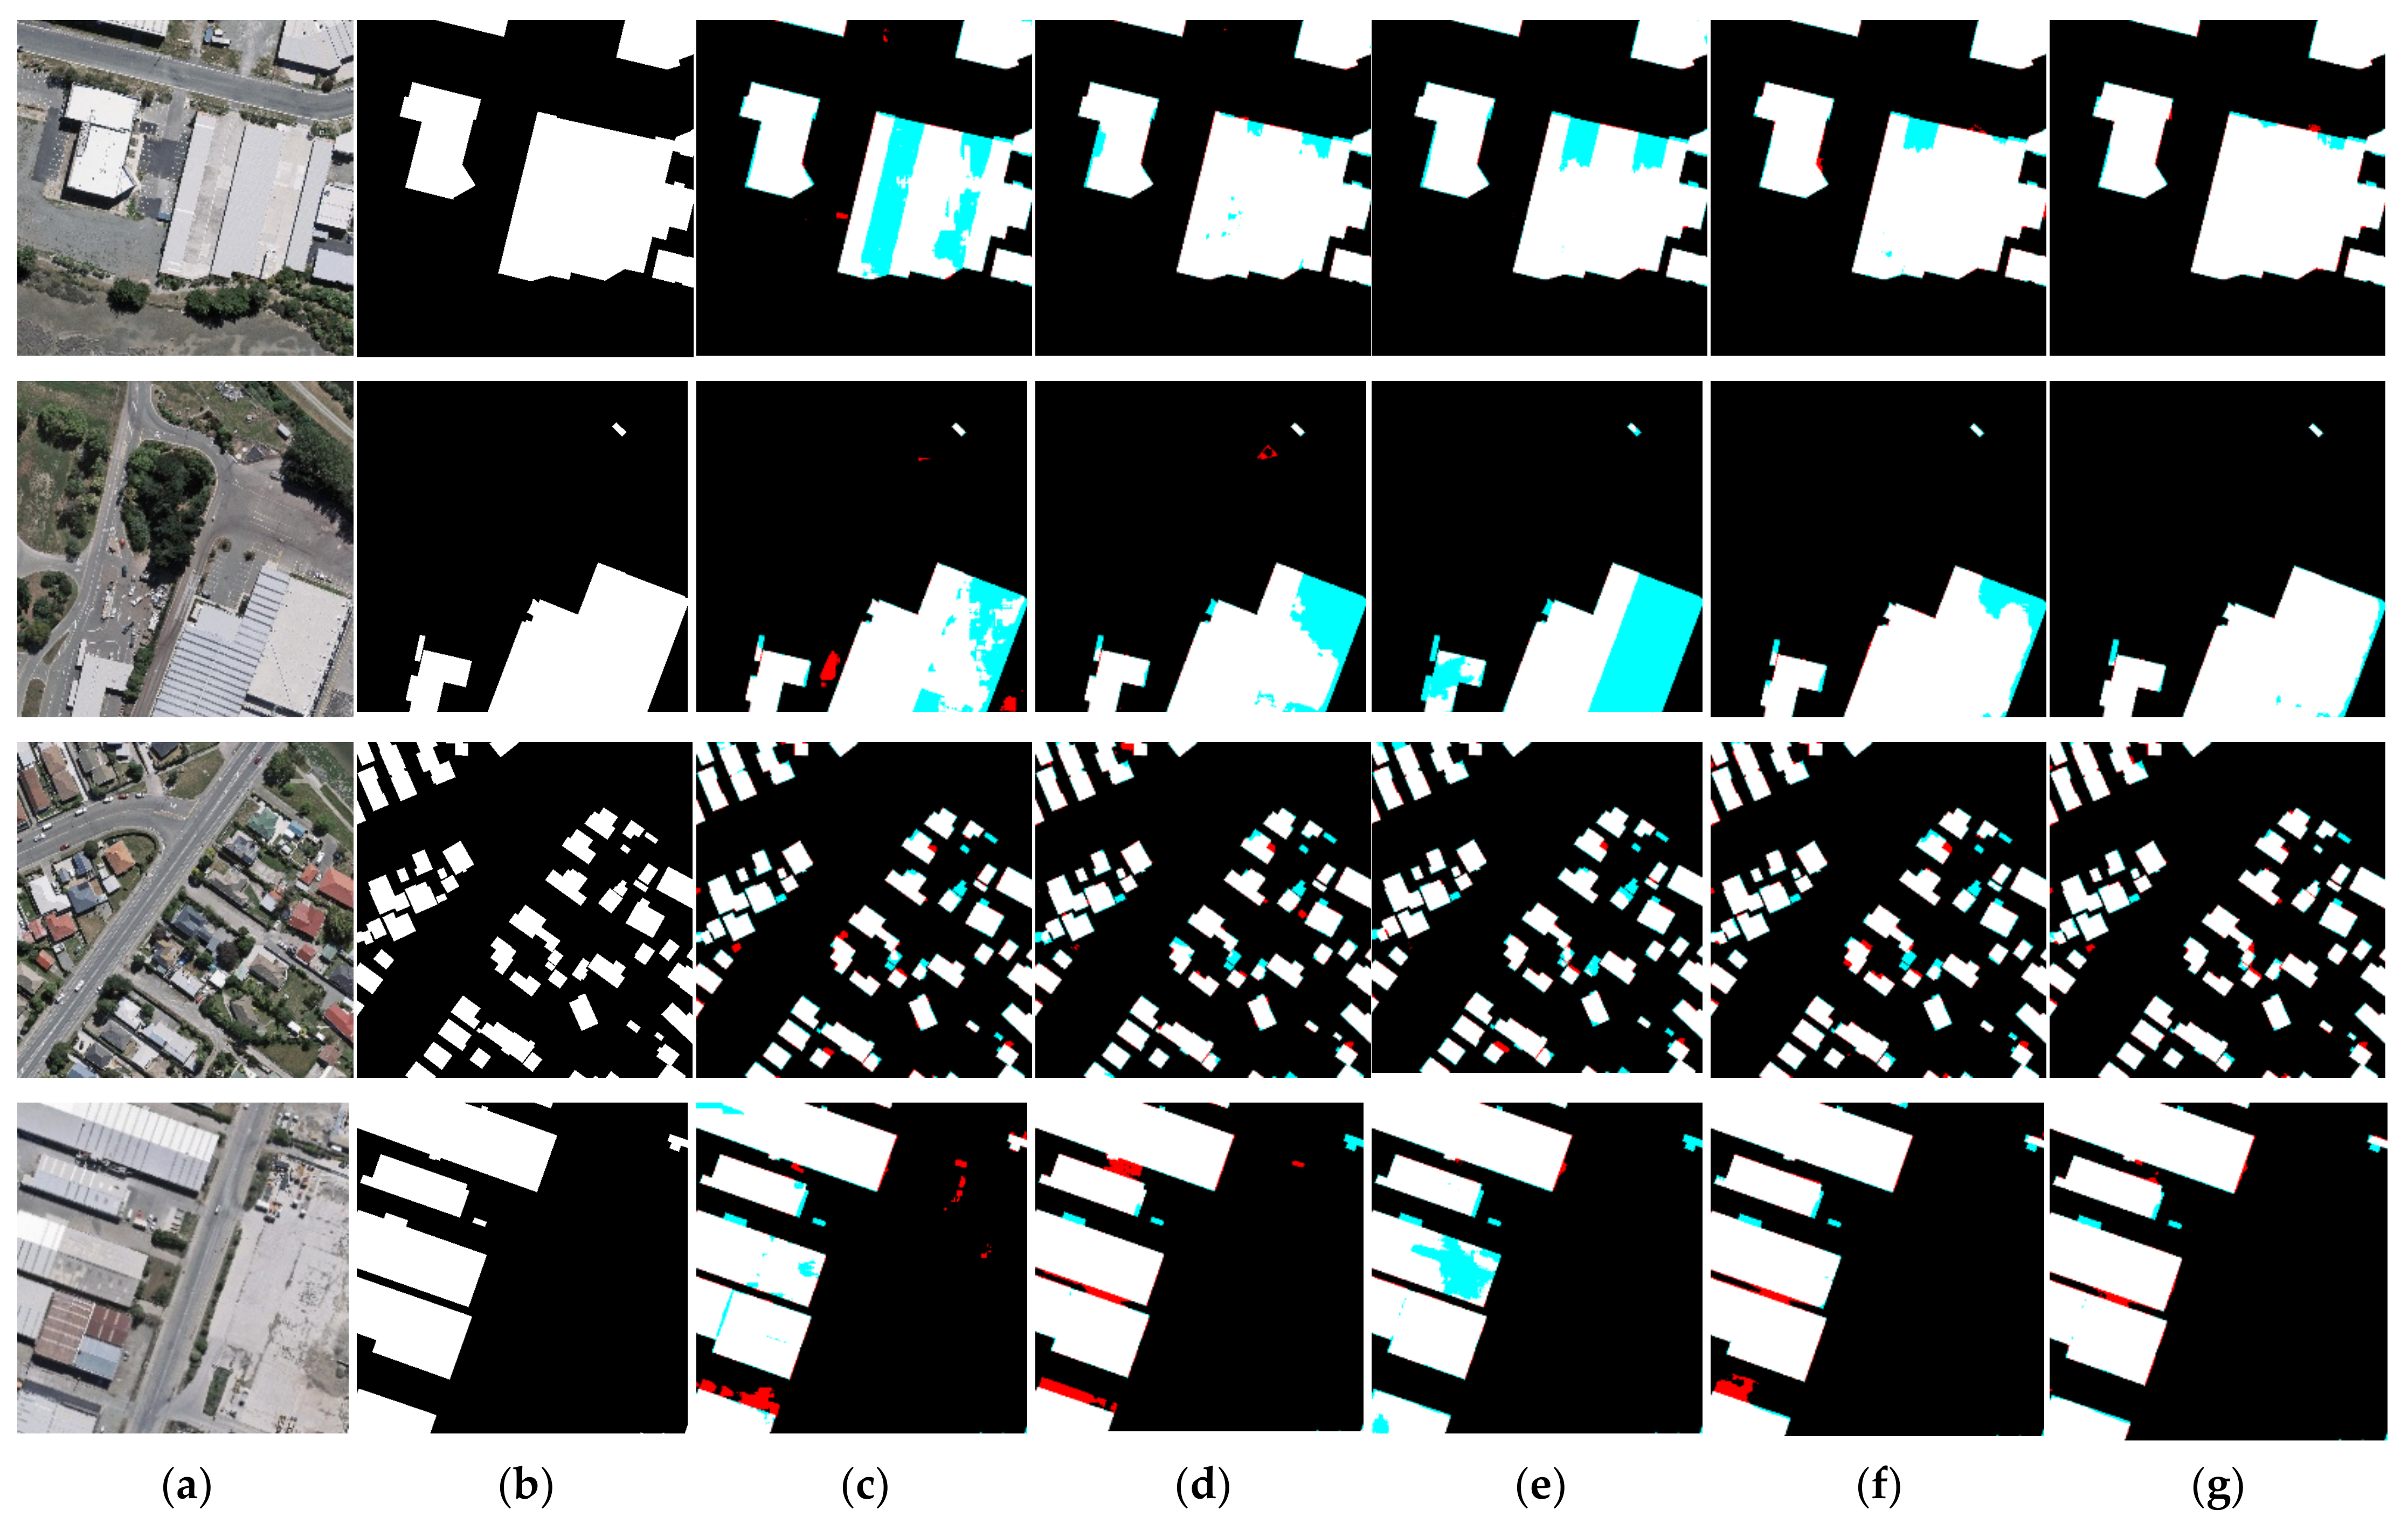
An additional evaluation was also conducted using the test set provided in the WHU building dataset. Figure 13 and Table 5 represent the prediction results for the entire test set of the WHU building dataset. The evaluation metrics are reported as the average values of the results obtained on the test set. Figure 13 visually shows the prediction results for the WHU building dataset. With most of the networks, large buildings such as factories were partially undetected, as shown in Figure 13c–f. However, our csAG-HRNet could better detect large building regions than the existing deep learning models. Table 5 shows the evaluation metrics for the WHU building dataset. The overall accuracy is the highest for csAG-HRNet, with a value of 0.9780, and the precision is also the highest at 0.9842. Similar to the other tests, csAG-HRNet has an F1-score of 0.9855.
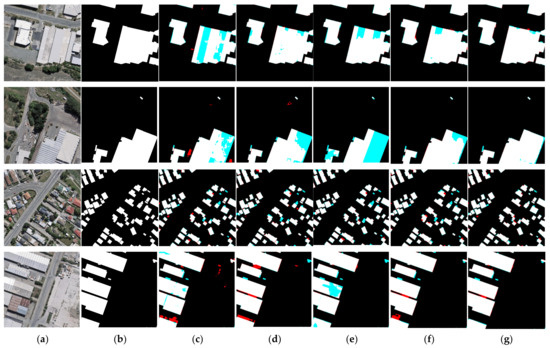
Figure 13.
Building extraction results for the WHU dataset according to each deep learning model. The red and cyan regions indicate false positives and false negatives, respectively. (a) Original image. (b) Ground-truth labels. (c) Results of SegNet. (d) Results of U-Net. (e) Results of FC-DenseNet. (f) Results of HRNet-v2. (g) Results of csAG-HRNet.
Table 5.
Evaluation metrics for each model (WHU dataset).
4. Discussion
We have proposed a deep learning structure with the addition of csAG modules based on HRNet-v2, named csAG-HRNet, for extracting buildings from high-resolution remote sensing imagery. In order to test the efficiency of the proposed deep learning model, a number of parameters of deep learning models were analyzed. The number of parameters means the total number of variables to each layer inside the deep learning model. The proposed network not only offers improved performance for building extraction but also has a slightly reduced number of parameters compared to the original HRNet-v2 model (HRNet-v2 (baseline): 24,283,778, csAG-HRNet (ours): 24,264,745).
In addition, the proposed structure uses channel and spatial attention gates for learning based on the relative importance of different channels and pixels. Features are extracted using subnetworks with a multiresolution layer structure and skip connections. The features that can be extracted by each subnetwork are different because the size of the feature map that is input into each subnetwork is different, and when fusion is performed between subnetworks, features may be lost or noise may be added. The proposed network uses a csAG module to transmit important information more efficiently when subnetworks are fused. To verify the efficiency of the csAG module, we separately analyzed its effect on each process in HRNet. Table 6 presents the building extraction results depending on the locations of the csAG modules in each process of HRNet-v2. As shown in Table 6, the results obtained through the addition of the csAG module to the basic block of each stage module, the fusion module, and the final fusion process show the highest building detection accuracy. Thus, it is confirmed that including the csAG mechanism in all convolutional layer processes of the HRNet-v2 model enables the effective extraction of meaningful information about buildings and minimizes false positives.
Table 6.
Building extraction results depending on the locations of the csAG modules in each process of HRNet-v2.
5. Conclusions
In this manuscript, we have proposed a deep learning structure named csAG-HRNet by introducing a csAG mechanism into HRNet-v2. Specifically, the csAG module used in our proposed algorithm allows features to be efficiently learned by considering the relative importance of channels and pixels. The channel attention gate focuses on the importance of different channels, while the spatial attention gate determines weights in accordance with the importance of different pixel positions in the input data. The proposed csAG-HRNet model is constructed by adding a csAG module to each subnetwork of the HRNet-v2 network. In experiments, it was confirmed that the proposed network is less affected by large buildings or shadows cast by unusually shaped buildings. In addition, the number of false positives for buildings, such as various small nonbuilding objects, is reduced. Moreover, compared to HRNet-v2, there is no difference in network complexity in terms of efficiency, and it has been confirmed that adding the csAG module to all processes in HRNet-v2 results in optimal performance. Therefore, the proposed csAG-HRNet is more effective in detecting buildings than existing deep learning models.
Author Contributions
Conceptualization, S.S. and J.C.; data curation, S.S.; funding acquisition, J.C.; investigation, S.S. and J.C.; methodology, S.S. and J.C.; software, S.S.; visualization, S.S.; writing—original draft, S.S.; writing—review and editing, J.C. Both authors have read and agreed to the published version of the manuscript.
Funding
This study was funded by the Basic Science Research Program through the National Research Foundation of Korea (NRF), which is funded by the Ministry of Education (NRF-2020R1I1A3A04037483), and by the Key research and development Program of Anhui Province (202104b11020022).
Institutional Review Board Statement
Not applicable.
Informed Consent Statement
Not applicable.
Data Availability Statement
The aerial images and digital topographic maps used in this study are available on request from the NGII webpage (http://map.ngii.go.kr/ms/map/NlipMap.do?tabGb=total (accessed on 4 August 2021)) and the WHU dataset is available on request from the WHU webpage (http://gpcv.whu.edu.cn/data/building_dataset.html (accessed on 4 August 2021)).
Acknowledgments
This study was supported by the Basic Science Research Program through the National Research Foundation of Korea (NRF), which is supported by the Ministry of Education (NRF-2020R1I1A3A04037483), and by the Key research and development Program of Anhui Province (202104b11020022).
Conflicts of Interest
The authors declare no conflict of interest.
References
- Blaschke, T. Object based image analysis for remote sensing. ISPRS J. Photogramm. Remote Sens. 2010, 65, 2–16. [Google Scholar] [CrossRef] [Green Version]
- Chen, C.; Zhong, J.; Tan, Y. Multiple-Oriented and Small Object Detection with Convolutional Neural Networks for Aerial Image. Remote Sens. 2019, 11, 2176. [Google Scholar] [CrossRef] [Green Version]
- Francis, A.; Sidiropoulos, P.; Muller, J.-P. CloudFCN: Accurate and Robust Cloud Detection for Satellite Imagery with Deep Learning. Remote Sens. 2019, 11, 2312. [Google Scholar] [CrossRef] [Green Version]
- Seo, S.; Choi, J.; Lee, J.; Kim, H.; Seo, D.; Jeong, J.; Kim, M. UPSNet: Unsupervised Pan-Sharpening Network With Registration Learning Between Panchromatic and Multi-Spectral Images. IEEE Access 2020, 8, 201199–201217. [Google Scholar] [CrossRef]
- Gu, J.; Sun, X.; Zhang, Y.; Fu, K.; Wang, L. Deep Residual Squeeze and Excitation Network for Remote Sensing Image Super-Resolution. Remote Sens. 2019, 11, 1817. [Google Scholar] [CrossRef] [Green Version]
- Hou, B.; Liu, Q.; Wang, H.; Wang, Y. From W-Net to CDGAN: Bitemporal Change Detection via Deep Learning Techniques. IEEE Trans. Geosci. Remote Sens. 2020, 58, 1790–1802. [Google Scholar] [CrossRef] [Green Version]
- Kang, W.; Xiang, Y.; Wang, F.; You, H. EU-Net: An Efficient Fully Convolutional Network for Building Extraction from Optical Remote Sensing Images. Remote Sens. 2019, 11, 2813. [Google Scholar] [CrossRef] [Green Version]
- Long, J.; Shelhamer, E.; Darrell, T. Fully convolutional networks for semantic segmentation. In Proceedings of the IEEE Conference on Computer Vision and Pattern Recognition, Boston, MA, USA, 7–12 June 2015; pp. 3431–3440. [Google Scholar]
- Badrinarayanan, V.; Kendall, A.; Cipolla, R. SegNet: A Deep Convolutional Encoder-Decoder Architecture for Image Segmentation. IEEE Trans. Pattern Anal. Mach. Intell. 2017, 39, 2481–2495. [Google Scholar] [CrossRef]
- Ronneberger, O.; Fischer, P.; Brox, T. U-net: Convolutional networks for biomedical image segmentation. In Proceedings of the International Conference on Medical Image Computing and Computer-Assisted Intervention, Munich, Germany, 5–9 October 2015; pp. 231–241. [Google Scholar]
- Simonyan, K.; Zisserman, A. Very deep convolutional networks for large-scale image recognition. arXiv 2014, arXiv:1409.1556. [Google Scholar]
- He, K.; Zhang, X.; Ren, S.; Sun, J. Deep Residual Learning for Image Recognition. In Proceedings of the IEEE Conference on Computer Vision and Pattern Recognition, Las Vegas, NV, USA, 26 June–1 July 2016; pp. 770–778. [Google Scholar]
- Chen, L.C.; Zhu, Y.; Papandreou, G.; Schroff, F.; Adam, H. Encoder-decoder with atrous separable convolution for semantic image segmentation. In Proceedings of the European Conference on Computer Vision (ECCV), Munich, Germany, 8–14 September 2018; pp. 801–818. [Google Scholar]
- Huang, G.; Liu, Z.; Van der Maaten, L.; Weinberger, K.Q. Densely connected convolutional networks. In Proceedings of the IEEE Conference on Pattern Recognition and Computer Vision 2017, Honolulu, HI, USA, 21–26 July 2017; pp. 4700–4708. [Google Scholar]
- Jégou, S.; Drozdzal, M.; Vazquez, D.; Romero, A.; Bengio, Y. The one hundred layers tiramisu: Fully convolutional DenseNets for semantic segmentation. In Proceedings of the Computer Vision and Pattern Recognition Workshops, Honolulu, HI, USA, 21–26 July 2017; pp. 1175–1183. [Google Scholar]
- Wang, F.; Jiang, M.; Qian, C.; Yang, S.; Li, C.; Zhang, H.; Wang, X.; Tang, X. Residual attention network for image classification. In Proceedings of the 2017 IEEE Conference on Computer Vision and Pattern Recognition, Honolulu, HI, USA, 21–26 July 2017; pp. 3156–3164. [Google Scholar]
- Lim, J.S.; Astrid, M.; Yoon, H.J.; Lee, S.I. Small Object Detection using Context and Attention. In Proceedings of the 2019 IEEE Conference on Computer Vision and Pattern Recognition, Long Beach, CA, USA, 15–21 June 2019; pp. 181–186. [Google Scholar]
- Fu, J.; Liu, J.; Tian, H.; Li, Y.; Bao, Y.; Fang, Z.; Lu, H. Dual attention network for scene segmentation. In Proceedings of the IEEE Conference on Computer Vision and Pattern Recognition, Long Beach, CA, USA, 15–20 June 2019; pp. 3146–3154. [Google Scholar]
- Sirmacek, B.; Unsalan, C. Building detection from aerial images using invariant color features and shadow information. In Proceedings of the 23rd International Symposium on Computer and Information Sciences, Istanbul, Turkey, 27–29 October 2008; pp. 1–5. [Google Scholar]
- Zhang, Y. Optimisation of building detection in satellite images by combining multispectral classification and texture filtering. ISPRS J. Photogramm. Remote Sens. 1999, 54, 50–60. [Google Scholar] [CrossRef]
- Ngo, T.T.; Mazet, V.; Collet, C.; De Fraipont, P. Shape-based building detection in visible band images using shadow information. IEEE J. Sel. Top. Appl. Earth Obs. Remote Sens. 2016, 10, 920–932. [Google Scholar] [CrossRef]
- Ghandour, A.J.; Jezzini, A.A. Autonomous Building Detection Using Edge Properties and Image Color Invariants. Buildings 2018, 8, 65. [Google Scholar] [CrossRef] [Green Version]
- Song, Y.; Shan, J. Building extraction from high resolution color imagery based on edge flow driven active contour and JSEG. In Proceedings of the International Archives of the Photogrammetry, Remote Sensing and Spatial Information Sciences, Beijing, China, 3–11 July 2008; Volume 37, pp. 185–190. [Google Scholar]
- Chen, M.; Wu, J.; Liu, L.; Zhao, W.; Tian, F.; Shen, Q.; Zhao, B.; Du, R. DR-Net: An Improved Network for Building Extraction from High Resolution Remote Sensing Image. Remote Sens. 2021, 13, 294. [Google Scholar] [CrossRef]
- Wagner, F.H.; Dalagnol, R.; Tarabalka, Y.; Segantine, T.Y.; Thomé, R.; Hirye, M. U-Net-Id, an Instance Segmentation Model for Building Extraction from Satellite Images—Case Study in the Joanópolis City, Brazil. Remote Sens. 2020, 12, 1544. [Google Scholar] [CrossRef]
- Ma, J.; Wu, L.; Tang, X.; Liu, F.; Zhang, X.; Jiao, L. Building extraction of aerial images by a global and multi-scale encoder-decoder network. Remote Sens. 2020, 12, 2350. [Google Scholar] [CrossRef]
- Guo, M.; Liu, H.; Xu, Y.; Huang, Y. Building extraction based on U-Net with an attention block and multiple losses. Remote Sens. 2020, 12, 1400. [Google Scholar] [CrossRef]
- Shao, Z.; Tang, P.; Wang, Z.; Saleem, N.; Yam, S.; Sommai, C. BRRnet: A fully convolutional neural network for automatic building extraction from high-resolution remote sensing images. Remote Sens. 2020, 12, 1050. [Google Scholar] [CrossRef] [Green Version]
- Zhang, Y.; Li, W.; Gong, W.; Wang, Z.; Sun, J. An improved boundary-aware perceptual loss for building extraction from VHR images. Remote Sens. 2020, 12, 1195. [Google Scholar] [CrossRef] [Green Version]
- Yi, Y.; Zhang, Z.; Zhang, W.; Zhang, C.; Li, W.; Zhao, T. Semantic Segmentation of Urban Buildings from VHR Remote Sensing Imagery Using a Deep Convolutional Neural Network. Remote Sens. 2019, 11, 1774. [Google Scholar] [CrossRef] [Green Version]
- Liu, H.; Luo, J.; Huang, B.; Hu, X.; Sun, Y.; Yang, Y.; Xu, N.; Zhou, N. DE-Net: Deep Encoding Network for Building Extraction from High-Resolution Remote Sensing Imagery. Remote Sens. 2019, 11, 2380. [Google Scholar] [CrossRef] [Green Version]
- Wang, S.; Hou, X.; Zhao, X. Automatic building extraction from high-resolution aerial imagery via fully convolutional encoder-decoder network with non-local block. IEEE Access 2020, 8, 7313–7322. [Google Scholar] [CrossRef]
- Li, W.; He, C.; Fang, J.; Zheng, J.; Fu, H.; Yu, L. Semantic Segmentation-Based Building Footprint Extraction Using Very High-Resolution Satellite Images and Multi-Source GIS Data. Remote Sens. 2019, 11, 403. [Google Scholar] [CrossRef] [Green Version]
- Zhang, L.; Wu, J.; Fan, Y.; Gao, H.; Shao, Y. An Efficient Building Extraction Method from High Spatial Resolution Remote Sensing Images Based on Improved Mask R-CNN. Sensors 2020, 20, 1465. [Google Scholar] [CrossRef] [PubMed] [Green Version]
- Liu, Y.; Zhou, J.; Qi, W.; Li, X.; Gross, L.; Shao, Q.; Zhao, Z.; Ni, L.; Fan, X.; Li, Z. ARC-Net: An efficient network for building extraction from high-resolution aerial images. IEEE Access 2020, 8, 154997–155010. [Google Scholar] [CrossRef]
- Jin, Y.; Xu, W.; Zhang, C.; Luo, X.; Jia, H. Boundary-Aware Refined Network for Automatic Building Extraction in Very High-Resolution Urban Aerial Images. Remote Sens. 2021, 13, 692. [Google Scholar] [CrossRef]
- Wu, T.; Hu, Y.; Peng, L.; Chen, R. Improved Anchor-Free Instance Segmentation for Building Extraction from High-Resolution Remote Sensing Images. Remote Sens. 2020, 12, 2910. [Google Scholar] [CrossRef]
- Yang, H.; Wu, P.; Yao, X.; Wu, Y.; Wang, B.; Xu, Y. Building Extraction in Very High Resolution Imagery by Dense-Attention Networks. Remote Sens. 2018, 10, 1768. [Google Scholar] [CrossRef] [Green Version]
- Ye, Z.; Fu, Y.; Gan, M.; Deng, J.; Comber, A.; Wang, K. Building extraction from very high resolution aerial imagery using joint attention deep neural network. Remote Sens. 2019, 11, 2970. [Google Scholar] [CrossRef] [Green Version]
- Deng, W.; Shi, Q.; Li, J. Attention-Gate-Based Encoder-Decoder Network for Automatical Building Extraction. IEEE J. Sel. Top. Appl. Earth Obs. Remote. Sens. 2021, 14, 2611–2620. [Google Scholar] [CrossRef]
- He, S.; Jiang, W. Boundary-Assisted Learning for Building Extraction from Optical Remote Sensing Imagery. Remote Sens. 2021, 13, 760. [Google Scholar] [CrossRef]
- Sun, S.; Mu, L.; Wang, L.; Liu, P.; Liu, X.; Zhang, Y. Semantic Segmentation for Buildings of Large Intra-Class Variation in Remote Sensing Images with O-GAN. Remote Sens. 2021, 13, 475. [Google Scholar] [CrossRef]
- Abdollahi, A.; Pradhan, B.; Gite, S.; Alamri, A. Building footprint extraction from high resolution aerial images using Generative Adversarial Network (GAN) architecture. IEEE Access 2020, 8, 209517–209527. [Google Scholar] [CrossRef]
- Wang, J.; Sun, K.; Cheng, T.; Jiang, B.; Deng, C.; Zhao, Y.; Liu, D.; Mu, Y.; Tan, M.; Wang, X.; et al. Deep High-Resolution Representation Learning for Visual Recognition. arXiv 2020, arXiv:1908.07919. [Google Scholar] [CrossRef] [PubMed] [Green Version]
- Sun, K.; Zhao, Y.; Jiang, B.; Cheng, T.; Xiao, B.; Liu, D.; Mu, Y.; Wang, X.; Liu, W.; Wang, J. High-Resolution Representations for Labeling Pixels and Regions. arXiv 2019, arXiv:1904.04514. [Google Scholar]
- Khanh, T.L.B.; Dao, D.P.; Ho, N.H.; Yang, H.J.; Baek, E.T.; Lee, G.; Kim, S.H.; Yoo, S.B. Enhancing U-Net with Spatial-Channel Attention Gate for Abnormal Tissue Segmentation in Medical Imaging. Appl. Sci. 2020, 10, 5729. [Google Scholar] [CrossRef]
- Schlemper, J.; Oktay, O.; Schaap, M.; Heinrich, M.; Kainz, B.; Glocker, B.; Rueckert, D. Attention gated networks: Learning to leverage salient regions in medical images. Med. Image Anal. 2019, 53, 197–207. [Google Scholar] [CrossRef] [PubMed]
- Ji, S.; Wei, S.; Lu, M. Fully convolutional networks for multisource building extraction from an open aerial and satellite imagery data set. IEEE Trans. Geosci. Remote Sens. 2018, 57, 574–586. [Google Scholar] [CrossRef]


Publisher’s Note: MDPI stays neutral with regard to jurisdictional claims in published maps and institutional affiliations. |
© 2021 by the authors. Licensee MDPI, Basel, Switzerland. This article is an open access article distributed under the terms and conditions of the Creative Commons Attribution (CC BY) license (https://creativecommons.org/licenses/by/4.0/).