Article

Enhanced Simulation of an Asian Dust Storm by Assimilating GCOM-C Observations

1
State Key Laboratory of Numerical Modeling for Atmospheric Sciences and Geophysical Fluid Dynamics, Institute of Atmospheric Physics, Chinese Academy of Sciences, Beijing 100029, China
2
Collaborative Innovation Center on Forecast and Evaluation of Meteorological Disasters, Nanjing University of Information Science and Technology, Nanjing 210044, China
3
National Institute for Environmental Studies, Tsukuba 305-8506, Japan
4
Earth Observation Research Center, Japan Aerospace Exploration Agency, Tsukuba 305-8505, Japan
5
Remote Sensing Technology Center of Japan, Tsukuba 305-8505, Japan
*
Author to whom correspondence should be addressed.
Remote Sens. 2021, 13(15), 3020; https://doi.org/10.3390/rs13153020
Submission received: 29 June 2021 / Revised: 26 July 2021 / Accepted: 28 July 2021 / Published: 1 August 2021

Abstract

:
Dust aerosols have great effects on global and regional climate systems. The Global Change Observation Mission-Climate (GCOM-C), also known as SHIKISAI, which was launched on 23 December 2017 by the Japan Aerospace Exploration Agency (JAXA), is a next-generation Earth observation satellite that is used for climate studies. The Second-Generation Global Imager (SGLI) aboard GCOM-C enables the retrieval of more precious global aerosols. Here, the first assimilation study of the aerosol optical thicknesses (AOTs) at 500 nm observed by this new satellite is performed to investigate a severe dust storm in spring over East Asia during 28–31 March 2018. The aerosol observation assimilation system is an integration of the four-dimensional local ensemble transform Kalman filter (4D-LETKF) and the Spectral Radiation Transport Model for Aerosol Species (SPRINTARS) coupled with the Non-Hydrostatic Icosahedral Atmospheric Model (NICAM). Through verification with the independent observations from the Aerosol Robotic Network (AERONET) and the Asian Dust and Aerosol Lidar Observation Network (AD-Net), the results demonstrate that the assimilation of the GCOM-C aerosol observations can significantly enhance Asian dust storm simulations. The dust characteristics over the regions without GCOM-C observations are better revealed from assimilating the adjacent observations within the localization length, suggesting the importance of the technical advances in observation and assimilation, which are helpful in clarifying the temporal–spatial structure of Asian dust and which could also improve the forecasting of dust storms, climate prediction models, and aerosol reanalysis.

1. Introduction

Through absorbing and scattering solar and Earth radiation, dust considerably influences the radiative budget of the atmosphere [1,2,3,4,5]. Absorbing aerosols, such as dust, can heat the atmosphere by absorbing the solar radiation [6]. Dust can also serve as the ice nuclei (IN) and the cloud condensation nuclei (CCN) involved in the development of clouds, which can change a cloud’s lifetime and albedo [7,8]. In addition, dust is an important factor affecting local air quality [9,10,11], tropospheric chemistry, and phytoplankton growth in the Pacific Ocean [12,13].
The Global Change Observation Mission-Climate (GCOM-C), also known as SHIKISAI, is a next-generation Earth-observing satellite for climate studies, which was successfully launched by Japan Aerospace Exploration Agency (JAXA) on 23 December 2017. The long-term GCOM-C observation system is scheduled to conduct continuous global observations and elucidate the mechanisms of global climate change, carbon cycles, and energy budgets [14,15]. The Second-Generation Global Imager (SGLI), an onboard optical sensor, scans the whole globe approximately every two days with high spectral (19 bands) and spatial resolutions (i.e., 250 m at all visible and thermal infrared channels) [15]. GCOM-C currently can provide UV aerosol products for detecting absorbing aerosols during the overpass time in the morning (10:30 LT) [16]. In addition, medium-resolution (1 km) wide-swath spectrometers can achieve polarization or multidirectional observations. Benefitting from the high spatial resolutions and multiple (including polarization) channels of SGLI, GCOM-C offers new opportunities for distinguishing the aerosol types, improving climate prediction models, monitoring the transport of yellow dust and wildfire smoke, and understanding the carbon cycle. This indicates that the start of the GCOM-C operation is an important step for the monitoring of aerosols. The single-scattering albedo (SSA), angstrom exponent (AE), and aerosol optical thickness (AOT) over land and ocean based on the different spectral reflectances are given in the GCOM-C aerosol products. By comparing the ground-based sky radiometer network (SKYNET) measurements, Hoque et al. [16] evaluated the 380 nm AOTs from GCOM-C satellite and indicated the consistency of the retrieved AOTs from the two datasets.
Asian dust storms emitted from the Gobi and Taklamakan Deserts are always transported to the Tibetan Plateau, Eastern China, Korea, and Japan by strong westerly winds [17,18], and sometimes farther across the Pacific Ocean, then reaching North America in spring [19,20]. In addition, several studies have shown that dust storms from the Middle East and the Sahara are transported for long distances and sometimes impact East Asia, with the mixture of dust emitted from the Gobi and Taklamakan Deserts sweeping over East Asia [13,21,22,23,24]. Owing to the observational gaps in satellite observations and the limited spatial representativeness of in situ observations, additional exploration via aerosol data assimilation is required to accurately simulate and completely understand the mechanisms of such dust storms and their transport path over East Asia. GCOM-C is a new satellite with several attractive features; however, a limited number of studies have been conducted with GCOM-C aerosol products. We present the first data assimilation study of the aerosol products derived from the GCOM-C satellite to exhibit the superiority of the GCOM-C products and reproduce the severe dust storm that occurred over East Asia from 28 to 31 March 2018. We update the aerosol data-assimilation system on the basis of a four-dimensional local ensemble transform Kalman filter (4D-LETKF) and aerosol-coupled Non-Hydrostatic Icosahedral Atmospheric Model (NICAM) [25] to assimilate the new aerosol observations of GCOM-C, then investigate the impact of GCOM-C aerosol assimilation on simulations of this Asian dust event.
Section 2 briefly describes the assimilated GCOM-C observations and the dataset for independent validation. Section 3 introduces the forward model, the 4D-LETKF data assimilation system, and our numerical experimental design. Section 4 shows the simulated results after data assimilation and independent verification. Another dust event over East Asia is discussed in Section 5 to generalize this study. Lastly, conclusions are drawn in Section 6.

2. Observational Data

2.1. Assimilated GCOM-C Observations

Global aerosol optical thicknesses (AOTs) at 500 nm over land with a spatial resolution of 4 km in SGLI Version 2 Level 2 Aerosol by Non-Polarization (ARNP) [26] are assimilated in this study. All of the products can be downloaded through the JAXA G-Portal (https://gportal.jaxa.jp/, last access: 28 June 2021). Aerosol by SGLI polarimetry is not used here because its retrieval algorithm is currently under development. The accuracy of the monthly mean GCOM-C AOTs over land was estimated to be 0.15, while that over the ocean was 0.1. The retrieval uncertainty σ i of the original GCOM-C AOTs was estimated according to the empirical formulas as follows [27]:
σ i = { 0.166 ,   A O T > 0.6 0.0995 ,   A O T 0.6 0.0895 ,   A O T 0.4 0.0770 ,   A O T 0.3 0.0650 ,   A O T 0.2 0.0355 ,   A O T 0.1
In order to ensure the quality of these originally available data, the quality assurance flags (QA_Flags), which include several bit fields for the aerosol discrimination algorithm, were applied to eliminate observations with high uncertainties (Table 1). Quality control procedures for the available data include the following: (1) the coastal flag is an indicator that excludes the coastal pixels with complicated structure; (2) the cloud flag separates “clear” aerosol pixels from “cloudy” ones; (3) we only used pixels with very good AOT confidence flag, indicating high confidence in AOT values; (4) sun glint and stray light flags had to be 0; (5) to decrease cloud shadow influences and large surface reflectance estimation error, the cloud shadow possibility flag and uncertain surface reflectance flag had to be also 0. Then, AOTs were aggregated hourly into a 0.5 × 0.5° model grid with additional buddy checks to better ensure the spatiotemporal representation of the observations and serve as the assimilated observations [28]. The aggregation procedures that we used were as follows: first, only AOT observations within μ ± σ were used to aggregate in one model grid, where μ represents the mean value of the subgrid observations and σ represents their standard deviation in the aggregation cell; second, the number of subgrid observations within the 0.5° grid cell had to be more than 20%; third, the observation over the grid cell with the ratio of the AOT standard deviation and mean value higher than 0.5 should be excluded for assimilation [27,29]. This methodology can work on finer domains according to Liu et al. [30]. Gridded total observation uncertainties are calculated as the square root of representative error variances σ r 2 coupled with instrumental error variances σ i 2 . After quality assurance and aggregation, the total number of available hourly GCOM-C AOTs from 28 to 31 March 2018 over land are shown in Figure 1. Over East Asia, most of the GCOM-C AOTs with high confidence were concentrated in Northeast China and the middle part of China. As shown in Figure S1, although the original GCOM-C-observed-AOTs were concentrated in the Gobi Desert, Mongolia, Northeast China, and the middle part of China, the observed-AOTs in the Gobi Desert and Mongolia were mostly eliminated by the strictly quality control procedures. The strictest quality control procedures used in this study eliminated a large number of AOTs observations over bright-reflecting surfaces to ensure the best observations for assimilation. The independent retrievals of optical aerosol properties from the Aerosol Robotic Network (AERONET) and Asian Dust and Aerosol Lidar Observation Network (AD-Net) were used to validate the simulated aerosol optical properties. The locations of the AERONET and AD-Net stations are marked in Figure 1.

2.2. Independent Observations Used for Evaluation

2.2.1. AERONET

AERONET (https://aeronet.gsfc.nasa.gov/, last access: 28 June 2021) is a global distributed network of autonomously operated CIMEL Sun photometers measure the sun and sky radiances, which provide a continuously long-term database of retrieved aerosol properties [31,32]. Over the past 25 years, the number of the AERONET sites has increased to more than 700 sites, which cover most parts of the world. AERONET Version 3 Level 2 database includes spectral aerosol optical depth, absorption optical depth, angstrom exponent, single scattering albedo, complex refractive index, and particle size distribution data. Near-real-time retrieved AOTs have a high temporal frequency of approximately 3–15 min for multiple wavelengths (340, 380, 440, 500, 675, 870, 1020, and 1640 nm) [32]. As most of the AERONET sites can provide the AOTs at 440 nm, the AERONET AOTs at 440 nm with the highest data quality levels were directly used to validate the model simulated AOTs at 440 nm. Instantaneous AOTs at 440 nm were averaged within each hour to obtain the hourly mean AOTs for independent validation.

2.2.2. AD-Net

AD-Net (http://www-lidar.nies.go.jp/AD-Net, last access: 28 June 2021) is continuously operated by the National Institute for Environmental Studies (NIES). It is distributed over 20 locations, including in China, Japan, Mongolia, Thailand, and Korea. The two-wavelength (532, 1064 nm), polarization-sensitive (532 nm) Mie scattering lidar is the standard lidar system used for AD-Net, which can measure vertical distributions of dust and other aerosols over East Asia for the quantitative understanding of influences of aerosols on the environment, climate, and health [33]. The vertical profiles of the volume depolarization ratio at 532 nm and the attenuated backscatter coefficients at 532 and 1064 nm are provided by AD-net. The depolarization ratio and attenuated backscatter coefficients are then used to estimate the extinction coefficients for spherical and non-spherical aerosols [9,10]. The vertical resolution of the lidar observations is 30 m and the temporal resolution is 15 min. AD-net also provides East Asian aerosol components for the Global Atmosphere Watch (GAW) Aerosol Lidar Observation Network [34].

3. Data Assimilation System

3.1. Forward Model

The forward model of the aerosol assimilation system is the global three-dimensional aerosol transport model named the Spectral Radiation Transport Model for Aerosol Species (SPRINTARS) [35,36,37,38], which is coupled online with a new dynamical atmospheric model called the Non-Hydrostatic Icosahedral Atmospheric Model (NICAM) [39,40,41,42], which predicts the spatiotemporal evolution of aerosols. Utilizing the icosahedral grid configuration and the non-hydrostatic dynamic core, NICAM can be run with a subkilometer horizontal resolution [43] and can employ finer meshes in the target regions as the stretched grid system [44]. In this study, the model horizontal resolution was 56 km due to limitations of our computational resources, while the vertical resolution was 38 layers, including 10 layers below 2 km. The aerosol-coupled NICAM considers the main aerosol processes, including emission, advection, diffusion, and deposition. It predicts the mass mixing ratios of the major tropospheric aerosol components, including sea salt, soil dust, sulfate, and carbonaceous aerosols [45,46]. The sulfate and carbonaceous aerosols are represented using the bulk scheme, while the soil dust and sea salt are divided into 10 bins and 4 bins from 0.1 to 10 μm by radius. In this study, the Global Fire Emissions Database (GFEDv3.1) [47] and the Hemispheric Transport of Air Pollution (HTAP) [48] are used as the biomass burning and anthropogenic emission inventories, respectively. Using the referred scheme from [49], dust emission fluxes are calculated online when the three following conditions are satisfied: (1) 10 m wind speeds higher than 6.5 m/s; (2) soil moisture lower than the threshold value; (3) snow cover lower than 1 kg/m2 [38,50]. Aerosol sink processes are parameterized, including dry deposition, wet deposition, and gravitational settling processes [36]. To reduce the influence of meteorology field errors on the model simulation, the analytical National Centers for Environmental Prediction (NCEP) Final (FNL) data are used to nudge the predicted wind and temperature fields during the simulation.

3.2. Data assimilation Methodology

We implemented the local ensemble transform Kalman filter (LETKF) with a four-dimensional extension [25,51,52] to assimilate GCOM-C AOTs observations, which permits the optimization of model-predicted aerosol trajectories over the assimilation time window with the asynchronous observation. The model state was optimized with the LETKF assimilation scheme according to the four formulas below:
x ¯ a = x ¯ b + X b w ¯ a
w ¯ a = P ˜ a ( Y b ) T R 1 ( y o y ¯ b )
P ˜ a = [ ( k 1 ) I + Y b T R 1 Y b ] 1
X a = X b [ ( k 1 ) P ˜ a ] 1 / 2 = X b W a
where x ¯ b and x ¯ a represent the background-state estimate and analysis-state estimate, respectively; matrix X b represents the background ensemble perturbation; the weight vector w ¯ a specifies a linear combination of the background ensemble perturbation to obtain the analysis state estimate in model space by adding to the background state estimate; the vectors y ¯ b and y o represent the vector of the background observation mean and the vector of the assimilated observation, respectively; R , H , and I represent the observation error covariance matrix, observation operator, and identity matrix, respectively; and the ensemble background observation y b ( i ) is calculated by applying H to the background ensemble as y b ( i ) = H ( x b ( i ) ) . The matrix Y b represents the ensemble background observation perturbation. The analysis ensemble perturbation X a is obtained as the multiple of matrices X b and W a , which continuously depends on analysis error covariance P ˜ a . To avoid frequently switching between background ensemble predictions and assimilation and asynchronous assimilating GCOM-C observations, the 4D-LETKF scheme considers approximate model trajectories using linear combinations of the background ensemble trajectories with similar initial conditions over a time interval [51]. Cheng et al. [29] and Dai et al. [25] give the details of this data assimilation system.
Three-dimensional aerosol mass mixing ratios in fine and coarse modes were the optimized state vectors used in the data assimilation system [30,50]. The fine mode included sulfate and carbonaceous aerosols, while the coarse mode included the soil dust and sea salt aerosols. As the observables were spectral optical thicknesses that were different from optimized state vectors, the observation operator H was used to convert aerosol mass mixing ratios into AOT space. The simulated AOT at wavelength λ was calculated according to linear operator A O T ( λ ) = j = 1 n ( β ( λ ) Δ M d j ) , where M d j is the dry mass concentration of the aerosol in each model layer and β is the prescribed aerosol mass extinction coefficient calculated using Mie scattering theory. Then, the optimal weight, which was determined by the model error covariance matrix and observational error covariance, combined the model-predicted state vector and the observed state vector to produce the updated aerosol mass mixing ratios. Aerosol mass mixing ratios in fine and coarse modes were determined after data assimilation according to their proportions in the background ensemble [46]. Lastly, the updated aerosol mass mixing ratios were used as initial conditions for the next assimilation cycle.
To generate an ensemble simulation with 20 members, the aerosol emissions at every integration step for each model grid were randomly perturbed in a spatially dependent manner to create the model ensemble member. Perturbations for each ensemble member were generated from lognormal distribution, with a mean value of 1 and variance of assumed uncertainty. Sea salt emission was randomly perturbed with 500% uncertainty [25,53,54,55] and 100% uncertainty was applied to natural dust as in our previous study [29,53]. The emission uncertainties were 130% for sulfate precursors SO2 and 350% for carbonaceous aerosols [25,55]. Perturbations were assumed to be constant in space and time to generate a sufficient model spread [45]. Using a localization technique, 4D-LETKF was used to explore a much higher-dimensional space and reduce the effects of spurious covariances with distance [56]. The horizontal localization factor f ( r ) is defined as f ( r ) = exp ( r 2 / 2 σ 2 ) with Gaussian features, where r is the distance between the model grid and the position of its assimilated observations in the grid space and σ is the horizontal localization scale [52]. Following Gaspari and Cohn [57], a fifth-order piecewise rational function was used to truncate the infinitely long tails of the Gaussian function. The influences of the observations decreased to zero at 3.65 times the localization scale and observations beyond this distance were not used for data assimilation.
The aerosol-coupled NICAM with the 4D-LETKF was adopted to investigate the aerosol processes and features over East Asia during March 2018, when a strong dust storm event was recorded [13,23]. Two experiments were conducted to reveal the influences of assimilating GCOM-C AOT retrievals on aerosol simulations. One was a simulation without data assimilation, which was used as the reference (FR simulation), while the other was a simulation with assimilating hourly mean AOTs derived from GCOM-C retrievals (DA simulation). The experiments were conducted for 4 days from 00:00 UTC on 28 March to 00:00 UTC on 1 April. The experiments were first initialized from 00:00 UTC on 1 March 2018 using the unmodified emissions without assimilation as a cold start for 22 days, then the experiments were spun up using perturbed emissions with 20-member ensemble assimilation from 00:00 UTC on 23 March 2018 as a warm start for 5 days. According to the 6 h assimilation window, the system performed the ensemble forecast for 6 h with an output every hour. According to Cheng et al. [29], 200 km was set as the horizontal localization scale in this study.

4. Results

4.1. Sanity Check with GCOM-C AOTs

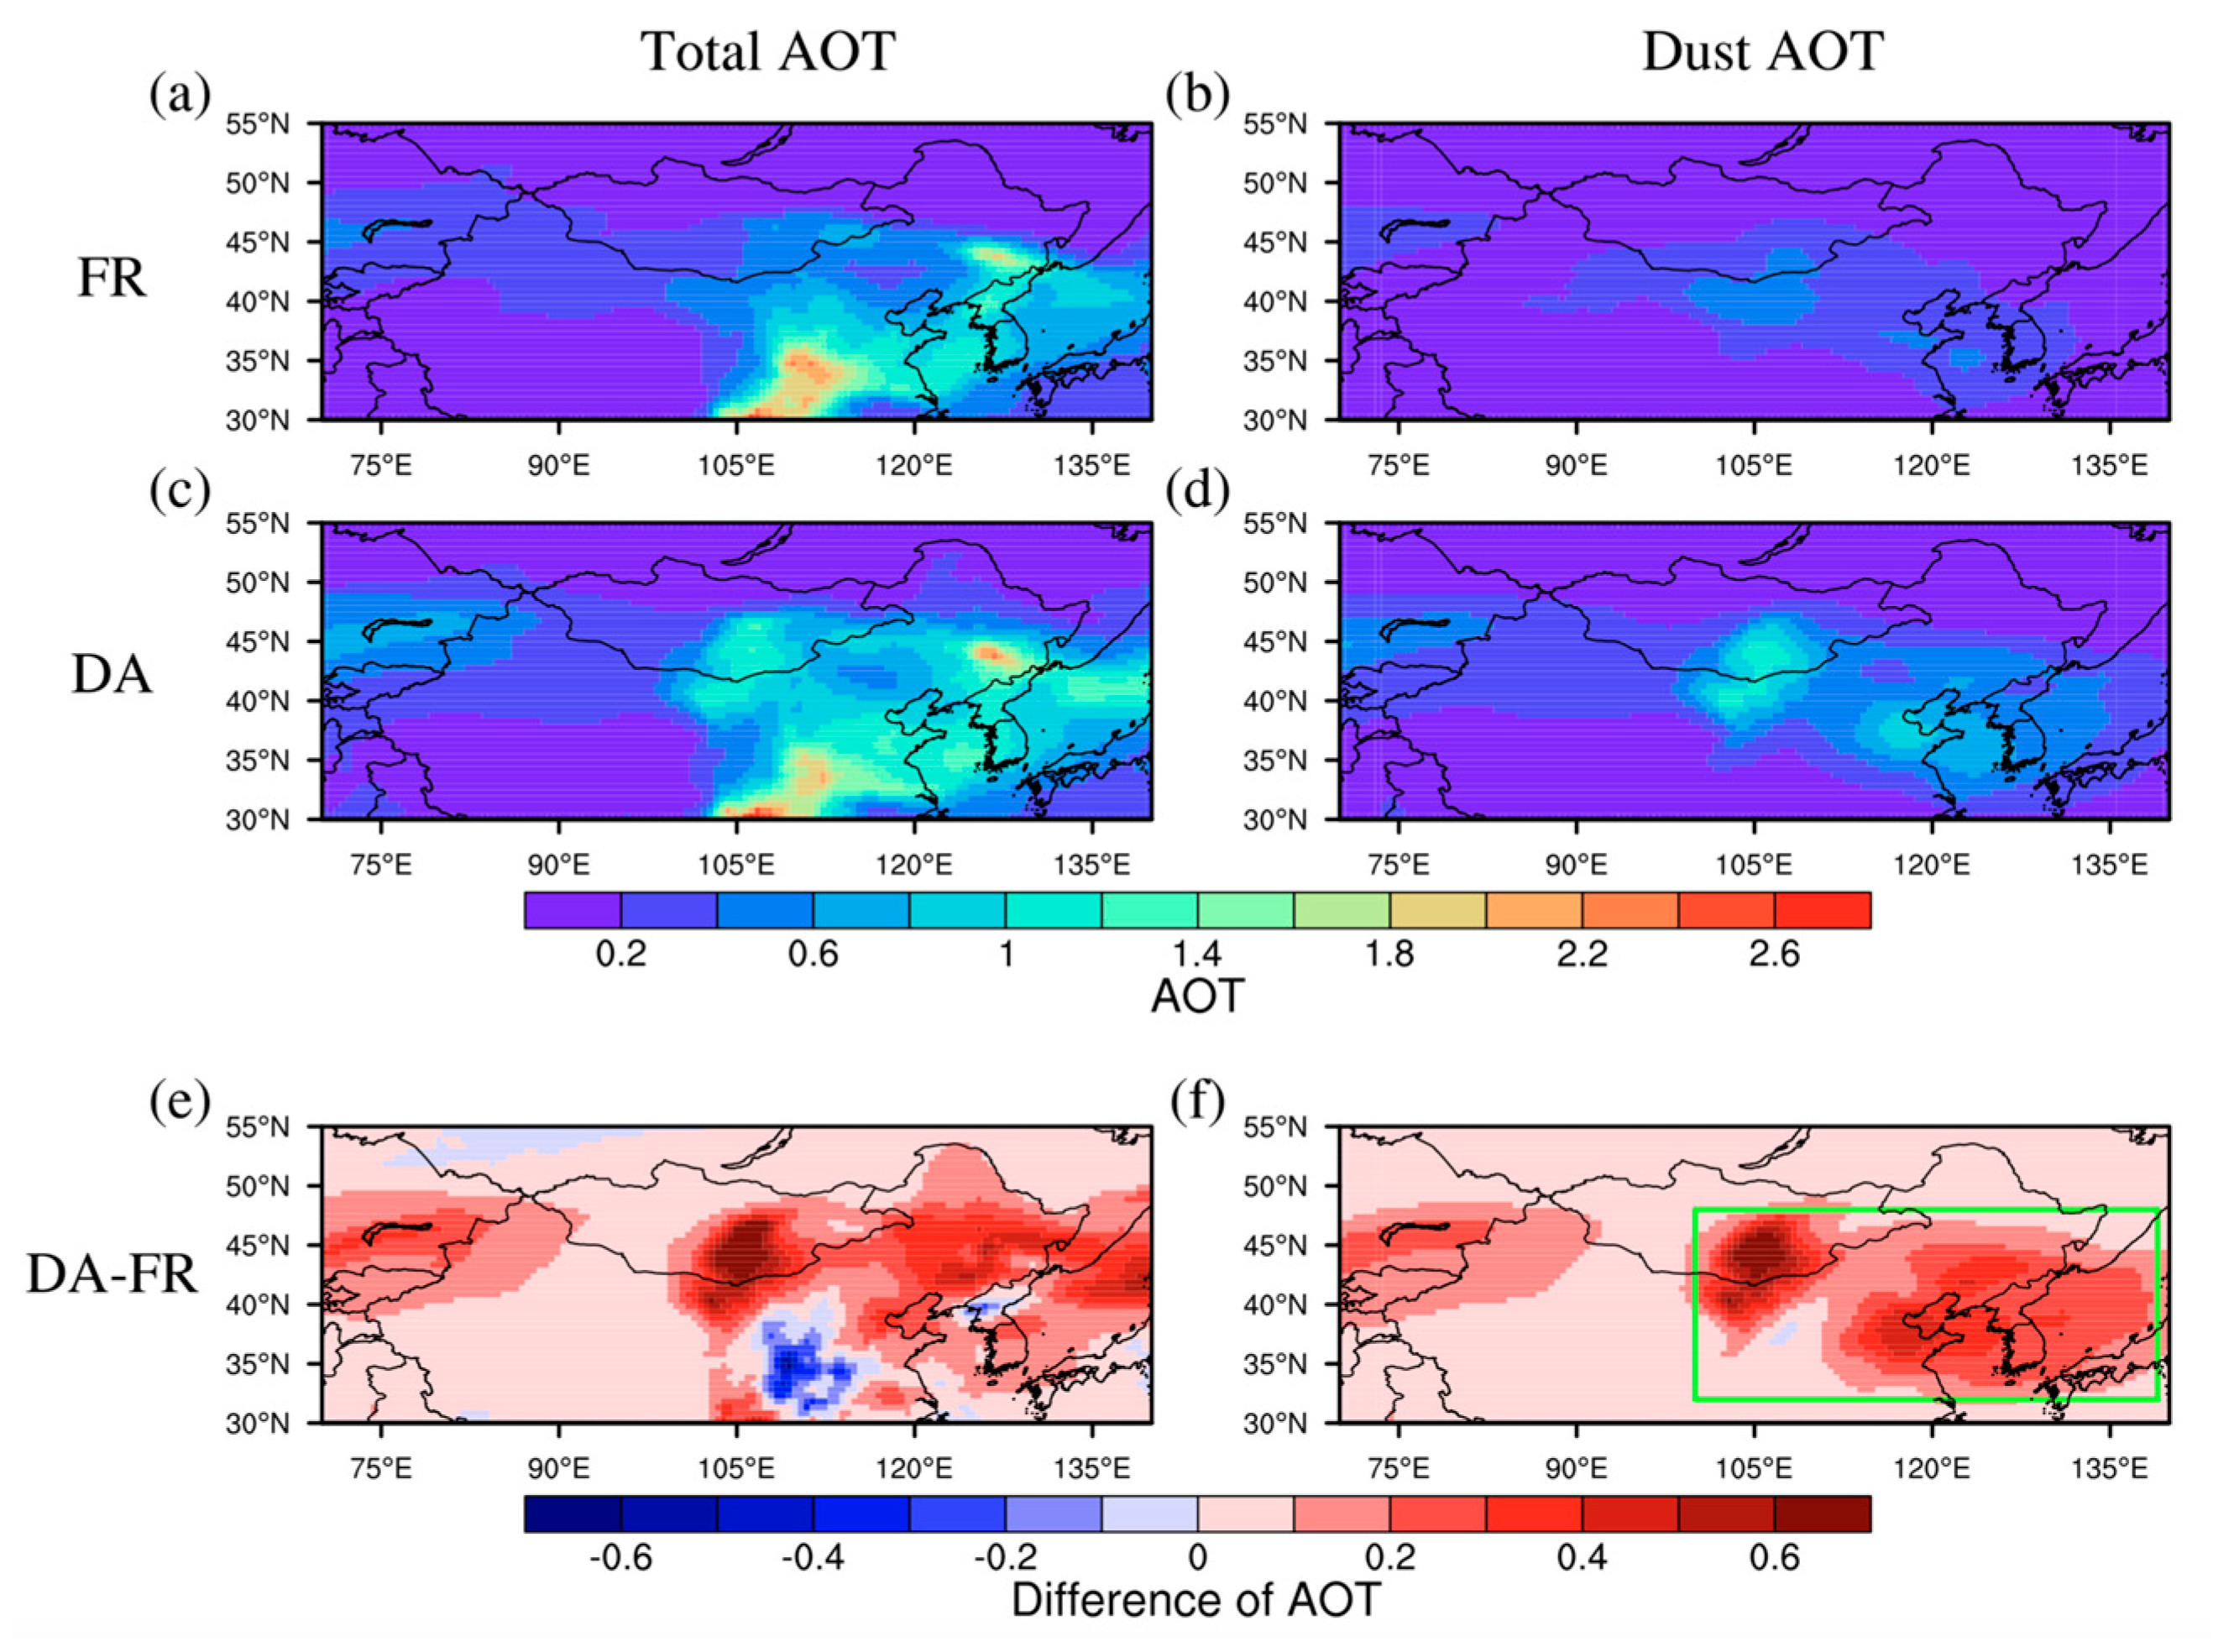
In this section, we first present the simulated AOTs in the FR and DA experiments and their differences during the whole assimilation period (28–31 March 2018) in Figure 2. The simulated AOTs with data assimilation were higher than those without data assimilation over the dust transport path, such as for Tianshan Mountain, the Mongolian Plateau, and Northeast China. The spatial distribution of the AOT increments with data assimilation is generally consistent with that of dust AOTs, indicating the dust dominants the aerosols in these areas during this period; therefore, we focus on these key areas for the studies of the Asian dust storm (shown as a green rectangle in Figure 2).
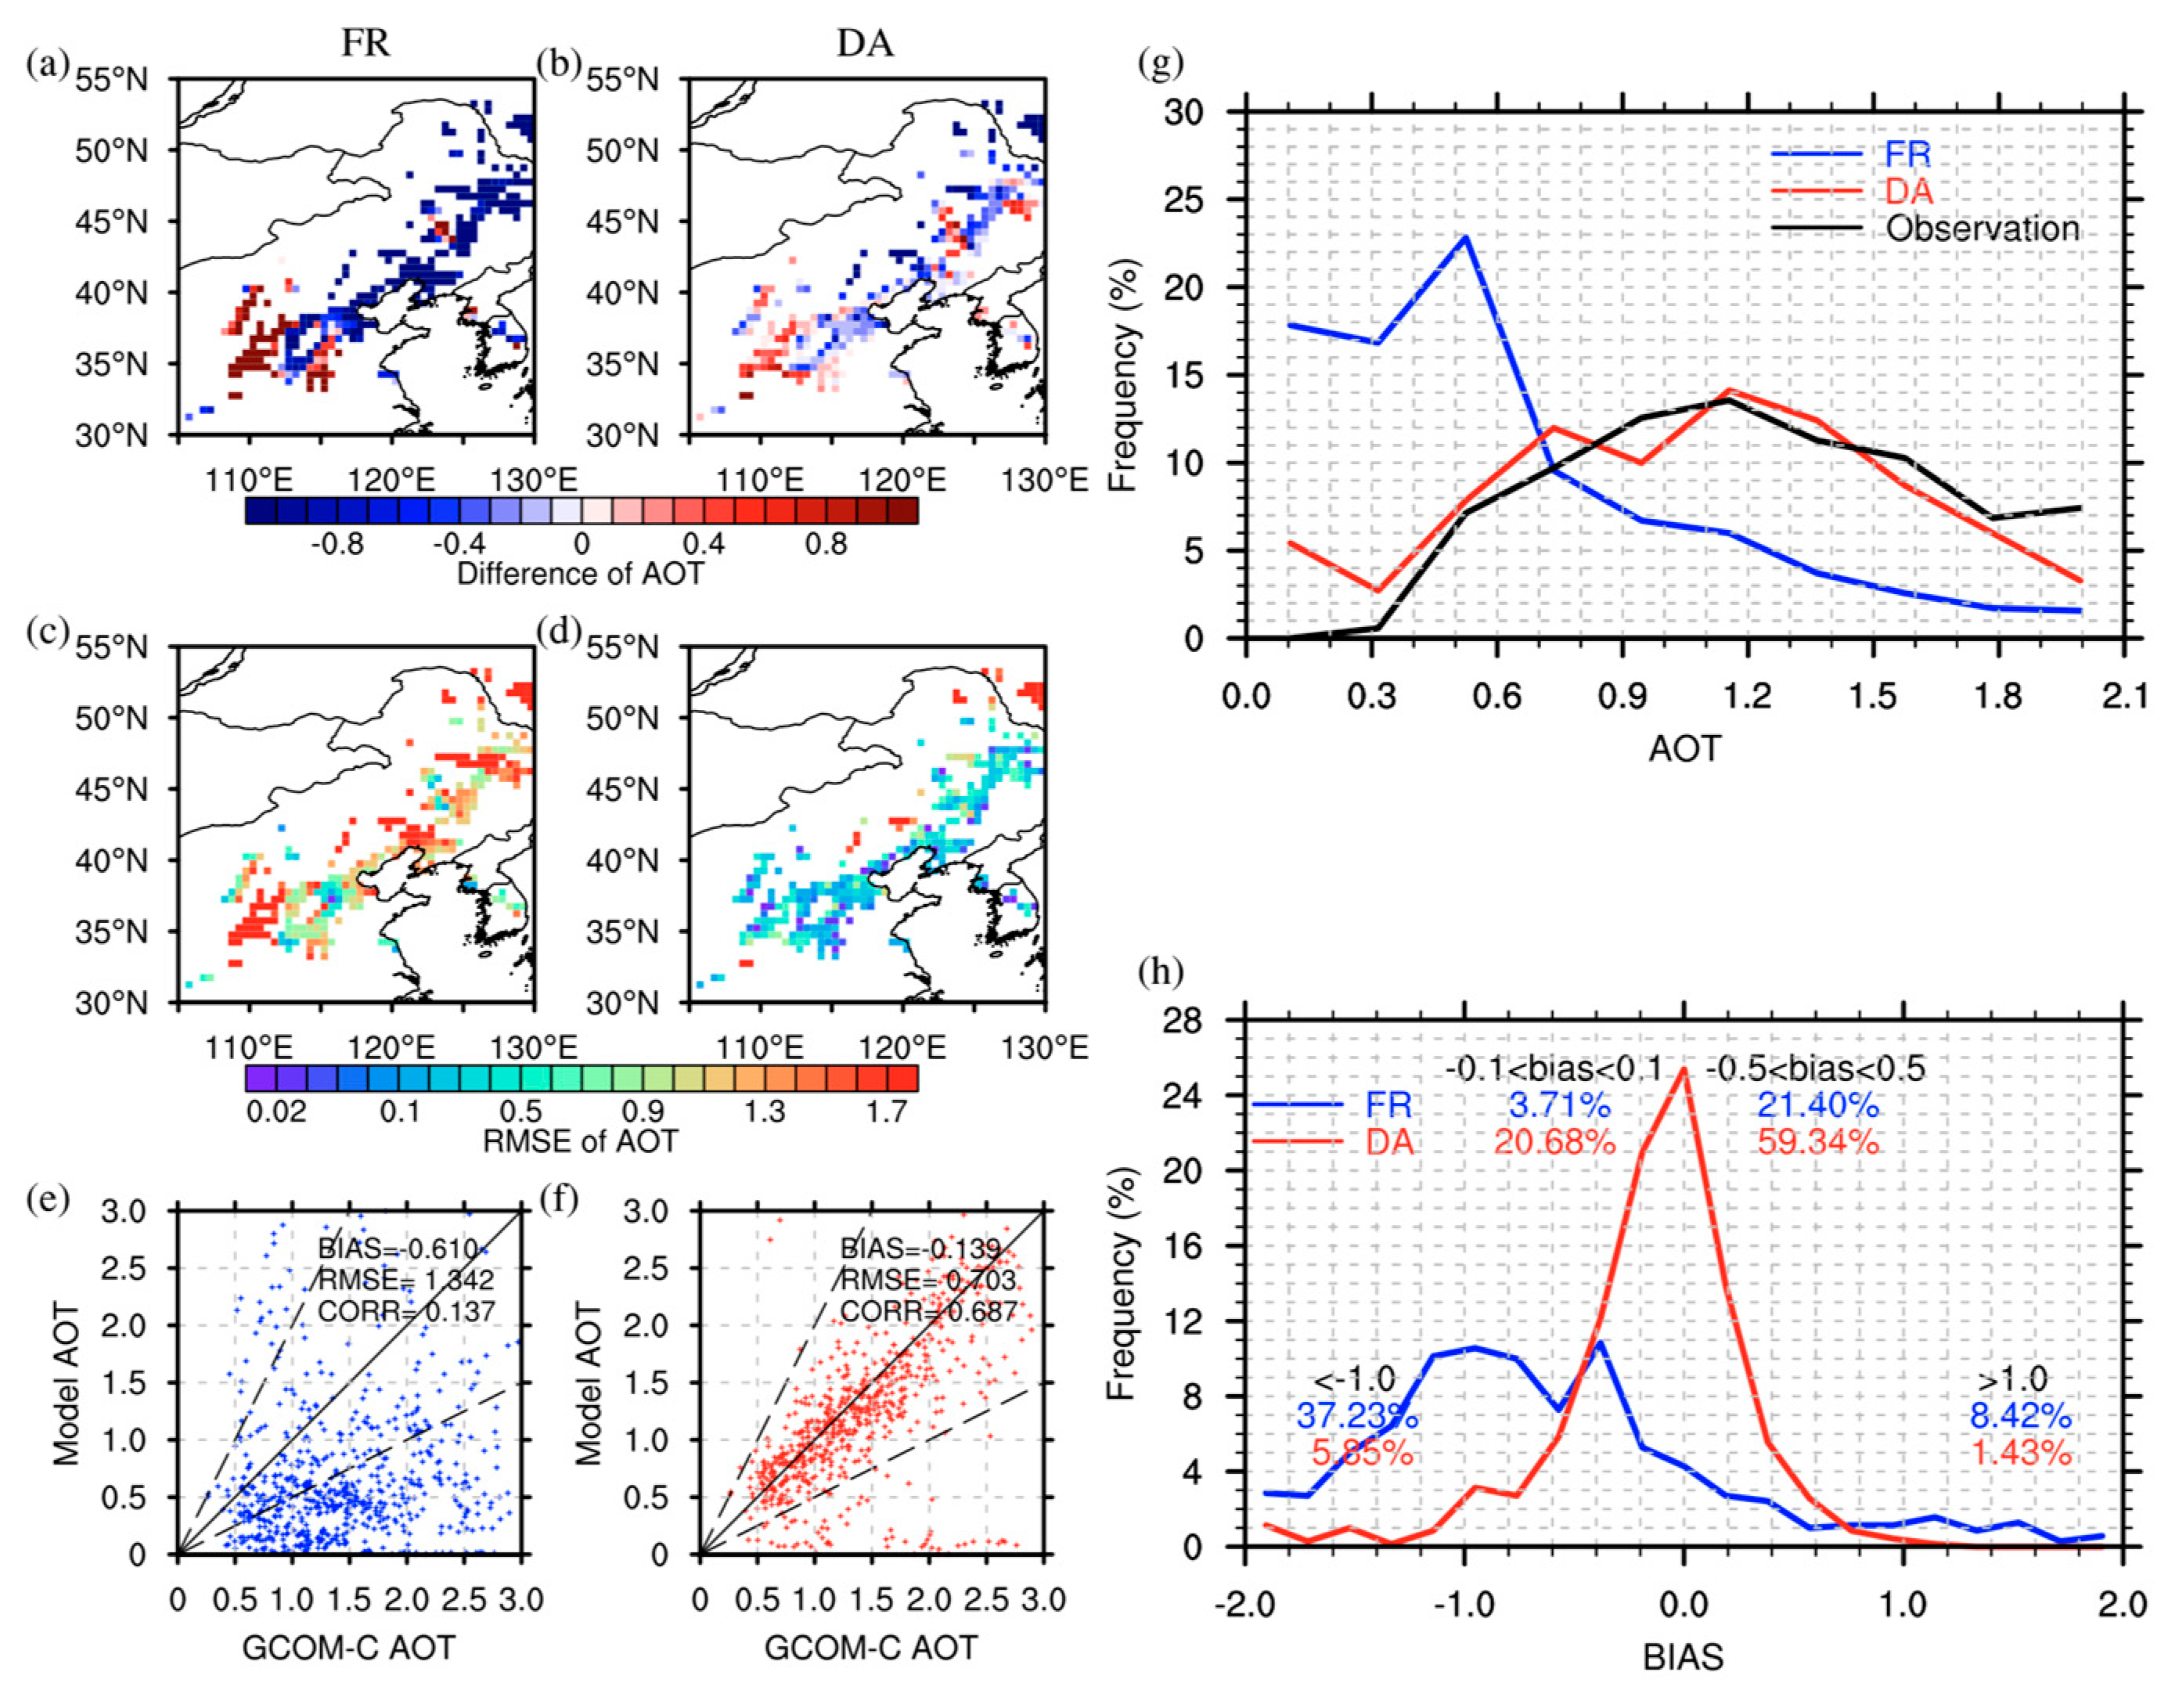
To assess the influences of assimilating GCOM-C AOTs on the modelled fields, Figure 3 shows the biases and root mean square errors (RMSEs) between the simulated and GCOM-C-observed AOTs. Such comparisons are considered to be “sanity checks” to directly determine the effects of aerosol assimilation on the model simulations [29]. Bias and RMSE between the modelled and observed AOTs were reduced from −0.610 and 1.342 to 0.139 and 0.703 with DA. The correlation between simulated and observed field was significantly increased from 0.137 to 0.687 by leveraging new GCOM-C satellite information, indicating the more reasonable horizontal distribution of aerosols. The probability distribution of the observed AOTs was symmetric around 1.2, while the probability distribution of the simulated AOTs in the DA experiment was generally consistent with that of the GCOM-C-observed ones; however, the simulated AOTs in the FR experiment peaked at around 0.5. The probability distribution of AOTs biases without GCOM-C data assimilation showed significantly negative biases, while the one in the DA experiment with a peak of 25.39% was generally symmetrical and more compressed at the value of 0. Merely 3.71% and 21.40% of the AOTs biases were within ±0.1 and ±0.5 in the FR experiment, whereas 20.68% and 59.34% of the biases were achieved within ±0.1 and ±0.5 in the DA experiment. These diagnostics of the posterior AOTs in the DA experiment demonstrate that assimilating GCOM-C AOTs can significantly improve modelled AOTs, even if the model tends to underestimate the AOTs in that region.

4.2. Verification with Independent AERONET Observations

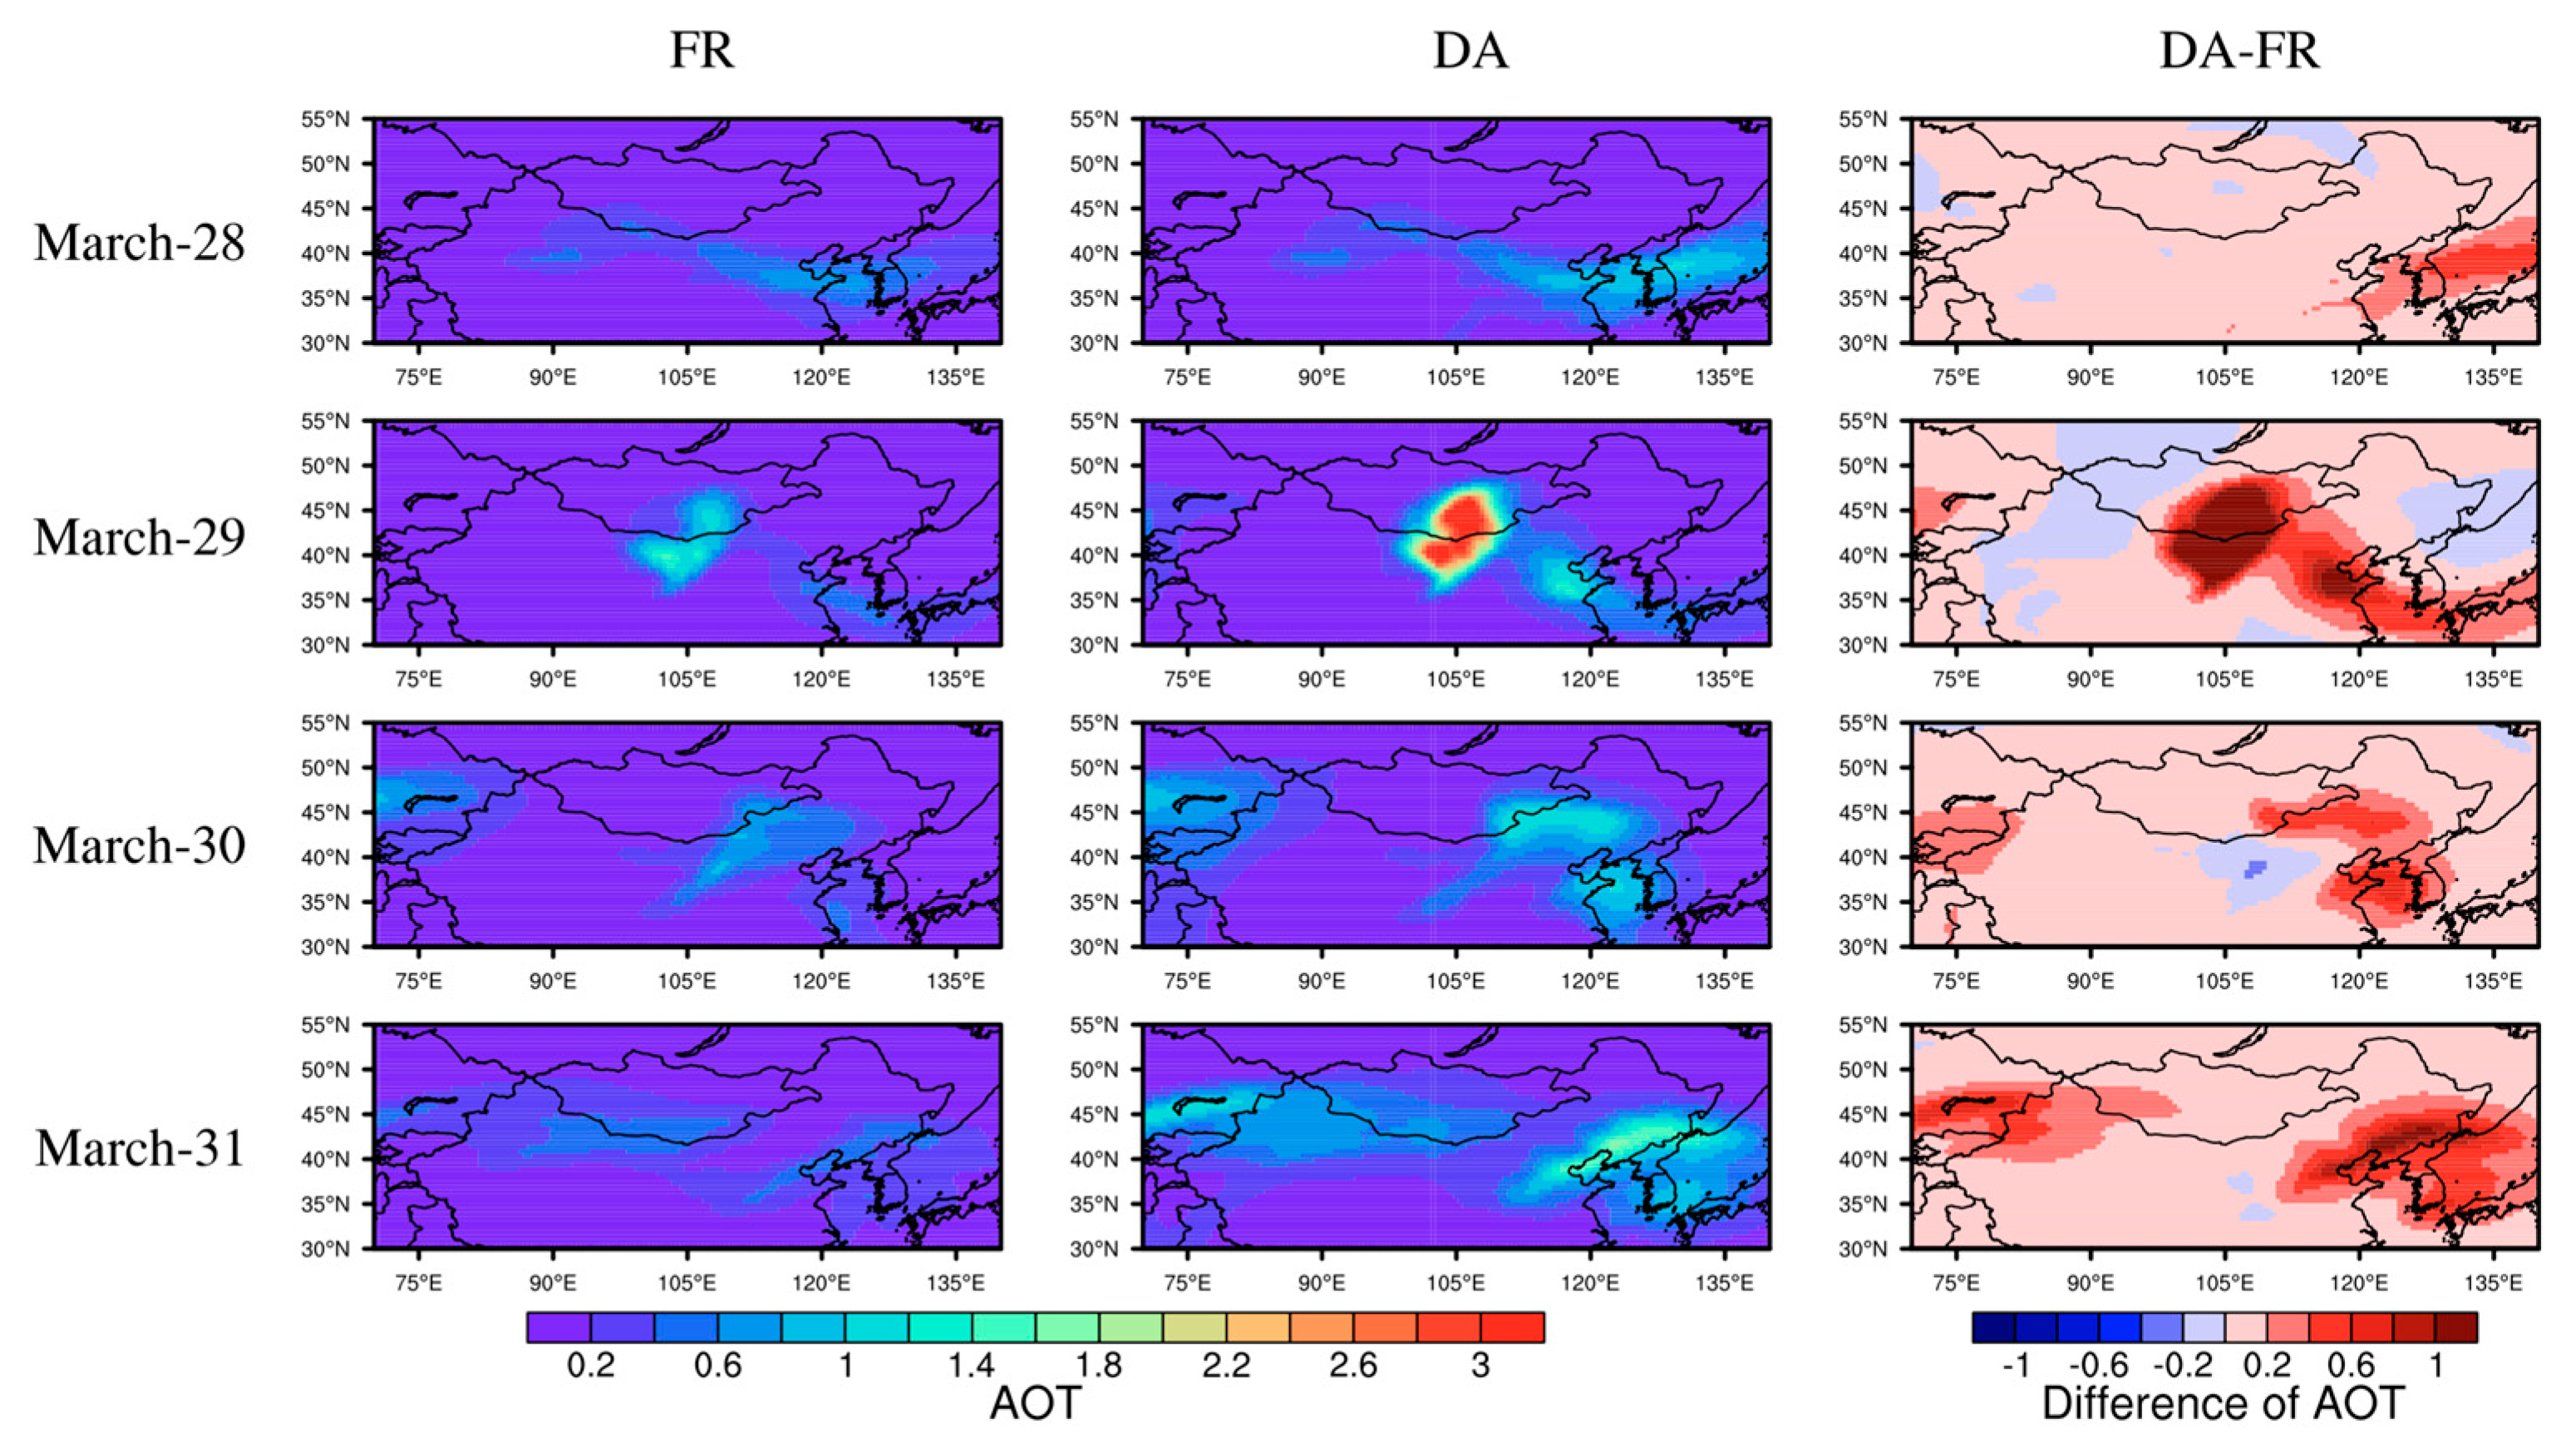
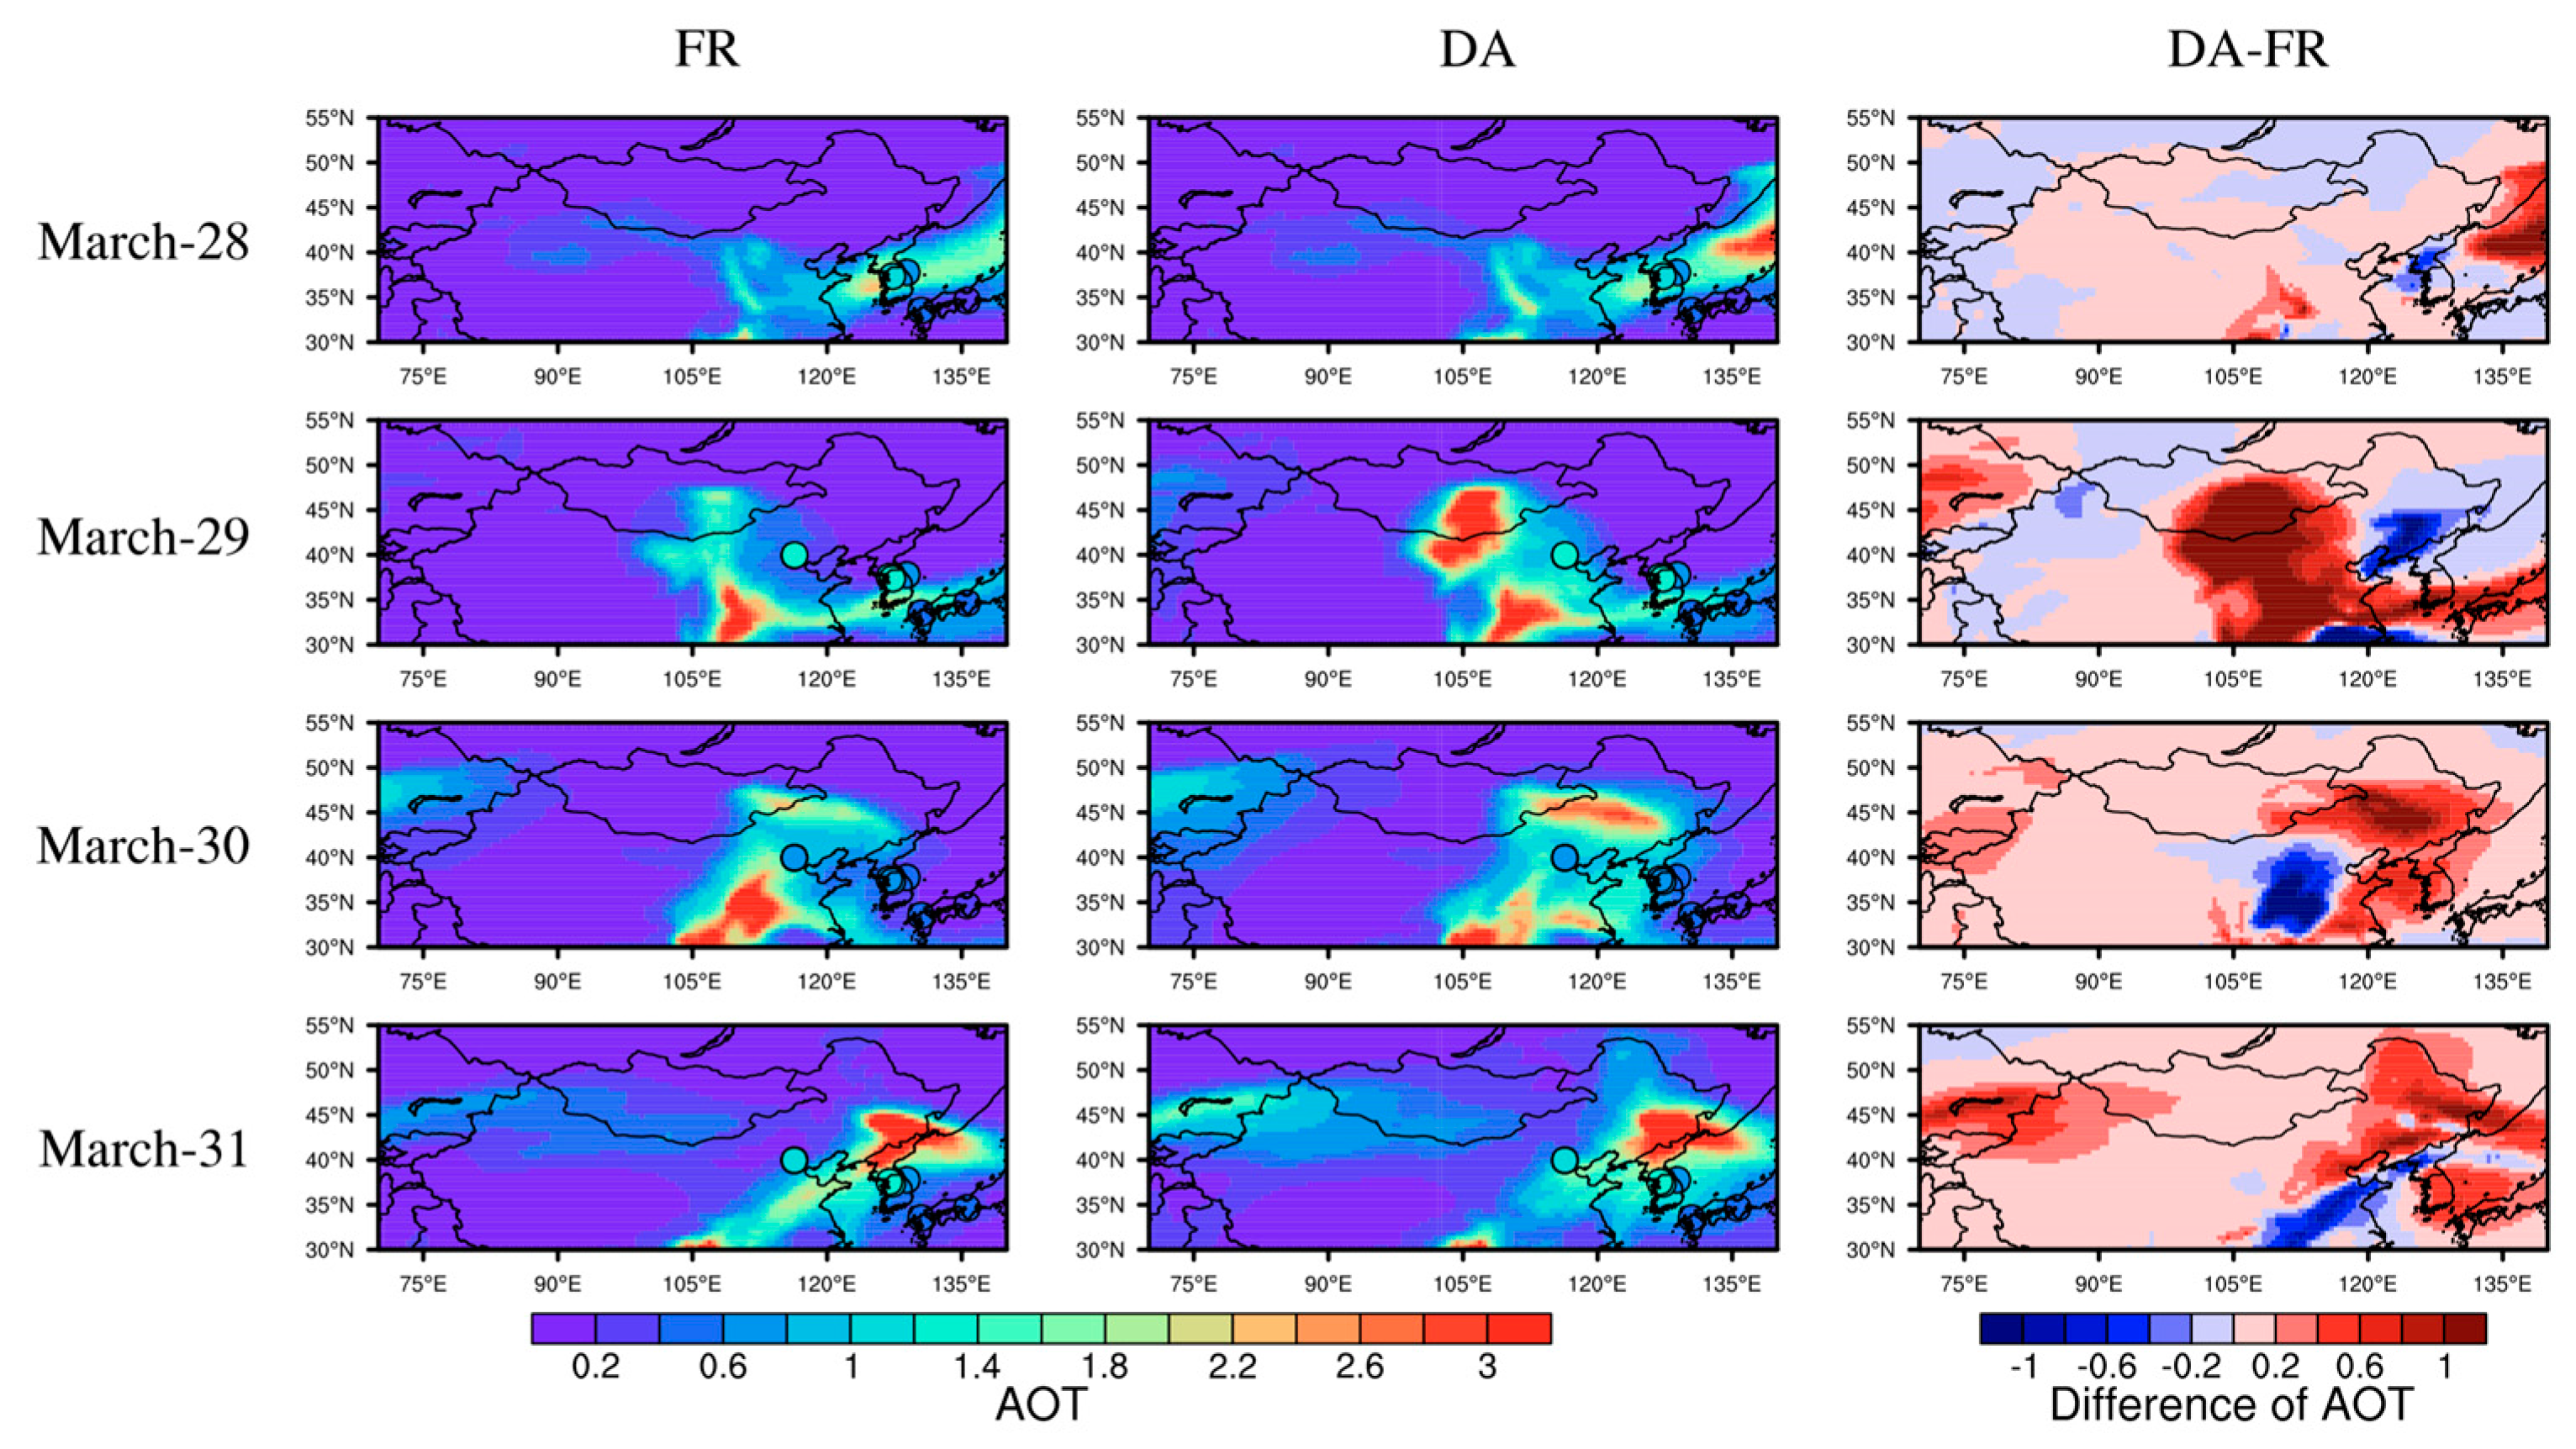
Figure 4 and Figure 5 give the spatial distributions of daily mean dust AOTs and total AOTs simulated in the FR and DA experiments, respectively. The daily mean AOTs in “dusty” stations from AERONET are also shown in Figure 5. Here, daily mean dust AOTs represent the daily mean AOTs of dust aerosols, while total AOTs represent the sum of the daily mean AOTs of all dust, sea salt, sulfate, and carbonaceous aerosols. The spatial distributions of AOTs simulated by the two experiments in the four days both show the dust transportation from the Gobi and Taklimakan Deserts to downwind areas, including the North China Plain, Korean Peninsula, and Western Japan. The spatial distributions of dust AOTs on 30 March revealed that dusts emitted from the Gobi Desert moved eastwards towards Eastern China and the North China Plain, and there was evidence of a dust front in the Yellow Sea. On 31 March, the dust storms from the Sahara Desert and Central Asia were transported across Eurasia and probably mixed with the Asian dust storms. During the four days, the daily mean dust AOTs after GCOM-C data assimilation were significantly higher than the ones in the FR experiment. Dust AOTs on 29 March around the Gobi Desert were significantly strengthened with aerosol data assimilation. Figure 5 shows that the total AOTs simulated by DA experiment were more consistent with the AERONET-observed ones, indicating that GCOM-C aerosol data assimilation contributed to the reproduction of the aerosol processes during this dust event. On 28 March, the total AOTs around the Korean Peninsula in the FR experiment were overestimated compared with AERONET AOTs, which is probably due to the anthropogenic aerosol emission inventory used in this study was developed in 2010 rather than in 2018. Data assimilation corrected these overestimations and drove the simulations closer to observations. From 29 to 31 March, simulated total AOTs in FR experiments over the Beijing site are clearly lower than those observed by the AERONET. AOT underestimations were significantly reduced in the DA experiment, indicating that the simulated dust processes in the DA experiment were more authentic than those in the FR experiment. Moreover, the simulated AOTs over South Japan on 30 and 31 March were also significantly improved by the GCOM-C AOT data assimilation.
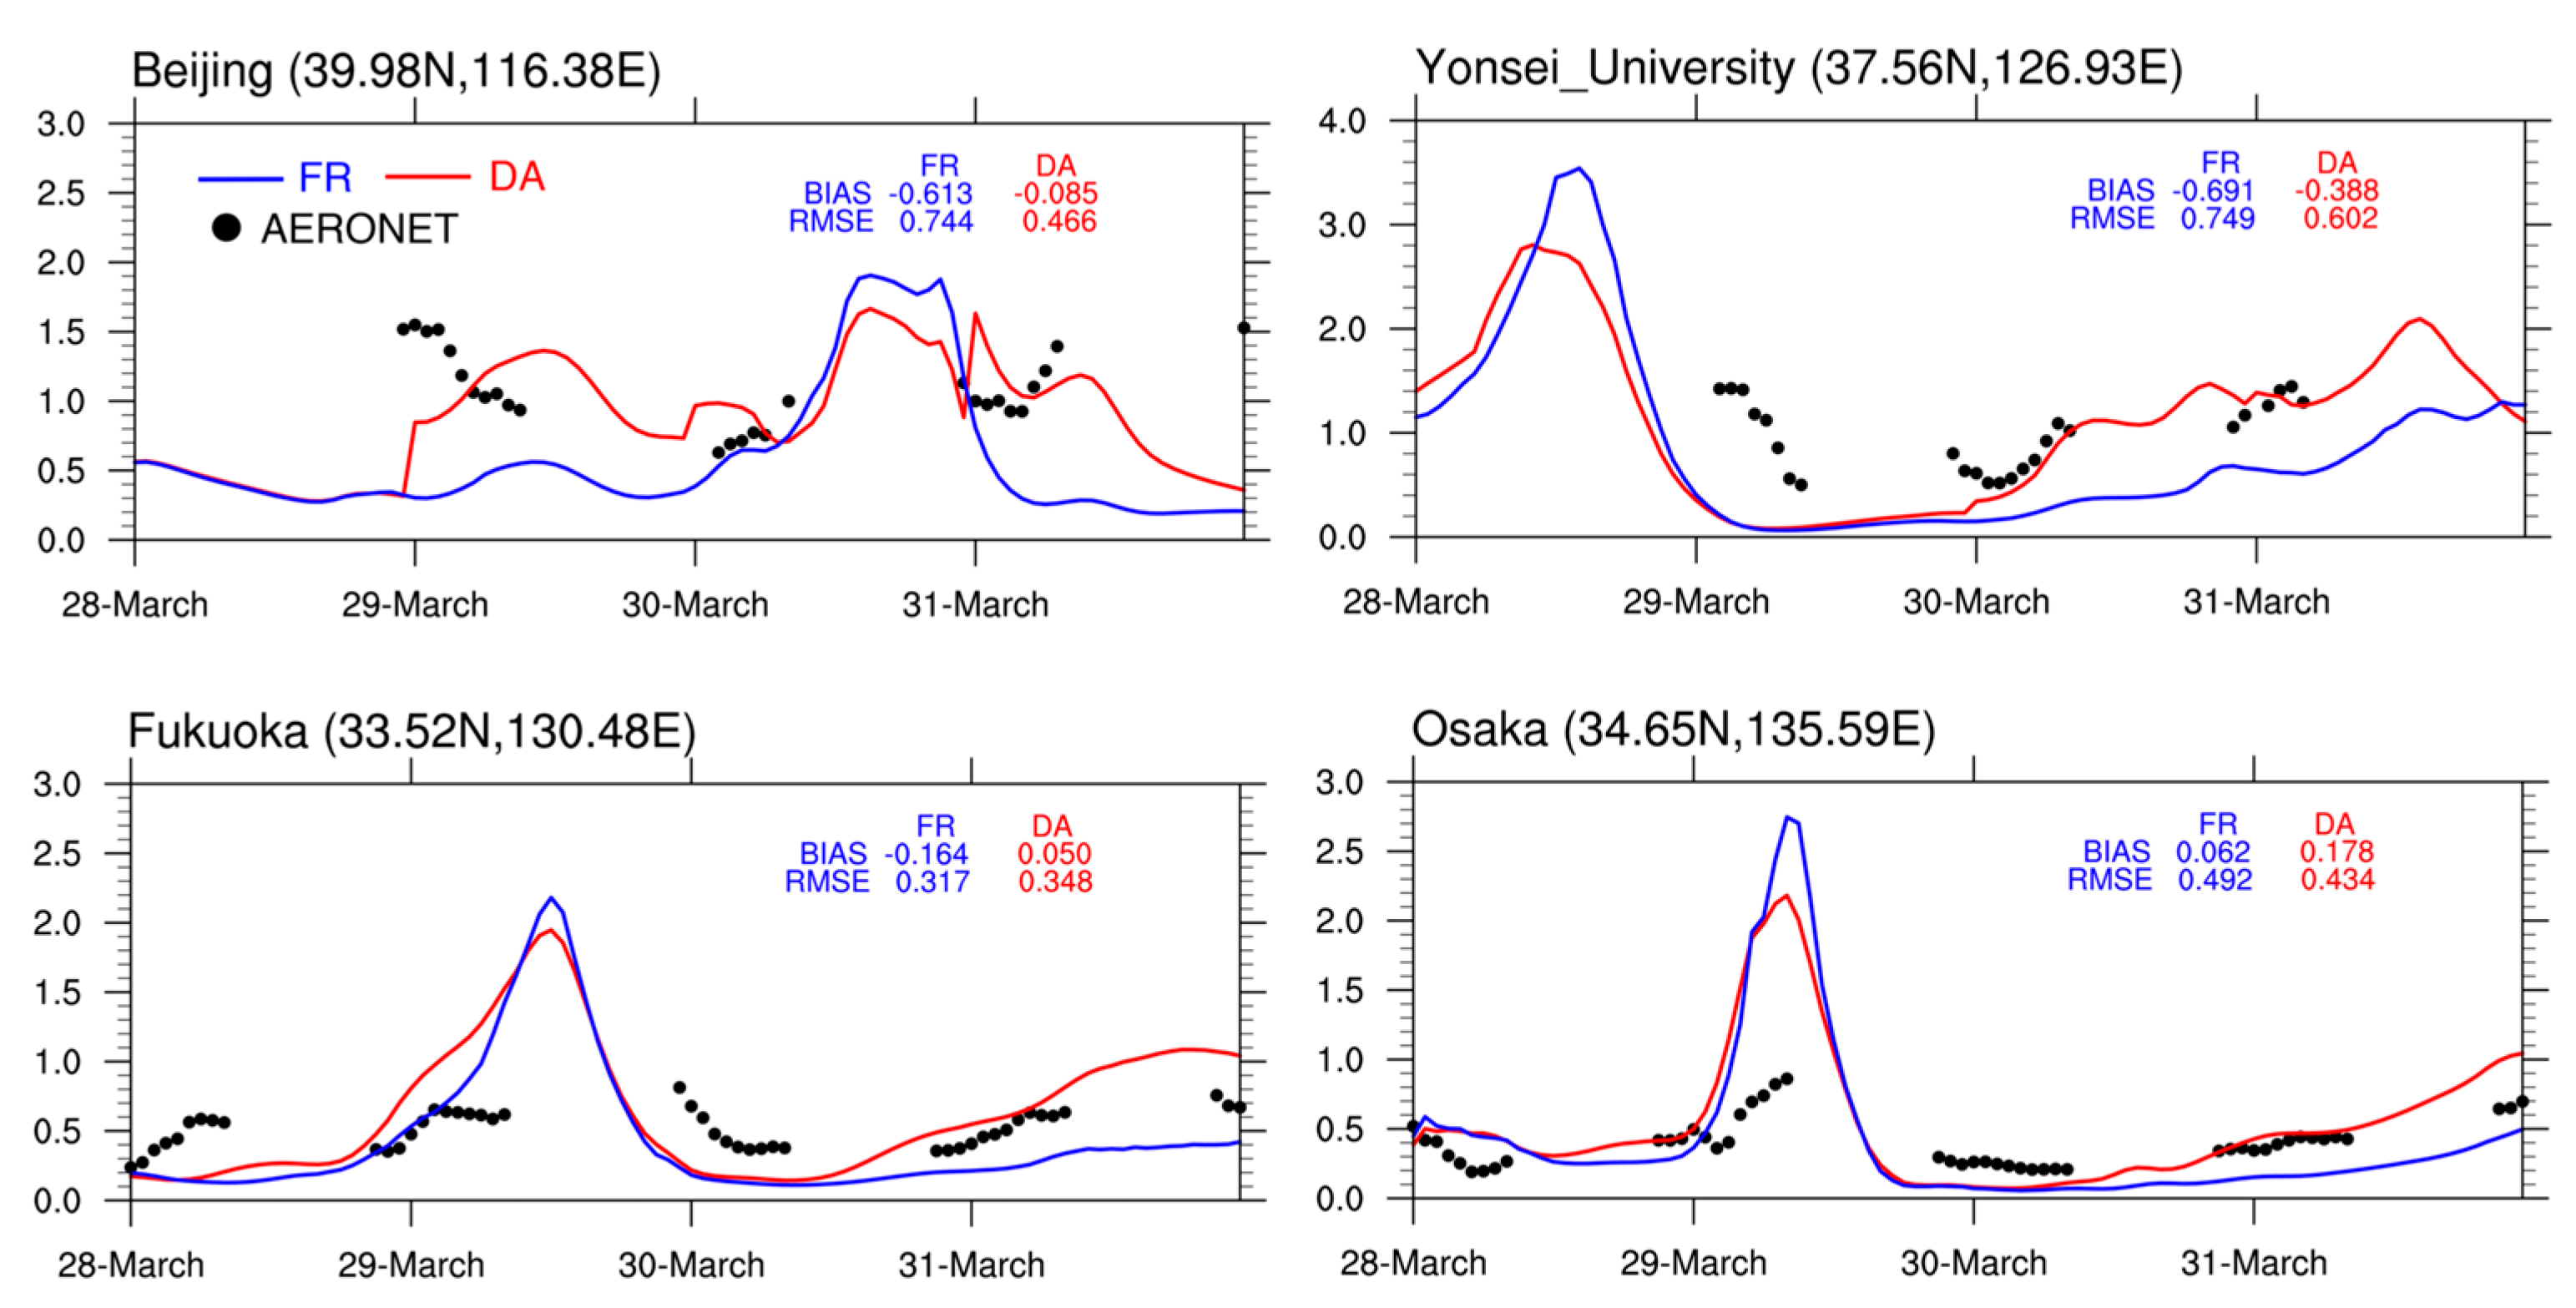
Figure 6 shows further evaluations of the temporal variations of AOTs for the two experiments using the AERONET-retrieved AOTs at Beijing, Yonsei University, Fokuoka, and Osaka sites. The Beijing site (39.98° N, 116.38° E) is located in the northern part of the North China Plain. The Yonsei University site (37.56° N, 126.93° E) is located about 3 km west of Seoul, which represents the aerosol background status of a megacity. Fokuoka (33.52° N, 130.48° E) and Osaka (34.65° N, 135.59° E) sites are both located in western Japan near the Korean Peninsula. Assimilation generally provides improvements in all statistical metrics. The RMSE (bias) over the Beijing site was reduced from 0.744 (−0.613) to 0.466 (−0.085) by GCOM-C AOT assimilation. On 31 March, AOTs in the FR experiment were monotonously decreased with time, whereas the DA experiment slightly reproduced the rapid growth of the observed AOTs during the daytime. As suggested by the decreased bias and RMSE values from −0.691 and 0.749 in the FR experiment to −0.388 and 0.602 in the DA experiment, AOTs in Yonsei University from 30 to 31 March were more in accordance with the AERONET observations. Over both the Fukuoka and Osaka sites, the DA experiment successfully corrected AOT underestimations from 30 to 31 March, resulting in the AOTs simulations being in accordance with the AERONET observations and contributing to the improvement of the correlation between simulated and observed AOTs; however, this improvement was limited on 29 March, particularly due to the lack of available GCOM-C observations over Northeast China for assimilation. Over the Fukuoka site, the negative bias of −0.164 in the FR experiment was sharply reduced to 0.050 in the DA experiment, whereas the RMSE was increased from 0.317 to 0.348. Statistical metrics over the Osaka site also showed the opposite trend—the bias of 0.062 was increased to 0.178, whereas the RMSE decreased from 0.492 to 0.434.

4.3. Vertical Structure of Aerosol Extinction Coefficients

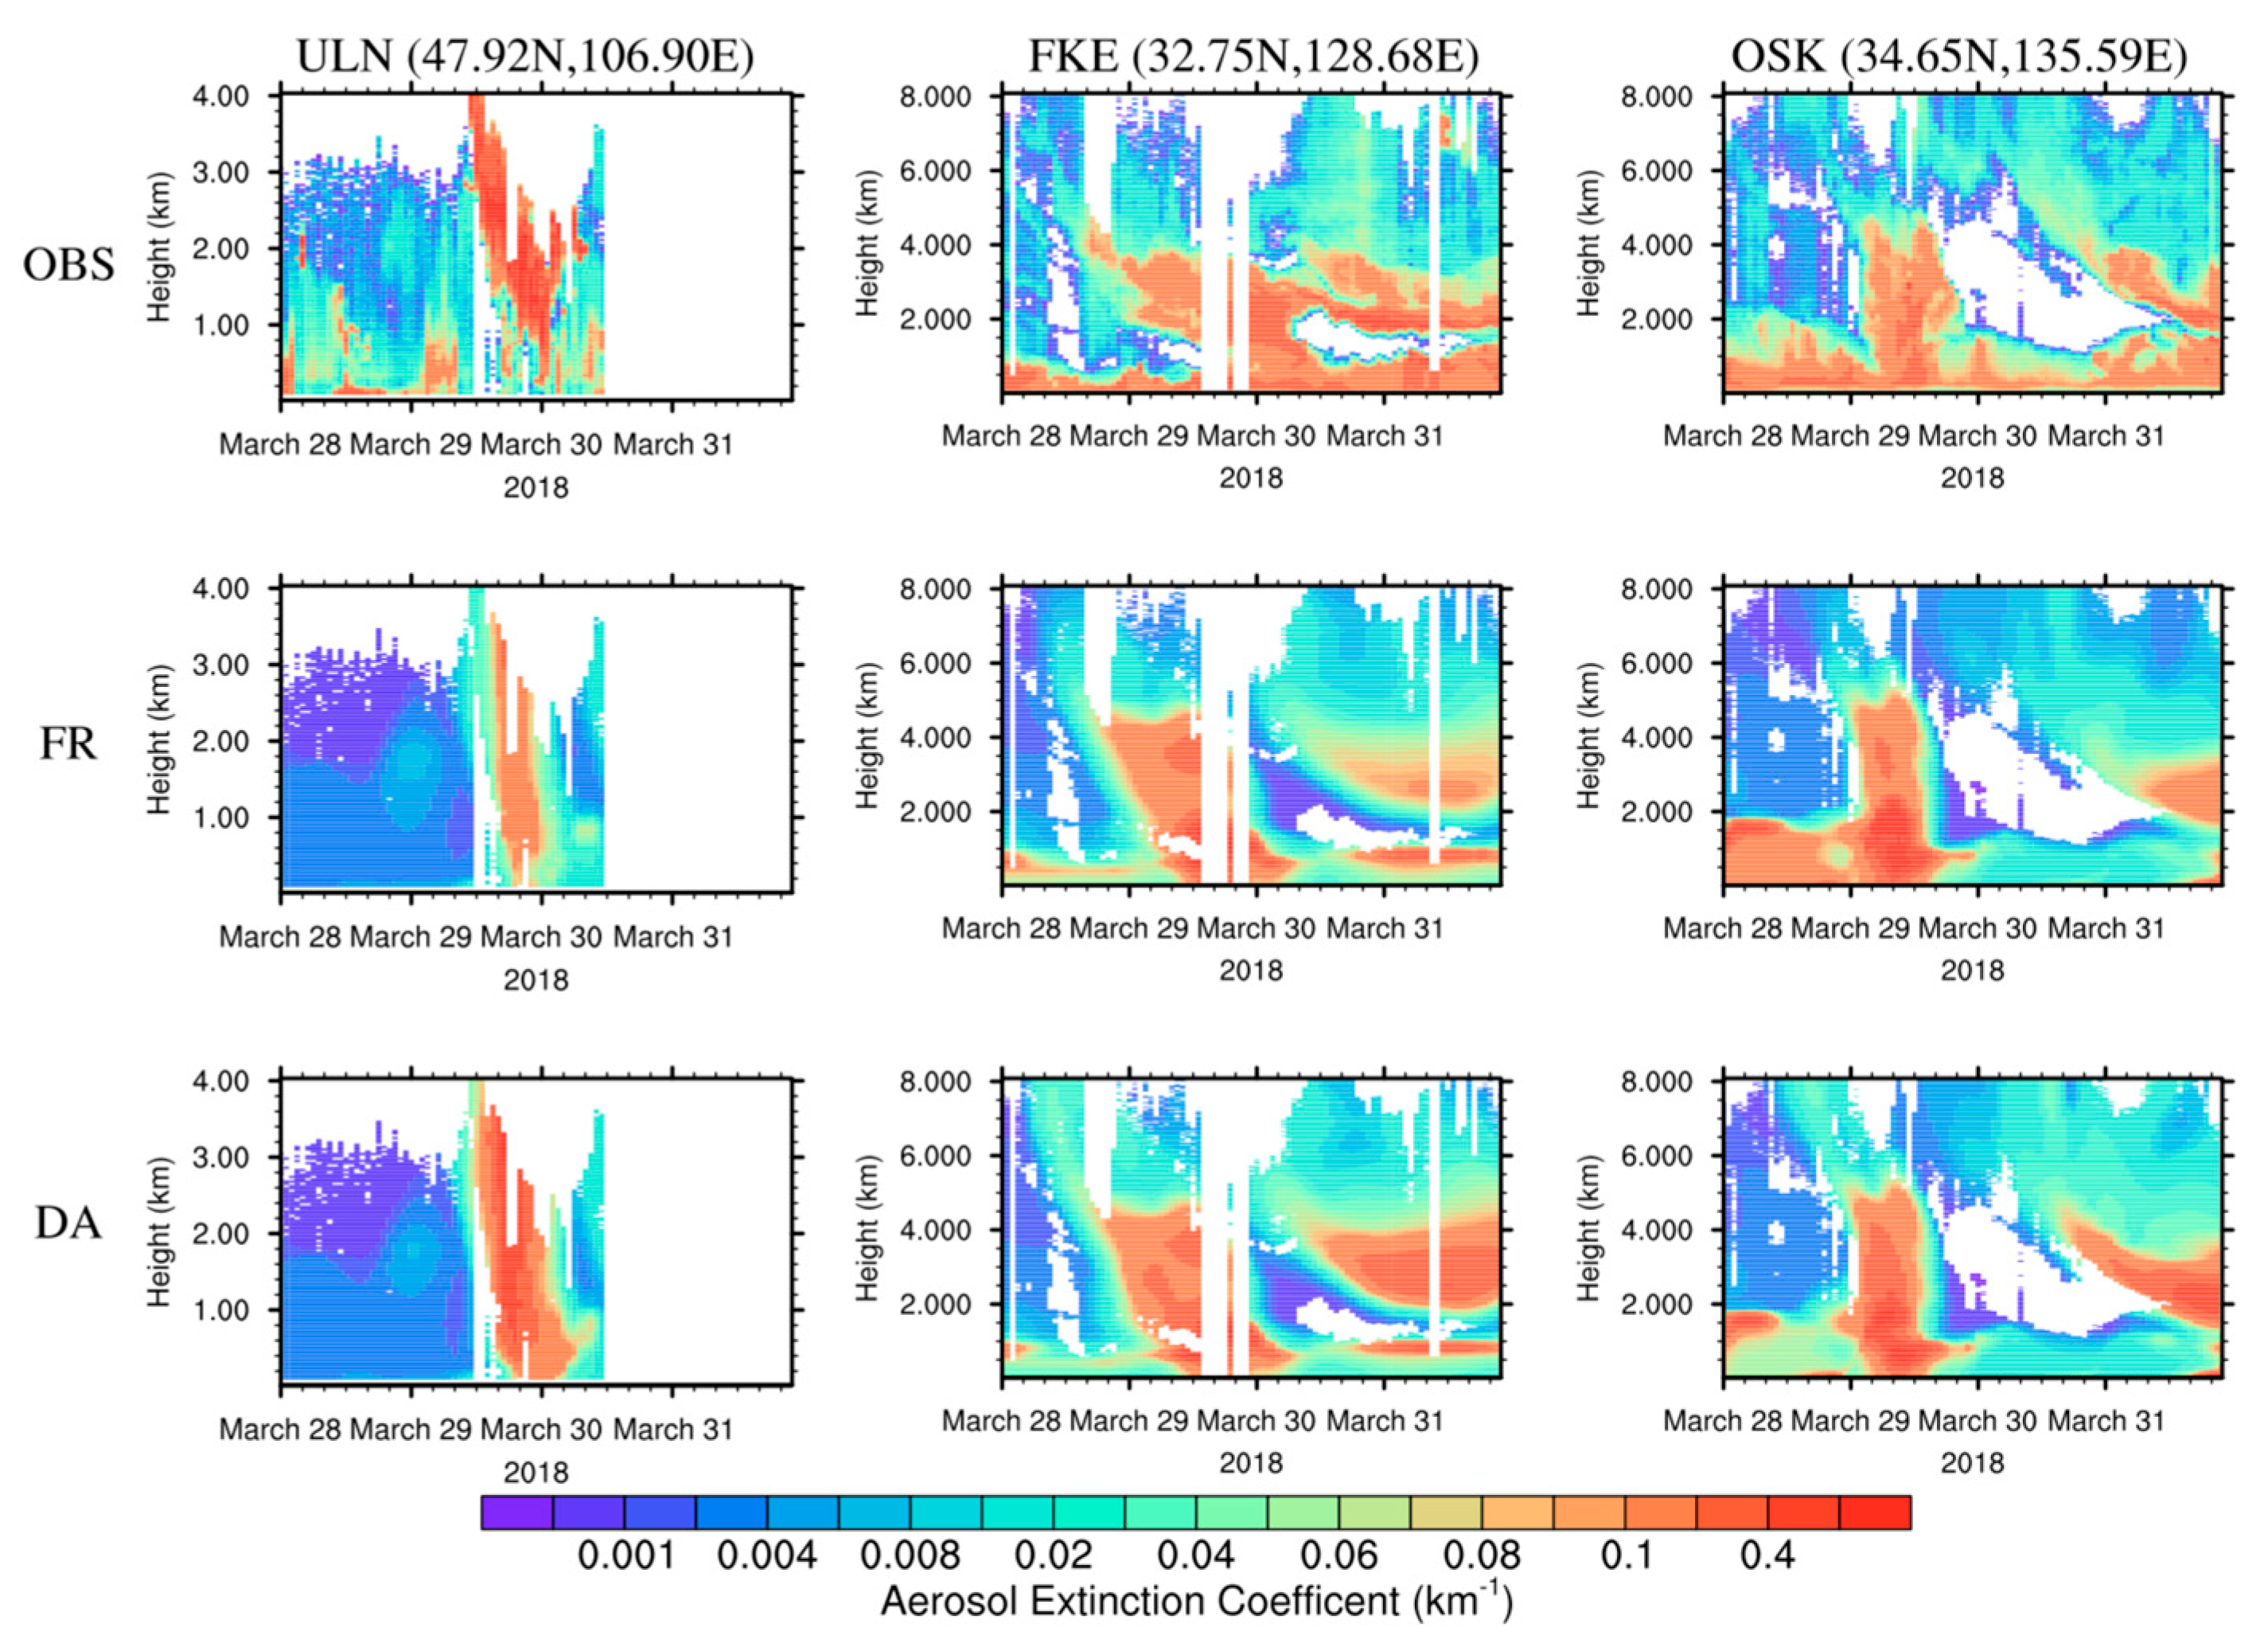
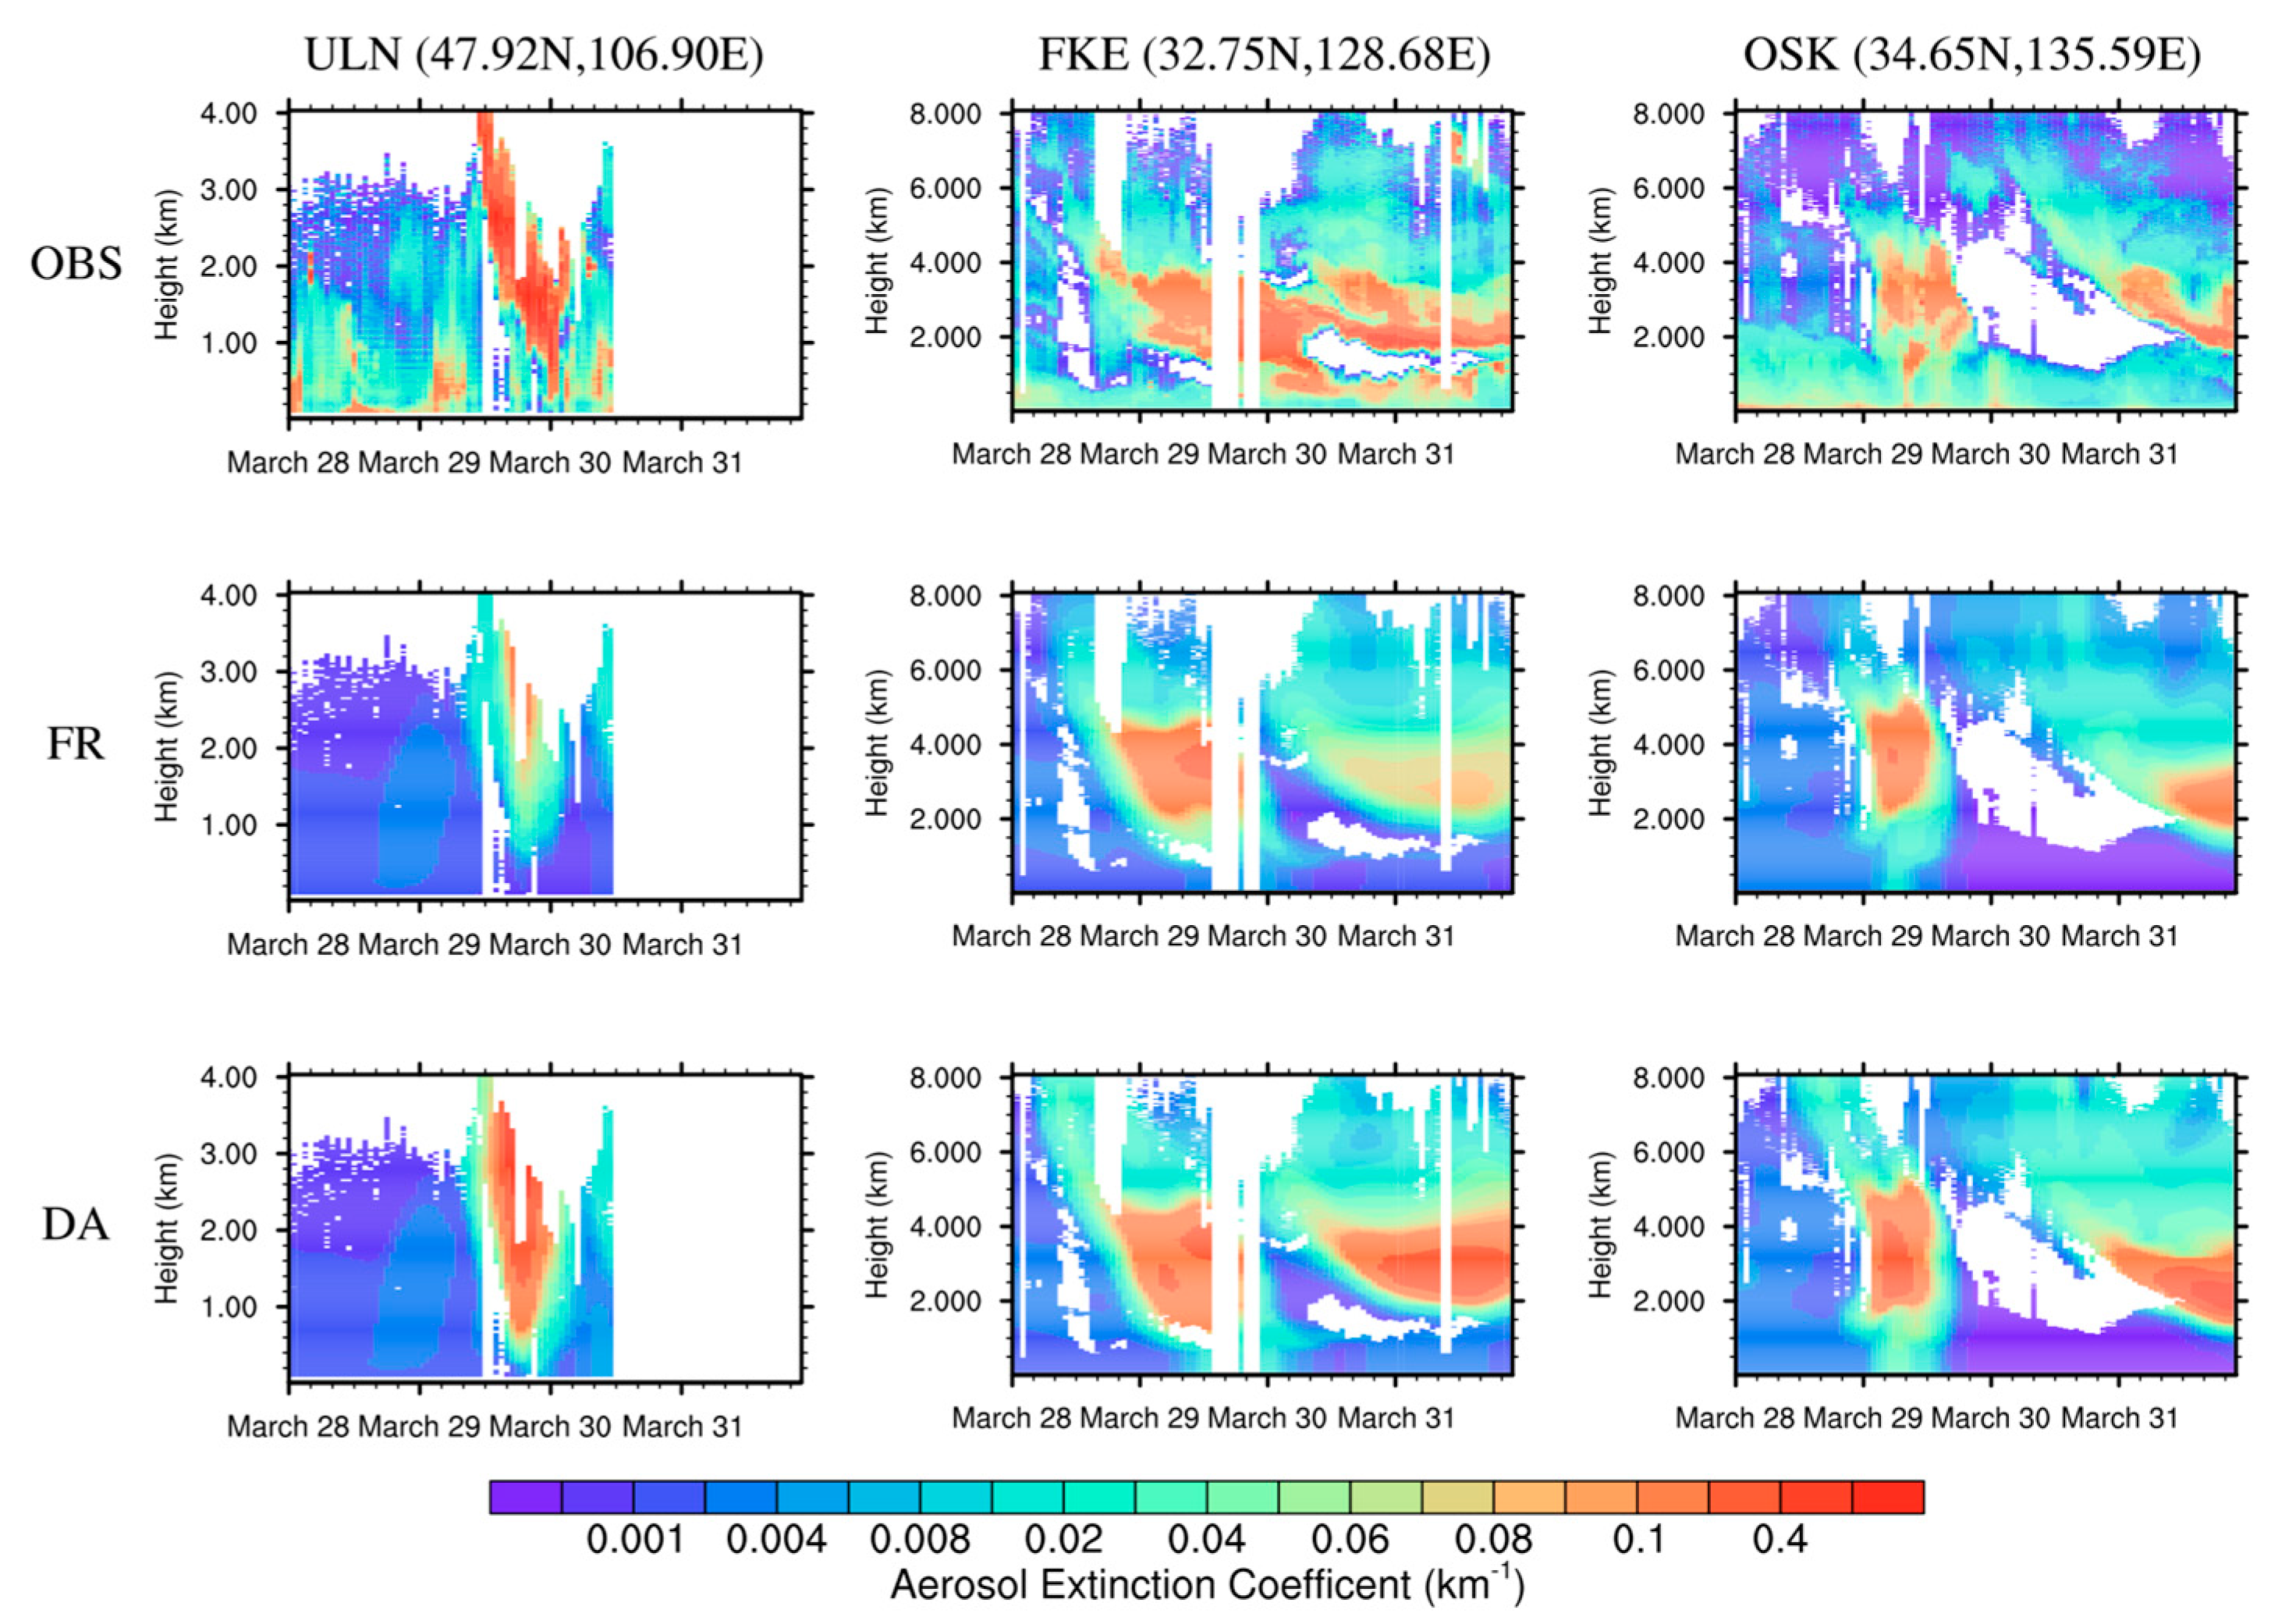
Figure 7 shows time–height cross-sections of simulated extinction coefficients and the coefficients derived from the ground-based lidar at Ulaanbaatar, Fukue, and Osaka from 28 to 31 March 2018. The Ulaanbaatar site (47.92° N, 106.90° E) is located in North Central Mongolian Plateau near the Gobi Desert and has been continuously operated by NIES since 2007. Fukue (32.75° N, 128.68° E) and Osaka (34.65° N, 135.59° E) sites are respectively located in the southern and western parts of Japan. The time series of the aerosol extinctions vertical profiles observed for non-spherical particles and the simulated dust are also shown in Figure 8. Comparing the extinction coefficients of total and dust aerosols, it is clear that dust aerosols are the dominant aerosol type in the Ulaanbaatar site. Without the aerosol data assimilation, aerosol extinctions were obviously underestimated during the whole period. Both total aerosol extinctions and the extinctions of dust aerosols in the DA experiment were more consistent with the observed ones, especially over the dust event. From 29 March 12:00 UTC to 30 March 12:00 UTC, the extinctions of dust aerosols observed by lidar and simulated by the DA experiment above 0.5 km were generally up to 0.1 km−1. During this period, aerosol extinctions simulated by the DA experiment and the observed ones both increased with height and peaked at around 3 km. At the Fukue site, the FR and DA experiments both showed a phenomenon whereby aerosols below 0.5 km were controlled by anthropogenic aerosols (spherical particles) over the whole time period, which was captured by lidar measurements; however, both total and non-spherical particle extinction coefficients in the 2–4 km altitude in the FR experiment on 30–31 March were obviously smaller than the observed ones, indicating that dust aerosols from source regions generally transport above the planetary boundary layer, while the FR experiment underestimated the transported dust aerosols at the Fukue site. The vertical distribution of aerosols, even in FR, should be improved by the model development, as pointed out by Goto et al. [58]. The GCOM-C DA successfully reduced the underestimations, showing comparable vertical patterns of both total and non-spherical particle aerosol extinctions derived from AD-Net. Over the Osaka site, temporal variations of the vertical distributions of the aerosol extinctions in the DA experiment were more comparable to the lidar observations, especially from 16:00 (UTC) on 30 March to 12:00 (UTC) on 31 March, whereas the aerosol extinctions in the FR experiment were evidently lower than the observed ones due to the underestimations of the dust aerosols.

5. Discussion

To generalize this study, two additional experiments with the same configurations as before were further conducted from 1 to 3 April 2018 to investigate the effects of GCOM-C AOT assimilation on simulated aerosol optical properties. Figure S2 shows the simulated AOTs in the FR and DA experiments and their differences from 1 to 3 April 2018. Both simulated total AOTs and dust AOTs in the DA experiment were higher than the ones in the FR experiment over northern Xinjiang province, the Mongolian Plateau, and Northeast China. The significantly negative differences of the simulated total AOTs between the DA and FR experiments in the Tarim Basin were dominated by reductions in dust AOTs. Although the simulated AOTs in the DA experiment were significantly lower than the ones in the FR experiment around the middle part of China, Korea, and the Sea of Japan, the simulated dust AOTs were slightly increased with GCOM-C AOT assimilation.
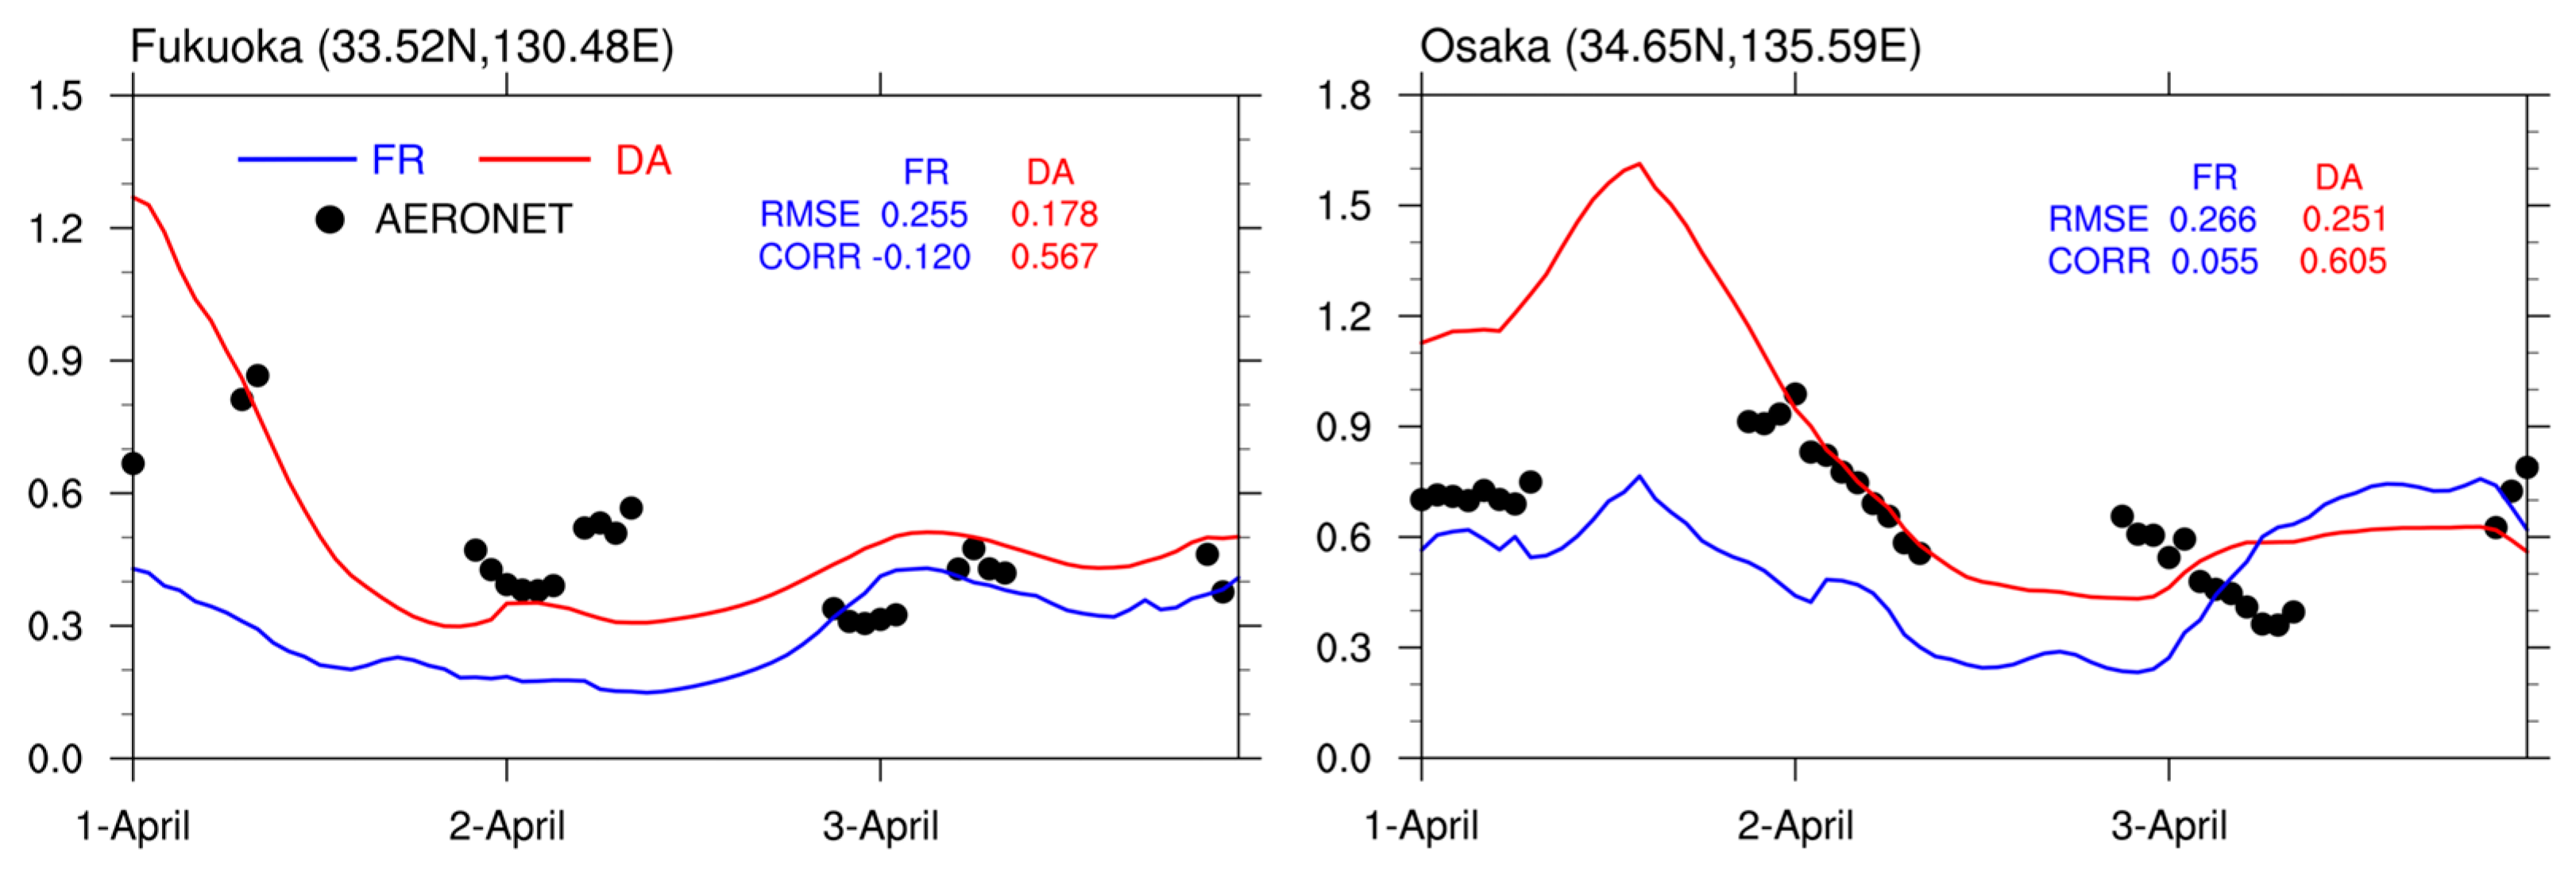
To quantitatively evaluate the influences of GCOM-C AOT assimilations on aerosol simulations, we first compared AOTs simulated by the FR and DA experiments with the AERONET-retrieved ones over the Fukuoka and Osaka sites in Figure 9. RMSEs over the Fukuoka and Osaka sites were reduced from 0.255 and 0.266 to 0.178 and 0.251, while CORRs over these two sites were increased from −0.120 and 0.055 to 0.567 and 0.605. On 2 April, simulated AOTs before assimilation were obviously lower than the observed AOTs over the Osaka site, whereas the ones after assimilation generally agreed with the AERONET observations.
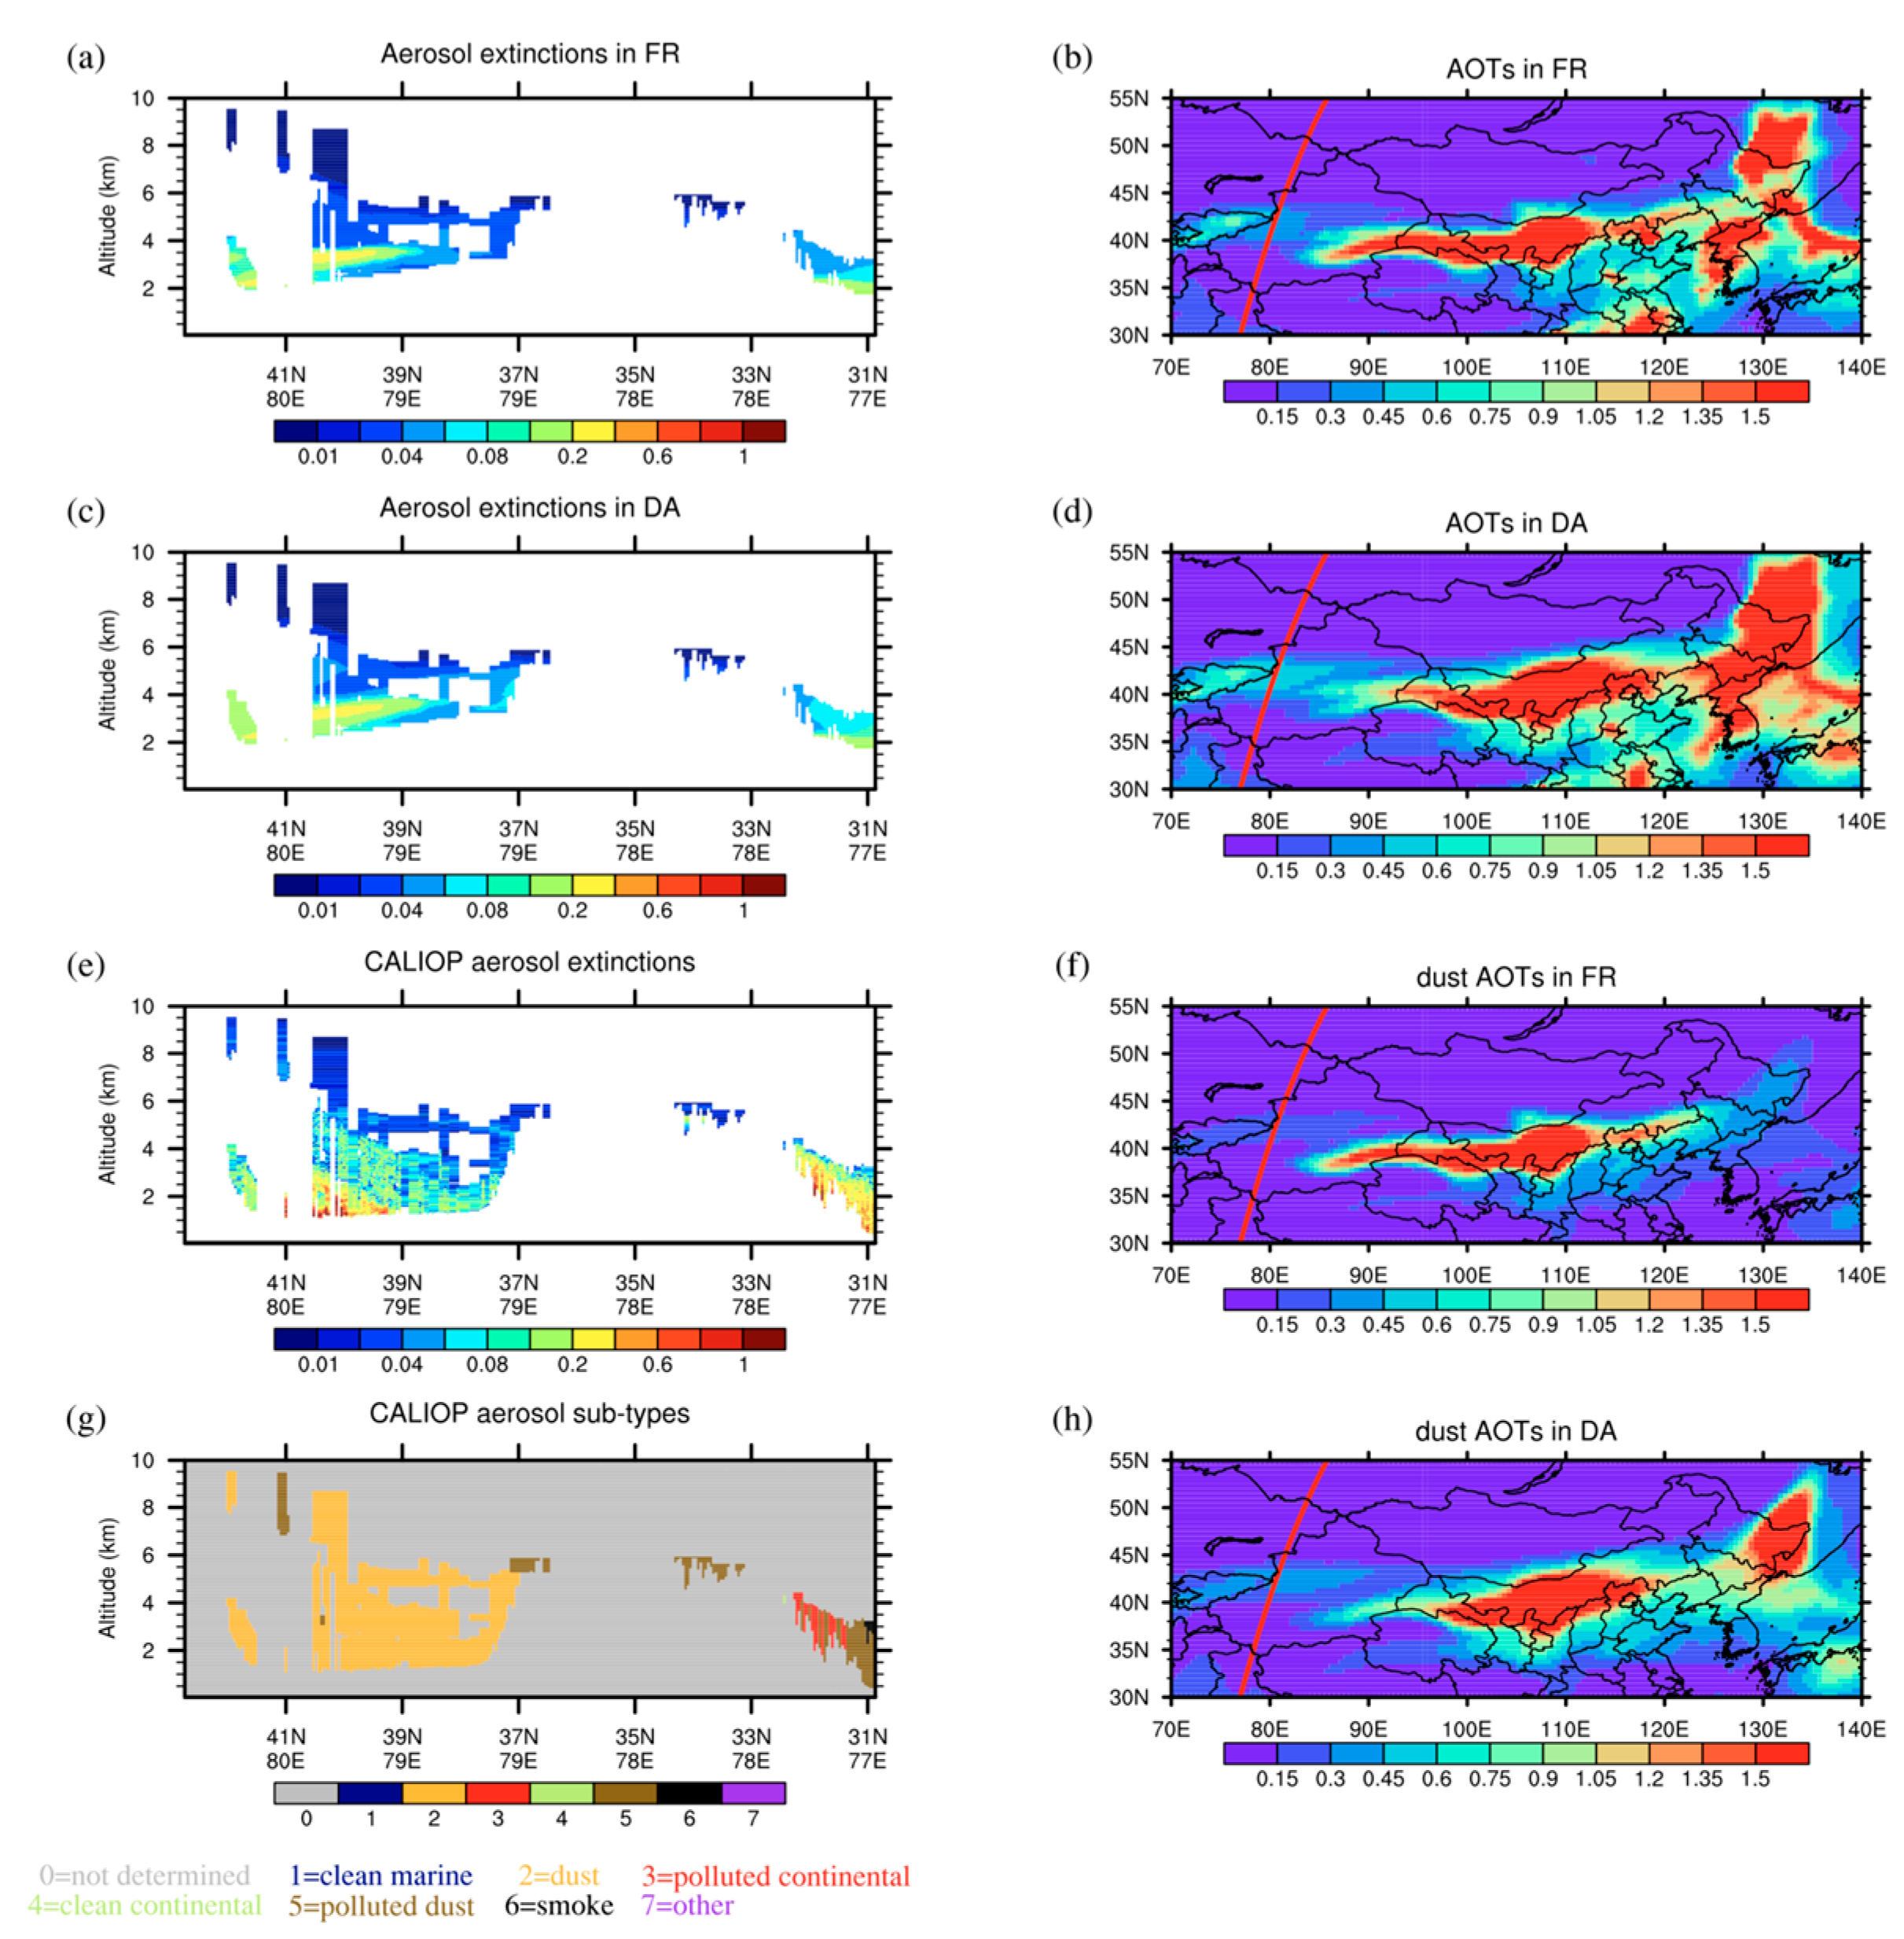
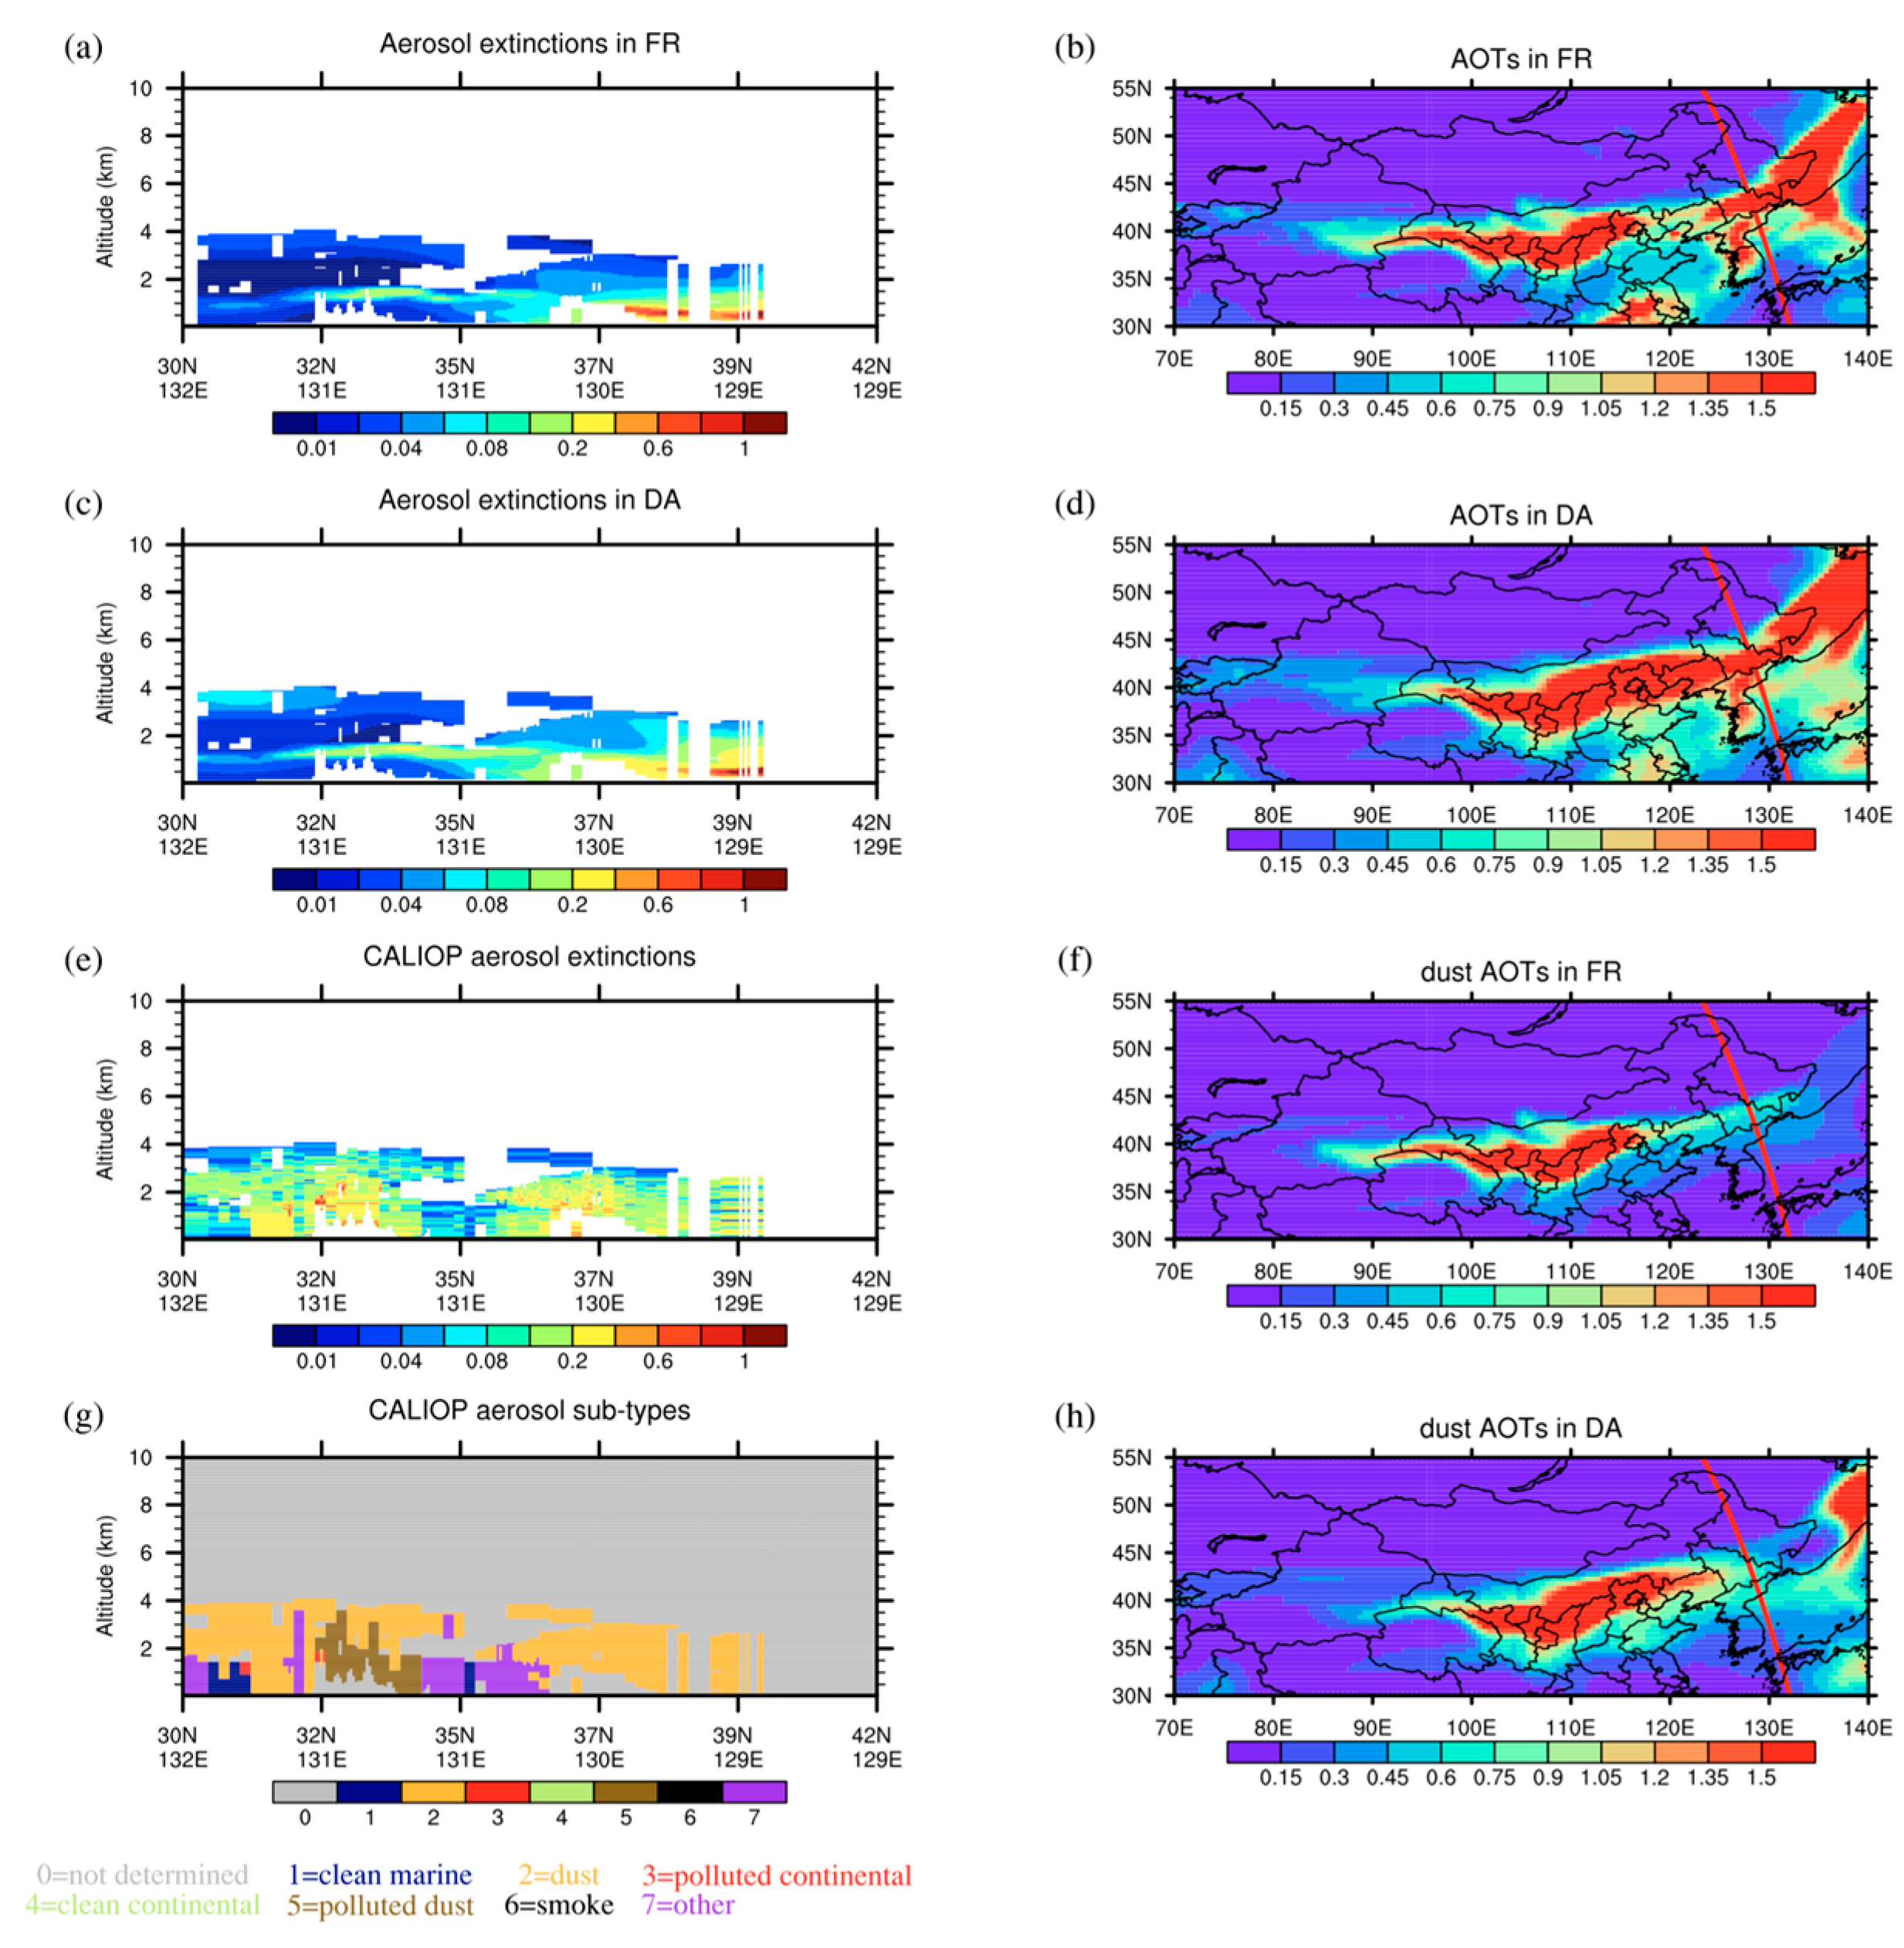
Figure 10 and Figure 11 further show the comparisons between the simulated aerosol extinction coefficient profiles for the two experiments and the retrieved ones from the Cloud-Aerosol Lidar with Orthogonal Polarization (CALIOP) onboard the Cloud-Aerosol Lidar and Infrared Pathfinder Satellite Observation (CALIPSO) [59,60] in the two CALIPSO orbit paths. One orbit path passed the west of Tarim Basin, while the other passed the downwind areas. According to CALIOP aerosol subtypes, the profiles of the aerosol extinctions in the two paths were both dominated by dust aerosols. Figure 10 shows that the increased AOTs in the DA experiment were probably due to increments of the eastward-transported aerosols. Although the FR experiment reproduced the vertical distributions of the aerosols, aerosol extinctions were underestimated. Assimilating GCOM-C AOTs improved the magnitude of the aerosol extinctions. As shown in Figure 11, the FR experiment tended to underestimate the aerosol extinctions, while the DA experiment showed more reasonable magnitude and vertical distributions.

6. Summary and Conclusions

As a new next-generation Earth-observing satellite, the Global Change Observation Mission-Climate (GCOM-C) satellite enables us to retrieve more precious optical properties of global aerosols, which is important for further aerosol research. Here, we showed the first utilization of GCOM-C AOTs in aerosol data assimilation. To evaluate its influence on the simulations of an Asian dust event from 28 to 31 March 2018, the aerosol-coupled NICAM with the four-dimensional local ensemble transform Kalman filter (4D-LETKF) was applied to assimilate the new aerosol observations acquired by the GCOM-C satellite.
Dust aerosols were the dominant aerosol type around Northeast China, the Mongolian Plateau, and Tianshan Mountain during this period. Compared with assimilated GCOM-C AOT observations, the FR experiment obviously underestimated the magnitude of this dust storm. Data assimilation with hourly GCOM-C AOT data significantly influenced the model simulation. The DA experiment generally reproduced spatial and temporal dust characteristics that were not captured without data assimilation. Merely 3.71% and 21.40% of the biases were within ±0.1 and ±0.5 in the FR experiment, whereas 20.68% and 59.34% of the biases were achieved within ±0.1 and ±0.5 in the DA experiment. The correlation between the simulated and observed fields was significantly increased from 0.137 to 0.687 by leveraging new GCOM-C satellite information.
Verification of the simulated results by comparison with independent ground-based measurements (AERONET and AD-Net) further confirmed the superiority of the data assimilation. The RMSE (bias) over the Beijing site was reduced from 0.744 (−0.613) to 0.466 (−0.085) by GCOM-C AOT assimilation. Significantly reduced differences between simulated and AERONET-retrieved AOTs indicated that the transport path of dust aerosols in the DA experiment was more authentic than that in the FR experiment. Simulated aerosol vertical extinctions were also improved by GCOM-C AOT assimilation, although the AOT assimilation included limited aerosol vertical information in correcting the aerosol profile. This illustrates that GCOM-C observations provide useful aerosol information to enhance model performances in dust simulation through data assimilation.
As a technical advance that leverages new satellite information, this study is promising for future aerosol simulations; however, the GCOM-C aerosol retrieval algorithm is still in development. We aim to further compare its product with that of other polar satellites and evaluate the possible benefits of data assimilation for forecasting dust storms.

Supplementary Materials

The following are available online at https://www.mdpi.com/article/10.3390/rs13153020/s1, Figure S1: Spatial distributions of the GCOM-C observed AOTs before and after quality control procedures from March 28 to March 31 in 2018; Figure S2: Spatial distributions of the total AOTs and dust AOTs averaged from 1 April to 3 April 2018 over East Asia for the FR (a,b) and DA (c,d) experiments. The differences in AOTs between the two experiments are also shown in (e) and (f), respectively.

Author Contributions

Methodology, T.D.; investigation, Y.C.; provision of the GCOM-C/SGLI satellite aerosol product, H.M. and M.Y.; writing—review and editing, Y.C., T.D., D.G., H.M., M.Y., G.S. and T.N.; funding acquisition, T.D., D.G. and Y.C. All authors have read and agreed to the published version of the manuscript.

Funding

This research was funded by the National Key Research and Development Program of China (grant Nos. 2016YFC0202001 and 2017YFC0209803), the Strategic Priority Research Program of the Chinese Academy of Sciences (grant No. XDA2006010302), the National Natural Science Funds of China (grant Nos. 41875133, 41590875, and 41605083), the Youth Innovation Promotion Association CAS (grant No. 2020078), the International Partnership Program of Chinese Academy of Sciences (grant No. 134111KYSB20200006), the JAXA collaborative research project (grant No. ER2GCF214), and the Postgraduate Research and Practice Innovation Program of Jiangsu Province (grant No. KYCX20_0921).

Data Availability Statement

The data and data analysis methods are available upon request. The NICAM source code is available according to the terms and conditions in http://nicam.jp/hiki/?Research+Collaborations, last access: 28 June 2021.

Acknowledgments

NCEP FNL reanalysis data were downloaded from https://rda.ucar.edu/datasets/ds083.2/, last access: 28 June 2021. We performed the simulations and data assimilation using supercomputer resources from NIES/NEC SX-Aurora TSUBASA and JAXA/JSS2. The AERONET observations were downloaded from the AERONET website (http://www.eorc.jaxa.jp/ptree/index.html, last access: 28 June 2021) and AD-Net data were downloaded from the NIES website (http://www-lidar.nies.go.jp/AD-Net, last access: 28 June 2021). We thank the members of the GCOM-C Scientific team of JAXA for their encouragement and help.

Conflicts of Interest

The authors declare no conflict of interest.

References

  1. Huang, J.; Fu, Q.; Su, J.; Tang, Q.; Minnis, P.; Hu, Y.; Yi, Y.; Zhao, Q. Taklimakan Dust Aerosol Radiative Heating Derived from CALIPSO Observations Using the Fu-Liou Radiation Model with CERES Constraints. Atmos. Chem. Phys. 2009, 9, 4011–4021. [Google Scholar] [CrossRef]
  2. Huang, J.; Minnis, P.; Yan, H.; Yi, Y.; Chen, B.; Zhang, L.; Ayers, J.K. Dust Aerosol Effect on Semi-Arid Climate over Northwest China Detected from A-Train Satellite Measurements. Atmos. Chem. Phys. 2010, 10, 6863–6872. [Google Scholar] [CrossRef] [Green Version]
  3. Liu, Y.; Zhu, Q.; Hua, S.; Alam, K.; Dai, T.; Cheng, Y. Tibetan Plateau Driven Impact of Taklimakan Dust on Northern Rainfall. Atmos. Environ. 2020, 234, 117583. [Google Scholar] [CrossRef]
  4. Wang, T.; Han, Y.; Huang, J.; Sun, M.; Jian, B.; Huang, Z.; Yan, H. Climatology of Dust-Forced Radiative Heating Over the Tibetan Plateau and Its Surroundings. J. Geophys. Res. Atmos. 2020, 125, e2020JD032942. [Google Scholar] [CrossRef]
  5. Wang, H.; Dai, T.; Zhao, M.; Goto, D.; Bao, Q.; Takemura, T.; Nakajima, T.; Shi, G. Aerosol Effective Radiative Forcing in the Online Aerosol Coupled CAS-FGOALS-F3-L Climate Model. Atmosphere 2020, 11, 1115. [Google Scholar] [CrossRef]
  6. Huang, J.; Lin, B.; Minnis, P.; Wang, T.; Wang, X.; Hu, Y.; Yi, Y.; Ayers, J.K. Satellite-Based Assessment of Possible Dust Aerosols Semi-Direct Effect on Cloud Water Path over East Asia. Geophys. Res. Lett. 2006, 33, L19802. [Google Scholar] [CrossRef] [Green Version]
  7. Liu, Y.; Zhu, Q.; Huang, J.; Hua, S.; Jia, R. Impact of Dust-Polluted Convective Clouds over the Tibetan Plateau on Downstream Precipitation. Atmos. Environ. 2019, 209, 67–77. [Google Scholar] [CrossRef]
  8. Liu, Y.; Hua, S.; Jia, R.; Huang, J. Effect of Aerosols on the Ice Cloud Properties Over the Tibetan Plateau. J. Geophys. Res. Atmos. 2019, 124, 9594–9608. [Google Scholar] [CrossRef]
  9. Shimizu, A. Continuous Observations of Asian Dust and Other Aerosols by Polarization Lidars in China and Japan during ACE-Asia. J. Geophys. Res. 2004, 109, D19S17. [Google Scholar] [CrossRef]
  10. Sugimoto, N.; Uno, I.; Nishikawa, M.; Shimizu, A.; Matsui, I.; Dong, X.; Chen, Y.; Quan, H. Record Heavy Asian Dust in Beijing in 2002: Observations and Model Analysis of Recent Events: Record Heavy Dust in Beijing in 2002. Geophys. Res. Lett. 2003, 30, 12. [Google Scholar] [CrossRef]
  11. Wang, S.; Huang, G.; Lin, J.; Hu, K.; Wang, L.; Gong, H. Chinese Blue Days: A Novel Index and Spatio-Temporal Variations. Environ. Res. Lett. 2019, 14, 074026. [Google Scholar] [CrossRef] [Green Version]
  12. Ridgwell, A.J. Dust in the Earth System: The Biogeochemical Linking of Land, Air and Sea. Philos. Trans. R. Soc. Lond. Ser. A Math. Phys. Eng. Sci. 2002, 360, 2905–2924. [Google Scholar] [CrossRef] [PubMed]
  13. Yoon, J.-E.; Lim, J.-H.; Shim, J.-M.; Kwon, J.-I.; Kim, I.-N. Spring 2018 Asian Dust Events: Sources, Transportation, and Potential Biogeochemical Implications. Atmosphere 2019, 10, 276. [Google Scholar] [CrossRef] [Green Version]
  14. Hori, M.; Murakami, H.; Miyazaki, R.; Honda, Y.; Nasahara, K.; Kajiwara, K.; Nakajima, T.Y.; Irie, H.; Toratani, M.; Hirawake, T.; et al. GCOM-C Data Validation Plan for Land, Atmosphere, Ocean, and Cryosphere. Aerosp. Technol. Jpn. 2018, 16, 218–223. [Google Scholar] [CrossRef] [Green Version]
  15. Imaoka, K.; Kachi, M.; Fujii, H.; Murakami, H.; Hori, M.; Ono, A.; Igarashi, T.; Nakagawa, K.; Oki, T.; Honda, Y.; et al. Global Change Observation Mission (GCOM) for Monitoring Carbon, Water Cycles, and Climate Change. Proc. IEEE 2010, 98, 717–734. [Google Scholar] [CrossRef]
  16. Hoque, H.M.S.; Irie, H.; Damiani, A.; Momoi, M. Primary Evaluation of the GCOM-C Aerosol Products at 380 Nm Using Ground-Based Sky Radiometer Observations. Remote Sens. 2020, 12, 2661. [Google Scholar] [CrossRef]
  17. Shao, Y.; Wyrwoll, K.-H.; Chappell, A.; Huang, J.; Lin, Z.; McTainsh, G.H.; Mikami, M.; Tanaka, T.Y.; Wang, X.; Yoon, S. Dust Cycle: An Emerging Core Theme in Earth System Science. Aeolian Res. 2011, 2, 181–204. [Google Scholar] [CrossRef]
  18. Uno, I.; Yumimoto, K.; Shimizu, A.; Hara, Y.; Sugimoto, N.; Wang, Z.; Liu, Z.; Winker, D.M. 3D Structure of Asian Dust Transport Revealed by CALIPSO Lidar and a 4DVAR Dust Model. Geophys. Res. Lett. 2008, 35. [Google Scholar] [CrossRef] [Green Version]
  19. Zhao, M.; Dai, T.; Wang, H.; He, B.; Bao, Q.; Liu, Y.; Shi, G. Aerosol Characteristics over the Tibetan Plateau Simulated with a Coupled Aerosol–Climate Model (FGOALS-F3-L). Atmos. Ocean. Sci. Lett. 2021, 14, 100031. [Google Scholar] [CrossRef]
  20. Huang, J.; Minnis, P.; Chen, B.; Huang, Z.; Liu, Z.; Zhao, Q.; Yi, Y.; Ayers, J.K. Long-Range Transport and Vertical Structure of Asian Dust from CALIPSO and Surface Measurements during PACDEX. J. Geophys. Res. 2008, 113, D23212. [Google Scholar] [CrossRef]
  21. Sugimoto, N.; Jin, Y.; Shimizu, A.; Nishizawa, T.; Yumimoto, K. Transport of Mineral Dust from Africa and Middle East to East Asia Observed with the Lidar Network (AD-Net). SOLA 2019, 15, 257–261. [Google Scholar] [CrossRef] [Green Version]
  22. Zhang, Z.; Zhou, W.; Wenig, M.; Yang, L. Impact of Long-Range Desert Dust Transport on Hydrometeor Formation over Coastal East Asia. Adv. Atmos. Sci. 2017, 34, 101–115. [Google Scholar] [CrossRef]
  23. Kaskaoutis, D.G.; Dumka, U.C.; Rashki, A.; Psiloglou, B.E.; Gavriil, A.; Mofidi, A.; Petrinoli, K.; Karagiannis, D.; Kambezidis, H.D. Analysis of Intense Dust Storms over the Eastern Mediterranean in March 2018: Impact on Radiative Forcing and Athens Air Quality. Atmos. Environ. 2019, 209, 23–39. [Google Scholar] [CrossRef]
  24. Bong Park, C.; Sugimoto, N.; Matsui, I.; Shimizu, A.; Tatarov, B.; Kamei, A.; Hie Lee, C.; Uno, I.; Takemura, T.; Westphal, D.L. Long-Range Transport of Saharan Dust to East Asia Observed with Lidars. SOLA 2005, 1, 121–124. [Google Scholar] [CrossRef] [Green Version]
  25. Dai, T.; Cheng, Y.; Suzuki, K.; Goto, D.; Kikuchi, M.; Schutgens, N.A.J.; Yoshida, M.; Zhang, P.; Husi, L.; Shi, G.; et al. Hourly Aerosol Assimilation of Himawari-8 AOT Using the Four-Dimensional Local Ensemble Transform Kalman Filter. J. Adv. Model. Earth Syst. 2019, 11, 680–711. [Google Scholar] [CrossRef]
  26. Yoshida, M.; Yumimoto, K.; Nagao, T.M.; Tanaka, T.Y.; Kikuchi, M.; Murakami, H. Satellite Retrieval of Aerosol Combined with Assimilated Forecast. Atmos. Chem. Phys. 2021, 21, 1797–1813. [Google Scholar] [CrossRef]
  27. Zhang, J.; Reid, J.S. MODIS Aerosol Product Analysis for Data Assimilation: Assessment of over-Ocean Level 2 Aerosol Optical Thickness Retrievals. J. Geophys. Res. 2006, 111. [Google Scholar] [CrossRef]
  28. Benedetti, A.; Morcrette, J.-J.; Boucher, O.; Dethof, A.; Engelen, R.J.; Fisher, M.; Flentje, H.; Huneeus, N.; Jones, L.; Kaiser, J.W.; et al. Aerosol Analysis and Forecast in the European Centre for Medium-Range Weather Forecasts Integrated Forecast System: 2. Data Assimilation. J. Geophys. Res. 2009, 114. [Google Scholar] [CrossRef] [Green Version]
  29. Cheng, Y.; Dai, T.; Goto, D.; Schutgens, N.A.J.; Shi, G.; Nakajima, T. Investigating the Assimilation of CALIPSO Global Aerosol Vertical Observations Using a Four-Dimensional Ensemble Kalman Filter. Atmos. Chem. Phys. 2019, 19, 13445–13467. [Google Scholar] [CrossRef] [Green Version]
  30. Liu, Z.; Liu, Q.; Lin, H.-C.; Schwartz, C.S.; Lee, Y.-H.; Wang, T. Three-Dimensional Variational Assimilation of MODIS Aerosol Optical Depth: Implementation and Application to a Dust Storm over East Asia: Aod Data Assimilation. J. Geophys. Res. Atmos. 2011, 116. [Google Scholar] [CrossRef] [Green Version]
  31. Giles, D.M.; Sinyuk, A.; Sorokin, M.G.; Schafer, J.S.; Smirnov, A.; Slutsker, I.; Eck, T.F.; Holben, B.N.; Lewis, J.R.; Campbell, J.R.; et al. Advancements in the Aerosol Robotic Network (AERONET) Version 3 Database—Automated near-Real-Time Quality Control Algorithm with Improved Cloud Screening for Sun Photometer Aerosol Optical Depth (AOD) Measurements. Atmos. Meas. Tech. 2019, 12, 169–209. [Google Scholar] [CrossRef] [Green Version]
  32. Holben, B.N.; Eck, T.F.; Slutsker, I.; Tanré, D.; Buis, J.P.; Setzer, A.; Vermote, E.; Reagan, J.A.; Kaufman, Y.J.; Nakajima, T.; et al. AERONET—A Federated Instrument Network and Data Archive for Aerosol Characterization. Remote Sens. Environ. 1998, 66, 1–16. [Google Scholar] [CrossRef]
  33. Shimizu, A.; Nishizawa, T.; Jin, Y.; Kim, S.-W.; Wang, Z.; Batdorj, D.; Sugimoto, N. Evolution of a lidar network for tropospheric aerosol detection in East Asia. Opt. Eng. 2016, 56, 031219. [Google Scholar] [CrossRef]
  34. Boesenberg, J.; Hoff, R.M. GAW Plan for the implementation of the GAW Aerosol Lidar Observation Network GALION. In GAW Report; WMO: Geneva, Switzerland, 2007; Volume 178. [Google Scholar]
  35. Takemura, T.; Okamoto, H.; Maruyama, Y.; Numaguti, A.; Higurashi, A.; Nakajima, T. Global Three-Dimensional Simulation of Aerosol Optical Thickness Distribution of Various Origins. J. Geophys. Res. 2000, 105, 17853–17873. [Google Scholar] [CrossRef]
  36. Takemura, T.; Uno, I.; Nakajima, T.; Higurashi, A.; Sano, I. Modeling Study of Long-Range Transport of Asian Dust and Anthropogenic Aerosols from East Asia: Study of Long-range Transport of Dust and Aerosols. Geophys. Res. Lett. 2002, 29, 11-1–11-4. [Google Scholar] [CrossRef]
  37. Takemura, T. Aerosol Distributions and Radiative Forcing over the Asian Pacific Region Simulated by Spectral Radiation-Transport Model for Aerosol Species (SPRINTARS). J. Geophys. Res. 2003, 108, 8659. [Google Scholar] [CrossRef]
  38. Takemura, T.; Egashira, M.; Matsuzawa, K.; Ichijo, H.; O’ishi, R.; Abe-Ouchi, A. A Simulation of the Global Distribution and Radiative Forcing of Soil Dust Aerosols at the Last Glacial Maximum. Atmos. Chem. Phys. 2009, 9, 3061–3073. [Google Scholar] [CrossRef] [Green Version]
  39. Satoh, M.; Tomita, H.; Miura, H.; Iga, S.; Nasuno, T. Development of a Global Cloud Resolving Model—A Multi-Scale Structure of Tropical Convections. J. Earth Simulator 2005, 3, 9. [Google Scholar]
  40. Satoh, M.; Matsuno, T.; Tomita, H.; Miura, H.; Nasuno, T.; Iga, S. Nonhydrostatic Icosahedral Atmospheric Model (NICAM) for Global Cloud Resolving Simulations. J. Comput. Phys. 2008, 227, 3486–3514. [Google Scholar] [CrossRef] [Green Version]
  41. Satoh, M.; Tomita, H.; Yashiro, H.; Miura, H.; Kodama, C.; Seiki, T.; Noda, A.T.; Yamada, Y.; Goto, D.; Sawada, M.; et al. The Non-Hydrostatic Icosahedral Atmospheric Model: Description and Development. Prog. Earth Planet. Sci. 2014, 1, 18. [Google Scholar] [CrossRef] [Green Version]
  42. Tomita, H.; Satoh, M. A New Dynamical Framework of Nonhydrostatic Global Model Using the Icosahedral Grid. Fluid Dyn. Res. 2004, 34, 357. [Google Scholar] [CrossRef]
  43. Miyamoto, Y.; Kajikawa, Y.; Yoshida, R.; Yamaura, T.; Yashiro, H.; Tomita, H. Deep Moist Atmospheric Convection in a Subkilometer Global Simulation: Convection in a Sub-Km Global Simulation. Geophys. Res. Lett. 2013, 40, 4922–4926. [Google Scholar] [CrossRef]
  44. Goto, D.; Dai, T.; Satoh, M.; Tomita, H.; Uchida, J.; Misawa, S.; Inoue, T.; Tsuruta, H.; Ueda, K.; Ng, C.F.S.; et al. Application of a Global Nonhydrostatic Model with a Stretched-Grid System to Regional Aerosol Simulations around Japan. Geosci. Model Dev. 2015, 8, 235–259. [Google Scholar] [CrossRef] [Green Version]
  45. Dai, T.; Goto, D.; Schutgens, N.A.J.; Dong, X.; Shi, G.; Nakajima, T. Simulated Aerosol Key Optical Properties over Global Scale Using an Aerosol Transport Model Coupled with a New Type of Dynamic Core. Atmos. Environ. 2014, 82, 71–82. [Google Scholar] [CrossRef]
  46. Goto, D.; Schutgens, N.A.J.; Nakajima, T.; Takemura, T. Sensitivity of Aerosol to Assumed Optical Properties over Asia Using a Global Aerosol Model and AERONET: Sensitivity of Aerosol. Geophys. Res. Lett. 2011, 38. [Google Scholar] [CrossRef]
  47. van der Werf, G.R.; Randerson, J.T.; Giglio, L.; Collatz, G.J.; Mu, M.; Kasibhatla, P.S.; Morton, D.C.; DeFries, R.S.; Jin, Y.; van Leeuwen, T.T. Global Fire Emissions and the Contribution of Deforestation, Savanna, Forest, Agricultural, and Peat Fires (1997–2009). Atmos. Chem. Phys. 2010, 10, 11707–11735. [Google Scholar] [CrossRef] [Green Version]
  48. Janssens-Maenhout, G.; Crippa, M.; Guizzardi, D.; Dentener, F.; Muntean, M.; Pouliot, G.; Keating, T.; Zhang, Q.; Kurokawa, J.; Wankmüller, R.; et al. HTAP_v2.2: A Mosaic of Regional and Global Emission Grid Maps for 2008 and 2010 to Study Hemispheric Transport of Air Pollution. Atmos. Chem. Phys. 2015, 15, 11411–11432. [Google Scholar] [CrossRef] [Green Version]
  49. Gillette, D. A Wind Tunnel Simulation of the Erosion of Soil: Effect of Soil Texture, Sandblasting, Wind Speed, and Soil Consolidation on Dust Production. Atmos. Environ. 1978, 12, 1735–1743. [Google Scholar] [CrossRef]
  50. Dai, T.; Cheng, Y.; Zhang, P.; Shi, G.; Sekiguchi, M.; Suzuki, K.; Goto, D.; Nakajima, T. Impacts of Meteorological Nudging on the Global Dust Cycle Simulated by NICAM Coupled with an Aerosol Model. Atmos. Environ. 2018, 190, 99–115. [Google Scholar] [CrossRef]
  51. Hunt, B.R.; Kostelich, E.J.; Szunyogh, I. Efficient Data Assimilation for Spatiotemporal Chaos: A Local Ensemble Transform Kalman Filter. Phys. D Nonlinear Phenom. 2007, 230, 112–126. [Google Scholar] [CrossRef] [Green Version]
  52. Miyoshi, T.; Yamane, S.; Enomoto, T. Localizing the Error Covariance by Physical Distances within a Local Ensemble Transform Kalman Filter (LETKF). SOLA 2007, 3, 89–92. [Google Scholar] [CrossRef] [Green Version]
  53. Schutgens, N.A.J.; Miyoshi, T.; Takemura, T.; Nakajima, T. Applying an Ensemble Kalman FIlter to the Assimilation of AERONET Observations in a Global Aerosol Transport Model. Atmos. Chem. Phys. 2010, 10, 2561–2576. [Google Scholar] [CrossRef] [Green Version]
  54. Schutgens, N.A.J.; Miyoshi, T.; Takemura, T.; Nakajima, T. Sensitivity Tests for an Ensemble Kalman FIlter for Aerosol Assimilation. Atmos. Chem. Phys. 2010, 10, 6583–6600. [Google Scholar] [CrossRef] [Green Version]
  55. Yin, X.; Dai, T.; Schutgens, N.A.J.; Goto, D.; Nakajima, T.; Shi, G. Effects of Data Assimilation on the Global Aerosol Key Optical Properties Simulations. Atmos. Res. 2016, 178–179, 175–186. [Google Scholar] [CrossRef]
  56. Yumimoto, K.; Takemura, T. Direct Radiative Effect of Aerosols Estimated Using Ensemble-Based Data Assimilation in a Global Aerosol Climate Model: Assimilation with Aerosol Climate Model. Geophys. Res. Lett. 2011, 38. [Google Scholar] [CrossRef]
  57. Gaspari, G.; Cohn, S.E. Construction of Correlation Functions in Two and Three Dimensions. Q. J. R. Meteorol. Soc. 1999, 125, 723–757. [Google Scholar] [CrossRef]
  58. Goto, D.; Kikuchi, M.; Suzuki, K.; Hayasaki, M.; Yoshida, M.; Nagao, T.M.; Choi, M.; Kim, J.; Sugimoto, N.; Shimizu, A.; et al. Aerosol model evaluation using two geostationary satellites over East Asia in May 2016. Atmos. Res. 2019, 217, 93–113. [Google Scholar] [CrossRef]
  59. Winker, D.M.; Hunt, W.H.; McGill, M.J. Initial Performance Assessment of CALIOP. Geophys. Res. Lett. 2007, 34. [Google Scholar] [CrossRef] [Green Version]
  60. Winker, D.M.; Tackett, J.L.; Getzewich, B.J.; Liu, Z.; Vaughan, M.A.; Rogers, R.R. The Global 3-D Distribution of Tropospheric Aerosols as Characterized by CALIOP. Atmos. Chem. Phys. 2013, 13, 3345–3361. [Google Scholar] [CrossRef] [Green Version]
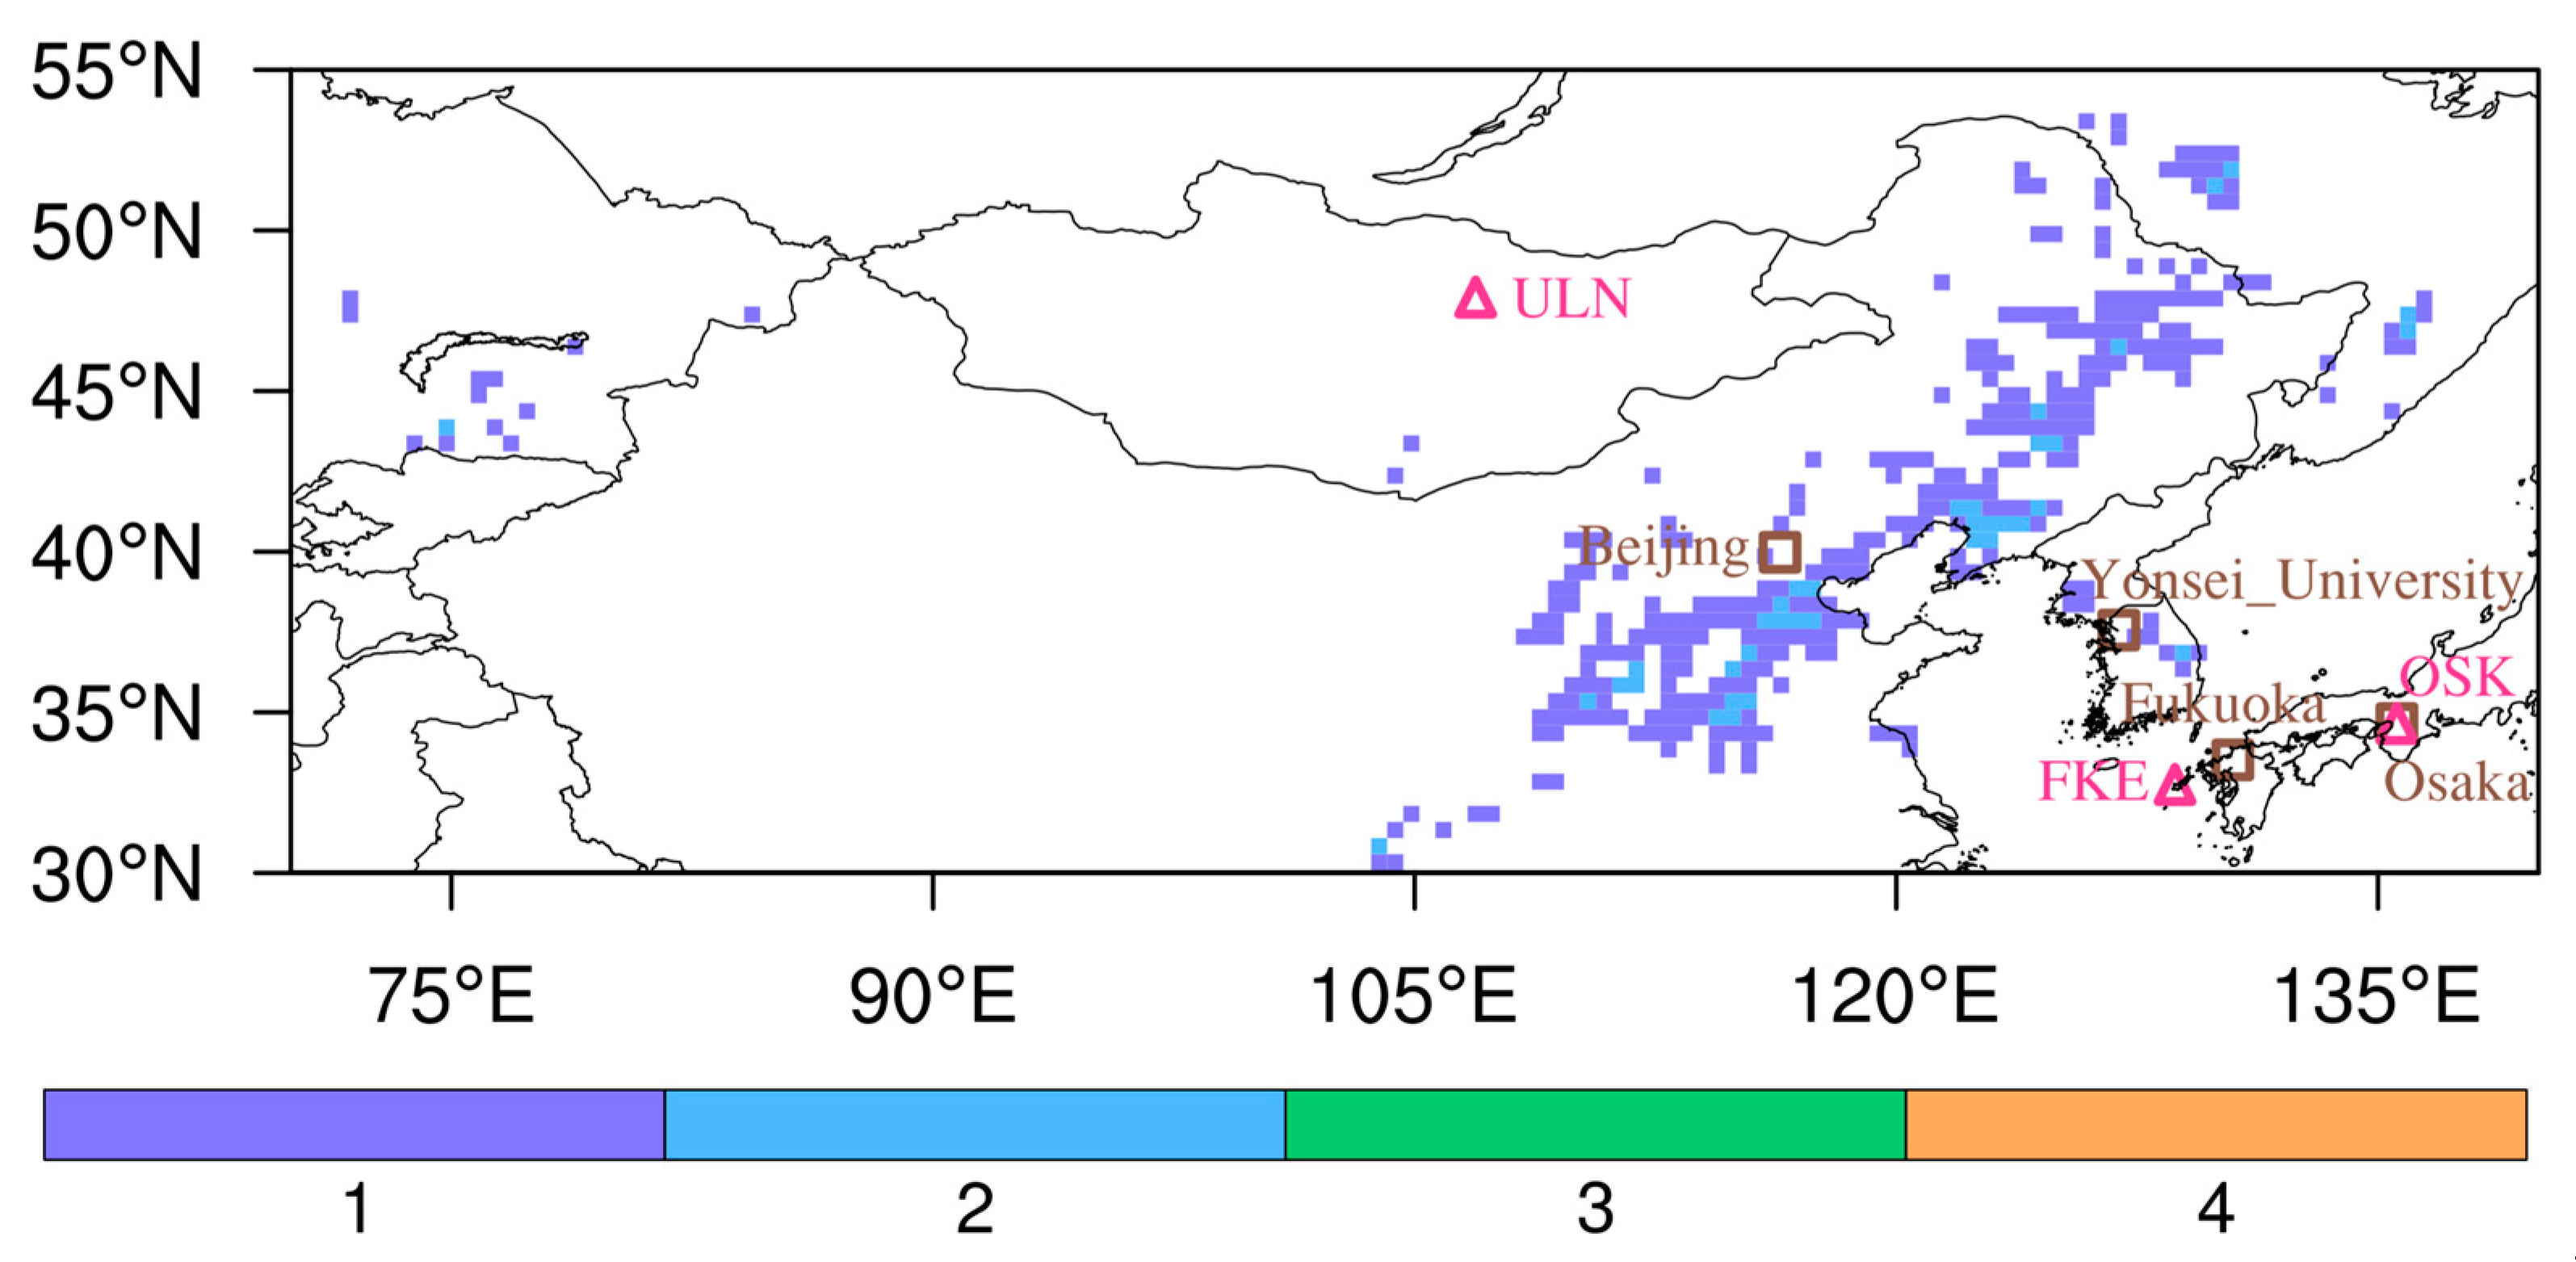
Figure 1. Number of hourly GCOM-C AOTs at 500 nm from 28 to 31 March 2018 for aerosol data assimilation over East Asia. Brown squares and pink triangles represent the locations of observation sites from the Aerosol Robotic Network (AERONET) and Asian Dust and Aerosol Lidar Observation Network (AD-Net), respectively, for independent validation.
Remotesensing 13 03020 g001
Figure 2. Spatial distributions of total AOTs and dust AOTs averaged from 28 to 31 March 2018 over East Asia for (a,b) FR and (c,d) DA experiments. (e,f) Differences in AOTs between the two experiments. Rectangle in green shown in lower-right panel represents the key areas of focus here.
Remotesensing 13 03020 g002
Figure 3. Spatial distributions of the biases and root mean square errors (RMSEs) between simulated and Global Change Observation Mission-Climate (GCOM-C)-observed AOTs at 500 nm from 28 to 31 March 2018 for (a,b) FR and (c,d) DA experiments. Scatter plots between GCOM-C-observed and simulated AOTs for (e) FR and (f) DA experiments. Solid line is the 1:1 line, dashed lines correspond to the 1:2 and 2:1 lines. (g) Frequency distributions of AOTs observed by GCOM-C and simulated in FR and DA experiments. (h) Frequency distributions of AOTs biases and percentages of biases within ±0.1, ±0.5, <−1.0, and >1.0.
Remotesensing 13 03020 g003
Figure 4. Spatial distributions of the daily mean dust AOTs from 28 to 31 March 2018 for FR and DA experiments with differences in daily mean dust AOTs between the two experiments.
Remotesensing 13 03020 g004
Figure 5. Spatial distributions of the total AOTs from 28 to 31 March 2018 for FR and DA experiments with differences in total AOTs between the two experiments. The daily mean AOTs in “dusty” stations from AERONET are also shown in circles.
Remotesensing 13 03020 g005
Figure 6. Time series of simulated AOTs at 440 nm for two experiments (FR in blue and DA in red) and AERONET-observed AOTs (dots in black) at 440 nm over four sites. Biases and root mean square errors (RMSEs) between AOTs simulated by the two experiments and AERONET-observed AOTs are shown.
Remotesensing 13 03020 g006
Figure 7. Comparisons of total observed aerosol extinction coefficients from AD-Net and simulated coefficients for FR and DA experiments from 28 to 31 March 2018 at three selected sites (ULN: Ulaanbaatar; FKE: Fukue; OSK: Osaka).
Remotesensing 13 03020 g007
Figure 8. Comparisons of observed dust aerosol extinction coefficients from AD-Net and simulated ones for FR and DA experiments from 28 to 31 March 2018 at three selected sites (ULN: Ulaanbaatar; FKE: Fukue; OSK: Osaka).
Remotesensing 13 03020 g008
Figure 9. Time series of simulated AOTs at 440 nm for two experiments (FR in blue and DA in red) and AERONET-observed AOTs (dots in black) at 440 nm over two sites. Root mean square errors (RMSEs) and correlations (CORRs) between AOTs simulated by the two experiments and the AERONET-observed AOTs are also shown.
Remotesensing 13 03020 g009
Figure 10. Profiles of simulated aerosol extinction coefficients at 550 nm (km−1) in (a) FR and (c) DA experiments and CALIOP-observed ones at (e) 532 nm over the CALIPSO orbit path (indicated by red curve) at 20:44:02 (UTC) on 1 April 2018. Spatial distributions of (b,d) simulated total AOTs and (f,h) dust AOTs for the two experiments. (g) CALIPSO-detected vertical aerosol sub-types.
Remotesensing 13 03020 g010
Figure 11. Profiles of simulated aerosol extinction coefficients at 550 nm (km−1) in (a) FR and (c) DA experiments and CALIOP-observed ones at (e) 532 nm over the CALIPSO orbit path (indicated by red curve) at 04:06:03 (UTC) on 2 April 2018. Spatial distributions of (b,d) simulated total AOTs and (f,h) dust AOTs for the two experiments. (g) CALIPSO-detected vertical aerosol sub-types.
Remotesensing 13 03020 g011
Table 1. Quality assurance flags (QA_Flags) used for the quality control of GCOM-C AOTs.
Flag NameOptional Bit ValueDescriptionSelected Bit Value
Data Availability0
1
Available
Not Available
0
Land/Water Flag0
1
Water
Land
1/0
Coastal Flag0
1
No
Yes
0
Cloud Flag0
1
Clear
Cloudy
0
Aerosol Optical Thickness Confidence Flag00
01
10
11
Very Good
Good
Marginal
No Confidence or Fill
00
Sun Glint Flag0
1
No
Yes
0
Stray Light Flag0
1
No
Yes
0
Cloud Shadow Possibility Flag0
1
No
Yes
0
Uncertain Surface Reflectance Flag0
1
No
Yes
0
Publisher’s Note: MDPI stays neutral with regard to jurisdictional claims in published maps and institutional affiliations.