Abstract
Most previous studies tend to simplify the lunar regolith as a homogeneous medium. However, the lunar regolith is not completely homogeneous, because there are weak reflections from the lunar regolith layer. In this study, we examined the weak heterogeneity of the lunar regolith layer using a self-organization model by matching the reflection pattern of both the lunar regolith layer and the top of the ejecta layer. After a series of numerical experiments, synthetic results show great consistency with the observed Chang’E-4 lunar penetrating radar data and provide some constraints on the range of controlling parameters of the exponential self-organization model. The root mean square permittivity perturbation is estimated to be about 3% and the correlation distance is about 5–10 cm. Additionally, the upper layer of ejecta has about 1–2 rocks per square meter, and the rock diameter is about 20–30 cm. These parameters are helpful for further study of structural characteristics and the evolution process of the lunar regolith. The relatively small correlation distance and root mean square perturbation in the regolith indicate that the regolith is mature. The weak reflections within the regolith are more likely to be due to structural changes rather than material composition changes.
1. Introduction
The structure of the lunar shallow surface is complex due to long-term impacting, sputtering and stacking processes; in addition, the Moon has no strong cementation due to the absence of interstitial water. Thus, the heterogeneity on the Moon can be well retained and is much stronger than that on the Earth. The remote-sensing spectrum and radar detection results show that there is a thick regolith layer on the top of the Von Kármán crater [1,2,3]. This provides an excellent opportunity for detection of the structural characteristics and the stacking mode of the lunar regolith, which are critical for understanding the formation process of the lunar regolith. However, in the past, the lunar regolith has usually been assumed to be a uniform layered medium [4,5,6,7,8]. A series of recent studies have shown that the lunar regolith is essentially inhomogeneous [9,10,11,12,13,14,15,16] but the specific structural characteristics of the lunar regolith are still unclear.
Radar is widely used in the exploration of the Moon and Mars, and has become a necessary tool to detect the underground structure of extraterrestrial bodies [17,18,19,20,21,22,23]. The exploration of the Moon, Mars, and other planets with penetrating radars may benefit from the long experience in using the same approaches (the same type of radars and models to interpret the measurements) in studies carried out on Earth. The Yutu-2 rover traveled a long distance (>500 m) with a fine spatial sampling interval (~3–5 cm) on the far side of the Moon. Such an observation provides a significant opportunity to explore the local fine structure under the rover’s path. The lunar regolith at the landing site has a thickness of up to ~12 m [24,25,26], which is much thicker than that detected on the near side of the Moon by the Chang’E-3 lunar penetrating radar (LPR) [27,28].
Surprisingly, even though the thickness of the lunar regolith is high (>10 m), the Chang’E-4 LPR profile still shows some weak reflections in the lunar regolith, and their amplitudes are far smaller than those of the reflections from the underlying ejecta. This indicates that the lunar regolith is not homogeneous but weakly heterogeneous. The weak heterogeneity of the lunar regolith does not seriously influence the imaging and inversion [24,29,30] because it is too weak compared with the reflections from the ejecta. However, further study of these weak heterogeneous characteristics would be helpful in revealing the process of lunar regolith formation, particularly to the most recent stage of local small impacts [31]. Of course, long-distance heavy bombardments may also convey an amount of small-particle ejecta and contribute to such an ultra-thick layer of fine regolith on the far side of the Moon [32].
Most traditional numerical simulations of LPR data assume layered models [4,5,6,7,8] and cannot well represent the heterogeneity of the lunar regolith. Recently, several works have considered the heterogeneity [9,10,11,12,13,14,15] but do not take typical models into account (e.g., cracks and ejecta). Lv et al. [16] constructed four typical models and performed numerical simulations using the time-domain finite-difference method, which can better present the wave propagation in the lunar regolith with strong heterogeneity. Some works noted the existence of weak heterogeneity of the lunar regolith [11,33,34,35]. However, to date, no numerical simulation has been conducted specifically on the weak heterogeneity of the lunar regolith, probably due to three aspects: 1. lack of methods describing heterogeneous media; 2. technical difficulty in constructing random models; 3. excessive computational cost of numerical simulations [16] compared with traditional methods. In this study, we assumed that the weak heterogeneity of the lunar regolith obeys the self-organization model [36], which is basically a stochastic approach for dealing with scattering waves through randomly inhomogeneous structures and is well known in the seismology field; then, we used the finite-difference time-domain method [16] to carry out a series of numerical simulations using various models; next, we analyzed the influence of different parameters on the weak reflection characteristics; finally, we constrained the possible range of each controlling parameter through grid searching techniques by matching the numerical simulation results with the Yutu-2 LPR observations, in terms of waveforms, envelopes, and reflection patterns.
2. Modeling and Simulation
The weak heterogeneity of the lunar regolith can be described by a stochastic model [36]. We keep a small part of the underlying ejecta by adding some sputtering blocks to the stochastic model [16]. This can provide a reliable reference for checking the amplitude variations from weak reflections of the lunar regolith to strong reflections of ejecta.
First, we generate a 2D dielectric permittivity background according to the typical 1D lunar regolith model [37,38,39] (Figure 1) and , where is the relative dielectric permittivity, (g/cm3) is the density, and (cm) is the depth. The velocity of radar wave propagation within the lunar regolith can be converted from the dielectric permittivity as , where is the velocity of the radar wave and is the speed of light in vacuum [40]. Then, we add some random perturbations and some ejecta to the background model to generate the model.
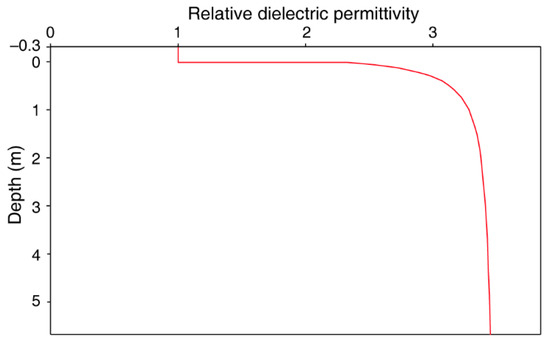
Figure 1.
The 1D background model of relative dielectric permittivity of the lunar regolith. There is a 0.3 m vacuum layer between the radar antennas and the lunar surface.
The 2D model has a width of 15 m and a depth of 16 m (Figure 2). From top to bottom, it includes a 0.3 m thick vacuum medium (with a relative dielectric permittivity of 1) between the rover bottom and the lunar surface, a 12 m thick random medium representing the lunar regolith, and a ~4 m thick random medium with some rocky blocks (i.e., ejecta layer). The numerical simulation method and parameter settings are consistent with those of Lv et al. [16]. The finite-difference method [41,42] is used to discretization the spatial partial derivatives of Maxwell’s curl equation [43,44], and only the 2D transverse electric pattern is considered. The radar frequency is 400 MHz to avoid visible numerical dispersion. We can analyze the reflection characteristics of the lunar regolith by either a snapshot of the wavefield at a given time or a waveform at a given position.
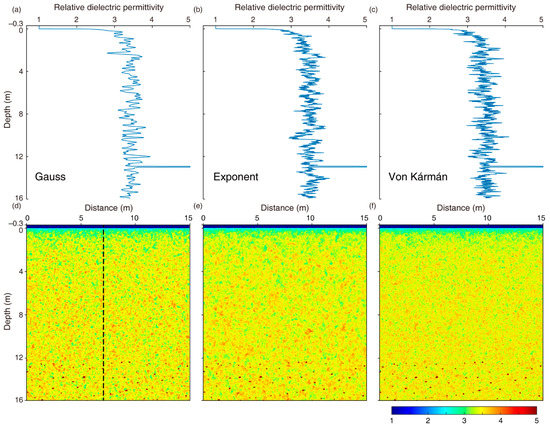
Figure 2.
The Gaussian, exponential, and Von Kármán (zero-order) types of random media. (a–c) Fluctuation of the 1D probe along the center of the 2D model. (d–f) 2D relative dielectric permittivity models for three types of random media. The color bar represents the relative dielectric permittivity.
2.1. Self-Organization Model
The self-organization model is an important approach for describing stochastic media. The controlling parameters generally include the mean value, variance (or standard deviation), and autocorrelation function (ACF). The ACF and its corresponding power spectral density function (PSDF) are the two most important parameters to reflect the distribution characteristics of random media. The most widely used autocorrelation functions include Gaussian, exponential, and Von Kármán types [45,46,47,48]. In the stochastic process theory, the PSDF is the Fourier transformation of ACF [49]. To characterize the random media, we define the ACF of the fractional permittivity fluctuation as:
where non-dimensional quantity is the fractional fluctuation of the permittivity, is the mean permittivity, and is the perturbation of permittivity. This provides a statistical measure of the spatial scale and the magnitude of medium inhomogeneity.
The most tractable ACF is Gaussian ACF (Figure 2a,d), as given by:
where is the correlation distance. For the 3D case, the PSDF is:
where is the wavenumber vector and . The Gaussian ACF is used to describe the medium with poor short-wavelength components because the PSDF goes rapidly to zero for a large . Many models are based on the Gaussian ACF due to its solid mathematical background [50,51].
Another commonly used model is the exponential ACF (Figure 2b,e):
For the 3D case, the PSDF is
There is an extension of the exponential ACF, called Von Kármán ACF (Figure 2c,f):
where is the gamma function and is the -th order modified Bessel function of the second kind. For the 3D case, the PSDF is:
Compared with the Gaussian ACF, the Von Kármán ACF (including exponential ACF) is more suitable for describing the random permittivity inhomogeneity of the lunar regolith due to the power law property of the Von Kármán ACF [36].
We assume that the randomness is spatially stationary, and we individually add Gaussian, exponential, and Von Kármán (zero-order) random fractional fluctuations to the background model. The ejecta are then added at the bottom of the lunar regolith (Figure 2).
Figure 3 shows the numerical simulation results of these three models. Because of the poor short-wavelength component of Gaussian ACF random media, their reflection characteristics show more long-wavelength structures. Compared with the Gaussian media, the Von Kármán media (including the exponential type) show more short-wavelength structures. Due to the intense sputtering and stacking process, the heterogeneity of the lunar regolith should be more consistent with the Von Kármán (including the exponential type) media [35,36,52]. However, we cannot well distinguish its difference from the exponential ACF due to the limited radar wave resolution, even though the zero-order Von Kármán model has greater heterogeneity at small scales. Therefore, we choose the exponential ACF to construct random media in the following experiments. This can simplify the model and facilitate the discussion of the results.
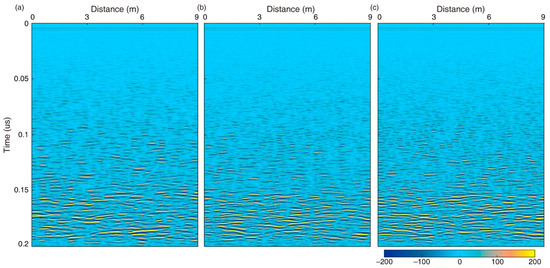
Figure 3.
The simulated LPR profiles of the three models shown in Figure 2. (a) Gaussian ACF random media; (b) exponential ACF random media; (c) Von Kármán ACF media. The color bar represents intensity (arbitrary units).
2.2. The Model of Lunar Regolith
The correlation distance and root mean square (RMS) perturbation are two key parameters to describe the self-organization random media; thus, we concentrate on these two parameters in the numerical simulations. These two parameters have a relatively clear physical meaning: the correlation distance can well constrain the variation range of regolith permittivity and the RMS perturbation can well present the extent of regolith permittivity variation. Different groups of correlation distance and RMS perturbation limit the physical properties and structural characteristics of the lunar regolith.
We established different models of 5–20 cm correlation distance and 1–7% RMS perturbation. Figure 4 shows three exponential ACF random media with different correlation distances, namely, 5, 10, and 20 cm, respectively. Figure 5 shows three exponential ACF random media with different RMS perturbations of 3, 5, and 7%, respectively. Sputtering stones were also added below the 12 m depth of the lunar regolith.
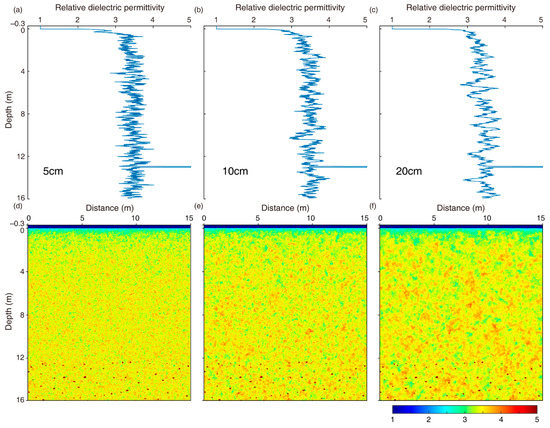
Figure 4.
Exponential ACF models with different correlation distances. (a–c) Fluctuation of the 1D probe along the center of 2D model. (d–f) 2D relative dielectric permittivity models with three correlation distances. The correlation distances were (a,d) 5 cm, (b,e) 10 cm, and (c,f) 20 cm, respectively. The RMS perturbation is 5%.
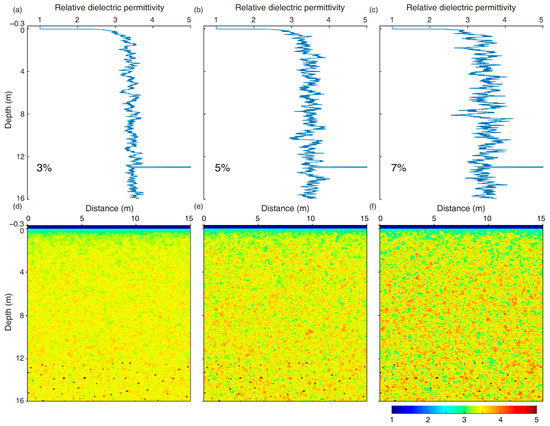
Figure 5.
Exponential ACF models with different RMS perturbations. (a–c) Fluctuation of the 1D probe along the center of the 2D model. (d–f) 2D relative dielectric permittivity models with three perturbations. The RMS perturbation were (a,d) 3%, (b,e) 5%, and (c,f) 7%, respectively. The correlation distance is 10 cm.
For the sake of simplicity, we only select the critical groups of controlling parameters by plotting them together, as shown in Figure 6, although we actually performed a vast number of numerical simulations. Figure 6 well presents the sensitivity of each controlling parameter. Obviously, a large correlation distance corresponds to weak reflections; in addition, a large RMS perturbation corresponds to strong reflections. Therefore, we can fit the Yutu-2 LPR data by searching for different correlation distances and RMS perturbations to obtain the subsurface features of the lunar regolith at the Chang’E-4 landing site.
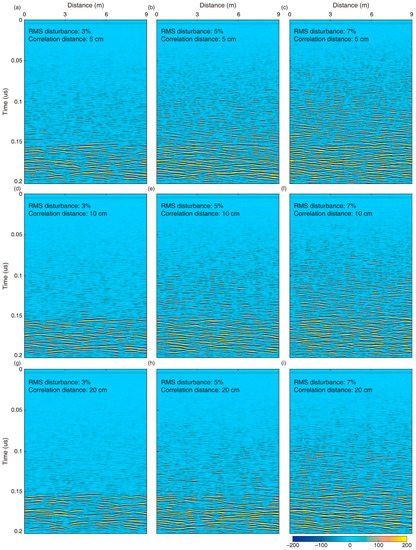
Figure 6.
Numerical simulation results using different parameters. The three columns from left to right are with RMS perturbation of 3%, 5%, and 7%, respectively. The three rows from top to bottom are with correlation distance of 5, 10, and 20 cm, respectively.
2.3. The Diameter and Stacking Density of Rocky Blocks
A 4 m thick ejecta layer at the bottom was used to qualitatively identify the rock size and spatial density in the shallow surface of ejecta. The physical properties of the lunar regolith were further determined by the relative amplitude of weak reflections within the lunar regolith compared with the strong reflections from the ejecta layer. We set up three kinds of models: without rocky blocks (Figure 7a), with several ~20 cm rocks (Figure 7b), and with a ~1 m rock (Figure 7c). The simulated LPR profiles of these three models are shown in Figure 8.

Figure 7.
The random model: (a) without rocky blocks; (b) with ~20 cm rocks; (c) with a ~1 m rock.
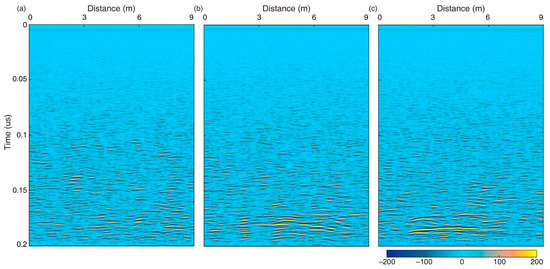
Figure 8.
The simulated LPR profiles using the models shown in Figure 7. (a) Without rocky blocks; (b) with ~20 cm rocks; (c) with a ~1 m rock.
The numerical simulation results show that the purely random model does not indicate an obvious interface between the lunar regolith and the ejecta layer, and the reflection patterns in different time windows are similar (Figure 8a). After adding the rocky blocks at the bottom, an obvious interface appears (Figure 8b). In contrast, a large rock corresponds to a wide range of reflections in the shape of a hyperbola with a slight curvature (Figure 8c). Therefore, a single big rock (e.g., ≥1 m) or without rocky blocks does not match the LPR observations. There must be a stack of rocks at the bottom of the model. We further used different stacking densities (i.e., low, moderate, and high) of small rocks and constrained their diameters (Figure 9). Our results show that the rock diameters should range from ~20 to ~30 cm, and the stacking density of rocks should be about 1–2 within each square meter, as shown in Figure 9 and Figure 10.
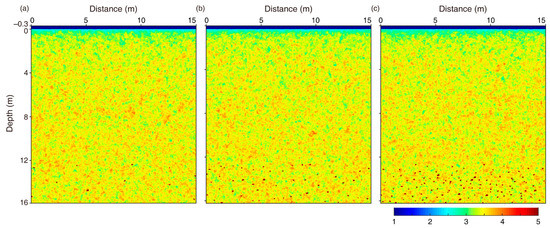
Figure 9.
The ejecta model with small (a), medium (b), and large (c) spatial densities of rocks.
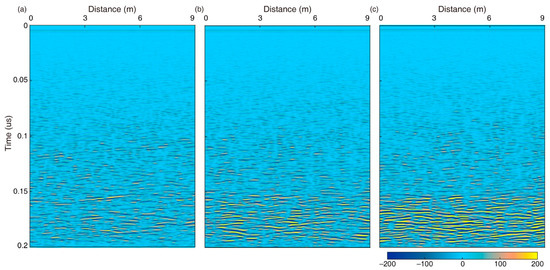
Figure 10.
The simulated LPR profiles using the models shown in Figure 9. (a) With small spatial density of rocks; (b) with medium spatial density of rocks; (c) with large spatial density of rocks.
3. Results
To evaluate the structural characteristics of the regolith near the Chang’E-4 landing site, we quantitatively compared the Yutu-2 radar data with the simulated data. We adopted the envelope-stacking method [53], which discards phase information and only considers energy variations. This method has been successfully applied to seismograms for characterizing small-scale spatial heterogeneity of the mantle [54,55]. We took a small segment of the Yutu-2 LPR profile processed by Zhang et al. [24] as a reference. For both observed and synthetic data, we first calculated the envelope of each trace and then stacked them together. We also normalized the stacked envelopes and calculated the correlation coefficients as well as square errors between the observed and synthetic data (Table 1 and Table 2). We only selected the data from 0.06 to 0.2 μs (~5–16 m) because the reflection patterns and energy of the first few meters could not be well considered by our numerical simulation method. More explanations on this can be found in the Discussion section.

Table 1.
Correlation coefficients between Yutu-2 LPR data and synthetic data.

Table 2.
Square errors between Yutu-2 LPR data and synthetic data.
As shown in Figure 11 and Figure 12, the stacked envelopes can well reflect the relative magnitude variation of reflections from the regolith and ejecta layers. As shown in Figure 13 and Figure 14, when the correlation coefficient is large or the square error is small, the stacked envelope also fits well with the observed data (Figure 11). Obviously, both the weak reflection of the lunar regolith and the strong reflection from the ejecta have good consistency in terms of radar profiles (Figure 15) and stacked envelopes (Figure 11). Therefore, we can determine the best group of the two controlling parameters: the correlation distance of the self-organization model is about 5–10 cm and the RMS perturbation is about 3%. In contrast, the other RMS perturbations (e.g., 1%, 5%, and 7%) show significant deviations from the stacked envelopes of the observed data. This indicates that the proposed method is sensitive to constraining the range of RMS perturbation. In addition, with the increasing value of RMS perturbation from 1% to 7%, the correlation coefficient changes accordingly and has a consistently varying trend. This indicates that the proposed method is feasible and robust for the evaluation of the RMS perturbation.
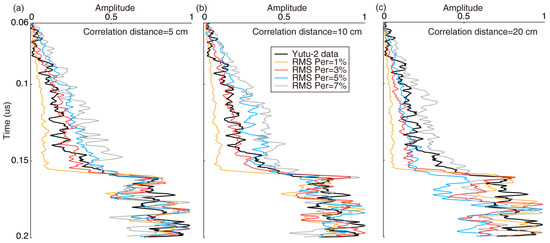
Figure 11.
Comparison between stacked envelopes of the observed and synthetic LPR data using different correlation distances and RMS perturbations. (a) Correlation distance is 5 cm. (b) Correlation distance is 10 cm. (c) Correlation distance is 20 cm. The amplitude is normalized for each stacked envelope.
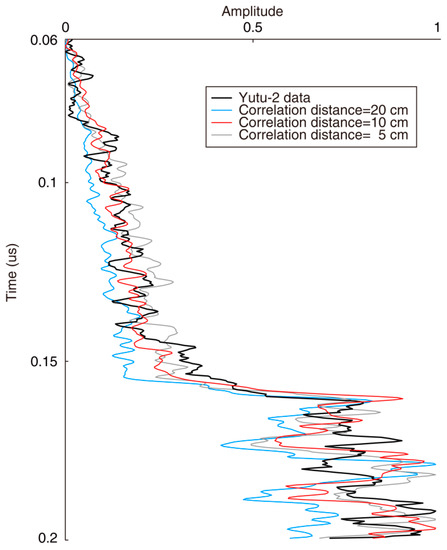
Figure 12.
Comparison between stacked envelopes of the observed and synthetic LPR data with an RMS perturbation of 3%. The amplitude is normalized for each stacked envelope.
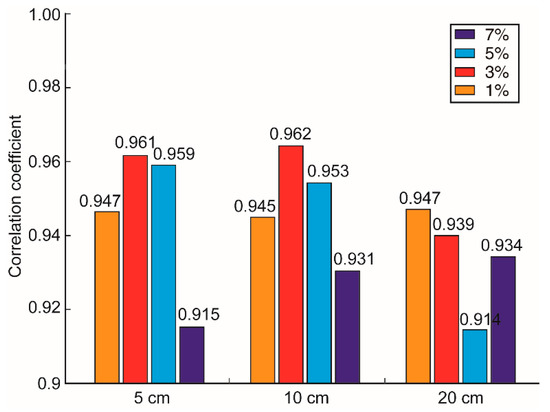
Figure 13.
Comparison of correlation coefficients between stacked envelopes of the observed and synthetic LPR data. These correlation coefficients are listed in Table 1.
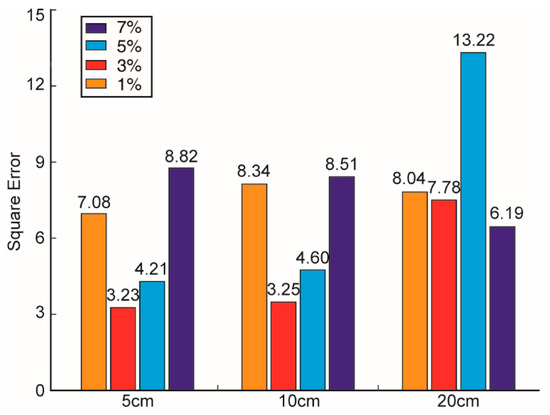
Figure 14.
Comparison of square errors between stacked envelopes of the Yutu-2 LPR data and the synthetic data. These square errors are listed in Table 2.
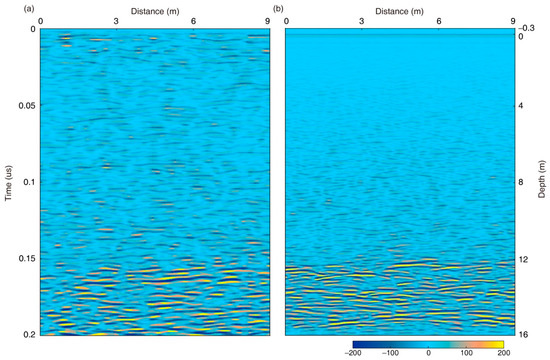
Figure 15.
(a) Yutu-2 radar profile. (b) Numerical simulation LPR profile with correlation distance of 10 cm and RMS perturbation of 3%.
The correlation distance (about 5–10 cm) is reasonable because it is smaller than the spatial resolution (about 30 cm) of the high-frequency (500 MHz) channel of the LPR [56]; otherwise, we would observe a clear diffraction or reflection if the correlation distance was comparable to or bigger than 30 cm. The RMS perturbation of 3% is also reasonable for weak reflections of the lunar regolith, considering that a much higher perturbation or contrast would cause more evident reflections. Such a small RMS perturbation means that there is no significant variation of regolith materials; instead, local weak variations of structures due to an uneven deposit or gardening would be expected. The diffractions would be evident if the scattering body (with a much higher permittivity compared with that of the regolith) is close to the ground surface [16]; however, we did not observe clear diffractions within the whole regolith layer from 0 to 12 m, even around the upper surface. This indicates that the permittivity variation within the regolith should be relatively gentle. Therefore, we conclude that the RMS perturbation of 3% and the correlation distance (about 5–10 cm) well reflect the physical property of the regolith variations.
Figure 12 shows that a correlation distance of 5–10 cm is the best estimation, because that of 20 cm has a lower correlation coefficient and larger square errors compared with the observed LPR data. These results also indicate that the proposed method is not as sensitive to constraining the correlation distance within a range of 5 to 10 cm, at least compared with its high sensitivity to constraining the RMS perturbation. Considering the relatively small correlation distance and RMS perturbation in the regolith, we argue that this is more likely to be due to structural changes rather than material composition changes.
The size (or diameter) of rocks is estimated to be about 20–30 cm, which is reasonable because it is comparable with the spatial resolution (about 30 cm) of the LPR payload [56]. The stacking density of rocks is only about 1–2 per square meter, which is consistent with the expectation of the shallow structure of the ejecta [57]. Note that the total depth of this layer is up to 4 m (Figure 15). Such a thick layer with low spatial density of rocks may indicate that it experienced a completely different gardening history, because it is significantly different from the upper fine regolith layer and the typical rocky ejecta layer (at ~20 m depth). It may be the transitional zone from ejecta to the regolith.
The LPR signals detected by the Chang’E-4 mission in the Von Kármán crater mainly appear below 12 m, and there are almost no strong reflected waves in the shallow area. Our results show that the weak heterogeneity of lunar regolith is only about 3%, and its correlation distance is no more than 10 cm. Such a low degree of heterogeneity indicates that the lunar soil is mature in the Von Kármán crater. Consequently, it allows radar wave energy to penetrate more deeply, up to 45 m. In contrast, the lunar regolith is less mature in the Imbrium basin [27] compared with that in the Von Kármán crater. This kind of regolith would have a strong scattering effect, particularly close to the upper surface [16]. As a result, it would prevent radar waves from penetrating more deeply; thus, the LPR signals detected by the Chang’E-3 mission in the Imbrium basin are mainly concentrated within 5 m, with almost no clear deep reflections. This indicates that the regolith maturity may be reflected by the radar wave energy and the maximum penetrating depth. Therefore, in addition to the difference in chemical components, the maturity or heterogeneity of the regolith layer also contribute to the LPR reflections.
4. Discussion
The observed data have relatively strong reflections within the depth of ~1–2 m on the top of the lunar regolith, but we could not explain them at the current stage because their simulation must consider the antenna effect and 3D models. Our code is currently able to process 2D random media but cannot well consider the antenna effect; in contrast, gprMax [58] can consider the antenna effect but it has significant difficulty in constructing random models [16]. Nevertheless, both the stacked envelope and reflection pattern are well matched between the synthetic and observed LPR data from ~5 to 16 m, as shown in Figure 11 and Figure 15. This verifies the feasibility of the proposed method.
As shown in Figure 11 and Figure 12, the stacked envelopes of the synthetic data can well match those of the Yutu-2 radar data before 0.16 μs (corresponding to the bottom of the regolith layer), compared with those after 0.17 μs (corresponding to the top of ejecta layer). The amplitudes of reflections from rocks after 0.17 μs are also influenced by the rocks’ position and depth; however, it is not necessary to better match the stacked envelopes of this part because we concentrate on the weak heterogeneity of the regolith layer, and the ejecta layer is only introduced to qualitatively evaluate the relative amplitude variations from the regolith layer to the ejecta layer. The local peak amplitudes of the stacked envelopes after 0.17 μs are generally comparable to each other; therefore, they can well present the general energy of reflections within the ejecta layer and may be a good reference to evaluate the general energy of reflections within the regolith layer.
In this paper, we only present 12 models with three correlation distances (i.e., 5, 10, and 20 cm) and four RMS perturbations (i.e., 1, 3, 5, and 7%). However, we actually tested a large number of various models to estimate the possible ranges of all parameters. Similarly, significant efforts were also made for estimating the rock diameter and spatial density. We used the 2D finite-difference time-domain method to simulate the LPR data [16,26]; unfortunately, even for a 2D model, and using an appropriate setting for the finite-difference method to avoid evident artifacts [16], processing would take about one day (~24 h) when running on a supercomputing cluster with 40 cores; that is, 3D numerical simulations are almost unaffordable at present, even though the radar waves are actually propagating through 3D random media.
The self-organization characteristics of the lunar regolith are only inferred by the Yutu-2 LPR data using numerical simulations, which may be corroborated using a drilling core. However, all existing drilling cores on the Moon are located on the near side, and the maximum length is no more than 3 m [18,59,60]. This indicates that our model cannot be verified from the perspective of geology until deeper drilling can be carried out on the far side of the Moon (to at least 5 m).
5. Conclusions
We used three self-organization random models with different autocorrelation functions to simulate the lunar regolith on the far side of the Moon. We also added randomly distributed rocks under the 12 m thick regolith to simulate the ejecta. Through a series of comparative analyses of the simulated and observed LPR data, we found that the structure of the lunar regolith in the landing area of Chang’E-4 can be expressed by an exponential autocorrelation random model. Numerical simulations were proven to be capable of quantitatively estimating statistical parameters of the regolith. The correlation distance was estimated to be about 5–10 cm and the RMS perturbation was about 3%. The ejecta under the lunar regolith is relatively sparse, only containing about 1–2 rocks per square meter; in addition, the diameter of the rocks is about 20–30 cm, which is comparable to but smaller than the spatial resolution of the high-frequency LPR. These results well constrain the ranges of the controlling parameters of self-organization models and provide a qualitative evaluation of the spatial density of the rocks on the top of ejecta layer. The relatively small correlation distance and RMS perturbation in the regolith indicate that the regolith is mature. The weak reflections within the regolith at the Chang’E-4 landing site are more likely to be due to local weak changes of structures rather than material composition changes.
Author Contributions
Conceptualization, X.Z. and J.Z.; methodology, X.Z., W.L., L.Z. and J.Z.; software, L.Z. and J.Z.; validation, Y.L. and Z.Y.; formal analysis, Y.L. and J.Z.; investigation, X.Z. and J.Z.; resources, Y.L. and J.Z.; data curation, X.Z. and J.Z.; writing—original draft preparation, X.Z.; writing—review and editing, J.Z.; visualization, X.Z. and J.Z.; supervision, Z.Y. and J.Z.; project administration, J.Z.; funding acquisition, J.Z. All authors have read and agreed to the published version of the manuscript.
Funding
This research was funded by the Strategic Priority Research Program of Chinese Academy of Sciences (XDA17010404) and the National Natural Science Foundation of China (41941002).
Data Availability Statement
The data used in this work is available on the Science and Application Center for Moon and Deep Space Exploration, Chinese Academy of Sciences (http://moon.bao.ac.cn accessed on 31 July 2021).
Acknowledgments
We thank the Supercomputing Laboratory of Institute of Geology and Geophysics, Chinese Academy of Sciences (IGGCAS) for providing computing resources.
Conflicts of Interest
The funders had no role in the design of the study; in the collection, analyses, or interpretation of data; in the writing of the manuscript, or in the decision to publish the results.
References
- Di, K.; Zhu, M.; Yue, Z.; Lin, Y.; Wan, W.; Liu, Z.; Gou, S.; Liu, B.; Peng, M.; Wang, Y.; et al. Topographic Evolution of von Kármán Crater Revealed by the Lunar Rover Yutu-2. Geophys. Res. Lett. 2019, 46, 12764–12770. [Google Scholar] [CrossRef]
- Lin, H.; Lin, Y.; Yang, W.; He, Z.; Hu, S.; Wei, Y.; Xu, R.; Zhang, J.; Liu, X.; Yang, J.; et al. New Insight into Lunar Regolith-Forming Processes by the Lunar Rover Yutu-2. Geophys. Res. Lett. 2020, 47, e2020GL087949. [Google Scholar] [CrossRef]
- Gou, S.; Yue, Z.; Di, K.; Wang, J.; Wan, W.; Liu, Z.; Liu, B.; Peng, M.; Wang, Y.; He, Z.; et al. Impact Melt Breccia and Surrounding Regolith Measured by Chang’e-4 Rover. Earth Planet. Sci. Lett. 2020, 544, 116378. [Google Scholar] [CrossRef]
- Fa, W. Simulation for Ground Penetrating Radar (GPR) Study of the Subsurface Structure of the Moon. J. Appl. Geophys. 2013, 99, 98–108. [Google Scholar] [CrossRef]
- Dai, S.; Su, Y.; Xiao, Y.; Feng, J.; Xing, S.; Ding, C. Echo Simulation of Lunar Penetrating Radar: Based on a Model of Inhomogeneous Multilayer Lunar Regolith Structure. Res. Astron. Astrophys. 2014, 14, 1642–1653. [Google Scholar] [CrossRef]
- Su, Y.; Fang, G.; Feng, J.; Xing, S.; Ji, Y.; Zhou, B.; Gao, Y.; Li, H.; Dai, S.; Xiao, Y.; et al. Data Processing and Initial Results of Chang’e-3 Lunar Penetrating Radar. Res. Astron. Astrophys. 2014, 14, 1623–1632. [Google Scholar] [CrossRef]
- Zhao, N.; Zhu, P.; Yuan, Y.; Zhang, B.; Deng, J. The Shallow Subsurface Structures of Chang’e-3 Landing Site Based on the Wavefield Characteristics of LPR Channel-2B Data. Adv. Space Res. 2018, 62, 884–889. [Google Scholar] [CrossRef]
- Zhang, L.; Li, J.; Zeng, Z.; Xu, Y.; Liu, C.; Chen, S. Stratigraphy of the Von Kármán Crater Based on Chang’e-4 Lunar Penetrating Radar Data. Geophys. Res. Lett. 2020, 47, e2020GL088680. [Google Scholar] [CrossRef]
- Hu, Y.; Zeng, Z.; Li, J.; Liu, F. Simulation and Processing of LPR Onboard the Rover of Chang’e-3 Mission: Based on Multilayer Lunar Regolith Structure Stochastic Media Model. In Proceedings of the International Conference on Ground Penetrating Radar, Hong Kong, China, 13–16 June 2016. [Google Scholar]
- Ding, C.; Su, Y.; Xing, S.; Dai, S.; Xiao, Y.; Feng, J.; Liu, D.; Li, C. Numerical Simulations of the Lunar Penetrating Radar and Investigations of the Geological Structures of the Lunar Regolith Layer at the Chang’e 3 Landing Site. Int. J. Antenn. Propag. 2017, 2017, 1–11. [Google Scholar] [CrossRef]
- Feng, J.; Su, Y.; Ding, C.; Xing, S.; Dai, S.; Zou, Y. Dielectric Properties Estimation of the Lunar Regolith at Ce-3 Landing Site Using Lunar Penetrating Radar Data. Icarus 2017, 284, 424–430. [Google Scholar] [CrossRef]
- Lai, J.L.; Xu, Y.; Zhang, X.; Tang, Z. Lunar Regolith Stratigraphy Analysis Based on the Simulation of Lunar Penetrating Radar Signals. Adv. Space Res. 2017, 60, 2099–2107. [Google Scholar] [CrossRef]
- Li, J.; Zeng, Z.; Liu, C.; Huai, N.; Wang, K. A Study on Lunar Regolith Quantitative Random Model and Lunar Penetrating Radar Parameter Inversion. IEEE. Geosci. Remote Sens. 2017, 14, 1953–1957. [Google Scholar] [CrossRef]
- Zhang, L.; Zeng, Z.; Li, J.; Huang, L.; Huo, Z.; Wang, K.; Zhang, J. Parameter Estimation of Lunar Regolith from Lunar Penetrating Radar Data. Sensors 2018, 18, 2907. [Google Scholar] [CrossRef]
- Zhang, L.; Zeng, Z.; Li, J.; Huang, L.; Huo, Z.; Zhang, J.; Huai, N. A Story of Regolith Told by Lunar Penetrating Radar. Icarus 2019, 321, 148–160. [Google Scholar] [CrossRef]
- Lv, W.; Li, C.; Song, H.; Zhang, J.; Lin, Y. Comparative Analysis of Reflection Characteristics of Lunar Penetrating Radar Data Using Numerical Simulations. Icarus 2020, 350, 113896. [Google Scholar] [CrossRef]
- Boisson, J.; Heggy, E.; Clifford, S.M.; Yoshikawa, K.; Anglade, A.; Lognonne, P. Radar Sounding of Temperate Permafrost in Alaska: Analogy to the Martian Midlatitude to High-Latitude Ice-Rich Terrains. J. Geophys. Res. Planets 2011, 116. [Google Scholar] [CrossRef]
- Yang, W.; Lin, Y. New Lunar Samples Returned by Chang’e-5: Opportunities for New Discoveries and International Collaboration. Innovation 2021, 2, 100070. [Google Scholar] [CrossRef]
- Fa, W.; Wieczorek, M.A. Regolith Thickness over the Lunar Nearside: Results from Earth-Based 70-CM Arecibo Radar Observations. Icarus 2012, 218, 771–787. [Google Scholar] [CrossRef]
- Lai, J.; Xu, Y.; Bugiolacchi, R.; Meng, X.; Xiao, L.; Xie, M.; Liu, B.; Di, K.; Zhang, X.; Zhou, B.; et al. First Look by the Yutu-2 Rover at the Deep Subsurface Structure at the Lunar Farside. Nat. Commun. 2020, 11, 3426. [Google Scholar] [CrossRef]
- Tian, H.; Zhang, T.; Jia, Y.; Peng, S.; Yan, C. Zhurong: Features and Mission of China’s First Mars Rover. Innovation 2021, 2, 100121. [Google Scholar] [CrossRef]
- Jia, Y.; Zou, Y.; Ping, J.; Xue, C.; Yan, J.; Ning, Y. The Scientific Objectives and Payloads of Chang’e-4 Mission. Planet. Space Sci. 2018, 162, 207–215. [Google Scholar] [CrossRef]
- Li, C.; Zuo, W.; Wen, W.; Zeng, X.; Gao, X.; Liu, Y.; Fu, Q.; Zhang, Z.; Su, Y.; Ren, X.; et al. Overview of the Chang’e-4 Mission: Opening the Frontier of Scientific Exploration of the Lunar Far Side. Space Sci. Rev. 2021, 217, 35. [Google Scholar] [CrossRef]
- Zhang, J.; Zhou, B.; Lin, Y.; Zhu, M.; Song, H.; Dong, Z.; Gao, Y.; Di, K.; Yang, W.; Lin, H.; et al. Lunar Regolith and Substructure at Chang’e-4 Landing Site in South Pole-Aitken Basin. Nat. Astron. 2021, 5, 25–30. [Google Scholar] [CrossRef]
- Li, C.; Su, Y.; Pettinelli, E.; Xing, S.; Ding, C.; Liu, J.; Ren, X.; Lauro, S.; Soldovieri, F.; Zeng, X.; et al. The Moon’s Farside Shallow Subsurface Structure Unveiled by Chang’E-4 Lunar Penetrating Radar. Sci. Adv. 2020, 6, eaay6898. [Google Scholar] [CrossRef] [PubMed]
- Zhang, L.; Xu, Y.; Bugiolacchi, R.; Hu, B.; Liu, C.; Lai, J.; Zeng, Z.; Huo, Z. Rock Abundance and Evolution of the Shallow Stratum on Chang’e-4 Landing Site Unveiled by Lunar Penetrating Radar Data. Earth Planet. Sci. Lett. 2021, 564, 116912. [Google Scholar] [CrossRef]
- Zhang, J.; Yang, W.; Hu, S.; Lin, Y.; Fang, G.; Li, C.; Peng, W.; Zhu, S.; He, Z.; Zhou, B.; et al. Volcanic History of the Imbrium Basin: A Close-up View from the Lunar Rover Yutu. Proc. Natl. Acad. Sci. USA 2015, 112, 5342–5347. [Google Scholar] [CrossRef] [PubMed]
- Chen, S.; Meng, Z.; Cui, T.; Lian, Y.; Wang, J.; Zhang, X. Geologic Investigation and Mapping of the Sinus Iridum Quadrangle from Clementine, Selene, and Chang’e-1 Data. Sci. China. Phys. Mech. 2010, 53, 2179–2187. [Google Scholar] [CrossRef]
- Song, H.; Li, C.; Zhang, J.; Wu, X.; Liu, Y.; Zou, Y. Rock Location and Property Analysis of Lunar Regolith at Chang’e-4 Landing Site Based on Local Correlation and Semblance Analysis. Remote Sens. 2020, 13, 48. [Google Scholar] [CrossRef]
- Li, C.; Zhang, J. Velocity Analysis Using Separated Diffractions for Lunar Penetrating Radar Obtained by Yutu-2 Rover. Remote Sens. 2021, 13, 1387. [Google Scholar] [CrossRef]
- Cai, Y.; Fa, W. Meter-scale Topographic Roughness of the Moon: The effect of Small Impact Craters. J. Geophys. Res. Planets 2020, 125, e2020JE006429. [Google Scholar] [CrossRef]
- Gou, S.; Yue, Z.; Di, K.; Cai, Z.; Liu, Z.; Niu, S. Absolute Model Age of Lunar Finsen Crater and Geologic Implications. Icarus 2021, 354, 114046. [Google Scholar] [CrossRef]
- Hu, B.; Wang, D.; Zhang, L.; Zeng, Z. Rock Location and Quantitative Analysis of Regolith at the Chang’e 3 Landing Site Based on Local Similarity Constraint. Remote Sens. 2019, 11, 530. [Google Scholar] [CrossRef]
- Fa, W.; Zhu, M.; Liu, T.; Plescia, J.B. Regolith Stratigraphy at the Chang’e-3 Landing Site as Seen by Lunar Penetrating Radar. Geophys. Res. Lett. 2015, 42, 10179–10187. [Google Scholar] [CrossRef]
- Onodera, K.; Kawamura, T.; Tanaka, S.; Ishihara, Y.; Maeda, T. Numerical Simulation of Lunar Seismic Wave Propagation: Investigation of Subsurface Scattering Properties near Apollo 12 Landing Site. J. Geophys. Res. Planets 2021, 126, e2020JE006406. [Google Scholar] [CrossRef]
- Sato, H.; Fehler, M.C.; Maeda, T. Seismic Wave Propagation and Scattering in the Heterogeneous Earth, 2nd ed.; Springer: Berlin/Heidelberg, Germany, 2012. [Google Scholar]
- Olhoeft, G.R.; Strangway, D.W. Dielectric Properties of the First 100m of the Moon. Earth Planet. Sci. Lett. 1975, 24, 394–404. [Google Scholar] [CrossRef]
- Heiken, G.; Vaniman, D.; French, B.M. Lunar Sourcebook, a User’s Guide to the Moon; CUP Archive: Cambridge, UK, 1991. [Google Scholar]
- Dong, Z.; Fang, G.; Zhao, D.; Zhou, B.; Gao, Y.; Ji, Y. Dielectric Properties of Lunar Subsurface Materials. Geophys. Res. Lett. 2020, 47, e2020GL089264. [Google Scholar] [CrossRef]
- Conyers, L.B.; Goodman, D. Ground-Penetrating Radar: An Introduction for Archaeologists; AltaMira Press: Walnut Creek, CA, USA, 1997. [Google Scholar]
- Yee, K.S. Numerical Solution of Initial Boundary Value Problems Involving Maxwell’s Equations in Isotropic Media. IEEE. Trans. Antenn. Propag. 1966, 14, 302–307. [Google Scholar] [CrossRef]
- Taflove, A.; Hagness, S. Computational Electrodynamics: The Finite-Difference Time-Domain Method; Artech House, Inc.: Norwood, MA, USA, 2005; pp. 629–670. [Google Scholar] [CrossRef]
- Feng, D.; Dai, Q.; Ji-Shan, H.; Gang, H. Finite Difference Time Domain Method of GPR Forward Simulation. Prog. Phys. Geog. 2006, 2, 630–636. [Google Scholar] [CrossRef]
- Irving, J.; Knight, R. Numerical Modeling of Ground-Penetrating Radar in 2-D Using Matlab. Comput. Geosci. 2006, 32, 1247–1258. [Google Scholar] [CrossRef]
- Levander, A.R.; Holliger, K. Small-Scale Heterogeneity and Large-Scale Velocity Structure of the Continental Crust. J. Geophys. Res. 1992, 97, 8797–8804. [Google Scholar] [CrossRef]
- Ikelle, L.T.; Yung, S.K.; Daube, F. 2-D Random Media with Ellipsoidal Autocorrelation Functions. Geophysics 1993, 58, 1359–1372. [Google Scholar] [CrossRef]
- Witte, O.; Roth, M.; Müller, G. Ray Tracing in Random Media. Geophys. J. Int. 1996, 124, 159–169. [Google Scholar] [CrossRef][Green Version]
- Frankel, A.; Clayton, R.W. Finite Difference Simulations of Seismic Scattering: Implications for the Propagation of Short-Period Seismic Waves in the Crust and Models of Crustal Heterogeneity. J. Geophys. Res. 1986, 91, 6465–6489. [Google Scholar] [CrossRef]
- Goff, J.A.; Jordan, T.H. Stochastic Modeling of Seafloor Morphology: Inversion of Sea Beam Data for Second-Order Statistics. J. Geophys. Res. 1988, 93, 13589–13608. [Google Scholar] [CrossRef]
- Holliger, K. Upper-Crustal Seismic Velocity Heterogeneity as Derived from a Variety of P-Wave Sonic Logs. Geophys. J. Int. 1996, 125, 813–829. [Google Scholar] [CrossRef]
- Wu, R.; Xu, Z.; Li, X. Heterogeneity Spectrum and Scale-Anisotropy in the Upper Crust Revealed by the German Continental Deep-Drilling (KTB) Holes. Geophys. Res. Lett. 1994, 21, 911–914. [Google Scholar] [CrossRef]
- Weber, R.C.; Knapmeyer, M.; Panning, M.; Schmerr, N.; Tong, V.C.H.; Garcia, R.A. Modeling Approaches in Planetary Seismology. In Extraterrestrial Seismology; Tong, V.C.H., Garcia, R.A., Eds.; Cambridge University Press: Cambridge, UK, 2015; pp. 140–156. [Google Scholar]
- Shearer, P.M.; Earle, P.S. Observing and Modeling Elastic Scattering in The Deep Earth. Adv. Geophys. 2008, 50, 167–193. [Google Scholar] [CrossRef]
- Mancinelli, N.J.; Shearer, P.M. Reconciling Discrepancies Among Estimates of Small-scale Mantle Heterogeneity from PKP Precursors. Geophys. J. Int. 2013, 195, 1721–1729. [Google Scholar] [CrossRef]
- Shearer, P.M.; Earle, P.S. The Global Short-period Wavefield Modelled with a Monte Carlo Seismic Phonon Method. Geophys. J. Int. 2004, 158, 1103–1117. [Google Scholar] [CrossRef]
- Fang, G.; Zhou, B.; Ji, Y.; Zhang, Q.; Shen, S.; Li, Y.; Guan, H.; Tang, C.; Gao, Y.; Lu, W.; et al. Lunar Penetrating Radar Onboard the Chang’e-3 Mission. Res. Astron. Astrophys. 2014, 14, 1607–1622. [Google Scholar] [CrossRef]
- Mcgetchin, T.R.; Settle, M.; Head, J.W. Radial Thickness Variation in Impact Crater Ejecta: Implications for Lunar Basin Deposits. Earth Planet. Sci. Lett. 1973, 20, 226–236. [Google Scholar] [CrossRef]
- Giannopoulos, A. Modelling Ground Penetrating Radar by gprMax. Constr. Build. Mater. 2005, 19, 755–762. [Google Scholar] [CrossRef]
- Jolliff, B.L.; Wieczorek, M.A.; Shearer, C.K.; Neal, C.R. New Views of the Moon; Mineralogical Society of America: Chantilly, VA, USA, 2006. [Google Scholar]
- Deng, X.J.; Zheng, Y.H.; Jin, S.Y.; Yao, M.; Zhao, Z.H.; Li, H.L.; Jiang, S.Q.; Wang, G.X. Design and Implementation of Sampling, Encapsulating, and Sealing System of Chang’e-5. Sci. Sin. Technol. 2021, 51, 753–762. [Google Scholar] [CrossRef]
Publisher’s Note: MDPI stays neutral with regard to jurisdictional claims in published maps and institutional affiliations. |
© 2021 by the authors. Licensee MDPI, Basel, Switzerland. This article is an open access article distributed under the terms and conditions of the Creative Commons Attribution (CC BY) license (https://creativecommons.org/licenses/by/4.0/).