Abstract
In the recent years, convolutional neural networks (CNN)-based super resolution (SR) methods are widely used in the field of remote sensing. However, complicated remote sensing images contain abundant high-frequency details, which are difficult to capture and reconstruct effectively. To address this problem, we propose a dense channel attention network (DCAN) to reconstruct high-resolution (HR) remote sensing images. The proposed method learns multi-level feature information and pays more attention to the important and useful regions in order to better reconstruct the final image. Specifically, we construct a dense channel attention mechanism (DCAM), which densely uses the feature maps from the channel attention block via skip connection. This mechanism makes better use of multi-level feature maps which contain abundant high-frequency information. Further, we add a spatial attention block, which makes the network have more flexible discriminative ability. Experimental results demonstrate that the proposed DCAN method outperforms several state-of-the-art methods in both quantitative evaluation and visual quality.
1. Introduction
High-resolution (HR) remote sensing images provide detailed geometric information about land cover. Thus, HR remote sensing images are essential for many applications, such as object detection [1,2], urban planning [3], building extraction [4,5,6] and so on [7,8,9,10,11,12,13,14,15]. However, the spatial resolution of remote sensing images are influenced by the limitations of hardware and environmental factors [16,17,18]. Compared to current physical imaging technology, super resolution (SR) which recovers HR images from low-resolution (LR) images is more convenient and low cost. Thus, SR becomes an alternative method in the remote sensing field.
SR can be classified into single image super resolution (SISR) and multiple image super resolution (MISR) [19] by the number of input images. MISR methods utilize multiple LR images of the same area, to provide more information, to better reconstruct high spatial-frequency details and texture [20]. Nevertheless, it is difficult to obtain multiple remote sensing images of the same scene. Thus, this paper considers a study of SISR methods. The traditional SISR methods [21] are mainly grouped into interpolation-based methods and reconstruction-based methods [22]. The interpolation-based methods predict the unknown pixel using a simple linear or non-linear interpolation [23] operation. Although interpolation-based methods are convenient, they have limited performance for images which contain more details. The reconstruction-based methods utilize a certain kind of prior information to produce better results, such as local, nonlocal and sparse priors [23,24]. Although reconstruction-based methods [25] are flexible and allow consideration of different prior constraints [26,27,28,29,30,31], they also have difficulties with complicated remote sensing images. Recently, deep learning-based methods attracted a lot of attention in the remote sensing images super resolution task. In 2015, a super resolution convolutional neural network (SRCNN) [32] was first proposed by Dong et al. to achieve the natural images super resolution. As the poineer, SRCNN learned the mapping between the HR images and the corresponding LR images using a three layers network. While SRCNN had outperformed traditional-based methods, bicubic LR images made the network to operate in a high-dimensional space and largely increased the computational cost. To alleviate the problem, a fast super resolution convolutional neural netork (FSRCNN) [33] and an efficient subpixel convolutional network (ESPCN) [34] were proposed which used a deconvolutional layer and a subpixel convolutional layer to achieve direct reconstruction in a low-dimensional space and save the computational cost, respectively. These networks were shallow and their performance were limited by the network depth. However, increasing the network depth leads to a vanishing gradient and an exploding gradient. To handle the problem, the skip connection operation [35] was proposed by He et al., which combined the low-level features and high-level features to effectively alleviate the gradient vanishing. Thus, the skip connection operation was gradually used in the SR networks. Among these networks, the very deep super resolution convolutional network (VDSR) [36] which used a global residual connection was proposed by Kim et al. to spread the LR information to the network end. It was the first network which introduced the residual learning to SR and succeeded training a 20-layer network. Besides, enhanced deep super resolution (EDSR) [37] and SRResNet [38] also used global residual connection. In addition, EDSR and SRResNet employed residual blocks as basic network module, which introduced local residual connection to ease the deep network training difficulty. Later, Zhang et al. [39] constructed a residual in residual structure where residual blocks compose residual groups using short and long skip connections. Further, cascading residual network (CARN) [40], dense deep back-projection network (D-DBPN) [41], SRDenseNet [42], residual dense network (RDN) [43], employed the dense skip connections or multiple skip connections to increase the training effect.
Deep learning-based SR methods in the field of remote sensing also developed fast in recent years. In 2017, a local-global combined network (LGC) [19] was first proposed by Lei et al. to enhance the spatial resolution of remote sensing images. LGC learns multi-level information including local details and global priors using the skip connection operation. In 2018, a residual dense backprojection network (RDBPN) [22] was proposed by Pan et al., which consists of several residual dense backprojection blocks that contain the upprojection module and the downprojection module. In 2020, Zhang et al. proposed a scene adaptive method [44] via a multi-scale attention network to enhance the SR reconstruction details under the different remote sensing scenes. Recently, an approach named dense-sampling super resolution network (DSSR) [45] presented a dense sampling mechanism which reuses an upscaler to upsample and overcome the large-scale remote sensing images SR reconstruction problem. However, the complex spatial distribution of remote sensing images need more attention. In 2020, a second-order multi-scale super resolution network (SMSR) [46] was proposed by Dong et al. to reuse the learned multi-level information to the high-frequency regions of remote sensing images. The multi-perception attention network (MPSR) [47] and the multi-scale residual neural network (MRNN) [48] are also doing some related work about using multi-scale information. In addition, the generative adversarial network (GAN)-based SR method is used to generate visually pleasing remote sensing images. In 2019, Jiang et al. presented an edge-enhancement generative adversarial network (EEGAN) [49], which introduces an edge enhancement module to improve the remote sensing images SR performance. In 2020, Lei et al. proposed a coupled-discriminated generative adversarial network (CDGAN) [50] for solving the discrimination-ambiguity problem for the low-frequency regions in the remote sensing images.
Although the above-mentioned methods have good performance, their results can be further improved. First, the distributions of remote sensing images are very complex; therefore, we need more high-frequency details and texture to better reconstruct HR images. Secondly, redundancy feature information are not beneficial to recover details and increase computation cost. So, we propose a dense channel attention network (DCAN) which learns multi-level feature information and pays more attention to the important and useful regions in order to better reconstruct the final image. The major contributions are as follows:
- (1)
- We propose a DCAN for SR of the single remote sensing image, which makes full use of the features learned at different depths through densely using multi-level feature information and pay more attention to high-frequency regions. Both quantitative and qualitative evaluations demonstrate the superiority of DCAN over the state-of-the-art methods.
- (2)
- A dense channel attention mechanism (DCAM) is proposed to utilize the channel attention block through the dense skip connection manner. This mechanism can increase the flow of information through the network and improve the representation capacity of the network.
- (3)
- A spatial attention block (SAB) is added to the network. This helps the network have more flexible discriminative ability for different local regions. It contributes to reconstruct the final image. In addition, this helps the network have more flexible discriminative ability for global structure and focus on high-frequency information from the spatial dimension.
2. Method
2.1. Network Architecture
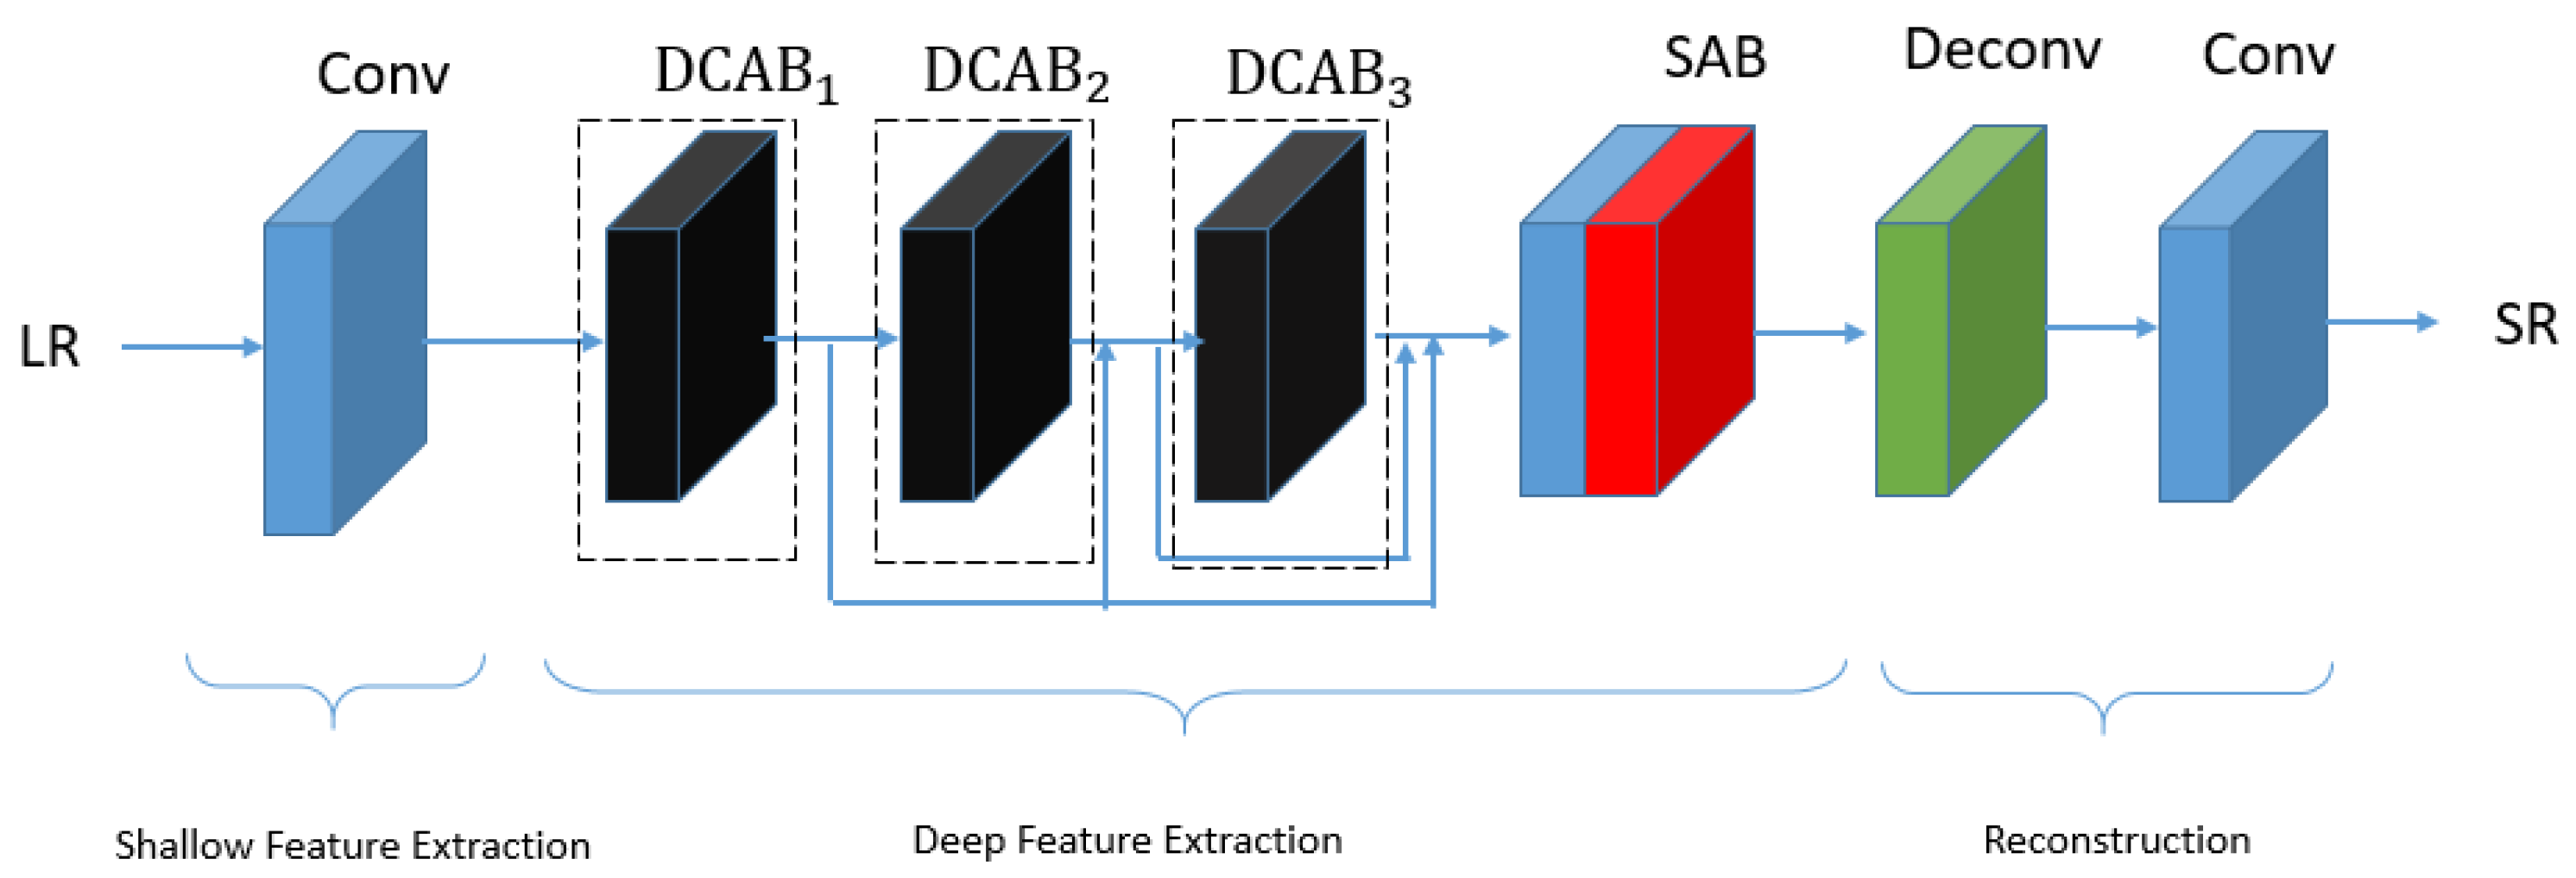
The architecture of our proposed DCAN is illustrated in Figure 1, which consists of three parts: shallow feature extraction, deep feature extraction, and reconstruction. The network first extracts the shallow features from the input LR image. Then, the second part extracts the deep features and increase the weights of important feature maps. Finally, the features which contain abundant useful information are sent to the third part of network for reconstruction. The network details will be introduced in the next part.

Figure 1.
The structure of the proposed dense channel attention network (DCAN).
- (1)
- Shallow Feature Extraction: Let Conv(k, f, c) be a convolutional layer, where k, f, c represent the filter kernel size, the number of filters, and the number of filter channels, respectively. We use a convolutional layer to extract the shallow feature from the input image , which contributes to the next feature extraction. The shallow feature extraction operation can be formulated as follows:
- (2)
- Deep Feature Extraction: After the shallow feature extraction, the backbone part which contains a series of Dense Channel Attention blocks () and a Spatial Attention Block (SAB) is designed to extract deep features. The main block DCAB receives the feature maps from each single DCAB as input, the structure of which will be given in Section 2.2. Then, the feature which is the sum of output features of G is sent to a convolutional layer:where is generated by the convolution operation, G denotes the number of . Then, the is sent to a SAB as follows:where denotes the operation of the SAB. The operational details will be described in Section 2.3.
- (3)
- Reconstruction: The reconstruction part contains two convolutional layers and a deconvolution layer. The SR image is generated as follows:where denotes the operation of the deconvolution layer.
2.2. Dense Channel Attention Mechanism
As discussed in Section 1, most existing super-resolution models do not make full use of the information from the input LR image. So, we propose a novel dense channel attention mechanism to solve the problem. It concentrates on the high-frequency information and weakens the useless information. Figure 2 shows DCAM, which can be described that the DCAB computes the feature map from the outputs of the as follows:
where denotes the operation of the DCAB, denote the outputs of the . The purpose of DCAM is to focus on high-frequency components and make better use of the information.

Figure 2.
The structure of dense channel attention mechanism (DCAM).
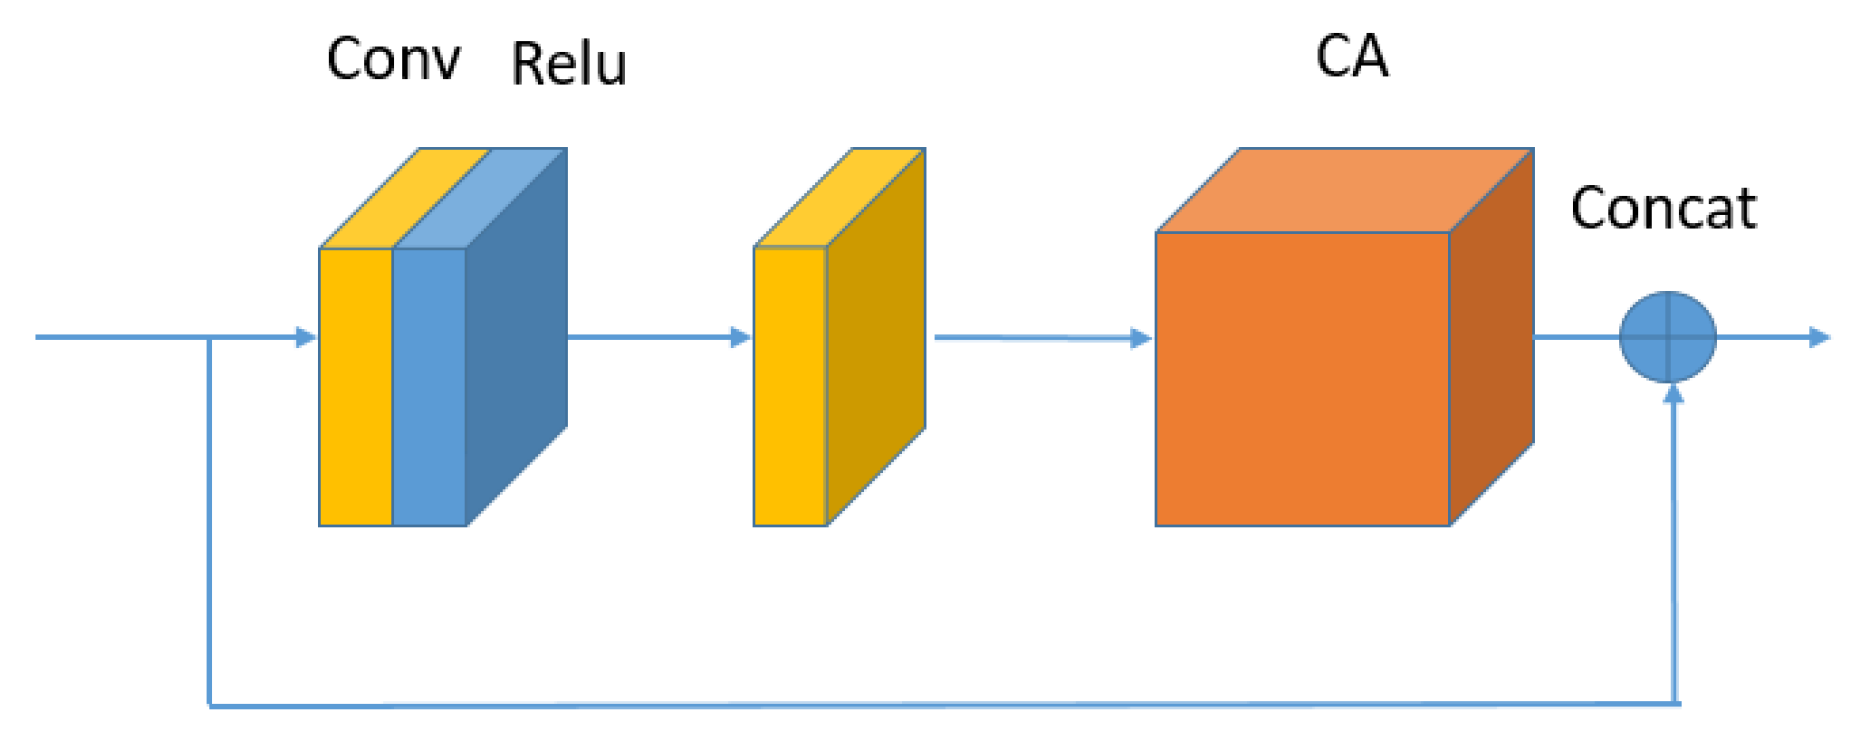
As shown in Figure 2, the DCAB is the basic block of the proposed DCAM. It mainly contains two convolutional layers and a CA (Channel Attention) block. To be specific, in Figure 3, the first convolutional layer before Relu consists of filters of size . The second convolutional layer after Relu contains filters of size . Let be the input of (the i-th DCAB in the ), there is
where is an intermediate feature contaninting feature maps. and denote the weight matrix of filters of size and filters of size . indicates the Relu activation.

Figure 3.
The structure of dense channel attention block (DCAB).
Then, CA is used to improve the discriminative learning ability. As shown in Figure 4, the mechanism of CA can be formulated as follows:
where is the output of , is the feature map of , are the elements of , ⊗ indicates the elementwise product. is a dimensional channel statistical descriptor, which is used to update . is obtained by
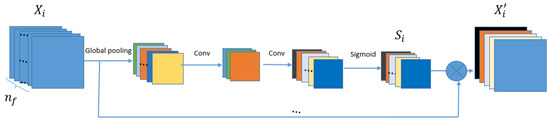
Figure 4.
The structure of Channel Attention Block (CA).
It contains several operations, including global average pooling , channel-down , Relu activation , channel-up , and sigmoid function , on (r is set to 16). The channel statistical descriptor can help express the different information among the feature maps of .
As shown in Figure 3, the input of the DCAB is from the output of . In general, the complete operation of DCAB can be formulated as follows:
This operation increases the flow of information through the network and the representation capacity of the network.
2.3. Spatial Attention Block
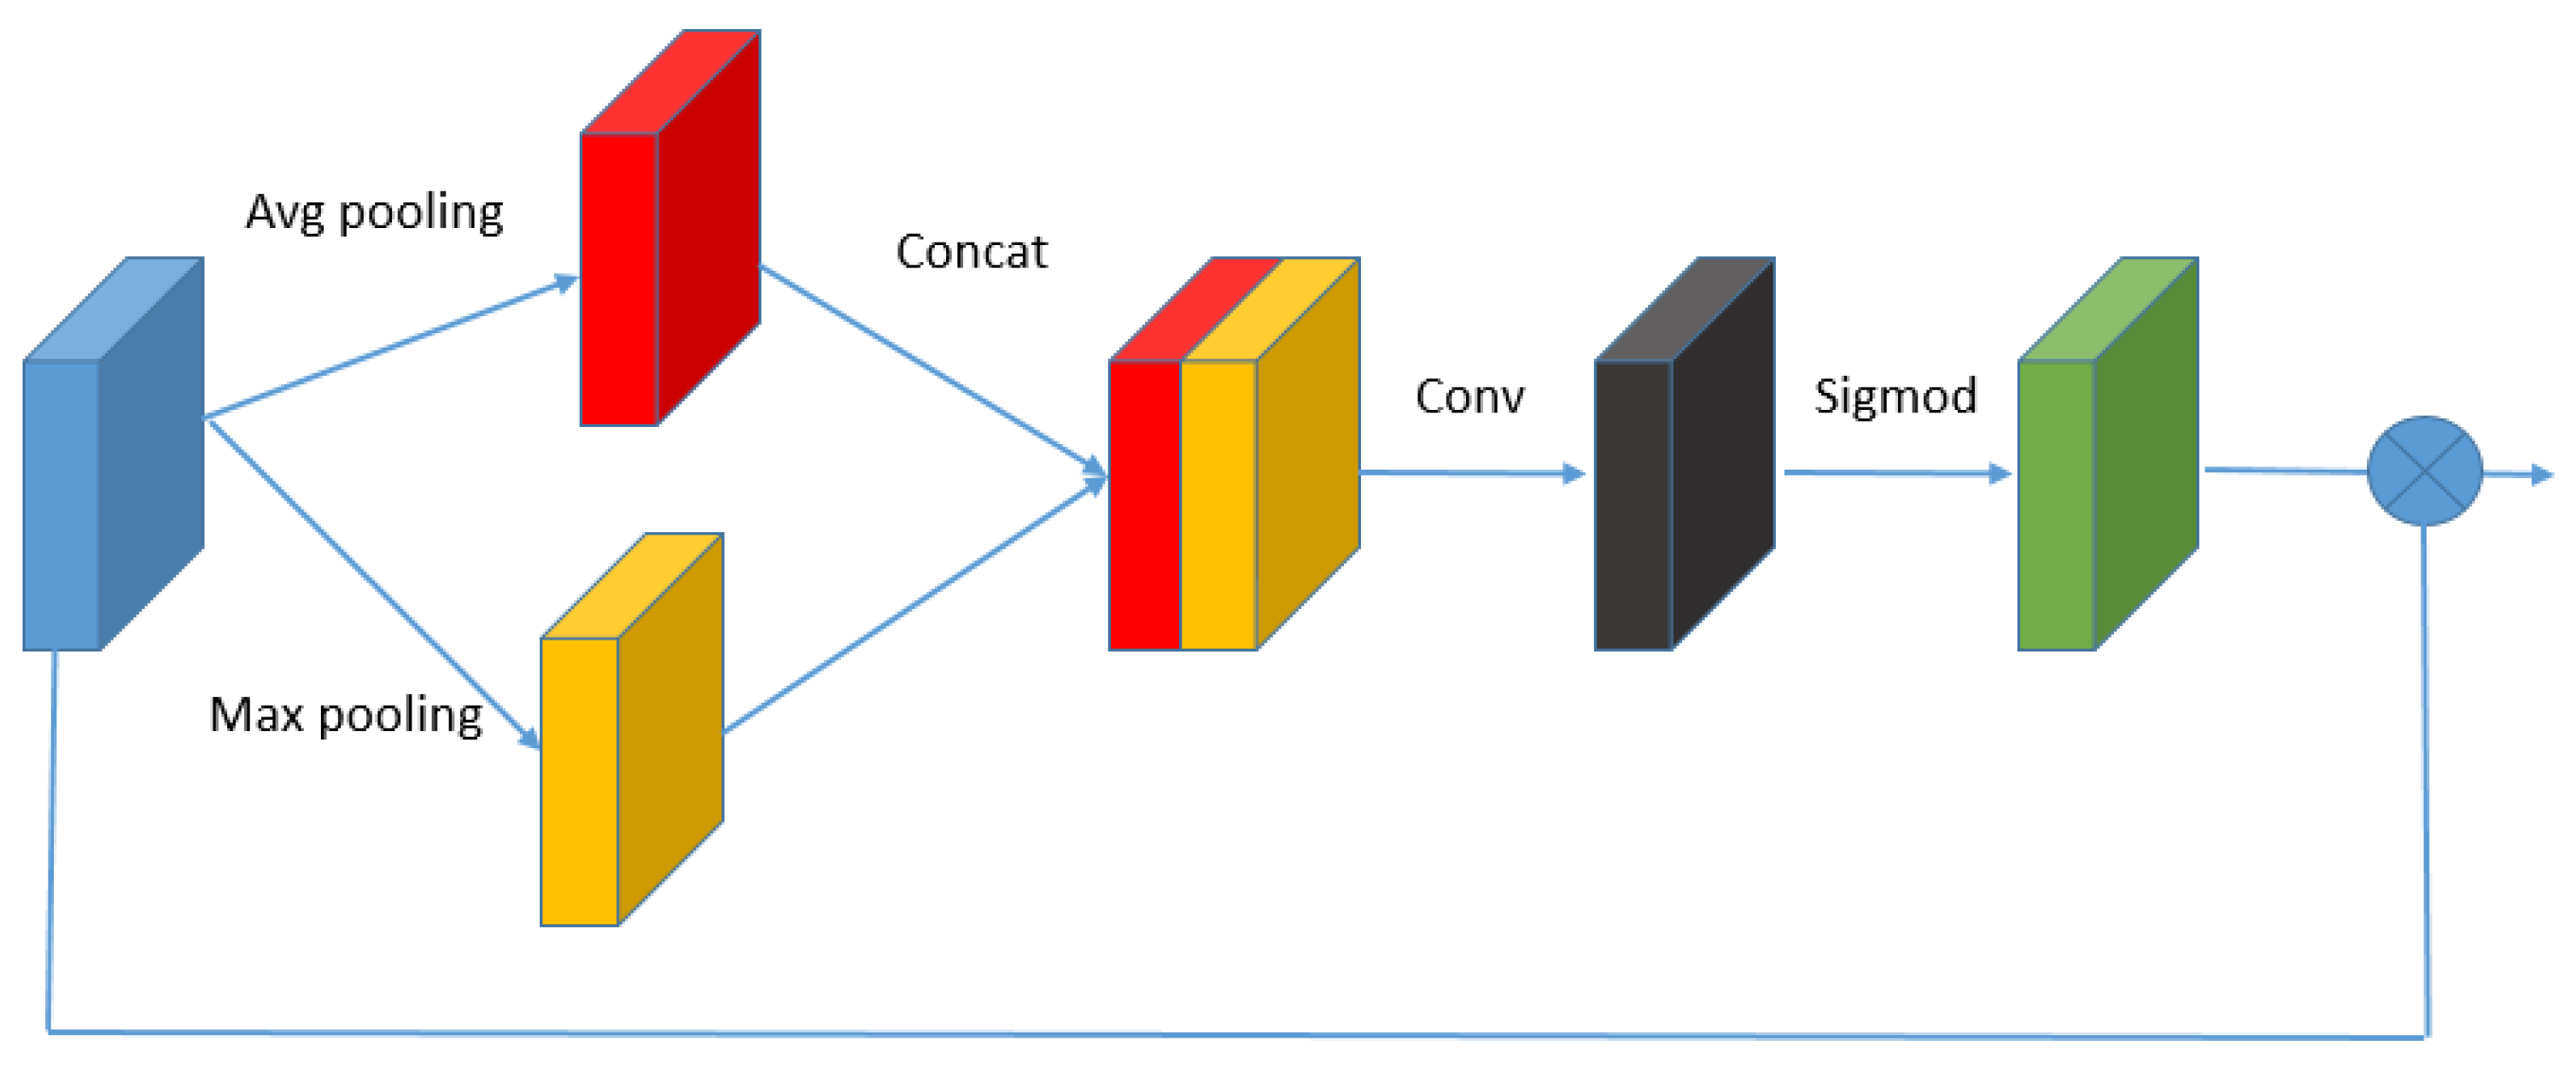
Considering the complicated spatial information and distribution of the remote sensing images, we add a SAB to increase the discriminative ability of the network. It helps the network have discriminative ability for different local regions and pay more attention to the regions which are more important and more difficult to reconstruct. As shown in Figure 5, the operation of SAB can be formulated as follows:
where is obtained by several operations, including average pooling , , concat , channel-down , sigmoid function , and element-wise product . The operation of SAB can focus on the local regions of which are useful to reconstruct.

Figure 5.
The structure of Spatial Attention Block (SAB).
2.4. Loss Function
We use the loss as the total loss because the loss can support better convergence. In addition, the loss can be described as follows:
where represents the whole parameter of the DCAN network, n represents the number of training images. The purpose of the loss function is that the reconstructed HR image can be similar to its corresponding ground truth image .
3. Results
3.1. Experimental Settings
The relevant experimental settings on the experimental datasets, degradation method, and evaluation metrics are detailed in this section.
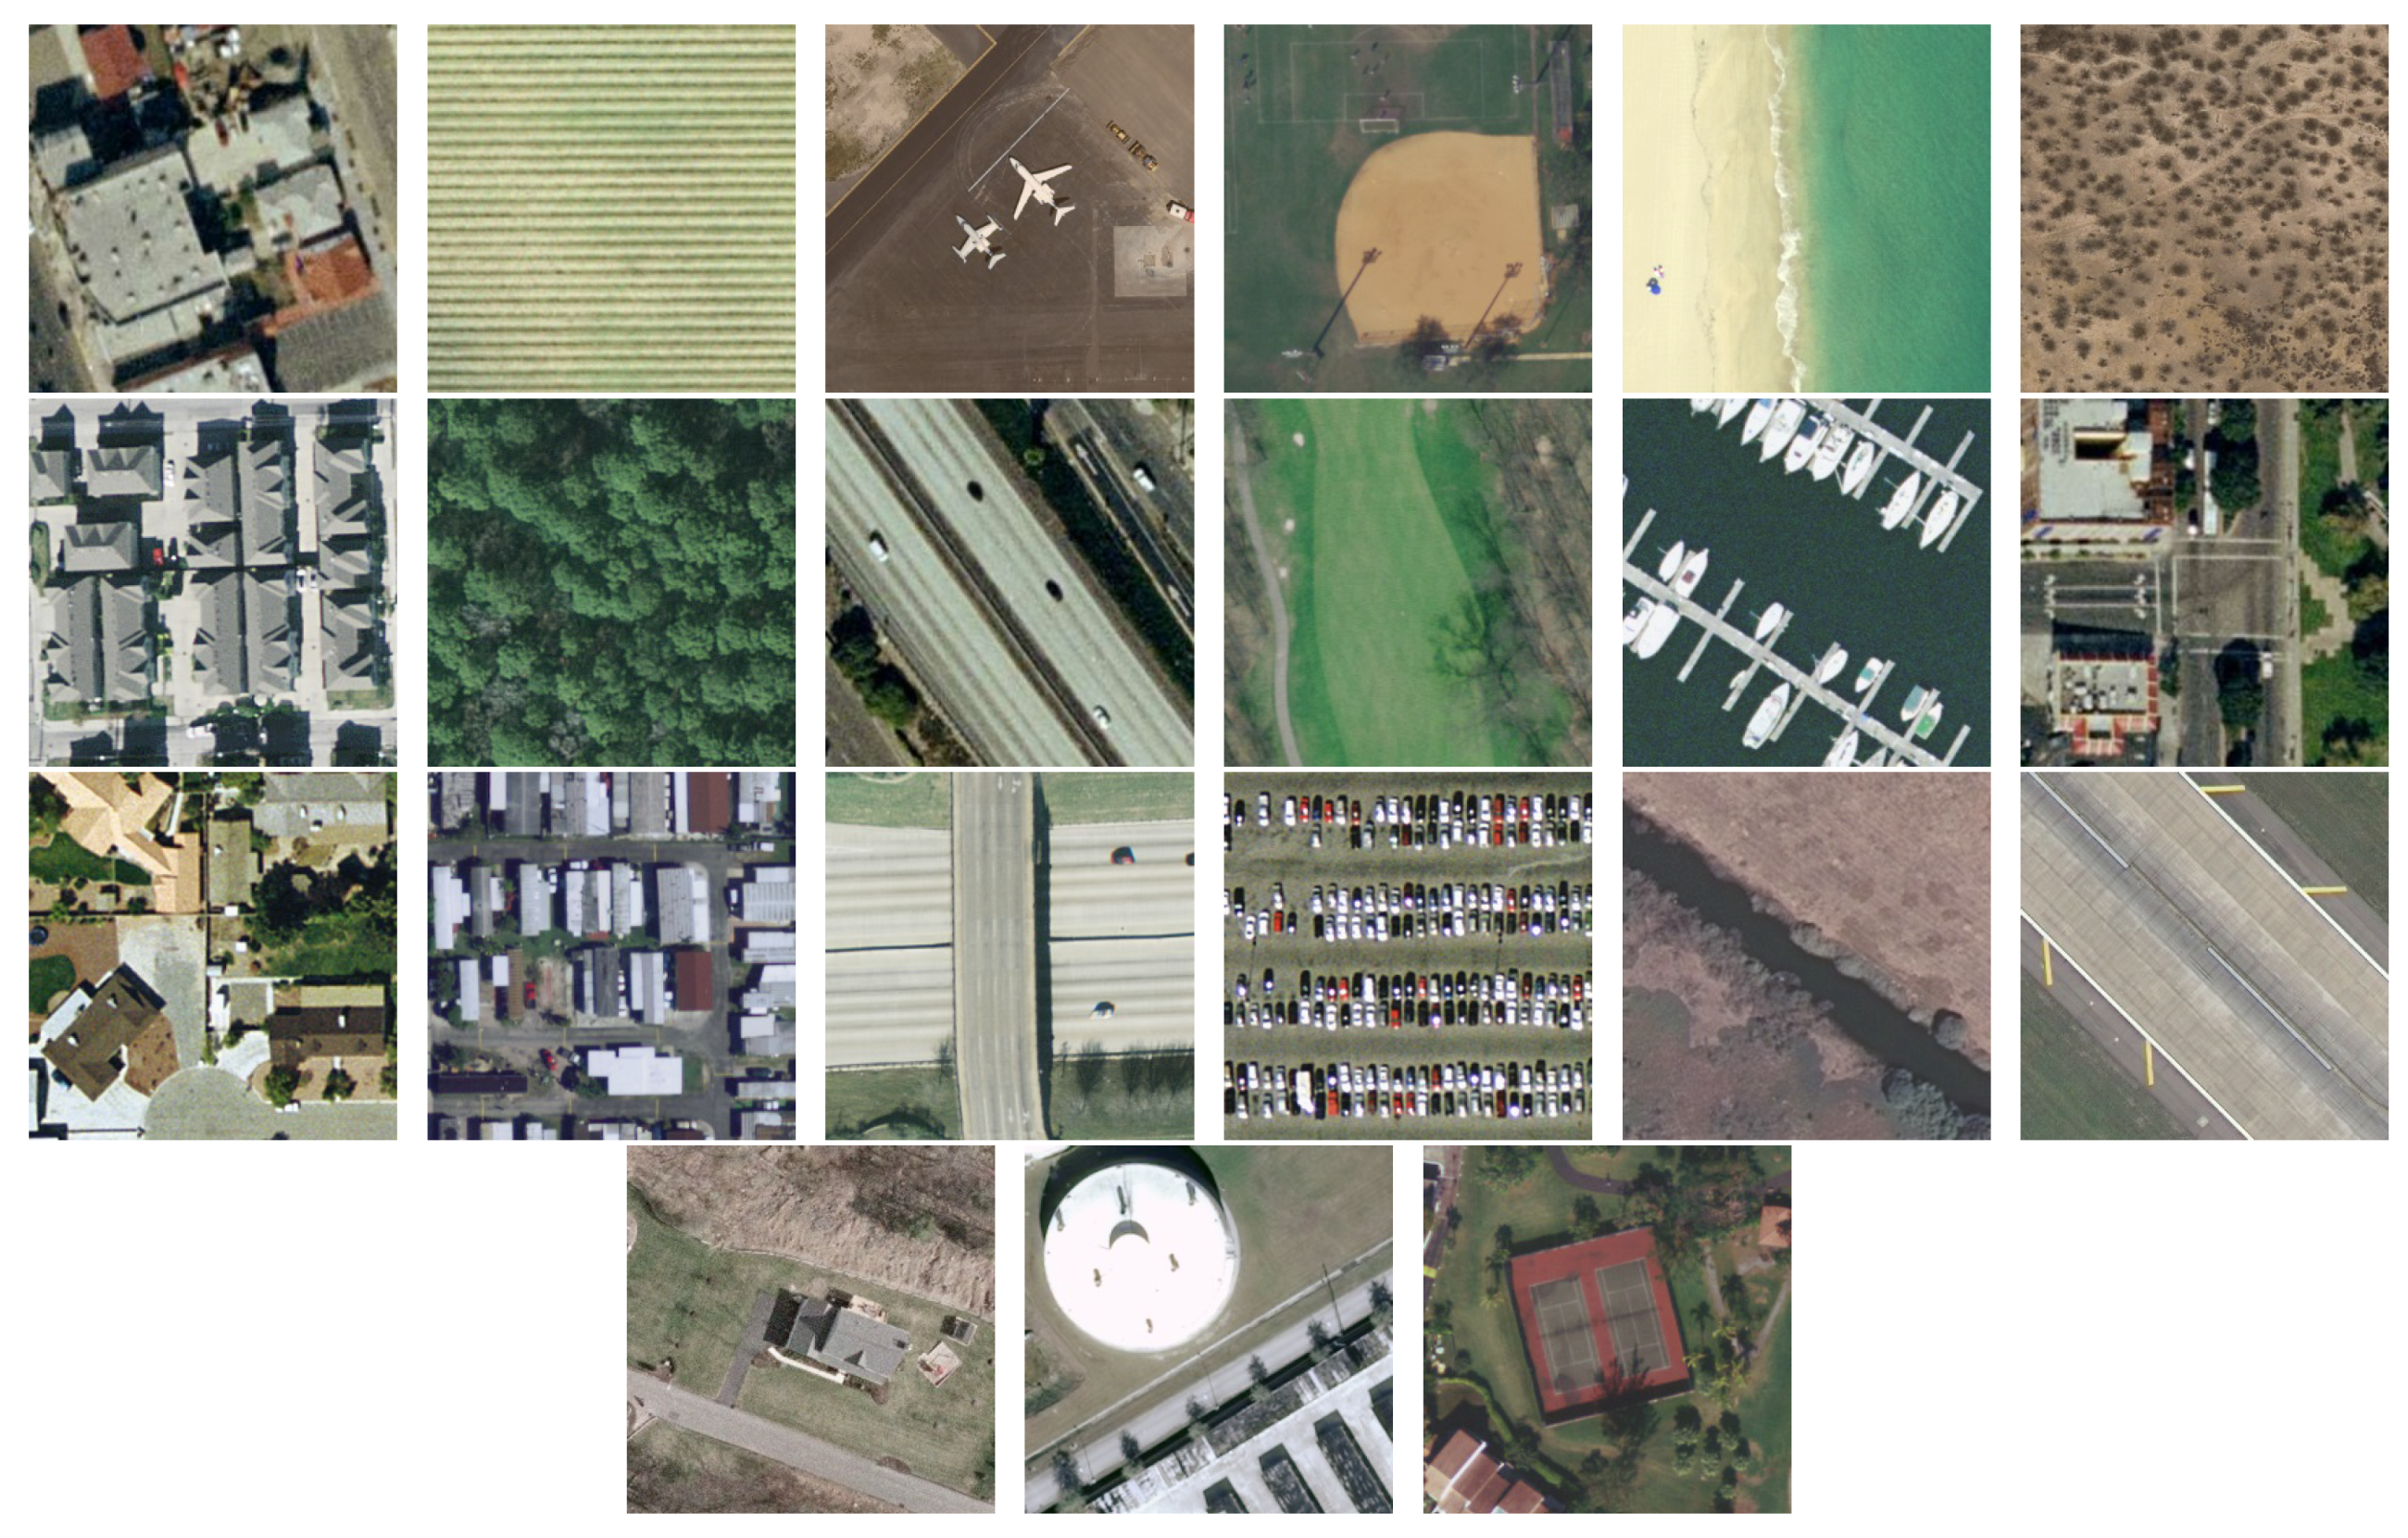
(1) Datasets: We use UC Merced dataset and RSSCN7 dataset for qualitative and quantitative analysis. The UC Merced dataset [51] is a classification dataset of remote sensing images containing 21 land use classes, and each class contains 100 images with size and RGB channels. Figure 6 shows some images. The UC Merced dataset is mainly used as the experimental data and divided into two sections. The first section includes images in 21 classes of agricultural, baseball diamond, beach, building and so on. For each category, 90 images are taken to create the training set. Therefore, the second section includes the remaining ten images for each class which are taken to construct the test set. We can validate the performance of our model for each class. The results are discussed in Section 3.2.

Figure 6.
Some images in the UC Merced dataset: 21 land use classes, including buildings, agricultural, airplane, baseball diamond, beach, chaparral, dense residential, forest, freeway, golf course, harbor, intersection, medium residential, mobile home park, overpass, parking lot, river, runway, sparse residential, storage tanks, and tennis court. The above images correspond to the above categories respectively.
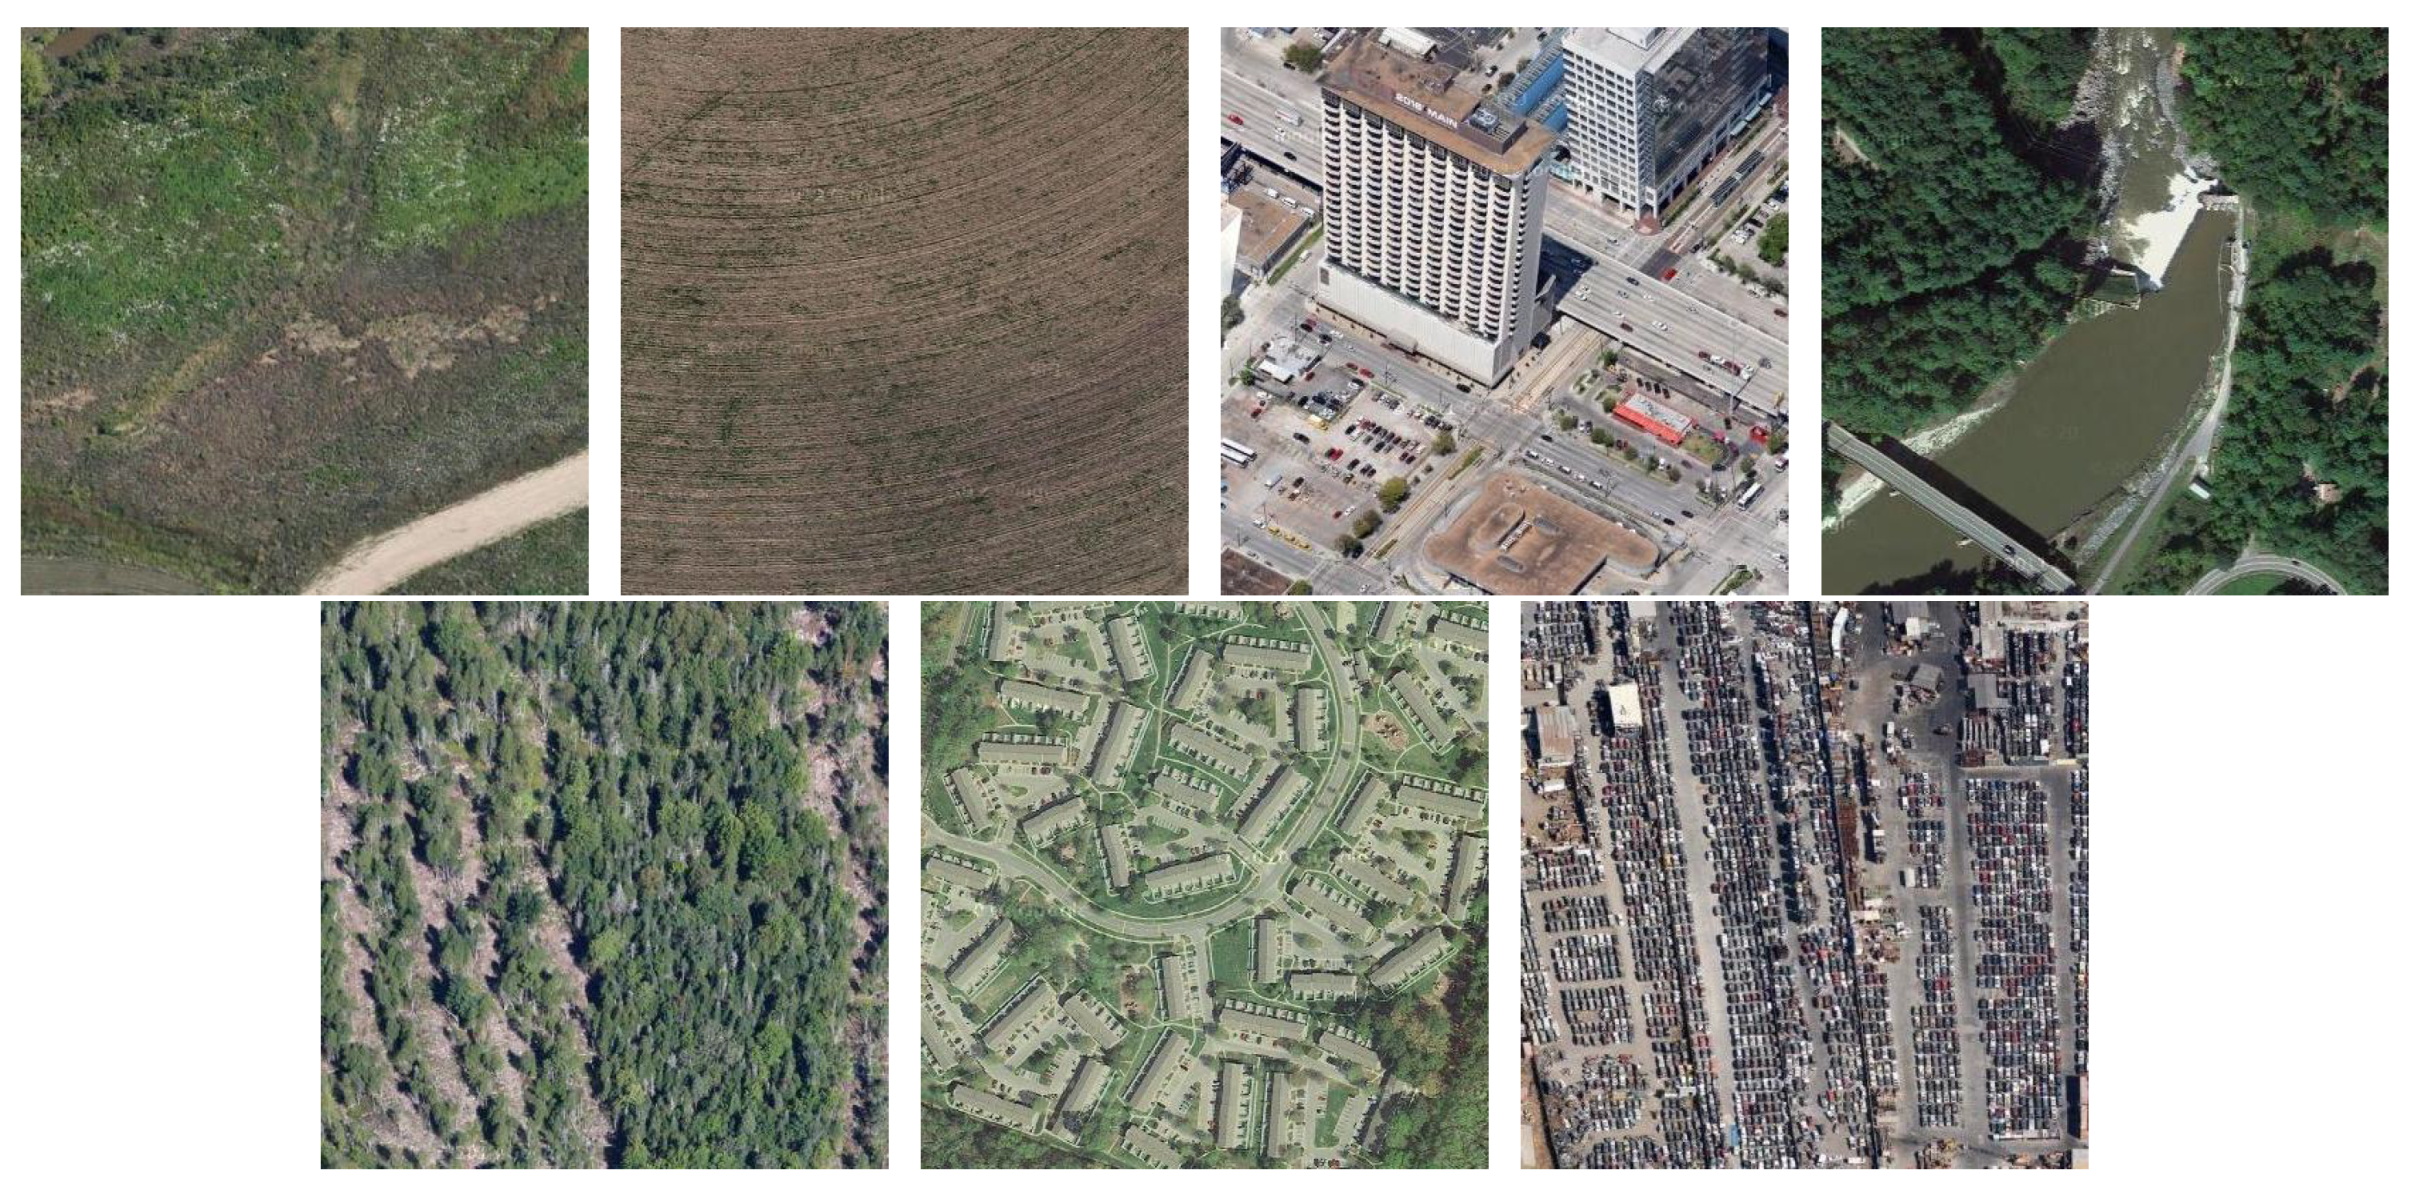
In addition, the other dataset named RSSCN7 [52] is also used to train our method and verify the effectiveness of our method. The RSSCN7 dataset is a classification dataset of remote sensing images containing 7 land use classes, and each class contains 400 images with size and RGB channels. Figure 7 shows some images. This dataset is divided into two sections. The first section contains images in 7 classes. For each class, 360 images are used to train the model. Thus, the second section includes the remaining 40 images for each class which are used to construct the test set. The test results are discussed in Section 3.2.
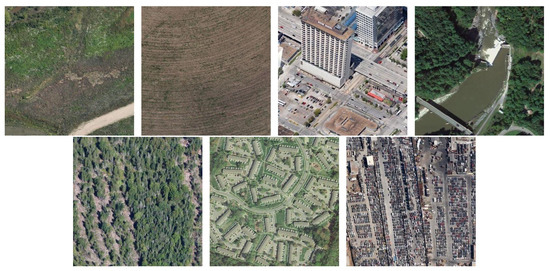
Figure 7.
Some images in the RSSCN7 dataset: 7 land use classes, including grass, filed, industry, river lake, forest, resident and parking. The above images correspond to the above categories respectively.
To validate the robustness of the proposed method, the real world data from GaoFen-2 in Ningxia, China, are used to test our model in Section 3.4. Experiments are designed by the scale factor and the scale factor, respectively. We obtain LR images by down sampling HR images using the bicubic operation.
All the parameter settings are same on the UC Merced dataset and RSSCN7 dataset. The training step is performed on the three channels of the RGB space. The channel number of the input image is 3, the filter size k is set as 3. The Adam [53] optimizer with and is used to train the proposed models under the batchsize of 16. The weights of the model are initialized using the method in [54]. We initialize the learning rate as and halve it at every batches updates. We implement the proposed algorithm with the PyTorch [55] framework, and we train the DCAN model using one NVIDIA Tesla V100 GPU.
(2) Evaluation Metrics: Two widely used image quality assessment metrics, the peak signal-to-noise ratio (PSNR) and structural similarity (SSIM) are used as evaluation metrics. They are used as the criteria for evaluating the quality of reconstructed HR images. Given the ground truth HR image x and its corresponding super-resolved image y, the PSNR of the super-resolved image y is computed as follows:
where and denote the ith pixel in x and y values, respectively. represents the image pixel number. The higher PSNR indicates that the quality of the SR image is better. In addition to using PSNR to measure image quality, we also use SSIM as the image quality assessment, the SSIM of the super-resolved image y is defined as follows:
where and denote the mean values of x and y, and and denote the standard deviation values of x and y, and and are constants. The higher SSIM indicates that the quality of the SR image is better.
3.2. Comparisons with the Other Methods
The proposed DCAN method is compared with four state-of-the-art methods: Bicubic, SRCNN [32], VDSR [36], SRResNet [38]. In this experiment, we use the same training datasets and test datasets to compare these methods fairly. In addition, these models are trained well to test under the suitable conditions. Figure 8, Figure 9, Figure 10, Figure 11, Figure 12, Figure 13, Figure 14 and Figure 15 show some reconstructed images of the UC Merced test set using the corresponding algorithm and the ground truth HR images in the visual quality.
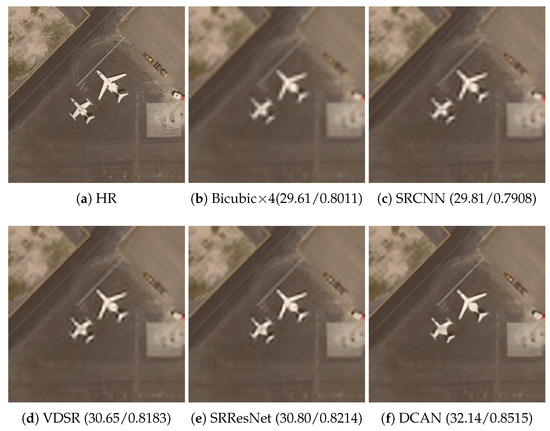
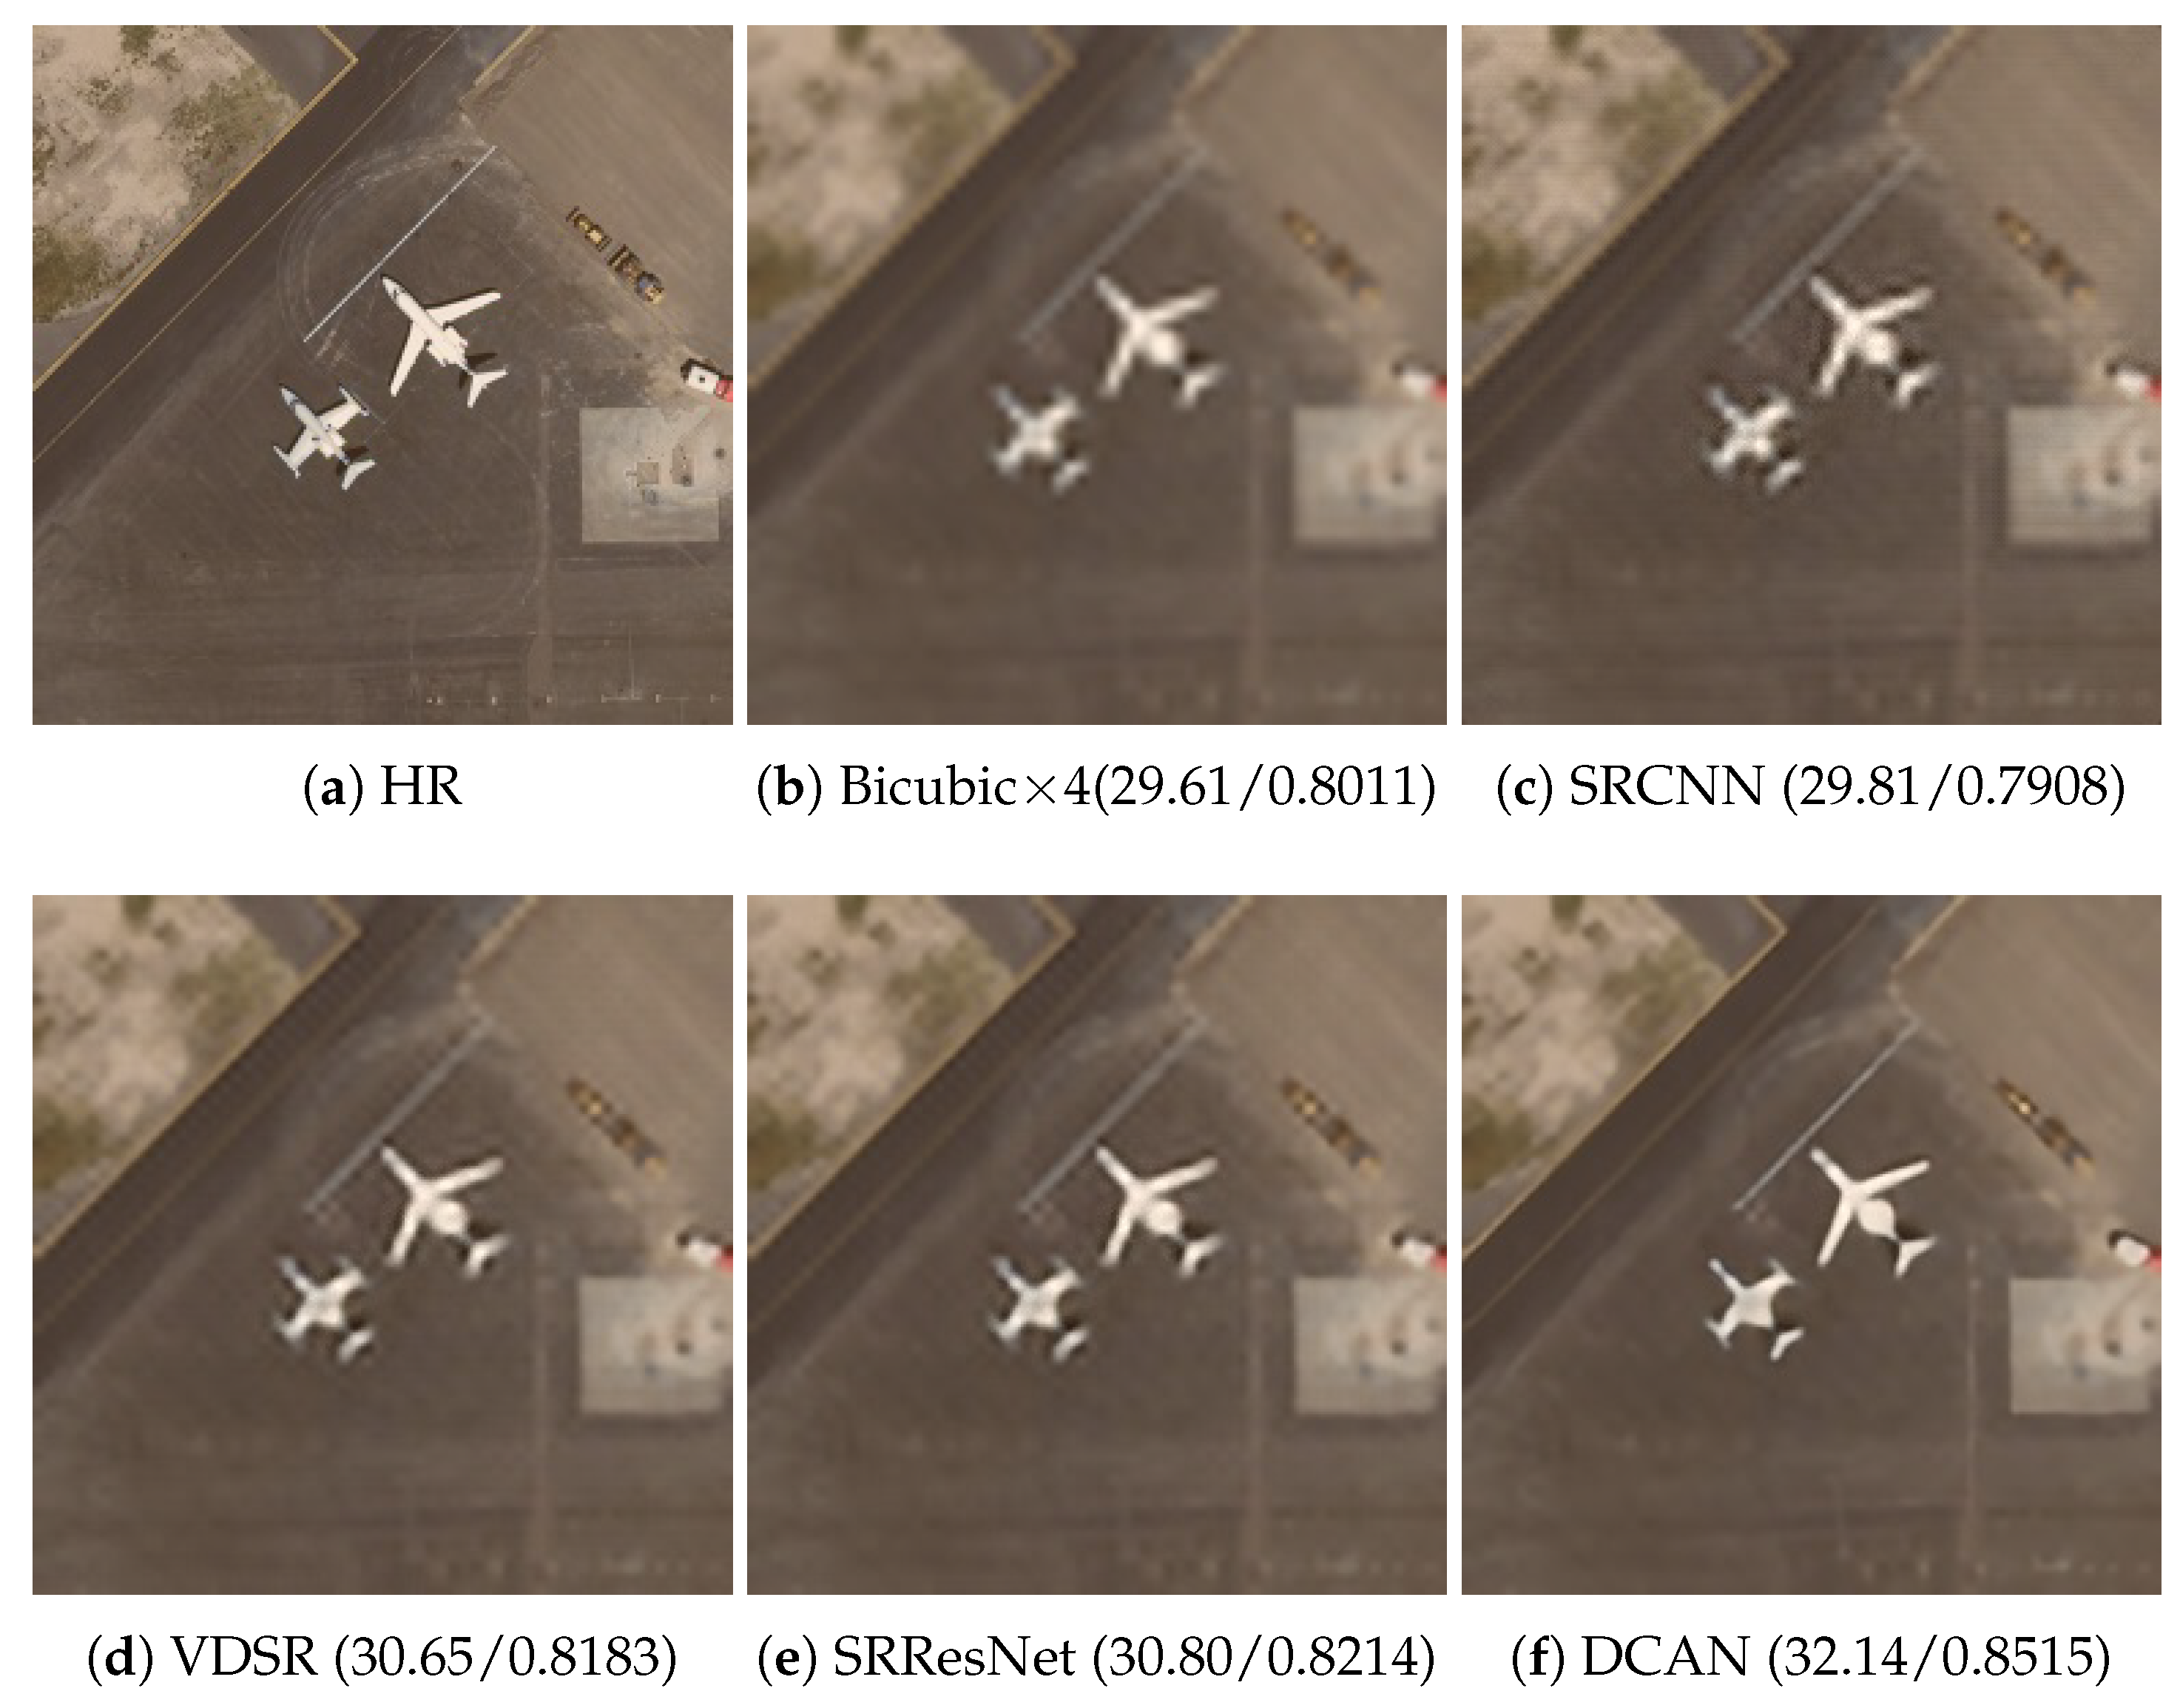
Figure 8.
super resolved-images of “airplane89.jpg” on the UC Merced dataset via different algorithms, and the numbers under these images represent the PSNR and SSIM values. (a) represent HR image, (b–f) represent the super-resolved image of Bicubic, SRCNN, VDSR, SRResNet, DCAN.
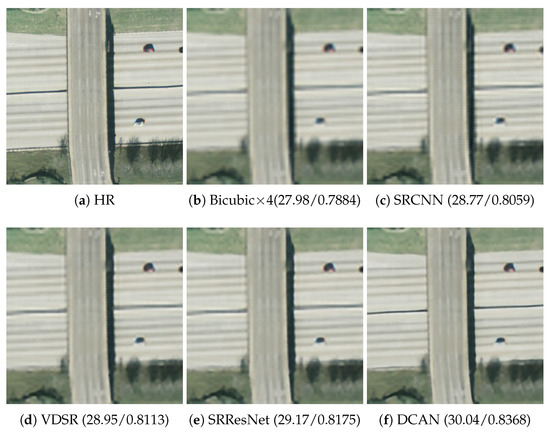
Figure 9.
super-resolved images of “overpass18.jpg” on the UC Merced dataset via different algorithms, and the numbers under these images represent the PSNR and SSIM values. (a) represent HR image, (b–f) represent the super-resolved image of Bicubic, SRCNN, VDSR, SRResNet, DCAN.
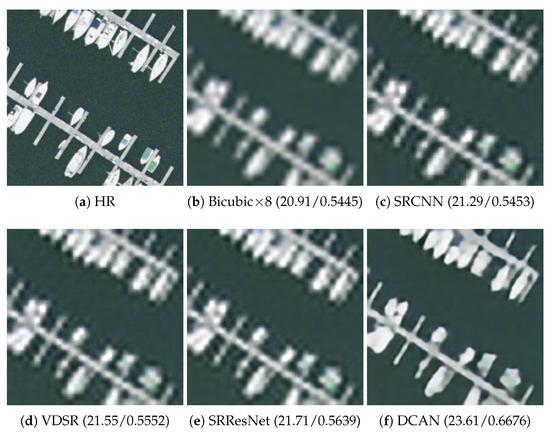
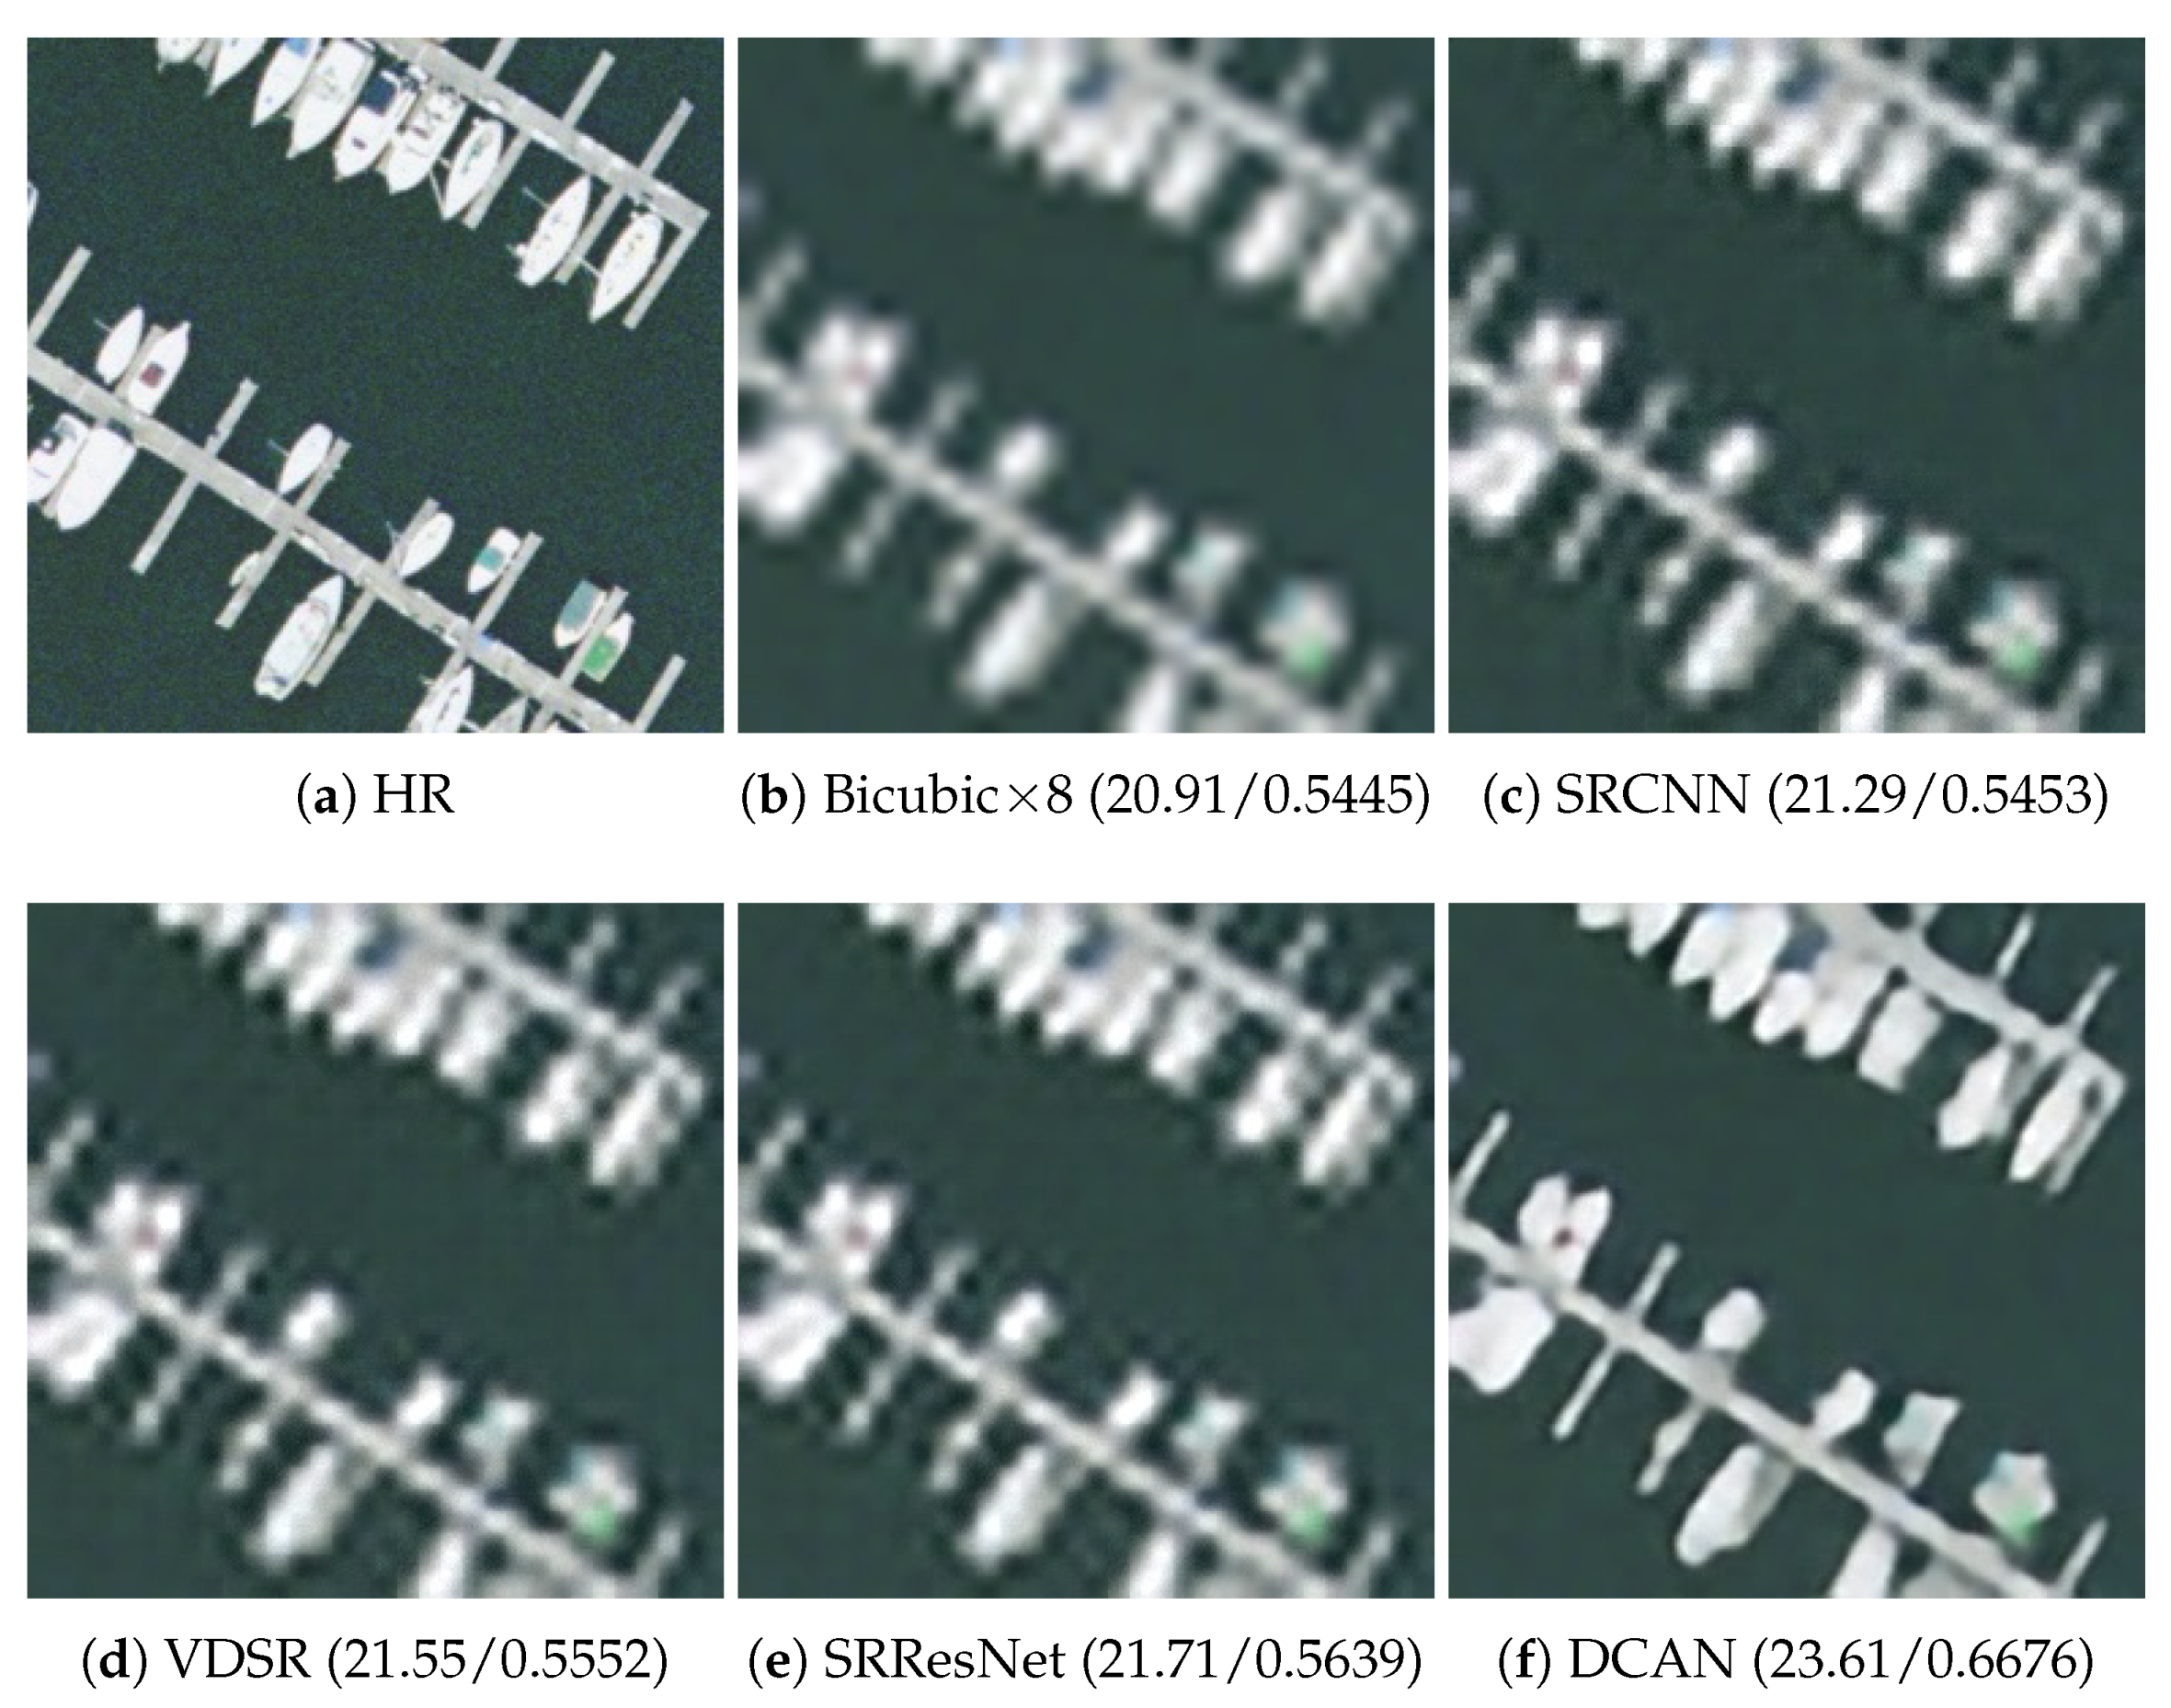
Figure 10.
super-resolved images of “harbor32.jpg” on the UC Merced dataset via different algorithms, and the numbers under these images represent the PSNR and SSIM values. (a) represent HR image, (b–f) represent the super-resolved image of Bicubic, SRCNN, VDSR, SRResNet, DCAN.
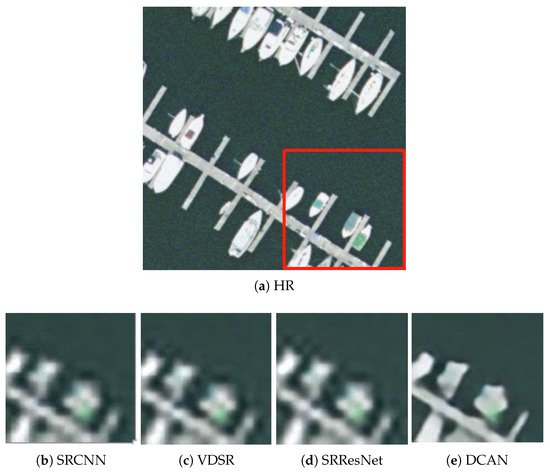
Figure 11.
The detail of super-resolved “harbor32.jpg” region with a scale factor of . (a) represent HR image, (b–e) represent the super-resolved image patch of SRCNN, VDSR, SRResNet, DCAN.
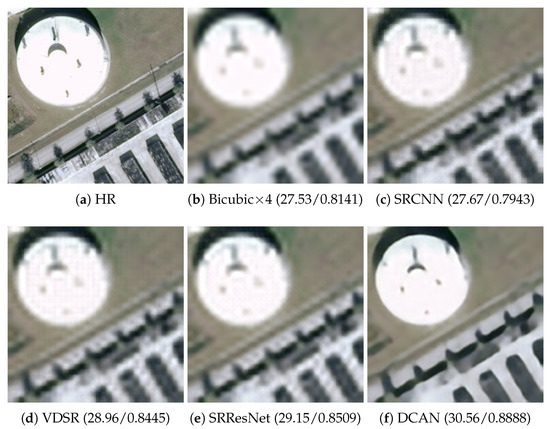
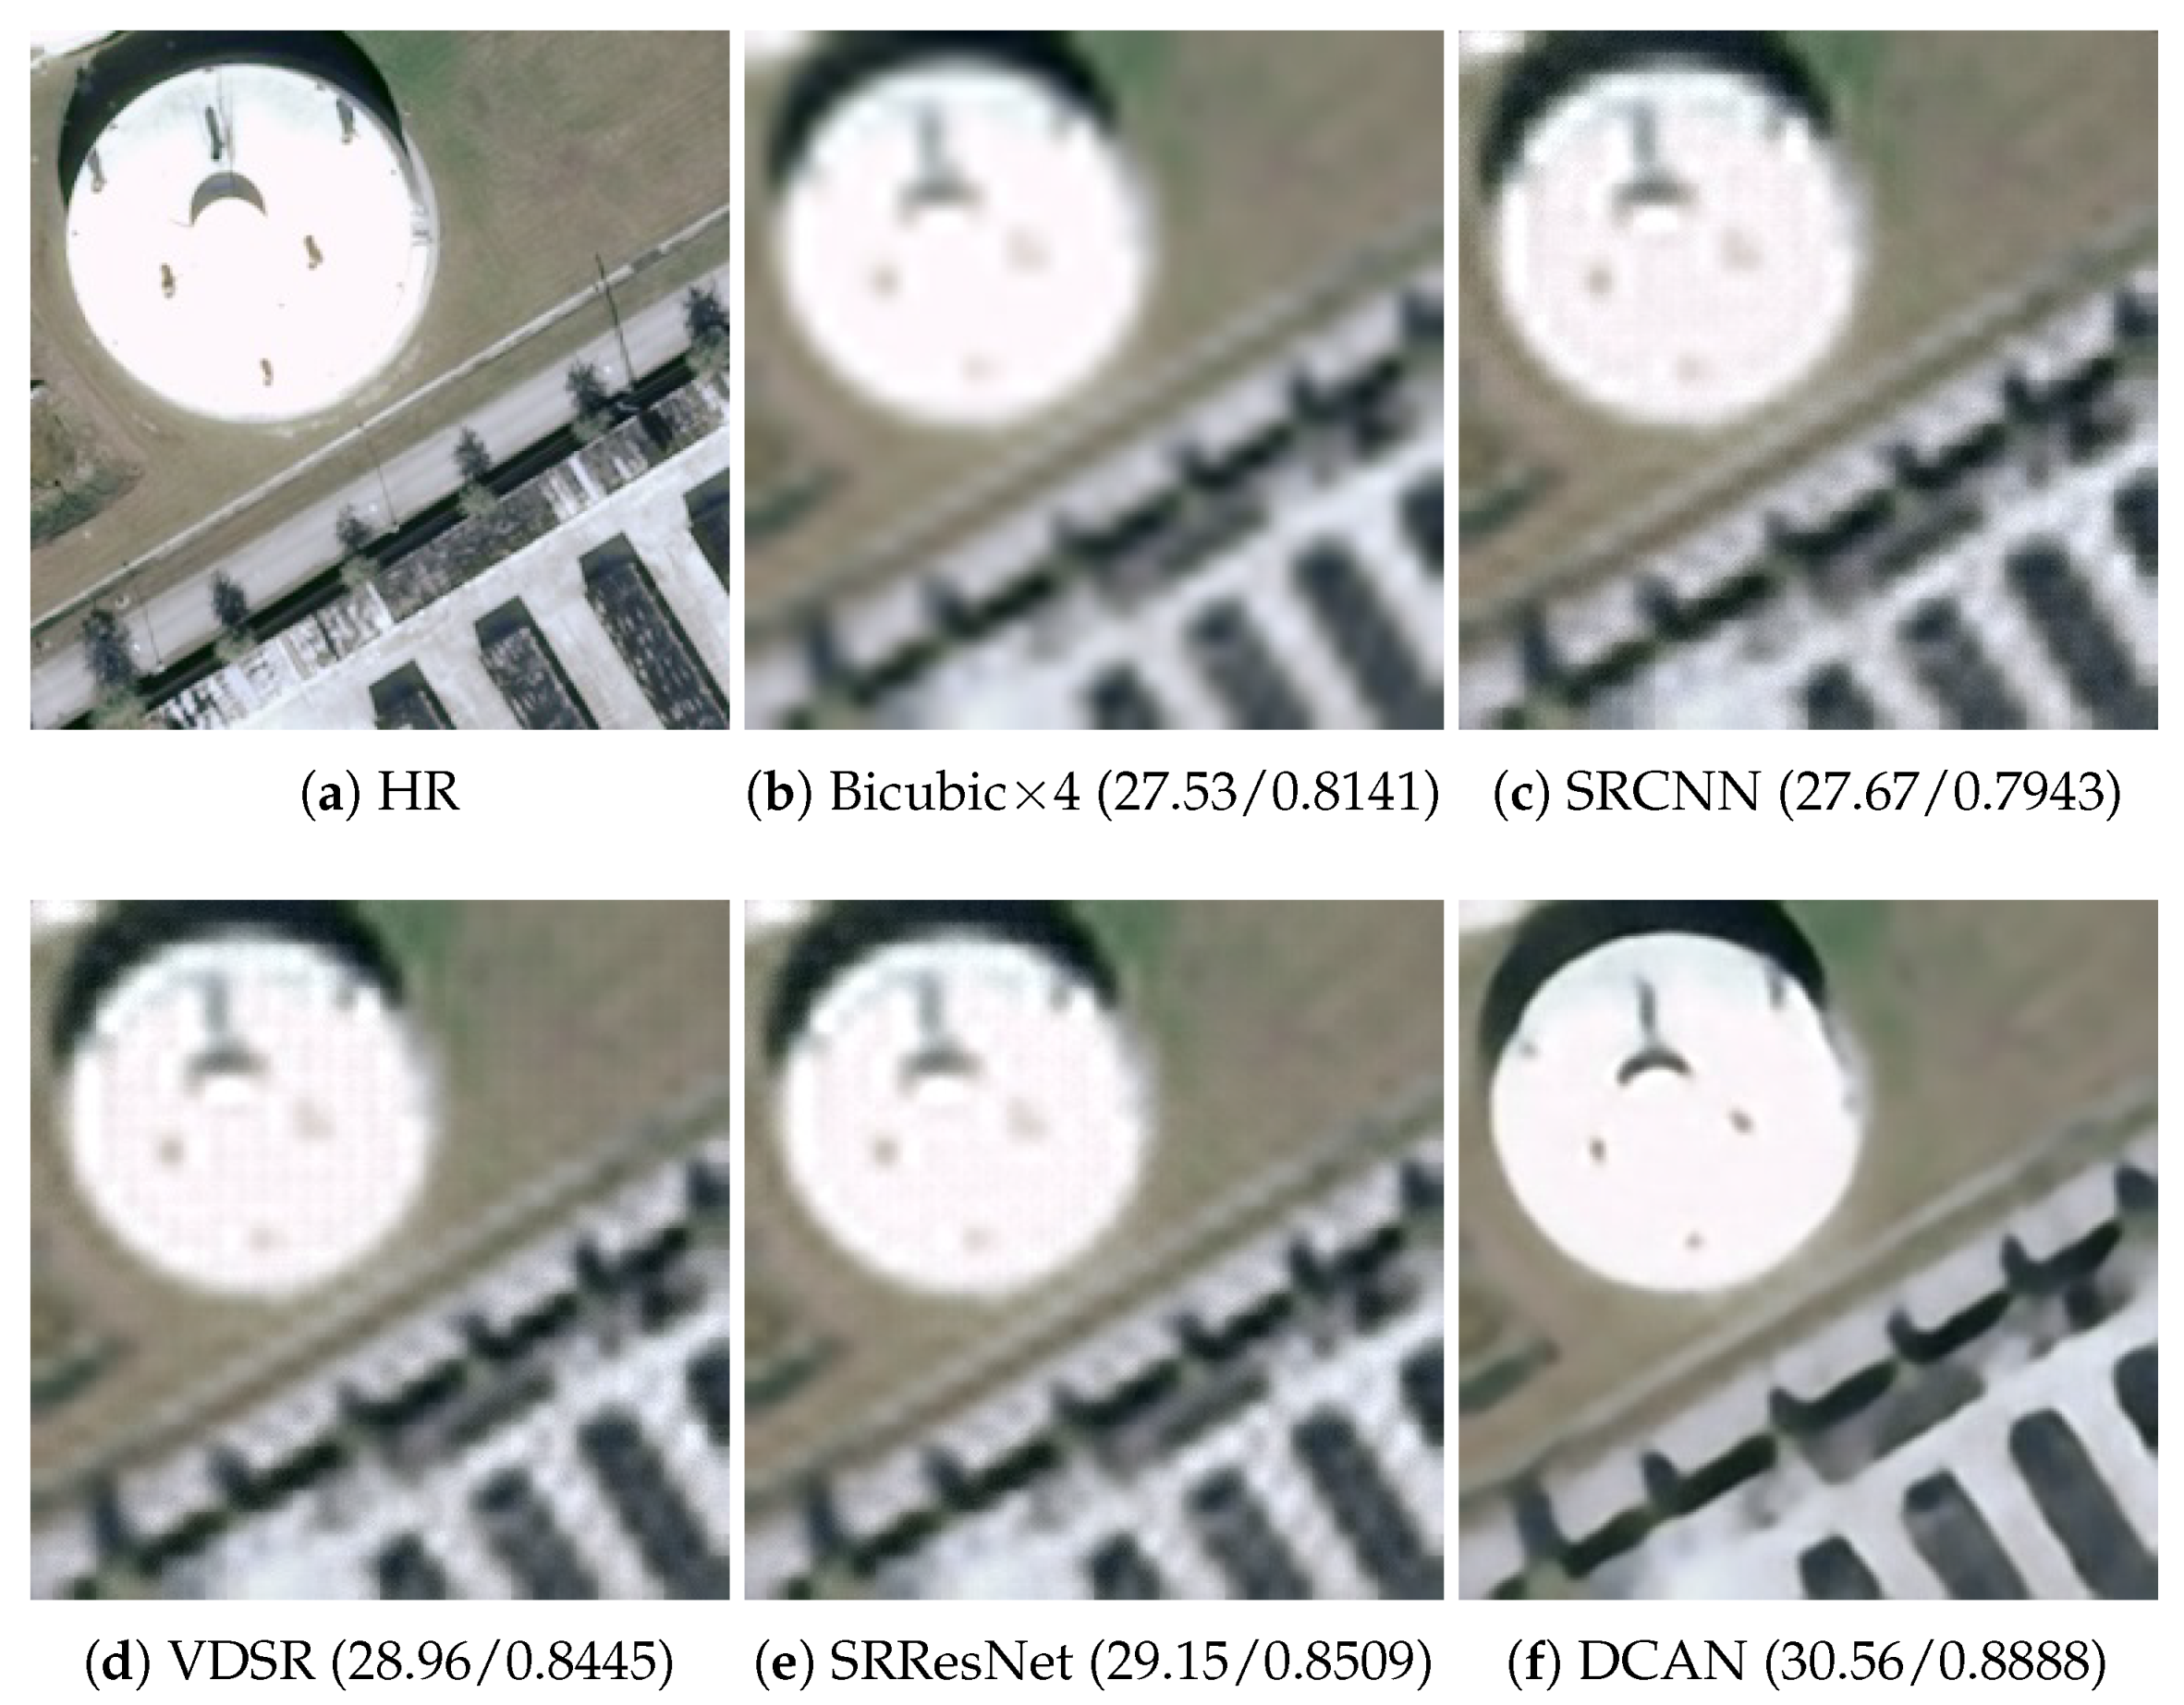
Figure 12.
super-resolved images of “storagetanks68.jpg” on the UC Merced dataset via different algorithms, and the numbers under these images represent the PSNR and SSIM values. (a) represent HR image, (b–f) represent the super-resolved image of Bicubic, SRCNN, VDSR, SRResNet, DCAN.
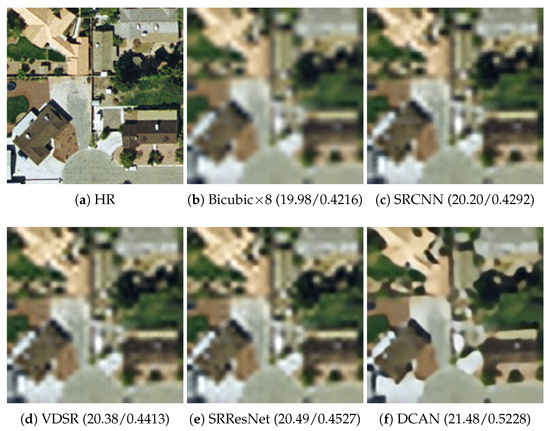
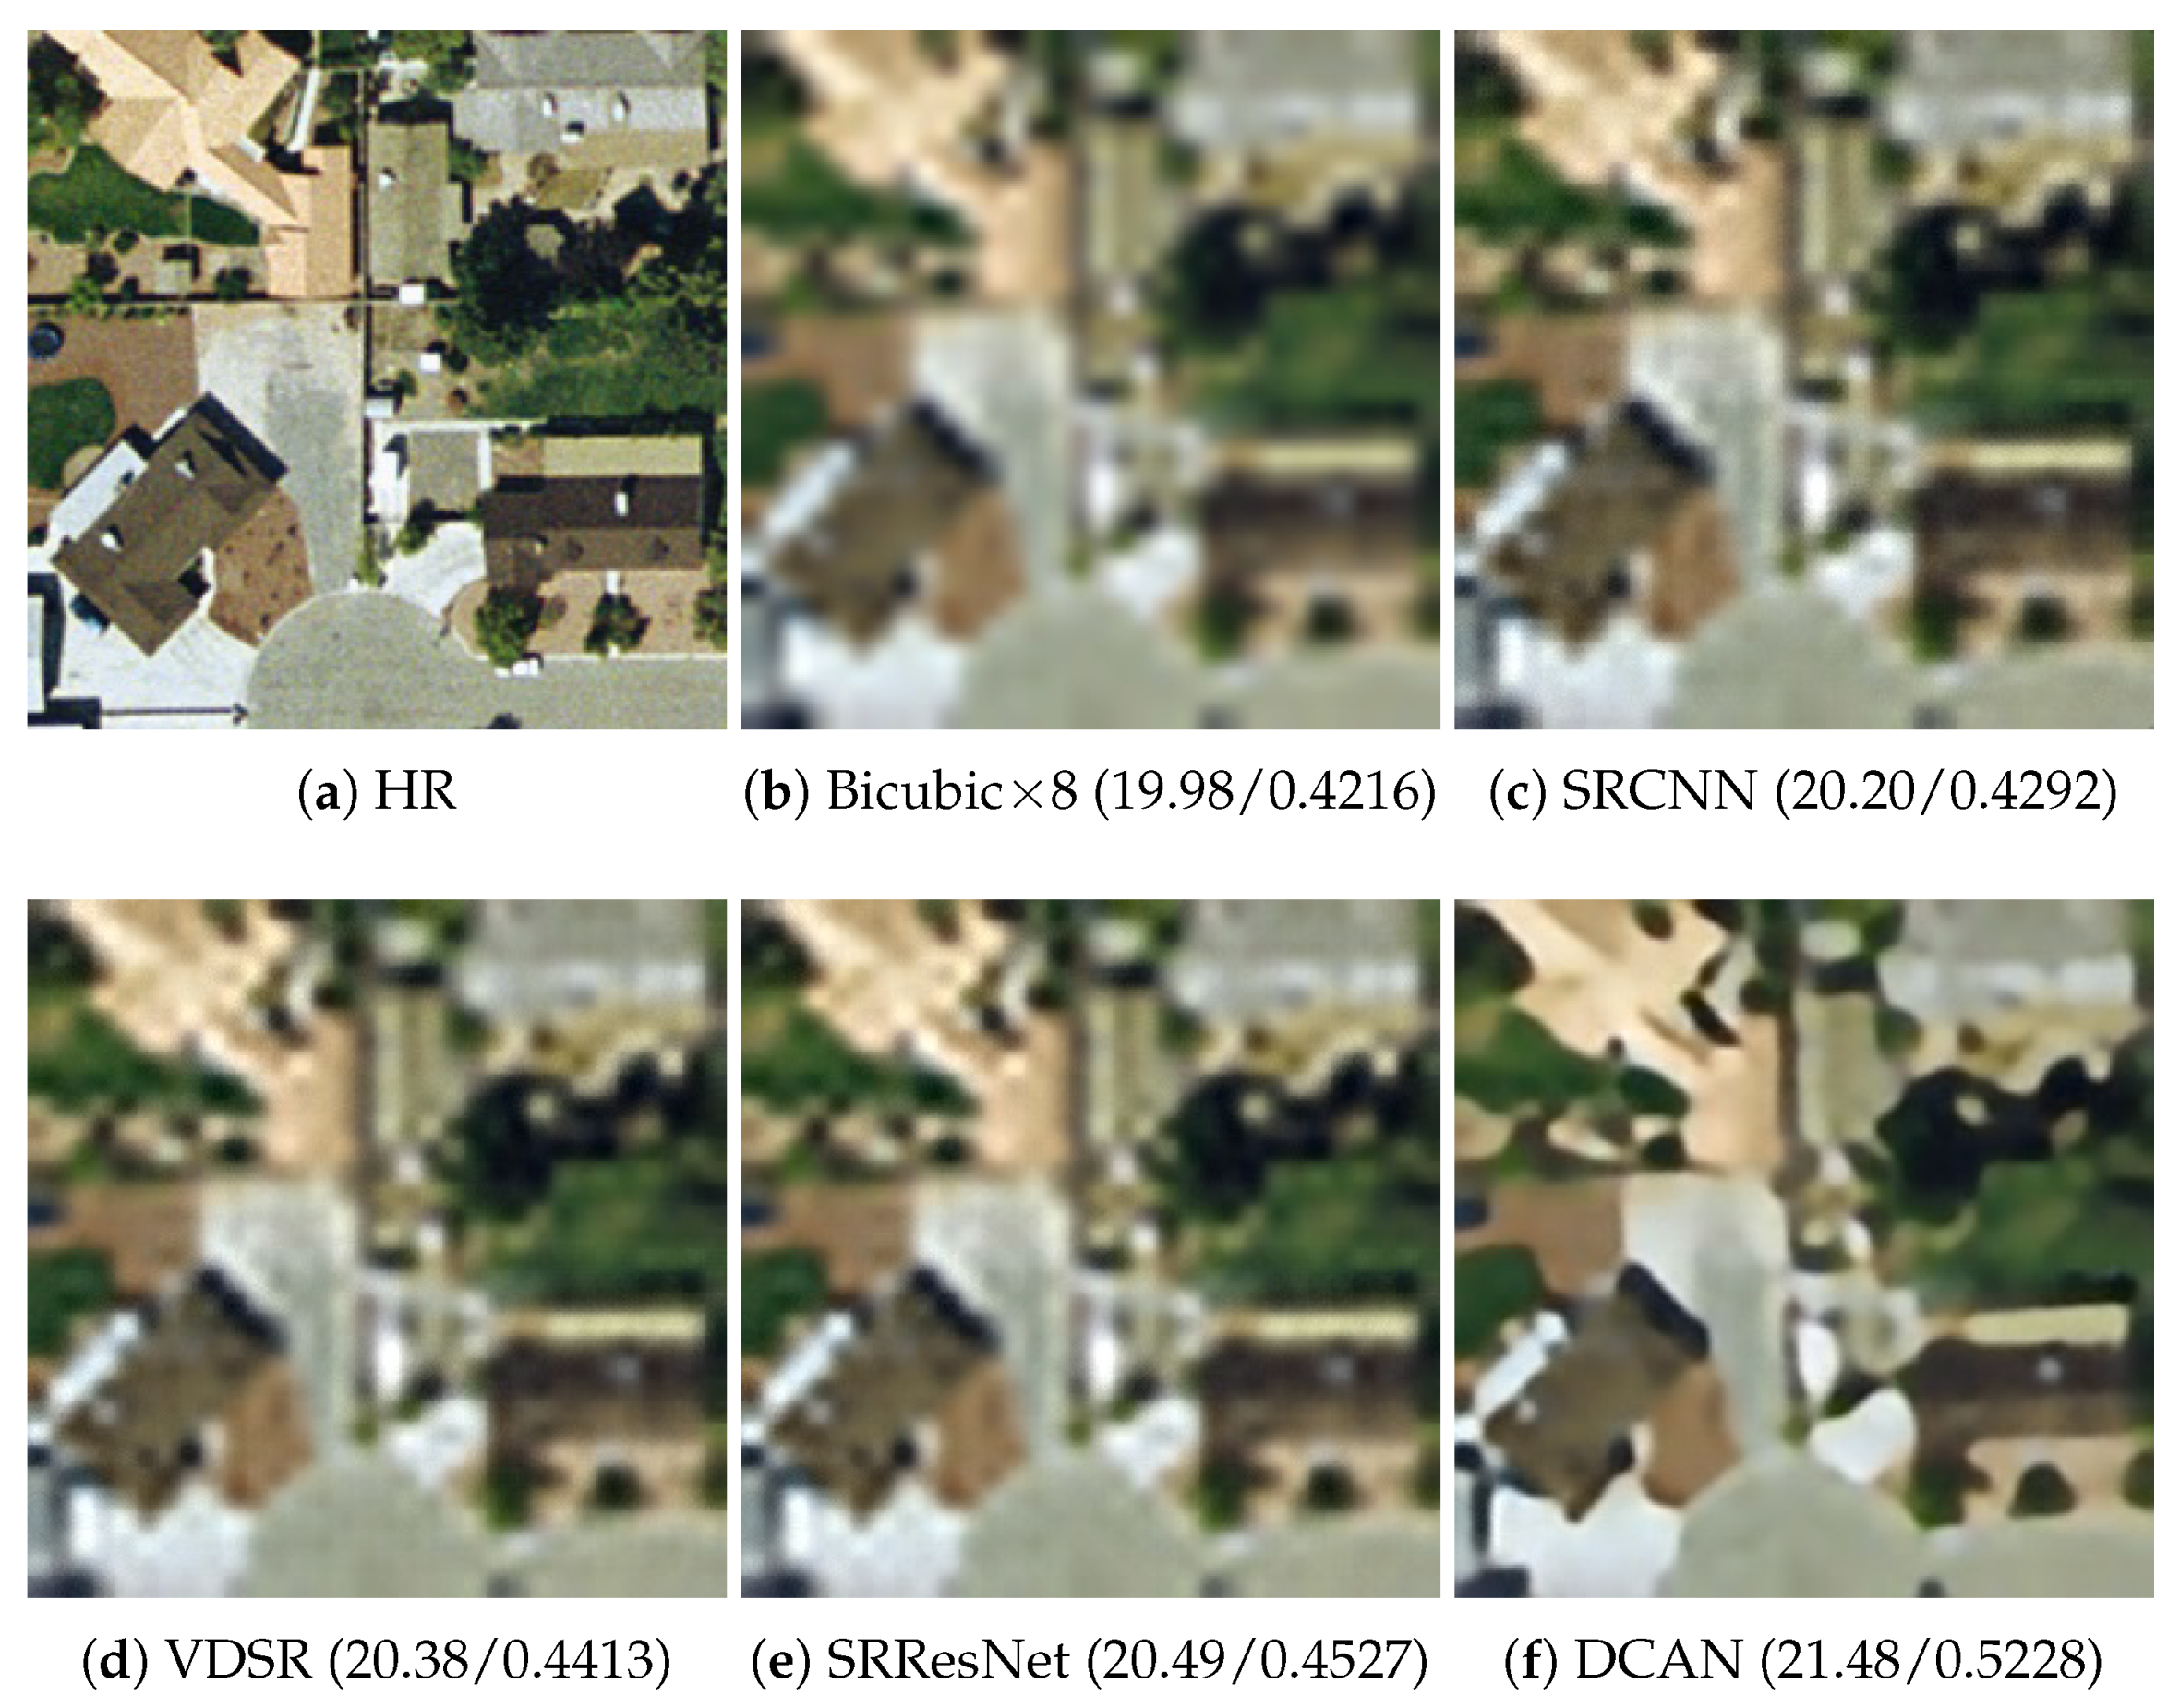
Figure 13.
super-resolved images of “mediumresidential34.jpg” on the UC Merced dataset via different algorithms, and the numbers under these images represent the PSNR and SSIM values. (a) represent HR image, (b–f) represent the super-resolved image of Bicubic, SRCNN, VDSR, SRResNet, DCAN.
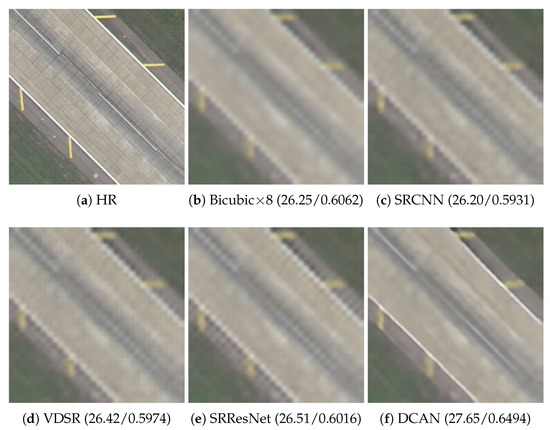
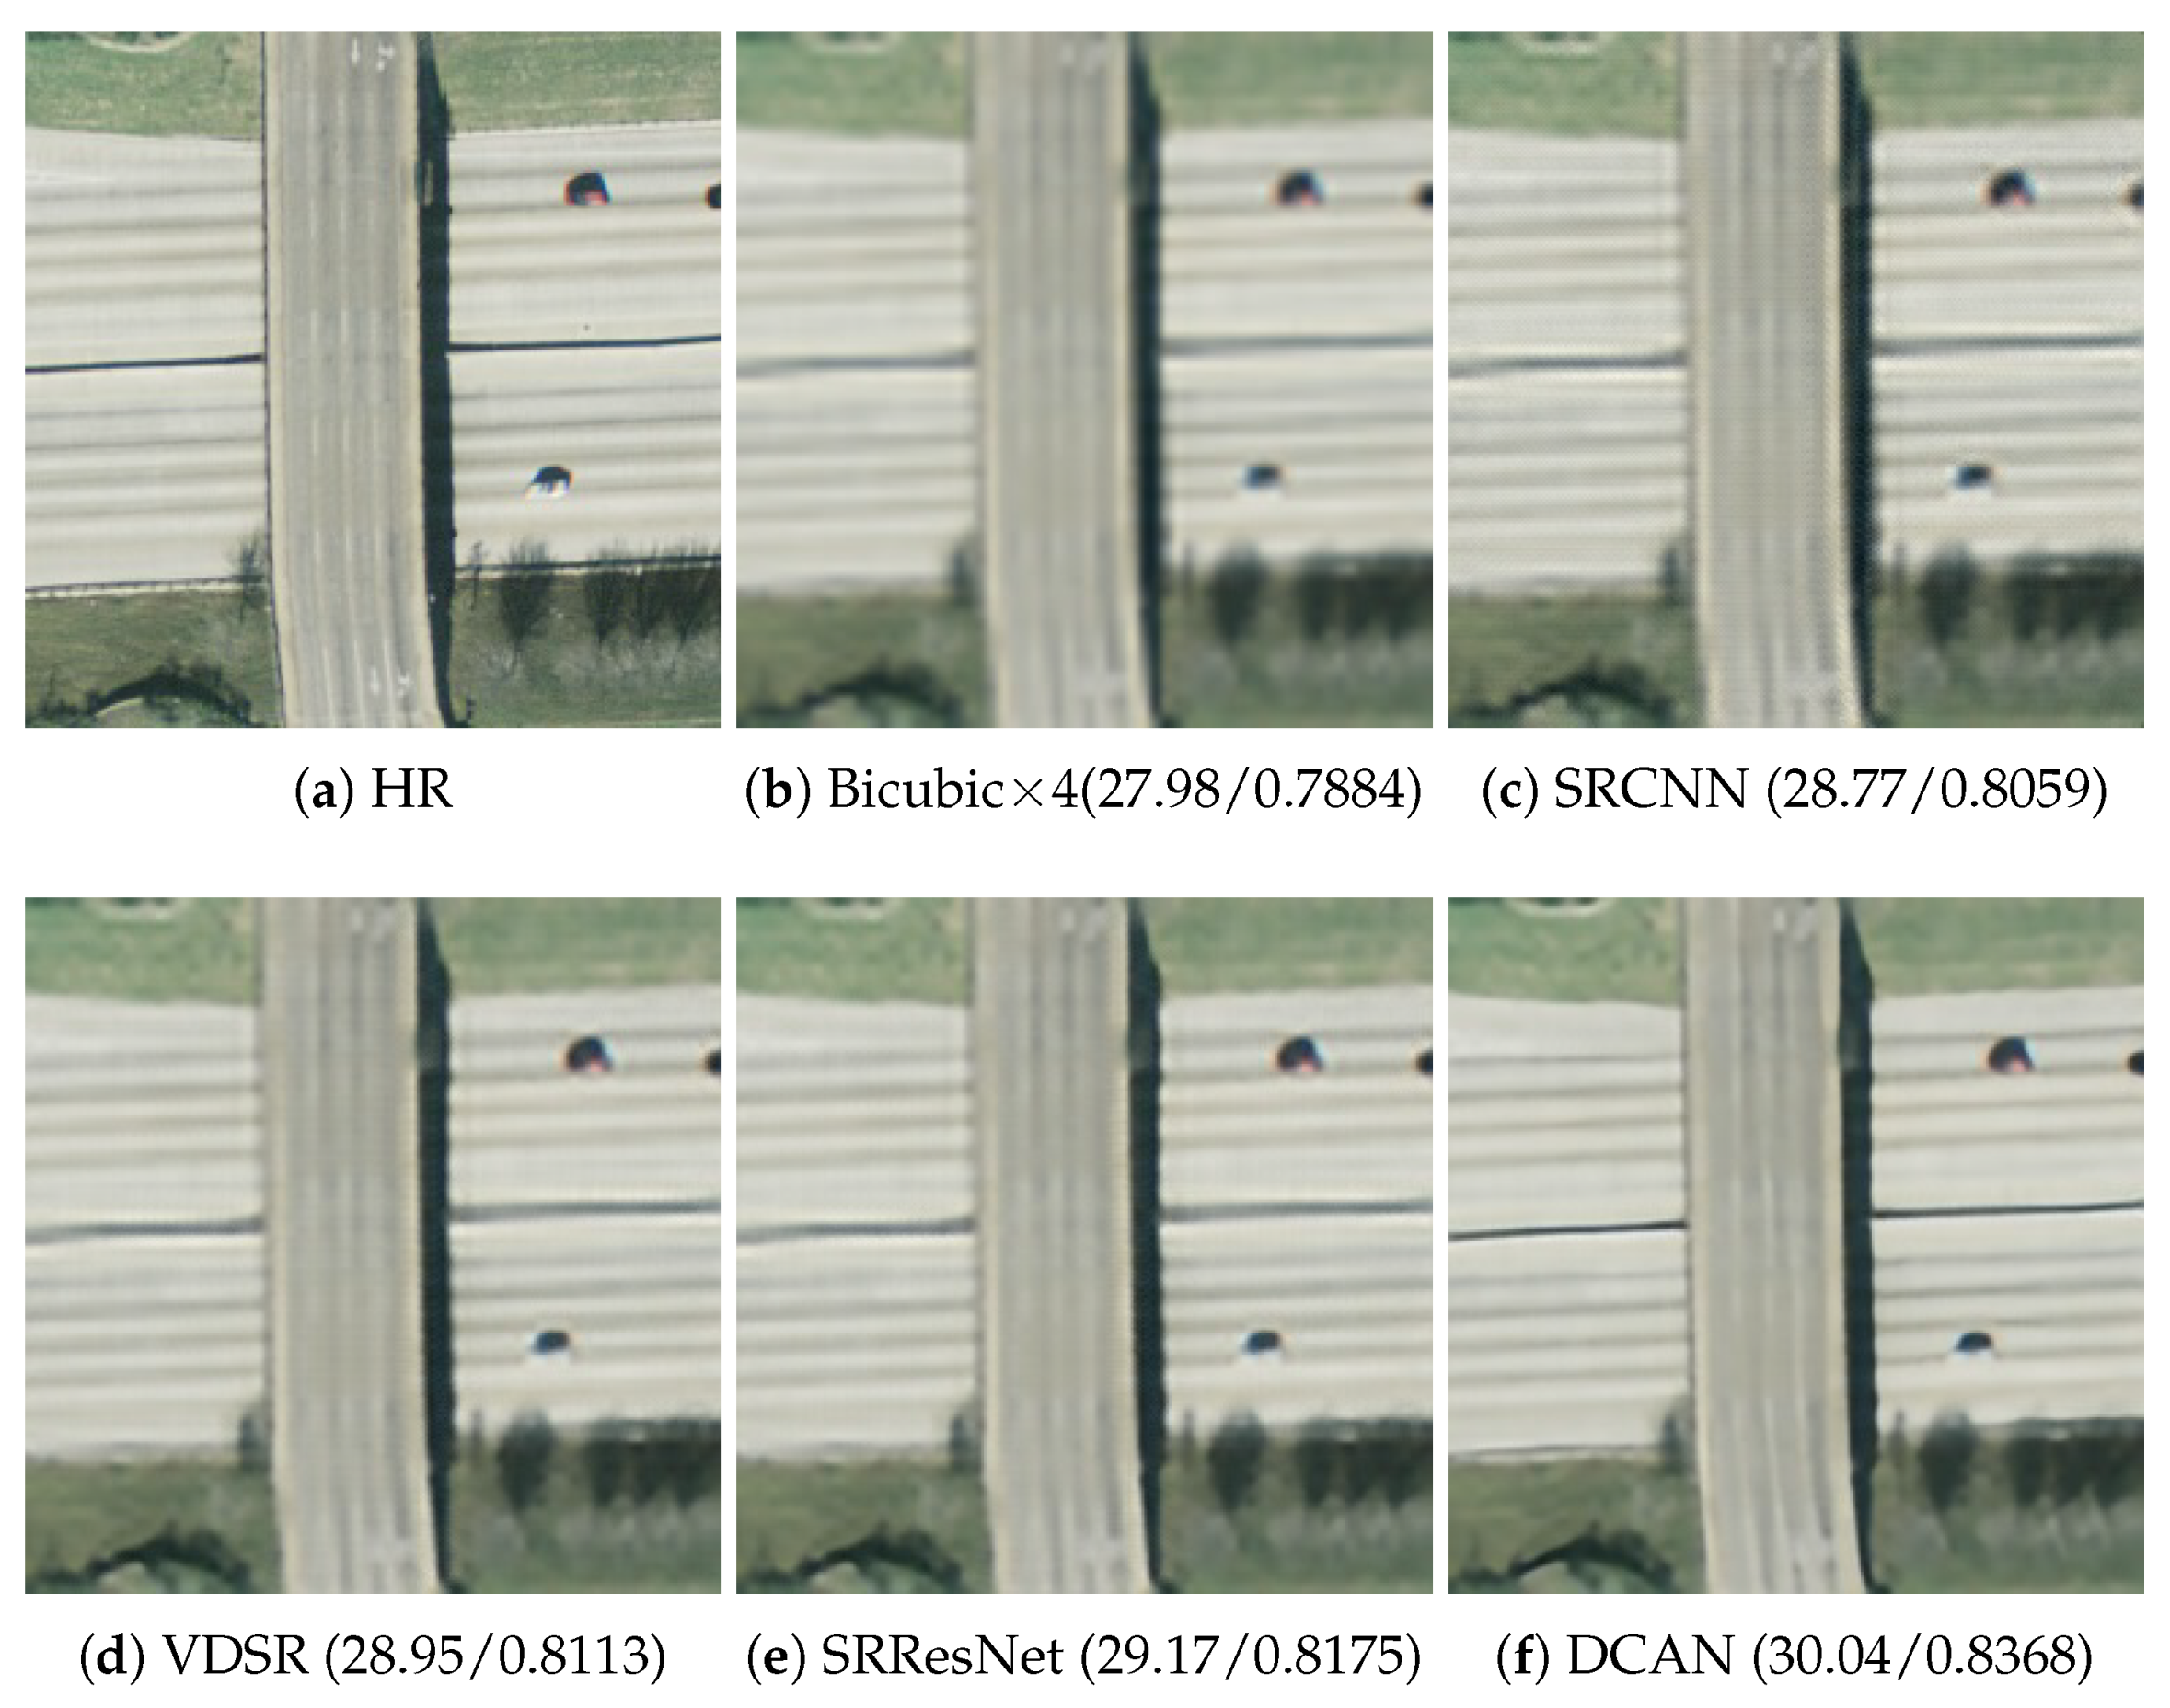
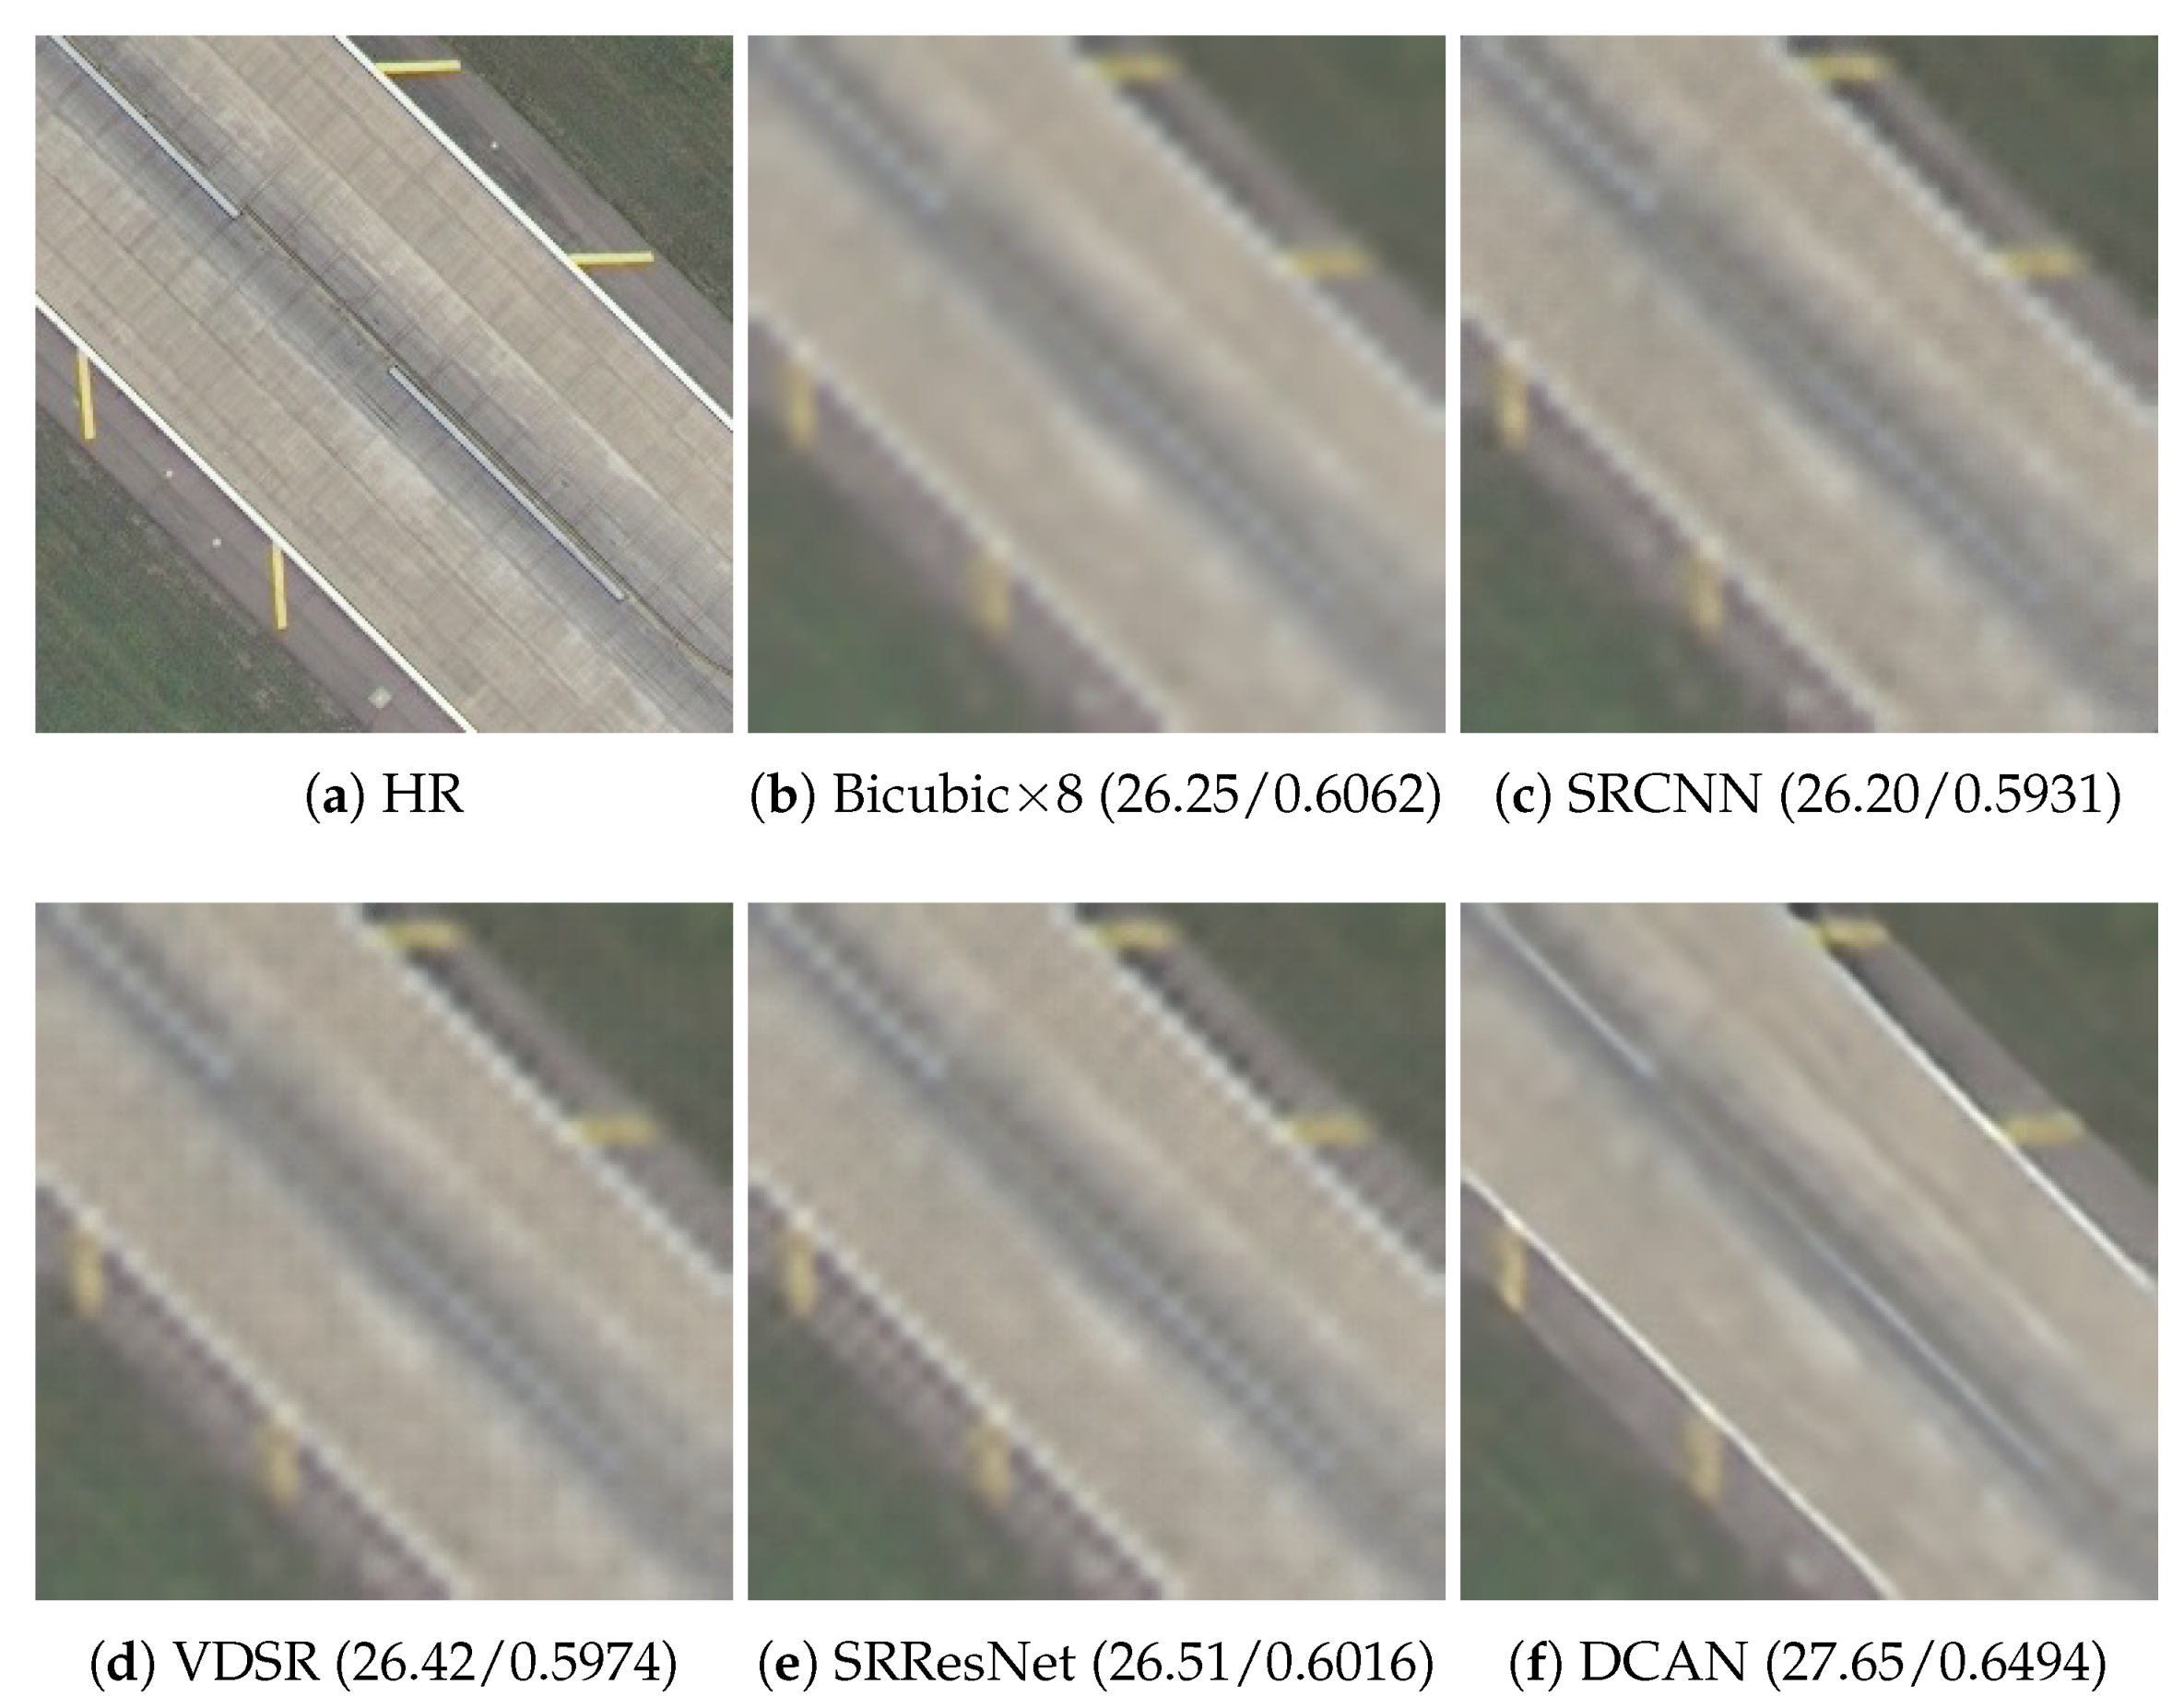
Figure 14.
super-resolved images of “runway39.jpg” on the UC Merced dataset via different algorithms, and the numbers under these images represent the PSNR and SSIM values. (a) represent HR image, (b–f) represent the super-resolved image of Bicubic, SRCNN, VDSR, SRResNet, DCAN.
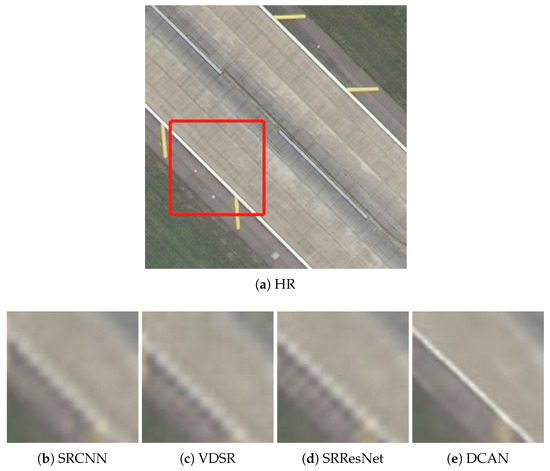
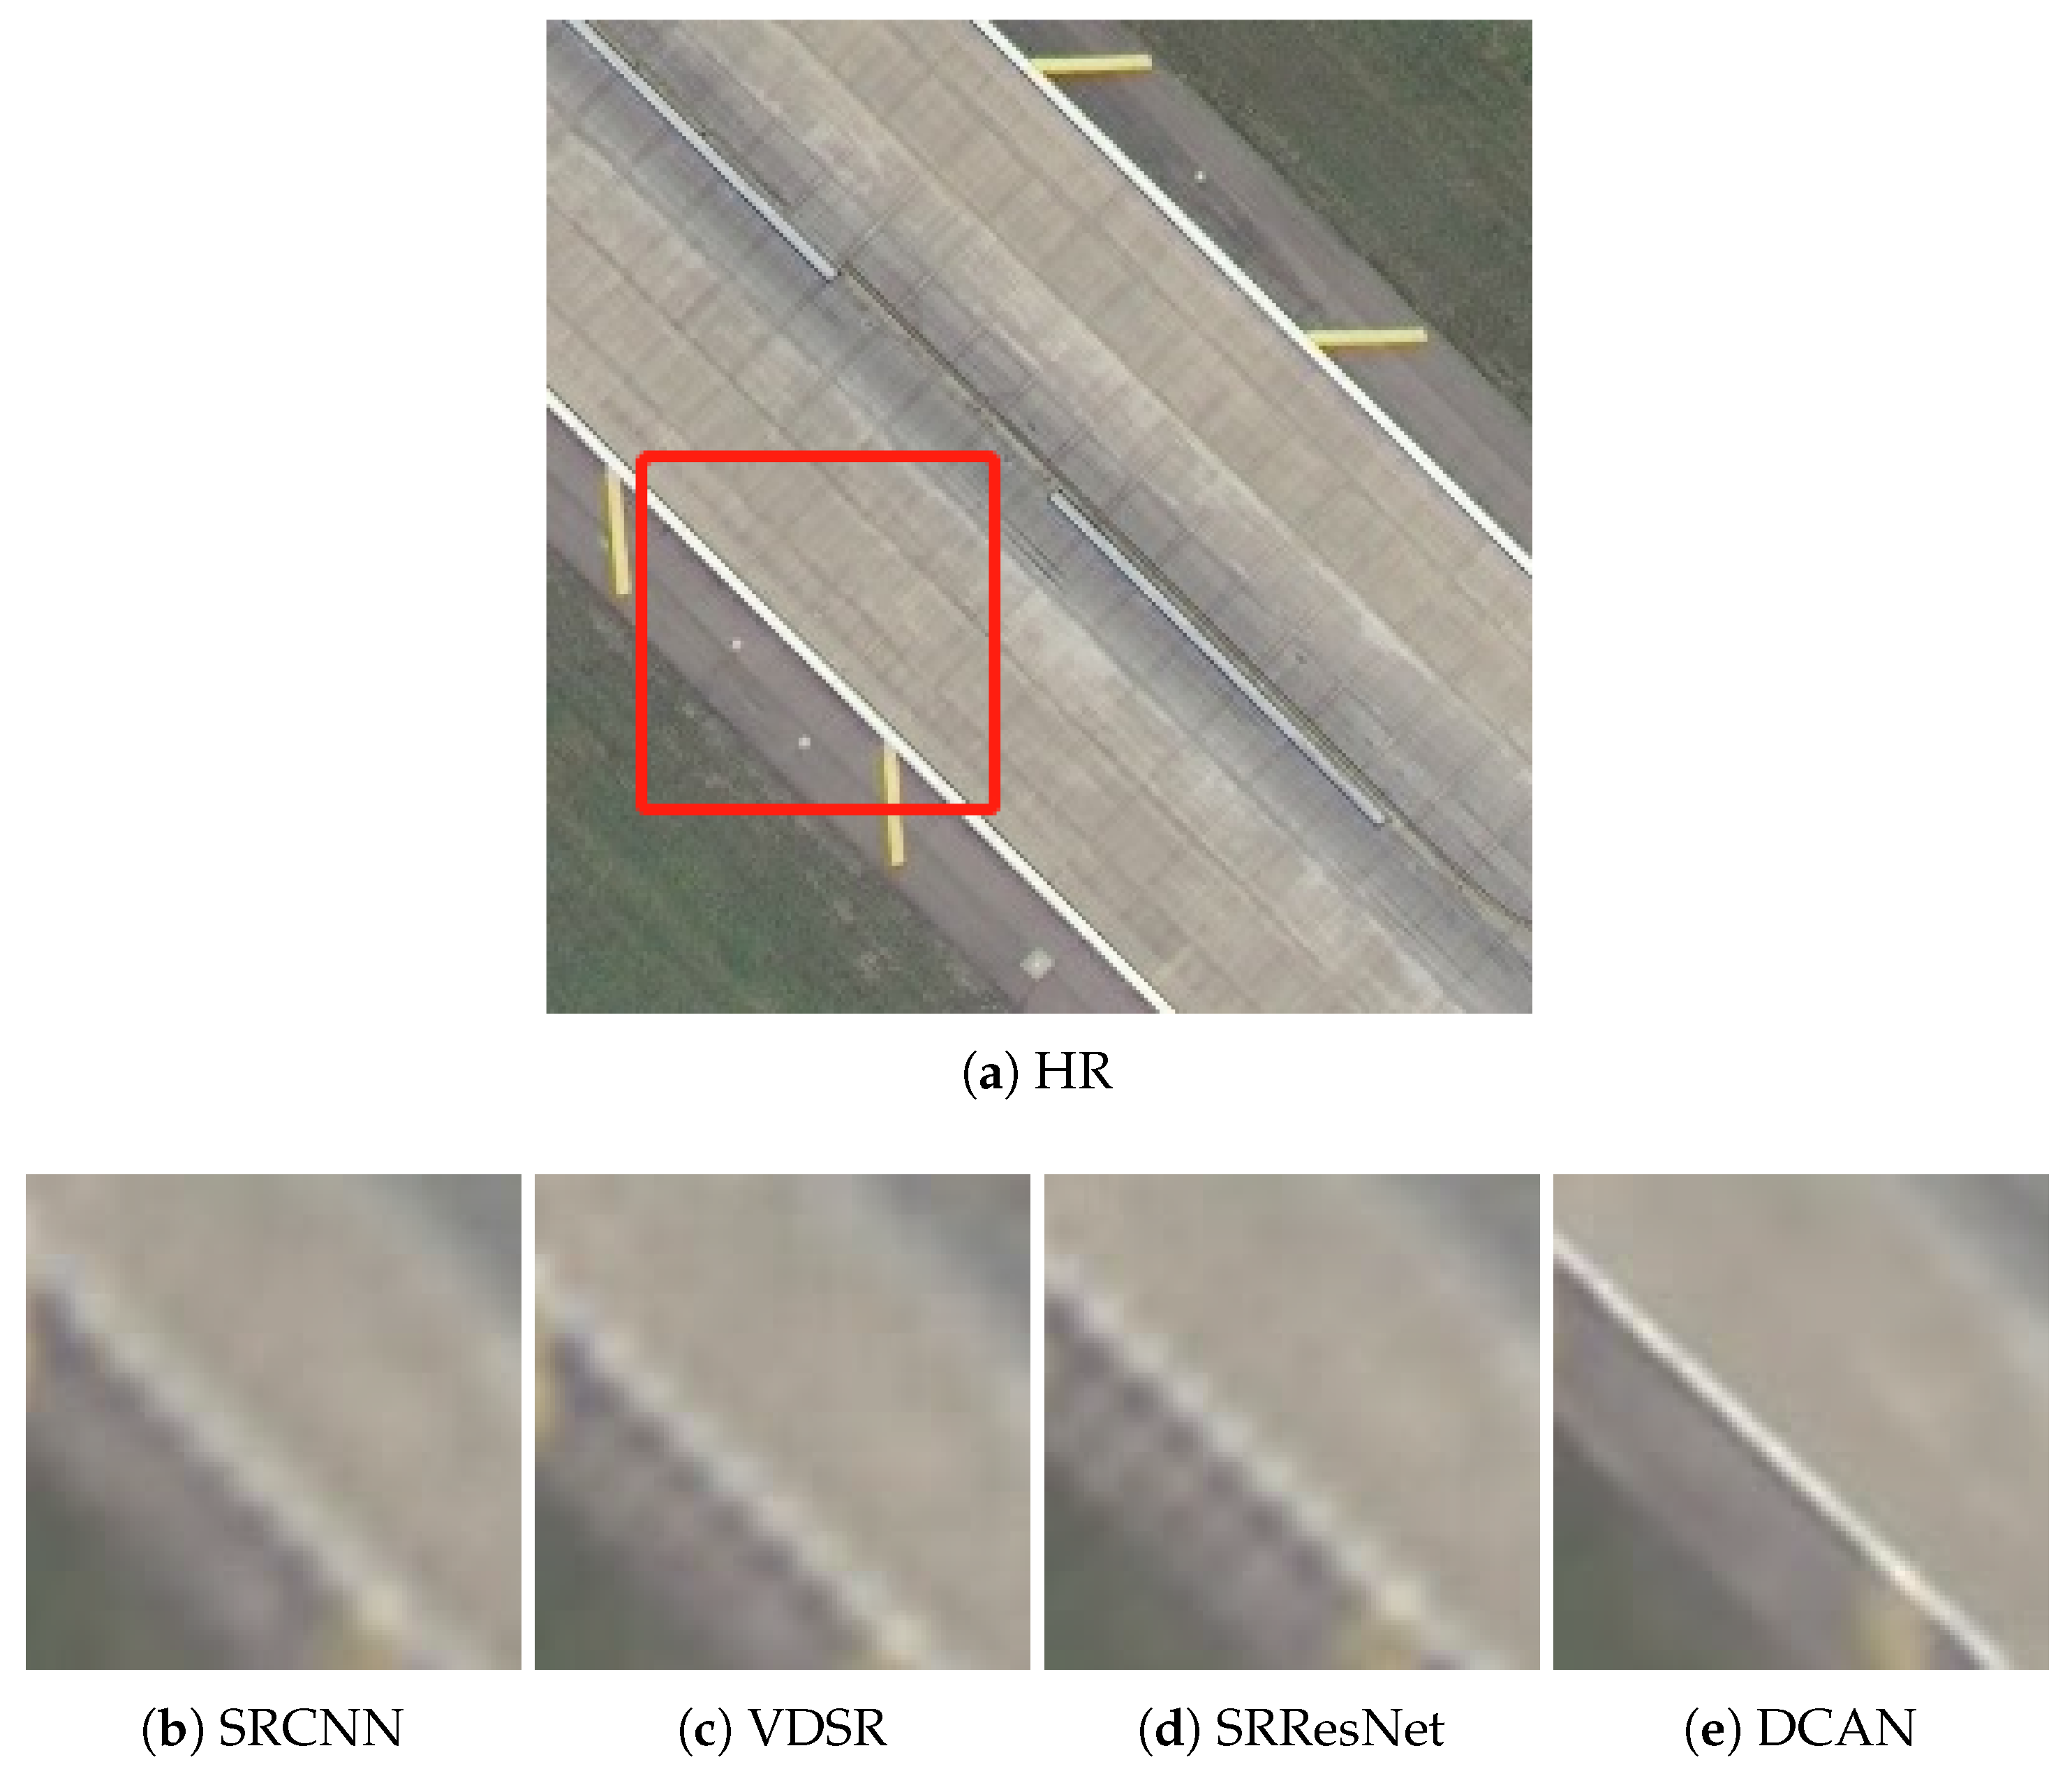
Figure 15.
The detail of super-resolved “runway39.jpg” region with a scale factor of . (a) represent HR image, (b–e) represent the super-resolved image patch of SRCNN, VDSR, SRResNet, DCAN.
Figure 8 shows the super-resolved HR images obtained through different models for “airplane89.jpg” with a scale factor of . The figure demonstrates that the reconstructed result of our DCAN model is better than those of the other algorithms, such as the edge of the plane. The reconstructed images for “overpass18.jpg” with a scale factor of are shown in Figure 9. It is obvious that DCAN reconstructed more details and recovered sharper edges, such as the traffic index line of the road and the car. Comparison results for “harbor32.jpg” of a scale factor are shown in Figure 10. We can get the conclusion that our method successfully reconstructed the main part of the bridge. The reconstructed HR images of “storagetanks68.jpg” are compared in Figure 12. The results demonstrate that the DCAN method provided more enhanced textures and recovered more details in comparison with other algorithms. Figure 13 shows the reconstructed images of “mediumresidential34.jpg” of a scale factor. It can be seen that the result of our proposed method reconstructed the edges sharper than the other methods. Figure 14 compares the reconstructed images of “runway39.jpg” with other methods. It is obvious that the proposed methods reconstructed the details better than the other algorithms, such as the thin strip lines at the right of the image. As shown in Figure 11 and Figure 15, we enlarge some regions of super-resolved images to better compare the textures and details. The texture and details of our proposed method are superior than those of other methods. The above results show that our method achieves better results compared with other methods in terms of the visual quality.
Table 1 and Table 2 show the PSNR and SSIM of the reconstructed HR images of the UC Merced test set on the and enlargement, respectively.

Table 1.
The PSNR and SSIM of UC Merced test dataset with a scale factor of 4.
Table 2.
The PSNR and SSIM of UC Merced test dataset with a scale factor of 8.
Our proposed method is also better than other methods in the quantitative evaluation. Table 3 and Table 4 show the PSNR and SSIM of the reconstructed HR images of RSSCN7 test set on the enlargement and enlargement, respectively. Experimental results demonstrate the effectiveness of our method.
Table 3.
The PSNR and SSIM of RSSCN7 test dataset with a scale factor of 4.
Table 4.
The PSNR and SSIM of RSSCN7 test dataset with a scale factor of 8.
3.3. Model Analysis
In this section, we use three groups of experiments to analyze the proposed method using the UC Merced dataset, including the number of DCAB, the dense channel attention mechanism, and the SAB. In addition, we use PSNR as quantitative evaluation.
- (1)
- DCAB: A small DCAN which contains four DCABs was used to learn the effect of . The experimental results about the effect of are presented in Table 5. We use three widely used values, including 32, 64 and 128. When , the average PSNR values on the test dataset are 0.27 dB higher than , and it also are 0.16 dB higher than . So, we set the in the rest of the experiments.
Table 5. The PSNR of DCAN with a scale factor of 4 under different on the UC Merced dataset.
- (2)
- Dense Channel Attention Mechanism: We use several DCAN which contain different to study the effect of the number of DCABs. The experimental results about the effect of are provided in Table 6. We set the number of DCABs to 4, 8 and 10, respectively. As shown in the table, we conclude that the PSNR of ten DCABs are higher than 4 and 8.
Table 6. The PSNR of DCAN which have different with a scale factor of 4 on the UC Merced dataset.
- (3)
- SAB: To study the effect of the SAB, we compare the DCAN-s which contain a SAB and the DCAN without SAB. The experimental results are provided in Table 7. It can be seen that the PSNR of DCAN-s is higher than DCAN. It demonstrates that SAB improves the network performance.
Table 7. The PSNR of DCAN and DCAN-s with a scale factor of 4 on the UC Merced dataset.
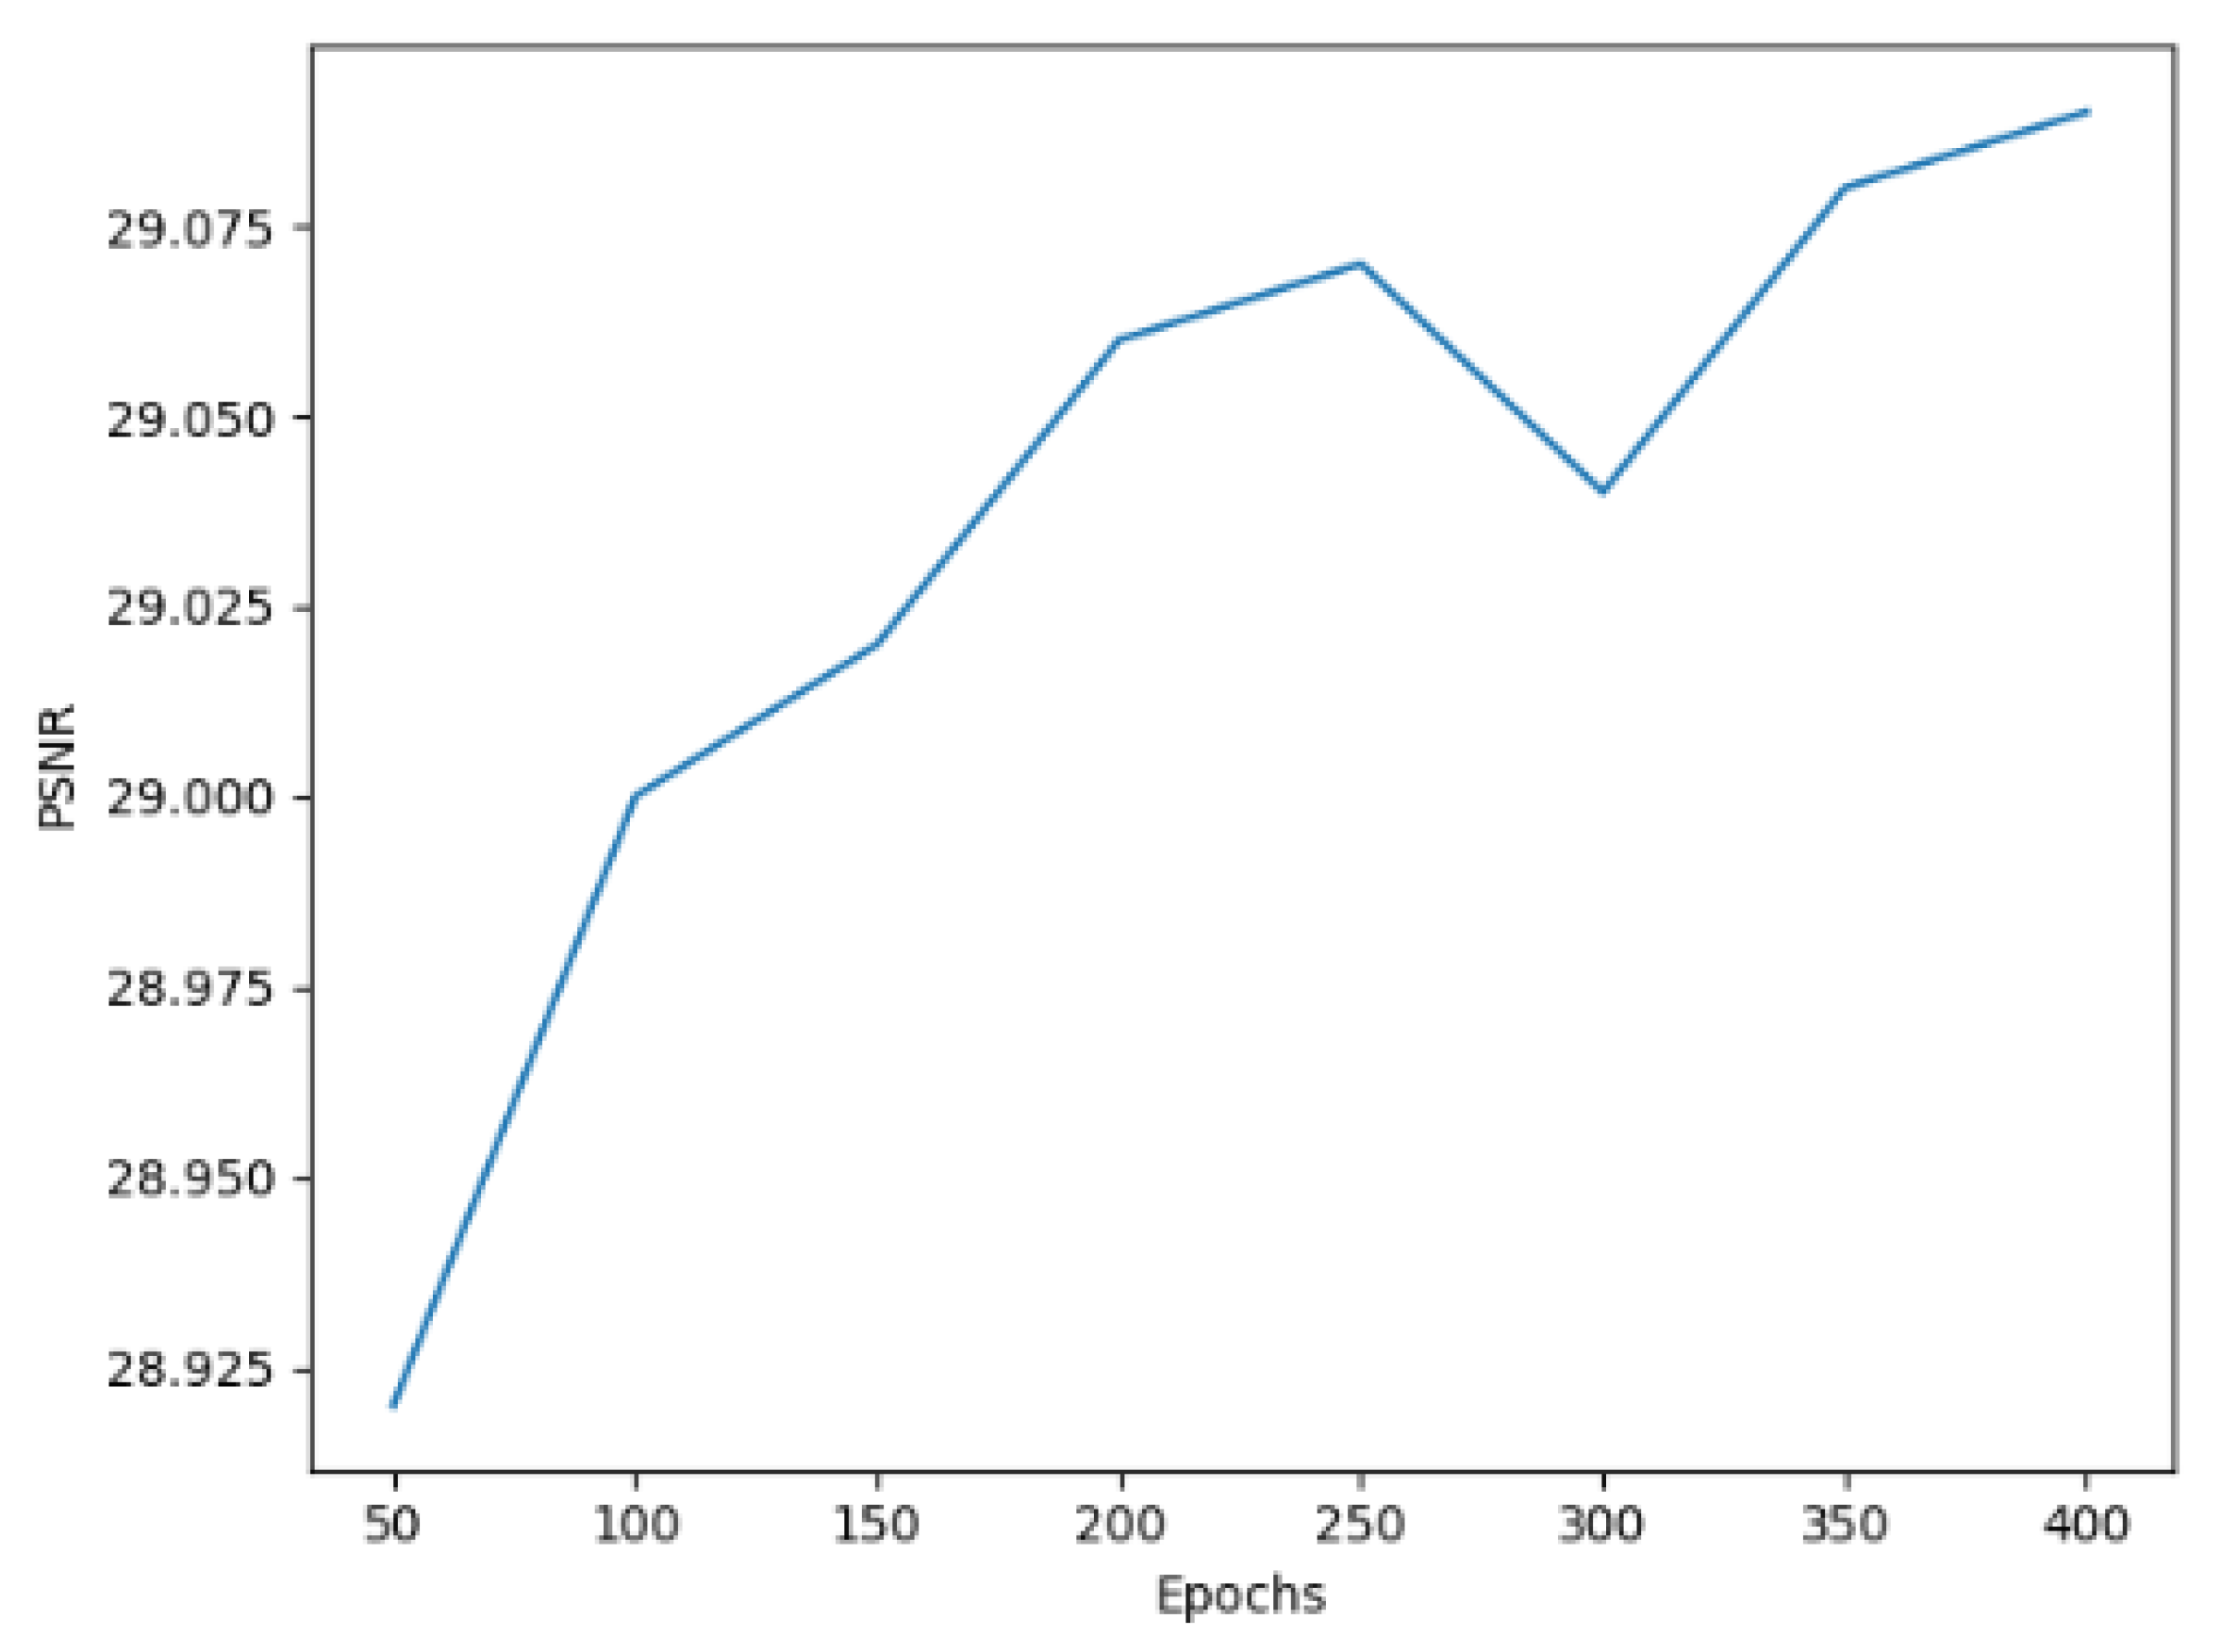
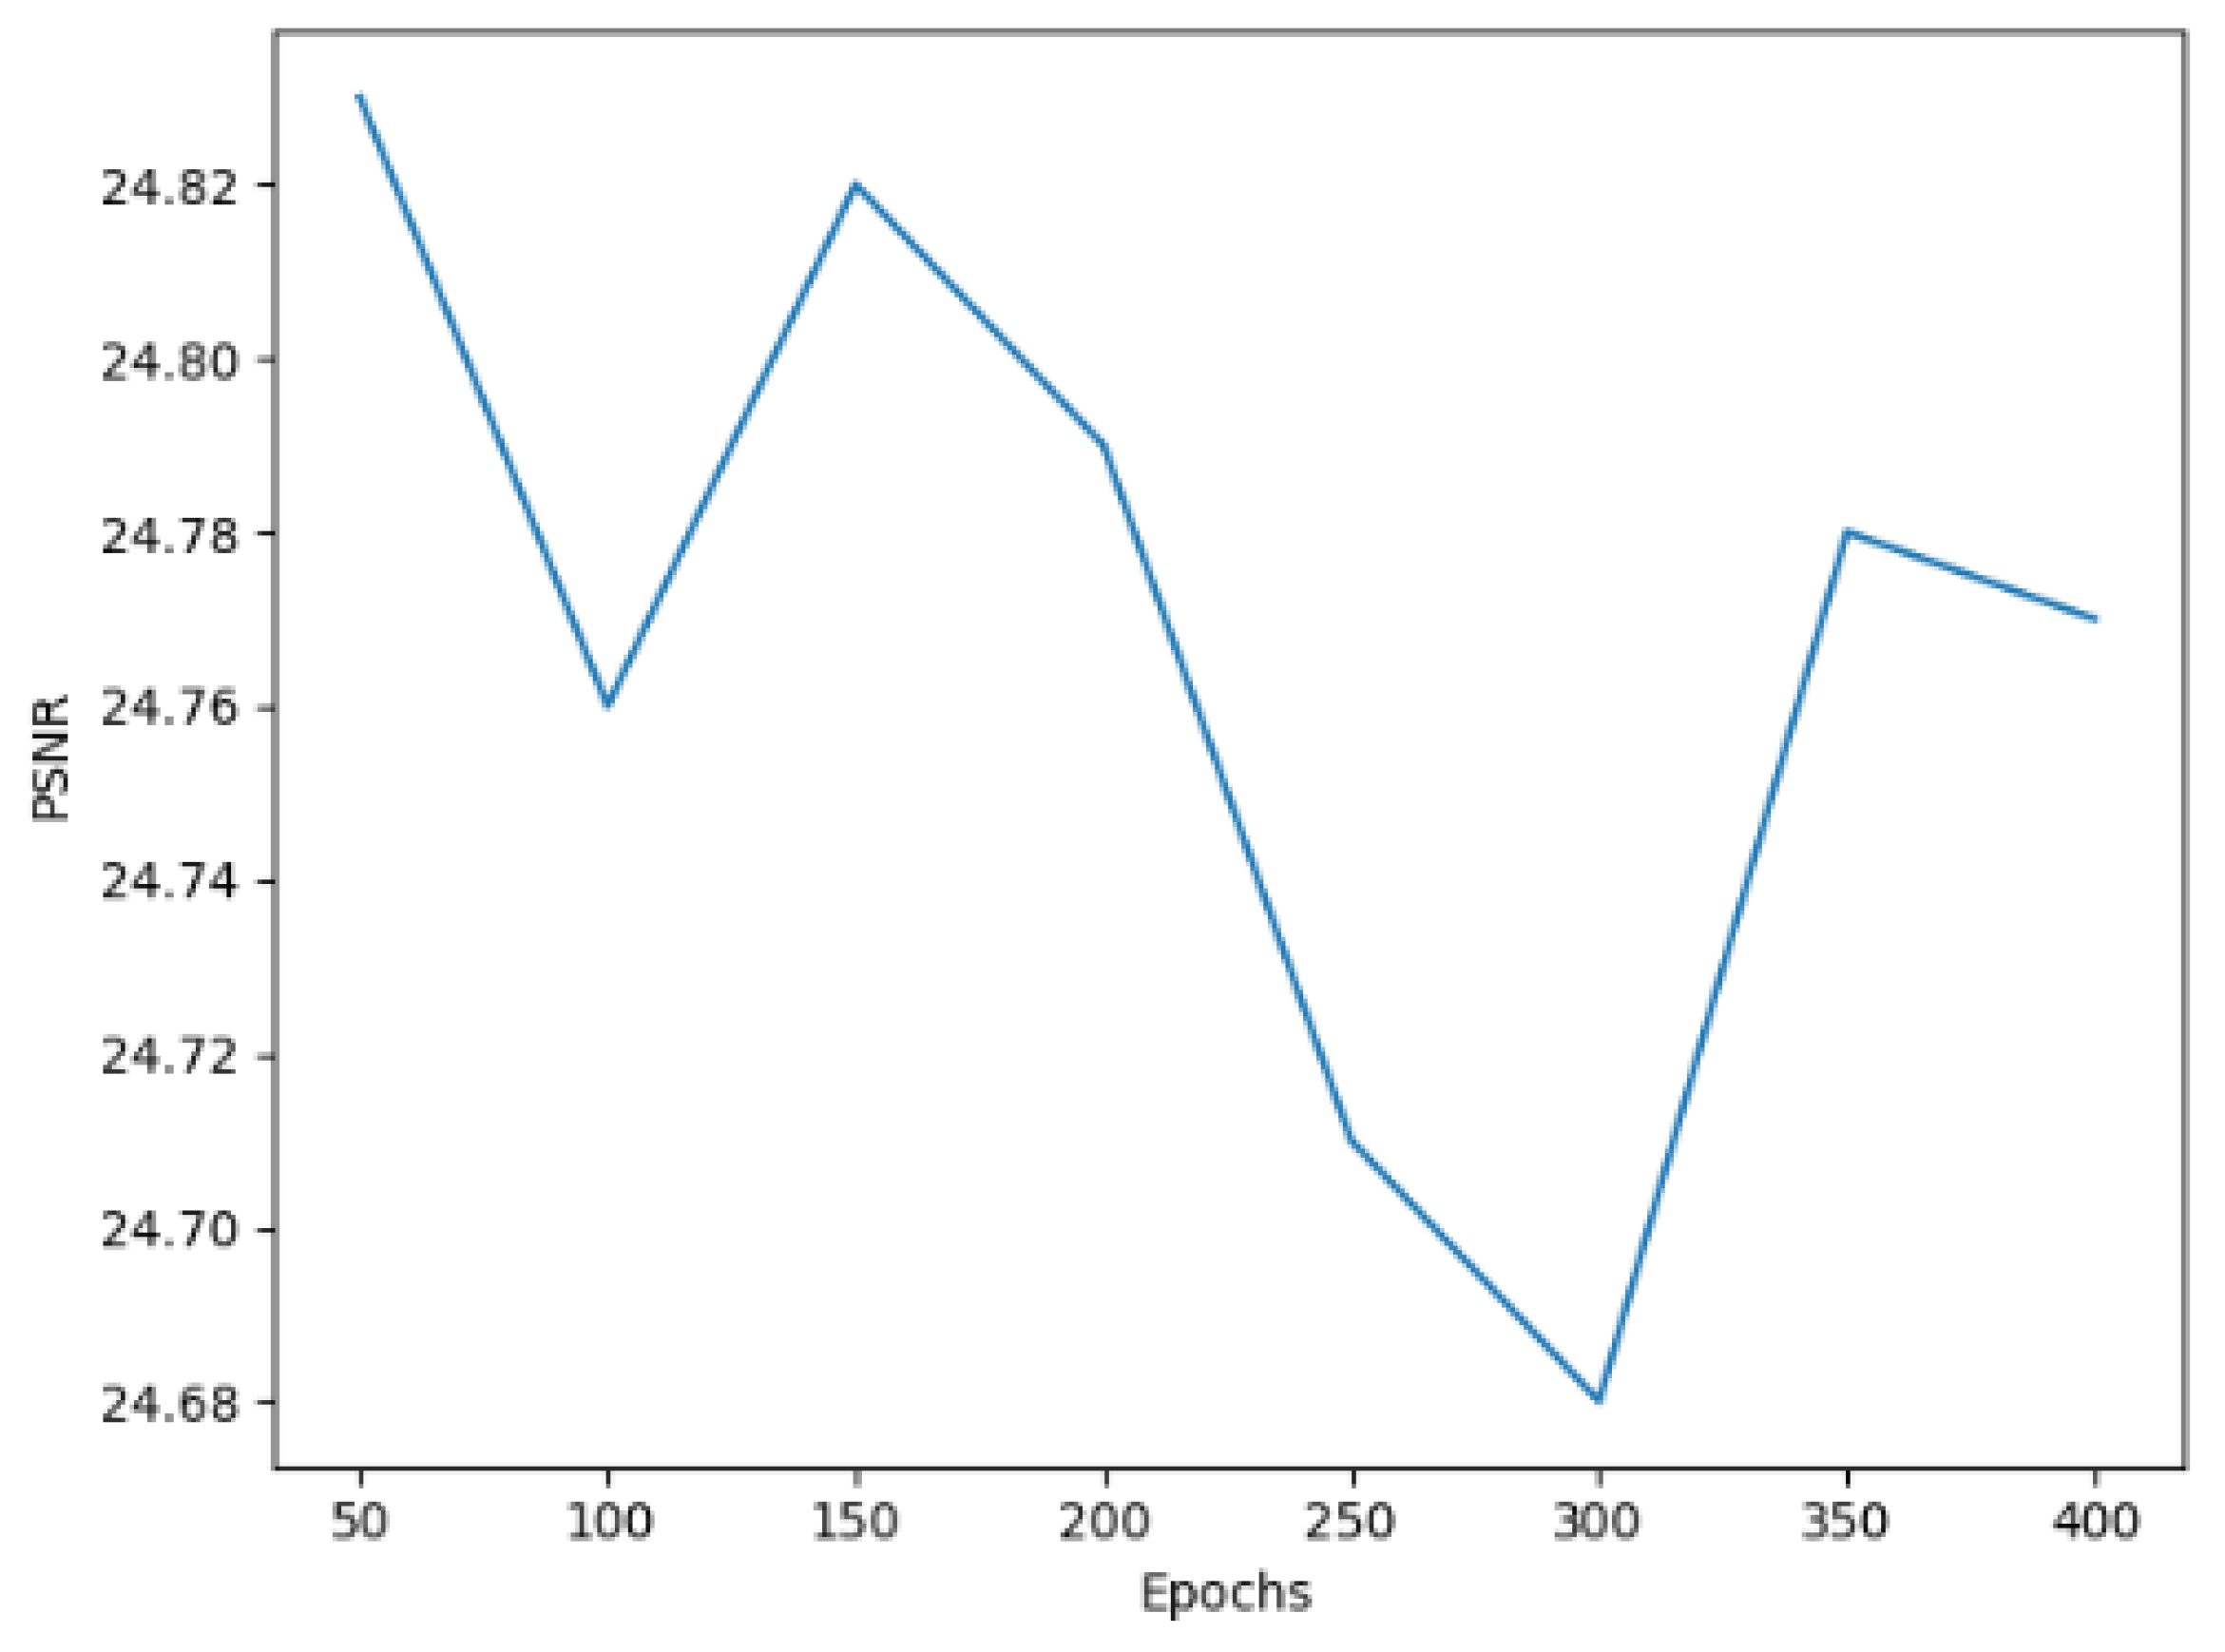
In addition, we explore the relationship between PSNR and epochs of network training. As shown in Figure 16, it can be seen that the PSNR of around 350 epochs begins to converge with a scale factor of ×4. As shown in Figure 17, at around 50 epochs, it begins to converge with a scale factor of ×8. We can draw the conclusion that, with our model, it is easy to achieve high performance.
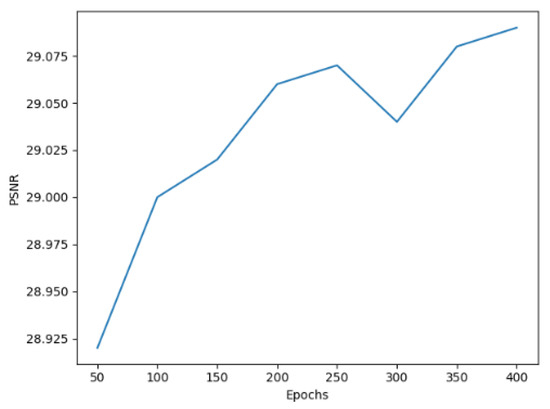
Figure 16.
PSNR of DCAN with a scale factor of ×4 on the UC Merced dataset.

Figure 17.
PSNR of DCAN with a scale factor of ×8 on the UC Merced dataset.
3.4. Super-Resolving the Real-World Data
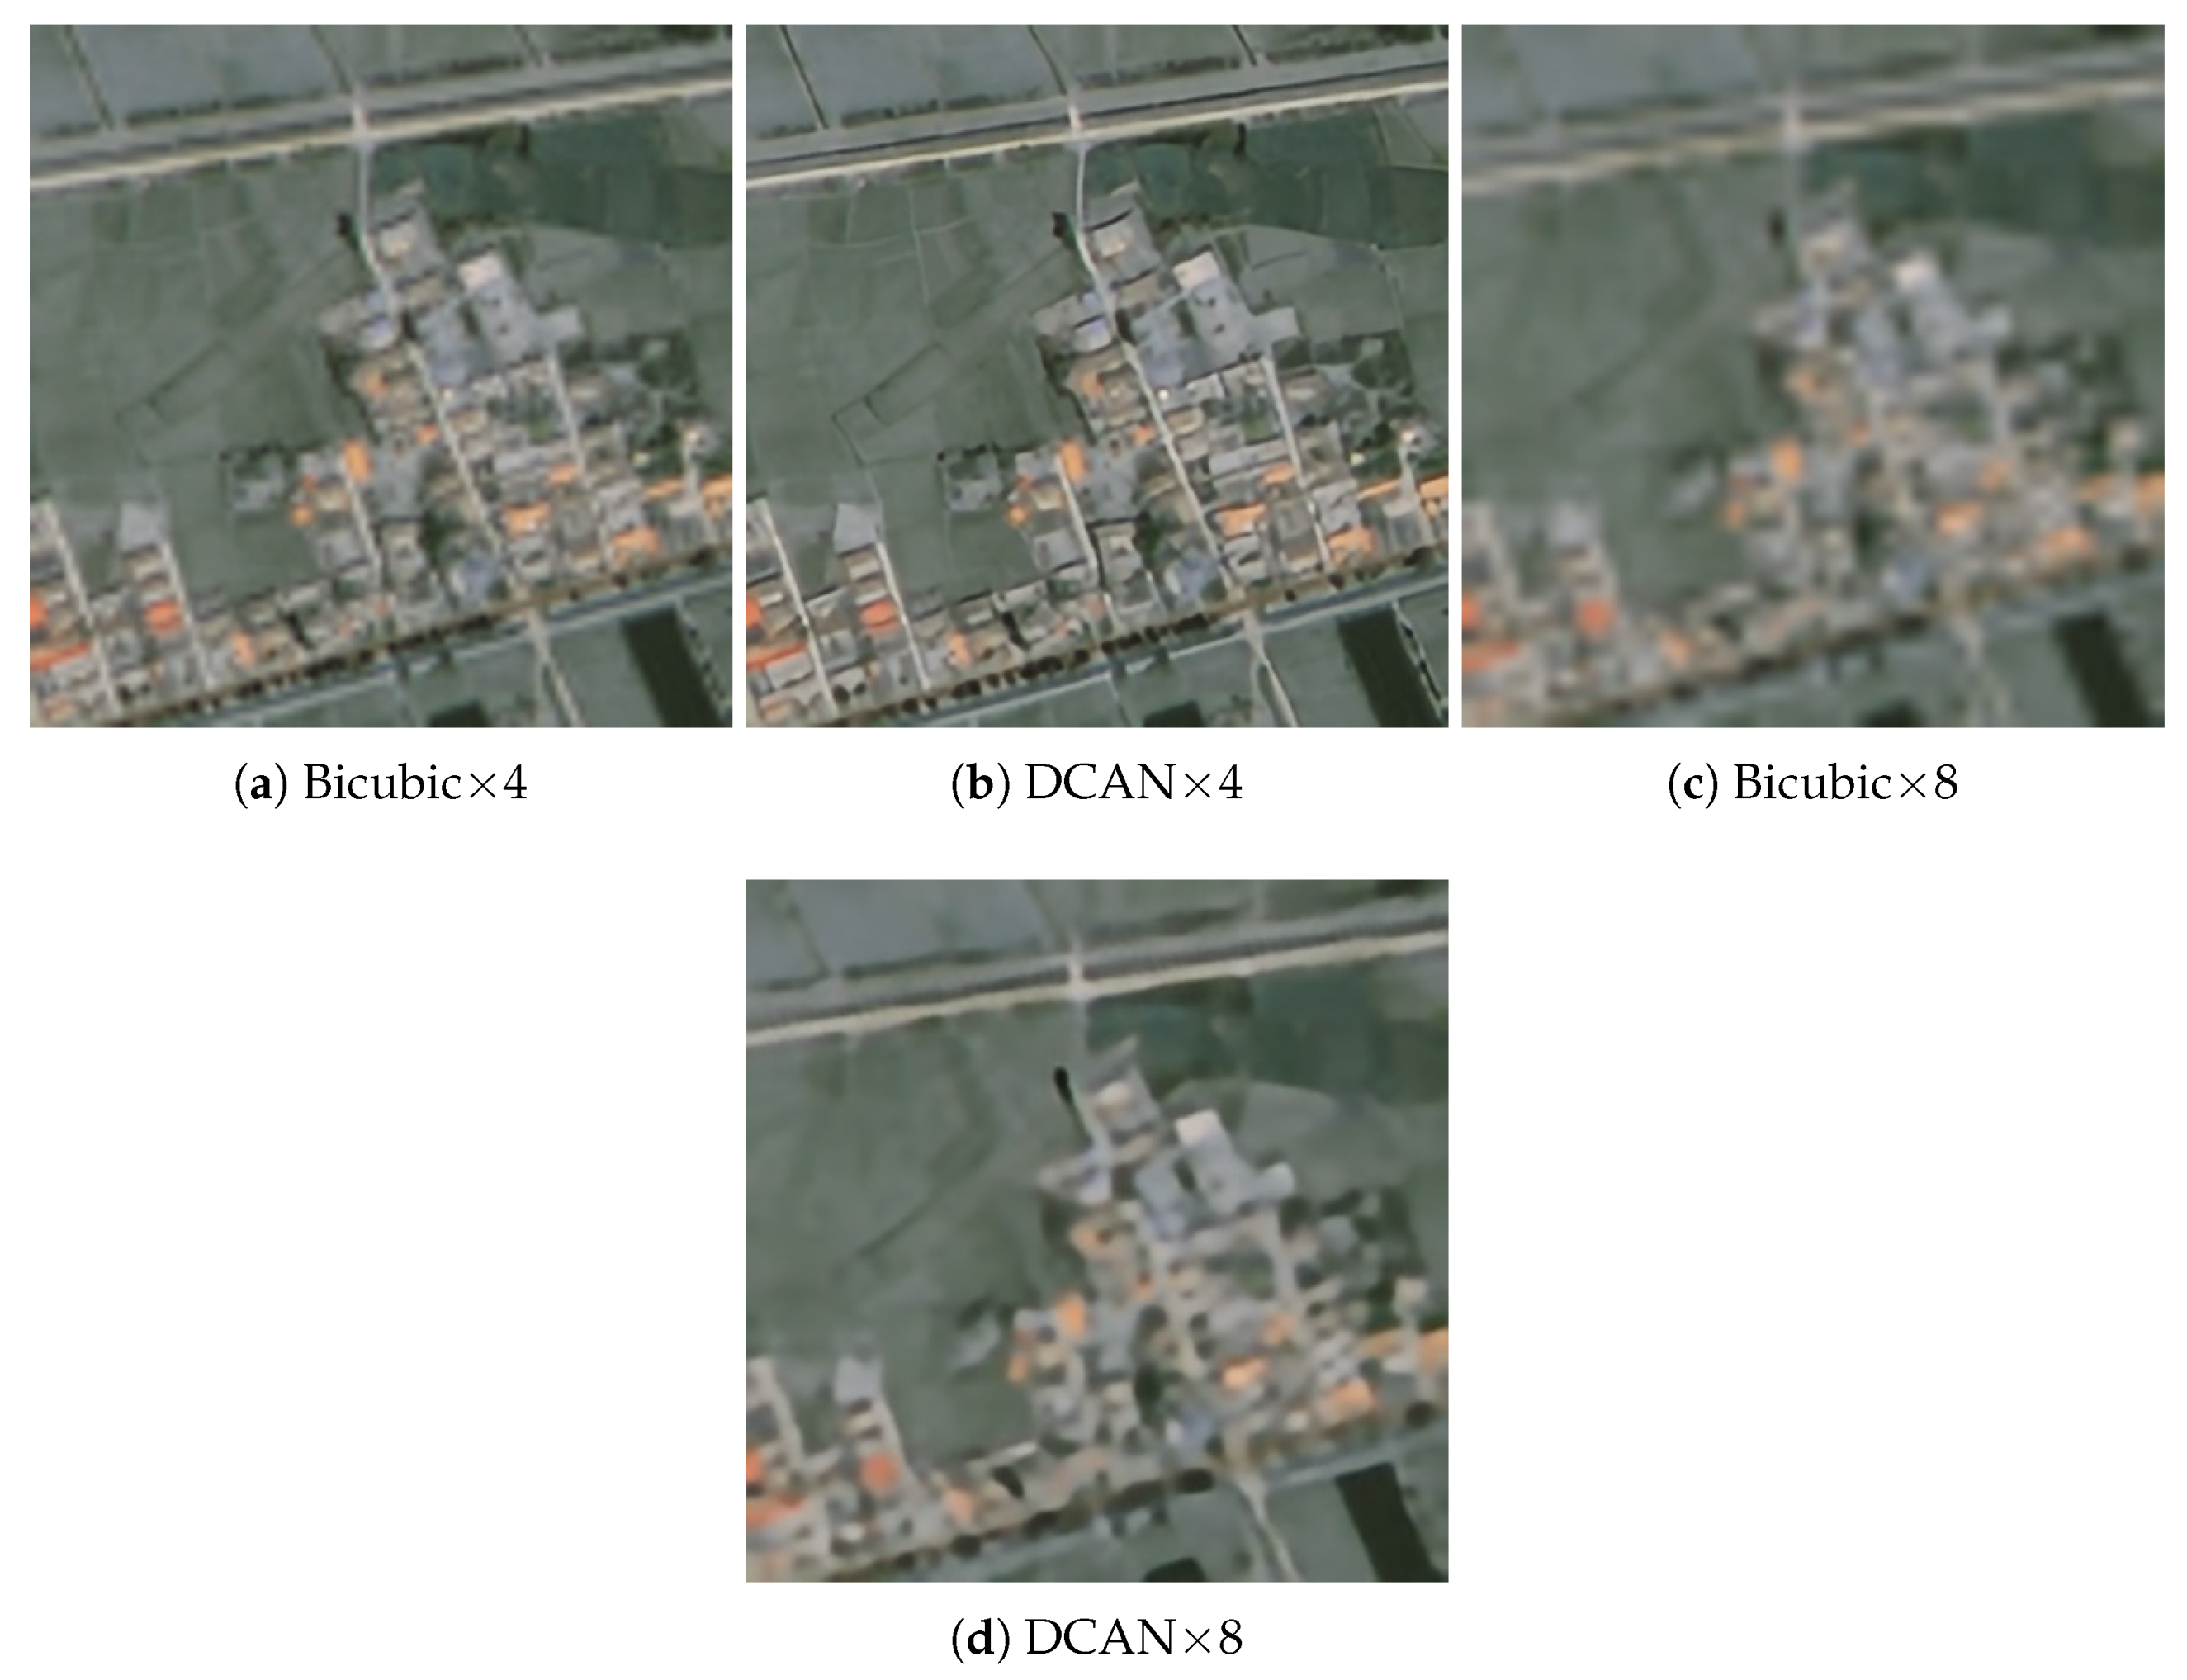
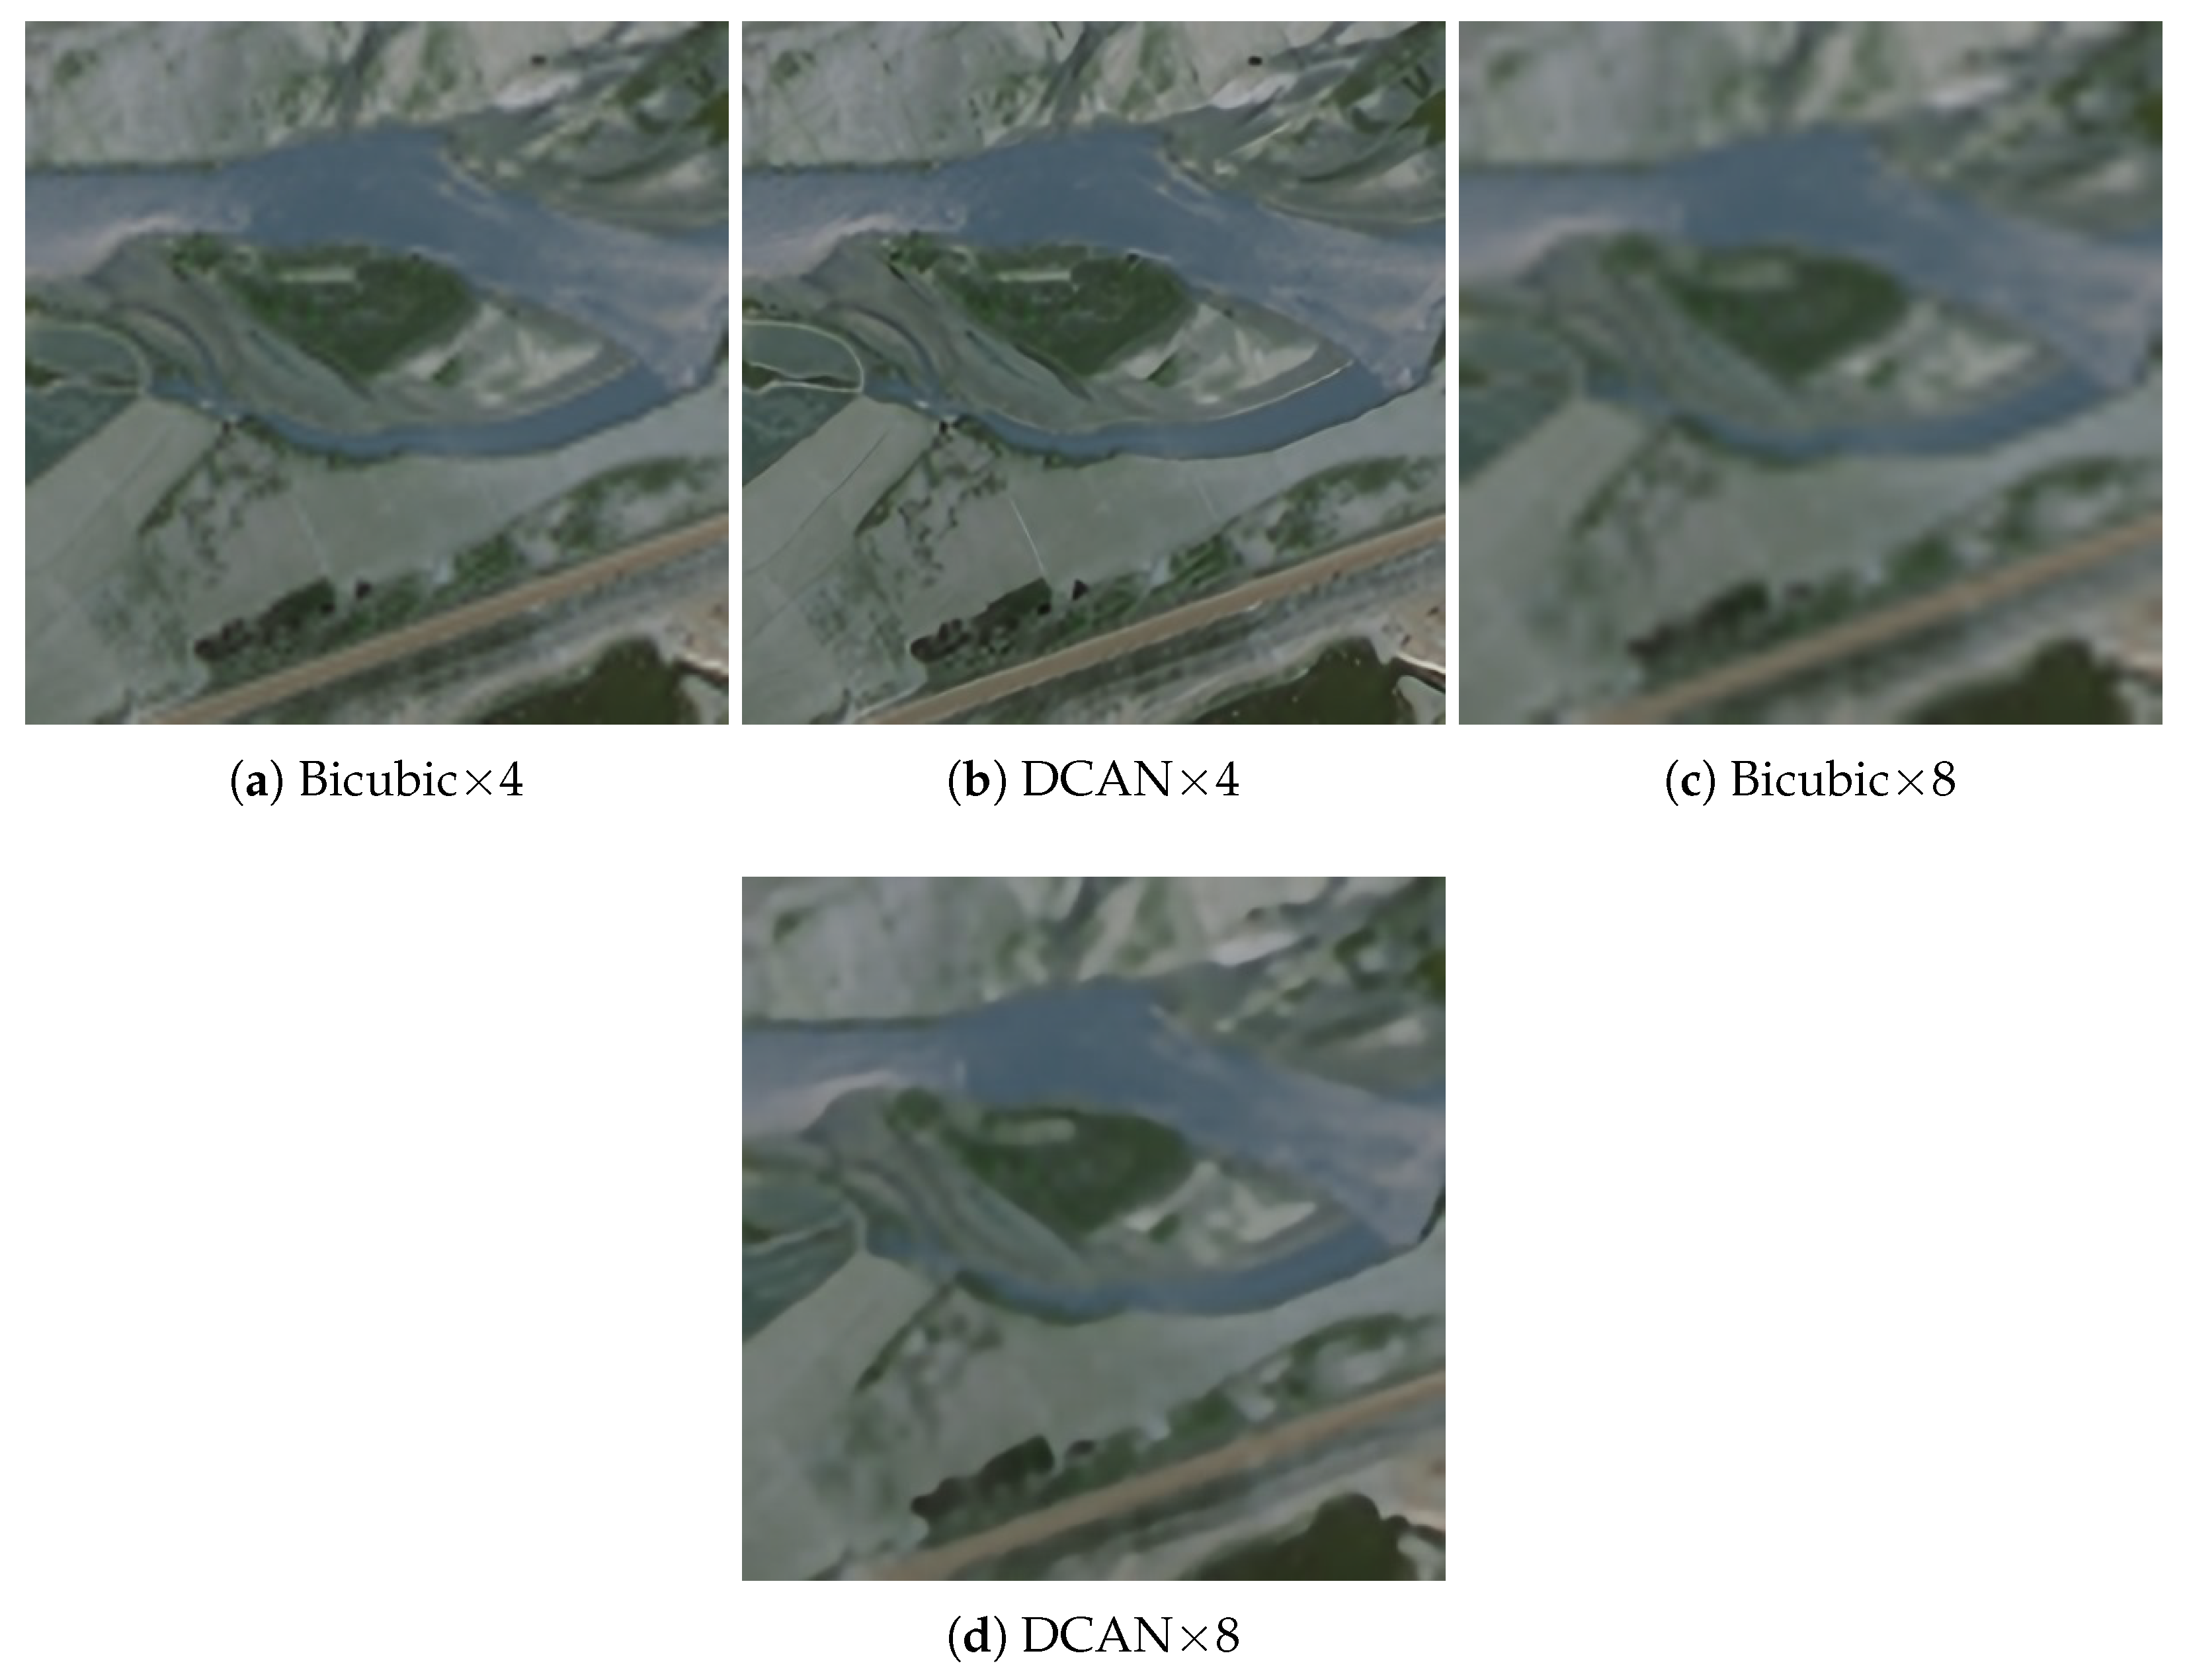
In this section, we use the real data to validate the robustness of our proposed method. The model is trained by UC Merced dataset and tested by some remote sensing images from GaoFen-2 in Ningxia, China, as the real-world data. The size and band number of real-word images are and 3, respectively. Figure 18 and Figure 19 show one LR image on the and enlargement, respectively. The reconstructed results show that the DCAN method achieves good results in terms of the visual quality.
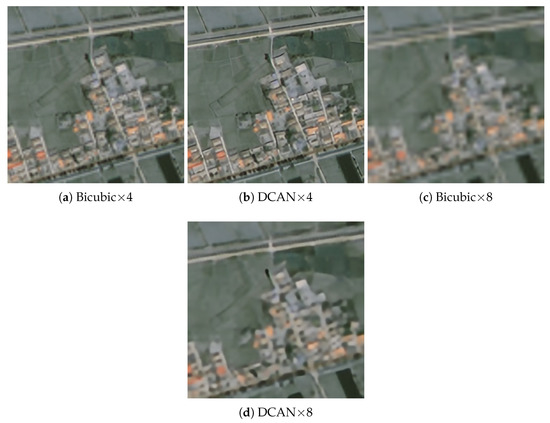
Figure 18.
SR results of real data of and scale factor. (a–d) represent the result of Bicubic , DCAN , Bicubic , DCAN , respectively.
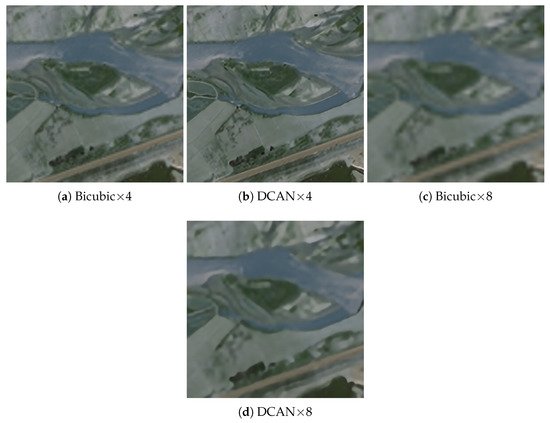
Figure 19.
SR results of real data of and scale factor. (a–d) represent the result of Bicubic , DCAN , Bicubic , DCAN , respectively.
4. Discussion
The proposed DCAN method is proven to have a good performance with experimental results. In Section 3.2, our method outperforms several state-of-the-art methods in both quantitative evaluation and visual quality. In Section 3.3, the increase of PSNR after adding DCAB and SAB demonstrates the effectiveness of our approch. In Section 3.4, we deal with real satellite images from GaoFen-2 using the DCAN model and obtain satisfactory SR results. In addition, we discussed the experimental results in combination with theoretical analysis.
- (1)
- Effect of Dense Channel Attention Block: As shown in Table 6, the PSNR of super-resolved images increases after we add the DCAB. It can be seen that when the number of increases from 4 to 10, it improves the performance of network. It proves that when we increase appropriately the number of , the capacity of the network can be improved.
- (2)
- Effect of Spatial Attention Block: As shown in Table 7, it can be seen that the PSNR value ranges from 28.63 to 28.70 after we add the SAB. Thus, we conclude that SAB can improve the performance of network and help the network have more flexible discriminative ability for global structure and focus on high-frequency information from spatial dimension.
- (3)
5. Conclusions
This article develops a DCAN network which achieves good performance in super-resolving the remote sensing images with complicated spatial distribution. Specifically, we design a network which densely uses the multi-level feature information and strengthens the effective information. In addition, we propose a dense channel attention mechanism which makes better use of multi-level feature maps which contain abundant high-frequency information. Further, we add a spatial attention block to pay more attention to the regions which are more important and more difficult to reconstruct. Results of the extensive experiments demonstrate the superiority of our method over the other compared algorithms.
Author Contributions
Funding acquisition, P.L. and X.S.; Investigation, Y.M.; Methodology, Y.M., P.L. and H.L.; Resources, P.L., H.L., X.S. and Y.Z.; Supervision, P.L.; Validation, Y.M.; Writing—original draft, Y.M. and P.L.; Writing—review & editing, P.L. and Y.Z. All authors have read and agreed to the published version of the manuscript.
Funding
This work was supported in part by the National Natural Science Foundation of China under Grant 42001307, and Grant 62061038, in part by the Ningxia Key RD Program under Grant 2020BFG02013, and in part by the Natural Science Foundation of Ningxia under Grant 2020AAC02006.
Conflicts of Interest
The authors declare no conflict of interest.
References
- Dong, Z.; Wang, M.; Wang, Y.; Zhu, Y.; Zhang, Z. Object detection in high resolution remote sensing imagery based on convolutional neural networks with suitable object scale features. IEEE Trans. Geosci. Remote Sens. 2019, 58, 2104–2114. [Google Scholar] [CrossRef]
- Amit, S.N.K.B.; Shiraishi, S.; Inoshita, T.; Aoki, Y. Analysis of satellite images for disaster detection. In Proceedings of the 2016 IEEE International Geoscience and Remote Sensing Symposium (IGARSS), Beijing, China, 10–15 July 2016; pp. 5189–5192. [Google Scholar]
- Mathieu, R.; Freeman, C.; Aryal, J. Mapping private gardens in urban areas using object-oriented techniques and very high-resolution satellite imagery. Landsc. Urban Plan. 2007, 81, 179–192. [Google Scholar] [CrossRef]
- Li, W.; He, C.; Fang, J.; Zheng, J.; Fu, H.; Yu, L. Semantic segmentation-based building footprint extraction using very high-resolution satellite images and multi-source GIS data. Remote Sens. 2019, 11, 403. [Google Scholar] [CrossRef] [Green Version]
- Zhao, K.; Kang, J.; Jung, J.; Sohn, G. Building extraction from satellite images using mask R-CNN with building boundary regularization. In Proceedings of the IEEE Conference on Computer Vision and Pattern Recognition Workshops, Salt Lake City, UT, USA, 18–22 June 2018; pp. 247–251. [Google Scholar]
- Yuan, S.; Dong, R.; Zheng, J.; Wu, W.; Zhang, L.; Li, W.; Fu, H. Long time-series analysis of urban development based on effective building extraction. In Proceedings of the Geospatial Informatics X, International Society for Optics and Photonics, Online, 21 April 2020; Volume 11398, p. 113980M. [Google Scholar]
- Lu, T.; Ming, D.; Lin, X.; Hong, Z.; Bai, X.; Fang, J. Detecting building edges from high spatial resolution remote sensing imagery using richer convolution features network. Remote Sens. 2018, 10, 1496. [Google Scholar] [CrossRef] [Green Version]
- Zhao, P.; Liu, K.; Zou, H.; Zhen, X. Multi-stream convolutional neural network for SAR automatic target recognition. Remote Sens. 2018, 10, 1473. [Google Scholar] [CrossRef] [Green Version]
- Zhang, W.; Witharana, C.; Liljedahl, A.K.; Kanevskiy, M. Deep convolutional neural networks for automated characterization of arctic ice-wedge polygons in very high spatial resolution aerial imagery. Remote Sens. 2018, 10, 1487. [Google Scholar] [CrossRef] [Green Version]
- Xu, Y.; Zhu, M.; Li, S.; Feng, H.; Ma, S.; Che, J. End-to-end airport detection in remote sensing images combining cascade region proposal networks and multi-threshold detection networks. Remote Sens. 2018, 10, 1516. [Google Scholar] [CrossRef] [Green Version]
- Ma, J.; Zhao, J.; Jiang, J.; Zhou, H.; Guo, X. Locality preserving matching. Int. J. Comput. Vis. 2019, 127, 512–531. [Google Scholar] [CrossRef]
- Lv, P.; Zhong, Y.; Zhao, J.; Zhang, L. Unsupervised change detection based on hybrid conditional random field model for high spatial resolution remote sensing imagery. IEEE Trans. Geosci. Remote Sens. 2018, 56, 4002–4015. [Google Scholar] [CrossRef]
- Kakareko, G.; Jung, S.; Ozguven, E.E. Estimation of tree failure consequences due to high winds using convolutional neural networks. Int. J. Remote Sens. 2020, 41, 9039–9063. [Google Scholar] [CrossRef]
- Song, Y.; Zhang, Z.; Baghbaderani, R.K.; Wang, F.; Qu, Y.; Stuttsy, C.; Qi, H. Land cover classification for satellite images through 1d cnn. In Proceedings of the 2019 10th Workshop on Hyperspectral Imaging and Signal Processing: Evolution in Remote Sensing (WHISPERS), Amsterdam, The Netherlands, 24–26 September 2019; pp. 1–5. [Google Scholar]
- Kocatepe, A.; Ulak, M.B.; Kakareko, G.; Ozguven, E.E.; Jung, S.; Arghandeh, R. Measuring the accessibility of critical facilities in the presence of hurricane-related roadway closures and an approach for predicting future roadway disruptions. Nat. Hazards 2019, 95, 615–635. [Google Scholar] [CrossRef]
- Zhang, L.; Zhang, L.; Du, B. Deep learning for remote sensing data: A technical tutorial on the state of the art. IEEE Geosci. Remote Sens. Mag. 2016, 4, 22–40. [Google Scholar] [CrossRef]
- Shen, H.; Zhang, L.; Huang, B.; Li, P. A MAP approach for joint motion estimation, segmentation, and super resolution. IEEE Trans. Image Process. 2007, 16, 479–490. [Google Scholar] [CrossRef]
- Köhler, T.; Huang, X.; Schebesch, F.; Aichert, A.; Maier, A.; Hornegger, J. Robust multiframe super-resolution employing iteratively re-weighted minimization. IEEE Trans. Comput. Imaging 2016, 2, 42–58. [Google Scholar] [CrossRef]
- Lei, S.; Shi, Z.; Zou, Z. Super-resolution for remote sensing images via local–global combined network. IEEE Geosci. Remote Sens. Lett. 2017, 14, 1243–1247. [Google Scholar] [CrossRef]
- Li, F.; Jia, X.; Fraser, D.; Lambert, A. Super resolution for remote sensing images based on a universal hidden Markov tree model. IEEE Trans. Geosci. Remote Sens. 2009, 48, 1270–1278. [Google Scholar]
- Garzelli, A. A review of image fusion algorithms based on the super-resolution paradigm. Remote Sens. 2016, 8, 797. [Google Scholar] [CrossRef] [Green Version]
- Pan, Z.; Ma, W.; Guo, J.; Lei, B. Super-resolution of single remote sensing image based on residual dense backprojection networks. IEEE Trans. Geosci. Remote Sens. 2019, 57, 7918–7933. [Google Scholar] [CrossRef]
- Chang, K.; Ding, P.L.K.; Li, B. Single image super-resolution using collaborative representation and non-local self-similarity. Signal Process. 2018, 149, 49–61. [Google Scholar] [CrossRef]
- Lu, X.; Yuan, H.; Yuan, Y.; Yan, P.; Li, L.; Li, X. Local learning-based image super-resolution. In Proceedings of the 2011 IEEE 13th International Workshop on Multimedia Signal Processing, Hangzhou, China, 17–19 October 2011; pp. 1–5. [Google Scholar]
- Zhong, Y.; Zhang, L. Remote sensing image subpixel mapping based on adaptive differential evolution. IEEE Trans. Syst. Man Cybern. Part B 2012, 42, 1306–1329. [Google Scholar] [CrossRef]
- Yang, J.; Wright, J.; Huang, T.S.; Ma, Y. Image super-resolution via sparse representation. IEEE Trans. Image Process. 2010, 19, 2861–2873. [Google Scholar] [CrossRef] [PubMed]
- Lu, X.; Yan, P.; Yuan, Y.; Li, X.; Yuan, H. Utilizing homotopy for single image superresolution. In Proceedings of the First Asian Conference on Pattern Recognition, Beijing, China, 28 November 2011; pp. 316–320. [Google Scholar]
- Lu, X.; Yuan, H.; Yan, P.; Yuan, Y.; Li, X. Geometry constrained sparse coding for single image super-resolution. In Proceedings of the 2012 IEEE Conference on Computer Vision and Pattern Recognition, Providence, RI, USA, 16–21 June 2012; pp. 1648–1655. [Google Scholar]
- Lu, X.; Yuan, Y.; Yan, P. Image super-resolution via double sparsity regularized manifold learning. IEEE Trans. Circuits Syst. Video Technol. 2013, 23, 2022–2033. [Google Scholar] [CrossRef]
- Lu, X.; Yuan, Y.; Yan, P. Alternatively constrained dictionary learning for image superresolution. IEEE Trans. Cybern. 2013, 44, 366–377. [Google Scholar] [PubMed]
- Dong, W.; Zhang, L.; Shi, G.; Wu, X. Image deblurring and super-resolution by adaptive sparse domain selection and adaptive regularization. IEEE Trans. Image Process. 2011, 20, 1838–1857. [Google Scholar] [CrossRef] [Green Version]
- Dong, C.; Loy, C.C.; He, K.; Tang, X. Image super-resolution using deep convolutional networks. IEEE Trans. Pattern Anal. Mach. Intell. 2015, 38, 295–307. [Google Scholar] [CrossRef] [Green Version]
- Dong, C.; Loy, C.C.; Tang, X. Accelerating the super-resolution convolutional neural network. In Lecture Notes in Computer Science, Proceedings of the European Conference on Computer Vision, Amsterdam, The Netherlands, 11–14 October 2016; Springer: Cham, Switzerland, 2016; pp. 391–407. [Google Scholar]
- Shi, W.; Caballero, J.; Huszár, F.; Totz, J.; Aitken, A.P.; Bishop, R.; Rueckert, D.; Wang, Z. Real-time single image and video super-resolution using an efficient sub-pixel convolutional neural network. In Proceedings of the IEEE Conference on Computer Vision and Pattern Recognition, Las Vegas, NV, USA, 26 June–1 July 2016; pp. 1874–1883. [Google Scholar]
- He, K.; Zhang, X.; Ren, S.; Sun, J. Deep residual learning for image recognition. In Proceedings of the IEEE Conference on Computer Vision and Pattern Recognition, Las Vegas, NV, USA, 26 June–1 July 2016; pp. 770–778. [Google Scholar]
- Kim, J.; Lee, J.K.; Lee, K.M. Accurate image super-resolution using very deep convolutional networks. In Proceedings of the IEEE Conference on Computer Vision and Pattern Recognition, Las Vegas, NV, USA, 26 June–1 July 2016; pp. 1646–1654. [Google Scholar]
- Lim, B.; Son, S.; Kim, H.; Nah, S.; Mu Lee, K. Enhanced deep residual networks for single image super-resolution. In Proceedings of the IEEE Conference on Computer Vision and Pattern Recognition Workshops, Honolulu, HI, USA, 21–26 June 2017; pp. 136–144. [Google Scholar]
- Ledig, C.; Theis, L.; Huszár, F.; Caballero, J.; Cunningham, A.; Acosta, A.; Aitken, A.; Tejani, A.; Totz, J.; Wang, Z. Photo-realistic single image super-resolution using a generative adversarial network. In Proceedings of the IEEE Conference on Computer Vision and Pattern Recognition, Honolulu, HI, USA, 21–26 June 2017; pp. 4681–4690. [Google Scholar]
- Zhang, Y.; Li, K.; Li, K.; Wang, L.; Zhong, B.; Fu, Y. Image super-resolution using very deep residual channel attention networks. In Proceedings of the European Conference on Computer Vision (ECCV), Munich, Germany, 8–14 September 2018; pp. 286–301. [Google Scholar]
- Ahn, N.; Kang, B.; Sohn, K.A. Fast, accurate, and lightweight super-resolution with cascading residual network. In Proceedings of the European Conference on Computer Vision (ECCV), Munich, Germany, 8–14 September 2018; pp. 252–268. [Google Scholar]
- Haris, M.; Shakhnarovich, G.; Ukita, N. Deep back-projection networks for super-resolution. In Proceedings of the IEEE Conference on Computer Vision and Pattern Recognition, Salt Like City, UT, USA, 18–22 June 2018; pp. 1664–1673. [Google Scholar]
- Tong, T.; Li, G.; Liu, X.; Gao, Q. Image super-resolution using dense skip connections. In Proceedings of the IEEE International Conference on Computer Vision, Venice, Italy, 22–29 October 2017; pp. 4799–4807. [Google Scholar]
- Zhang, Y.; Tian, Y.; Kong, Y.; Zhong, B.; Fu, Y. Residual dense network for image super-resolution. In Proceedings of the IEEE Conference on Computer Vision and Pattern Recognition, Salt Like City, UT, USA, 18–22 June 2018; pp. 2472–2481. [Google Scholar]
- Zhang, S.; Yuan, Q.; Li, J.; Sun, J.; Zhang, X. Scene-adaptive remote sensing image super-resolution using a multiscale attention network. IEEE Trans. Geosci. Remote Sens. 2020, 58, 4764–4779. [Google Scholar] [CrossRef]
- Dong, X.; Sun, X.; Jia, X.; Xi, Z.; Gao, L.; Zhang, B. Remote sensing image super-resolution using novel dense-sampling networks. IEEE Trans. Geosci. Remote Sens. 2020, 59, 1618–1633. [Google Scholar] [CrossRef]
- Dong, X.; Wang, L.; Sun, X.; Jia, X.; Gao, L.; Zhang, B. Remote Sensing Image Super-Resolution Using Second-Order Multi-Scale Networks. IEEE Trans. Geosci. Remote Sens. 2020, 59, 3473–3485. [Google Scholar] [CrossRef]
- Dong, X.; Xi, Z.; Sun, X.; Gao, L. Transferred multi-perception attention networks for remote sensing image super-resolution. Remote Sens. 2019, 11, 2857. [Google Scholar] [CrossRef] [Green Version]
- Lu, T.; Wang, J.; Zhang, Y.; Wang, Z.; Jiang, J. Satellite image super-resolution via multi-scale residual deep neural network. Remote Sens. 2019, 11, 1588. [Google Scholar] [CrossRef] [Green Version]
- Jiang, K.; Wang, Z.; Yi, P.; Wang, G.; Lu, T.; Jiang, J. Edge-enhanced GAN for remote sensing image superresolution. IEEE Trans. Geosci. Remote Sens. 2019, 57, 5799–5812. [Google Scholar] [CrossRef]
- Lei, S.; Shi, Z.; Zou, Z. Coupled adversarial training for remote sensing image super-resolution. IEEE Trans. Geosci. Remote Sens. 2019, 58, 3633–3643. [Google Scholar] [CrossRef]
- Yang, Y.; Newsam, S. Bag-of-visual-words and spatial extensions for land-use classification. In Proceedings of the 18th SIGSPATIAL International Conference on Advances in gEographic Information Systems, lSan Jose, CA, USA, 2–5 November 2010; pp. 270–279. [Google Scholar]
- Zou, Q.; Ni, L.; Zhang, T.; Wang, Q. Deep learning based feature selection for remote sensing scene classification. IEEE Geosci. Remote Sens. Lett. 2015, 12, 2321–2325. [Google Scholar] [CrossRef]
- Kingma, D.P.; Ba, J. Adam: A method for stochastic optimization. arXiv 2014, arXiv:1412.6980. [Google Scholar]
- He, K.; Zhang, X.; Ren, S.; Sun, J. Delving deep into rectifiers: Surpassing human-level performance on imagenet classification. In Proceedings of the IEEE International Conference on Computer Vision, Santiago, Chile, 11–18 December 2015; pp. 1026–1034. [Google Scholar]
- Paszke, A.; Gross, S.; Chintala, S.; Chanan, G.; Yang, E.; DeVito, Z.; Lin, Z.; Desmaison, A.; Antiga, L.; Lerer, A. Automatic Differentiation in Pytorch. 2017. Available online: https://openreview.net/forum?id=BJJsrmfCZ (accessed on 28 October 2017).


Publisher’s Note: MDPI stays neutral with regard to jurisdictional claims in published maps and institutional affiliations. |
© 2021 by the authors. Licensee MDPI, Basel, Switzerland. This article is an open access article distributed under the terms and conditions of the Creative Commons Attribution (CC BY) license (https://creativecommons.org/licenses/by/4.0/).