
Aerosol Direct Radiative Effects under Cloud-Free Conditions over Highly-Polluted Areas in Europe and Mediterranean: A Ten-Years Analysis (2007–2016)

 , , ,
, , ,  and
and 
Abstract
:
1. Introduction
2. Materials and Methods
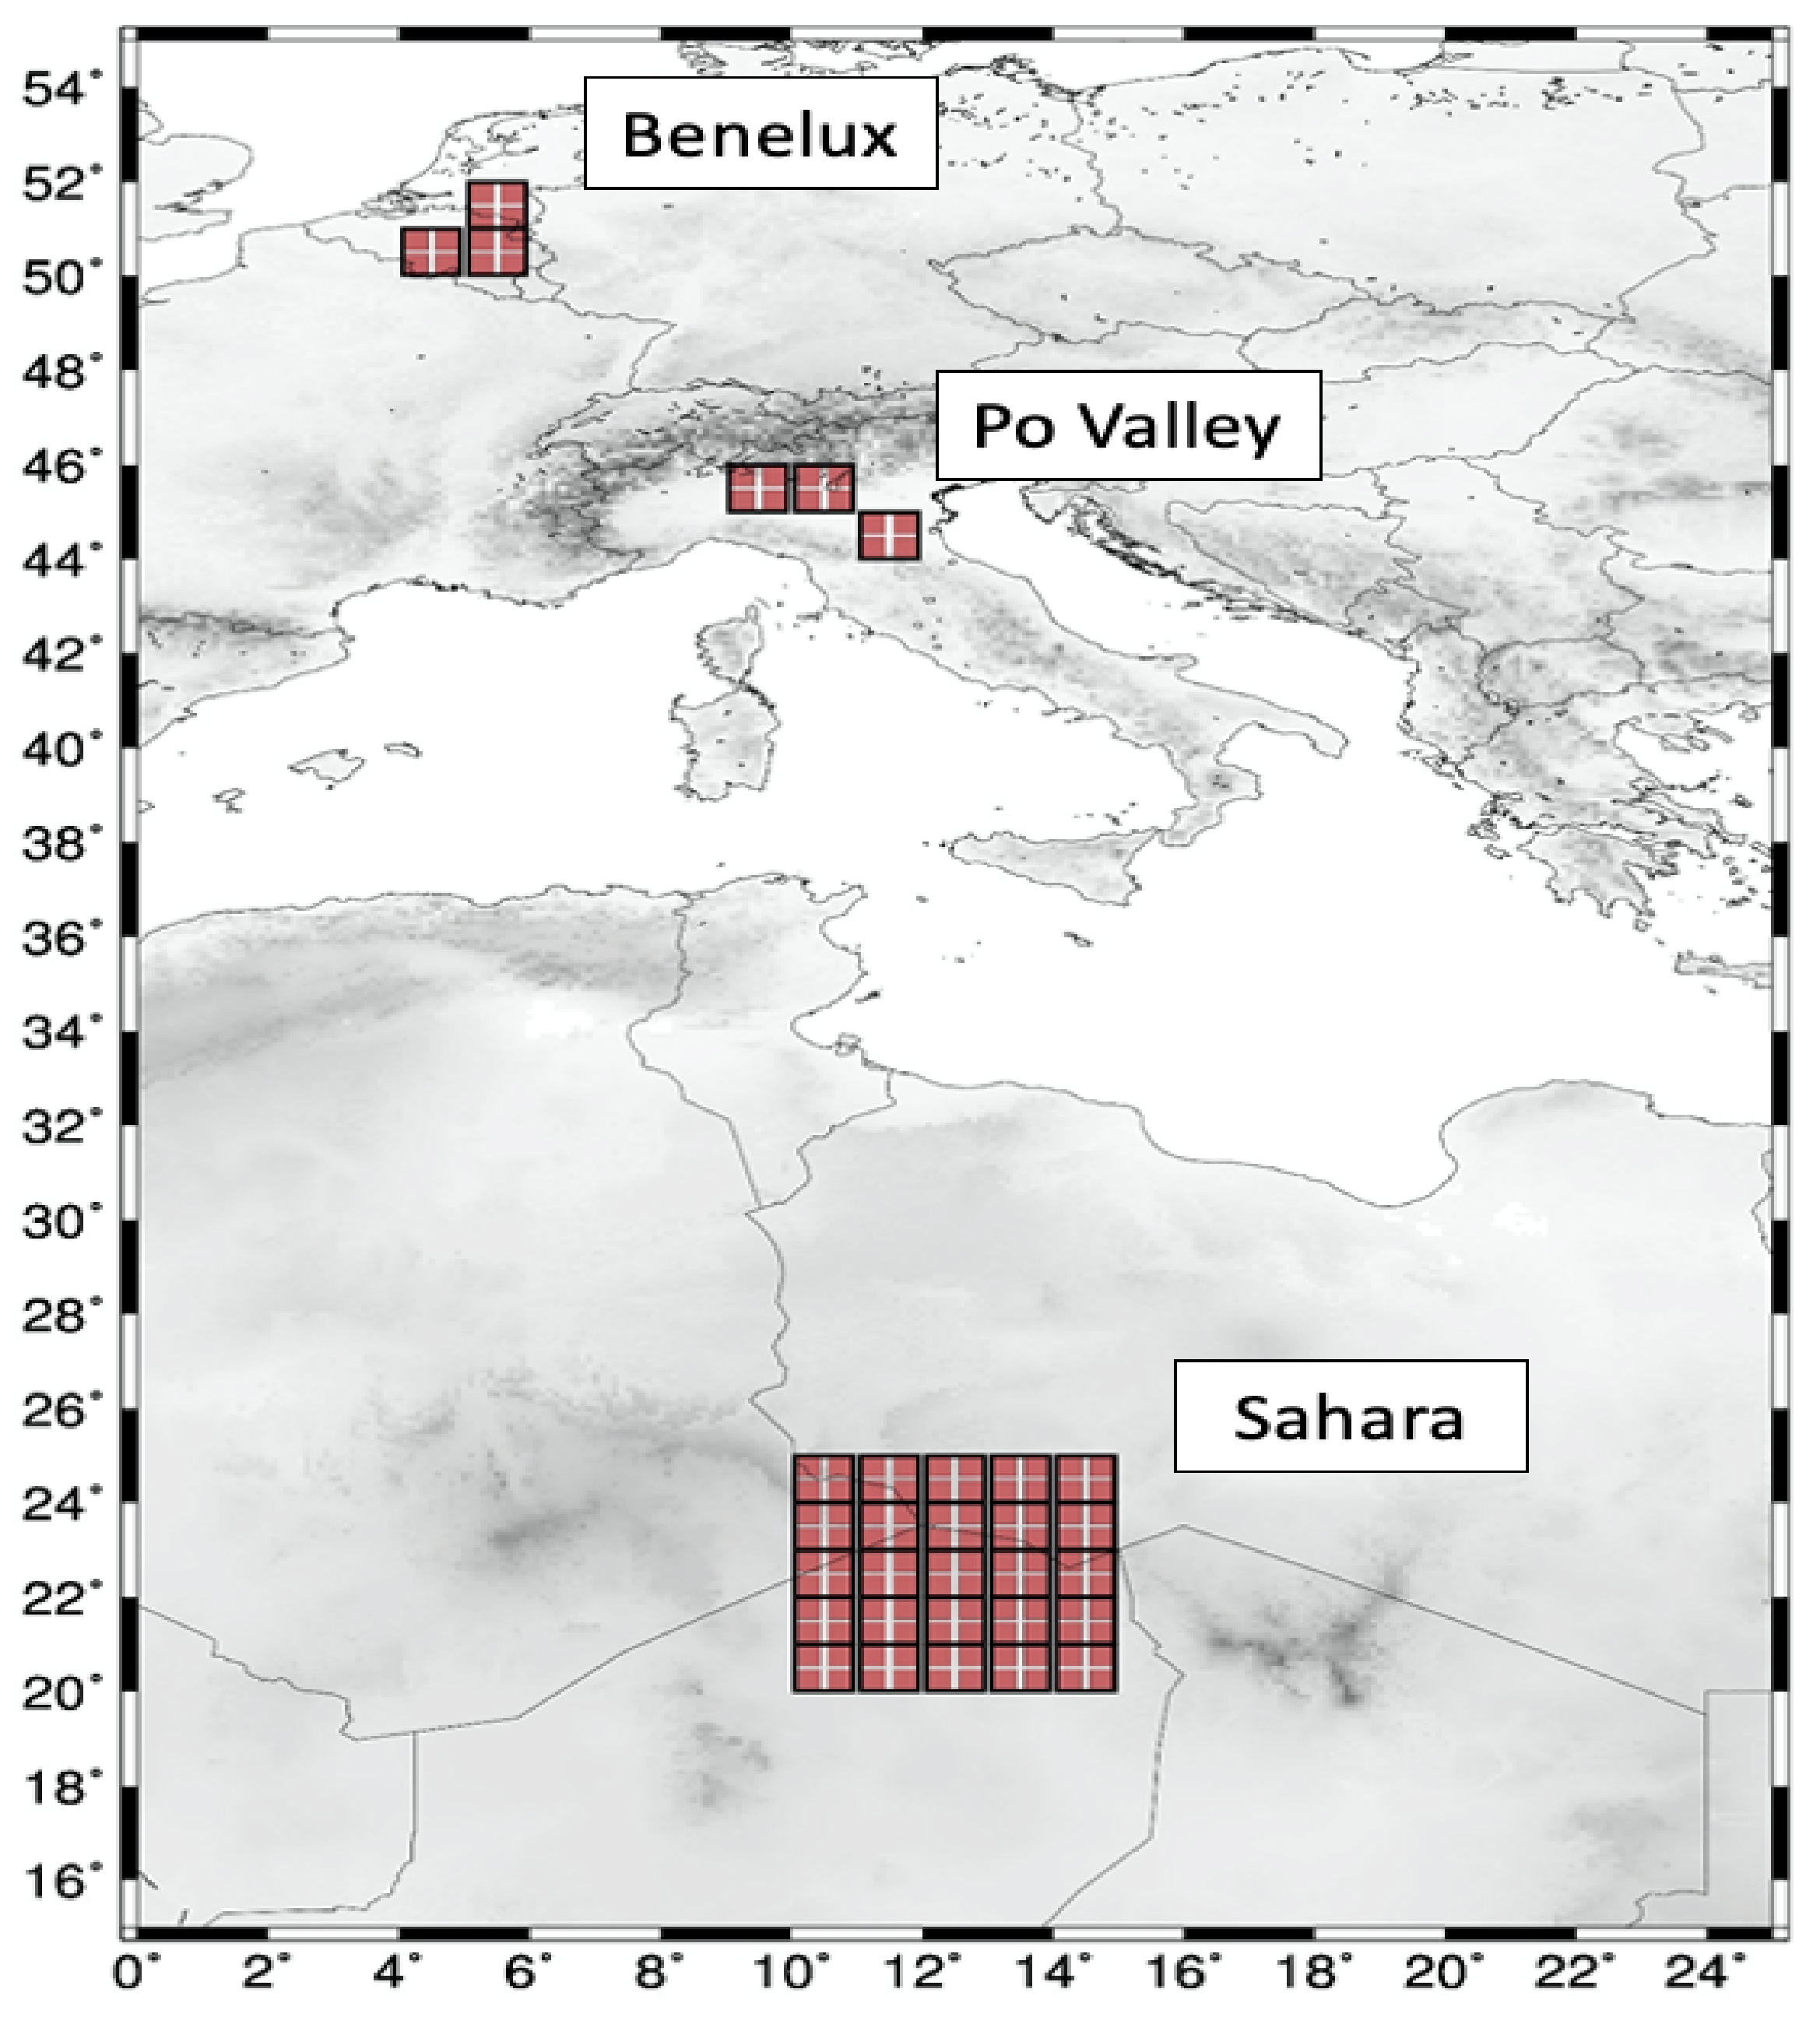
2.1. Regions of Interest
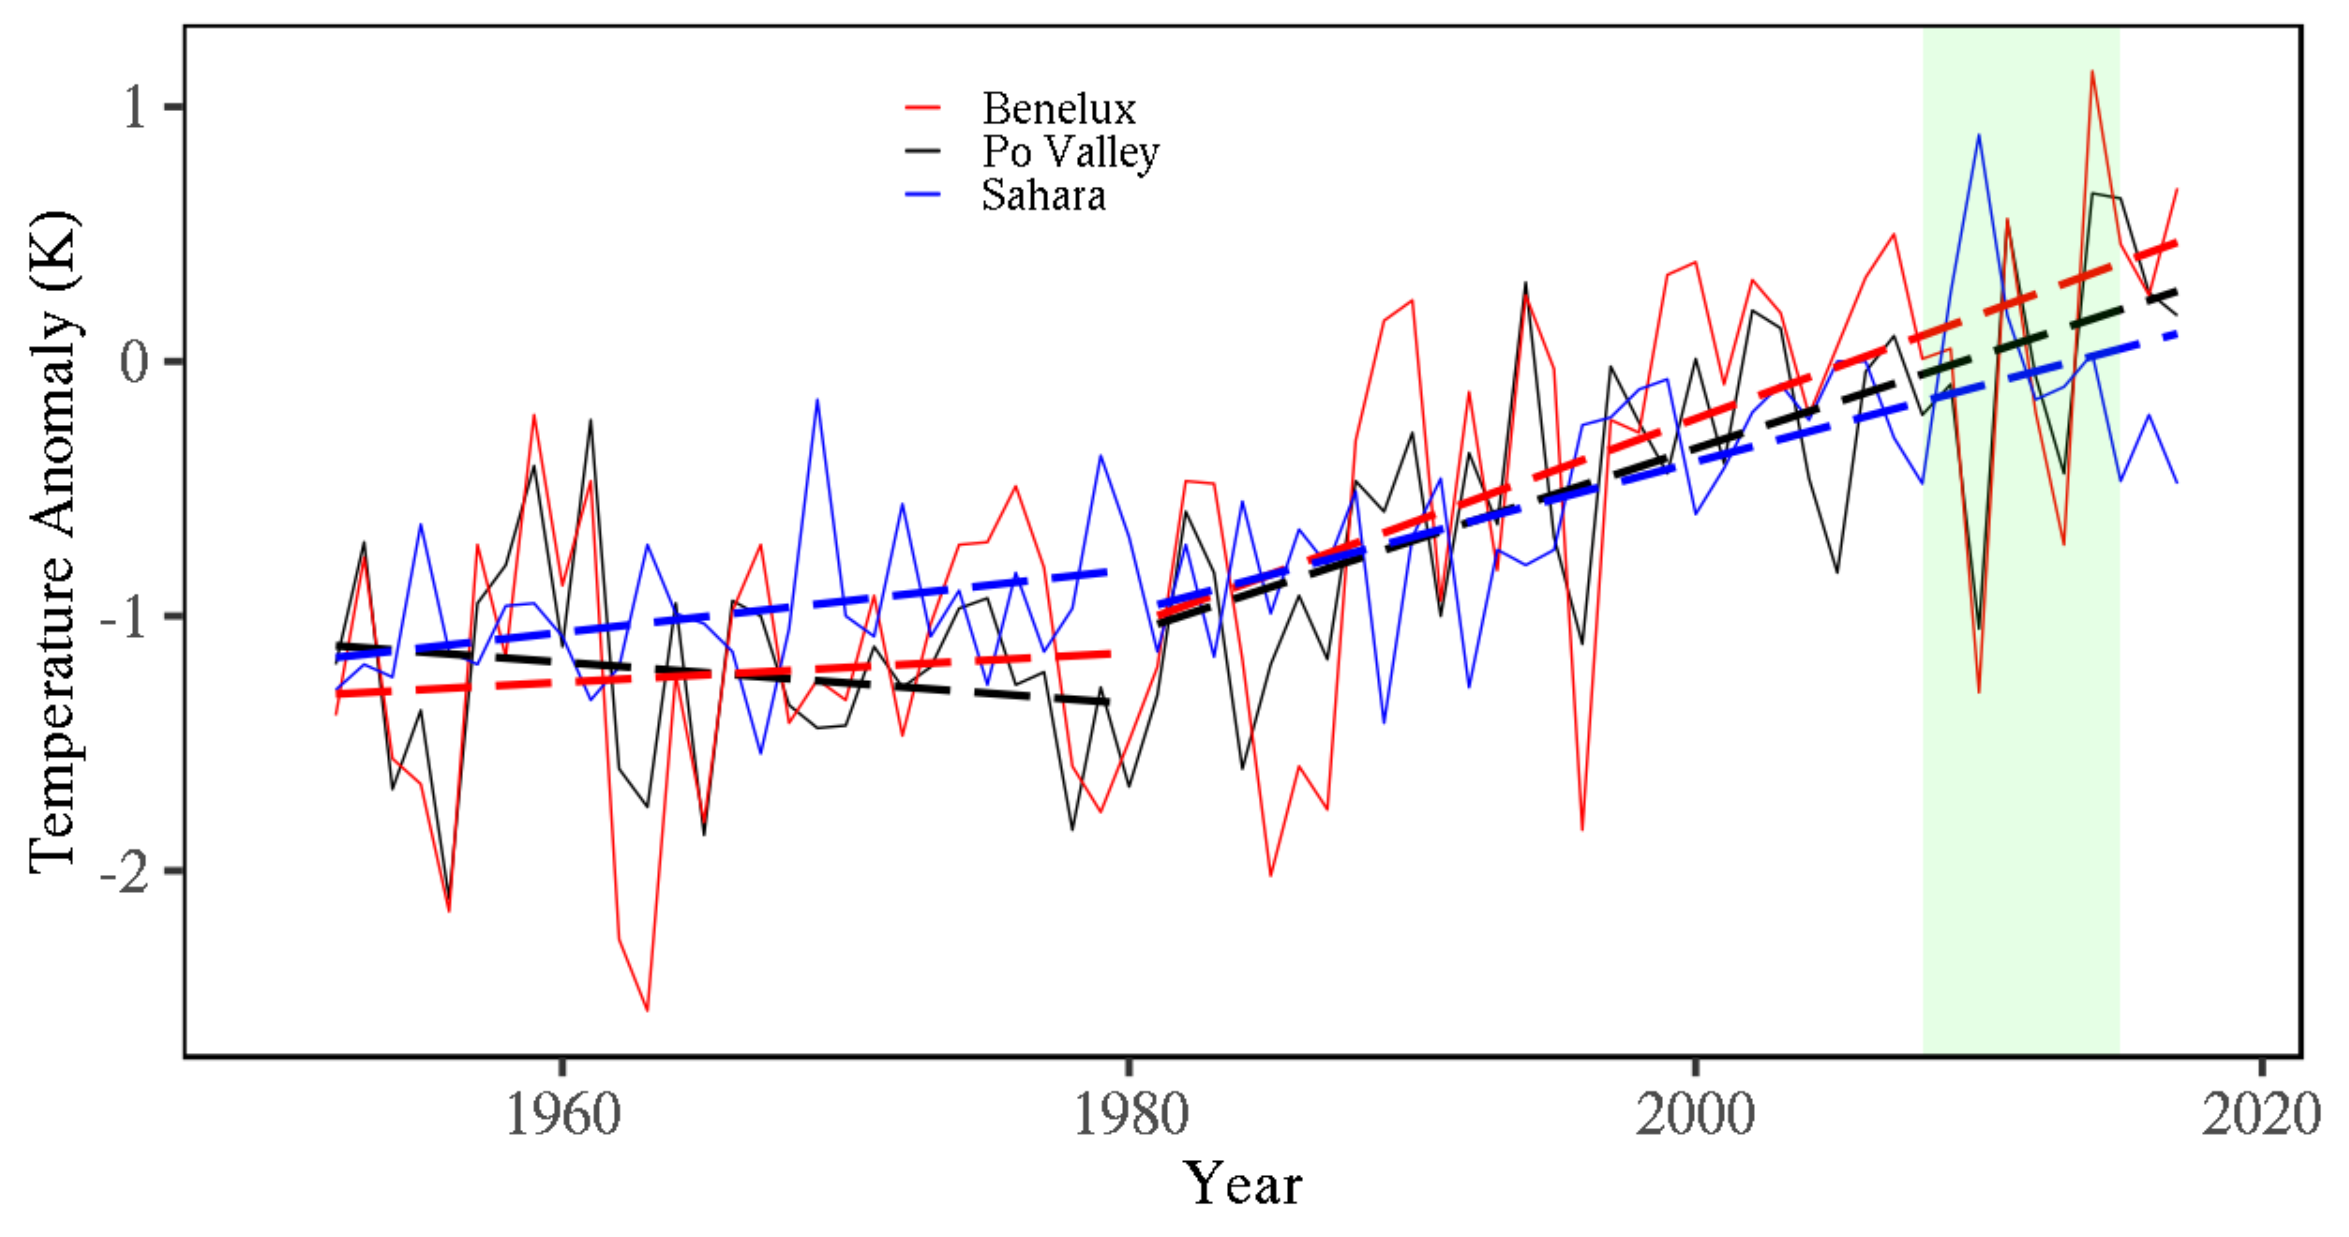
2.2. Surface Air Temperature: Trend Calculation
2.3. Aerosol Optical Depth: CALIPSO and AERONET Measurements
2.4. The Fu-Liou-Gu Radiative Transfer Model
3. Results and Discussion
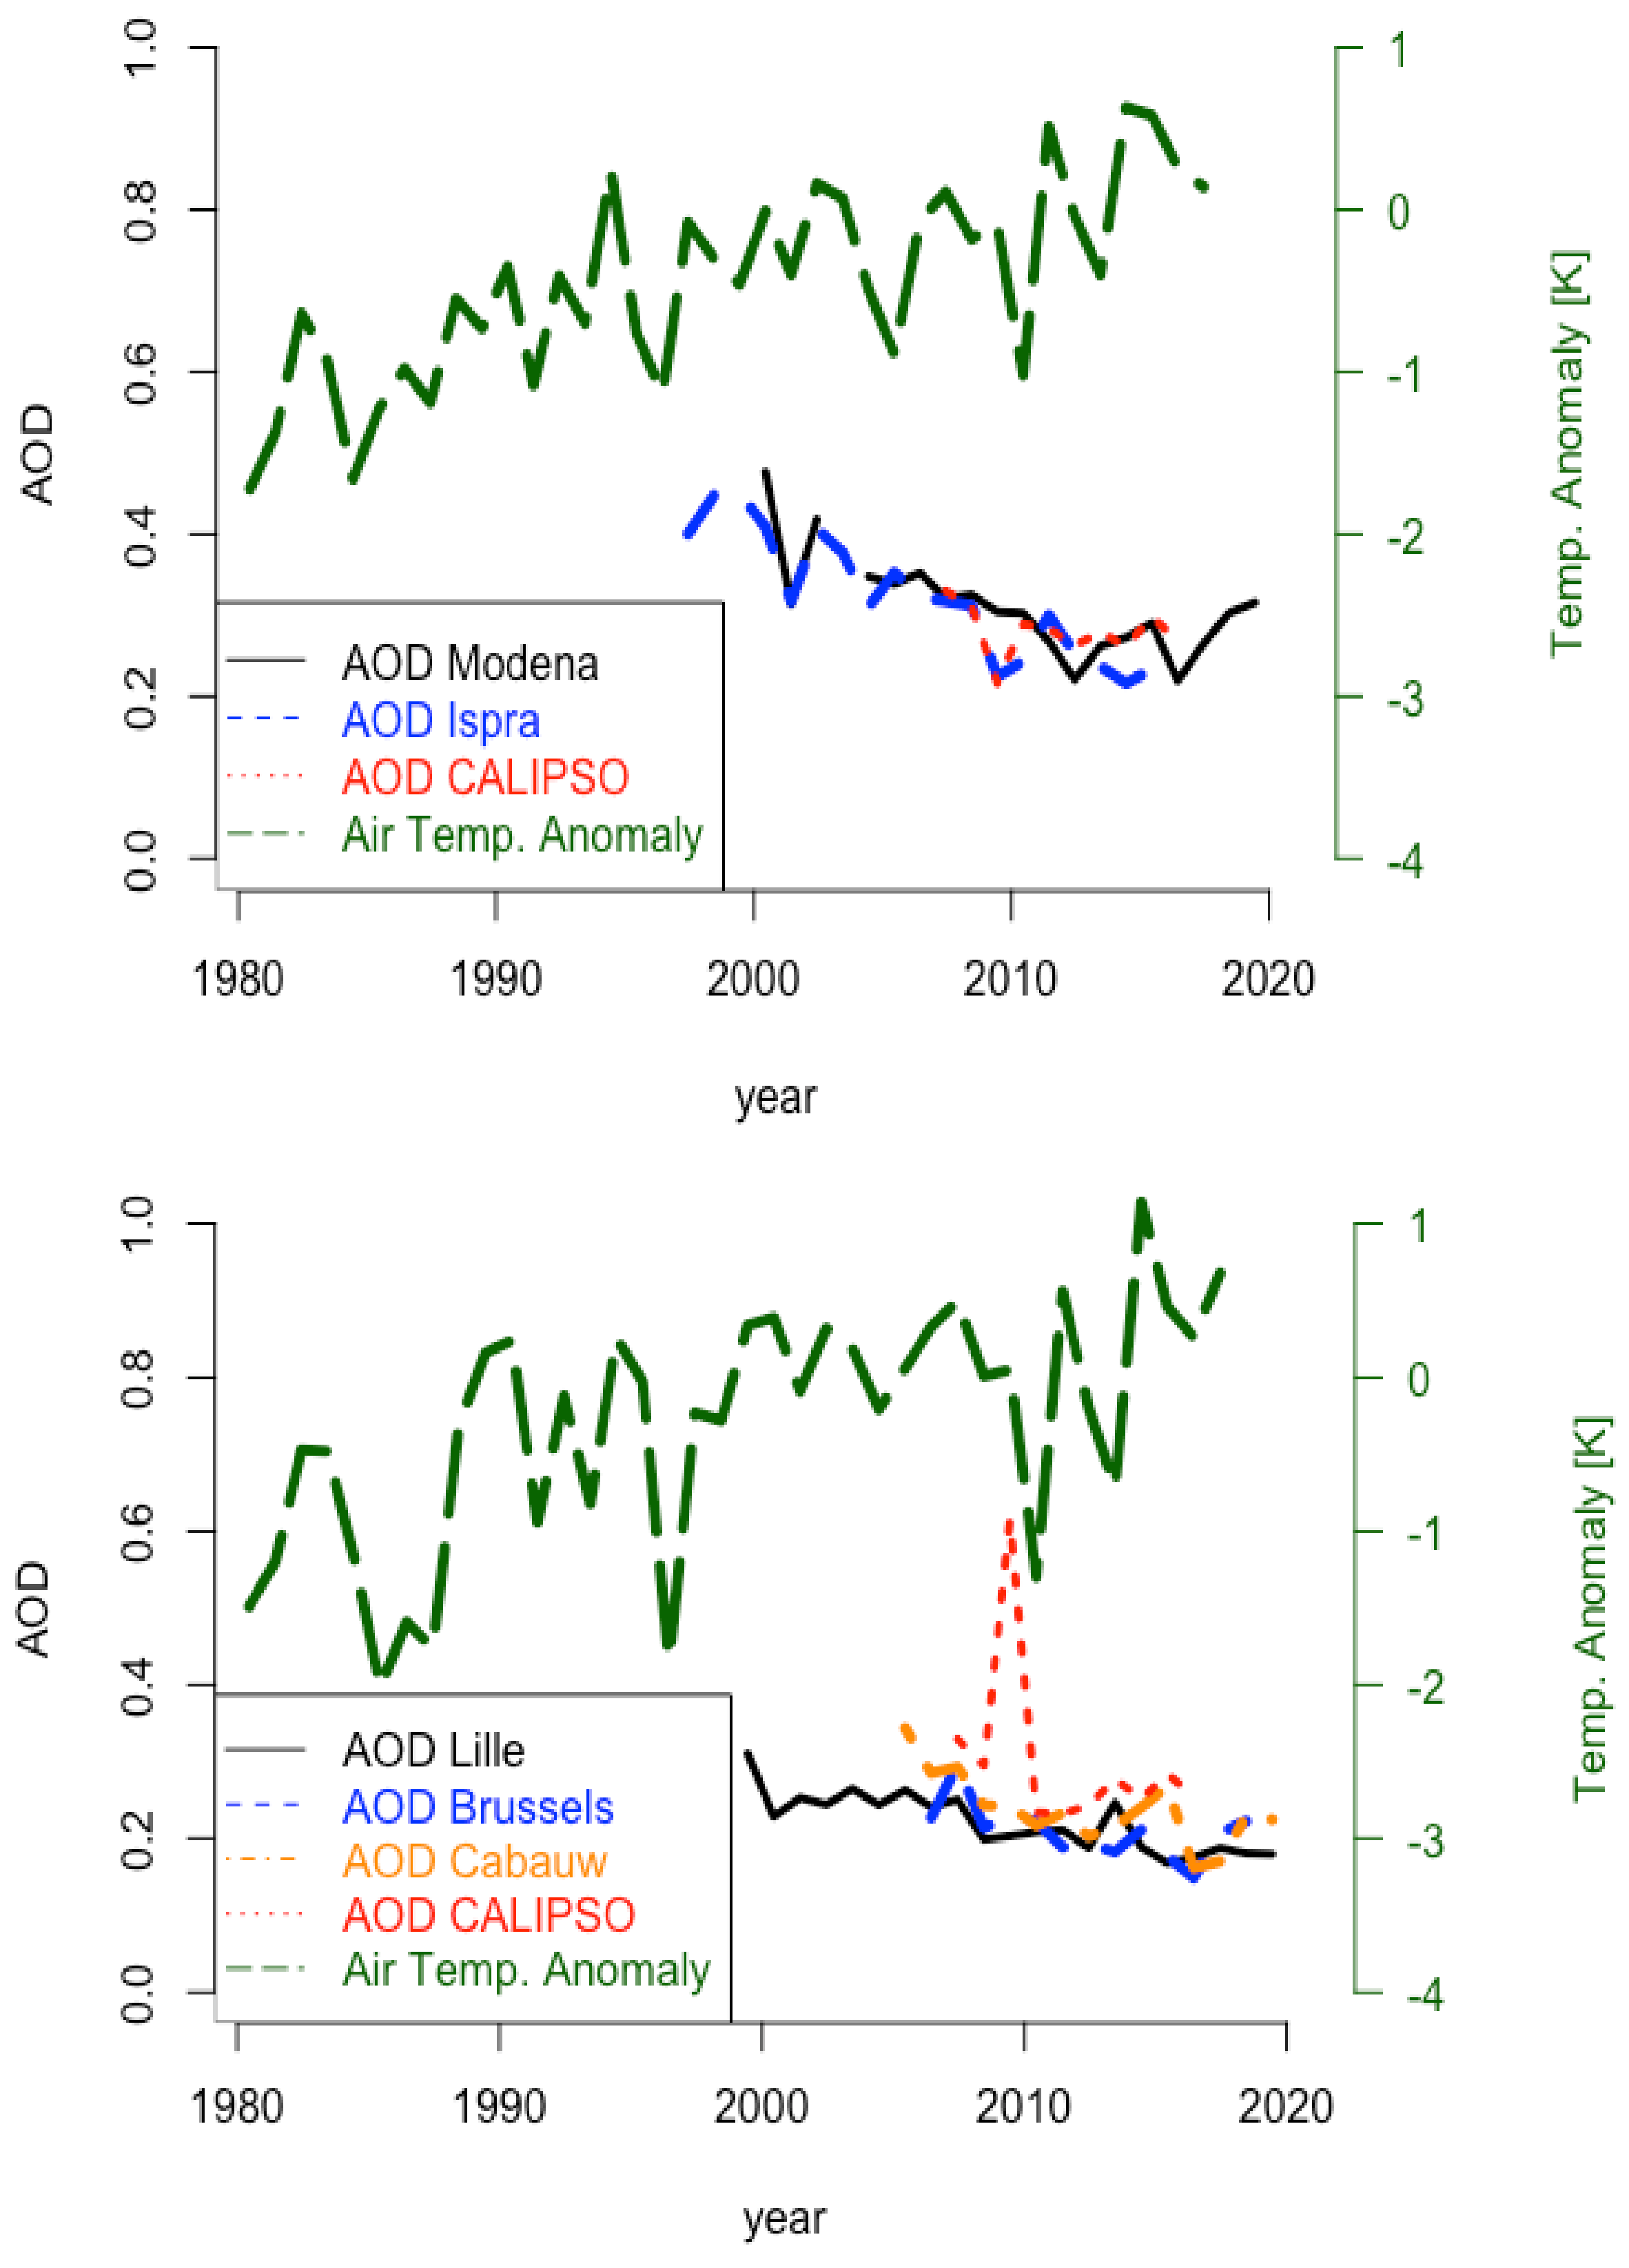
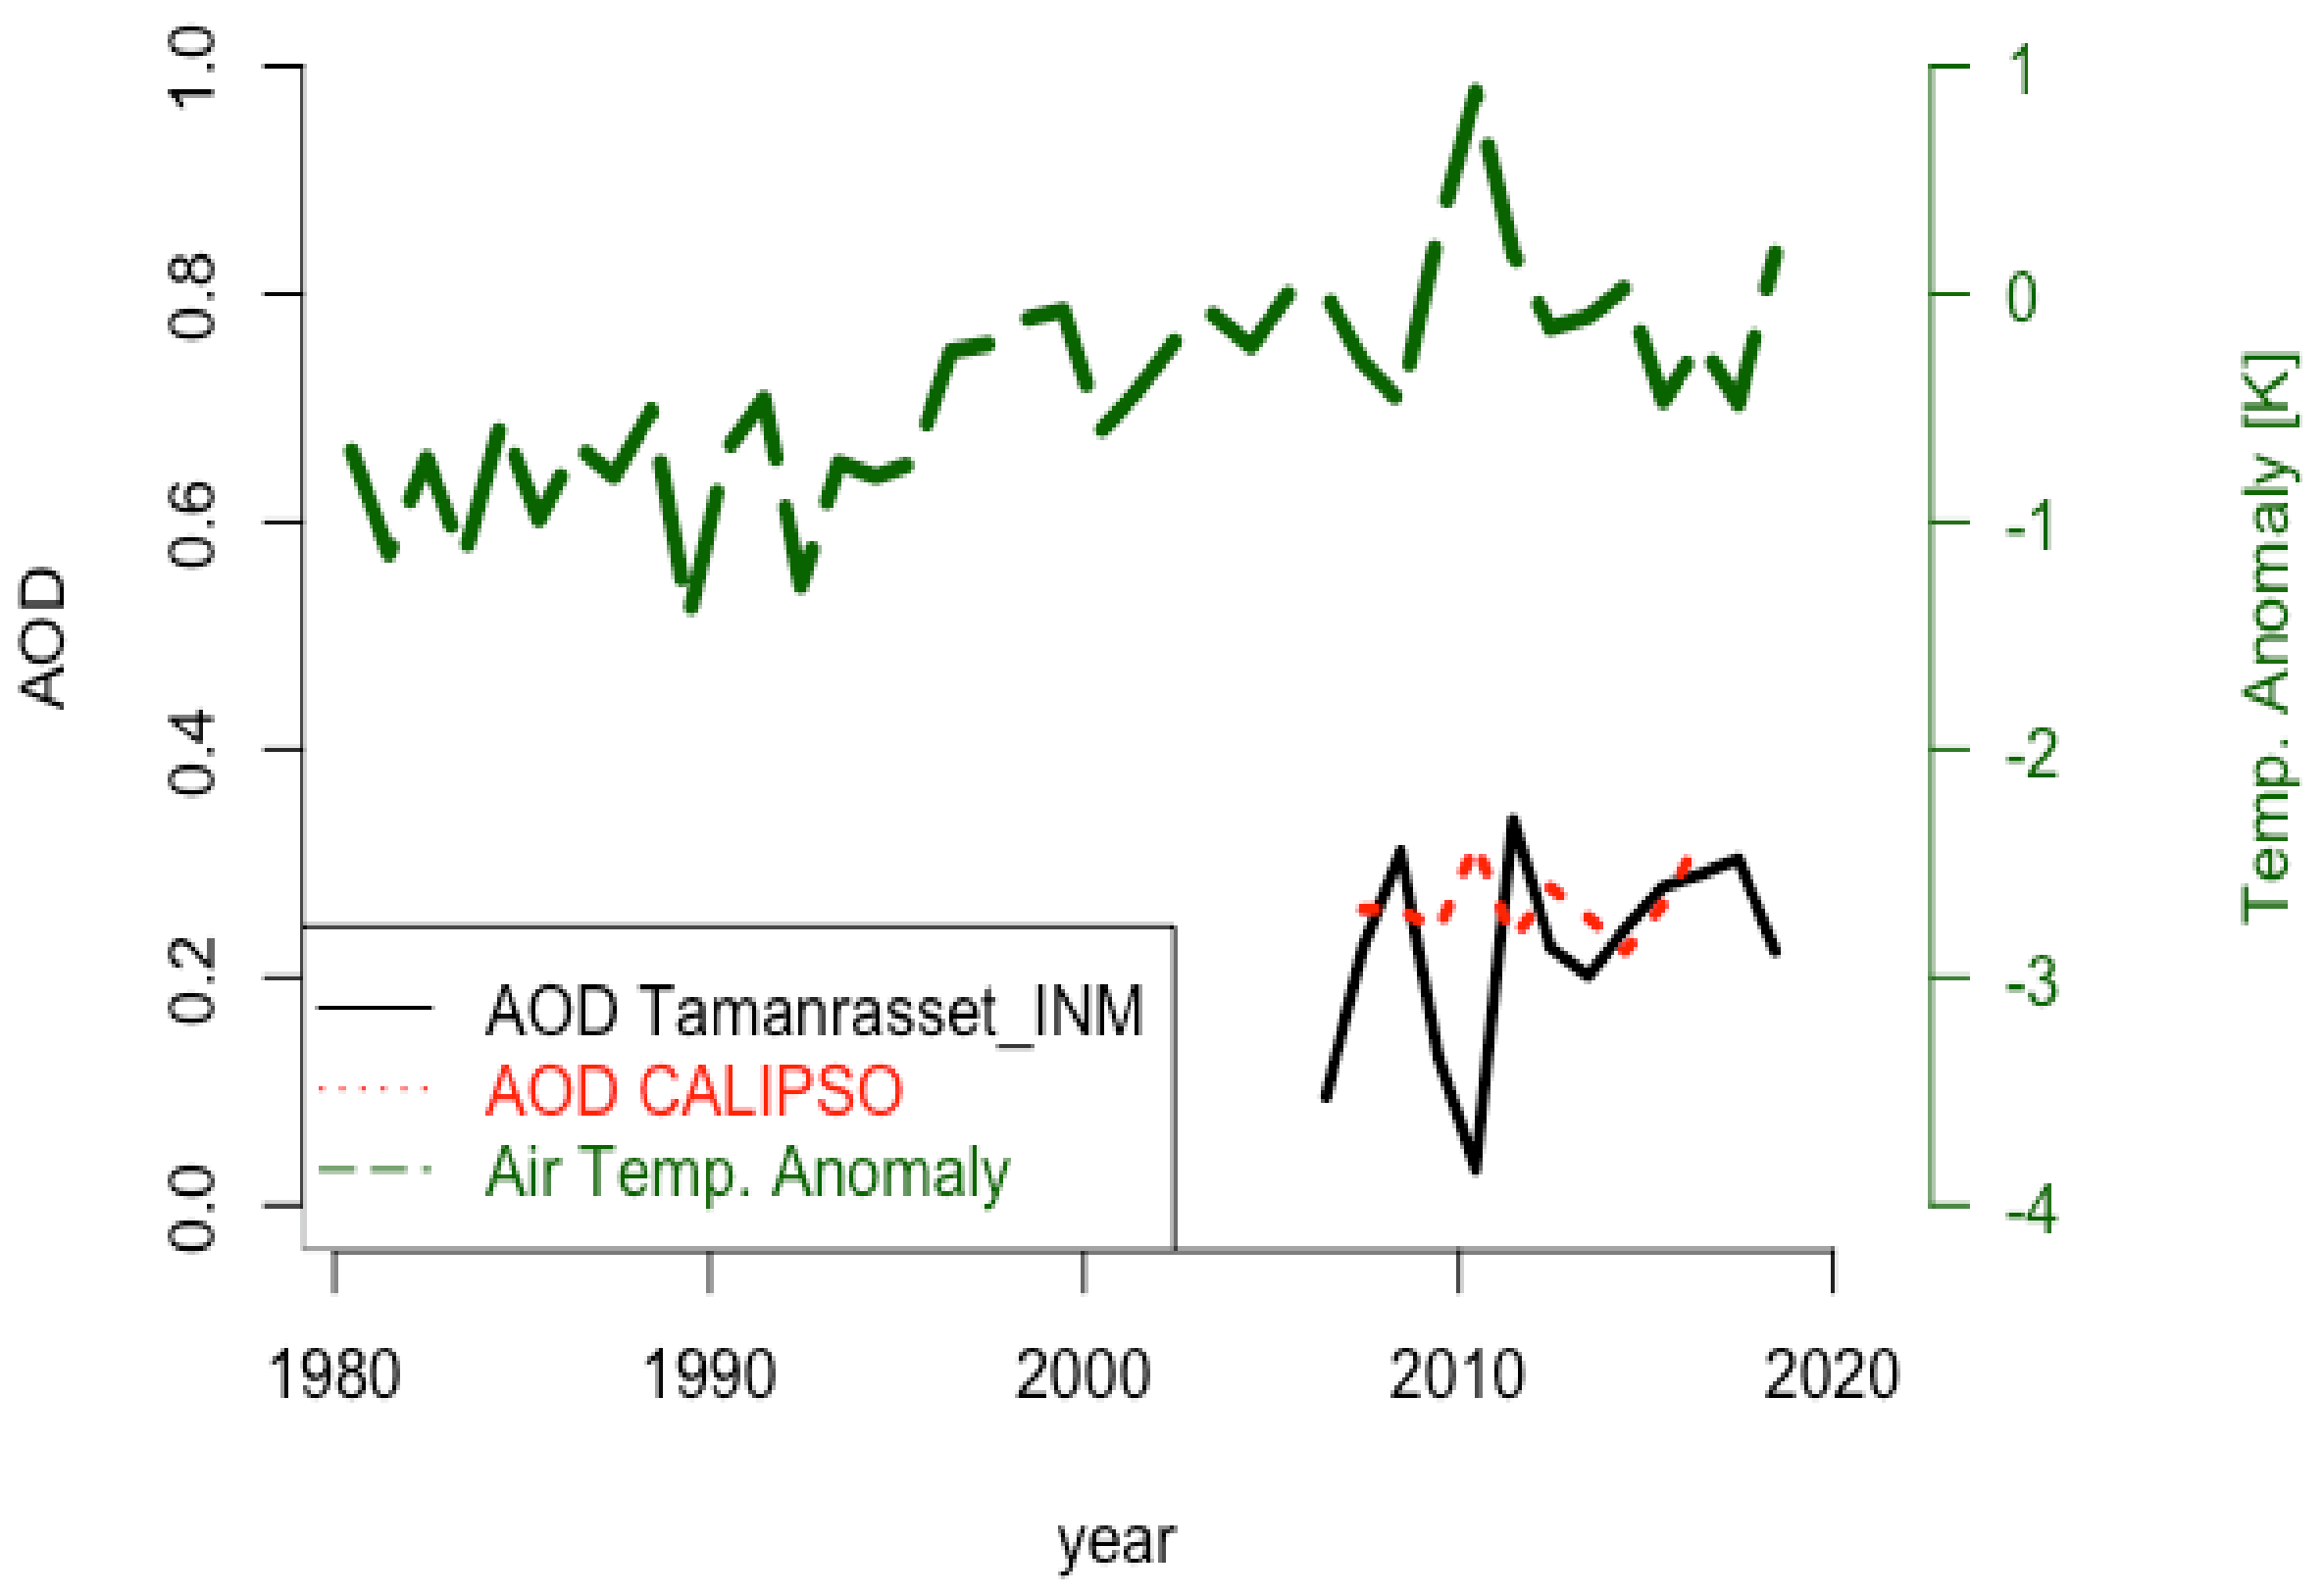
Correlations between the Atmospheric Turbidity and Surface Air Temperature
4. Conclusions
Author Contributions
Funding
Institutional Review Board Statement
Informed Consent Statement
Data Availability Statement
Acknowledgments
Conflicts of Interest
References
- Nicholls, R.J.; Wong, P.P.; Burkett, V.; Woodroffe, C.D.; Hay, J. Climate change and coastal vulnerability assessment: Scenarios for integrated assessment. Sustain. Sci. 2008, 3, 89–102. [Google Scholar] [CrossRef]
- Lewis, S.C.; King, A.D.; Perkins-Kirkpatrick, S.E.; Mitchell, D.M. Regional hotspots of temperature extremes under 1.5 ∘C and 2 ∘C of global mean warming. Weather. Clim. Extrem. 2019, 26, 100233. [Google Scholar] [CrossRef]
- Spiegl, T.; Langematz, U. Twenty-First-Century Climate Change Hot Spots in the Light of a Weakening Sun. J. Clim. 2020, 33, 3431–3447. [Google Scholar] [CrossRef]
- Guiot, J.; Cramer, W. Climate change: The 2015 Paris Agreement thresholds and Mediterranean basin ecosystems. Science 2016, 354, 465–468. [Google Scholar] [CrossRef]
- Mueller, D.; Uibel, S.; Takemura, M.; Klingelhoefer, D.; Groneberg, D.A. Ships, ports and particulate air pollution—An analysis of recent studies. J. Occup. Med. Toxicol. 2011, 6, 1–6. [Google Scholar] [CrossRef] [Green Version]
- Harrison, P.A.; Butterfield, R.E.; Orr, J.L. Modelling climate change impacts on wheat, potato and grapevine in Europe. In Climate Change, Climatic Variability and Agriculture in Europe; Environmental Change Unit, University of Oxford: Oxford, UK, 2000; pp. 367–390. [Google Scholar]
- Hinkel, J.; Nicholls, R.J.; Vafeidis, A.T.; Tol, R.S.; Avagianou, T. Assessing risk of and adaptation to sea-level rise in the European Union: An application of DIVA. Mitig. Adapt. Strateg. Glob. Chang. 2010, 15, 703–719. [Google Scholar] [CrossRef] [Green Version]
- Bilal, M.; Nazeer, M.; Nichol, J.; Qiu, Z.; Wang, L.; Bleiweiss, M.P.; Shen, X.; Campbell, J.R.; Lolli, S. Evaluation of Terra-MODIS C6 and C6. 1 aerosol products against Beijing, XiangHe, and Xinglong AERONET sites in China during 2004–2014. Remote Sens. 2019, 11, 486. [Google Scholar] [CrossRef] [Green Version]
- Crosier, J.; Allan, J.; Coe, H.; Bower, K.; Formenti, P.; Williams, P. Chemical composition of summertime aerosol in the Po Valley (Italy), northern Adriatic and Black Sea. Q. J. R. Meteorol. Soc. 2007, 133, 61–75. [Google Scholar] [CrossRef]
- Stanhill, G. A perspective on global warming, dimming, and brightening. Eos Trans. Am. Geophys. Union 2007, 88, 58. [Google Scholar] [CrossRef]
- Perrino, C.; Catrambone, M.; Dalla Torre, S.; Rantica, E.; Sargolini, T.; Canepari, S. Seasonal variations in the chemical composition of particulate matter: A case study in the Po Valley. Part I: Macro-components and mass closure. Environ. Sci. Pollut. Res. 2014, 21, 3999–4009. [Google Scholar] [CrossRef] [PubMed]
- Bilal, M.; Nazeer, M.; Nichol, J.E.; Bleiweiss, M.P.; Qiu, Z.; Jäkel, E.; Campbell, J.R.; Atique, L.; Huang, X.; Lolli, S. A simplified and robust surface reflectance estimation method (SREM) for use over diverse land surfaces using multi-sensor data. Remote Sens. 2019, 11, 1344. [Google Scholar] [CrossRef] [Green Version]
- Menon, S.; Hansen, J.; Nazarenko, L.; Luo, Y. Climate effects of black carbon aerosols in China and India. Science 2002, 297, 2250–2253. [Google Scholar] [CrossRef] [PubMed] [Green Version]
- Wild, M. Global dimming and brightening: A review. J. Geophys. Res. Atmos. 2009, 114. [Google Scholar] [CrossRef] [Green Version]
- Sanchez-Lorenzo, A.; Wild, M.; Brunetti, M.; Guijarro, J.A.; Hakuba, M.Z.; Calbó, J.; Mystakidis, S.; Bartok, B. Reassessment and update of long-term trends in downward surface shortwave radiation over Europe (1939–2012). J. Geophys. Res. Atmos. 2015, 120, 9555–9569. [Google Scholar] [CrossRef] [Green Version]
- Mateos, D.; Sanchez-Lorenzo, A.; Antón, M.; Cachorro, V.E.; Calbó, J.; Costa, M.J.; Torres, B.; Wild, M. Quantifying the respective roles of aerosols and clouds in the strong brightening since the early 2000s over the Iberian Peninsula. J. Geophys. Res. Atmos. 2014, 119, 10–382. [Google Scholar] [CrossRef] [Green Version]
- Stocker, T.F.; Qin, D.; Plattner, G.-K.; Tignor, M.; Allen, S.K.; Boschung, J.; Nauels, A.; Xia, Y.; Bex, V.; Midgley, P.M. (Eds.) IPCC: Climate Change 2013: The Physical Science Basis. Contribution of Working Group I to the Fifth Assessment Report of the Intergovernmental Panel on Climate Change; Cambridge University Press: Cambridge, UK; New York, NY, USA, 2013; p. 1535. [Google Scholar]
- Vivone, G.; D’Amico, G.; Summa, D.; Lolli, S.; Amodeo, A.; Bortoli, D.; Pappalardo, G. Atmospheric boundary layer height estimation from aerosol lidar: A new approach based on morphological image processing techniques. Atmos. Chem. Phys. 2021, 21, 4249–4265. [Google Scholar] [CrossRef]
- Lolli, S.; Khor, W.Y.; Matjafri, M.Z.; Lim, H.S. Monsoon Season Quantitative Assessment of Biomass Burning Clear-Sky Aerosol Radiative Effect at Surface by Ground-Based Lidar Observations in Pulau Pinang, Malaysia in 2014. Remote Sens. 2019, 11, 2660. [Google Scholar] [CrossRef] [Green Version]
- Zheng, Y.; Che, H.; Xia, X.; Wang, Y.; Wang, H.; Wu, Y.; Tao, J.; Zhao, H.; An, L.; Li, L.; et al. Five-year observation of aerosol optical properties and its radiative effects to planetary boundary layer during air pollution episodes in North China: Intercomparison of a plain site and a mountainous site in Beijing. Sci. Total. Environ. 2019, 674, 140–158. [Google Scholar] [CrossRef]
- Granados-Muñoz, M.J.; Sicard, M.; Román, R.; Benavent-Oltra, J.A.; Barragán, R.; Brogniez, G.; Denjean, C.; Mallet, M.; Formenti, P.; Torres, B.; et al. Impact of mineral dust on shortwave and longwave radiation: Evaluation of different vertically resolved parameterizations in 1-D radiative transfer computations. Atmos. Chem. Phys. 2019, 19, 523–542. [Google Scholar] [CrossRef] [Green Version]
- Kinne, S. Aerosol radiative effects with MACv2. Atmos. Chem. Phys. 2019. [Google Scholar] [CrossRef] [Green Version]
- Norris, J.R.; Wild, M. Trends in aerosol radiative effects over Europe inferred from observed cloud cover, solar “dimming,” and solar “brightening”. J. Geophys. Res. Atmos. 2007, 112. [Google Scholar] [CrossRef] [Green Version]
- Gettelman, A.; Shindell, D.; Lamarque, J. Impact of aerosol radiative effects on 2000–2010 surface temperatures. Clim. Dyn. 2015, 45, 2165–2179. [Google Scholar] [CrossRef]
- Fu, Q.; Liou, K.N. On the correlated k-distribution method for radiative transfer in nonhomogeneous atmospheres. J. Atmos. Sci 1992, 49, 2139–2156. [Google Scholar] [CrossRef] [Green Version]
- Fu, Q.; Liou, K.N. Parameterization of the Radiative Properties of Cirrus Clouds. J. Atmos. Sci. 1993, 50, 2008–2025. [Google Scholar] [CrossRef] [Green Version]
- Lolli, S.; Campbell, J.R.; Lewis, J.R.; Gu, Y.; Welton, E.J. Fu–Liou–Gu and Corti–Peter model performance evaluation for radiative retrievals from cirrus clouds. Atmos. Chem. Phys. 2017, 17, 7025–7034. [Google Scholar] [CrossRef] [Green Version]
- European Environment Agency. Air Quality in Europe—2018 Report. EEA Report 12/2018. 2018. Available online: https://www.eea.europa.eu/publications/air-quality-in-europe-2018 (accessed on 25 July 2021).
- Todd, M.C.; Washington, R.; Martins, J.V.; Dubovik, O.; Lizcano, G.; M’bainayel, S.; Engelstaedter, S. Mineral dust emission from the Bodélé Depression, northern Chad, during BoDEx 2005. J. Geophys. Res. Atmos. 2007, 112. [Google Scholar] [CrossRef]
- Harris, I.; Jones, P.D.; Osborn, T.J.; Lister, D.H. Version 4 of the CRU TS Monthly High-Resolution Gridded Multivariate Climate Dataset; Nature Publishing Group: London, UK, 2020; Volume 7, pp. 1–18. [Google Scholar]
- Sen, P.K. Estimates of the regression coefficient based on Kendall’s tau. J. Am. Stat. Assoc. 1968, 63, 1379–1389. [Google Scholar] [CrossRef]
- Theil, H. A rank-invariant method of linear and polynomial regression analysis, 3; confidence regions for the parameters of polynomial regression equations. Indag. Math. 1950, 1, 467–482. [Google Scholar]
- Sneyers, R. On the use of statistical analysis for the objective determination of climate change. Meteorol. Z. 1992, 1, 247–256. [Google Scholar] [CrossRef]
- Campbell, J.; Tackett, J.; Reid, J.; Zhang, J.; Curtis, C.; Hyer, E.; Sessions, W.; Westphal, D.; Prospero, J.; Welton, E.; et al. Evaluating nighttime CALIOP 0.532 μm aerosol optical depth and extinction coefficient retrievals. Atmos. Meas. Tech. 2012, 5, 2143–2160. [Google Scholar] [CrossRef] [Green Version]
- Winker, D.; Tackett, J.; Getzewich, B.; Liu, Z.; Vaughan, M.; Rogers, R. The global 3-D distribution of tropospheric aerosols as characterized by CALIOP. Atmos. Chem. Phys. 2013, 13, 3345–3361. [Google Scholar] [CrossRef] [Green Version]
- Toth, T.D.; Campbell, J.R.; Reid, J.S.; Tackett, J.L.; Vaughan, M.A.; Zhang, J.; Marquis, J.W. Minimum aerosol layer detection sensitivities and their subsequent impacts on aerosol optical thickness retrievals in CALIPSO level 2 data products. Atmos. Meas. Tech. 2018, 11, 499–514. [Google Scholar] [CrossRef] [PubMed] [Green Version]
- Lolli, S.; Alparone, L.; Garzelli, A.; Vivone, G. Haze Correction for Contrast-Based Multispectral Pansharpening. IEEE Geosci. Remote Sens. Lett. 2017, 14, 2255–2259. [Google Scholar] [CrossRef]
- Holben, B.N.; Eck, T.F.; Slutsker, I.; Tanre, D.; Buis, J.; Setzer, A.; Vermote, E.; Reagan, J.A.; Kaufman, Y.; Nakajima, T.; et al. AERONET—A federated instrument network and data archive for aerosol characterization. Remote Sens. Environ. 1998, 66, 1–16. [Google Scholar] [CrossRef]
- Gu, Y.; Farrara, J.; Liou, K.; Mechoso, C. Parameterization of cloud–radiation processes in the UCLA general circulation model. J. Clim. 2003, 16, 3357–3370. [Google Scholar] [CrossRef]
- Gu, Y.; Liou, K.; Ou, S.; Fovell, R. Cirrus cloud simulations using WRF with improved radiation parameterization and increased vertical resolution. J. Geophys. Res. Atmos. 2011, 116. [Google Scholar] [CrossRef]
- Tosca, M.G.; Campbell, J.; Garay, M.; Lolli, S.; Seidel, F.C.; Marquis, J.; Kalashnikova, O. Attributing accelerated summertime warming in the southeast united states to recent reductions in aerosol burden: Indications from vertically-resolved observations. Remote Sens. 2017, 9, 674. [Google Scholar] [CrossRef] [Green Version]
- Hess, M.; Koepke, P.; Schult, I. Optical properties of aerosols and clouds: The software package OPAC. Bull. Am. Meteorol. Soc. 1998, 79, 831–844. [Google Scholar] [CrossRef]
- Lolli, S.; Campbell, J.R.; Lewis, J.R.; Gu, Y.; Marquis, J.W.; Chew, B.N.; Liew, S.C.; Salinas, S.V.; Welton, E.J. Daytime Top-of-the-Atmosphere Cirrus Cloud Radiative Forcing Properties at Singapore. J. Appl. Meteorol. Climatol. 2017, 56, 1249–1257. [Google Scholar] [CrossRef] [Green Version]
- Strahler, A.H.; Muller, J.; Lucht, W.; Schaaf, C.; Tsang, T.; Gao, F.; Li, X.; Lewis, P.; Barnsley, M.J. MODIS BRDF/albedo product: Algorithm theoretical basis document version 5.0. Modis Doc. 1999, 23, 42–47. [Google Scholar]
- Lolli, S.; Di Girolamo, P. Principal component analysis approach to evaluate instrument performances in developing a cost-effective reliable instrument network for atmospheric measurements. J. Atmos. Ocean. Technol. 2015, 32, 1642–1649. [Google Scholar] [CrossRef]
- Kim, M.H.; Omar, A.H.; Tackett, J.L.; Vaughan, M.A.; Winker, D.M.; Trepte, C.R.; Hu, Y.; Liu, Z.; Poole, L.R.; Pitts, M.C.; et al. The CALIPSO version 4 automated aerosol classification and lidar ratio selection algorithm. Atmos. Meas. Tech. 2018, 11, 6107–6135. [Google Scholar] [CrossRef] [Green Version]
- Toth, T.D.; Zhang, J.; Campbell, J.R.; Reid, J.S.; Vaughan, M.A. Temporal variability of aerosol optical thickness vertical distribution observed from CALIOP. J. Geophys. Res. Atmos. 2016, 121, 9117–9139. [Google Scholar] [CrossRef] [Green Version]
- Mukherjee, A.; Agrawal, M. World air particulate matter: Sources, distribution and health effects. Environ. Chem. Lett. 2017, 15, 283–309. [Google Scholar] [CrossRef]
- Johnson, B.; Shine, K.; Forster, P. The semi-direct aerosol effect: Impact of absorbing aerosols on marine stratocumulus. Q. J. R. Meteorol. Soc. 2004, 130, 1407–1422. [Google Scholar] [CrossRef] [Green Version]
- Sand, M.; Berntsen, T.K.; Ekman, A.M.; Hansson, H.C.; Lewinschal, A. Surface temperature response to regional black carbon emissions: Do location and magnitude matter? Atmos. Chem. Phys. 2020, 20, 3079–3089. [Google Scholar] [CrossRef] [Green Version]
- Duchi, R.; Cristofanelli, P.; Landi, T.C.; Arduini, J.; Bonafe, U.; Bourcier, L.; Busetto, M.; Calzolari, F.; Marinoni, A.; Putero, D.; et al. Long-term (2002–2012) investigation of Saharan dust transport events at Mt. Cimone GAW global station, Italy (2165 m asl) Long-term investigation of Saharan dust transport events at Mt. Cimone. ELementa Sci. Anthr. 2016, 4, 85. [Google Scholar] [CrossRef]
- Pey, J.; Querol, X.; Alastuey, A.; Forastiere, F.; Stafoggia, M. African dust outbreaks over the Mediterranean Basin during 2001–2011: PM10 concentrations, phenomenology and trends, and its relation with synoptic and mesoscale meteorology. Atmos. Chem. Phys. 2013, 13, 1395. [Google Scholar] [CrossRef] [Green Version]
- Mehta, M.; Singh, R.; Singh, A.; Singh, N.; Anshumali. Recent global aerosol optical depth variations and trends—A comparative study using MODIS and MISR level 3 datasets. Remote Sens. Environ. 2016, 181, 137–150. [Google Scholar] [CrossRef]


| % /10 Years (AOD and BOA 2007–2016) | |||
|---|---|---|---|
| Po Valley | Benelux | Sahara | |
| Total AOD | −3.4 | −16.5 | +4.8 |
| lev3 AOD | +3.9 | −15.5 | +8.7 |
| lev2 AOD | −10.1 | −14.0 | +8.0 |
| lev1 AOD | −14.3 | −19.6 | +8.5 |
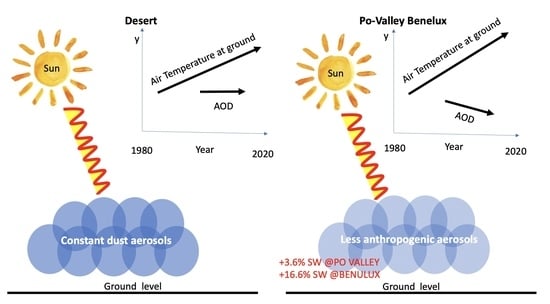
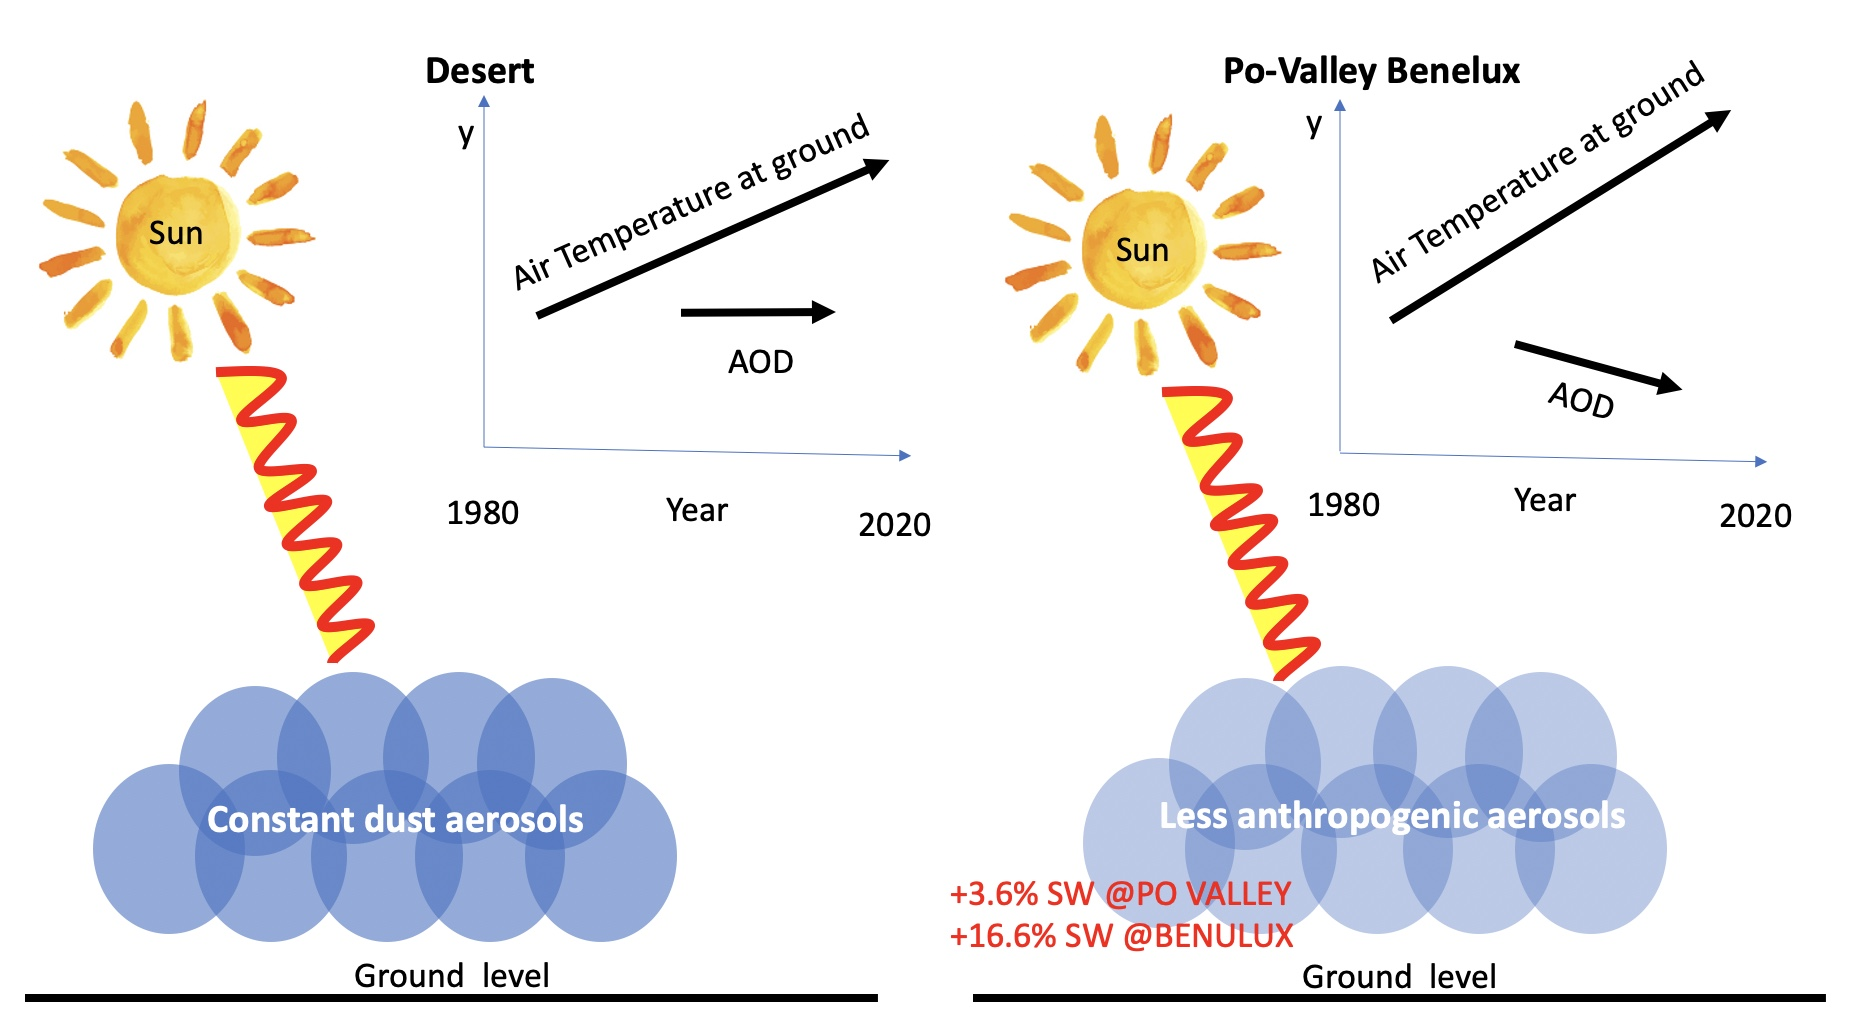
| BOA | +3.6 | +16.6 | −9.0 |
Publisher’s Note: MDPI stays neutral with regard to jurisdictional claims in published maps and institutional affiliations. |
© 2021 by the authors. Licensee MDPI, Basel, Switzerland. This article is an open access article distributed under the terms and conditions of the Creative Commons Attribution (CC BY) license (https://creativecommons.org/licenses/by/4.0/).
Share and Cite
Landi, T.C.; Bonasoni, P.; Brunetti, M.; Campbell, J.R.; Marquis, J.W.; Di Girolamo, P.; Lolli, S. Aerosol Direct Radiative Effects under Cloud-Free Conditions over Highly-Polluted Areas in Europe and Mediterranean: A Ten-Years Analysis (2007–2016). Remote Sens. 2021, 13, 2933. https://doi.org/10.3390/rs13152933
Landi TC, Bonasoni P, Brunetti M, Campbell JR, Marquis JW, Di Girolamo P, Lolli S. Aerosol Direct Radiative Effects under Cloud-Free Conditions over Highly-Polluted Areas in Europe and Mediterranean: A Ten-Years Analysis (2007–2016). Remote Sensing. 2021; 13(15):2933. https://doi.org/10.3390/rs13152933
Chicago/Turabian StyleLandi, Tony C., Paolo Bonasoni, Michele Brunetti, James R. Campbell, Jared W. Marquis, Paolo Di Girolamo, and Simone Lolli. 2021. "Aerosol Direct Radiative Effects under Cloud-Free Conditions over Highly-Polluted Areas in Europe and Mediterranean: A Ten-Years Analysis (2007–2016)" Remote Sensing 13, no. 15: 2933. https://doi.org/10.3390/rs13152933
APA StyleLandi, T. C., Bonasoni, P., Brunetti, M., Campbell, J. R., Marquis, J. W., Di Girolamo, P., & Lolli, S. (2021). Aerosol Direct Radiative Effects under Cloud-Free Conditions over Highly-Polluted Areas in Europe and Mediterranean: A Ten-Years Analysis (2007–2016). Remote Sensing, 13(15), 2933. https://doi.org/10.3390/rs13152933