Underlying Topography Inversion Using TomoSAR Based on Non-Local Means for an L-Band Airborne Dataset
Abstract
:1. Introduction
2. Non-Local Means (NLM) Tomographic Synthetic Aperture Radar (TomoSAR) Method
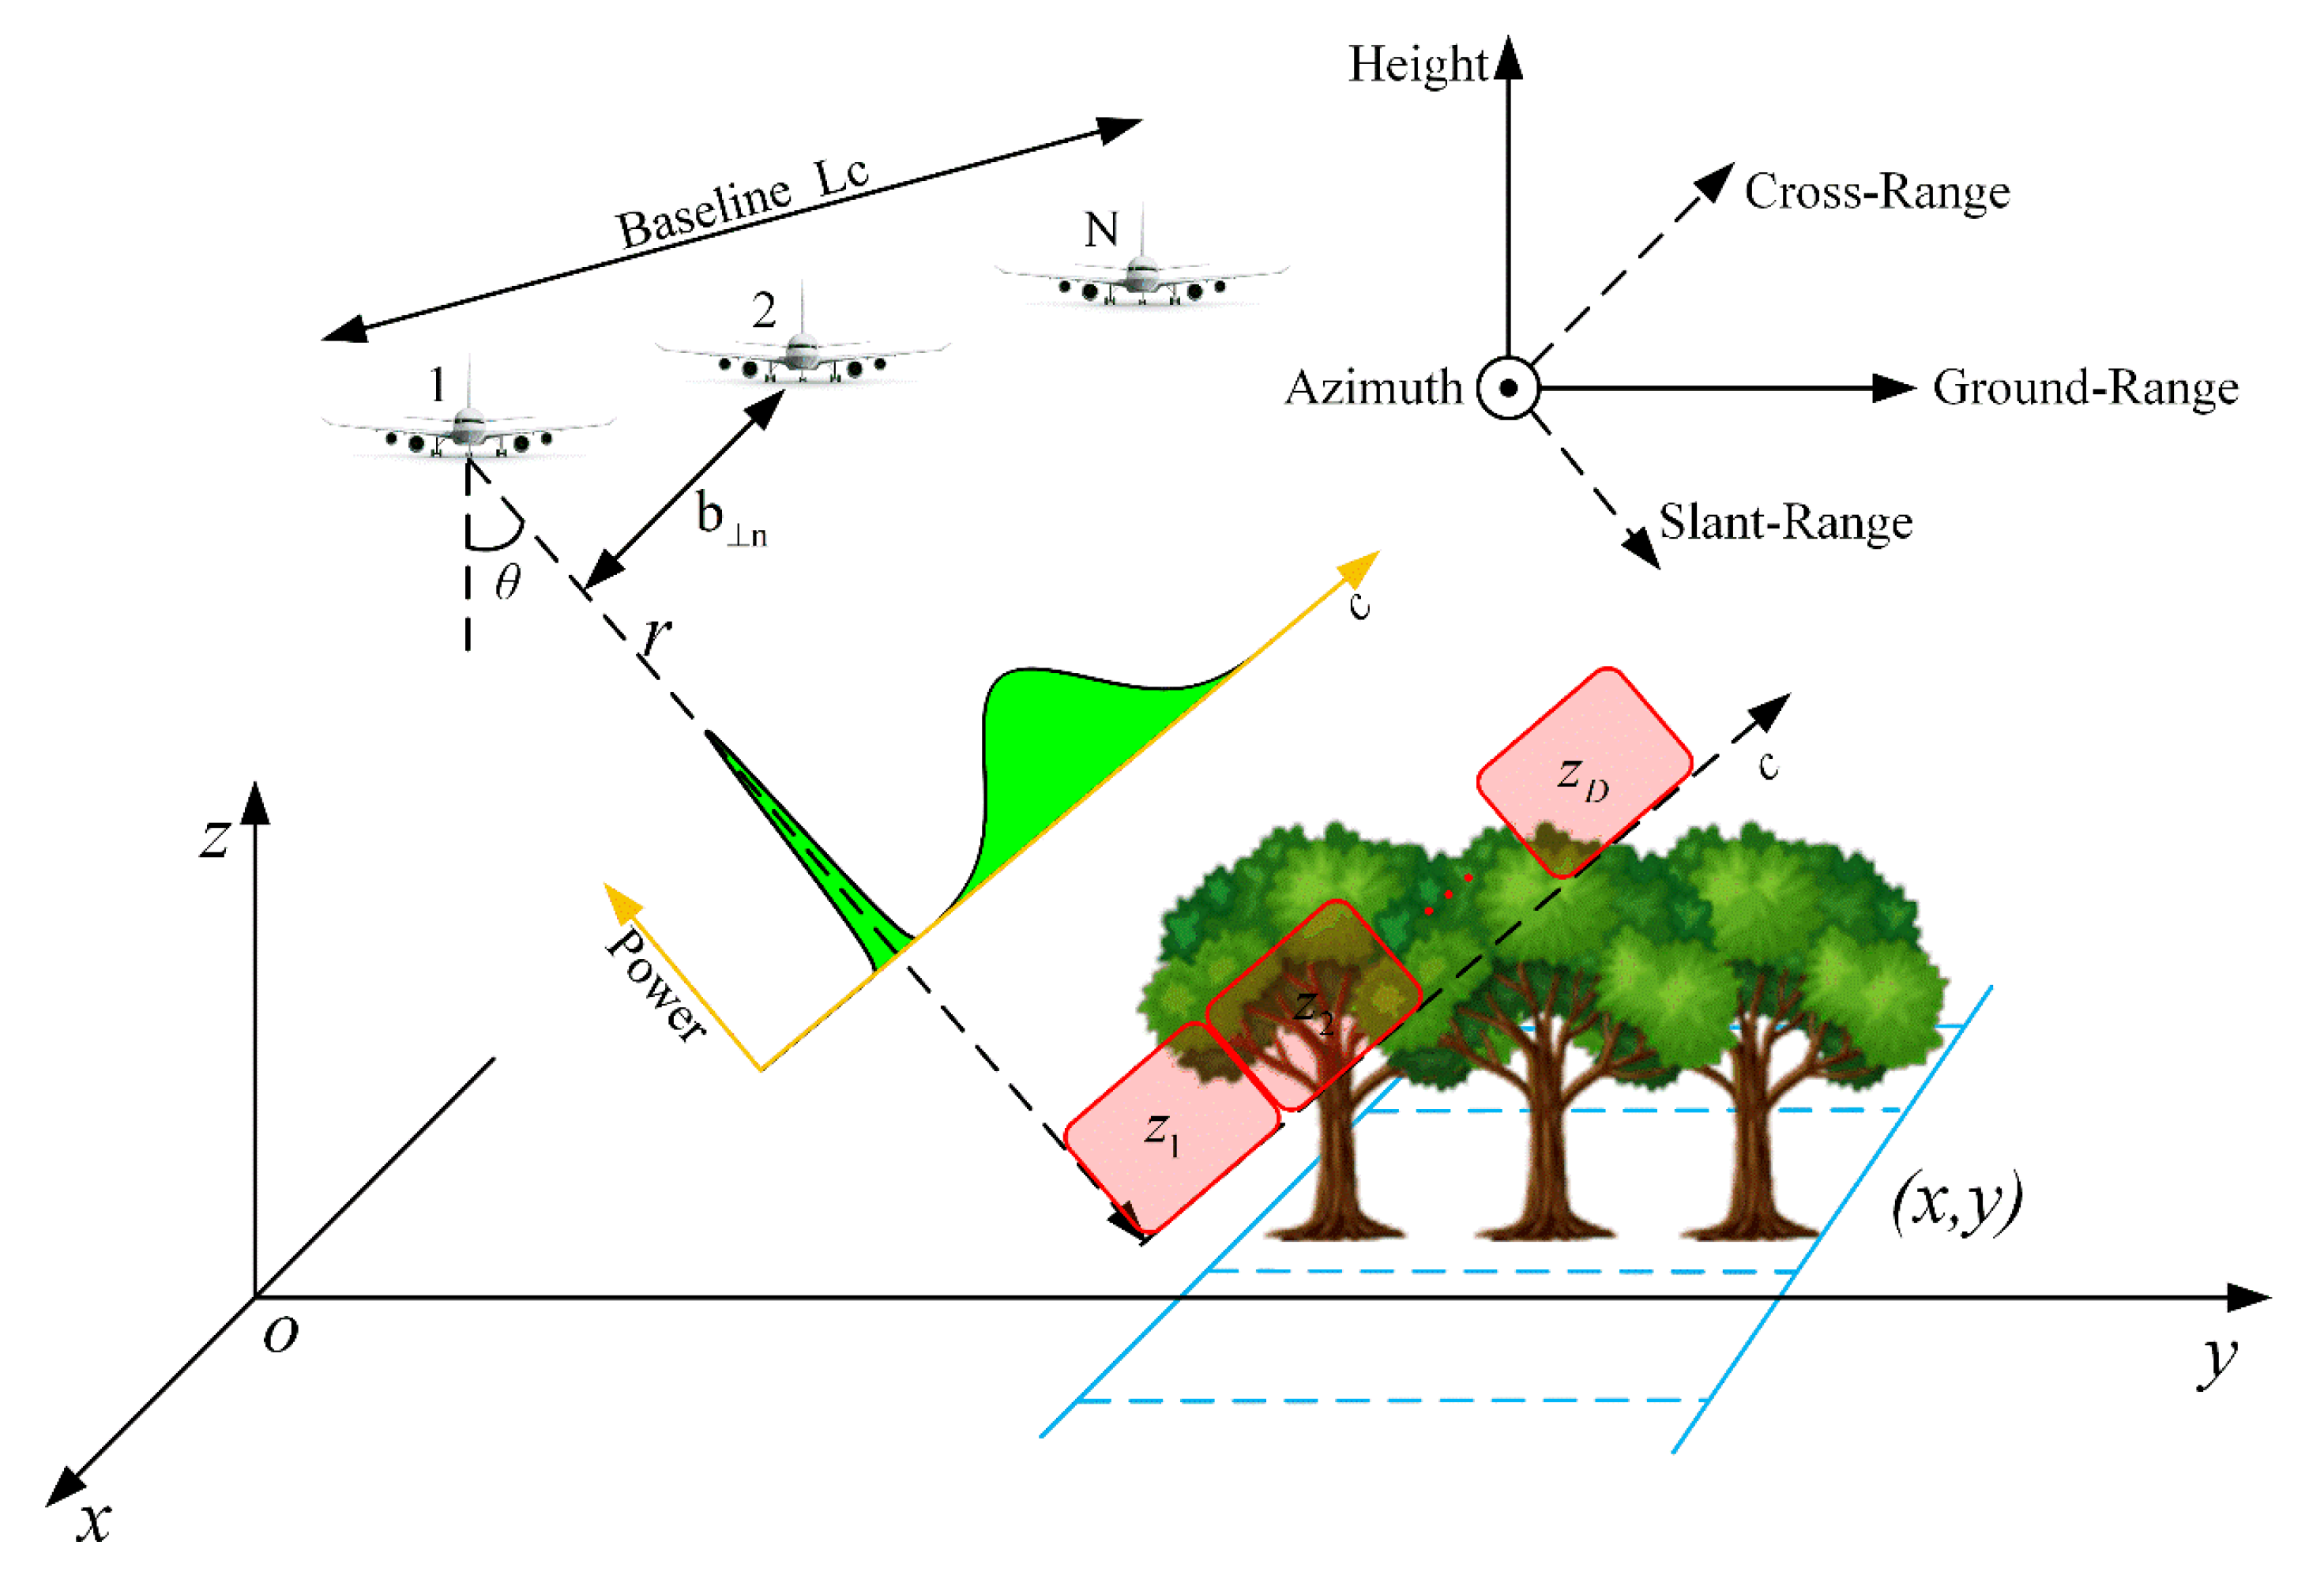
2.1. SAR Tomography Model
2.1.1. Beamforming
2.1.2. Adaptive Beamforming (Capon)
2.1.3. Multiple Signal Classification (MUSIC)
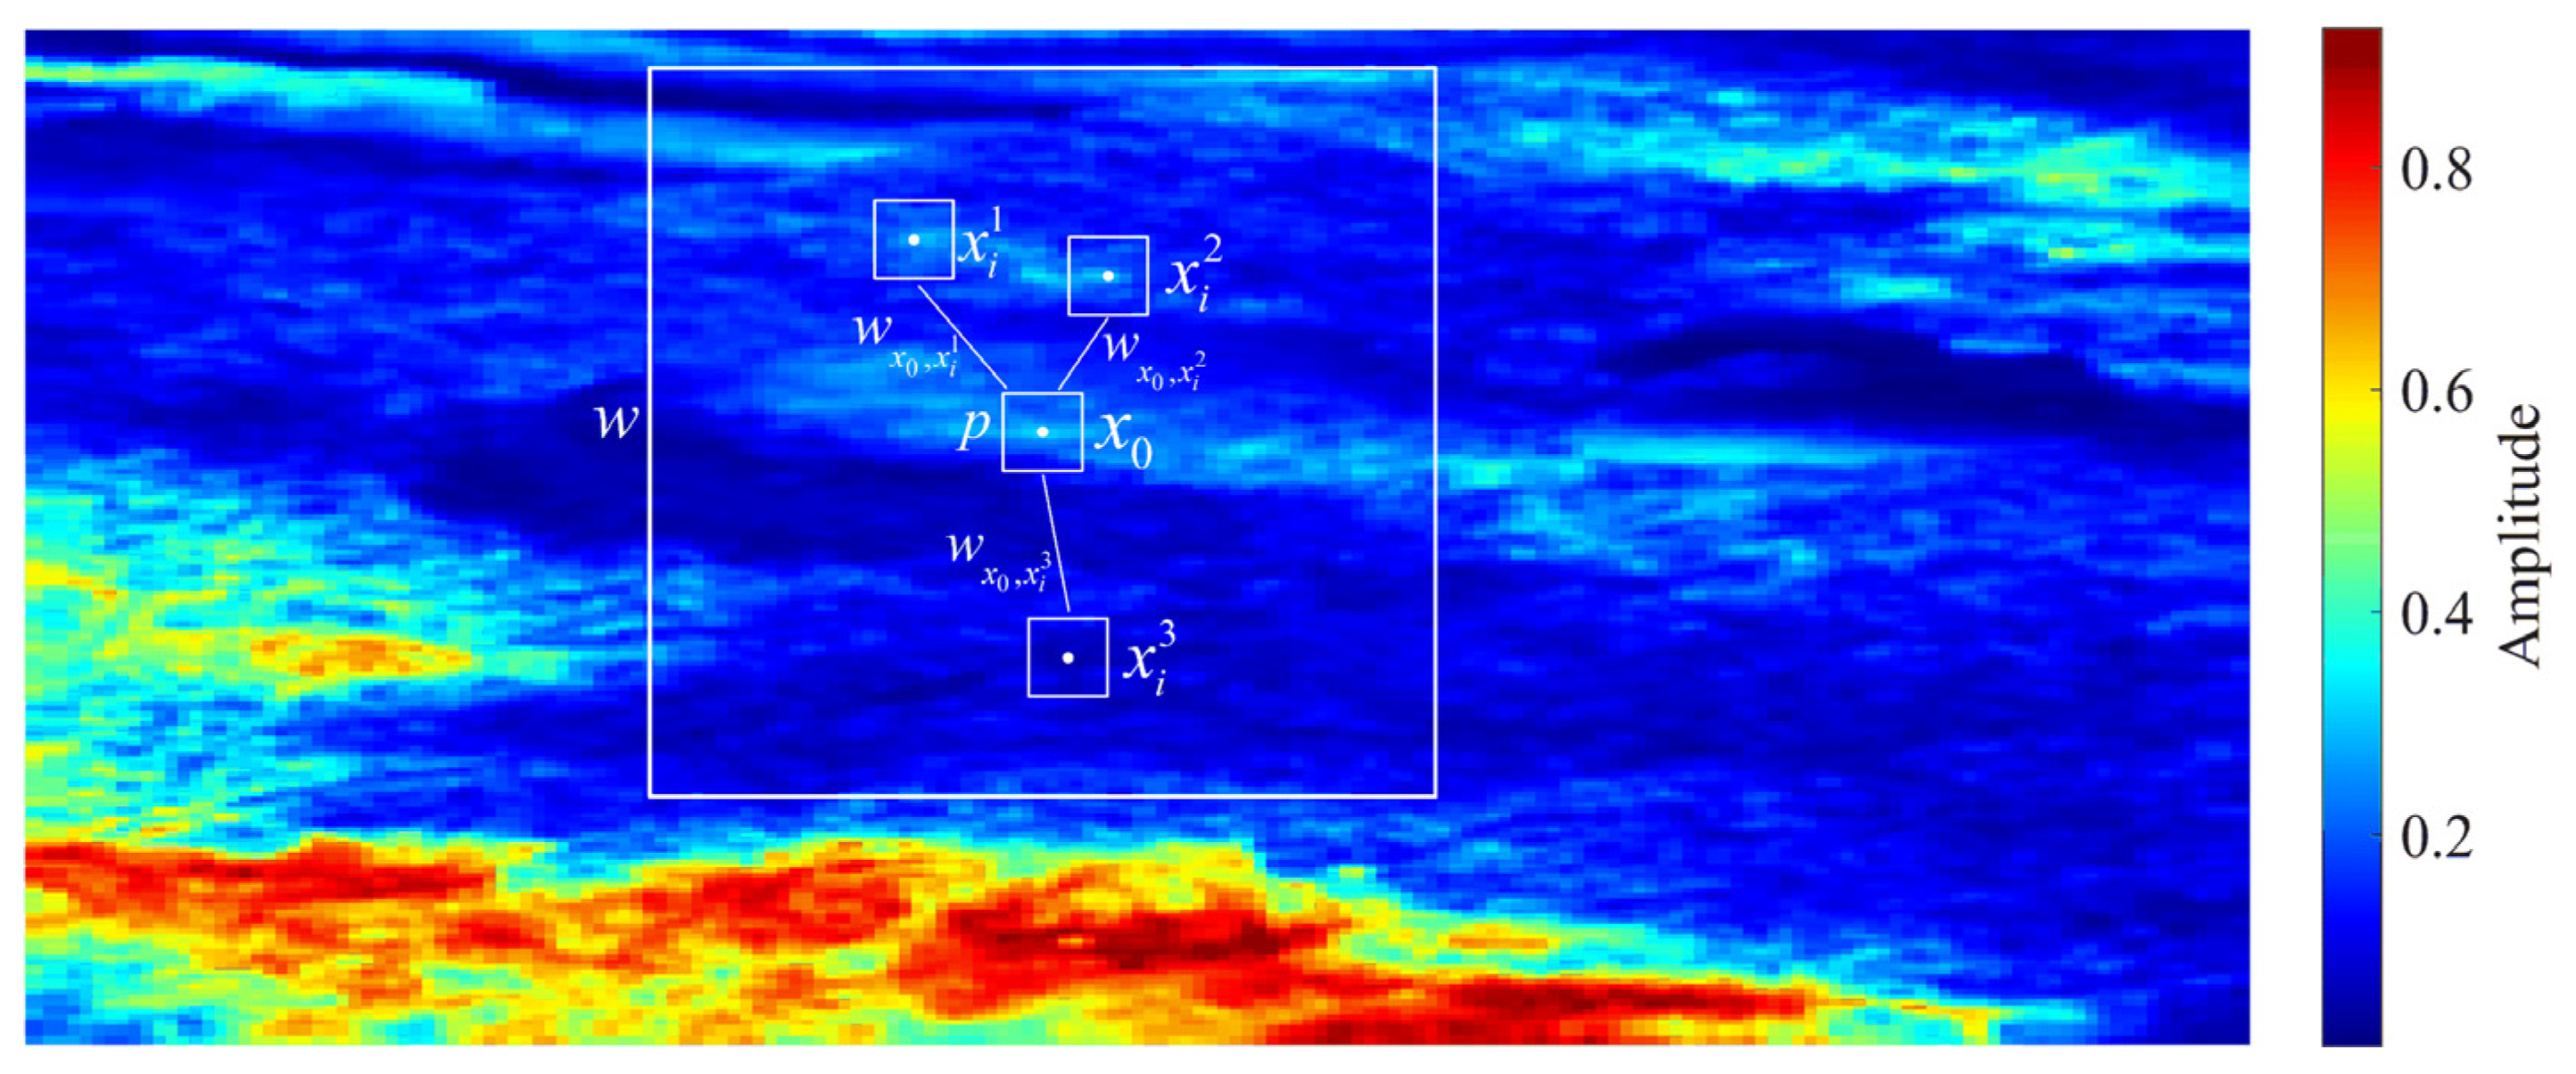
2.2. The NLM Algorithm
2.3. The Traditional Spectral Estimation Methods Based on NLM
- (1)
- Solve the SCM of all the pixels in the area of interest.
- (2)
- Specify the size of the search window and matching window .
- (3)
- Calculate the spatial similarity and radiometric similarity of the matching window between the central pixel and neighboring pixel . (A pixel in the research region is located at within its search window ).
- (4)
- Calculate the weight of the neighborhood pixel based on the spatial and radiometric similarity.
- (5)
- Calculate the optimal weighted CM of the center pixel by the using of the SCM of all the neighborhood pixels (except for the center pixel) in the search window and their corresponding weights.
- (6)
- Substitute the estimated CM into the spectrum estimation formula to estimate the pixel’s spectrum.
- (7)
- Traverse the whole study area, and repeat steps (3) to (6) to obtain the spectra over the whole area.
3. Experiments and Results
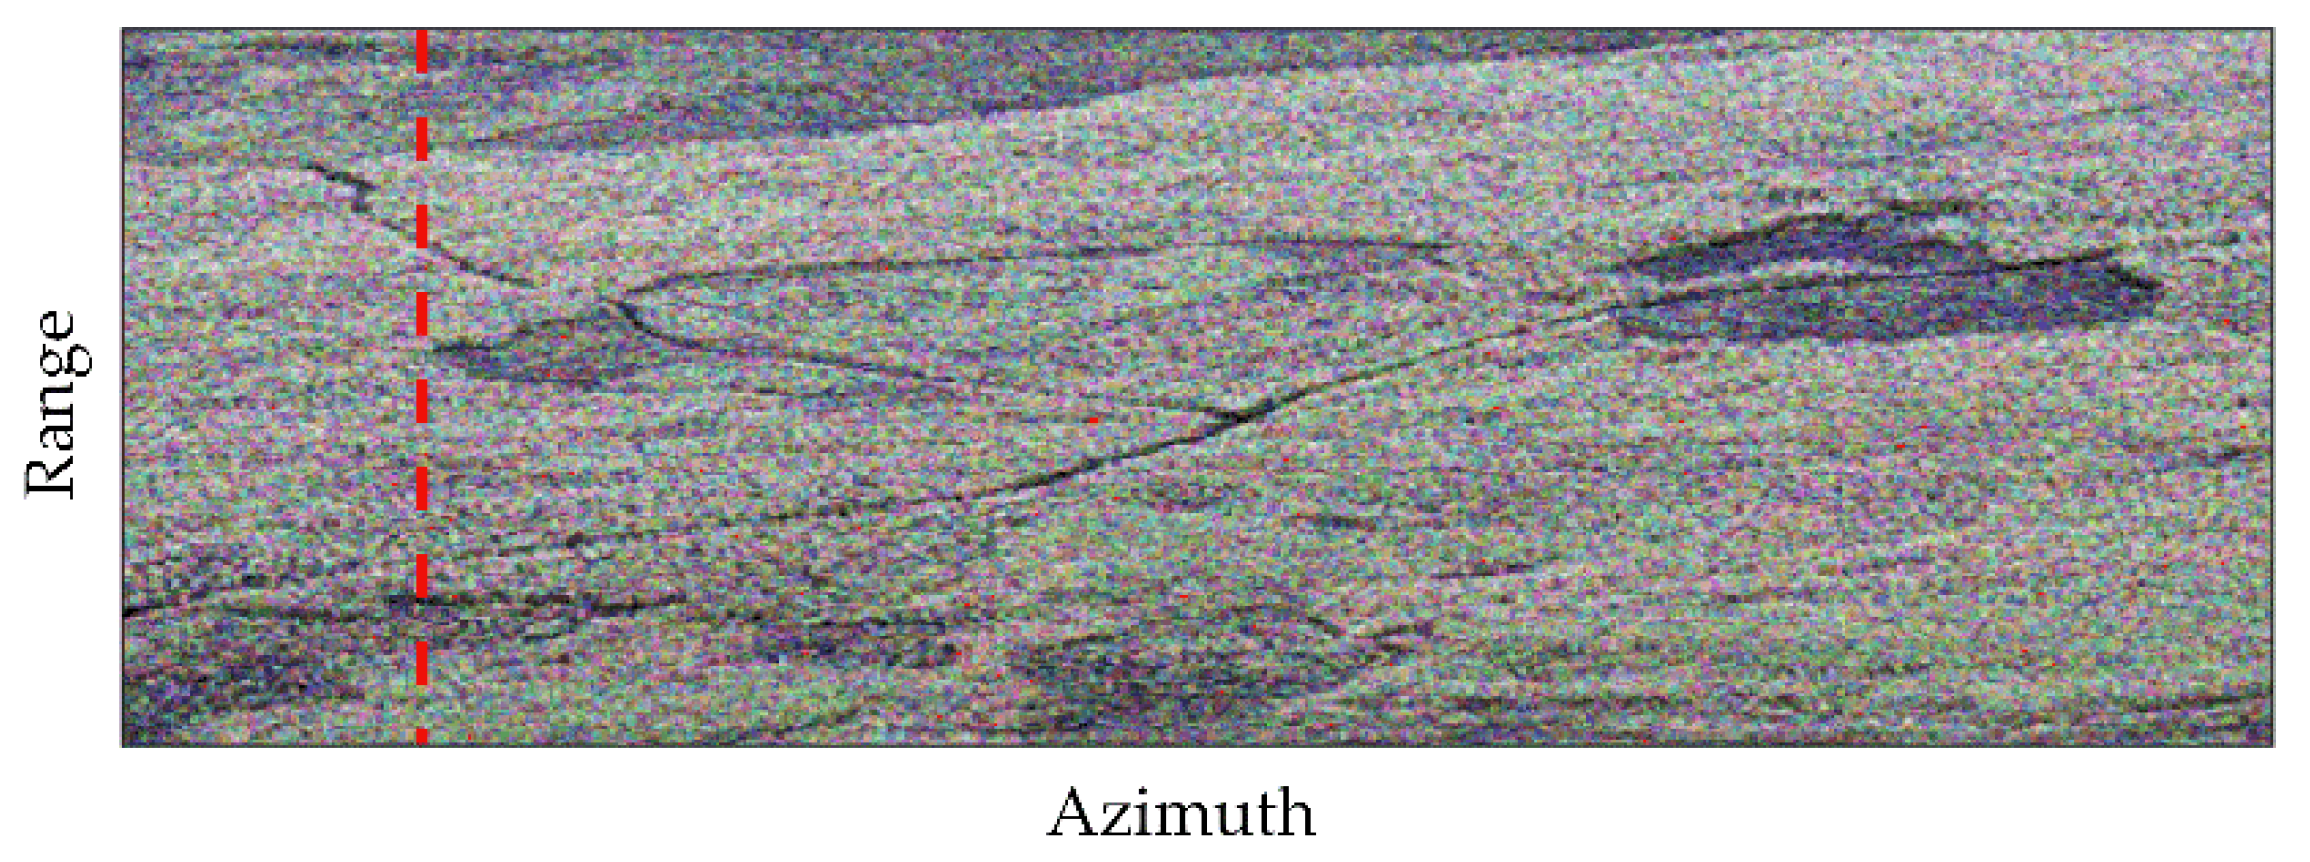
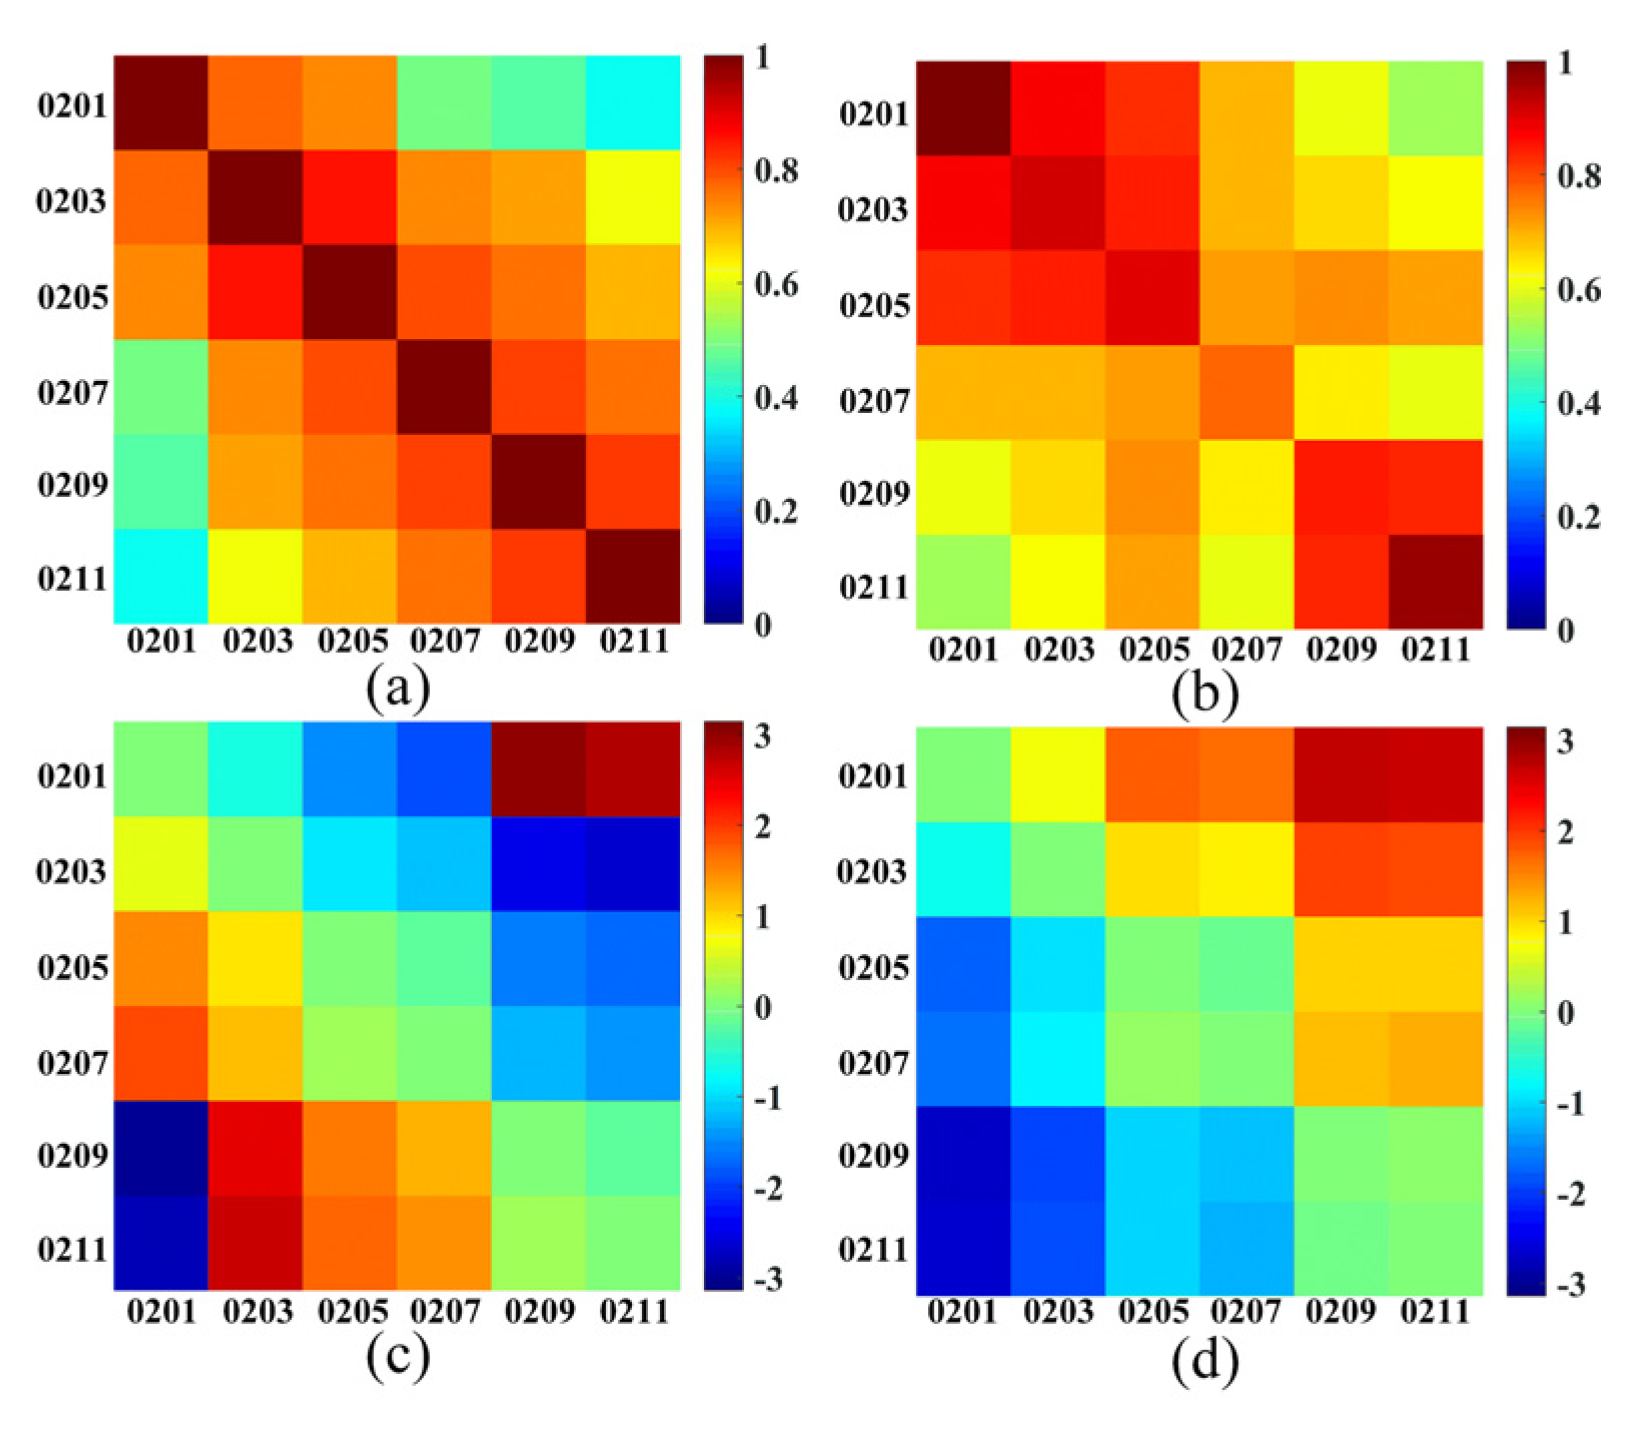
3.1. Study Area and Dataset
3.2. Experimental Results and Analysis
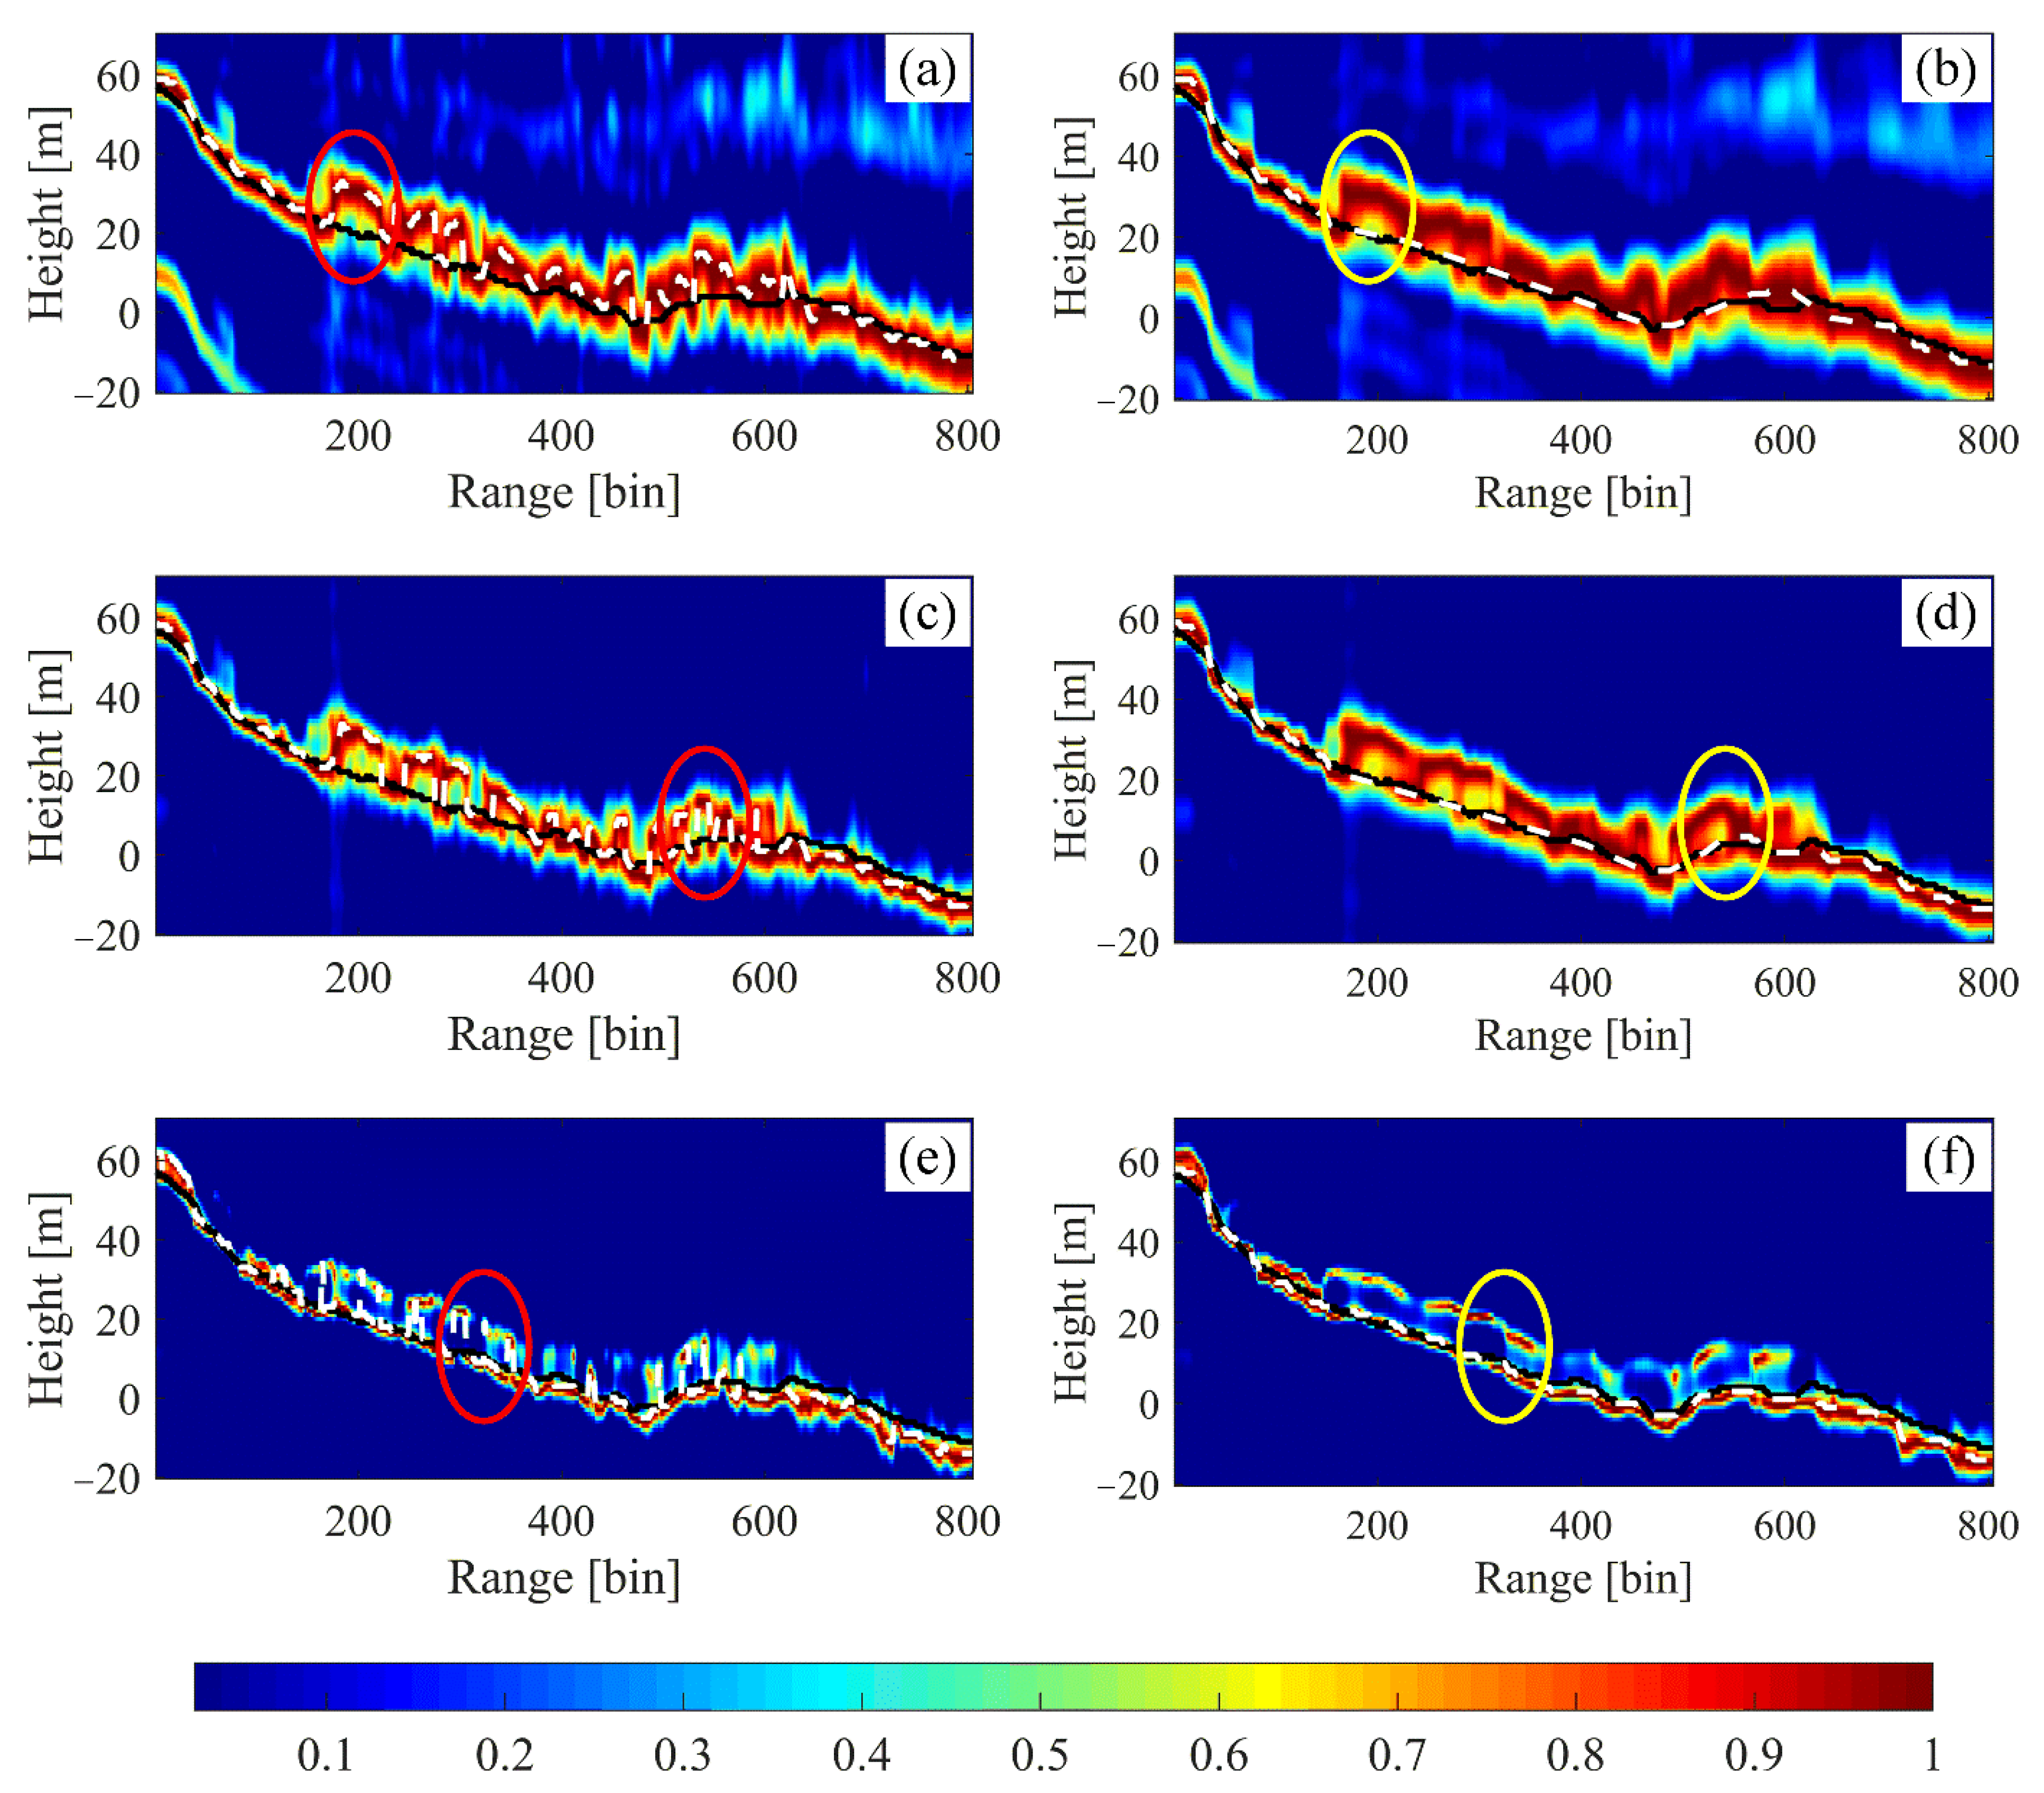
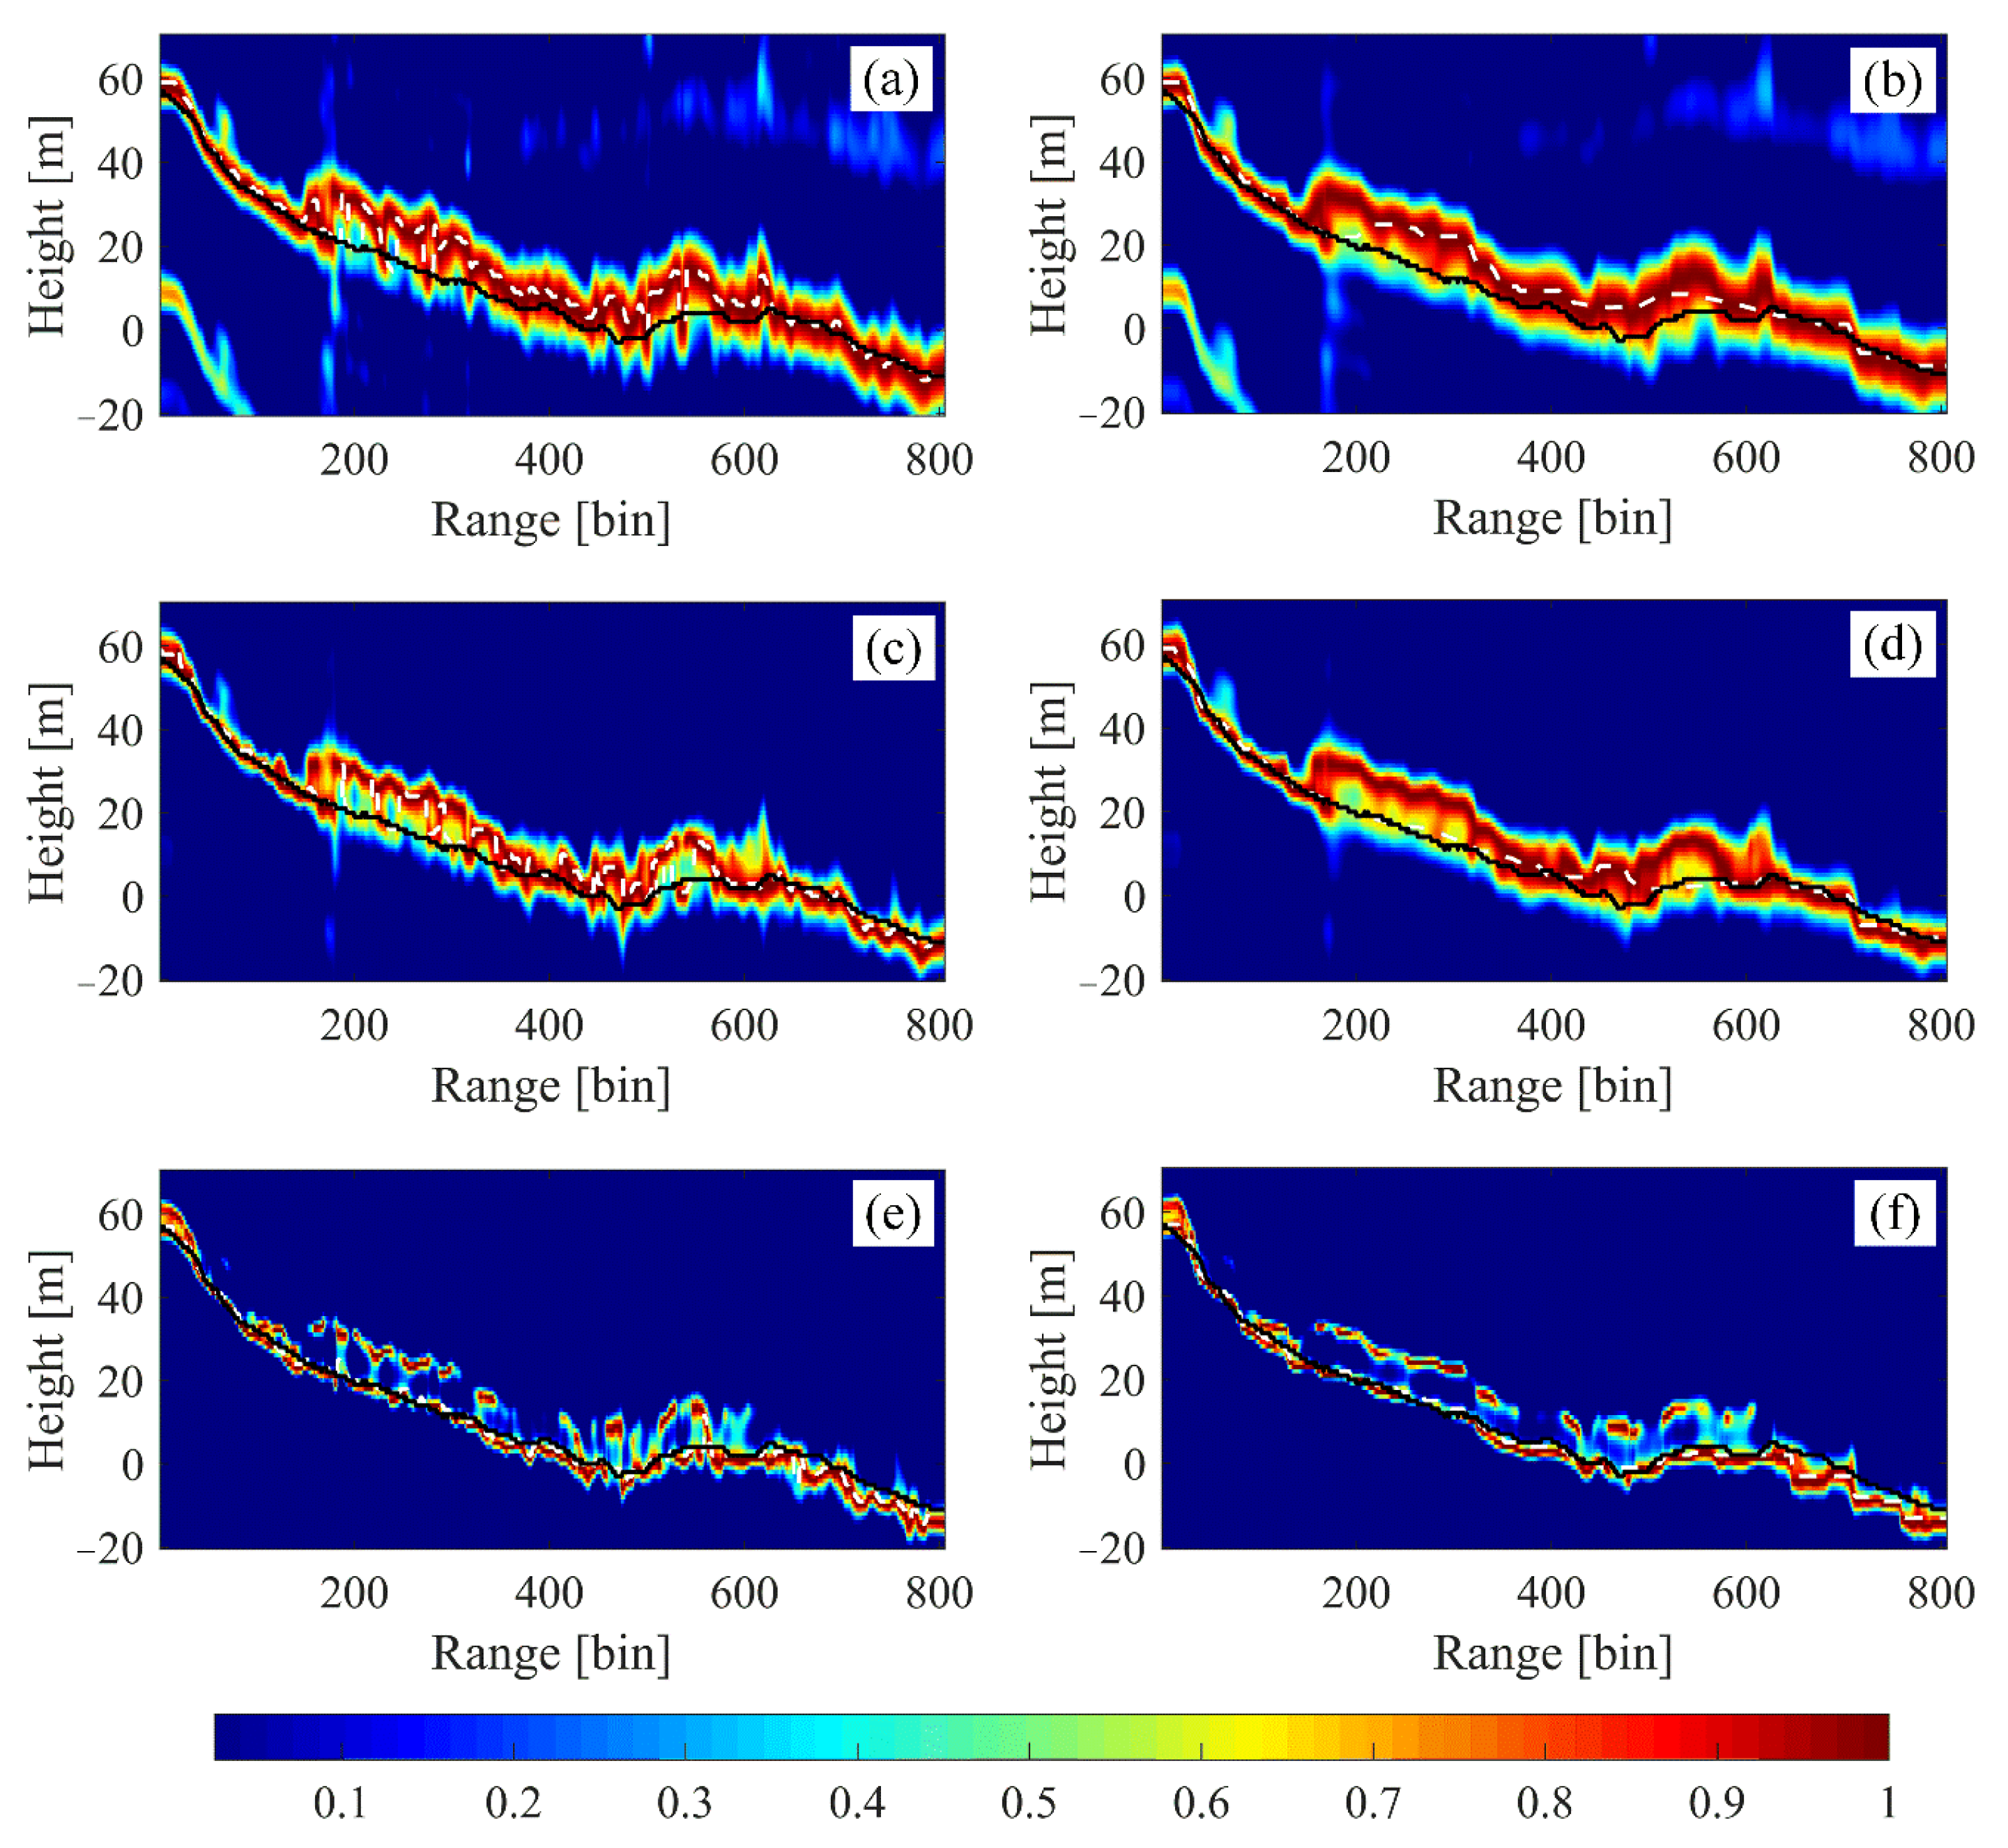
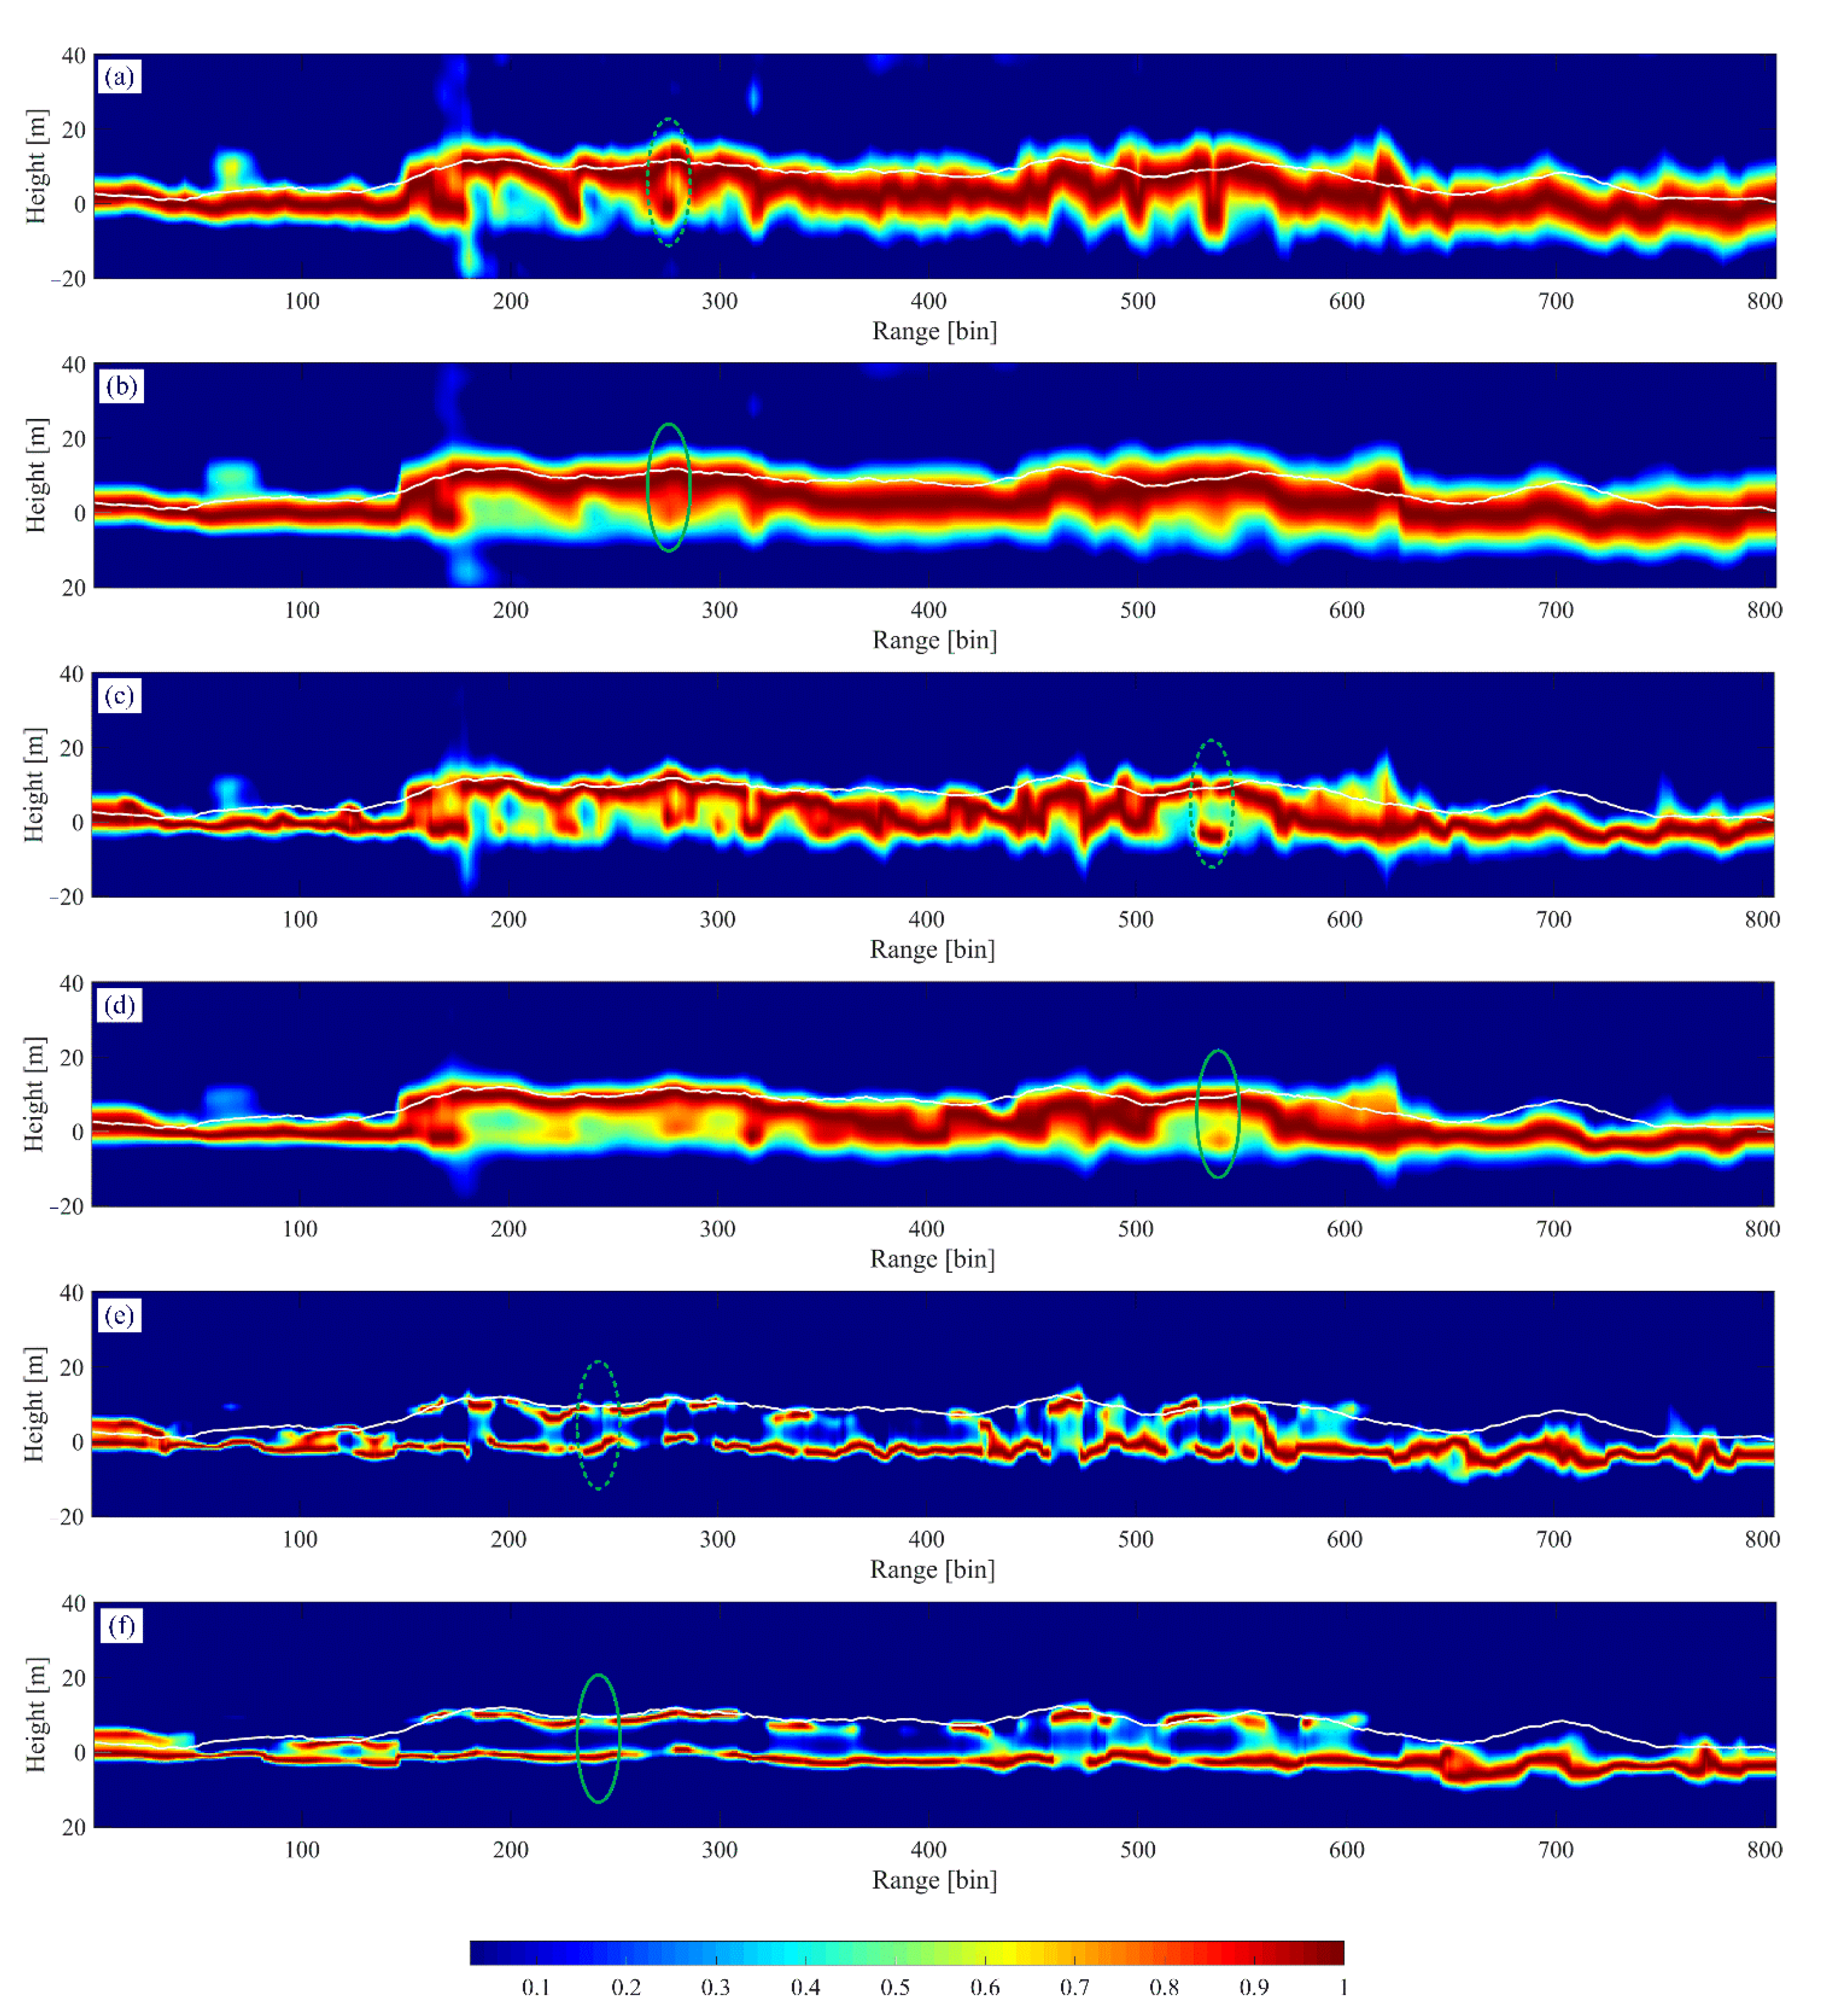
3.2.1. Comparison of the Tomograms
3.2.2. Inversion of the Underlying Topography
4. Discussion
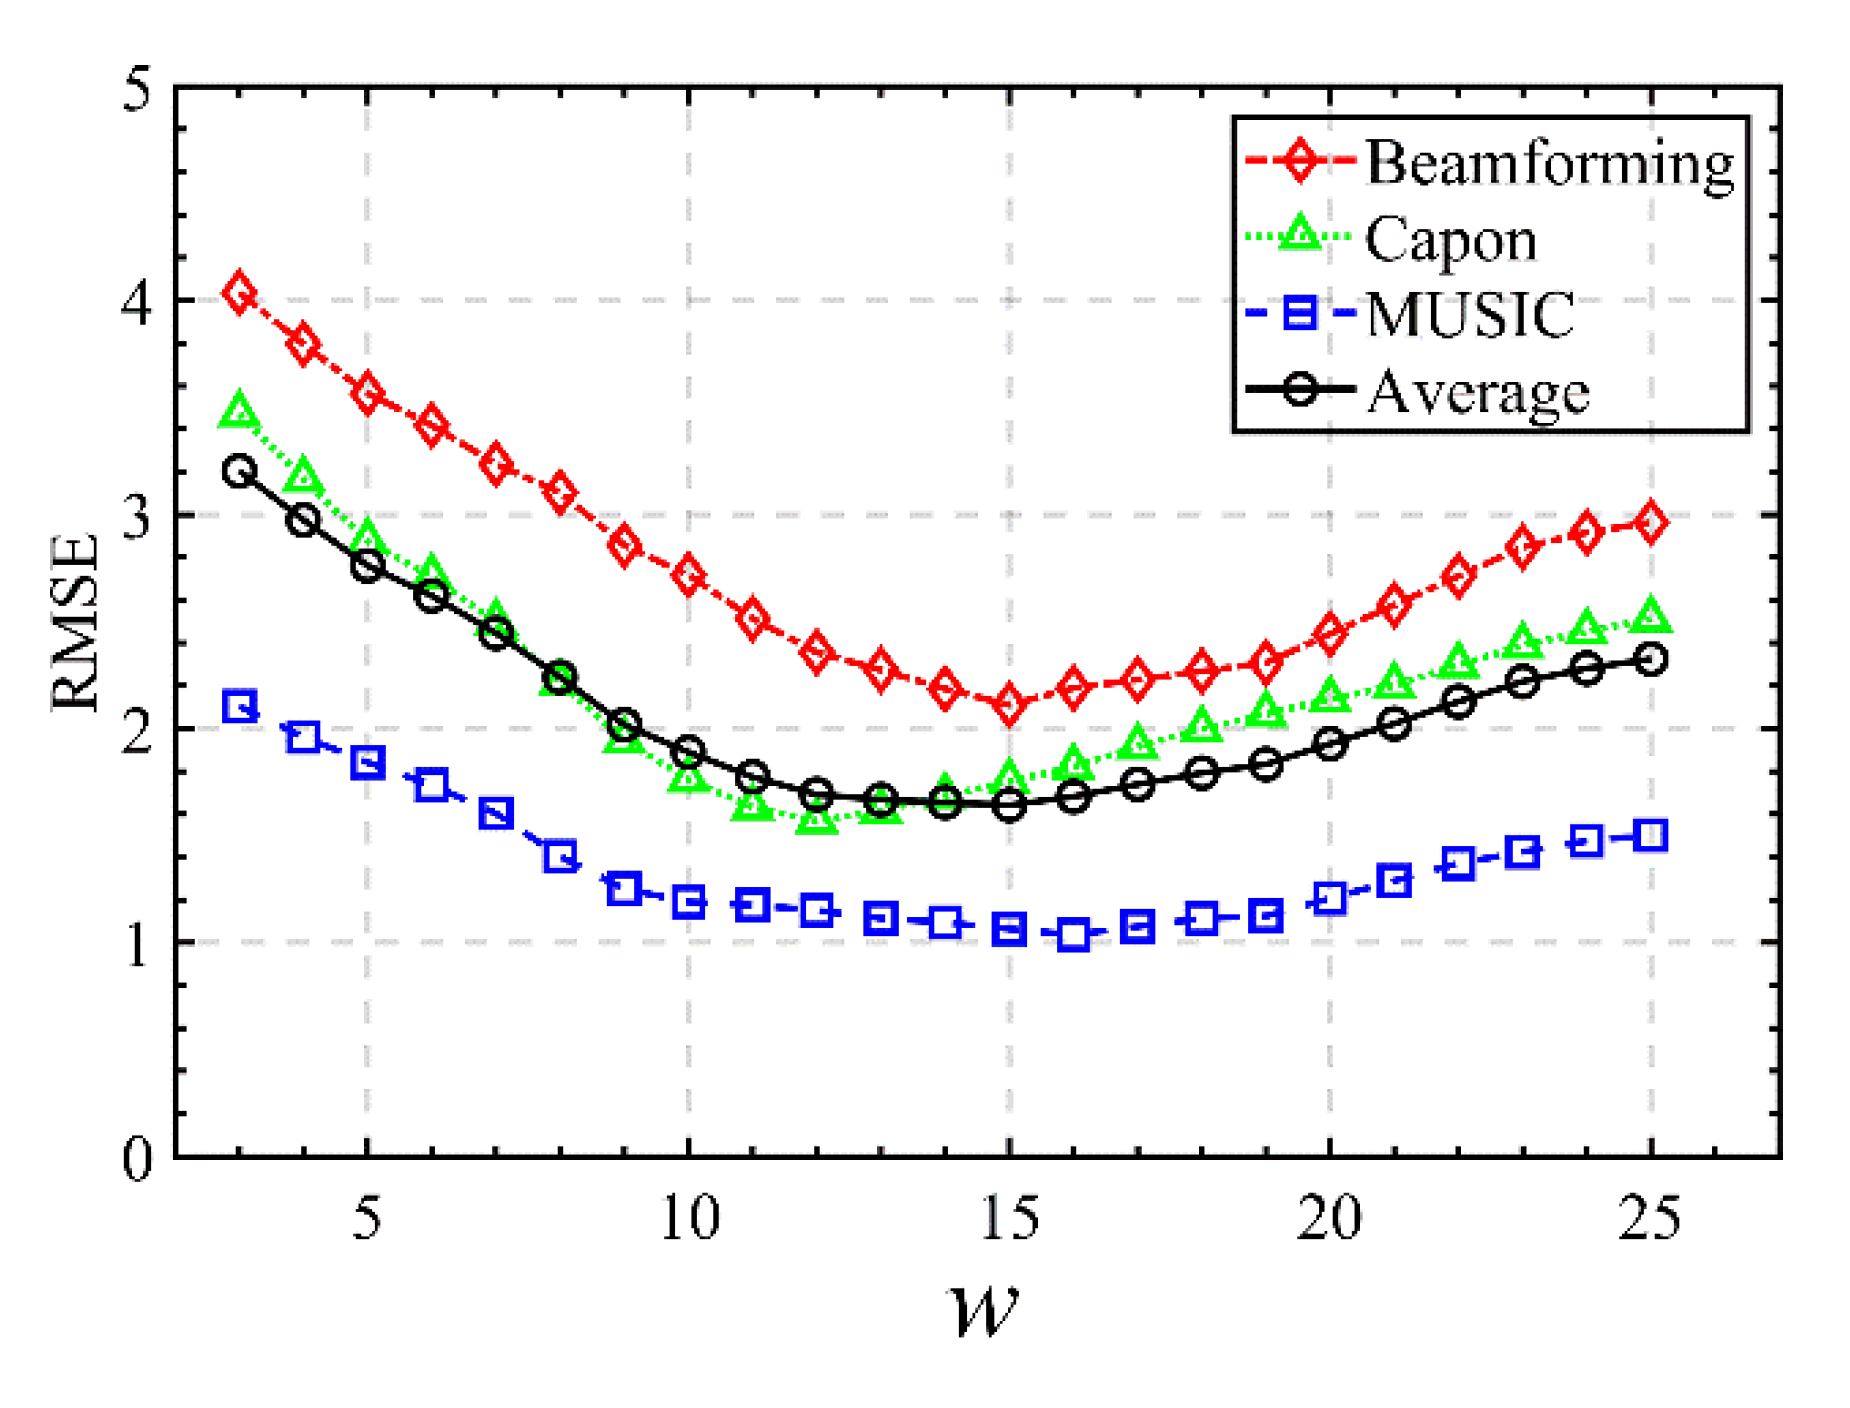
4.1. Optimal Covariance Matrix Estimation
4.2. Tomograms in the HV and VV Channels
4.3. Forest Height Estimation
5. Conclusions
Author Contributions
Funding
Institutional Review Board Statement
Informed Consent Statement
Data Availability Statement
Acknowledgments
Conflicts of Interest
References
- Dinh, H.T.M.; Toan, T.L.; Rocca, F.; Tebaldini, S.; d’Alessandro, M.M.; Villard, L. Relating P-Band Synthetic Aperture Radar Tomography to Tropical Forest Biomass. IEEE Trans. Geosci. Remote Sens. 2013, 52, 967–979. [Google Scholar] [CrossRef]
- Aghababaee, H.; Ferraioli, G.; Ferro-Famil, L.; Huang, Y.; d’Alessandro, M.M.; Pascazio, V.; Schirinzi, G.; Tebaldini, S. Forest SAR Tomography: Principles and Applications. IEEE Geosci. Remote Sens. Mag. 2020, 8, 30–45. [Google Scholar] [CrossRef]
- Dinh, H.T.M.; Le Toan, T.; Rocca, F.; Tebaldini, S.; Villard, L.; Réjou-Méchain, M.; Phillips, O.L.; Feldpausch, T.R.; Dubois-Fernandez, P.; Scipal, K. SAR tomography for the retrieval of forest biomass and height: Cross-validation at two tropical forest sites in French Guiana. Remote Sens. Environ. 2016, 175, 138–147. [Google Scholar] [CrossRef] [Green Version]
- Ngo, Y.-N.; Ho Tong Minh, D.; Moussawi, I.; Villard, L.; Ferro-Famil, L.; d’Alessandro, M.M.; Tebaldini, S.; Albinetv, C.; Scipal, K.; Le Toan, T. Afrisar-Tropisar: Forest Biomass Retrieval by P-Band Sar Tomography. In Proceedings of the IGARSS 2018—2018 IEEE International Geoscience and Remote Sensing Symposium, Valencia, Spain, 22–27 July 2018; pp. 8675–8678. [Google Scholar]
- Peng, X.; Li, X.; Wang, C.; Zhu, J.; Liang, L.; Fu, H.; Du, Y.; Yang, Z.; Xie, Q. SPICE-Based SAR Tomography Over Forest Areas Using a Small Number of P-band Airborne F-SAR Images Characterized by Non-Uniformly Distributed Baselines. Remote Sens. 2019, 11. [Google Scholar] [CrossRef] [Green Version]
- Reigber, A.; Moreira, A. First demonstration of airborne SAR tomography using multibaseline L-band data. IEEE Trans. Geosci. Remote Sens. 2000, 38, 2142–2152. [Google Scholar] [CrossRef]
- Gini, F.; Lombardini, F.; Montanari, M. Layover solution in multibaseline SAR interferometry. IEEE Trans. Aerosp. Electron. Syst. 2002, 38, 1344–1356. [Google Scholar] [CrossRef]
- Lombardini, F.; Reigber, A. Adaptive spectral estimation for multibaseline SAR tomography with airborne L-band data. In Proceedings of the 2003 IEEE International Geoscience and Remote Sensing Symposium (IEEE Cat. No. 03CH37477), Toulouse, France, 21–25 July 2003; pp. 2014–2016. [Google Scholar]
- Nannini, M.; Scheiber, R.; Moreira, A. Estimation of the minimum number of tracks for SAR tomography. IEEE Trans. Geosci. Remote Sens. 2009, 47, 531–543. [Google Scholar] [CrossRef]
- Yu, H.; Zhang, Z. The Performance of Relative Height Metrics for Estimation of Forest Above-Ground Biomass Using L-and X-Bands TomoSAR Data. IEEE J. Sel. Top. Appl. Earth Obs. Remote Sens. 2021, 14, 1857–1871. [Google Scholar] [CrossRef]
- Tebaldini, S.; Rocca, F. Multibaseline polarimetric SAR tomography of a boreal forest at P-and L-bands. IEEE Trans. Geosci. Remote Sens. 2011, 50, 232–246. [Google Scholar] [CrossRef]
- d’Alessandro, M.M.; Tebaldini, S. Digital terrain model retrieval in tropical forests through P-band SAR tomography. IEEE Trans. Geosci. Remote Sens. 2019, 57, 6774–6781. [Google Scholar] [CrossRef]
- El Moussawi, I.; Ho Tong Minh, D.; Baghdadi, N.; Abdallah, C.; Jomaah, J.; Strauss, O.; Lavalle, M. L-Band UAVSAR tomographic imaging in dense forests: Gabon forests. Remote Sens. 2019, 11, 475. [Google Scholar] [CrossRef] [Green Version]
- Yang, X.; Tebaldini, S.; d’Alessandro, M.M.; Liao, M. Tropical Forest Height Retrieval Based on P-Band Multibaseline SAR Data. IEEE Geosci. Remote Sens. Lett. 2019, 17, 451–455. [Google Scholar] [CrossRef]
- Zhang, Q.; Huang, Y.; Schwaebisch, M.; Mercer, B.; Wei, M. Forest height estimation using single-pass dual-baseline L-band PolInSAR data. In Proceedings of the 2012 IEEE International Geoscience and Remote Sensing Symposium, Munich, Germany, 22–27 July 2012; pp. 7055–7058. [Google Scholar]
- Liang, L.; Li, X.; Gao, X.; Guo, H. Multibaseline polarimetric synthetic aperture radar tomography of forested areas using wavelet-based distribution compressive sensing. J. Appl. Remote Sens. 2015, 9, 095048. [Google Scholar] [CrossRef] [Green Version]
- Pardini, M.; Tello, M.; Cazcarra-Bes, V.; Papathanassiou, K.P.; Hajnsek, I. L-and P-band 3-D SAR reflectivity profiles versus lidar waveforms: The AfriSAR case. IEEE J. Sel. Top. Appl. Earth Obs. Remote Sens. 2018, 11, 3386–3401. [Google Scholar] [CrossRef]
- Labriere, N.; Tao, S.; Chave, J.; Scipal, K.; Le Toan, T.; Abernethy, K.; Alonso, A.; Barbier, N.; Bissiengou, P.; Casal, T. In situ reference datasets from the TropiSAR and AfriSAR campaigns in support of upcoming spaceborne biomass missions. IEEE J. Sel. Top. Appl. Earth Obs. Remote Sens. 2018, 11, 3617–3627. [Google Scholar] [CrossRef]
- Cazcarra-Bes, V.; Pardini, M.; Tello, M.; Papathanassiou, K.P. Comparison of tomographic SAR reflectivity reconstruction algorithms for forest applications at L-band. IEEE Trans. Geosci. Remote Sens. 2019, 58, 147–164. [Google Scholar] [CrossRef]
- Huang, Y.; Ferro-Famil, L.; Reigber, A. Under-foliage object imaging using SAR tomography and polarimetric spectral estimators. IEEE Trans. Geosci. Remote Sens. 2011, 50, 2213–2225. [Google Scholar] [CrossRef] [Green Version]
- Ramachandran, N.; Saatchi, S.; Tebaldini, S.; d’Alessandro, M.M.; Dikshit, O. Evaluation of P-Band SAR Tomography for Mapping Tropical Forest Vertical Backscatter and Tree Height. Remote Sens. 2021, 13, 1485. [Google Scholar] [CrossRef]
- Huang, Y.; Zhang, Q.; Ferro-Famil, L. Forest Height Estimation Using a Single-Pass Airborne L-Band Polarimetric and Interferometric SAR System and Tomographic Techniques. Remote Sens. 2021, 13, 487. [Google Scholar] [CrossRef]
- Ferro-Famil, L.; Huang, Y.; Pottier, E. Principles and applications of polarimetric SAR tomography for the characterization of complex environments. In Proceedings of the VIII Hotine-Marussi Symposium on Mathematical Geodesy, Rome, Italy, 17–21 June 2015; pp. 243–255. [Google Scholar]
- Guliaev, R.; Pardini, M.; Papathanassiou, K. A Comparison of Function Bases for Polarization Coherence Tomography in Forest Scenarios. In Proceedings of the European Conference on Synthetic Aperture Radar, EUSAR 2021, Virtual, 28 March–1 April 2021. [Google Scholar]
- Cazcarra-Bes, V.; Pardini, M.; Papathanassiou, K. Definition of Tomographic SAR Configurations for Forest Structure Applications at L-Band. IEEE Geosci. Remote Sens. Lett. 2020. [Google Scholar] [CrossRef]
- Aghababaee, H.; Ferraioli, G.; Schirinzi, G.; Sahebi, M.R. The role of nonlocal estimation in SAR tomographic imaging of volumetric media. IEEE Geosci. Remote Sens. Lett. 2018, 15, 729–733. [Google Scholar] [CrossRef]
- D’Hondt, O.; López-Martínez, C.; Guillaso, S.; Hellwich, O. Nonlocal filtering applied to 3-D reconstruction of tomographic SAR data. IEEE Trans. Geosci. Remote Sens. 2017, 56, 272–285. [Google Scholar] [CrossRef]
- Asopa, U.; Kumar, S. UAVSAR Tomography for Vertical Profile Generation of Tropical Forest of Mondah National Park, Gabon. Earth Space Sci. 2020, 7. [Google Scholar] [CrossRef]
- Li, Z.; Zhang, P.; Qiao, H.; Zhao, C.; Zhou, J.; Huang, L. Advances in Information Extraction of Surface Parameters Using Tomographic SAR. J. Radars 2021, 10, 116–130. [Google Scholar] [CrossRef]
- Fornaro, G.; Serafino, F.; Soldovieri, F. Three-dimensional focusing with multipass SAR data. IEEE Trans. Geosci. Remote Sens. 2003, 41, 507–517. [Google Scholar] [CrossRef]
- Aguilera, E.; Nannini, M.; Reigber, A. Wavelet-based compressed sensing for SAR tomography of forested areas. IEEE Trans. Geosci. Remote Sens. 2013, 51, 5283–5295. [Google Scholar] [CrossRef] [Green Version]
- Homer, J.; Longstaff, I.; Callaghan, G. High resolution 3-D SAR via multi-baseline interferometry. In Proceedings of the IGARSS’96 1996 International Geoscience and Remote Sensing Symposium, Lincoln, NE, USA, 31 May 1996; pp. 796–798. [Google Scholar]
- Stoica, P.; Moses, R.L. Spectral Analysis of Signals; Prentice Hall: Upper Saddle River, NJ, USA, 2005. [Google Scholar]
- She, Z.; Gray, D.; Bogner, R.; Homer, J. Three-dimensional SAR imaging via multiple pass processing. In Proceedings of the IEEE 1999 International Geoscience and Remote Sensing Symposium, IGARSS’99 (Cat. No. 99CH36293), Hamburg, Germany, 28 June–2 July 1999; pp. 2389–2391. [Google Scholar]
- Kumar, S.; Joshi, S.K.; Govil, H. Spaceborne PolSAR tomography for forest height retrieval. IEEE J. Sel. Top. Appl. Earth Obs. Remote Sens. 2017, 10, 5175–5185. [Google Scholar] [CrossRef]
- D’Hondt, O.; Guillaso, S.; Hellwich, O. Iterative bilateral filtering of polarimetric SAR data. IEEE J. Sel. Top. Appl. Earth Obs. Remote Sens. 2013, 6, 1628–1639. [Google Scholar] [CrossRef] [Green Version]
- Lee, J.-S.; Grunes, M.R.; De Grandi, G. Polarimetric SAR speckle filtering and its implication for classification. IEEE Trans. Geosci. Remote Sens. 1999, 37, 2363–2373. [Google Scholar] [CrossRef]
- Barbaresco, F. Interactions between symmetric cone and information geometries: Bruhat-tits and siegel spaces models for high resolution autoregressive doppler imagery. In Proceedings of the LIX Fall Colloquium on Emerging Trends in Visual Computing, Palaiseau, France, 18–20 November 2008; pp. 124–163. [Google Scholar]
- European Space Agency. Technical Assistance for the Development of Airborne SAR and Geophysical Measurements during the BioSAR 2008 Experiment; Final Report; European Space Agency: Paris, France, 2009. [Google Scholar]
- Peng, X.; Li, X.; Du, Y.; Xie, Q. Forest Height Estimation from a Robust TomoSAR Method in the Case of Small Tomographic Aperture with Airborne Dataset at L-Band. Remote Sens. 2021, 13, 2147. [Google Scholar] [CrossRef]




| Initialization | |
| Traverse | |
| repeat | |
| Until (finish) |
| Items | Parameters |
|---|---|
| Wavelength | 0.23 m (L-band) |
| Polarimetric channel | HH + HV + VV |
| Incidence angle | 25–55° |
| Center slant range | 3900 m |
| Range resolution | 2.12 m |
| Azimuth resolution | 1.20 m |
| Identifier | Acquisition Date | Baseline (m) |
|---|---|---|
| 08biosar0201 × 1 | 15 October 2008 | 0 |
| 08biosar0203 × 1 | −6 | |
| 08biosar0205 × 1 | −12 | |
| 08biosar0207 × 1 | −18 | |
| 08biosar0209 × 1 | −24 | |
| 08biosar0211 × 1 | −30 |
| Item | Beamforming (m) | Capon (m) | MUSIC (m) |
|---|---|---|---|
| LM | 3.24 | 2.87 | 1.55 |
| NLM | 2.11 | 1.77 | 1.06 |
| Improvement | 34.87% | 38.28% | 31.61% |
| Item | Beamforming (s) | Capon (s) | MUSIC (s) |
|---|---|---|---|
| LM | 26 | 25 | 24 |
| NLM | 369 | 371 | 374 |
| Beamforming (m) | Capon (m) | MUSIC (m) | |
|---|---|---|---|
| LM | 2.85 | 2.56 | 1.61 |
| NLM | 1.83 | 1.67 | 1.12 |
| Improvement | 35.78% | 34.76% | 30.43% |
Publisher’s Note: MDPI stays neutral with regard to jurisdictional claims in published maps and institutional affiliations. |
© 2021 by the authors. Licensee MDPI, Basel, Switzerland. This article is an open access article distributed under the terms and conditions of the Creative Commons Attribution (CC BY) license (https://creativecommons.org/licenses/by/4.0/).
Share and Cite
Peng, X.; Wang, Y.; Long, S.; Pan, X.; Xie, Q.; Du, Y.; Fu, H.; Zhu, J.; Li, X. Underlying Topography Inversion Using TomoSAR Based on Non-Local Means for an L-Band Airborne Dataset. Remote Sens. 2021, 13, 2926. https://doi.org/10.3390/rs13152926
Peng X, Wang Y, Long S, Pan X, Xie Q, Du Y, Fu H, Zhu J, Li X. Underlying Topography Inversion Using TomoSAR Based on Non-Local Means for an L-Band Airborne Dataset. Remote Sensing. 2021; 13(15):2926. https://doi.org/10.3390/rs13152926
Chicago/Turabian StylePeng, Xing, Youjun Wang, Shilin Long, Xiong Pan, Qinghua Xie, Yanan Du, Haiqiang Fu, Jianjun Zhu, and Xinwu Li. 2021. "Underlying Topography Inversion Using TomoSAR Based on Non-Local Means for an L-Band Airborne Dataset" Remote Sensing 13, no. 15: 2926. https://doi.org/10.3390/rs13152926
APA StylePeng, X., Wang, Y., Long, S., Pan, X., Xie, Q., Du, Y., Fu, H., Zhu, J., & Li, X. (2021). Underlying Topography Inversion Using TomoSAR Based on Non-Local Means for an L-Band Airborne Dataset. Remote Sensing, 13(15), 2926. https://doi.org/10.3390/rs13152926


