Article

A New Method for Automatic Extraction and Analysis of Discontinuities Based on TIN on Rock Mass Surfaces

1
College of Geo-Exploration Science and Technology, Jilin University, Changchun 130026, China
2
College of Construction Engineering, Jilin University, Changchun 130026, China
*
Author to whom correspondence should be addressed.
Remote Sens. 2021, 13(15), 2894; https://doi.org/10.3390/rs13152894
Submission received: 8 June 2021 / Revised: 17 July 2021 / Accepted: 21 July 2021 / Published: 23 July 2021
(This article belongs to the Special Issue 3D Point Clouds in Rock Mechanics Applications)

Abstract

:
Light detection and ranging (LiDAR) can quickly and accurately obtain 3D point clouds on the surface of rock masses, and on the basis of this, discontinuity information can be extracted automatically. This paper proposes a new method to automatically extract discontinuity information from 3D point clouds on the surface of rock masses. This method first applies the improved K-means algorithm based on the clustering algorithm by fast search and find of density peaks (DPCA) and the silhouette coefficient in the cluster validity index to identify the discontinuity sets of rock masses, and then uses the hierarchical density-based spatial clustering of applications with noise (HDBSCAN) algorithm to segment the discontinuity sets and to extract each discontinuity from a discontinuity set. Finally, the random sampling consistency (RANSAC) method is used to fit the discontinuities and to calculate their parameters. The 3D point clouds of the typical rock slope in the Rockbench repository is used to extract the discontinuity orientations using the new method, and these are compared with the results obtained from the classical approach and the previous automatic methods. The results show that, compared to the results obtained by Riquelme et al. in 2014, the average deviation of the dip direction and dip angle is reduced by 26% and 8%, respectively; compared to the results obtained by Chen et al. in 2016, the average deviation of the dip direction and dip angle is reduced by 39% and 40%, respectively. The method is also applied to an artificial quarry slope, and the average deviation of the dip direction and dip angle is 5.3° and 4.8°, respectively, as compared to the manual method. Furthermore, the related parameters are analyzed. The study shows that the new method is reliable, has a higher precision when identifying rock mass discontinuities, and can be applied to practical engineering.

Graphical Abstract

1. Introduction

Rock mass discontinuities refer to planar geological interfaces with a certain direction, large extension, and small thickness, and are mainly generated in rock mass under the action of tectonic stress. The spatial distribution and existing orientation constitute the rock mass structure. According to “the theory of structure-controlled rock mass” [1], the discontinuity parameters (orientation, trace, spacing, gap width, roughness, filler, etc.) of rock mass, especially the discontinuity orientation, are of great significance to the study of rock mass geo-mechanics [2,3]. Artificial contact measurement methods for the orientations of rock mass discontinuities include compass measurements and the scanning line method [4]. Compass measurements are labor-intensive and have low efficiency. They are also easily affected by weather and terrain characteristics (accessibility, instability, etc.). Additionally, they are of limited utility for obtaining discontinuity orientations of metal mine slopes due to the incorrect work of the compass. The scanning line method needs to enter the exploration site to measure the parameters of the discontinuities, which is very difficult and dangerous to work. This kind of manual contact measurement is often dangerous, labor-intensive, time-consuming, and has limited information acquisition. Moreover, the precision of the results depends on the professional knowledge and relevant experience of the surveyor.
In recent years, for orientation measurements of rock mass discontinuities, light detection and ranging (LiDAR), photogrammetry, and other technologies have been applied to rock mass engineering [5,6,7,8,9]. These technologies can directly collect 3D point clouds on the surface of rock masses in real time and with high precision, without being affected by subjective factors like manual contact measurement, thus making up for the shortcomings of traditional surveying and mapping. There are some successful cases of discontinuity orientations being extracted, as can be seen in the data obtained from LiDAR [10,11,12,13,14,15,16] and photogrammetry [17,18,19,20,21,22,23,24,25,26].
With the rapid development in the applications of LiDAR technology in the field of rock mass engineering, research on the extraction of discontinuity orientation based on LiDAR data has gradually deepened. Initially, these researchers [27,28,29,30] manually selected a series of point cloud subsets of rock mass discontinuities collected from LiDAR and used the least squares method to fit and calculate its normal vector, which represents the normal vector of the discontinuities. However, this method requires manual judgment in order to select a suitable point cloud subset to represent the discontinuity, and this step is time-consuming and cumbersome. Therefore, some researchers [31,32,33] proposed the use of the neighborhood relationship between 3D point clouds in order to overcome the limitations of the above method—that is, to form a plane with a sufficiently small radius, and to calculate the normal plane vectors based on this relationship. For example, the principal component analysis method [31] can be used to analyze the neighborhood of each point and to calculate the normal vector; however, this method needs to perform a neighborhood search for each point in the point clouds, and the radius is difficult to determine under the uneven density. Later, some researchers proposed other algorithms, such as the algorithm based on searching for volumetric pixels [12] and the region growing algorithm [34]. It can be seen from the above research that there are two main ideas for extracting the discontinuities on rock masses. The first is to directly extract them from the original 3D point clouds on the rock mass surface. The steps are as follows: (a) firstly, find the neighboring points from the original 3D point clouds in order to form an approximate plane; (b) then project the normal vector of the plane into the 3D network, and use the kernel density estimation (KDE) [35] to identify the main orientations of the discontinuity set; and (c) finally use a clustering algorithm (MeanShift [36], density-based scan algorithm with noise (DBSCAN) [27], etc.) to segment the discontinuity set. The second method is to extract them from the digital surface model (DSM) of the rock mass. The steps are as follows: (a) firstly, use the triangulated irregular network (TIN) for the 3D point clouds in order to create the DSM of rock mass, calculate the normal vector of each triangle, and determine the same discontinuity set by the triangles with similar normal vectors; (b) then use the region growing algorithm to grow the triangles of the same discontinuity set and identify a single discontinuity in each discontinuity set; and finally (c) calculate the orientation of each discontinuity [9,37]. However, in the first method, the radius (or numbers) of the neighboring points is related to the structure and surface roughness of the rock mass. The radius value is difficult to determine, and the number of discontinuity sets also needs to be manually determined. Considering the limitations of the first method, this paper first creates a DSM using TIN, based on the 3D point clouds of the rock surface, and then the discontinuities are extracted.
In this paper, a new method for automatically extracting discontinuity information from the TIN of the rock mass is proposed. Compared to previous studies, the main contributions are as follows: (1) the optimal triangle mesh size for creating the TIN is determined in order to provide high-quality basic data for subsequent identification and segmentation of the discontinuity set; (2) the improved K-means algorithm based on DPCA and silhouette coefficient in the cluster validity index can automatically identify discontinuity sets and determine the optimum number of clusters, thus avoiding manual determination of the number, as in previous studies, and has a high degree of automation; (3) it is proposed the use of the hierarchical density-based spatial clustering of applications with noise (HDBSCAN) [38] algorithm to extract a single discontinuity, which combines the hierarchical clustering algorithm with the DBSCAN algorithm. The parameter adjustment of this algorithm is relatively simple and robust. For the point clouds with large variations in density, the reliability of the HDBSCAN algorithm can also be guaranteed.

2. Data and Methodology

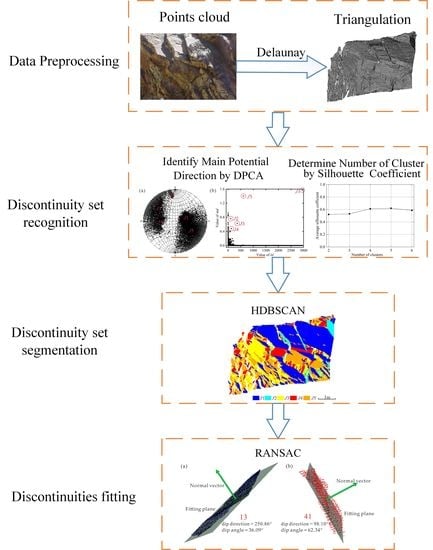
The method mainly includes the following four steps (Figure 1):
(1)
Data preprocessing. First, remove noise points and outliers from the point clouds of the rock mass, then resample the point clouds and use the Delaunay algorithm to generate a TIN of the rock mass surface. Compared to the regular grid model, TIN has the advantages of reducing data redundancy, better performance of variation characteristics, and easy calculation [9,37].
(2)
Discontinuity set recognition. Firstly, calculate the normal vector and centroid of each triangle of the TIN. Secondly, use the DPCA to identify the main potential directions of the discontinuity set. Next, use the K-means algorithm to cluster the discontinuity set. Finally, combine the silhouette coefficient to determine the optimum clustering result. The clustering results can be expressed as Group 1, Group 2, … Group k.
(3)
Discontinuity set segmentation. Use the HDBSCAN algorithm to segment the discontinuity set after clustering and identify each discontinuity. Suppose each discontinuity set has m, n, …, p discontinuities, respectively.
(4)
Discontinuities fitting. Use the RANSAC method to fit the discontinuities and to obtain its parameters.

2.1. Test Data Set Description

This paper uses the rock slope case dataset in the Rockbench repository [39] in order to test the new method proposed. The Rockbench repository is an open database established by Lato et al. in 2009 to realize the sharing of rock mass data in earth sciences. The database is updated with the point clouds of typical cases, such as regular geometries and rock slopes collected by LiDAR and photogrammetry from time-to-time to provide public point clouds of rock mass for all researchers. The public point clouds of rock mass can be used to extract rock mass discontinuities in subsequent innovative algorithms, which is convenient to compare and analyze the improvement with previous methods, and to promote progress in the field of automatic extraction of rock mass discontinuities. The dataset is available at www.3D-landslide.com/projects/discontinuity/ accessed on 20 June 2020 [40]. It is located in Ouray, CO, USA (Figure 2), and the LiDAR data is publicly available. The dataset is the point clouds collected by an Optech ILRIS-3D laser scanner at four scan positions in 2004. The scanning time was about 15 min, the resolution was about 2 cm, and there was a total of 1,515,722 points. In this paper, the area in the red box (Figure 2) is selected as the test data set in order to illustrate the applicability of the new method.

2.2. Data Preprocessing

According to the new method, the point clouds of the rock slope need to be preprocessed. Firstly, use the moving least squares method [41] to denoise point clouds in order to reduce noise data generated by inevitable factors, such as instruments and dust [42]. Then, to save time and money, the point clouds can be resampled using the space method without affecting the rock mass structure. Considering that 0.5 m is often used as the lower limit of the discontinuity extraction in general engineering, this paper selected 5 cm as the resampling parameter [43]. Finally, the Delaunay algorithm was used to create a TIN from the point clouds. The preprocessing steps in this paper reference the method proposed by Chen et al. [37]. Figure 3a shows the original point clouds of the rock slope. After preprocessing, the rock slope was composed of 219,709 faces (Figure 3b) from 110,839 vertices (Figure 3a).

2.3. Discontinuity Set Recognition

2.3.1. Normal Vector and Centroid Computation

When the Delaunay algorithm is used to create a TIN from the point clouds, the calculation process of the normal vector and centroid of each triangle in the TIN is as follows: assume that the vertices of the triangle fi are P1 (X1, Y1, Z1), P2 (X2, Y2, Z2), and P3 (X3, Y3, Z3), arranged counterclockwise. n = (A, B, C) is the normal vector and Ck is the centroid of the triangle fi. Calculate the vector between P1 and P2, and P1 and P3, which are expressed as P1P2 = (X2X1, Y2Y1, Z2Z1) and P1P3 = (X3X1, Y3Y1, Z3Z1). The normal vector n = (A, B, C) can be expressed as a cross product of P1P2 and P1P3, then A, B, and C can be calculated by Formula (1):
A = (Y2Y1)(Z3Z1) − (Z2Z1)(Y3Y1)
B = (Z2Z1)(X3X1) − (X2X1)(Z3Z1)
C = (X2X1)(Y3Y1) − (Y2Y1)(X3X1)
The centroid Ck can be calculated by Formula (2):
C k = ( X 1 + X 2 + X 3 3 , Y 1 + Y 2 + Y 3 3 , Z 1 + Z 2 + Z 3 3 )

2.3.2. Determination of the Main Direction of Discontinuity Set

This research used the clustering algorithm by fast search and find of density peaks, named DPCA in this paper, to determine the main potential directions of the discontinuity set [44]. DPCA is based on the local density of sample points to detect the arbitrary shape of the clustering center. Compared to the traditional MeanShift algorithm, which selects a density threshold in spatial clustering and takes the points lower than the density threshold as noise and distributes them to different high-density areas to detect the clustering center, the DPCA directly converges all sample points to the density distribution function and takes the local maximum points of each region as the clustering center. This method can identify clusters of arbitrary shapes and has a low time cost. Since the DPCA is faster and more reliable than the traditional clustering algorithm at identifying the main directions of a discontinuity set, this paper applied the DPCA to identify the main potential directions of the discontinuity set based on the local density and the minimum distance between the sample point and any other sample points with a higher local density [45]. According to previous studies [46,47], the orientations belonging to one discontinuity set basically conform to the Fisher’s distribution. The density of the sample point near the main orientation is very large and decreases when the distance to the main orientation increases. The principle is as follows:
The distance between the normal vectors di and dj corresponding to the sample point i and j is defined as Formula (3):
d i j = arccos ( | d i d j | )
Calculate the local density ldi of the normal vector of the sample point i by Formulas (4) and (5):
l d i = j χ ( d i j d c f )
χ ( d ) = { 1 , d < 0 0 , d 0
where dij is the distance between the normal vectors of the sample point i and j, and dcf is the cutoff distance. ldi represents the number of sample points with distances to the sample point i less than dcf. d refers to the difference between dij and dcf; if it is less than 0, the local density of the sample point is increased by 1, whereas if it is greater than 0, the local density of the sample point remains unchanged.
Calculate the minimum distance mdi between sample point i and the other sample points with a local density greater than ldi using Formula (6):
m d i = min j : l d j > l d i ( d i j )
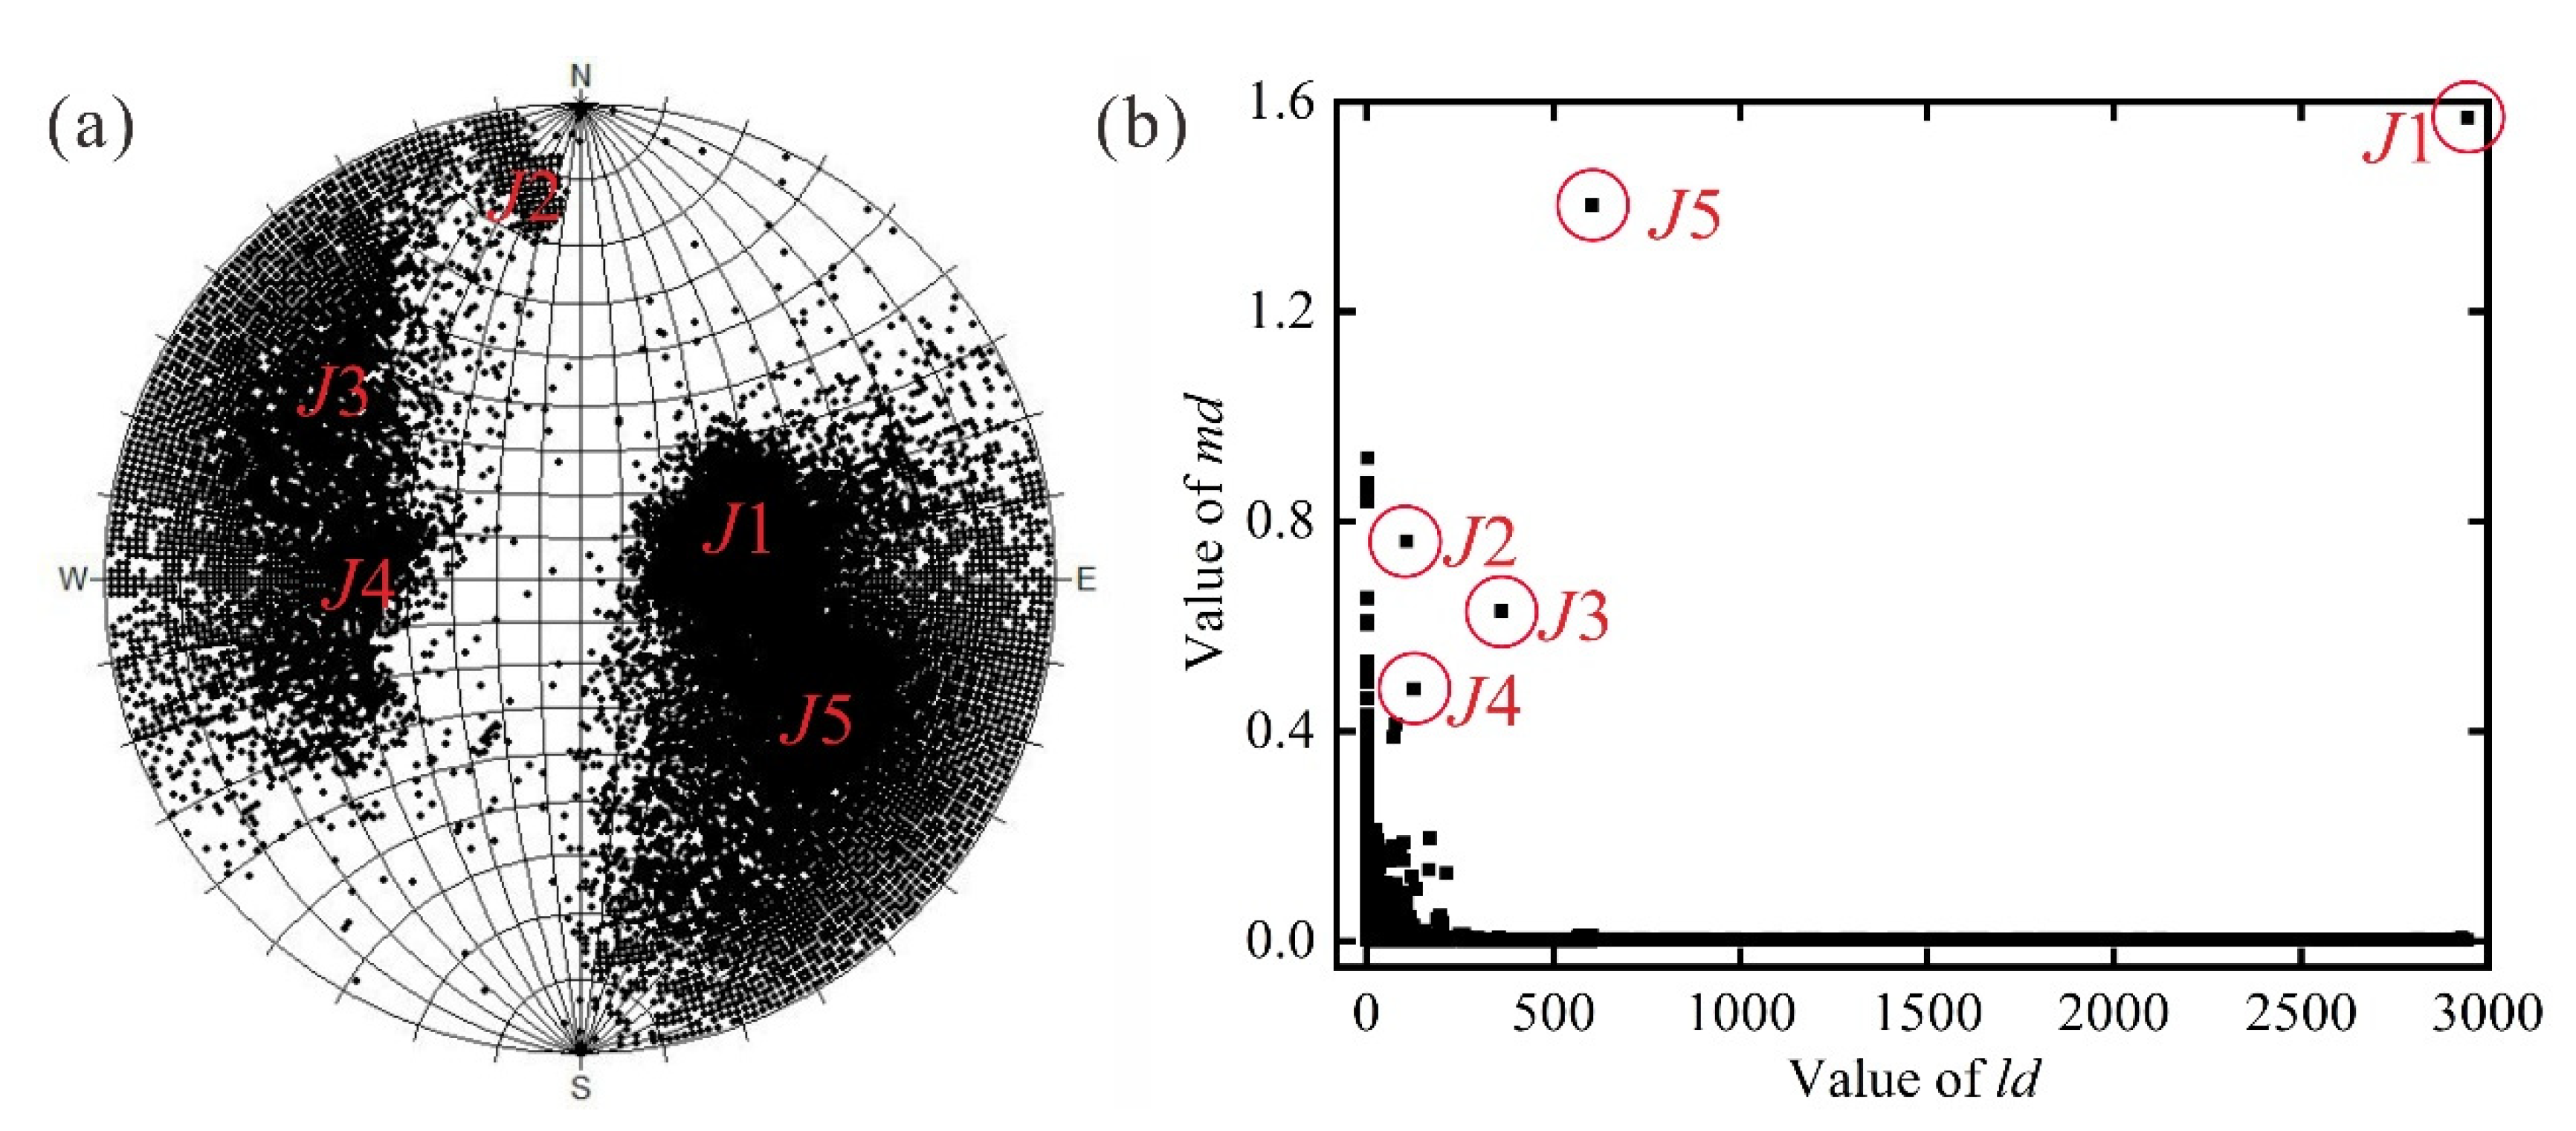
According to the ld and md of each sample point, the DPCA can automatically detect the main potential directions. The specific process is as follows: Firstly, the normal vectors of all the sample points are projected into the isometric 3D network, and as seen in Figure 4a, the rock slope could have five main directions, respectively. Secondly, the DPCA is used to calculate the ld and md of each sample point. ld is calculated by the criteria that the distance between the normal vector of the sample point and the normal vectors of other sample points is less than dcf. If dcf is too large, it will lead to the same ld between the dense sample points. If it is too small, it will lead to the same ld between the sparse sample points. Thus, dcf is set to 0.05. Figure 4b shows the ld and md corresponding to all the sample points in the rock slope. The main potential directions are located in the discrete area in the decision graph, and the points in the red circle indicate the potential main directions that can be selected.
The selection process is as follows: (a) select the first n of the obvious outlier sample points with the largest product of ld and md successively and put them into set C, which is a set of potential clustering centers detected by DPCA. The point in set C with the maximum product value of ld and md is taken as the initial center and is deleted from set C to avoid repeated selections in subsequent steps; (b) select the next cluster center in set C—the requirements are as follows: (1) the angle between the next cluster center and the selected cluster center is greater than the threshold α. According to Formula (3), the maximum angle between the normal vectors projected into the 3D network is 90°, and generally, the rock mass discontinuities can be divided into a maximum of six clusters [43], so the threshold α is set to 15°; (2) select the sample point with the largest production of ld and md that meet condition (1) in set C, and delete it from set C. Repeat the above steps until k centers are selected.

2.3.3. Determination of the Optimum Number of Discontinuity Set

The optimum clustering of the rock mass discontinuities is the basis of the rock mass mechanical analysis and stability evaluation. This paper introduces the silhouette coefficient [48] in the cluster validity index in order to determine the optimal number of discontinuity sets; this is an index that combines the cohesion and separation of clustering in order to evaluate the effectiveness of clustering. Suppose the point clouds of the rock slope can be divided into k clusters. xi is a sample in one of the clusters. Define a(xi) as the average distance between xi and all the other samples in the same cluster, and b(xi) as the minimum average distance between xi and samples in other clusters. The silhouette coefficient of xi is defined by Formula (7):
S ( x i ) = b ( x i ) a ( x i ) max ( a ( x i ) , b ( x i ) )
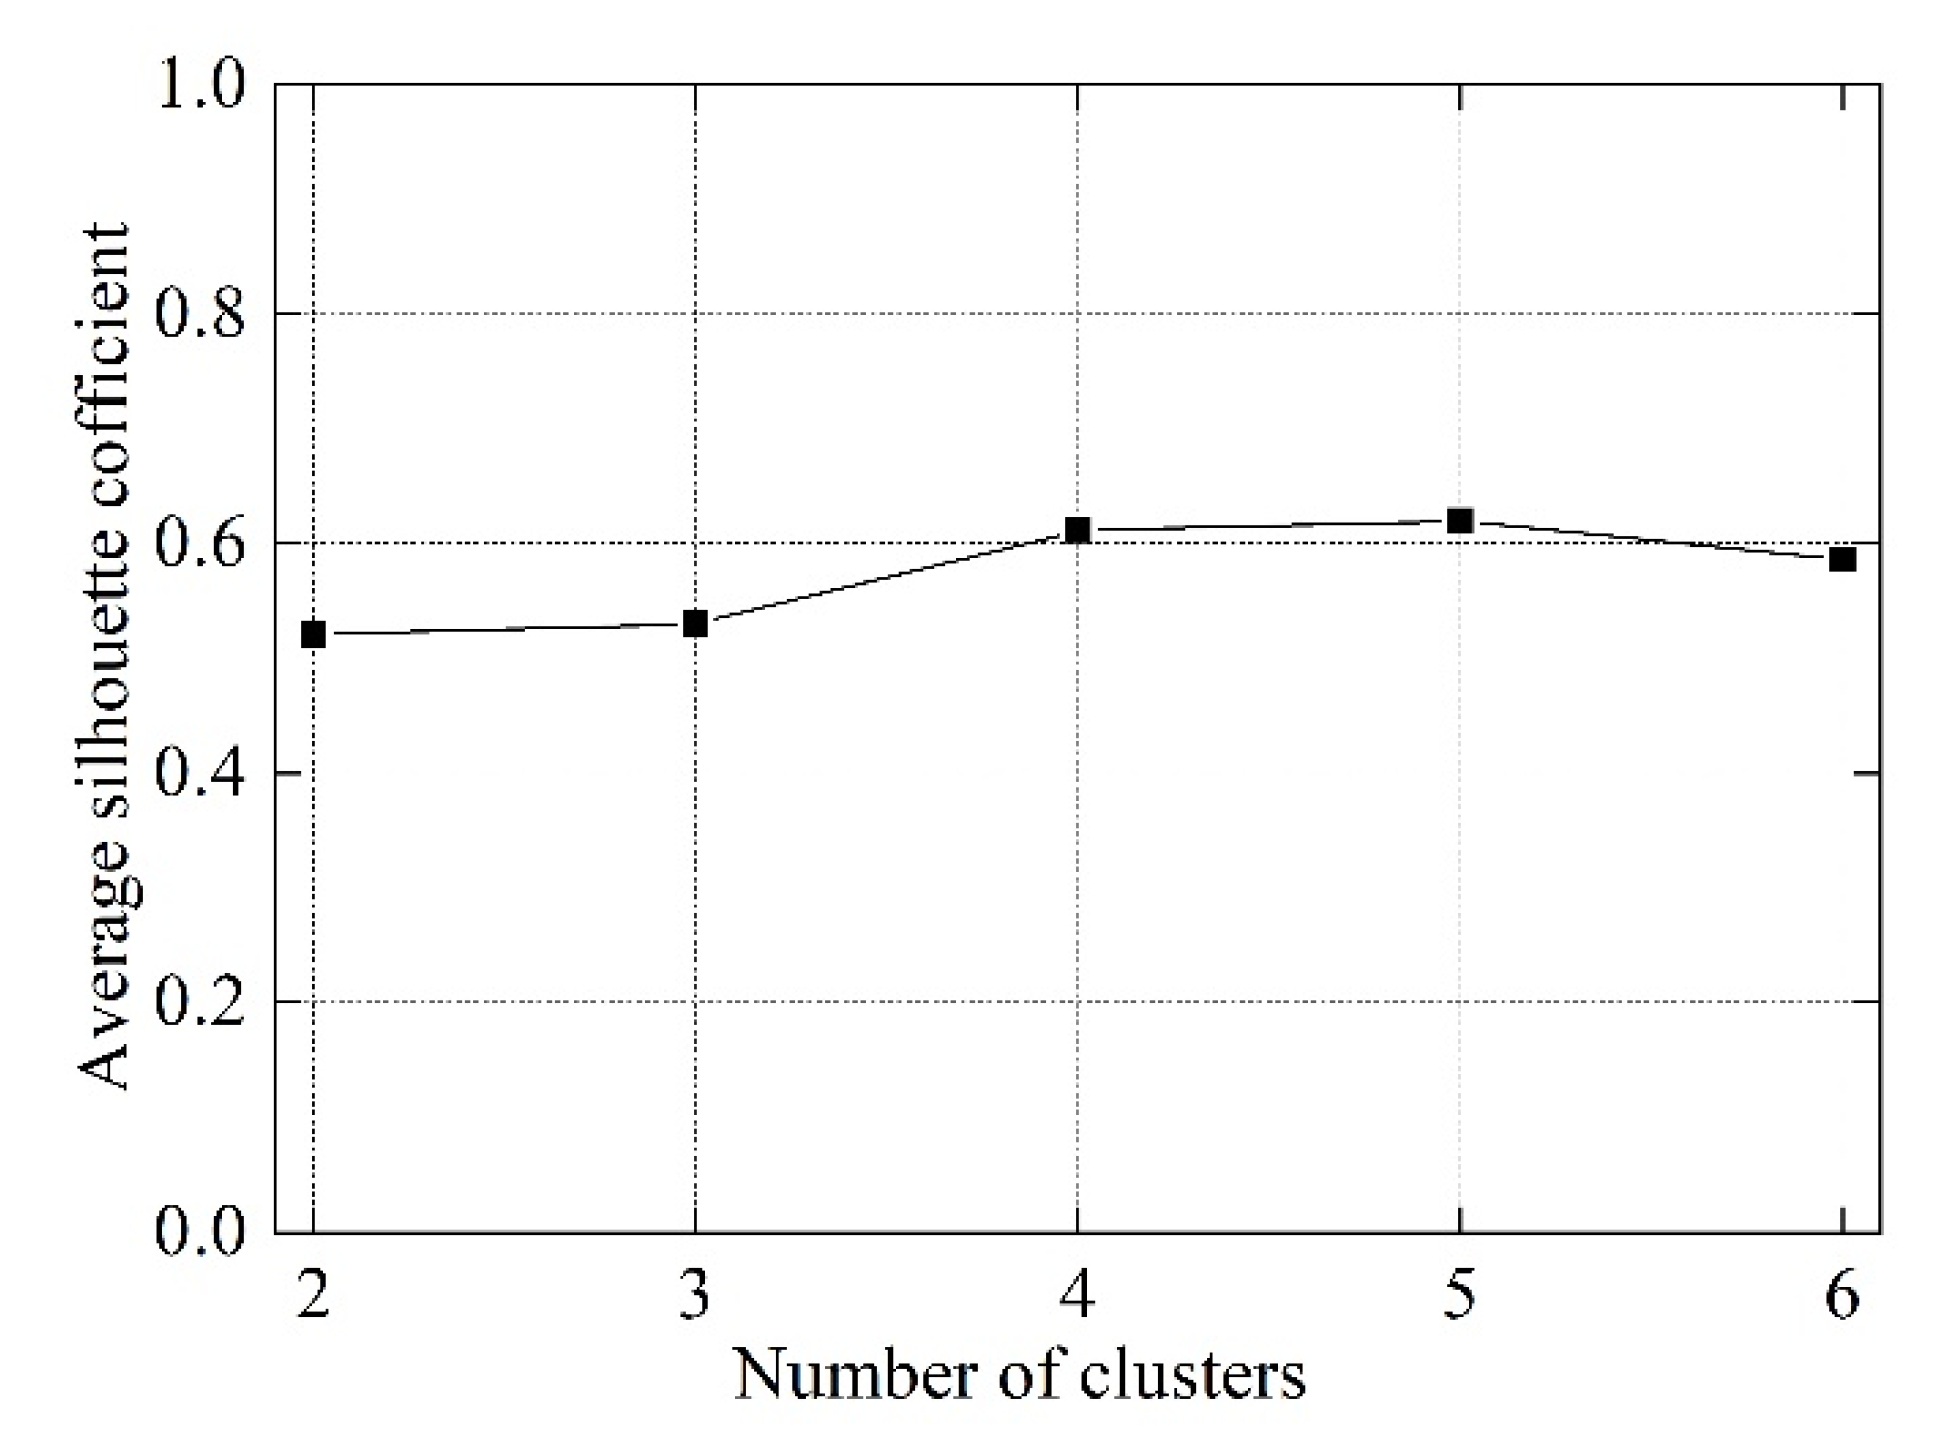
Among them, if the value of S(xi) is close to 1, it means that xi is correctly assigned to the appropriate cluster; if the value of S(xi) is close to 0, it means that xi can be assigned to this cluster or other clusters, because the average distance from xi to the other clusters is equal; if the value of S(xi) is close to −1, it means that xi is misclassified. Calculate the silhouette coefficients of all the sample points and their average value, which is called the average silhouette coefficient, to represent the effectiveness of the current clustering result. In this paper, k is set from 2 to 6. Calculate the average silhouette coefficient corresponding to each k value and use the k value with the larger average silhouette coefficient as the final clustering number of the discontinuity set. It can be seen from Figure 5, the number of clusters corresponding to the maximum average silhouette coefficient for the rock slope is 5, which means that the optimal number of clusters for the rock slope is 5.

2.4. Discontinuity Set Segmentation

DBSCAN is a common method used to automatically extract each discontinuity in a discontinuity set. In previous studies [9,49], DBSCAN has successfully extracted a single discontinuity from the discontinuity set. However, an obvious disadvantage of the DBSCAN is that many parameters need to be adjusted. For data sets with large changes in density, it is difficult to adjust the parameters [9,27,30,50]. Focusing on the difficulty of parameter adjustment using the DBSCAN to process the data with uneven variations in density, this paper proposes the use of the HDBSCAN to segment discontinuity sets. HDBSCAN was proposed by Campello et al. [38], and was originally used to classify various data sets. Its basic principle is to introduce the idea of hierarchical clustering on the basis of the DBSCAN in order to generate a hierarchy based on density clustering, from which the discontinuity can be extracted more effectively. A detailed introduction of the HDBSCAN can be found in [50,51].
The HDBSCAN is based on the mutual reachability graph of a certain Min-pts to reflect the reachable distance between any sample points. Min-pts is the minimum number of neighbors of point q that regards q as a core point. The reachable distance between any two points p and q of a certain Min-pts can be expressed by Formula (8):
d m r e a c h ( p , q ) = max { c o r e ( p ) , c o r e ( q ) , d ( p , q ) }
where d(p,q) represents the distance between p and q and core(p) represents the distance between the core point p and the Min-pts point. Similarly, the representation of core(q) is the same. Therefore, when Min-pts becomes larger, the core(p) will accordingly become larger. The steps to segment a single discontinuity from the discontinuity set based on HDBSCAN are as follows: (a) calculate the core distance of the sample point, that is, the Euclidean distance between each sample point and the Min-pts sample point; (b) calculate the reachable distance between sample points using Formula (8) and define it as the distance of the two sample points. The advantage of this process is that the distance of the sample points in the dense area is not affected, while the distance between the sample points in the sparse area and other sample points is enlarged; (c) construct a mutual reachability graph based on the reachable distance between every two sample points, where the sample points are vertices, and the edge between any two points is their reachable distance and (d) delete the long edge in the mutual reachability graph, and output the best segmentation result, that is, divide each discontinuity set into a single discontinuity (Figure 6).
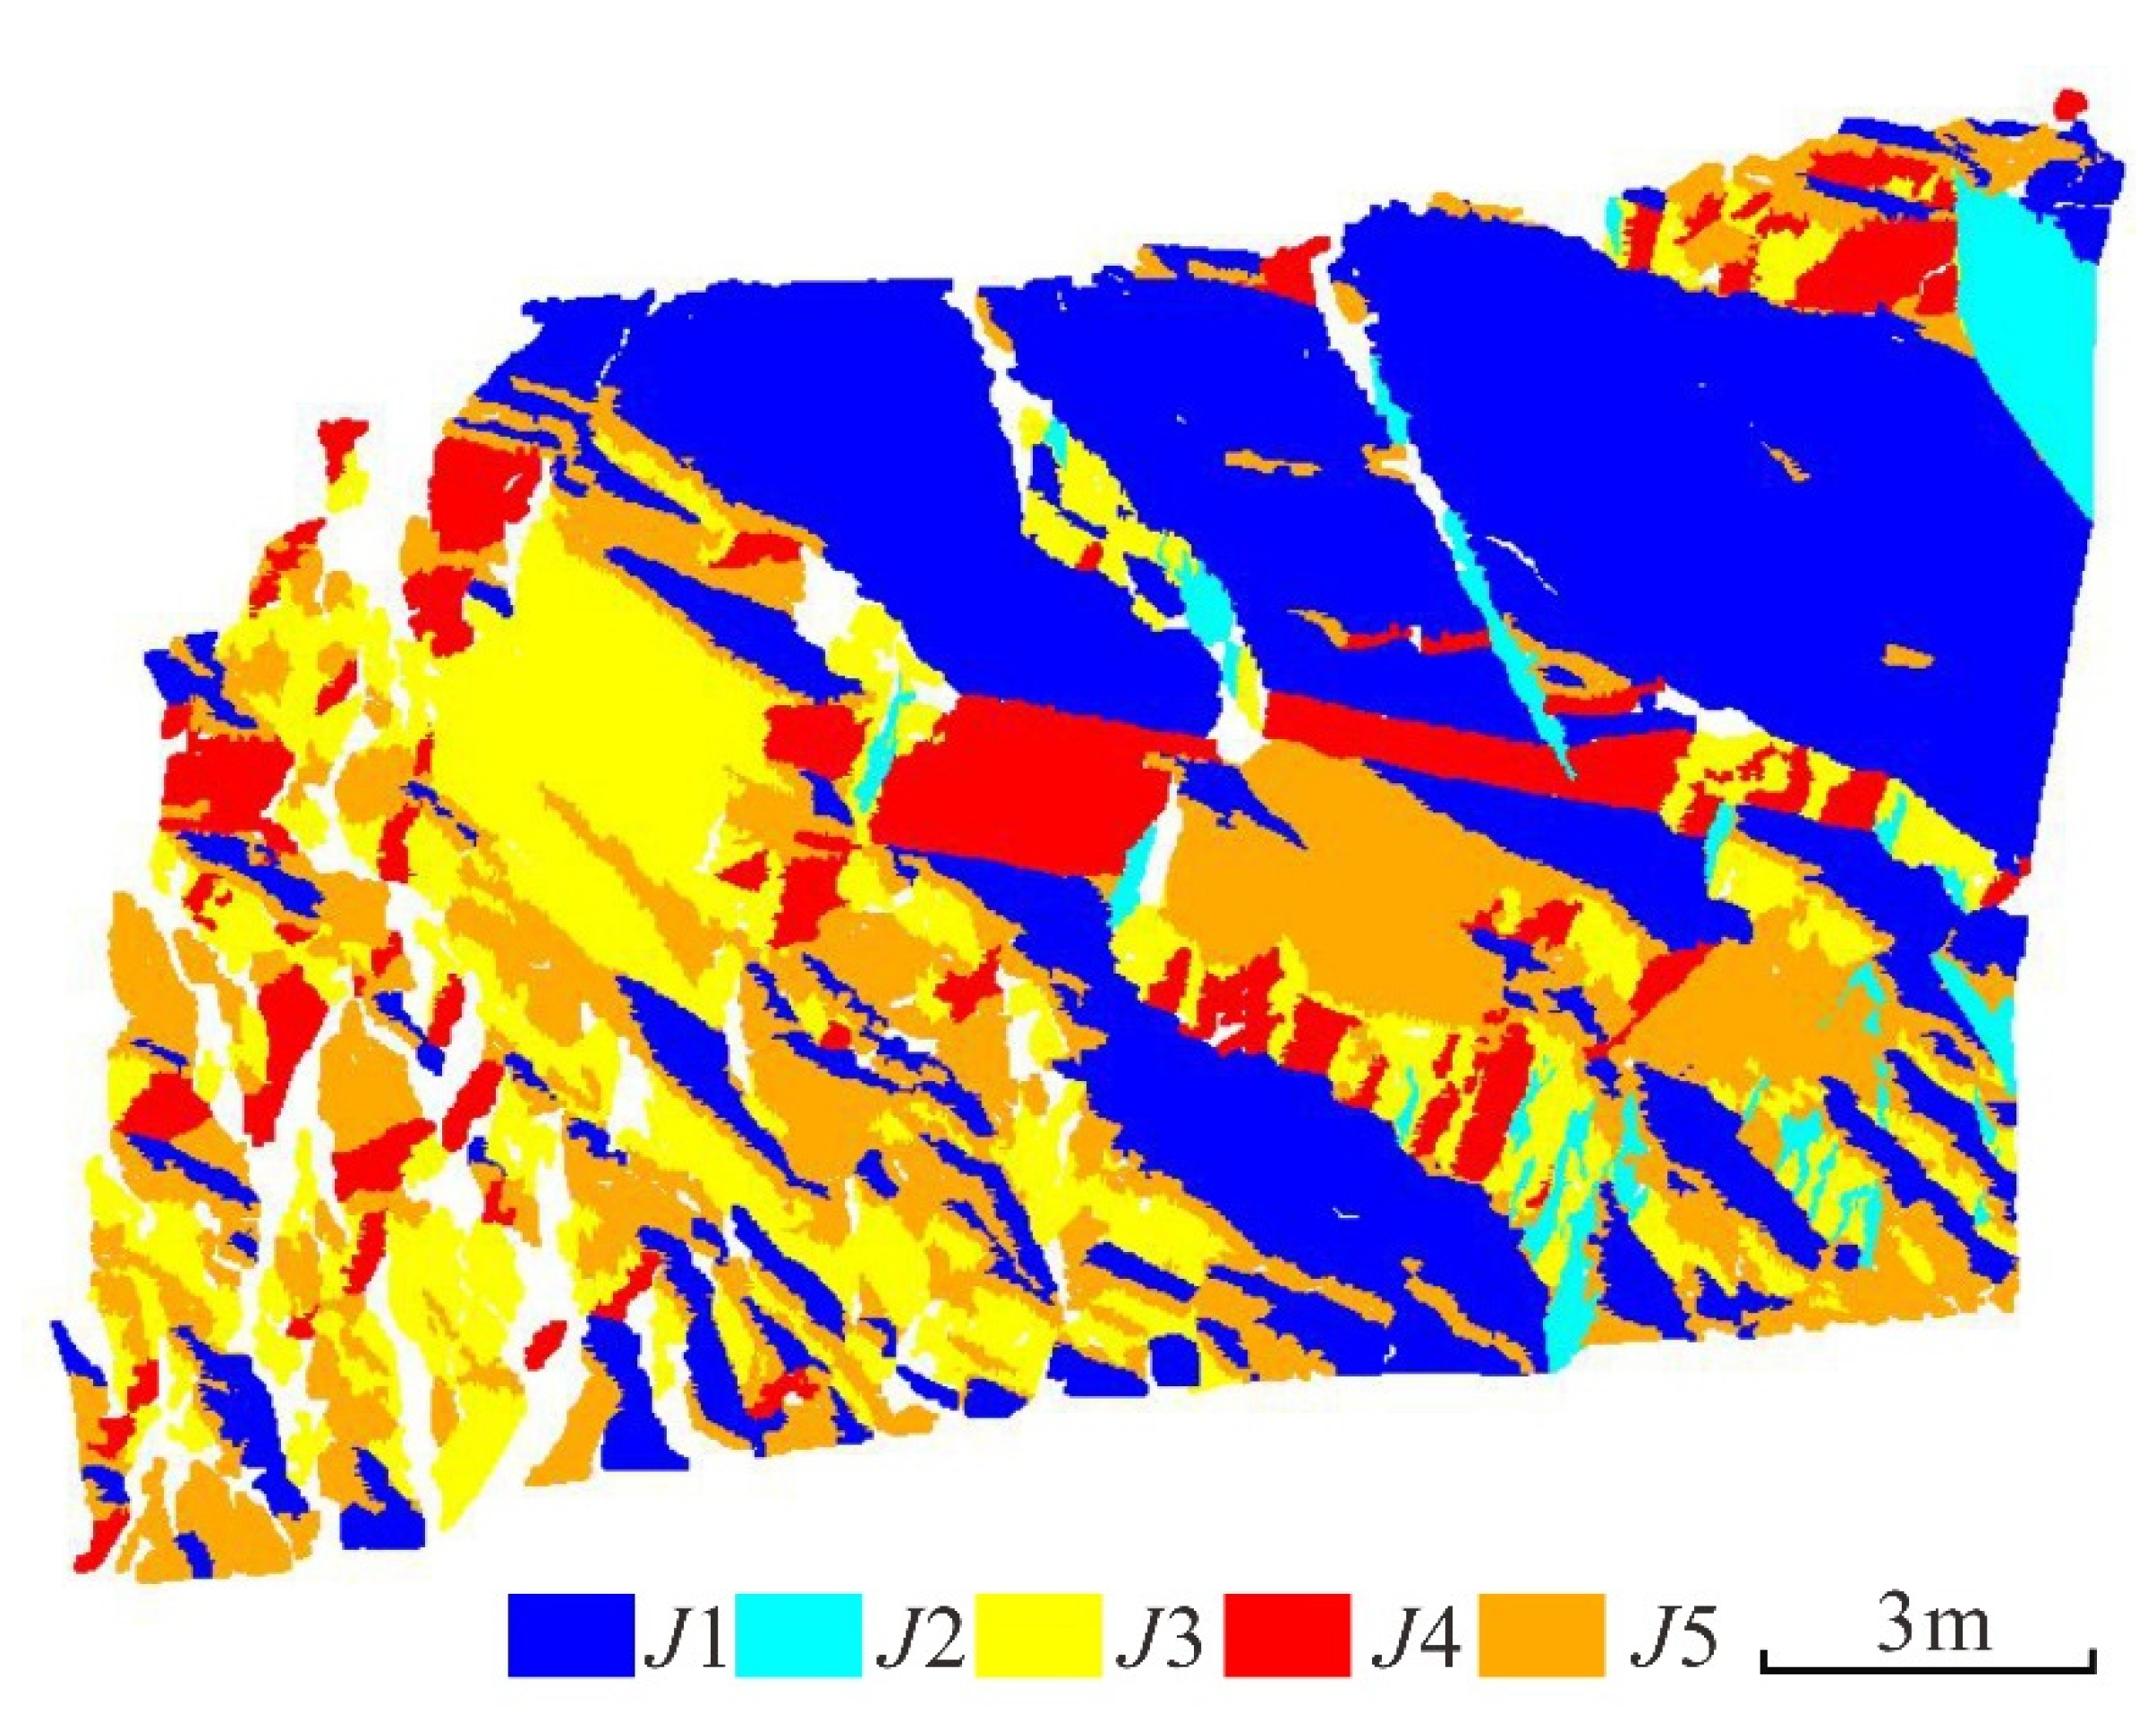
For the only parameter, Min-pts, that needs to be set at HDBSCAN, Campello et al. [38] suggested starting to search from the least neighboring points without prior knowledge. Therefore, this paper starts from 2 and gradually increases the value of Min-pts. In addition, a large number of small discontinuities may be detected in the rock slope. In practical applications, we may only need to extract large discontinuities. Therefore, a threshold Min-size, which is the minimum number of triangles to extract discontinuity, needs to be set to delete these small discontinuities. Combined with the actual situation of this paper, set the Min-size to 50. Figure 7 shows the segmentation results of the rock slope using the HDBSCAN, with blue, cyan, yellow, red, and orange representing five discontinuity sets.
Table 1 shows the results of the new method proposed alongside those of Riquelme et al. [40]. From Table 1, it can be seen that the new method proposed has a similar effect on the discontinuity direction of the rock slope to that found by Riquelme et al. [40]. The results of both are consistent. The maximum dip direction deviation Δ|DD| is 2.95°, the minimum is 0.02°, the maximum dip angle deviation Δ|DA| is 3.72°, and the minimum is 0.94°.

2.5. Discontinuities Fitting

After segmenting the discontinuity set into single discontinuities based on the HDBSCAN algorithm, we only obtained an approximate plane, which was usually rough and wavy. It was necessary to fit the discontinuity in order to obtain its orientation. Riquelme et al. [40] mostly selected representative point clouds in a discontinuity or manually adjusted the area with large fluctuations in order to fit the plane, which is time-consuming and subjective. Therefore, Fischler and Bolles [52] proposed the use of the Random Sampling Consistency (RANSAC) method to fit rough and undulating planes. The fitting process is as follows: (1) randomly select three points on the plane subset and define the plane equation; and (2) set a threshold d, calculate the distance from other points in the plane subset to the plane. If the distance is less than d, then take the point as the interior point of the plane and count the number of interior points. (3) Repeat steps (1) and (2), and the plane with the largest number of interior points will be the best fitted. A detailed RANSAC method is described in [52,53].

2.6. Clustering Results for the Rock Slope

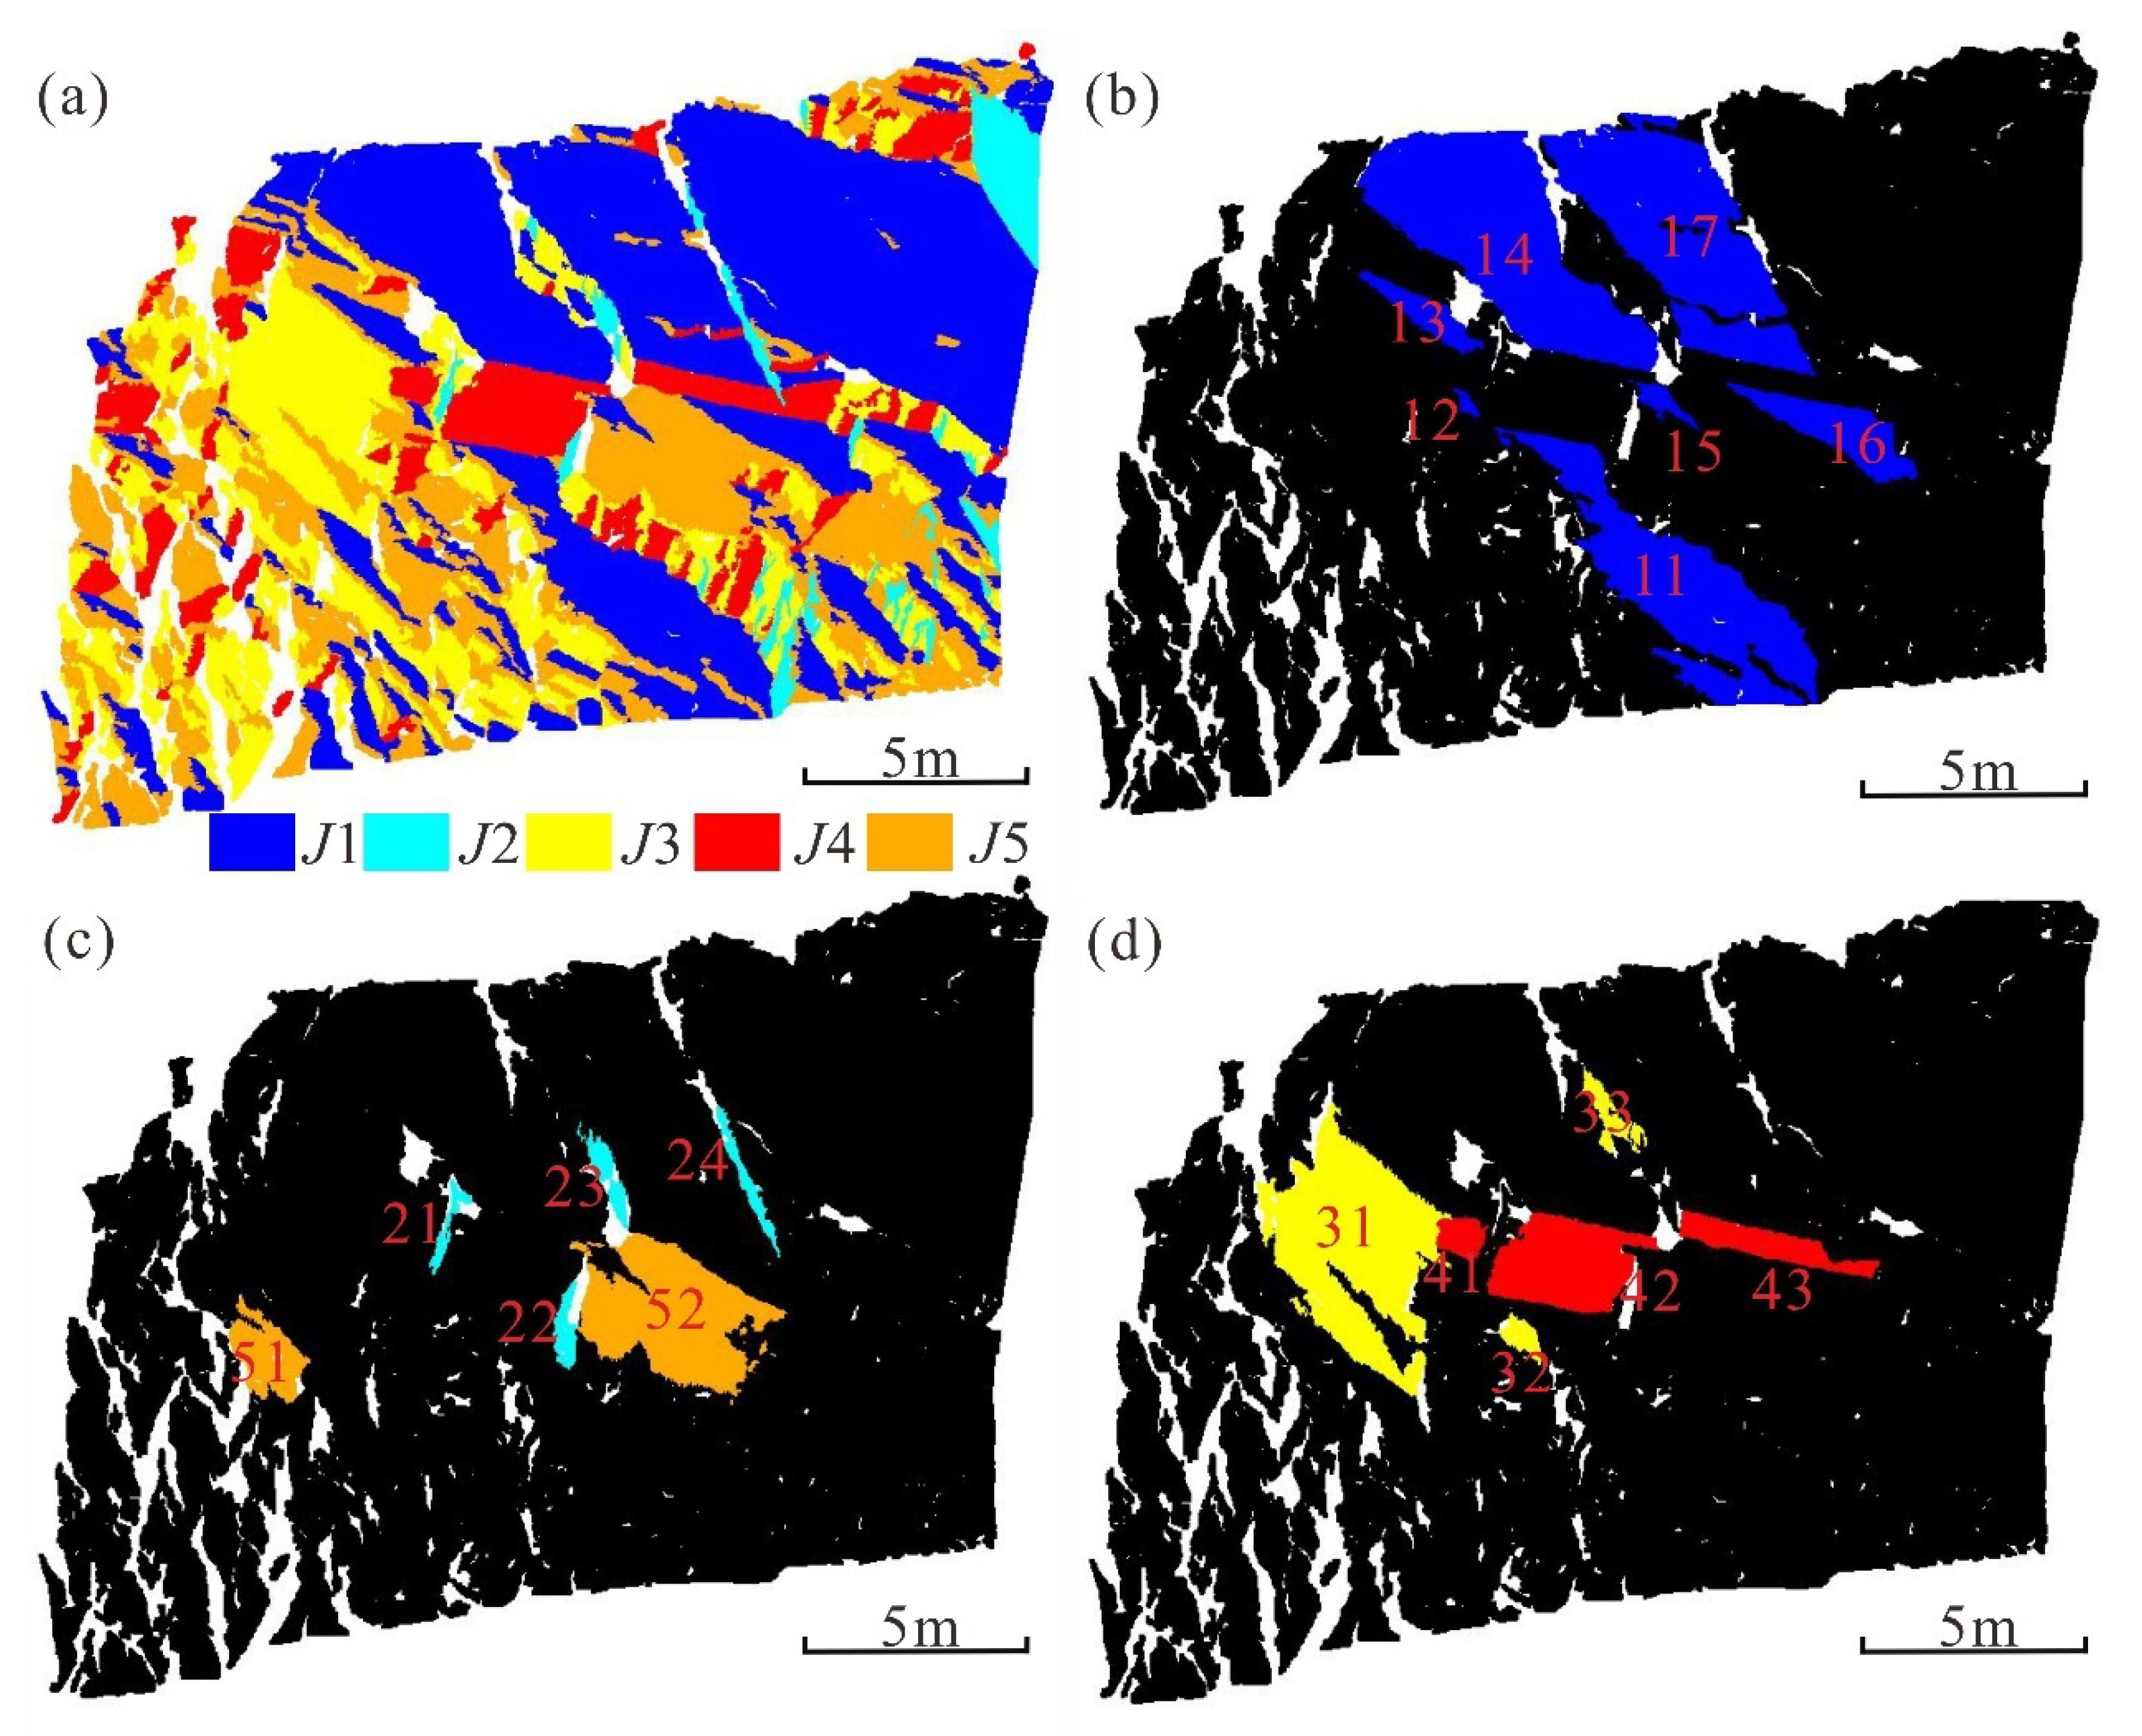
The clustering results of the rock slope using the new method are shown in Figure 8a. After segmentation, the discontinuities in the same discontinuity set are represented by the same color. To facilitate a comparison with the research results, Riquelme et al. [40] selected 19 discontinuities of the rock slope in 2014, of which the first discontinuity set took seven discontinuities (Figure 8b), the second and fifth discontinuity sets took four and two discontinuities, respectively (Figure 8c), and the third and fourth discontinuity sets took three discontinuities, respectively (Figure 8d).
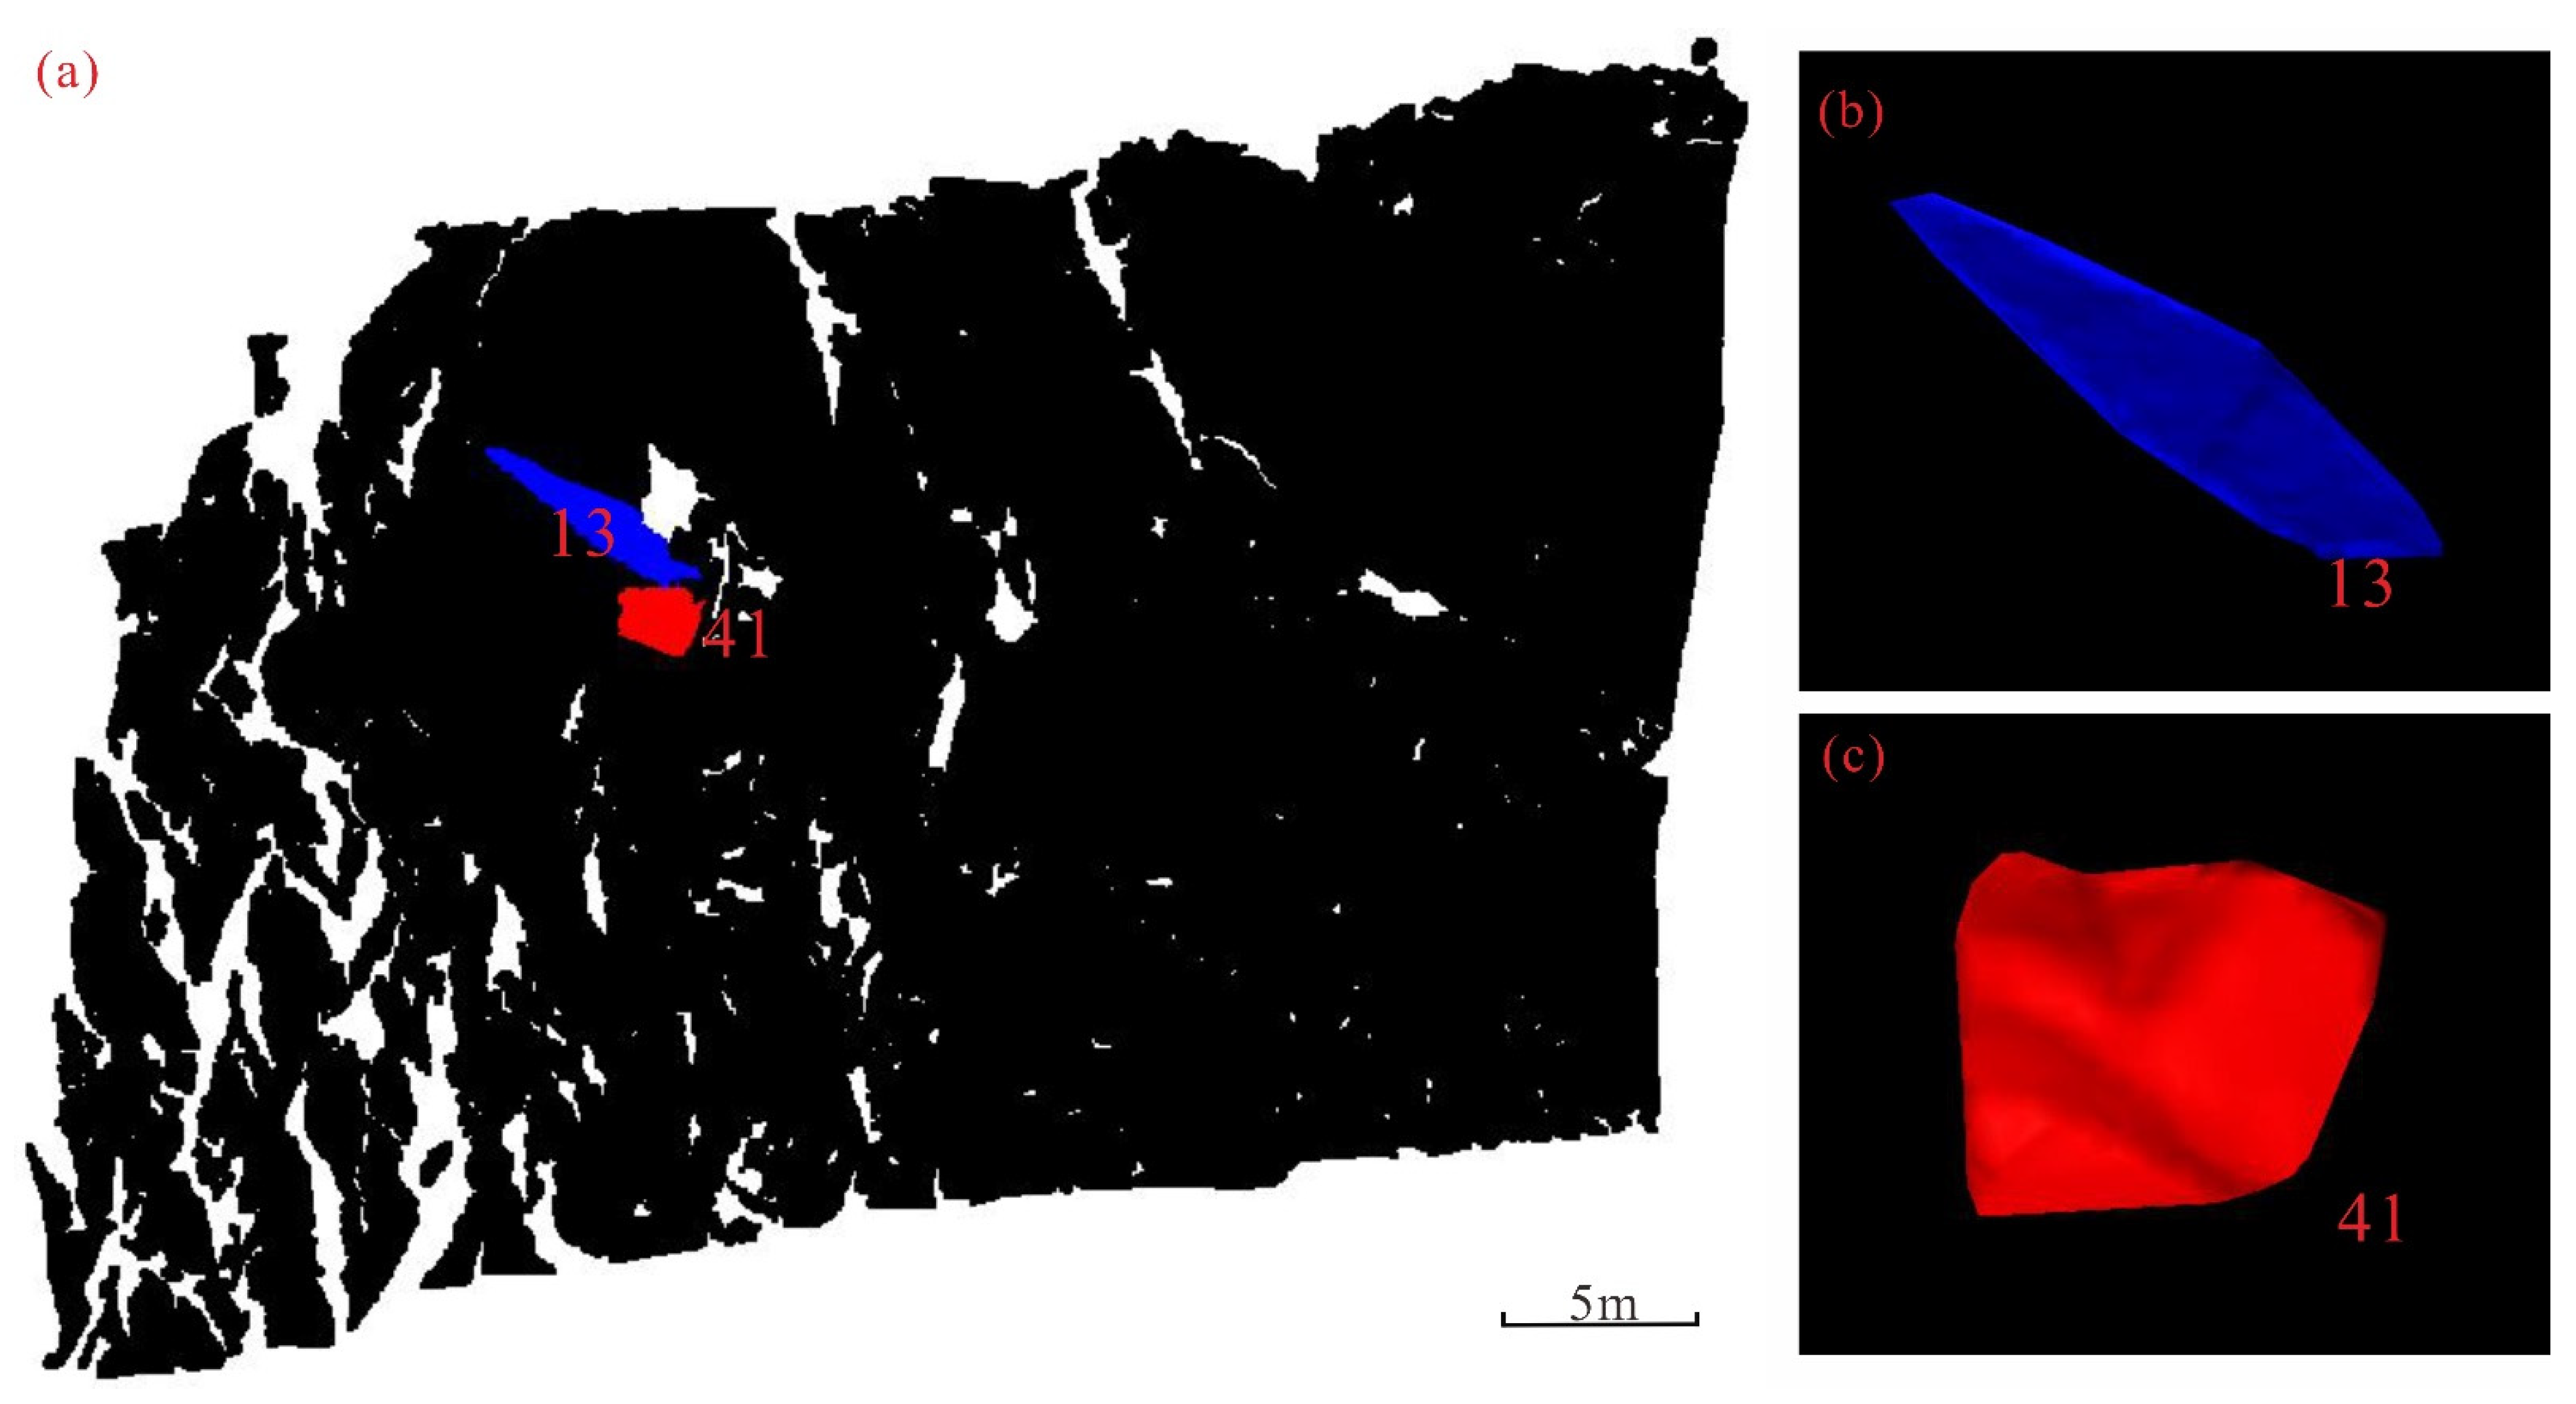
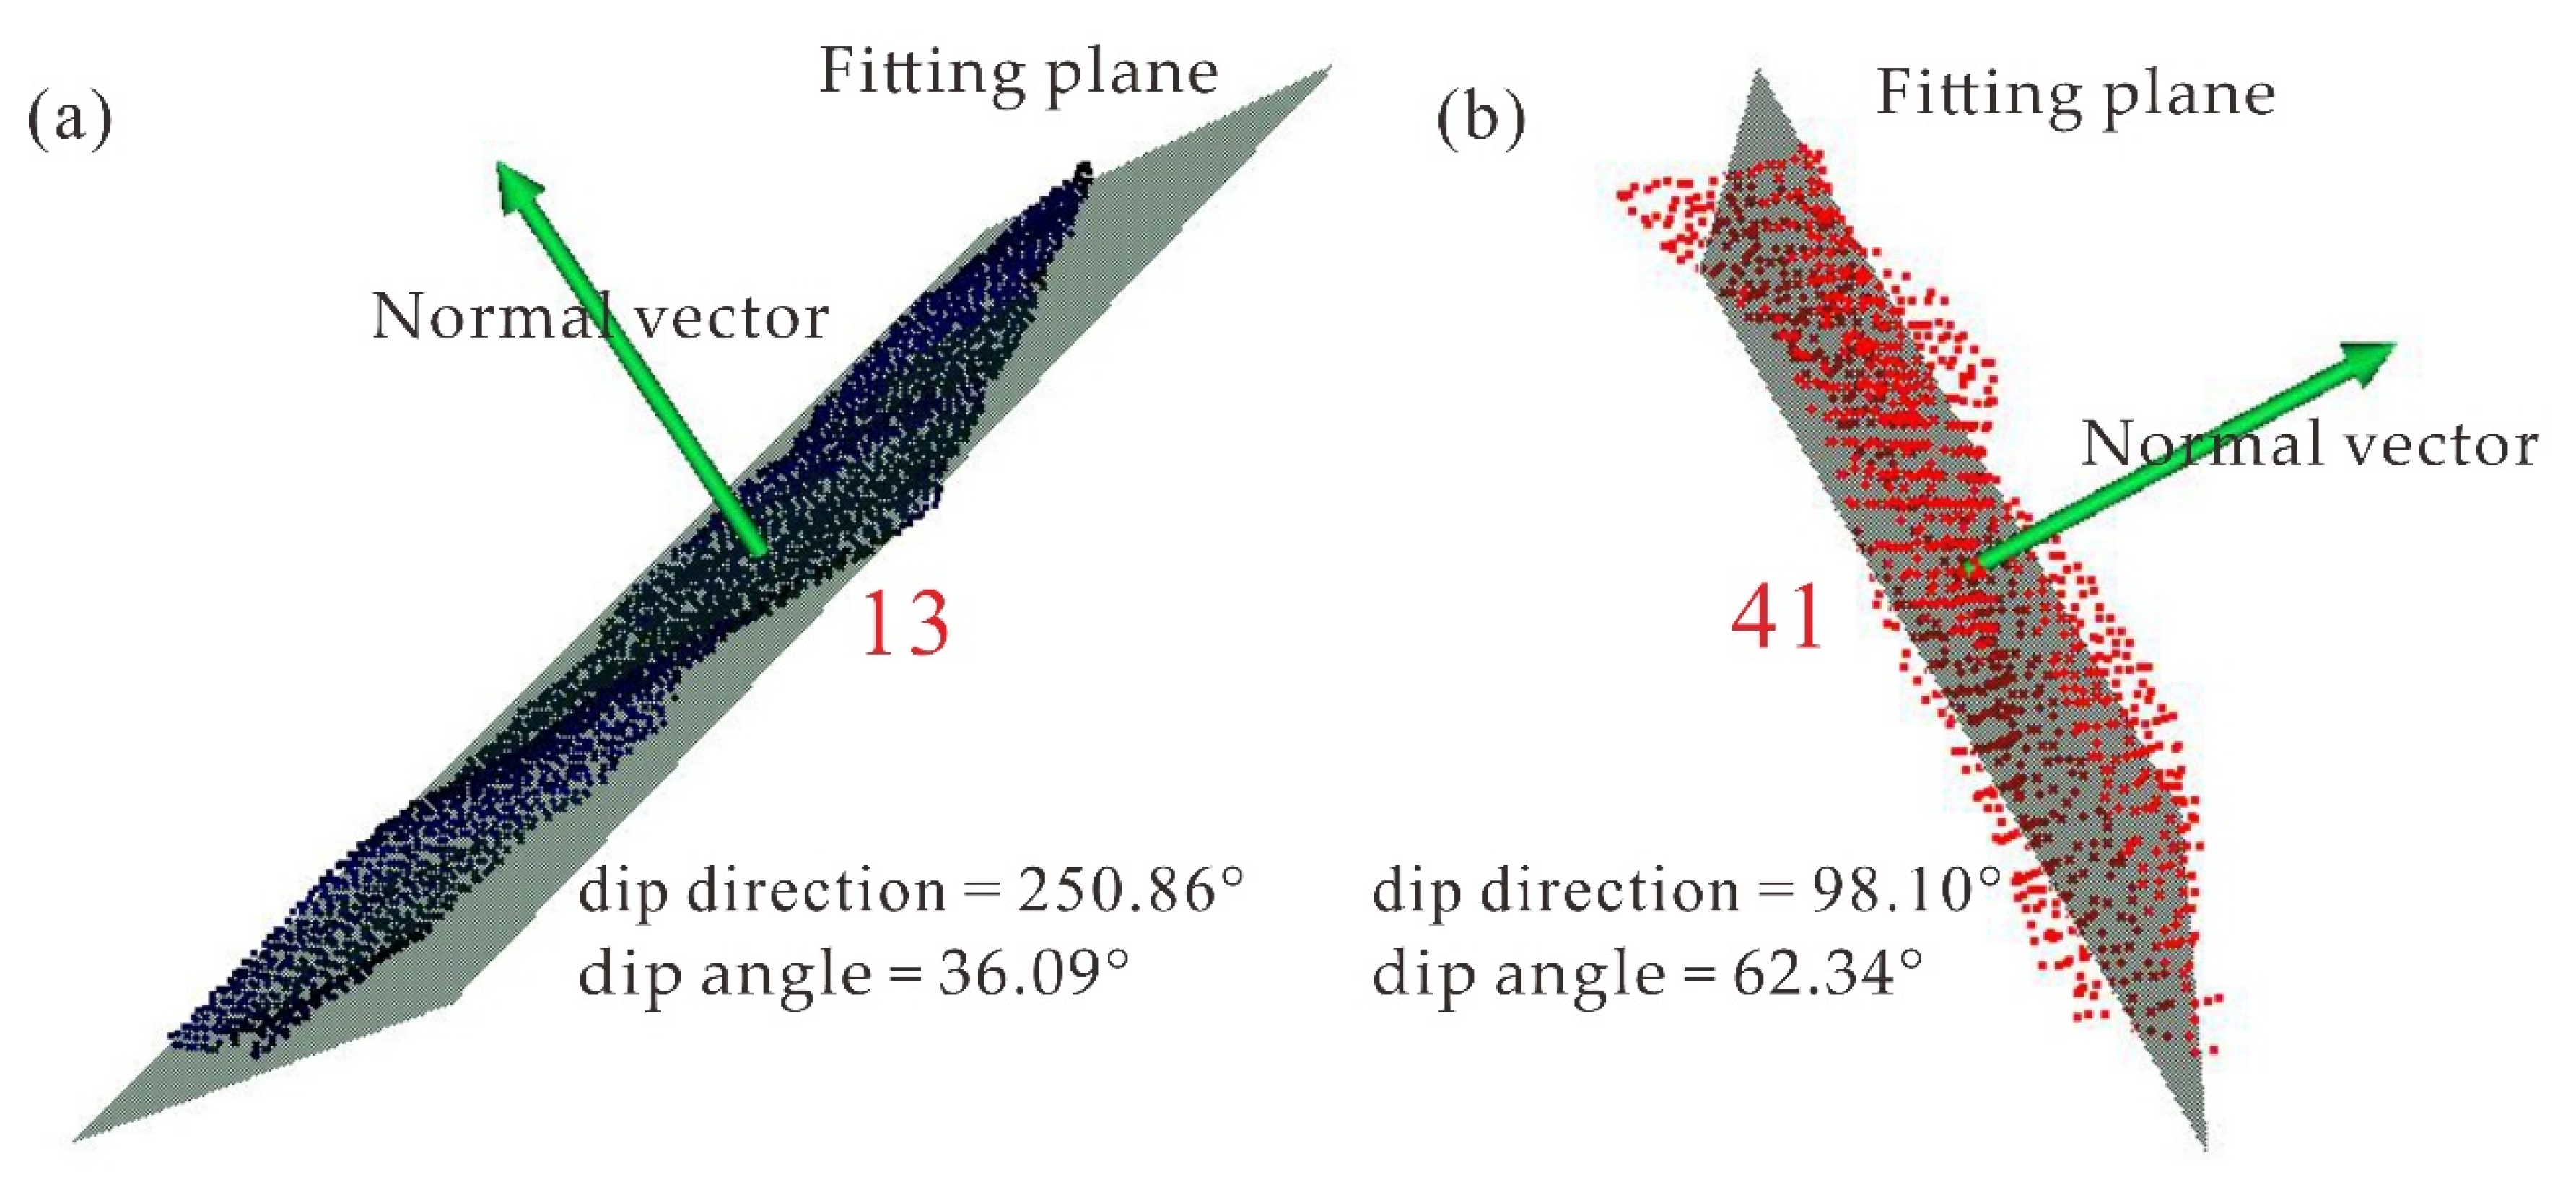
Table 2 lists the precision comparison between the two different automatic methods and the classical approach with best-fit planes using PolyWorks. The results show that the deviations in the dip direction and dip angle of 89.5% discontinuities were between 0–8°, but there were also discontinuities marked as 13 and 41 that had larger deviations.
Figure 9a shows the two discontinuities with the largest deviation, and Figure 9b,c are the enlarged discontinuities marked as 13 and 41, respectively. The areas of these discontinuities are small, and the surface undulations are large, resulting in large deviations between the orientation of the discontinuities using the new method and the classical approach.

3. Workflow Application to an Artificial Quarry Slope

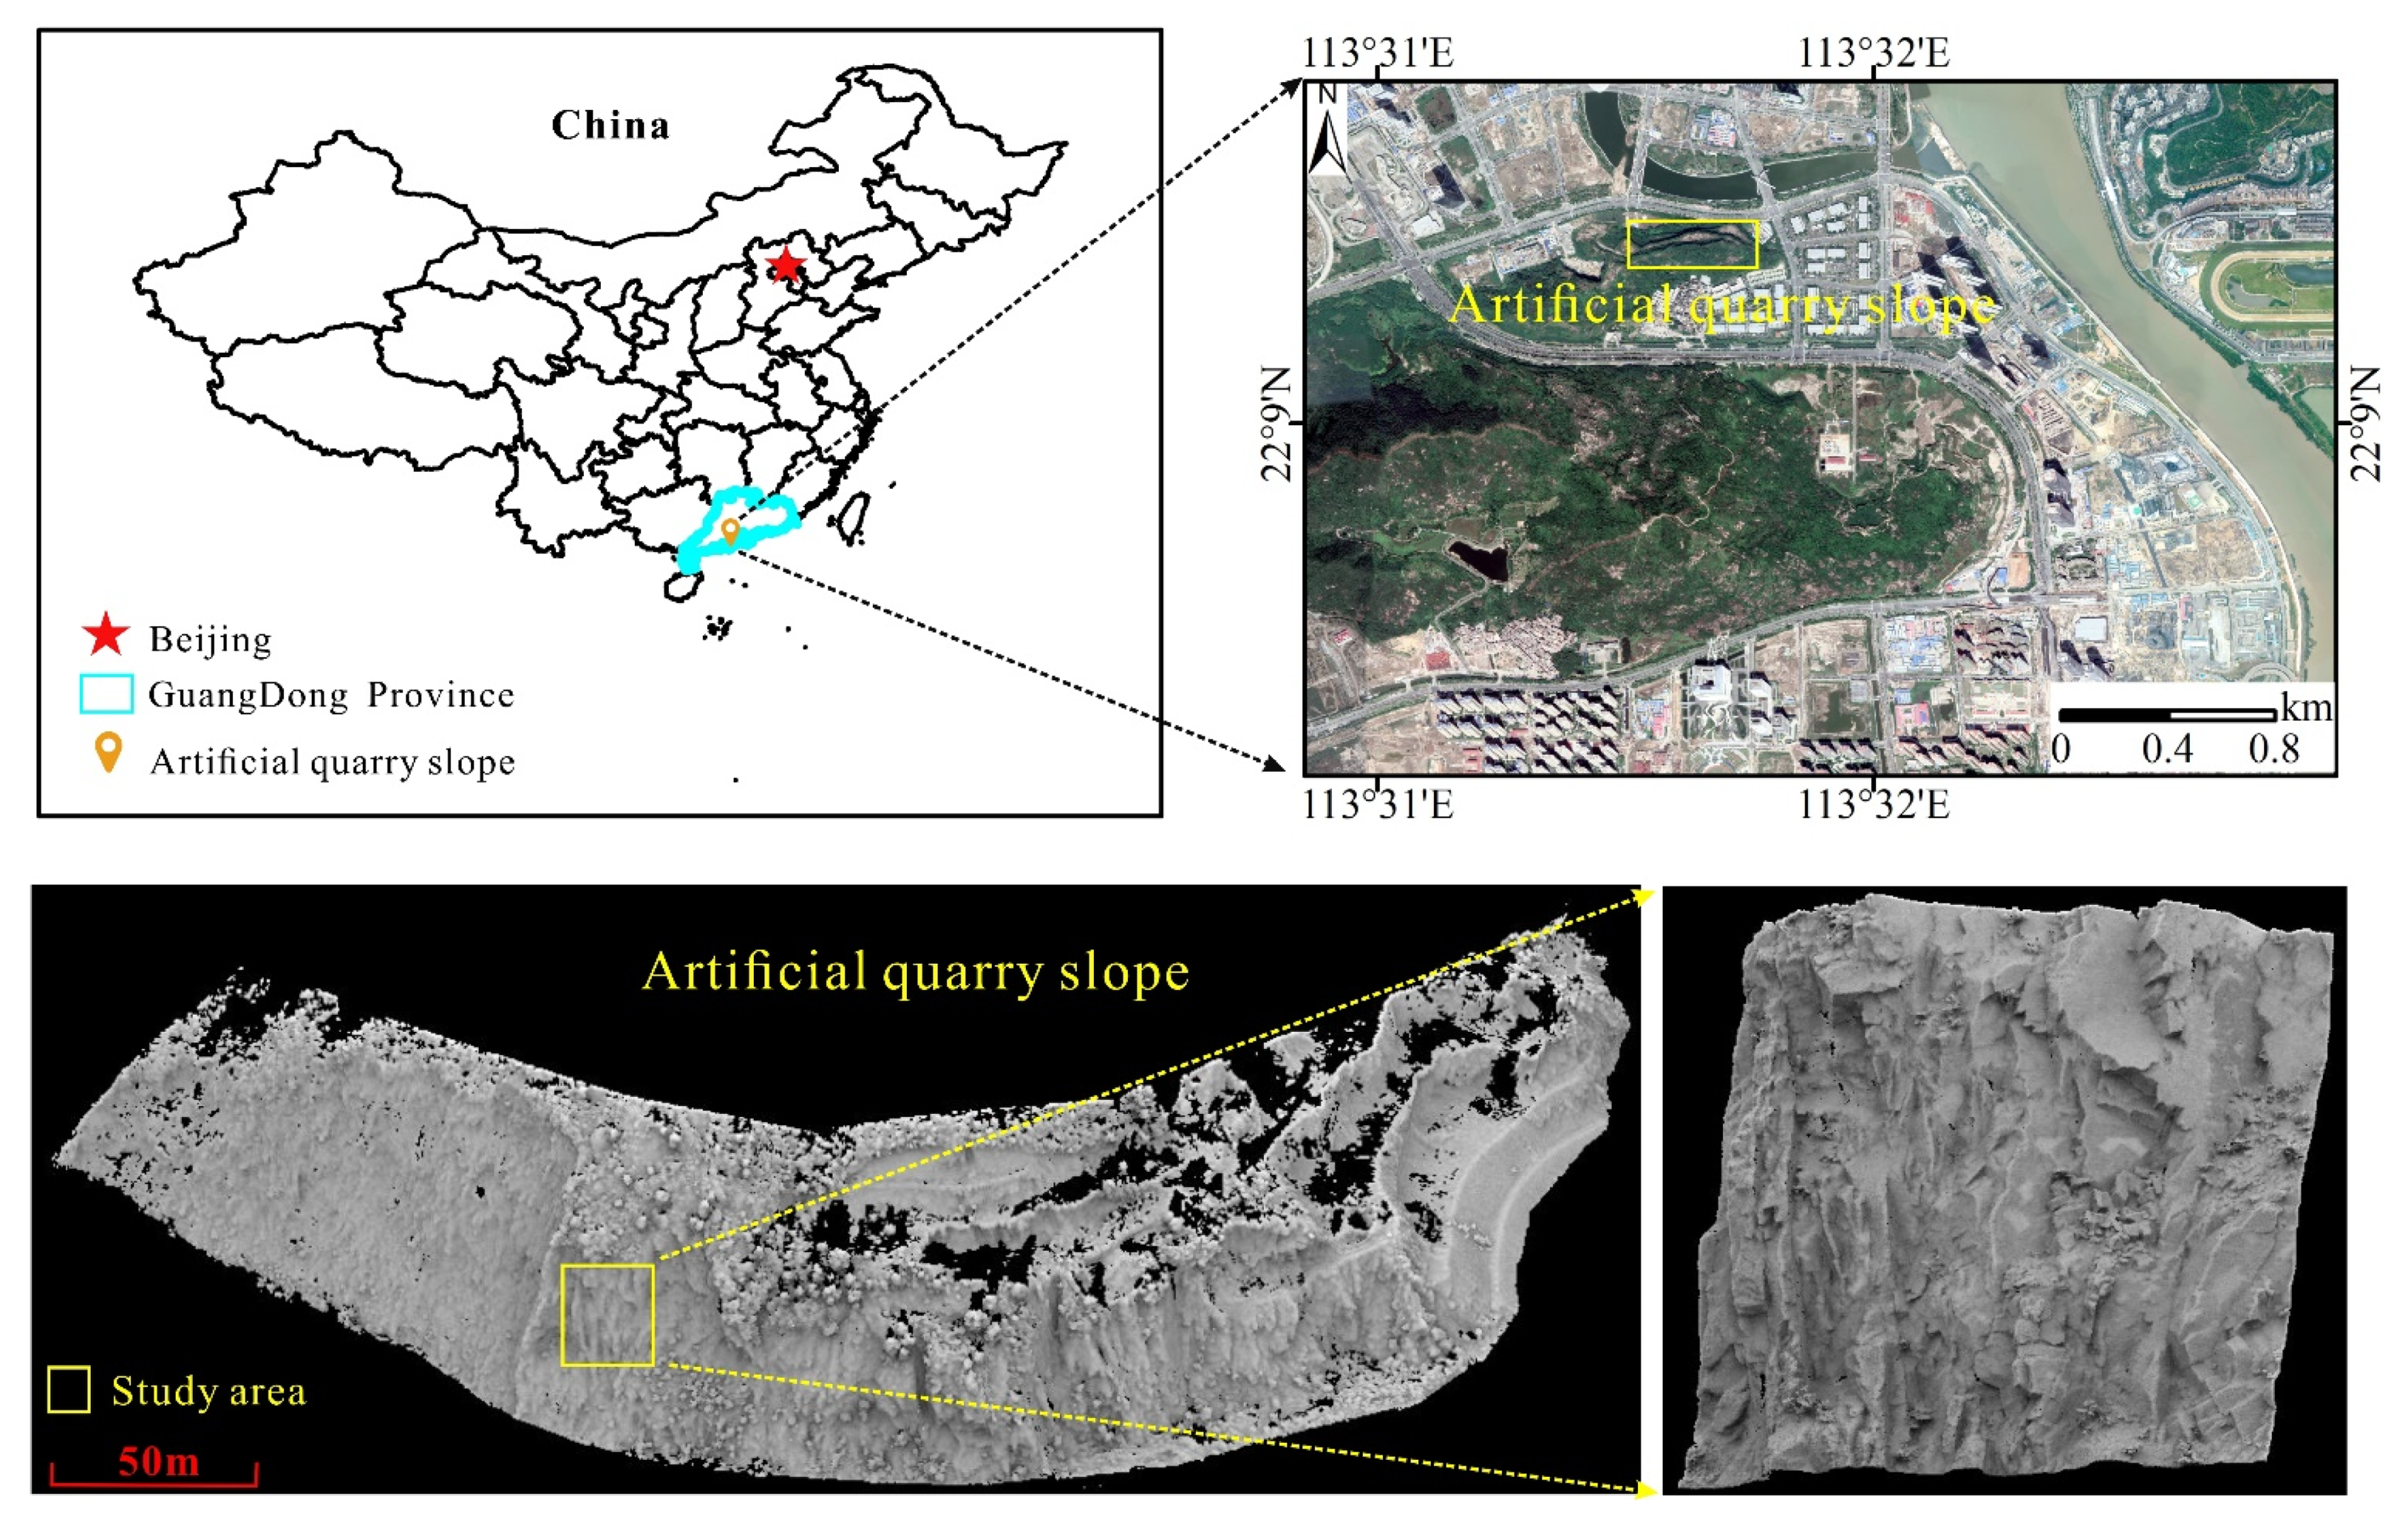
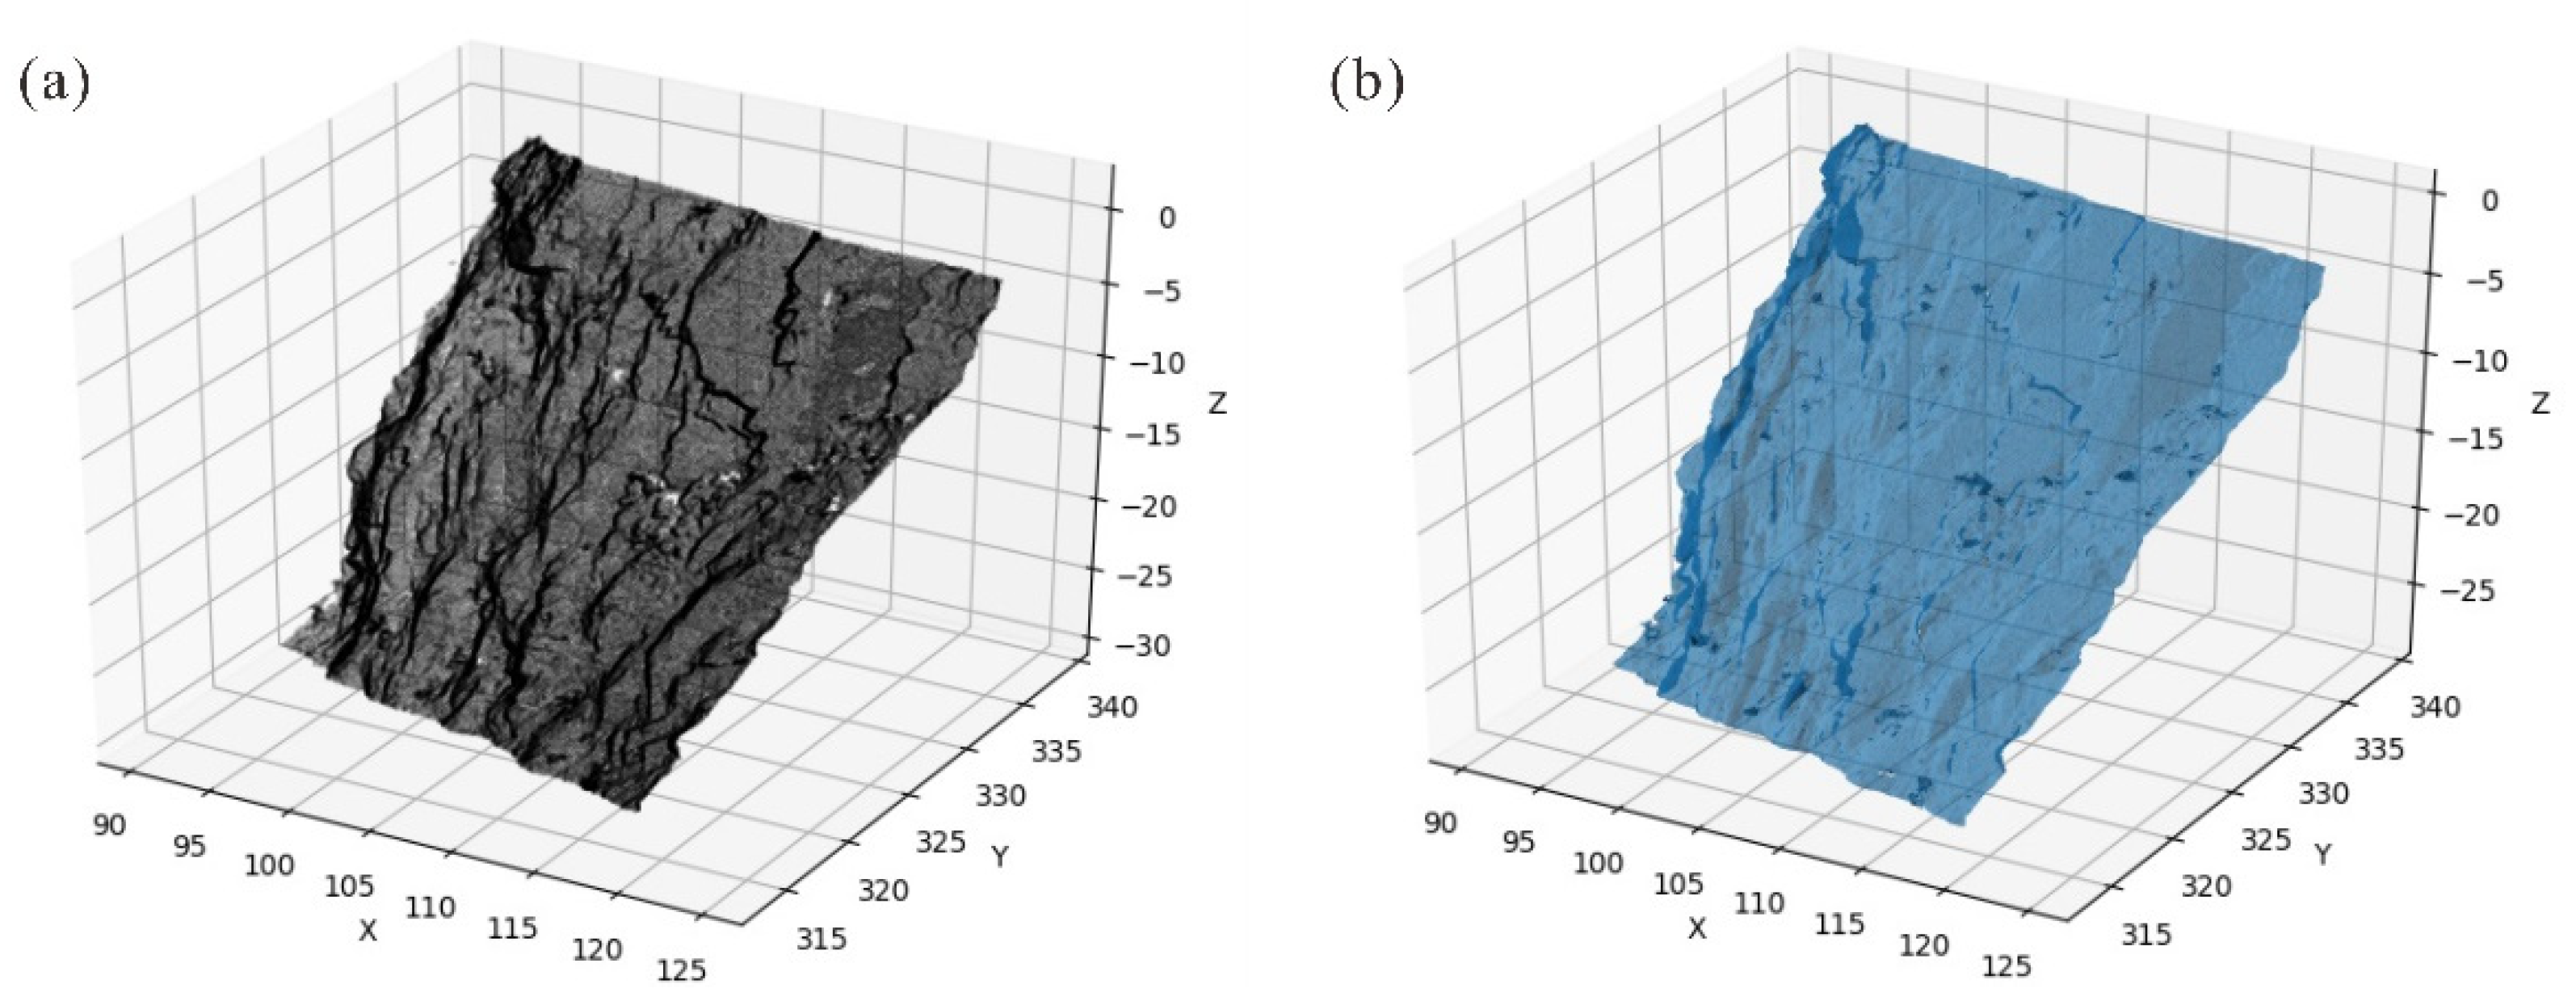
The point clouds of the artificial quarry slope acquired with an ILRIS-3D laser scanner are used to verify whether the proposed new method can be applied to actual rock engineering. The artificial quarry slope is located in Nanshanzui, Hengqin Island, Zhuhai City, Guangdong Province, China. The slope is about 750 m long, 100 m wide, and 100 m high. The exposed section is about 40–70 m high. The ILRIS-3D laser scanner from Optech of Canada with a 10 kHz laser emission frequency and a ranging capability greater than 3 km was used to collect the artificial quarry slope with a resolution of less than 2 cm. The experimental area is part of the artificial quarry slope, as shown in Figure 10. The experimental area is about 30 m long and 35 m high. After preprocessing, the created experimental area TIN consisted of 235,950 surfaces from 120,222 points (Figure 11).

3.1. Clustering Results of the Artificial Quarry Slope

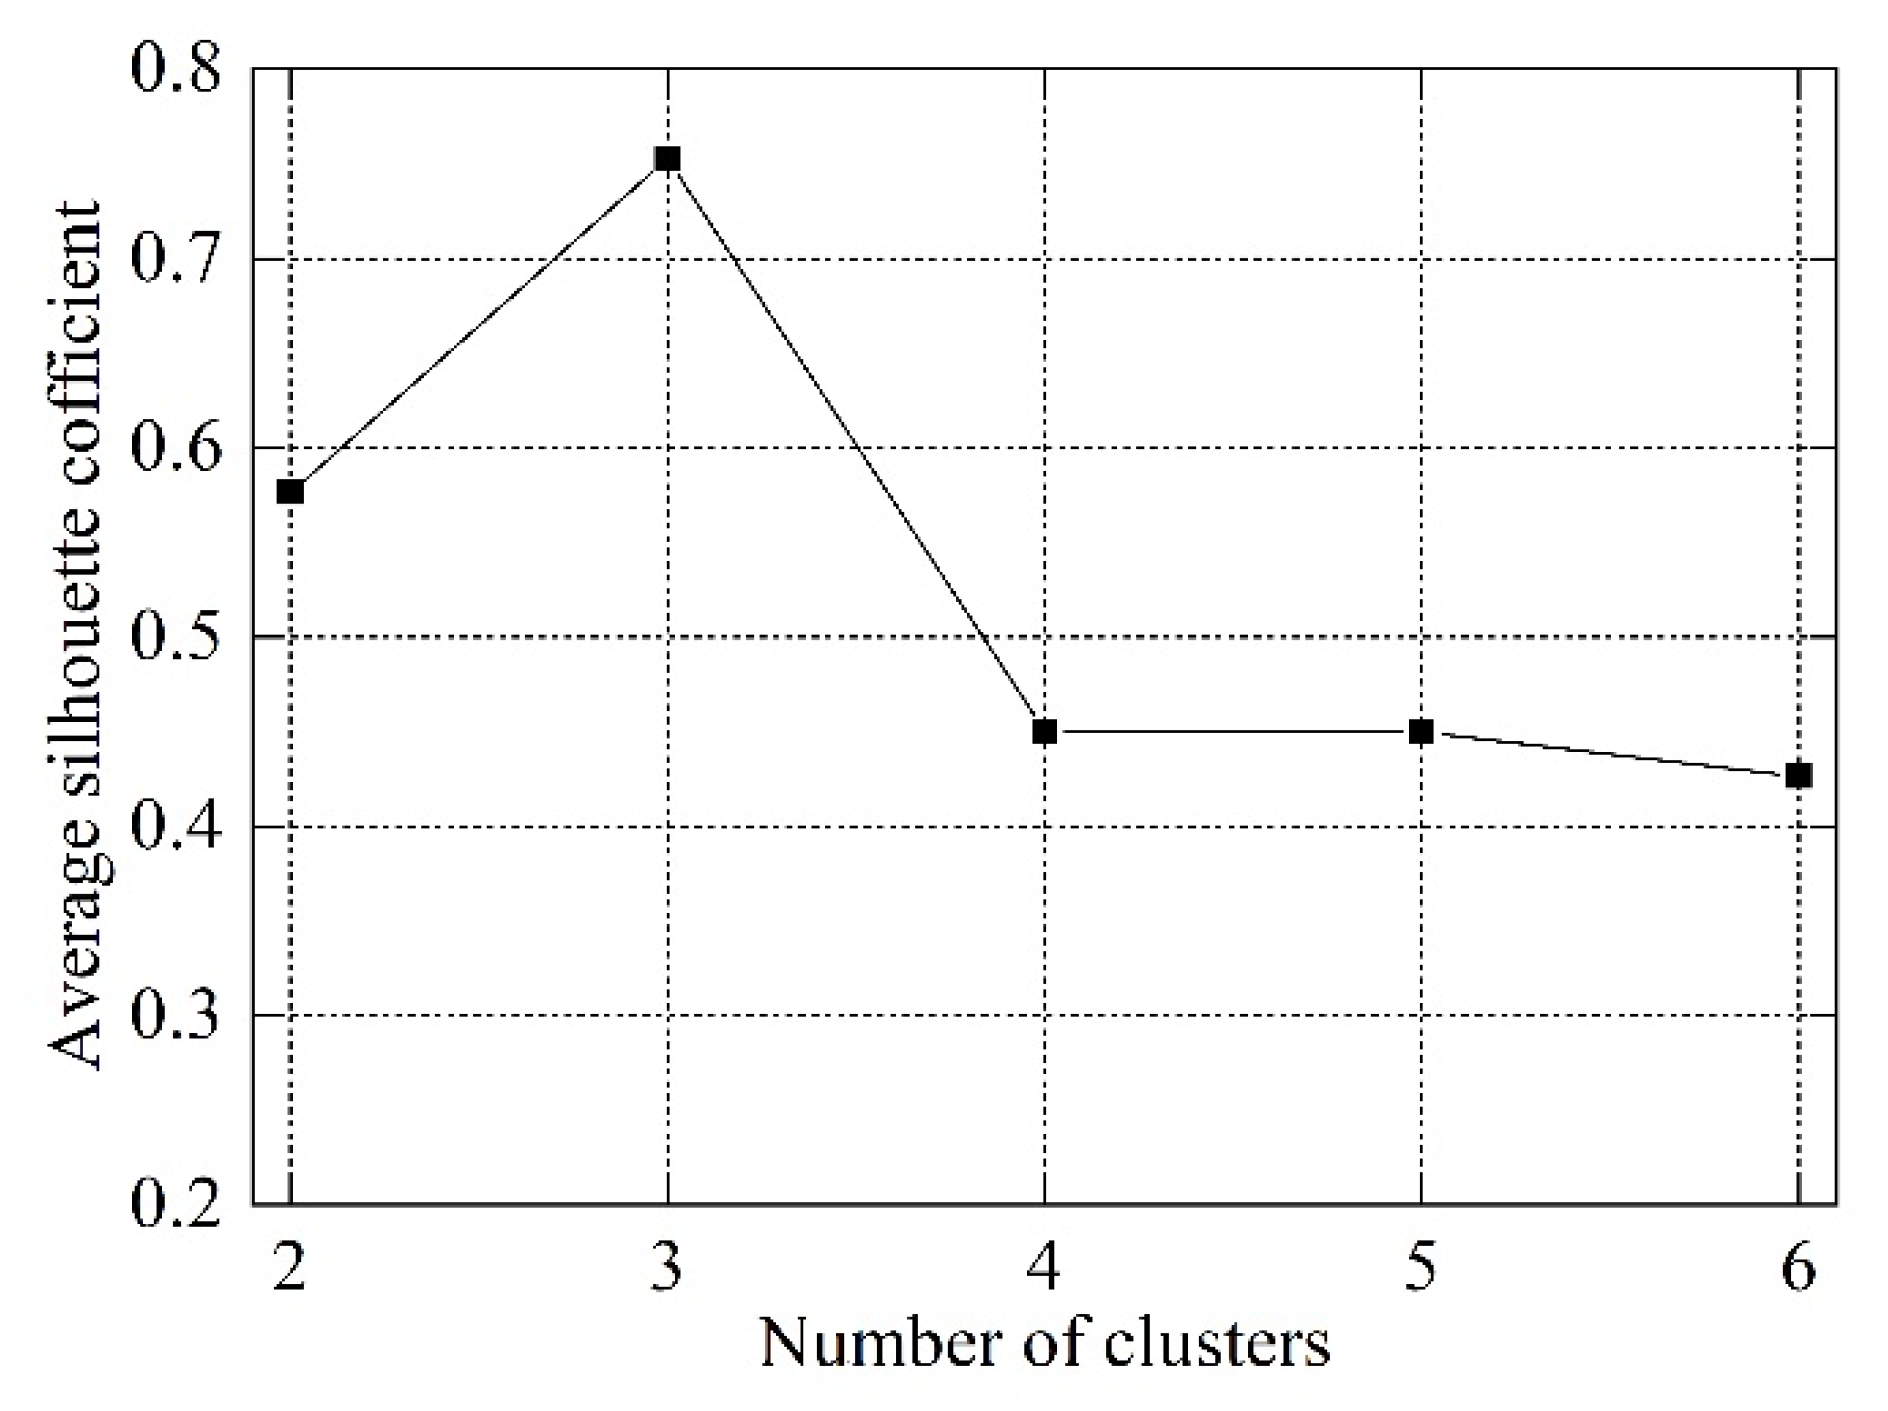
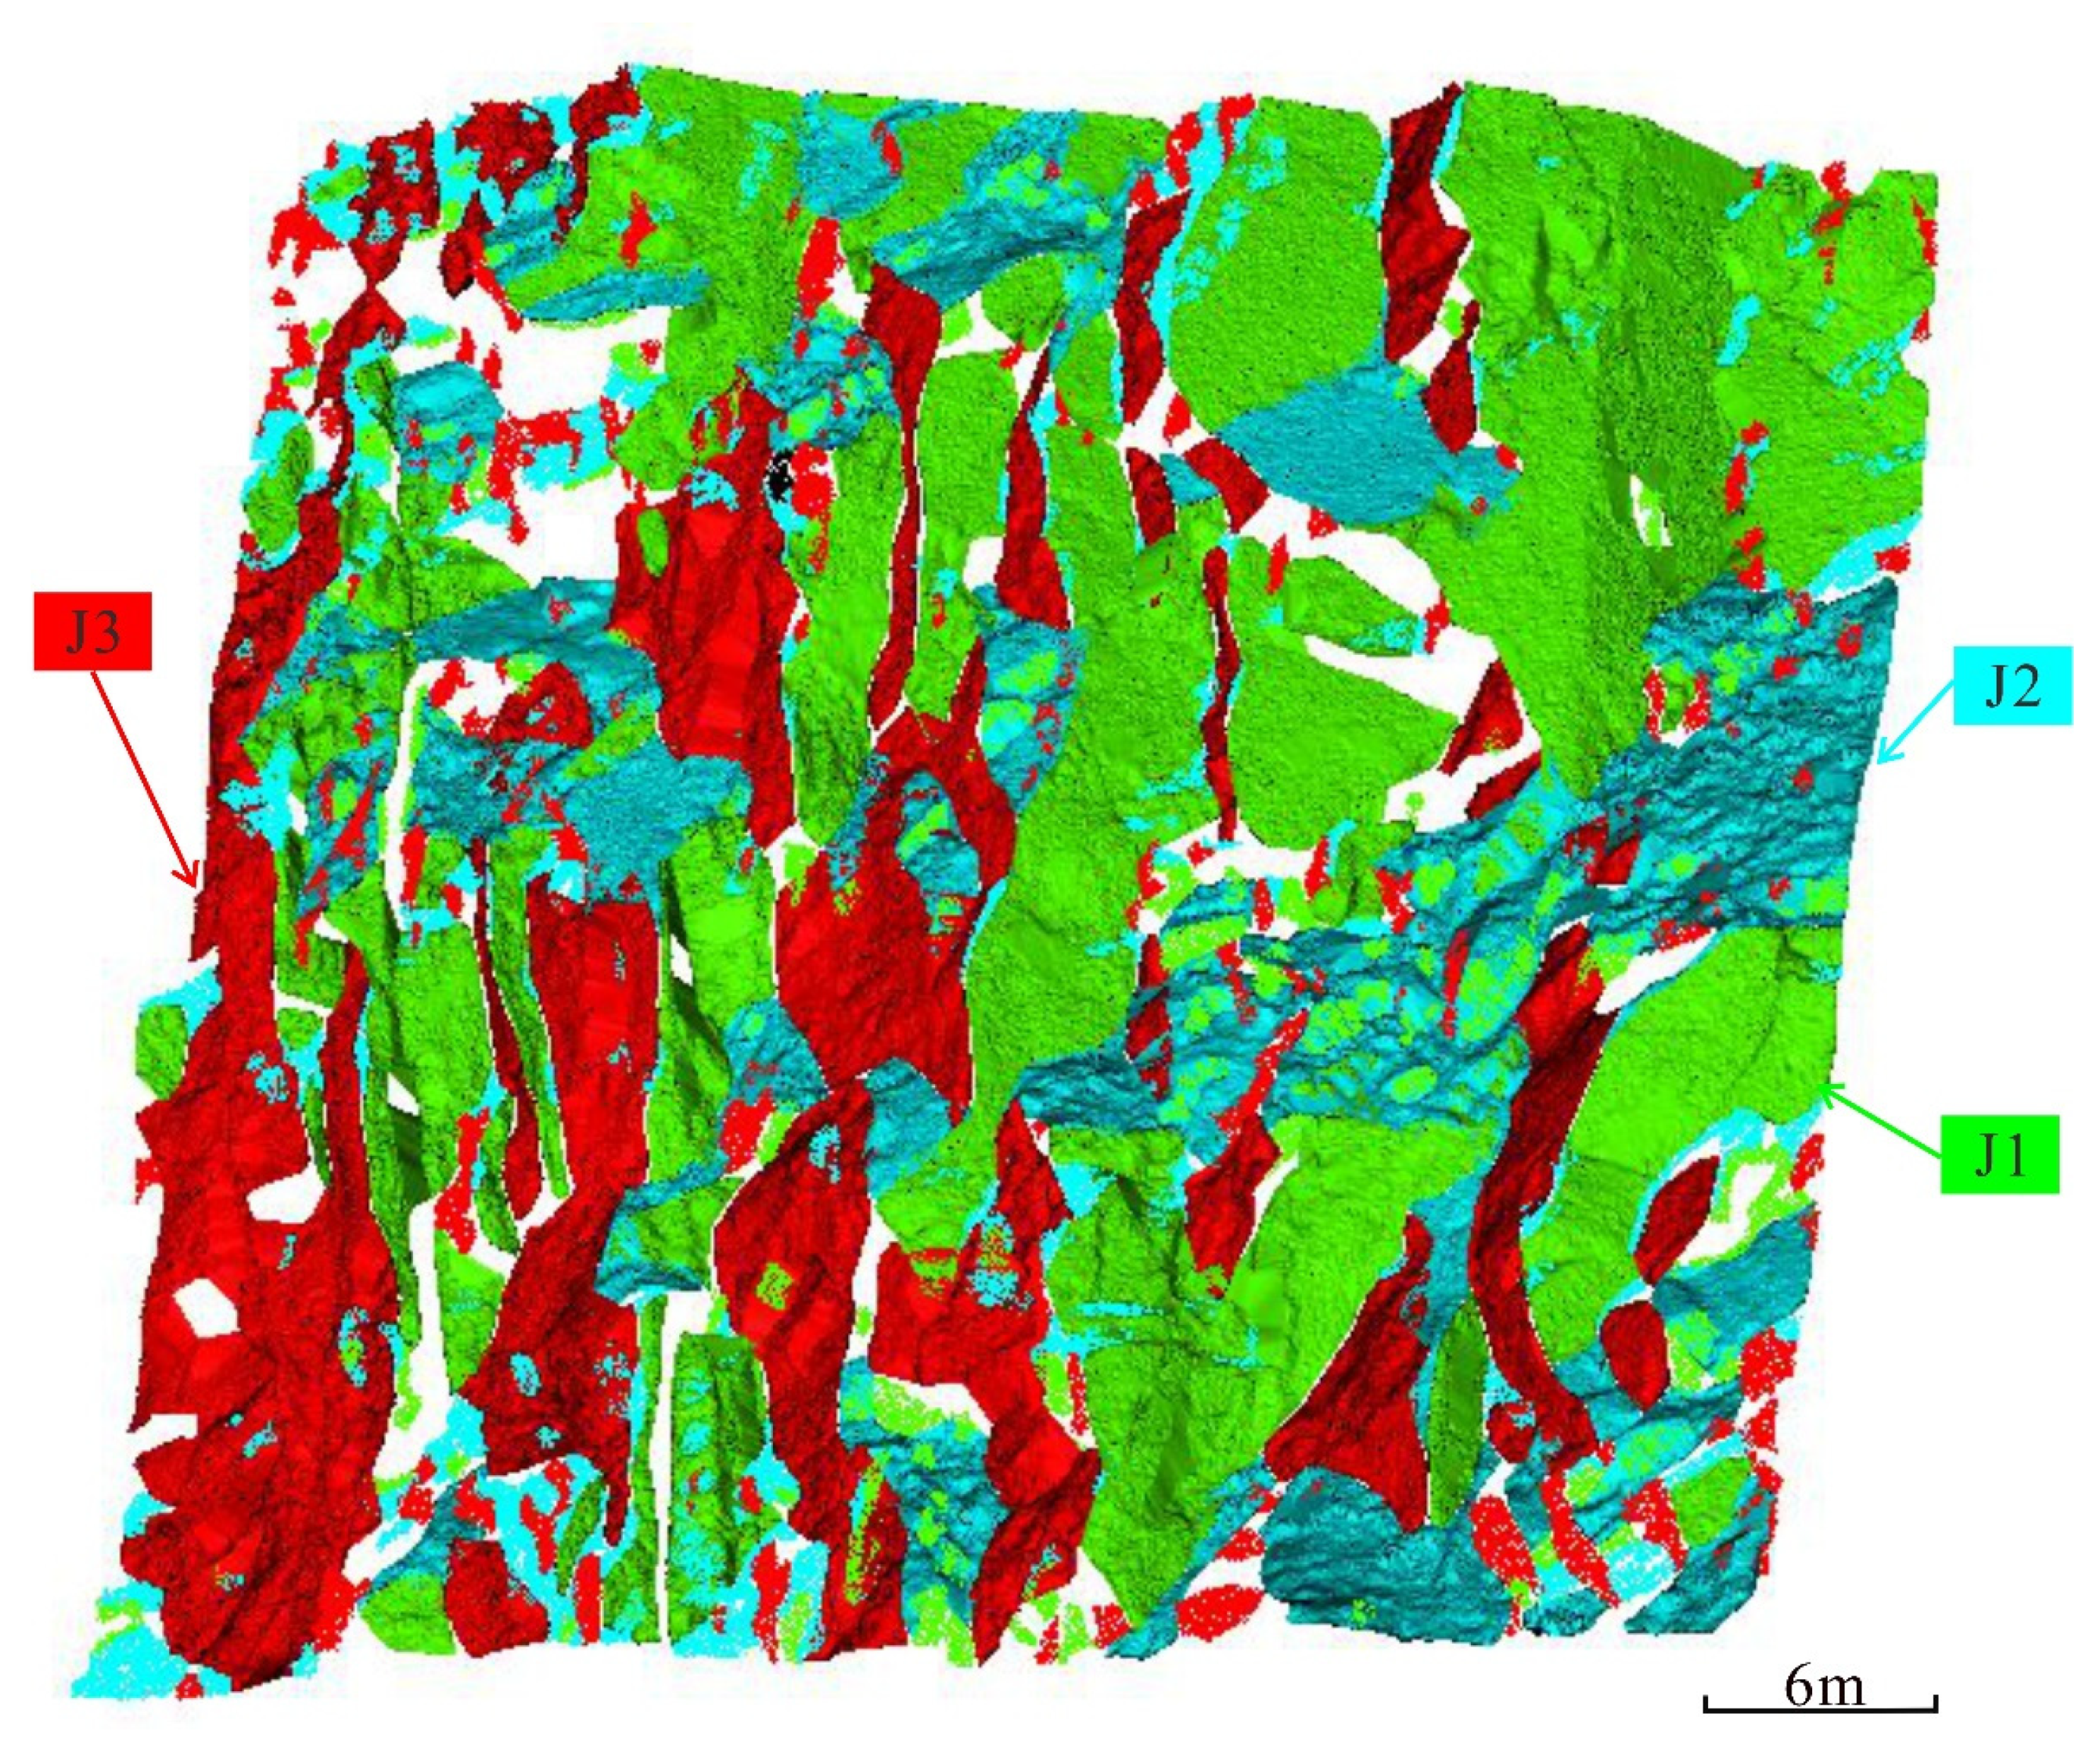
Based on the new method proposed, the average silhouette coefficients under different cluster numbers were calculated, and the relationship between the average silhouette coefficient and the number of clusters was drawn, as shown in Figure 12. The results show that, when k was equal to 3, the average silhouette coefficient was the largest, so the artificial quarry slope could be divided into three discontinuity sets. Then, the HDBSCAN algorithm was used to segment the three discontinuity sets and to extract each discontinuity from the three discontinuity sets, respectively. The clustering results are shown in Figure 13, with three discontinuity sets represented by green, cyan, and red, respectively.
Table 3 shows the clustering results of the discontinuities of the artificial quarry slope using the new method and the manual measurement method with fitting the plane by manually selecting the point cloud subset of the plane in CloudCompare. It can be seen from Table 3 that the maximum deviation between the measurement results of the discontinuities orientation of the artificial quarry slope using the new method and the manual measurement results is 8.72°, the average deviation of the dip direction is 5.32°, and the maximum deviation of the dip angle is 9.98°, the average deviation of the dip angle is 4.81°. Since the discontinuities in the data are mostly curved and undulating, the manual measurement method cannot be accurate because the results are affected by the surface roughness. The RANSAC method has strong robustness and can find the largest subset of data related to the plane in order to represent the plane.

3.2. The Influence of the Triangle Mesh Size

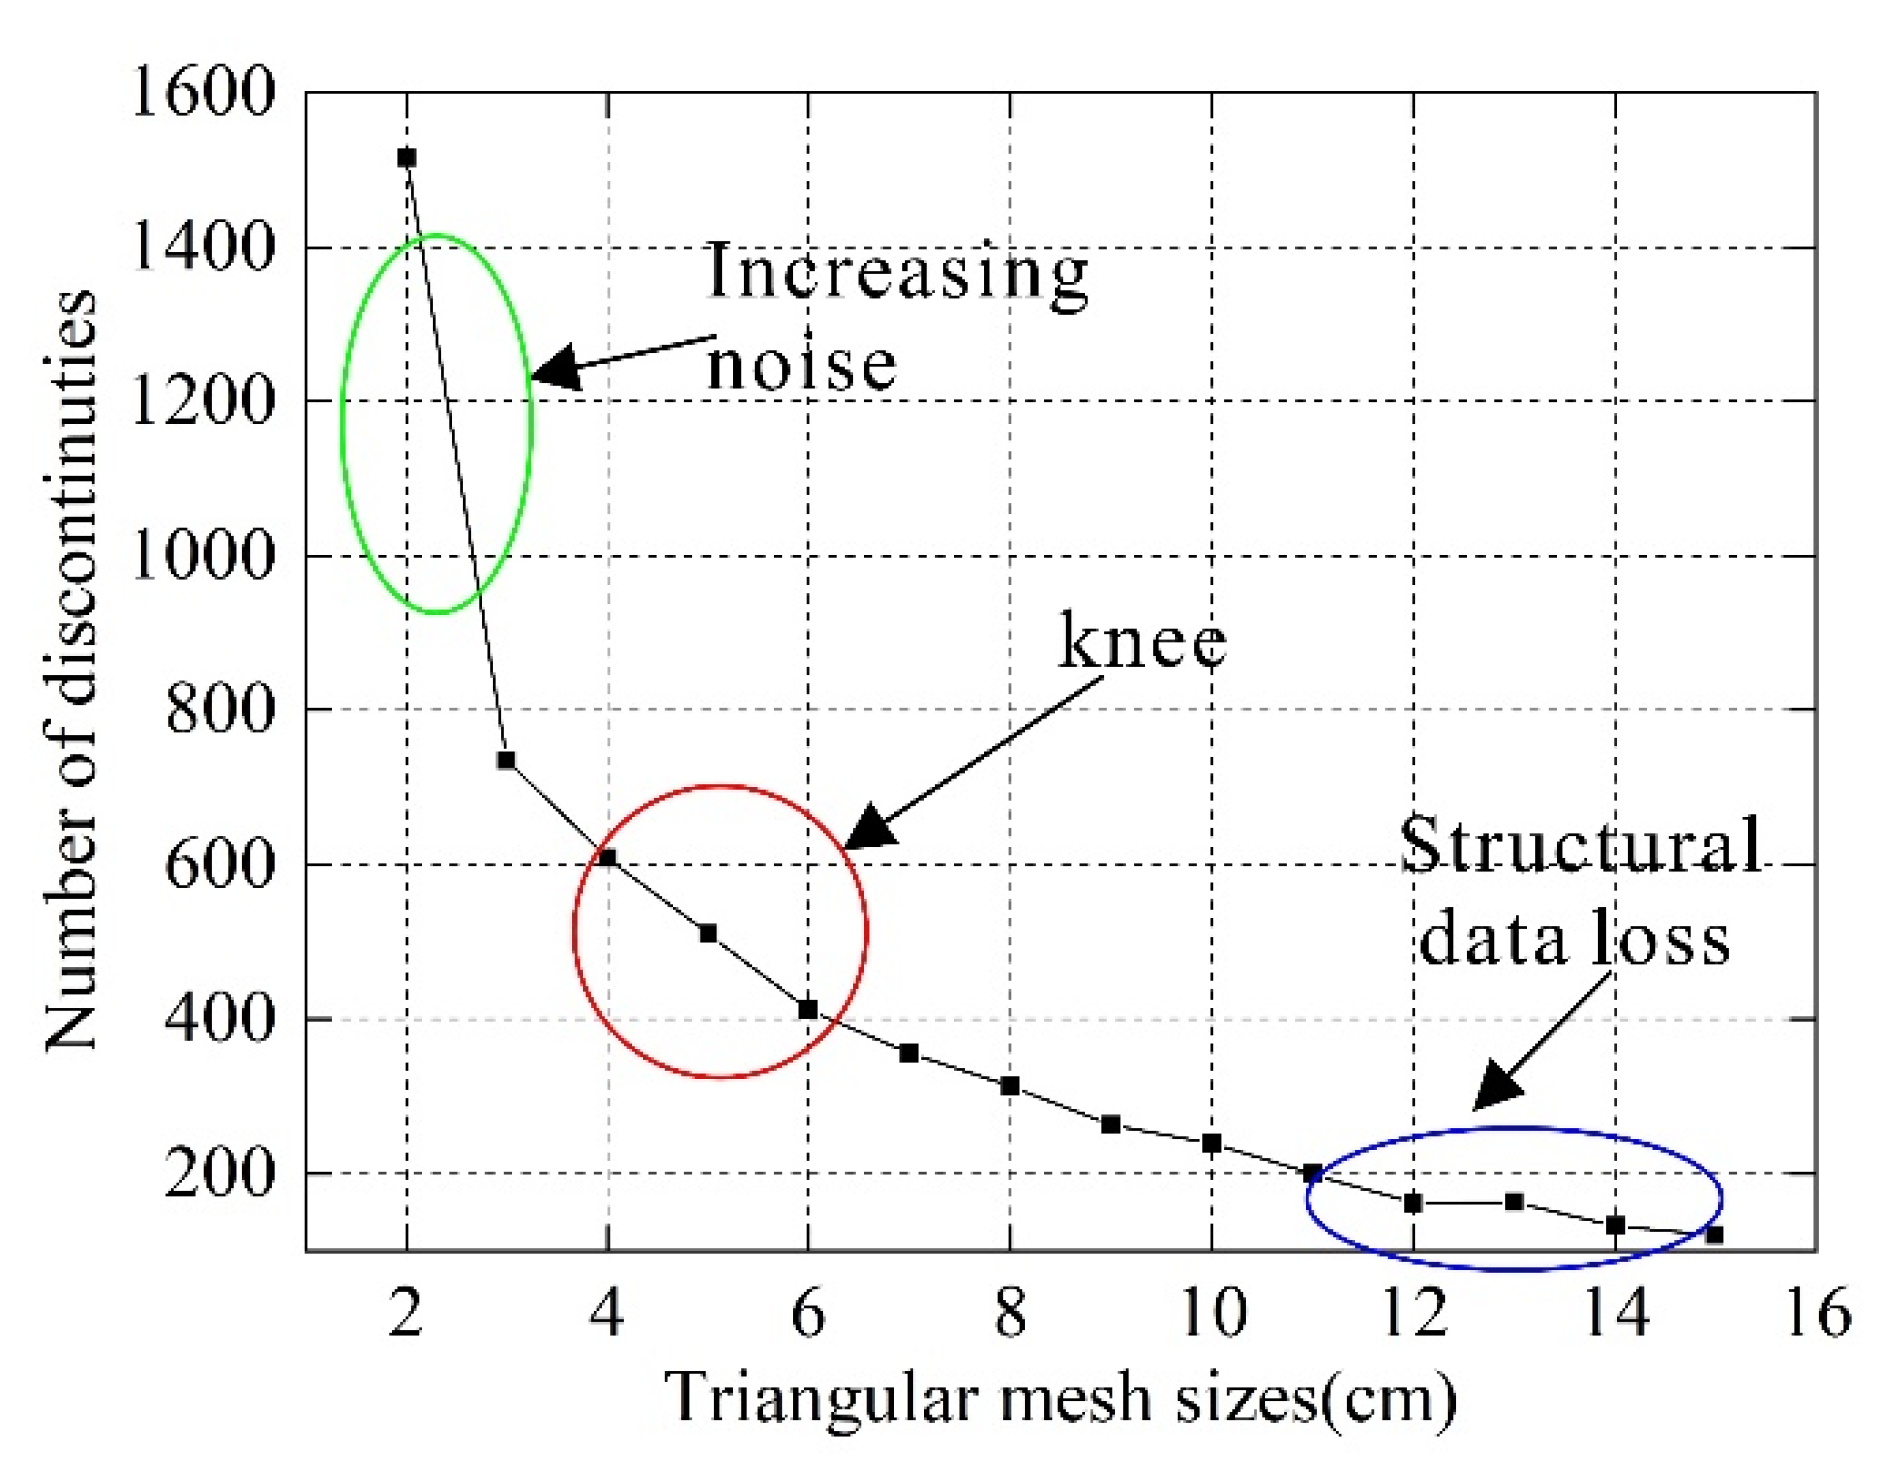
To analyze the influence of the triangle mesh size on the extraction of discontinuities, the point cloud of the artificial quarry slope was resampled from 2 cm to 15 cm. By analyzing a number of discontinuities under different triangle mesh sizes, the optimal triangle size of the artificial quarry slope could be obtained. Figure 14 shows the number of discontinuities identified under different triangle mesh sizes. According to previous research [54], the optimal triangle mesh size will appear at the “knee” position in the trend line (red area of Figure 14). This is because, when the triangle mesh size is too small, the density of the TIN will be too large and will generate noisy data, which will cause a number of discontinuities to change sharply and become unstable (green area of Figure 14); when the triangle mesh size is too large, the discontinuities with too small area may merge with the adjacent surface, resulting in the loss of structural surface data, and the real structure of discontinuities cannot be presented well (blue area of Figure 14).
Therefore, it can be seen from Figure 14 that, according to the optimal triangle mesh size appearing at the “knee” position of the trend line, the optimal triangle mesh size for the artificial quarry slope is between 4 and 6 cm.

3.3. The Impact of HDBSCAN Algorithm Parameter Min-pts

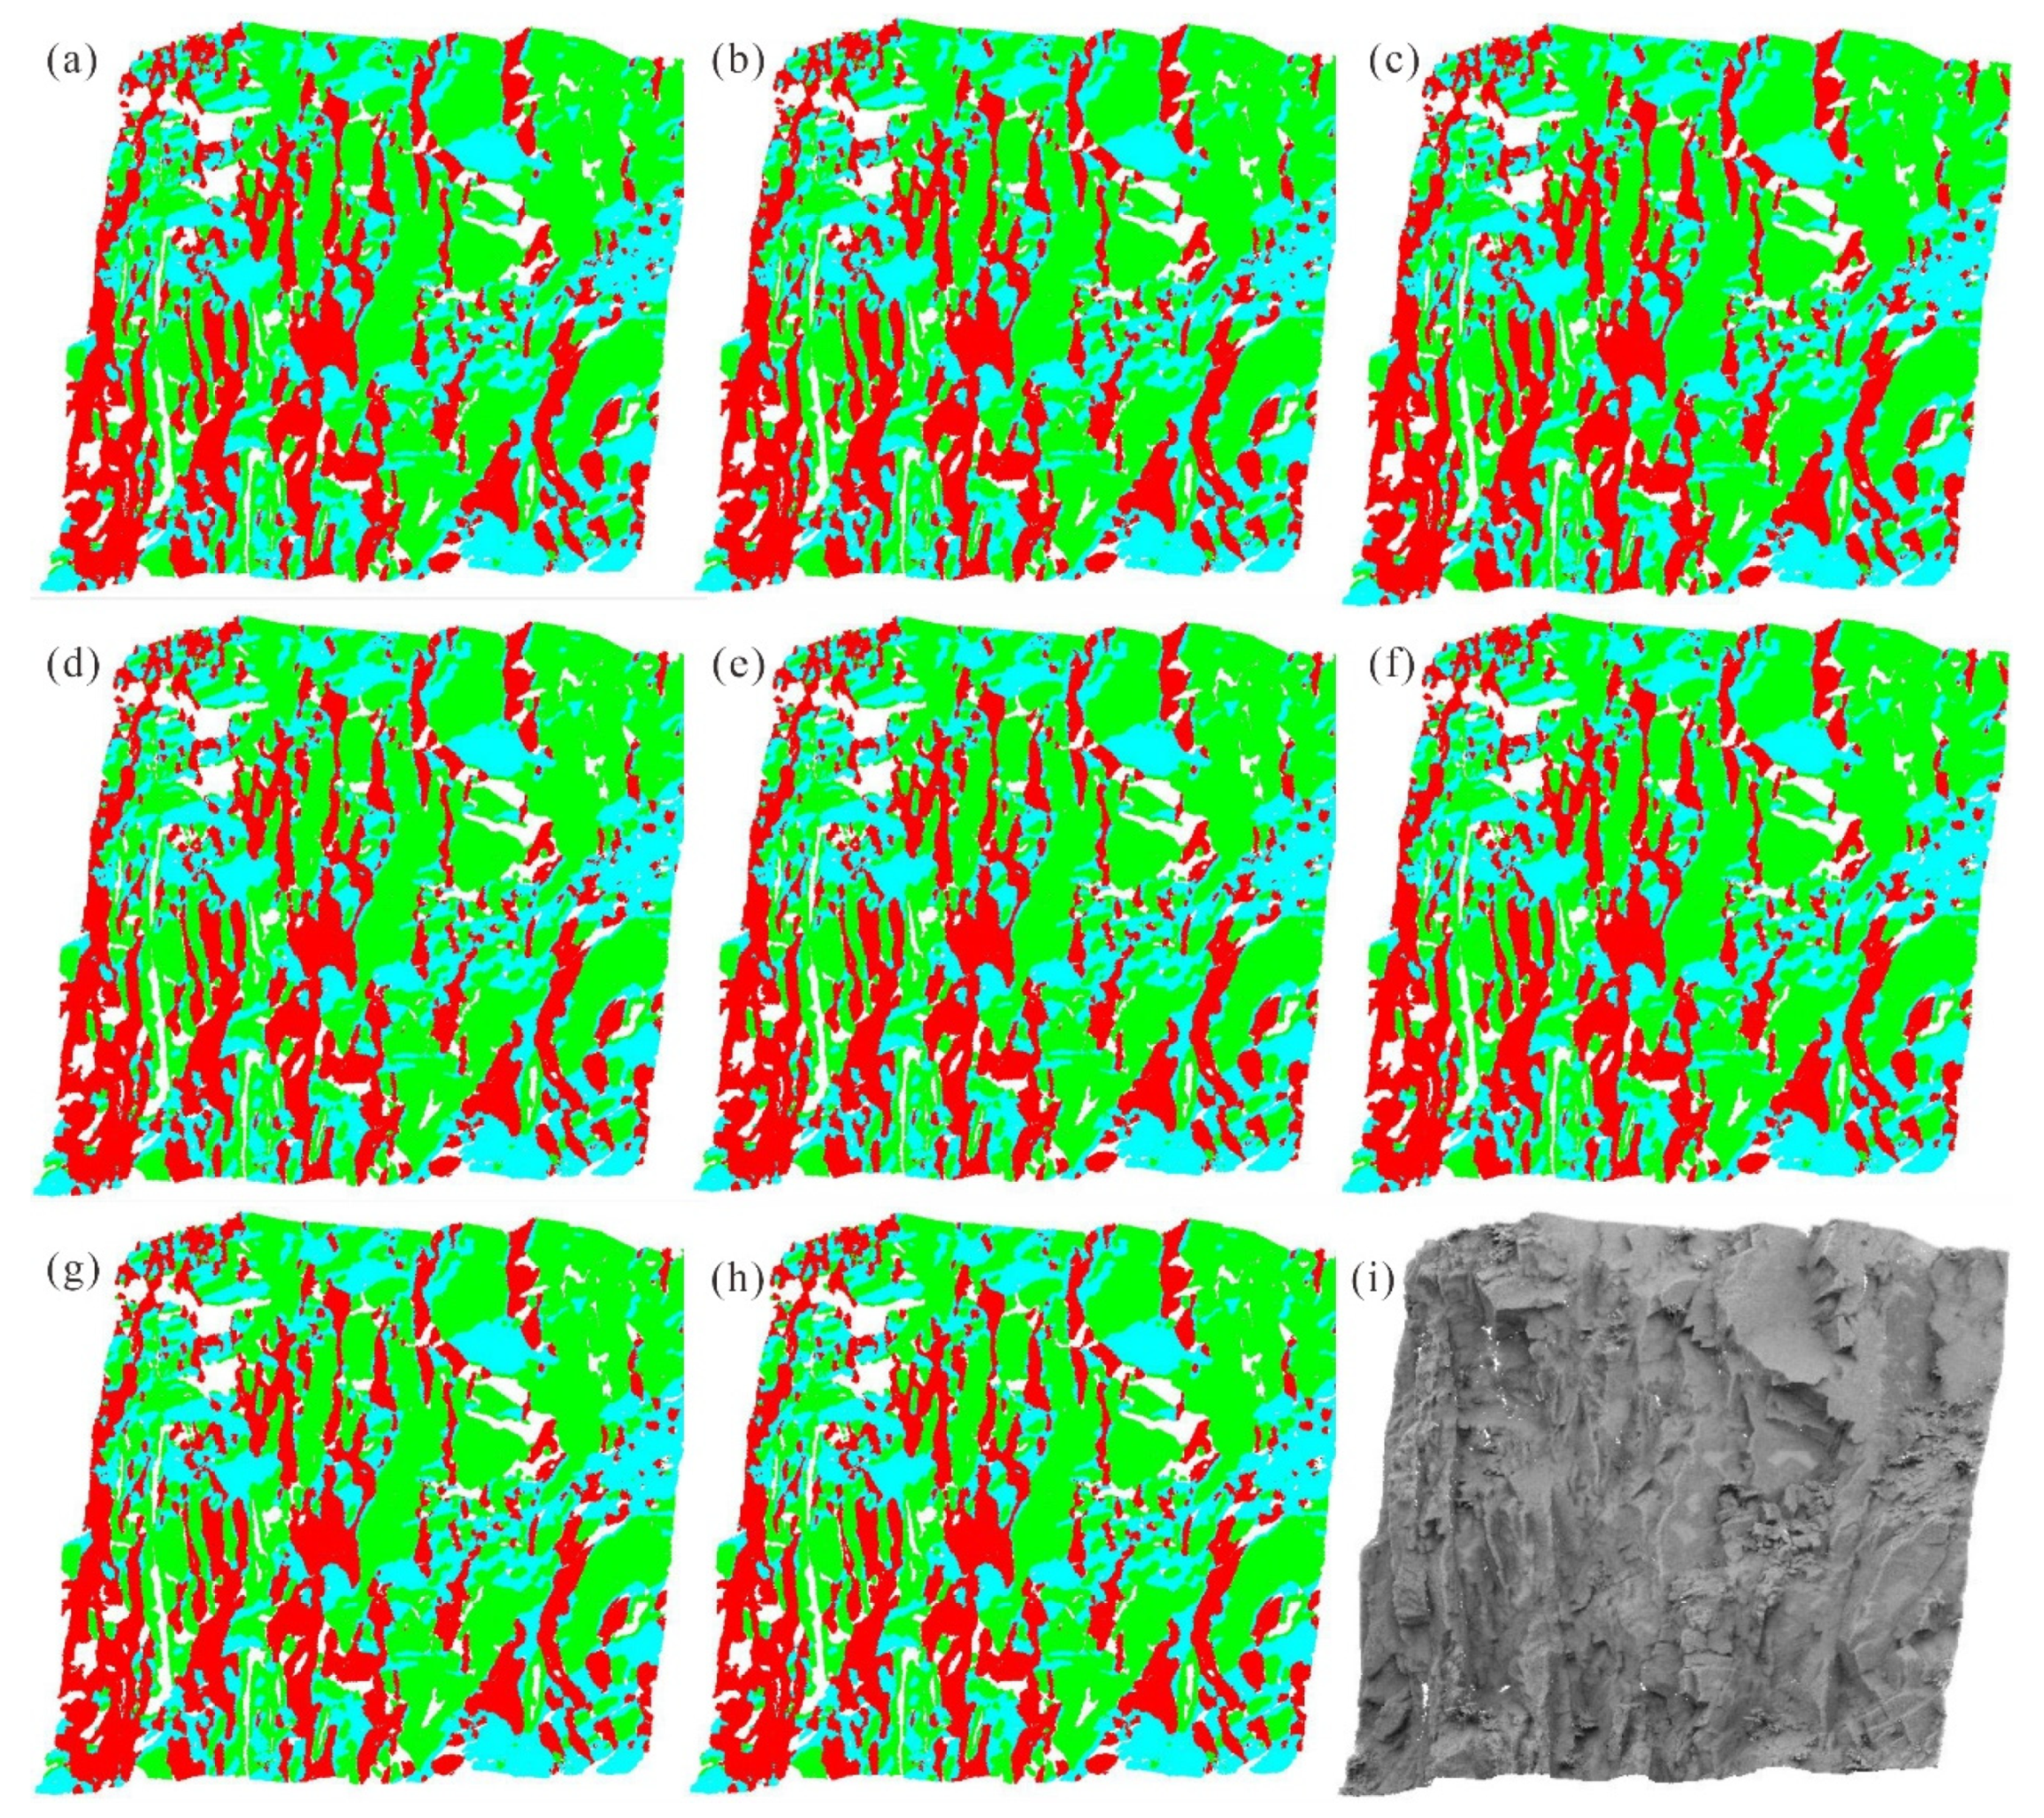
In this paper, the parameter, Min-pts, in the HDBSCAN algorithm was set to 2, 4, 6, 8, 10, 12, 16, and 20, respectively, in order to analyze the influence of different values of Min-pts on the discontinuity segmentation. Figure 15 shows the automatic segmenting results of the artificial quarry slope under different values of Min-pts. It can be seen from Figure 15 that the value of Min-pts has little effect on the automatic segmenting results of the artificial quarry slope.
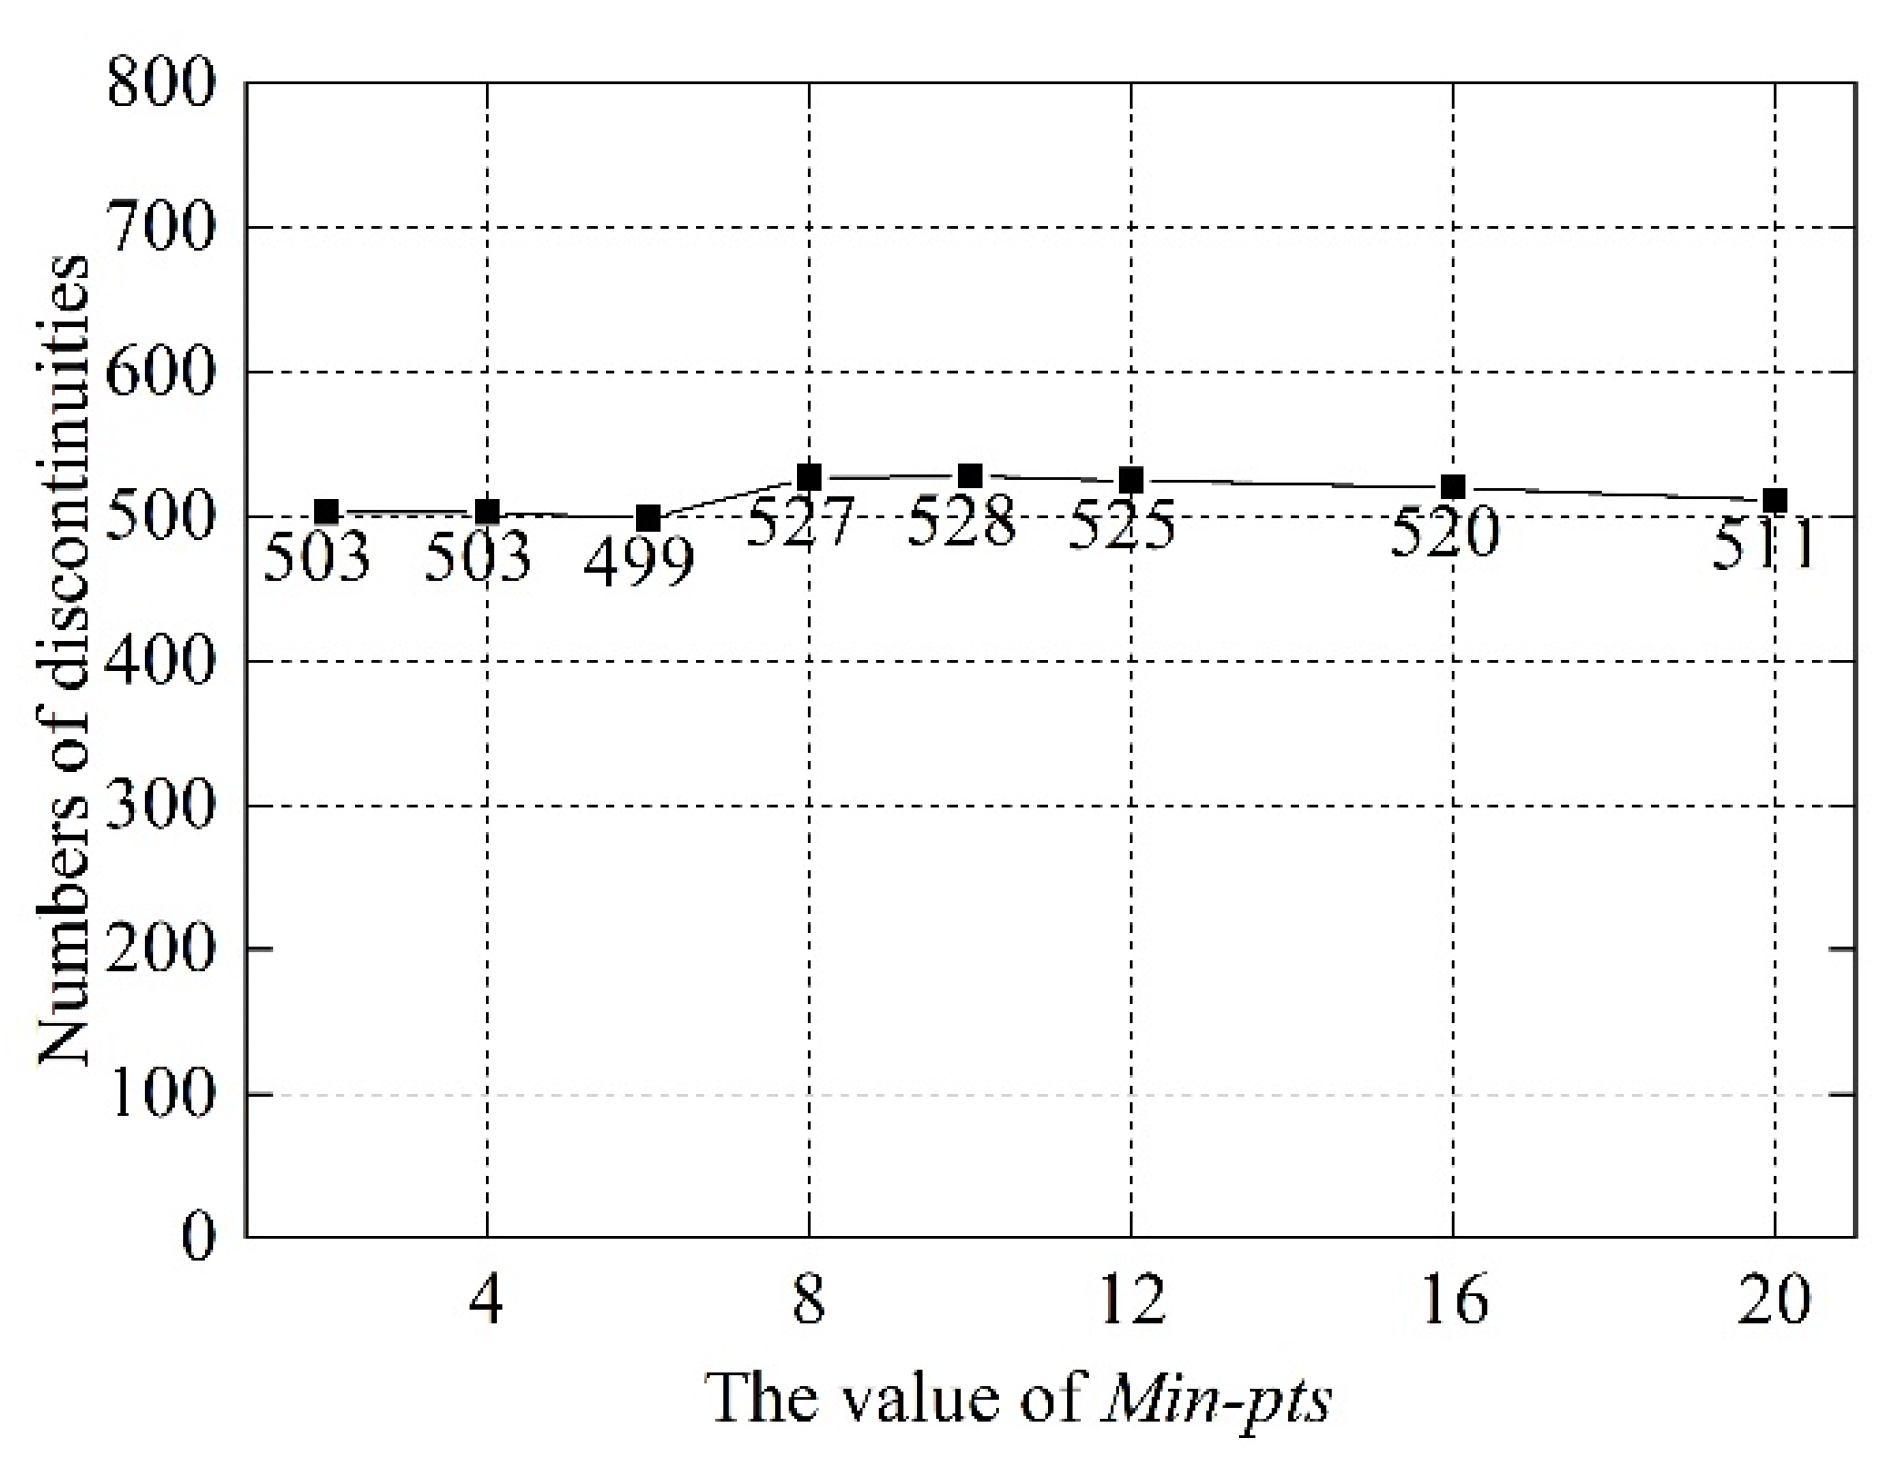
Figure 16 shows the number of discontinuities of the artificial quarry slope under different values of the parameter Min-pts in the HDBSCAN algorithm. As can be seen from Figure 16, when Min-pts is set to 10, the maximum number of discontinuities is 528; when Min-pts is set to 6, the minimum number of discontinuities is 499. Under different Min-pts, the maximum deviation in the number of discontinuities is about 5.6%.
It can be concluded that the parameter Min-pts has little influence on the number of discontinuities of the artificial quarry slope. It was verified that the HDBSCAN algorithm can segment discontinuities in data with uneven density without the constant adjustment of parameters with the DBSCAN algorithm. Therefore, in this paper, Min-pts is set to 4.

4. Discussion

4.1. Comparison of the Extracting Results of the Rock Slope

Illustrated by the case of the typical rock slope, we clarified in detail how to identify the main potential directions of DPCA, determine the number of discontinuity sets by the silhouette coefficient (Section 2.3), segment the discontinuity sets by HDBSCAN (Section 2.4), fit the discontinuities by the RANSAC method (Section 2.5), and compare the extracted results with those obtained by Riquelme et al. [40] and Chen et al. [37] (Section 2.6). The results show that (1) the new method has higher extraction precision. The average deviations of the dip direction and dip angle are 3.07° and 2.81°, respectively, which are smaller than those found by Riquelme et al. [40] (3.87° and 3.03°) and Chen et al. [37] (4.26° and 3.92°); the average deviations have been reduced (26% and 8%) and (39% and 40%), respectively. (2) The new method has high computational efficiency. Based on the workstation and intel cores with i7-6700 CPU and 16GB RAM, the automatic extraction of discontinuities takes about 1.4 h, as compared to the work of Riquelme et al. [40] (1.5 h in a workstation with the Intel Core i3-350M and 8GB DDR3 RAM) and Chen et al. [37] (2.5 h in a workstation with the Intel Core i7-2600 CPU and 16 GB RAM).
In addition, in determining the number of discontinuities using the silhouette coefficient, the rock slope was divided into three discontinuity sets by Chen et al. [37] and five discontinuity sets by the new method (Figure 7). As the work of Chen et al. [37] was done according to the statistical density of all the samples, the sample point with the maximum density was determined as the initial clustering center, and the sample point with the maximum distance from it was selected as the next center point until the k centers were selected. However, this paper first projects the normal vectors of all the sample points into the stereo network, obtains the main potential direction by DPCA, and then determines the k value by combining it with the silhouette coefficient. The advantage of this method is that the main direction with small sample points can also be identified accurately.

4.2. Analysis of the Optimal Triangle Mesh Size

This paper introduces Lato et al.’s [54] idea of discussing the relationship between the optimal triangle mesh size and the number of discontinuities. Based on the trend line drawn with the triangle mesh size as the horizontal axis and the number of discontinuities as the vertical axis, it was determined that the optimal triangle mesh size would appear at the “knee” position of the trend line. When the triangle mesh size is too small, it will cause noise data due to excessive density in the process of generating TIN, which makes the number of discontinuities sharply increase; when the triangle mesh size is too large, it will cause a discontinuity with too small an area to merge with the adjacent surfaces, resulting in the loss of discontinuities, and the true structure of the rock mass cannot be well presented. For the artificial quarry slope, the trend line reflecting the relationship between the number of discontinuities and triangle mesh sizes is drawn. It can be seen from Figure 14 that the optimal triangle mesh size of the artificial quarry slope is between 4 and 6 cm according to the “knee” position of the trend line. Therefore, 5 cm was selected as the optimal triangle mesh size. In order to verify the reliability of this selection, the experiments on the triangle mesh sizes of 3 cm and 7 cm were carried out; the results are shown in Table 4 and are compared with 5 cm data.
It can be seen from Table 4 that compared to the triangle mesh size of 5 cm, when the triangle mesh size is 3 cm, the number of discontinuities is larger, although the average deviation of the dip direction and dip angle are smaller, which are 4.97° and 4.23°, respectively, the calculation time is longer at 3.25 h; when the triangle mesh size is 7 cm, the number of discontinuities decreases, although the calculation time is 0.36 h, the average deviation in the dip direction and dip angle are larger at 6.04° and 5.73°, respectively. Therefore, considering the number of discontinuities, extraction precision, and calculation time, this paper determines that the optimal triangular mesh size of the artificial quarry slope is 5 cm. The purpose is not to damage the rock mass structure of the artificial quarry slope. While reducing the extraction precision slightly, the calculation time can be greatly reduced, and it is reasonable that the optimal triangle mesh size is at the “knee” of the trend line.

4.3. Relevant Parameters of Proposed New Method

The new method proposed in this paper involves the following parameters: the cutoff distance dcf and the angle α between the main directions when identifying the main potential directions by DPCA; the only parameter Min-pts when segmenting the discontinuity sets by HDBSCAN; and the minimum number of triangles Min-size in a discontinuity.
When identifying the main potential directions according to the DPCA, the cutoff distance dcf and the angle α between the main directions need to be set. The cutoff distance dcf will affect the local density of the sample point. If dcf is too large, it will reduce the difference of local density and may not be able to effectively identify the main direction. If the dcf is too small, it will cause the main directions with approach directions to increase. Gao et al. [45] conducted a detailed sensitivity analysis of dcf and proposed that the lower limit and upper limit of dcf be set to 0.005 and 0.12, respectively. Generally, if dcf is greater than 0.12, it will cause the angle between two discontinuities normal vectors to be about 20°. If dcf is less than 0.005, the angle between two discontinuities normal vectors is about 4°. Therefore, based on the sensitivity analysis of dcf by Gao et al. [45], this paper sets dcf to 0.05. The angle α between the main directions will affect the number of discontinuity sets. Due to the normal vector projected into the 3D network, the maximum angle between the normal vectors is 90°, and generally, the rock mass discontinuities can be divided into six clusters at most. If α is greater than 15°, the number of discontinuity sets will be less than six, which is unreasonable for a rock mass with more discontinuity sets.
The influence of the unique parameter Min-pts in the HDBSCAN algorithm on the segmentation results (Figure 15) and the number of discontinuities (Figure 16) is discussed. It can be seen that when the Min-pts is at 2–20, the segmentation result of discontinuity is almost unchanged, and the fluctuation range of discontinuity number is only 5.6%, which proves that the HDBSCAN algorithm has good robustness for clustering results with different Min-pts values, and it does not need to adjust multiple parameters manually like other algorithms to get a better result (Section 3.3).
For an actual rock mass, we may only need large discontinuities, and small discontinuities need to be deleted. Therefore, it is necessary to set Min-size, which is the minimum number of triangles in the discontinuity. When the Min-size is small, many small discontinuities will be identified, and when the Min-size is large, some real discontinuities may be discarded. In this paper, the Min-size is set to 50, and the new method is used to extract the number of discontinuity and the main direction of the discontinuity set of the rock slope, which is basically consistent with the results extracted by Riquelme et al. [40] (Table 1). However, it is necessary to analyze the Min-size in the future, because the number of point clouds in each discontinuity set of the rock mass may be different. As a result, a discontinuity set with a larger number of point clouds will identify many small discontinuities, and a small number of point clouds will discard some discontinuities. Therefore, it is necessary to set different Min-sizes for the discontinuities in each discontinuity set in the future.

4.4. Discussion on Fitting Plane by RANSAC

In fitting the discontinuities, the discontinuities are usually curved and undulating, resulting in the manual measurement being affected by the surface roughness and the results not being accurately obtained. For example, for rough exposed surfaces, manual measurement with a compass only uses the accessible part of the joint surface without considering the change of the entire surface. In this paper, the RANSAC method considering curve and undulate can produce more objective estimates. The direction of the discontinuity is related to the best fit plane. The RANSAC method is used to select the point clouds with the largest interior point in order to represent the whole plane, which effectively avoids the influence of some point clouds with large deviations.
For the two representative rough discontinuities marked as 13 and 41 in Figure 9, the fitting results are shown in Figure 17a,b, respectively. Compared with the directions of discontinuities 13 and 41 measured by the classical approach with best-fit planes using PolyWorks (Table 2), it can be seen that the fitting effect using the RANSAC method is better than that using all the points in the plane, as the the deviations in dip direction and dip angle are reduced by 1–2° (Table 5).

4.5. Discussion on the Applicability of the New Method

For the artificial quarry slope, we first discussed the influence of the triangle mesh size and the unique parameter Min-pts in the HDBSCAN algorithm on the extraction results, and then compared the extraction results with the traditional measurement methods (Table 3). When the influence on the extraction results was small, increasing the triangle mesh size on the rock surface TIN was helpful in saving running time. Therefore, this paper discussed the triangle mesh size (Figure 14) and concluded that the optimal triangle mesh size of the artificial quarry slope was 4–6 cm (Section 3.2).
In addition, although the new method has more advantages than the methods proposed by previous researchers [37,40] and can be used in practical engineering, there are still some problems. It can be seen from Figure 12 that, when the average silhouette coefficient is three, the artificial quarry slope is best divided into three discontinuity sets, but in Figure 13, there are still a few discontinuity extracting errors. This is because, when DPCA is used to determine the main orientations of the slope, the angles between the normal vectors of some discontinuities and the three main orientations are large, which leads to a large extracting error of these discontinuities. Figure 18 shows the distribution of the angles between the discontinuities in each discontinuity set and the main orientation at 0–15°, 15–30°, 30–45°, and 45–90°. The regions of 0–15°, 15–30°, 30–45°, and 45–90° are represented by green, yellow, red, and blue, respectively. As can be seen from Figure 18, most of the discontinuities in each discontinuity set of the artificial quarry slope are consistent with the main direction. The discontinuities with an angle less than 15° are about 40%, and the discontinuities in discontinuity set 1 and set 2 even reach 46% and 47.9%, respectively. The discontinuities with an angle less than 30° are more than 85%. While the discontinuities with an angle greater than 30° still exist, owing to their small area and rough surface, they do not account for more than 16%.
Influenced by vegetation and weathering on the surface of artificial quarry slope, the point clouds with noise data will be removed in the preprocessing, which could result in holes and gaps in generating the TIN, as shown in the blank area in Figure 13. In addition, there is a phenomenon that some small discontinuities that coincides with a large one (Figure 13), which is mainly because the region with a larger undulated surface was divided into other discontinuity sets as compared to the whole discontinuity.

5. Conclusions

This paper proposes a new approach to automatically extracting the discontinuity orientations from the 3D point clouds. The main innovative contributions are that the new method can determine the discontinuity set automatically by the improved K-means algorithm based on the DPCA algorithm and the silhouette coefficient in the cluster validity index, and segment the discontinuity sets and extract each discontinuity from a discontinuity set by the HDBSCAN algorithm. The advantage of the new method is that DPCA can identify the main directions with fewer sample points, and the HDBSCAN algorithm can handle data sets with large variations in density with fewer adjustment parameters and stronger robustness.
The new method can realize the automatic extraction of discontinuities and identify the main orientations with high precision and good applicability for different data sets. The precision of extracting the discontinuity orientations for the rock slope is within 3.5°, which is higher than that obtained by Riquelme et al. [40] and Chen et al. [37]. Compared to the method of using the original point clouds, the new method greatly saves on operation time because of the optimal triangular mesh size. In addition, it can also be used in practical engineering. Through the comparison of the clustering results of the artificial quarry slope, it is consistent with the traditional measurement method. It can provide reliable discontinuity clustering data for the stability analysis of the artificial quarry slope.
The new method can be used to obtain the orientations of rock slope discontinuities in inaccessible areas or dangerous outcrops. It is helpful for rock scientists and practitioners to obtain accurate and repeatable data. Future research can focus on the following three aspects: (1) filling holes and gaps in the TIN produced by the vegetation or the weathering; (2) discussing the influence on the discontinuity number of different Min-size thresholds; and (3) extracting more discontinuity parameters, such as trace, spacing, roughness, etc.

Author Contributions

Conceptualization, X.W. and F.W.; methodology, X.W. and F.W.; validation, X.W. and S.Z.; investigation, X.W., F.W., and S.Z.; data curation, X.W.; writing—original draft preparation, X.W. and F.W.; writing—review and editing, F.W., M.W., X.Z., and Q.W.; supervision, X.Z. and Q.W.; funding acquisition, F.W. and M.W. All authors have read and agreed to the published version of the manuscript.

Funding

This research was funded by the National Natural Science Foundation of China (Grant Nos. 42077242 and 41820104001), the Open Fund of Key Laboratory of Urban Land Resources Monitoring and Simulation, Ministry of Natural Resources of China (Grant No. KF-2019-04-080 and KF-2020-05-024), and the Scientific research project of the 13th five-year plan of Jilin province education department (JJKH20200999KJ).

Institutional Review Board Statement

Not applicable.

Informed Consent Statement

Not applicable.

Data Availability Statement

Not applicable.

Acknowledgments

The authors would like to thank Lato et al. for providing their dataset and the reviewers for their valuable comments and suggestions.

Conflicts of Interest

The authors declare no conflict of interest.

References

  1. Guangzhong, S. On the theory of structure-controlled rockmass. J. Eng. Geol. 1993, 1, 14–18. [Google Scholar]
  2. Priest, S.; Hudson, J. Discontinuity spacings in rock. Int. J. Rock Mech. Min. Sci. Geomech. Abstr. 1976, 13, 135–148. [Google Scholar] [CrossRef]
  3. Bieniawski, Z.T. Engineering Rock Mass Classifications: A Complete Manual for Engineers and Geologists in Mining, Civil, and Petroleum Engineering; John Wiley & Sons: Hoboken, NJ, USA, 1989. [Google Scholar]
  4. Poropat, G.V.; Elmouttie, M.K. Automated structure mapping of rock faces. In Proceedings of the International Symposium on Stability of Rock Slopes in Open Pit Mining and Civil Engineering Situations, Brisbane, Australia, 3–6 April 2006. [Google Scholar]
  5. Oppikofer, T.; Jaboyedoff, M.; Blikra, L.; Derron, M.H.; Metzger, R. Characterization and monitoring of the Åknes rockslide using terrestrial laser scanning. Nat. Hazards Earth Syst. Sci. 2009, 9, 1003–1019. [Google Scholar] [CrossRef] [Green Version]
  6. Viero, A.; Teza, G.; Massironi, M.; Jaboyedoff, M.; Galgaro, A. Laser scanning-based recognition of rotational movements on a deep seated gravitational instability: The Cinque Torri case (North-Eastern Italian Alps). Geomorphology 2010, 122, 191–204. [Google Scholar] [CrossRef]
  7. Jaboyedoff, M.; Oppikofer, T.; Abellán, A.; Derron, M.H.; Loye, A.; Metzger, R.; Pedrazzini, A. Use of LIDAR in landslide investigations: A review. Nat. Hazards 2012, 61, 5–28. [Google Scholar] [CrossRef] [Green Version]
  8. Abellán, A.; Oppikofer, T.; Jaboyedoff, M.; Rosser, N.J.; Lim, M.; Lato, M.J. Terrestrial laser scanning of rock slope instabilities. Earth Surf. Process. Landf. 2014, 39, 80–97. [Google Scholar] [CrossRef]
  9. Zhang, P.; Du, K.; Zhu, H.; Zheng, W.; Tannant, D. Automated method for extracting and analysing the rock discontinuities from point clouds based on digital surface model of rock mass. Eng. Geol. 2018, 239, 109–118. [Google Scholar] [CrossRef]
  10. Lato, M.J.; Diederichs, M.S.; Hutchinson, D.J. Bias correction for view-limited Lidar scanning of rock outcrops for structural characterization. Rock Mech. Rock Eng. 2010, 43, 615–628. [Google Scholar] [CrossRef]
  11. Otoo, J.N.; Maerz, N.H.; Duan, Y.; Xiaoling, L. LiDAR and optical imaging for 3-D fracture orientations. In Proceedings of the 2011 NSF Engineering Research and Innovation Conference, Atlanta, GA, USA, 4–7 January 2011. [Google Scholar]
  12. Gigli, G.; Casagli, N. Semi-automatic extraction of rock mass structural data from high resolution LIDAR point clouds. Int. J. Rock Mech. Min. Sci. 2011, 48, 187–198. [Google Scholar] [CrossRef]
  13. Fisher, J.E.; Shakoor, A.; Watts, C.F. Comparing discontinuity orientation data collected by terrestrial LiDAR and transit compass methods. Eng. Geol. 2014, 181, 78–92. [Google Scholar] [CrossRef]
  14. Riquelme, A.J.; Abellán, A.; Tomás, R. Discontinuity spacing analysis in rock masses using 3D point clouds. Eng. Geol. 2015, 195, 185–195. [Google Scholar] [CrossRef] [Green Version]
  15. Dong, X.; Xu, Q.; Huang, R.; Liu, Q.; Kieffer, D.S. Reconstruction of Surficial Rock Blocks by Means of Rock Structure Modelling of 3D TLS Point Clouds: The 2013 Long-Chang Rockfall. Rock Mech. Rock Eng. 2019, 53, 671–689. [Google Scholar] [CrossRef] [Green Version]
  16. Liu, L.; Xiao, J.; Wang, Y. Major Orientation Estimation-Based Rock Surface Extraction for 3D Rock-Mass Point Clouds. Remote Sens. 2019, 11, 635. [Google Scholar] [CrossRef] [Green Version]
  17. Zekkos, D.; Greenwood, W.; Lynch, J.; Manousakis, J.; Athanasopoulos-Zekkos, A.; Clark, M.; Cook, K.L.; Saroglou, C. Lessons learned from the application of UAV-enabled structure-from-motion photogrammetry in geotechnical engineering. Int. J. Geoengin. Case Hist. 2018, 4, 254–274. [Google Scholar] [CrossRef]
  18. Kemeny, J.; Post, R. Estimating three-dimensional rock discontinuity orientation from digital images of fracture traces. Comput. Geosci. 2003, 29, 65–77. [Google Scholar] [CrossRef]
  19. Roncella, R.; Forlani, G. Extraction of planar patches from point clouds to retrieve dip and dip direction of rock discontinuities. In Proceedings of the Laser Scanning 2005, Enschede, The Netherlands, 12–14 September 2005. [Google Scholar]
  20. Potsch, M.; Schubert, W.; Gaich, A. Application of metric 3D images of rock faces for the determination of the response of rock slopes to excavation. In Proceedings of the ISRM International Symposium-EUROCK 2005, Brno, Czech Republic, 18–20 May 2005. [Google Scholar]
  21. Haneberg, W.C. Using close range terrestrial digital photogrammetry for 3-D rock slope modeling and discontinuity mapping in the United States. Bull. Eng. Geol. Environ. 2008, 67, 457–469. [Google Scholar] [CrossRef]
  22. Sturzenegger, M.; Stead, D. Quantifying discontinuity orientation and persistence on high mountain rock slopes and large landslides using terrestrial remote sensing techniques. Nat. Hazards Earth Syst. Sci. 2009, 9, 267–287. [Google Scholar] [CrossRef]
  23. Voge, M.; Lato, M.J.; Diederichs, M.S. Automated rockmass discontinuity mapping from 3-dimensional surface data. Eng. Geol. 2013, 164, 155–162. [Google Scholar] [CrossRef]
  24. Li, X.; Chen, J.; Zhu, H. A new method for automated discontinuity trace mapping on rock mass 3D surface model. Comput. Geosci. 2016, 89, 118–131. [Google Scholar] [CrossRef]
  25. Zhu, H.; Wu, W.; Chen, J.; Ma, G.; Liu, X.; Zhuang, X. Integration of three dimensional discontinuous deformation analysis (DDA) with binocular photogrammetry for stability analysis of tunnels in blocky rockmass. Tunn. Undergr. Space Technol. 2016, 51, 30–40. [Google Scholar] [CrossRef]
  26. Giordan, D.; Hayakawa, Y.; Nex, F.; Remondino, F.; Tarolli, P. Review article: The use of remotely piloted aircraft systems (RPAS) for natural hazards monitoring and management. Nat. Hazards Earth Syst. Sci. 2017, 18, 1079–1096. [Google Scholar] [CrossRef] [Green Version]
  27. Ester, M.; Kriegel, H.P.; Sander, J.; Xu, X. A density-based algorithm for discovering clusters in large spatial databases with noise. KDD 1996, 96, 226–231. [Google Scholar]
  28. Fernández, O. Obtaining a best fitting plane through 3D georeferenced data. J. Struct. Geol. 2005, 27, 855–858. [Google Scholar] [CrossRef]
  29. Abellán, A.; Vilaplana, J.M.; Martínez, J. Application of a long-range terrestrial laser scanner to a detailed rockfall study at Vall de Núria (Eastern Pyrenees, Spain). Eng. Geol. 2006, 88, 136–148. [Google Scholar] [CrossRef]
  30. Kriegel, H.; Kröger, P.; Sander, J.; Zimek, A. Density-based clustering. Wiley Interdiscip. Rev. Data Min. Know. Disc. 2011, 1, 231–240. [Google Scholar] [CrossRef]
  31. Jaboyedoff, M.; Metzger, R.; Oppikofer, T.; Couture, R.; Derron, M.; Locat, J.; Turmel, D. New insight techniques to analyze rock-slope relief using DEM and 3D-imaging cloud points: COLTOP-3D software. Rock Mechanics. Meeting Society’s Challenges and Demands. In Proceedings of the 1st Canada—US Rock Mechanics Symposium, Vancouver, BC, Canada, 27–31 May 2007. [Google Scholar]
  32. Ferrero, A.M.; Forlani, G.; Roncella, R.; Voyat, H.I. Advanced geostructural survey methods applied to rock mass characterization. Rock Mech. Rock Eng. 2009, 42, 631–665. [Google Scholar] [CrossRef]
  33. García-Sellés, D.; Falivene, O.; Arbués, P.; Gratacos, O.; Tavani, S.; Muñoz, J.A. Supervised identification and reconstruction of near-planar geological surfaces from terrestrial laser scanning. Comput. Geosci. 2011, 37, 1584–1594. [Google Scholar] [CrossRef]
  34. Wang, Y.; Feng, H.Y.; Delorme, F.É.; Engin, S. An adaptive normal estimation method for scanned point clouds with sharp features. CAD Comput. Aided Des. 2013, 45, 1333–1348. [Google Scholar] [CrossRef]
  35. Silverman, B.W. Density Estimation for Statistics and Data Analysis; Chapman and Hall: London, UK, 1986. [Google Scholar] [CrossRef]
  36. Fukunaga, K.; Hostetler, L.D. The estimation of the gradient of a density function, with application in pattern recognition. IEEE Trans. Inf. Theory 1975, 21, 32–40. [Google Scholar] [CrossRef] [Green Version]
  37. Chen, J.; Zhu, H.; Li, X. Automatic extraction of discontinuity orientation from rock mass surface 3D point cloud. Comput. Geosci. 2016, 95, 18–31. [Google Scholar] [CrossRef]
  38. Campello, R.; Moulavi, D.; Sander, J. Density-based clustering based on hierarchical density estimates. Lect. Notes Comput. Sci. 2013, 7819, 160–172. [Google Scholar] [CrossRef]
  39. Lato, M.; Kemeny, J.; Harrap, R.M.; Bevan, G. Rock bench: Establishing a common repository and standards for assessing rockmass characteristics using LiDAR and photogrammetry. Comput. Geosci. 2013, 50, 106–114. [Google Scholar] [CrossRef]
  40. Riquelme, A.J.; Abellán, A.; Tomás, R.; Jaboyedoff, M. A new approach for semi-automatic rock mass joints recognition from 3D point clouds. Comput. Geosci. 2014, 68, 38–52. [Google Scholar] [CrossRef] [Green Version]
  41. Alexa, M.; Behr, J.; Cohen-Or, D.; Fleishman, S.; Levin, D.; Silva, C.T. Computing and rendering point set surfaces. IEEE Trans. Vis. Comput. Graph. 2003, 9, 3–15. [Google Scholar] [CrossRef] [Green Version]
  42. Slob, S. Automated Rock Mass Characterisation Using 3-D Terrestrial Laser Scanning. Ph.D. Dissertation, Delft University of Technology, Delft, The Netherlands, 2010. [Google Scholar]
  43. Chen, J.; Xiao, S.; Wang, Q. Principles of Computer Simulation for Random Discontinuities in 3D Network; Northeast Normal University Press: Changchun, China, 1995; p. 11. [Google Scholar]
  44. Rodriguez, A.; Laio, A. Clustering by fast search and find of density peaks. Science 2014, 344, 1492–1496. [Google Scholar] [CrossRef] [PubMed] [Green Version]
  45. Gao, F.; Chen, D.; Zhou, K.; Niu, W.; Liu, H. A fast clustering method for identifying rock discontinuity sets. KSCE J. Civ. Eng. 2019, 23, 556–566. [Google Scholar] [CrossRef]
  46. Kulatilake, P.H.S.W.; Wu, T.H.; Wathugala, D.N. Probabilistic modelling of joint orientation. Int. J. Numer. Anal. Methods Geomech. 1990, 14, 325–350. [Google Scholar] [CrossRef]
  47. Priest, S.D. Discontinuity Analysis for Rock Engineering; Chapman & Hall: London, UK, 1993. [Google Scholar] [CrossRef]
  48. Rousseeuw, P.J. Silhouettes: A graphical aid to the interpretation and validation of cluster analysis. J. Comput. Appl. Math. 1987, 20, 53–65. [Google Scholar] [CrossRef] [Green Version]
  49. Tonini, M.; Abellan, A. Rockfall detection from terrestrial LiDAR point clouds: A clustering approach using R. J. Spat. Inf. Sci. 2014, 8, 95–110. [Google Scholar] [CrossRef]
  50. Ni, H.; Lin, X.; Zhang, J. Classification of ALS point cloud with improved point cloud segmentation and random forests. Remote Sens. 2017, 9, 288. [Google Scholar] [CrossRef] [Green Version]
  51. McInnes, L.; Healy, J.; Astels, S. hdbscan: Hierarchical density based clustering. J. Open Source Softw. 2017, 2, 205. [Google Scholar] [CrossRef]
  52. Fischler, M.A.; Bolles, R.C. Random sample consensus: A paradigm for model fitting with applications to image analysis and automated cartography. Commun. ACM 1981, 24, 381–395. [Google Scholar] [CrossRef]
  53. Xu, B.; Jiang, W.; Shan, J.; Zhang, J.; Li, L. Investigation on the weighted RANSAC approaches for building roof plane segmentation from LiDAR point clouds. Remote Sens. 2016, 8, 5. [Google Scholar] [CrossRef] [Green Version]
  54. Lato, M.; Diederichs, M.S.; Hutchinson, D.J.; Harrap, R. Optimization of LiDAR scanning and processing for automated structural evaluation of discontinuities in rockmasses. Int. J. Rock. Mech. Min. Sci. 2009, 46, 194–199. [Google Scholar] [CrossRef]
Figure 1. Workflow chart of the proposed methodology.
Remotesensing 13 02894 g001
Figure 2. Image of a rock slope in Ouray, CO, USA (from the Rockbench repository).
Remotesensing 13 02894 g002
Figure 3. (a) Point clouds of the rock slope. (b) TIN of the rock slope after triangulation.
Remotesensing 13 02894 g003
Figure 4. (a) Isometric 3D network with the projection of the normal vectors of all the sample points; (b) the decision graph of the main potential orientations, which is drawn by the ld and md corresponding to all sample points in the rock slope.
Remotesensing 13 02894 g004
Figure 5. Average silhouette coefficient with different numbers of clusters for the rock slope.
Remotesensing 13 02894 g005
Figure 6. HDBSCAN algorithm segmentation flowchart.
Remotesensing 13 02894 g006
Figure 7. Automatic clustering results according to k is equal to 5.
Remotesensing 13 02894 g007
Figure 8. Cluster identification in a section of a rock slope. (a) One color per discontinuity set with all clusters labelled. (b) J1. (c) J2 and J5. (d) J3 and J4.
Remotesensing 13 02894 g008
Figure 9. (a) Discontinuities marked 13 and 41; enlarged views of discontinuities 13 (b) and 41 (c).
Remotesensing 13 02894 g009
Figure 10. Schematic diagram of the artificial quarry slope.
Remotesensing 13 02894 g010
Figure 11. 3D point clouds (a) and triangular mesh (b) of the artificial quarry slope.
Remotesensing 13 02894 g011
Figure 12. Average silhouette coefficients for different numbers of clusters for the artificial quarry slope.
Remotesensing 13 02894 g012
Figure 13. Discontinuity sets represented by different colors (J1—green, J2—cyan, and J3—red).
Remotesensing 13 02894 g013
Figure 14. Number of discontinuities detected with different triangular mesh sizes.
Remotesensing 13 02894 g014
Figure 15. Segmenting result of Min-pts = (a) 2; (b) 4; (c) 6; (d) 8; (e) 10; (f) 12; (g) 16; (h) 20; and (i) artificial quarry slope image.
Remotesensing 13 02894 g015
Figure 16. The number of discontinuities under different Min-pts.
Remotesensing 13 02894 g016
Figure 17. Calculation of the orientation of the two selected discontinuities 13 (a) and 41 (b).
Remotesensing 13 02894 g017
Figure 18. Deviation between the discontinuities in each discontinuity set and the main orientation.
Remotesensing 13 02894 g018
Table 1. Results of clustering discontinuity sets of the rock slope.
SetDip Direction/Dip Angle (°) by New MethodNumber of ClustersDip Direction/Dip Angle (°) by Riquelme et al. [40]Number of ClustersΔ|DD| (°)Δ|DA| (°)
J1248.17/34.7450249.04/36.66590.871.92
J2172.27/82.2214172.29/83.16140.020.94
J3134.38/81.5966137.33/77.87562.953.72
J493.67/50.8245092.96/48.74340.712.08
J5286.22/65.5655288.45/68.22572.232.66
Table 2. Comparison of orientation results using different methods.
DiscontinuityDiscontinuity Orientations byRiquelme et al. in 2014 (°)Chen et al. in 2016 (°)New Method (°)
Classical Approach (°)Riquelme et al. in 2014 (°)Chen et al. in 2016 (°)New Method (°)Δ|DD|Δ|DA|Δ|DD|Δ|DA|Δ|DD|Δ|DA|
11249.18/40.23246.24/39.02244.62/38.38246.22/38.992.941.214.561.852.961.24
12264.23/57.02256.86/52.3256.18/52.16266.09/54.727.374.728.054.861.862.30
13263.97/41.9170.26/35.8251.04/36.17250.86/36.0913.716.1112.935.7413.115.82
14252.58/36.53252.68/35.48251.44/33.85252.24/37.000.101.051.142.680.340.44
15248.71/36.98249.74/35.91250.82/36.83250.43/35.851.031.072.110.151.731.13
16254.77/29.8670.47/35.91250.46/35.86250.43/35.854.306.054.316.004.345.99
17249.85/35.94255.12/32.82253.19/33.46254.90/32.605.273.123.342.485.053.34
21338.68/82.35339.47/83.25157.55/83.81338.63/82.200.790.901.131.460.050.15
22347.47/79.01166.33/76.58166.31/78.73348.76/80.771.142.431.160.281.291.76
23341.04/89.5160.2/89.86157.52/86.88159.98/88.480.840.363.522.621.061.02
24353.5/76.4173.55/76.85353.07/77.82172.64/77.880.050.450.431.420.861.48
31314.1/77.18136.59/82.58314.73/80.04136.43/86.252.495.400.632.862.249.07
32302.36/75.92131.225/82.67136.52/89.85124.76/79.258.876.7514.1613.932.403.33
33330.19/83.01143.91/89.7145.62/89.85326.47/89.776.286.694.576.853.726.76
41286.12/58.9197.55/63.22285.98/59.8498.10/62.348.574.310.140.938.023.43
42274.18/51.0991.07/50.19272.57/47.6491.09/50.543.110.901.613.453.090.55
43277.22/46.4296.64/47.97277.31/49.3197.24/47.270.581.550.092.890.020.85
51305.04/77.62123.42/76.15305.04/77.62304.07/79.791.621.4716.254.410.972.17
52290.16/66.99105.75/69.94109.29/76.61284.94/69.564.412.950.879.625.222.57
Maximum deviation 13.716.7516.2513.9313.119.07
Average deviation 3.873.034.263.923.072.81
Table 3. Results of the clustering discontinuity sets of the artificial quarry slope.
SetDip Direction/Dip Angle (°) by New MethodNumber of ClustersDip Direction/Dip Angle (°) by Manual MethodNumber of ClustersΔ|DD| (°)Δ|DA| (°)
J1163.64/61.77150160.22/64.58603.422.81
J2198.56/54.61188189.84/44.63818.729.98
J3225.73/66.11172221.93/67.76643.831.65
Average deviation 5.324.81
Table 4. Comparison of different triangle mesh sizes.
Triangle Mesh Size (cm)Number of DiscontinuitiesTime (h)Precision (°)
Δ|DD|Δ|DA|
37363.254.974.53
55101.395.324.81
73560.366.045.73
Table 5. Comparison of calculation directions of different methods.
DiscontinuityDip Direction/Dip Angle Measured byRANSAC (°)The Whole Points (°)
Classical Approach (°)RANSAC (°)The Whole Points (°)Δ|DD|/Δ|DA|Δ|DD|/Δ|DA|
13263.97/41.91250.86/36.09248.73/34.6113.11/5.8215.24/7.30
41286.12/58.9198.10/63.3496.87/64.468.02/4.439.25/5.55
Publisher’s Note: MDPI stays neutral with regard to jurisdictional claims in published maps and institutional affiliations.