Abstract
The leaf area index (LAI) is an important vegetation biophysical index that provides broad information on the dynamic behavior of an ecosystem’s productivity and related climate, topography, and edaphic impacts. The spatiotemporal changes of LAI were assessed throughout Ardabil Province—a host of relevant plant communities within the critical ecoregion of a semi-arid climate. In a comparative study, novel data from Google Earth Engine (GEE) was tested against traditional ENVI measures to provide LAI estimations. Moreover, it is of important practical significance for institutional networks to quantitatively and accurately estimate LAI, at large areas in a short time, and using appropriate baseline vegetation indices. Therefore, LAI was characterized for ecoregions of Ardabil Province using remote sensing indices extracted from Landsat 8 Operational Land Imager (OLI), including the Enhanced Vegetation Index calculated in GEE (EVIG) and ENVI5.3 software (EVIE), as well as the Normalized Difference Vegetation Index estimated in ENVI5.3 software (NDVIE). Moreover, a new field measurement method, i.e., the LaiPen LP 100 portable device (LP 100), was used to evaluate the accuracy of the derived indices. Accordingly, the LAI was measured in June and July 2020, in 822 ground points distributed in 16 different ecoregions-sub ecoregions having various plant functional types (PFTs) of the shrub, bush, and tree. The analyses revealed heterogeneous spatial and temporal variability in vegetation indices and LAIs within and between ecoregions. The mean (standard deviation) value of EVIG, EVIE, and NDVIE at a province scale yielded 1.1 (0.41), 2.20 (0.78), and 3.00 (1.01), respectively in June, and 0.67 (0.37), 0.80 (0.63), and 1.88 (1.23), respectively, in July. The highest mean values of EVIG-LAI, EVIE-LAI, and NDVIE-LAI in June are found in Meshginshahr (1.40), Meshginshahr (2.80), and Hir (4.33) ecoregions and in July are found in Andabil ecoregion respectively with values of 1.23, 1.5, and 3.64. The lowest mean values of EVIG-LAI, EVIE-LAI, and NDVIE-LAI in June were observed for Kowsar (0.67), Meshginshahr (1.8), and Neur (2.70) ecoregions, and in July, the Bilesavar ecoregion, respectively, with values of 0.31, 0.31, and 0.81. High correlation and determination coefficients (r > 0.83 and R2 > 0.68) between LP 100 and remote sensing derived LAI were observed in all three PFTs (except for NDVIE-LAI in June with r = 0.56 and R2 = 0.31). On average, all three examined LAI measures tended to underestimate compared to LP 100-LAI (r > 0.42). The findings of the present study could be promising for effective monitoring and proper management of vegetation and land use in the Ardabil Province and other similar areas.
1. Introduction
Leaf area is the main component in the exchange of matter and energy between tree canopies and the atmosphere, and is considered an important ecological and biological indicator [1,2,3]. Since the ecological values of vegetation in natural ecosystems have a particular priority in regional security supply, the study of leaf production added to the soil every year plays an essential role in soil quality improvement [4,5,6]. Therefore, it is necessary to be aware of the changing pattern of the leaf area index (LAI) in different ecosystems to choose the right land management strategy [7,8]. The vegetation structure strongly influences the net primary production and regulates the light, temperature, wind, and humidity, locally [9,10].
The LAI shows the amount of leaf matter in the ecosystem and is geometrically defined as the area of one side of photosynthetic tissue of leaf per unit land area [11]. The green leaf area could account for the largest part of the plant canopy, which is one of the key factors in the net primary production of the ecosystem, and the exchange of energy between the Earth’s surface and the atmosphere [11]. It also fundamentally affects the canopy reflectance [11]. For this reason, it is also considered one of the main structural variables of the forest and rangeland ecosystems. Therefore, LAI measurement is essential to understand the interactions between plant growth and the environment [12].
Two main methods—direct and indirect—are used to estimate LAI. Both methods were compared in terms of their theoretical background, sensors, errors, and sampling strategies in a vast number of studies (e.g., [13,14,15,16,17]. Jonckheere et al. [14] assigned the leaf collection (through destructive sampling and the model tree method or by non-harvesting litter traps) and the leaf area determination (planimetric or gravimetric) techniques to the direct methods for LAI measurements. The leaf collections can further serve as reference data to calibrate models by which LAI can be indirectly assessed. The indirect contact (i.e., inclined point quadrat and allometric techniques) and indirect non-contact LAI measurement (i.e., optical) methods are also used for LAI estimation. A broad range of instruments can be used for the LAI measurement, including passive and active optical methods. Direct methods provide reliable values for LAI evaluation. In the direct methods (i.e., destructive methods), the leaves are separated from the plant, and the measurements are made using tools, such as surveyors, in small plants with a small number of leaves [18]. The direct method is generally hindered by the large spatial extent of survey regions and its high labor costs, including the travel to difficult-to-reach areas. For this reason, in most countries today, indirect methods such as specific photographic cameras [19], aerial photographs [20], allometric regression models [21,22], or light spectrum reflection in satellite images [23], are used to estimate the LAI. Estimation of LAI through new remote sensing methods also has some sound advantages, including non-destructive measurements and extensive spatial coverage. In the indirect methods, leaf area is observed using different variables, such as the geometric position of the canopy, the amount of light interception, and the length and width of the leaf [24]. Since the field measurement of LAI is very time-consuming and costly, remote sensing serves as a useful alternative to estimate and monitor LAI at various scales, utilizing large samples that can be rapidly collected and automatically processed [14].
One of the most common indirect methods based on remote sensing in LAI estimation is establishing an experimental relationship between LAI and various vegetation indices, including Enhanced Vegetation Index (EVI), Soil Adjusted Vegetation Index (SAVI), and Normalized Difference Vegetation Index (NDVI) [8]. The most widely used vegetation index is the NDVI, which is suitable for estimating vegetation cover, plant production, and vegetation segregation. Although this index estimates the LAI appropriately at values less than three—in LAI values greater than three, it loses its sensitivity to the greenness changes or becomes saturated [25,26]. The EVI provides complete information on the spatial and temporal variations of vegetation and reduces some of the NDVI problems (e.g., its capability to overcome the dust effects on vegetation) [27]. The Google Earth Engine (GEE) system has also been introduced in recent years as one of the most used methods in calculating LAI. The system is capable of spectral processing on a local to global scale using free satellite imagery. GEE is a cloud system that allows analyzing various satellite images on a local to global scale. This system is an extensive database of radiometric and atmospheric corrected images worldwide that can be easily used [28]. The ENVI software is also frequently used as a platform for the estimation of vegetation indices and LAI from different satellite images. A successful application of this software requires a preprocessing of the images and further classifications. Recently, the GEE [29,30] simplified these steps by providing a single platform for server-side image acquisition, preprocessing, processing, and visualization. Moreover, the methodology in the GEE platform enables online tests and modifications. Nevertheless, Landsat data from GEE have not been applied in LAI mapping, although this platform is highly applicative for institutional networks in remote areas and with limitations in computational power.
Recently, the LaiPen LP 100 (LP 100) was designed and introduced as one of the field methods of LAI estimation. This device quickly eliminates the disadvantages of direct methods and can be used for the shrub, bush, and tree species [31]. The LP 100 has a lower weight and a higher measurement speed than other devices used to measure LAI in natural ecosystem species (for example, digital plant canopy imager). An additional advantage of LP 100 is that it works under light conditions (lighting hours), i.e., cloud cover is not required, such as with other similar tools [27]. A high sensitivity, an integrated sensor for measuring foliage inclination, and different angles measurement are further benefits of the LP 100. For fast, convenient, and repeatable measurements with instant readings, light is measured by LP 100 from five different zenith angles, and LAI is then calculated using a radioactive transfer model in vegetative canopies.
There are various results concerning the accuracy assessment of different methods in LAI estimation. The similar reliability, accuracy, and methodology of LP 100 and LAI-2200 PCA as the “world standard” is confirmed by several studies [2,32,33,34]. The accuracy of LAI derived from Landsat 7 (ETM+) and Landsat 8 (OLI) was assessed in [35] using the LI-COR LAI-2200 Plant Canopy Analyzer and field data from loblolly pine plantations in the USA. Results showed an R2 of 0.32–0.83 for and a root mean square error (RMSE) of 0.41–1.10 for when LAI estimates were derived from various vegetation indices. Campos-Taberner et al. [36] derived the LAI on a global scale using MODIS products of GEE. Their results verified the consistency of the GEE-MODIS products in the estimation of biophysical variables, such as LAI. According to the literature, no study compared the accuracy of LP 100 and remote sensing data of Landsat simultaneously with the direct measurement. Moreover, no study has yet been conducted on the accuracy assessment between GEE and LP 100. Consequently, the present study will demonstrate new facilities using the Landsat product of GEE and the LP 100, especially when the study area is large, the budget is limited, and/or the time is limited.
Although plant functional types (PFTs) have relatively similar spectral properties (high absorption in RED and high reflection in NIR), they have specific properties in different ecoregions depending on the vegetation canopy structure. The spatial and temporal variability of spectral properties and, consequently, LAI, are verified for different ecosystems of the world, such as in Niger [37], China [38,39], Switzerland [40], and Australia [41]. The LAI estimates are affected by the environmental conditions and mainly through climatic (e.g., precipitation and temperature), environmental stressors (e.g., insect damage, drought, weeds, and nutrient deficiency), and phenological conditions. For example, Meng et al. [39] reported the interrelation of vegetation greenness based on LAI estimation with climatic and hydrological variables. They verified the enhancement of vegetation greening due to the wetting climate in northern China is also stated by previous studies (e.g., [38]). Spatiotemporal variations are also reported in the canopy reflectance and differences in plant performance [42,43]. Variations in plant canopy and leaf structure, as well as pigment and water content, can result in changing reflectance properties, even between closely related species [42,44,45]. It is known that the spectral properties of plant species depend on plant physiology, morphology, or anatomy [43].
Various studies have been performed to estimate LAI using vegetation indices throughout the world [2,8,21,45,46,47,48,49,50,51,52,53,54,55]. For instance, Goswami et al. [47] showed that the NDVI for six key species in Alaska has a very high correlation with production (R2 = 0.83) and LAI (R2 = 0.70), but where the production value was more than 100 g m−2 and LAI more than 2, the NDVI was saturated. A high correlation (R2 = 0.88) between LAI and production was also confirmed. A weak relationship (p > 0.05) between LAI and vegetation indices during the flowering period was reported by Qiao et al. [8]. Towers et al. [46] also reported the inadequate sensitivity of NDVI in the LAI estimation. Lovynska et al. [50] estimated LAI by direct and indirect methods in the steppe regions of northern Ukraine in Scottish pine trees. Their results showed that the LAI obtained by the direct method was, on average, 8.8% higher than that calculated by the indirect method. In addition, Mani et al. [49] used the LaiPen device in their studies to calculate the LAI of teak trees in India and the statistical relationship between the terrestrial data and vegetation indices obtained from Landsat 8 and Advanced Wide Field Sensor (AWiFS) satellite images. Their results showed a positive relationship between terrestrial data and spectral reflectance of the NIR band and an inverse relationship with the red band. The validation of the model, based on ground-based LAI, showed that Landsat 8 and the AWiFS model derived LAI image showed better correlation and lower RMSE, and indicated a strong correlation between the measured and estimated LAI. In Iran, Behbahani et al. [51] investigated the possibility of using vegetation indices derived from ASTER-L1B sensor data to determine the canopy cover percentage of single trees in arid woody rangelands. The results indicated significant correlations. Among the indices, NDVI and the Modified Soil-Adjusted Vegetation Index (MSAVI) presented a stronger statistical correlation than the other indices with the crown cover area, having a correlation coefficient of 0.61 and a standard error of 5.58. Adl [21] also calculated the LAI of two species of oak (Quercus brantii) and pistachio (Pistacia atlantica) in forests of Yasuj County, southwestern Iran. The gravimetric method was used to calculate the leaf area index in which the relationship between “leaf area” and “dry weight” was used as criteria for estimating the total area of the tree leaves. The mean LAI in the study forests was estimated to be 1.2. Asadi et al. [52] compared different spectral vegetation indices for remote sensing of LAI of winter wheat in Mashhad, northeast Iran. The results showed higher accuracy in estimating wheat LAI using the NDVI and SAVI based on the exponential functions than the linear model. Moreover, the highest accuracy in LAI estimation was observed using the combination of the greenness (G2) index or SAVI and EVI due to the greater sensitivity of the G2 index to medium and high LAI than NDVI.
According to the literature review, it could be concluded that the LAI analysis using modern rapid assessment methods, such as GEE and LP 100, is highly important to plan, monitor, and manage critical natural capitals. However, Ardabil Province, located in northwestern Iran, enjoys diverse ecological natural ecosystems; there are no comprehensive reports on the spatial and temporal changes of LAI. Accordingly, the major goals of the present study were: (i) to examine the applicability of different remote sensing indices to analyze the LAI in different PFTs of various ecoregions of Ardabil Province; (ii) to compare the LAI values in two months (June and July 2020) according to the growing conditions of the study areas; and (iii) to assess the accuracy of LAI derived from remote sensing indices using modern equipment of LP 100. Since, the present study is the first endeavor to quantify the LAI using different vegetation indices and estimation tools in the critical ecoregions of Ardabil Province, located in Iran (western Asia), the findings will be vital to the land planning and policy-making at local, regional, national, and international levels.
2. Materials and Methods
2.1. Study Area
The study ecoregions of Ardabil Province included Andabil, Bilesavar-Khoroslo, Darband Hir, Germi, Hashtjin, Hatam Meshasi forests, Khalkhal forests, Kowsar highlands, Namin highlands, and Neur Lake highlands (Figure 1, Table 1). There were three PFTs, i.e., shrub, bush, and tree. In this study, the shrub was a small- to medium-sized perennial woody plant, less than 50 cm height; the bush was considered the plant with many small branches growing either directly from the ground or a hard stem, from 50 cm to less than seven meters in height; the tree was a woody perennial plant, having a single (usually elongated) main stem, generally with few or no branches on its lower part, with a height of over seven meters.
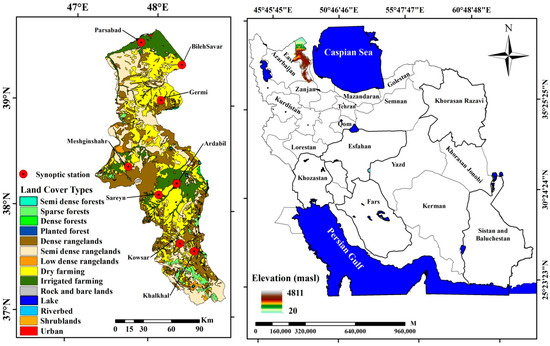
Figure 1.
General view from Ardabil Province location, elevation, land cover, and location of synoptic stations [53].

Table 1.
General characteristics of the study ecoregions in Ardabil Province.
Ardabil Province is situated in a cold region of northwestern Iran with an area of 17,952 km2, about one percent of the total area of the country. Its mean altitude is 1400 m above sea level (m a.s.l.). The lowest inner point with a height of 20 m a.s.l. is in Parsabad and Bilesavar counties, and Sabalan, with an elevation of 4811 m a.s.l., is the highest peak of the province. The maximum and minimum annual temperature in Ardabil Province varies from 14.3 to 20.5 °C and 1.5 to 9.7 °C, respectively. Ardabil Province has diverse ecological and climatic conditions due to the complexity of natural conditions, geological and geomorphological diversity, and the diversity of factors affecting its climate. The northern part of the province has a temperate climate due to its low altitude. The province’s climate mainly depends on four factors: altitude, latitude, water resources, and moving air masses. Other factors, such as vegetation, small-scale industrial, mining, and agricultural activities are affected by climate [54]. Daddeh et al. [55] verified the rainfall seasonality in Ardabil Province and reported winter as the main rainfall season for almost the entire Ardabil Province. In addition, some parts of the center and south of the province experience the highest rainfall during the spring season, and very small parts in the east and west stations had a humid autumn season. A positive correlation with seasonal rainfall (autumn and winter) for shrub growing around Meshginshahr, was found by Sharifi and Akbarzadeh [56], who stated that the maximum correlation between vegetation variations of the bush was attributed to the autumn rainfall. The response of the shrub species of the Khalkhal ecoregion to seasonal and annual rainfall changes is slow, which means that this PFT, in addition to using rainfall at the time of its fall, also uses the moisture stored deep in the soil throughout the year by its deep roots. The soil moisture storage of this rangeland (with sandy loam to loamy texture) compensates for rainfall fluctuations for shrub species, so that during the year, the shrubs have access to the required moisture [57,58].
To verify the results of the remote sensing results, it was essential to choose similar months for LP 100 measurements, while considering some critical conditions (maximum greenness, availability of images without cloudiness, and on-site measures). Two months consideration (i.e., June and July) in this studywas attributed to the large area of the study province (i.e., 17,952 km2); it was impossible to sample all study ecoregions in one month. The climatic properties (Table 2) of the Ardabil Province’s synoptic stations (Figure 1) showed that, in June, the rainfall was higher, and the temperature was lower than in July throughout the province.
Table 2.
Climatic properties of Ardabil Province synoptic stations.
2.2. Methodology
In the present study, LAI was calculated using (i) EVI in the GEE system (hereafter called EVIG-LAI); (ii) EVI and NDVI in the ENVI5.3 software (hereafter called EVIE-LAI, and NDVIE-LAI, respectively); and (iii) LP 100 device (hereafter called LP-LAI). The flowchart of these calculations is depicted in Figure 2.
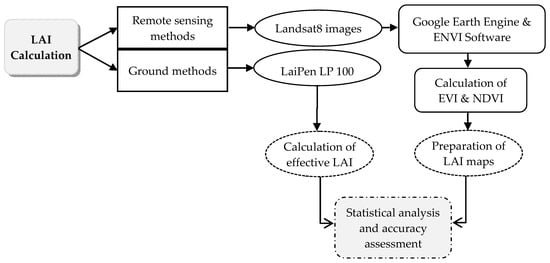
Figure 2.
Flowchart of research.
2.2.1. Satellite Images Used and Processed
Image data from only two months, June and July, were selected for the LAI estimation due to a number of reasons. First, this period covers the growing seasons; second, cloudiness is usually more likely during the summer; and third, due to a consequence of field-collected data with selected images for accuracy assessment. To calculate the LAI in the GEE system, 22 radiometrically and atmospherically corrected Landsat 8 satellite images covering all areas of the Ardabil Province, related to June and July 2020, were used (the detailed information can be found at https://code.earthengine.google.com/d3ca88dea99bcbf166ec3505df2f2c2c; accessed on: 1 June 2021). Furthermore, to calculate the LAI in the ENVI 5.3 software, the Landsat 8 images of June and July 2020 were downloaded from the USGS website (https://www.usgs.gov/; accessed on: 1 June 2021; Table 3). Then, the image processing, including geometric, radiometric, and atmospheric correction, was done. The radiometric and atmospheric corrections were performed with the radiometric calibration and flash algorithm in ENVI 5.3 software [59].
Table 3.
Specifications of Landsat 8 satellite images used in the present study.
2.2.2. Calculation of Vegetation Indices and LAI
Spectral indices in remote sensing refer to inter-band equations, in which two or more bands with different reflectance shapes in connection with a phenomenon are used. Spectral indices are applied to detect biophysical and biochemical parameters in satellite images [5]. Using the three bands of Blue, Red, and near-infrared (NIR) of Landsat 8 satellite images, the vegetation indices of EVI and NDVI were calculated as expressed in Equations (1) [60] and (2) [61].
EVI = 2.5 × (NIR − Red)/(NIR + 6 × Red − 7.5 × Blue + 1)
NDVI = (NIR − Red)/(NIR + Red)
In the GEE system, the LAI map was prepared by calculating the EVI and coding the LAI equation (Equation (3)). The average LAI values for each ecoregion were considered, as well.
Two indices of EVI and NDVI were also used to calculate the LAI in the ENVI5.3 software as given in Equations (3) [62] and (4) [63].
LAI = 3.618 × EVI − 0.118
LAI = 0.57 × exp (2.33 × NDVI)
2.2.3. LP 100 Device (Field Measurements)
To evaluate the accuracy of LAI estimated by remote sensing indices in ecoregions of Ardabil Province, 822 ground truth points (Table 1; Figure 3) that included PFTs of the shrub, bush, and tree were systematically selected for LAI measurement using LP 100. Different replications were used for each PFT and ecoregion dependent on the frequency of each PFT and the total area of the study ecoregions (Table 1; Figure 3). The operating instructions of LP 100 for LAI measuring are followed as entirely explained in the LP 100 Manual and User Guide [64]. This device is equipped with two sensors of LAI and photosynthetically active radiation (PAR). For this study, the LAI sensor located below the device cap was used. This sensor measures the irradiance of the blue part of solar radiation (400–500 nm, ALAI) as the most important part of the spectrum absorbed by green leaves. The revised Lambert–Beer extinction law [64] was used to determine the LAI based on the ALAI transmittance as presented in Equation (5):
where, I and I0, respectively, represent the radiation intensity in the lower and upper parts of the vegetation. The ratio of I to I0 expresses the ALAI transmittance. K is the extinction factor dependent on the vegetation canopy shape, orientation, and position [15]. The reference value measurements for ALAI were also done in an open space. The Darband Hir, Neur, Kowsar, Meshginshahr, and Namin ecoregions (Figure 1) were subjected to LP 100 application in June 2020, and the rest of the ecoregions were considered in July 2020. In total, the collection period for LP 100 ranged from 13 June to 25 July 2020.
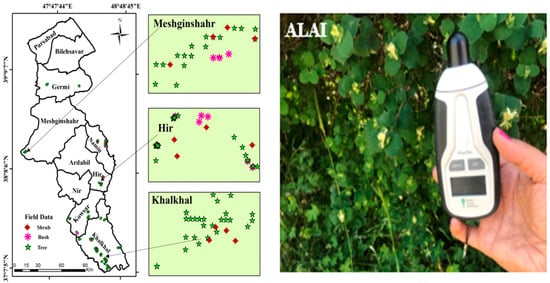
Figure 3.
Location of ground truth points (Left) and LP 100 application for ALAI calculation in the study area (right; e.g., Namin highlands).
2.2.4. LP 100 Device Validation
VitiCanopy App was applied for LP 100 validation (detailed information provided in [65,66]). To this end, six repetitions from each PFT were subjected to VitiCanopy and LP 100, simultaneously, and the LAIs were calculated. Moreover, Babaei Kafaki et al. [67], studied the LAI of Quercus macranthera using the direct method in the 278-hectare forest located northeast of Khalkhal, the LAI was obtained 3.33, which was considered as an additional basis for LP 100 validation.
2.2.5. Geographic Information System (GIS) Application
The ArcGIS 10.8 was used to show the spatial distribution of the sampled points recorded by the global position system and LP 100 throughout the field survey. In addition, the base maps (pixel size = 30 m) of elevation, land use [53], vegetation indices, and LAIs were finalized in this environment. To provide the base data for scatter plots of comparisons, the “extract by points” and the “zonal statistics” functionalities in GIS were also used to derive the vegetation indices and LAIs of the produced maps, from ENVI and GEE for all points recorded by LP 100. To facilitate appropriate comparison between field and remote sensing, the LAI data of LP 100 in each homogeneous pixel size of 30 m were averaged and then used for the accuracy assessment.
2.2.6. Statistical Analysis and Accuracy Assessment
The correlation coefficient (r) was used to examine the relationship between the two datasets of the LAI field measurements and the estimates via remote sensing. To mitigate spatial misalignments, the LAI estimates from the aerial images were extracted with pixel size resolutions for each PFT, and subsequently averaged for each ecoregion/sub-ecoregion. To evaluate the performance of the data obtained from satellite images compared to the ground data, five error assessment criteria were used [6,68] (Equations (6) to (10)):
1. Mean bias error (MBE) indicates the difference between the mean of remote sensing (LAIRS) and LP 100 (LAILP) derived LAIs (Equation (6). Although this criterion is the average bias error of the overall remote sensing method, and not a good error measure—it primarily facilitates seeing how much remote sensing methods overestimate or underestimate the LAI values. Negative and positive MBE indicates underestimation and overestimation, respectively. Where the MBE is zero, there is validity, and it shows the desirable LAI estimation.
2. The multiplicative bias (MBias) is expressed as the ratio of the LAIRS to LAILP (Equation (7)). MBias values of one, less than one, and more than one, respectively, indicate perfect, low, and high estimation of LAI using remote sensing methods.
3. The relative bias (RBias) addresses the systematic bias of remotely sensed LAIs and behaves the same as MBE. The systematic bias is commonly associated with sensor systems and methods used in the LAI generation process (Equation (8)).
4. Mean absolute error (MAE) is a measure of dispersion that gives the average magnitude of estimated errors. Due to its low sensitivity to distant outliers and being less subject to interpretation, it is preferred by many researchers. MAE is always positive. The closer the MAE and MBE criteria are to zero, the more accurate the method indicates.
5. Root mean square error (RMSE) is defined as the square root of the square mean of all of the errors. RMSE is one of the most widely used performance criteria. The lower it is (close to zero), means the lower the error.
3. Results
The results of LP 100 validation through the VitiCanopy app (Table 4) verified the LP 100 application (r > 0.91; R2 > 0.83; RMSE < 0.51). In addition, in the preliminary, the results of the vegetation indices used for LAI assessment and the LAI extracted maps for the Ardabil Province are depicted in Figure 4 and Figure 5. The results of LAI analysis based on remote sensing methods for different sampling months and PFTs are also given in Table 5 and Table 6. Scatter plots of remote sensing-based and LP 100 LAIs for different PFTs and months are shown in Figure 6 and Figure 7. Furthermore, the relationships between remote sensing vegetation indices and LP-LAIs for different PFTs and sampling months were analyzed, as shown in Figure 8 and Figure 9, respectively. Finally, the results of the accuracy assessment for each study month and PFT are summarized in Table 7.
Table 4.
Results of LP 100 validation through the VitiCanopy (VC) application.
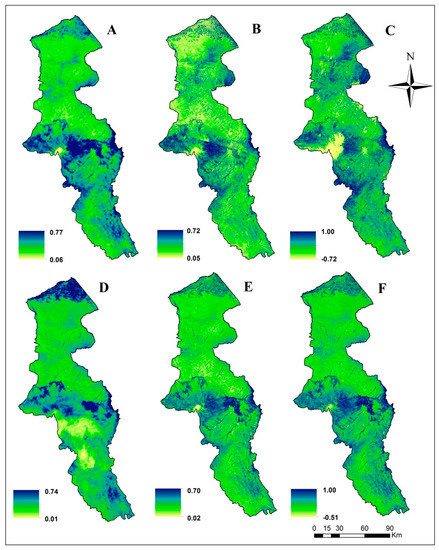
Figure 4.
Maps of vegetation indices produced from GEE and ENVI 5.3 in June (up) and July (down) 2020 (A: EVIG (June), B: EVIE (June), C: NDVIE (June), D: EVIG (July), E: EVIE (July), F: NDVIE (July)).
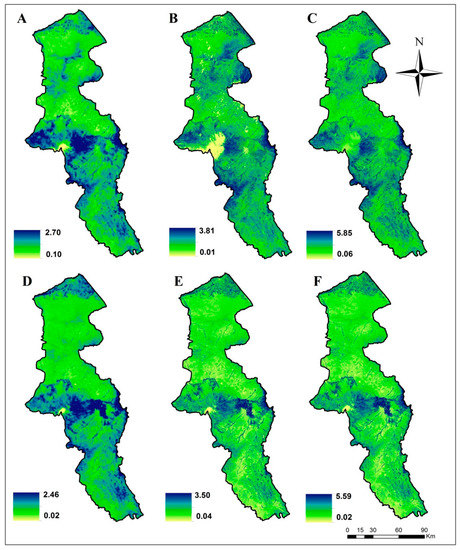
Figure 5.
Maps of LAI produced from different vegetation indices in June (up) and July (down), 2020 (A: EVIG-LAI (June), B: EVIE-LAI (June), C: NDVIE-LAI (June), D: EVIG-LAI (July), E: EVIE-LAI (July), F: NDVIE-LAI (July)).
Table 5.
Remote sensing LAI values for different sampling months.
Table 6.
Remote sensing LAI values for different PFTs.
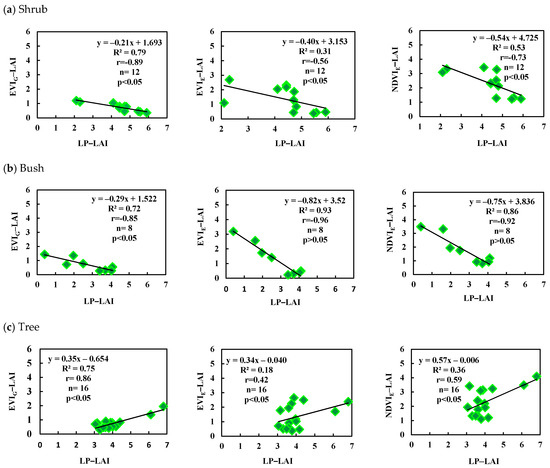
Figure 6.
Scatter plots of remote sensing-based and LP 100 LAIs for different PFTs of (a) shrub, (b) bush, and (c) tree.
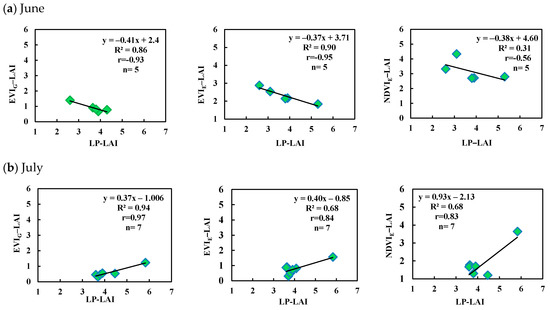
Figure 7.
Scatter plots of remote sensing-based and LP 100 LAIs in (a) June and (b) July.
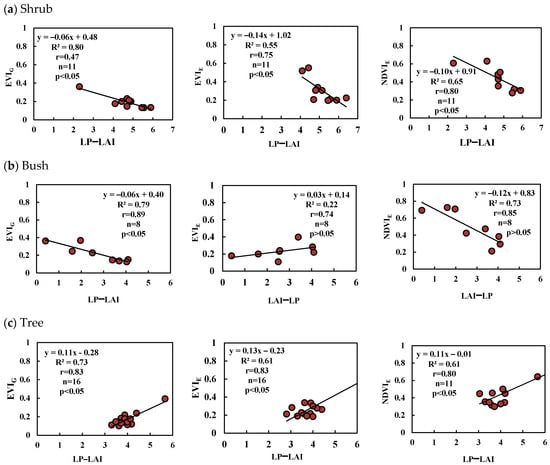
Figure 8.
Scatter plots of remote sensing vegetation indices and LP-LAIs for different PFTs of (a) shrub, (b) bush, and (c) tree.
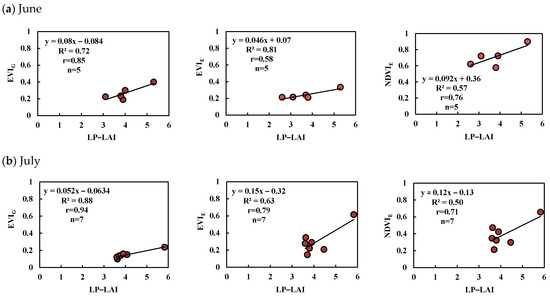
Figure 9.
Scatter plots of vegetation indices and LP-LAIs in (a) June and (b) July.
Table 7.
Results of accuracy assessment for each study month and PFTs.
4. Discussion
4.1. Vegetation Indices
According to the produced maps of EVI using GEE and ENVI 5.3 (hereafter called EVIG and EVIE, respectively), and NDVI using ENVI 5.3 (hereafter called NDVIE), there are high spatial variations throughout the Ardabil Province. The EVIG, EVIE, and NDVIE, respectively, ranged from 0.06 to 0.77, 0.05 to 0.72, and −0.72 to 1.00 in June and 0.01 to 0.74, 0.02 to 0.70, and −0.51 to 1.00 in July (Figure 4). As shown in Figure 4, there is also a high spatial and temporal heterogeneity in the province in the viewpoint of all vegetation indices. This heterogeneity is partly attributed to large change patterns in land cover and land use governing the Ardabil Province (Figure 1), the difference in rainfall and temperature (Table 1), and partly related to environmental changes (e.g., soil moisture). In June, the growing season is ongoing (or: “just started”), but due to higher rainfall and a lower temperature, the drought stress is reduced, and the photosynthesis rates are increased. Hence, the vegetation indices in June were higher than in July [69,70].
The spatial distribution of vegetation indices showed that the small regions in the north and south and main parts of the center of the province have better vegetation cover levels, demonstrating the high photosynthetic activity and biomass accumulation. From north to center, mainly, but some parts of the south have low values of vegetation indices. The land cover types in Ardabil Province are diverse, covering the sparse vegetation, trees, bushes, shrubs, grassland, meadow land, wetlands, residential, industrials lands, dry farming lands, irrigated farming lands, and horticulture (Figure 1). In addition, the elevation is also very high, and it reaches more than 4700 m a.s.l. (Figure 1). Similar results were found by Matsushita et al. [26], who verified the spatial variation of vegetation indices in Japan. They also noted that the EVI is more sensitive to topographic conditions of the mountainous areas covered by a high-density Japanese cypress plantation than the NDVI. Moreover, Silveira et al. [71], for Cerrado, deciduous, and semi-deciduous forest in the north of Minas Gerais, Brazil, revealed an agreement between vegetation indices and the monthly precipitation pattern. In the Central Valley in Costa Rica, Martín-Ortega et al. [46] also verified a strong correlation between illumination conditions and vegetation indices of EVI and NDVI calculated by GEE. Since this study is the first effort to calculate LAI at a vast spatial scale covering different vegetation, the obtained maps and database of vegetation indices are very useful for the modeling and monitoring of land use changes, as well as for the conservation of critical ecoregions of the Ardabil Province.
4.2. Remote Sensing-Based LAI
LAI distribution maps showed that LAI values extracted from various methods differed in the Ardabil Province (Figure 6) and their temporal variations were consistent with plant phenology (Figure 6, Table 5 and Table 6). The lowest EVIG-LAI, EVIE-LAI, and NDVIE-LAI levels were observed for some parts from west and north in June. The rest of the province is characterized by a moderate and high level of LAIs. As shown in Figure 7, the behavior of LAIs in July differed from the previous month. The mean values of EVIG-LAI, EVIE-LAI, and NDVIE-LAI, respectively, were 0.90, 2.30, and 3.17 in June and 0.68, 0.81, and 1.73 in July (Table 6). This finding is also in agreement with Zhu et al. [72], who found significant effects of measurement seasons on LAI values (p < 0.001) in subtropical forests, southern China.
In Figure 6c (tree), the low R2 associated with the linear model of the LP 100-EVIE-LAI (0.18); and higher R2 for EVIG-LAI (0.75) verified the appropriate efficiency of integration of GEE with EVI as a base for LAI estimation. In general, as can be seen from the total results, the LAI derived from the integration of EVI and GEE showed relevant and reliable results.
Whereas the minimum values of all study LAI methods were similar and close to zero, the maximum LAI values showed considerable differences. The maximum value for EVIG-LAI, EVIE-LAI, and NDVIE-LAI was respectively 1.40, 2.88, and 4.33 in June, and 1.20, 1.56, and 3.64 in July. In total, the LAI derived from the June vegetation indices were higher than those for July. This was because of the higher greenness of the dominating vegetation cover in this period. In addition, the range between minimum and maximum LAI in July was lower than in June, indicating the similar ecological variation of critical regions of the Ardabil Province. The obtained temporal variations of LAI in Ardabil Province provide useful information for sampling approaches to accurately estimate LAI based on the indirect measurements. Because of higher greenness and vegetation cover due to more rainfall and less drought stress in June, the LAI was higher than in July, irrespective of the study PFTs.
This study also extracted the LAI in pixel scale for each PFT. As reported in Table 1, different PFTs are dominant in some ecoregions of Ardabil Province; the values of EVIG-LAI, EVIE-LAI, and NDVIE-LAI for each PFT are summarized in Table 6. The results indicate the different behaviors of LAIs for the study of PFTs of the shrub, bush, and tree.
4.3. Results of Statistical Analysis and Accuracy Assessment
The mean of the remote sensing LAI range was plotted against the measured LAI by LP 100 for each PFTs (Figure 7). In all cases, this expected LAI was linearly related to and slightly underestimated the LP-LAI (r > 0.42). The results showed that the correlation between remote sensing estimations and terrestrial data was positive in the tree PFT and negative in the bush and shrub PFTs (Figure 6 and Figure 7). This was because, the trees generally provided a uniform and dense coverage, while the coverage of the shrub and bush plots was rather sparse and showed a higher heterogeneity. Given that the satellite imagery calculates the LAI from plant reflections and the LP 100 calculates the LAI based on light passing through the leaves of trees, it is speculated that the LP 100 LAI measurements in the tree PFT was affected by the shadow of the trees, and it performed similar to the remote sensing method. These contrary results could be related to ecological or biological functions of the study of PFTs and would need further investigation and additional experiments that would fall beyond the scope of this work.
The EVIE-LAI for the bush and tree, respectively, received the most and the least correlation and determination coefficients (Figure 6). In addition, for the bush, the EVIE-LAI showed higher correlation and determination coefficients concerning LP-LAI rather than NDVIE-LAI and EVIG-LAI. Adversely, for shrub and tree PFTs, the EVIG-LAI represented better correlation (r > 0.86) and determination (R2 > 0.75) coefficients. These results are also verified by the correlation analysis conducted individually for each month. A negative relationship was observed between remote sensing LAIs and LP-LAIs for the bush and shrub. However, in July, due to the dominant PFT of trees in the study areas, the terrestrial LAI values were positively correlated with remote sensing indices (Figure 7). The results (Figure 7) showed high correlation and determination coefficients between terrestrial and remote sensing derived LAI in all three PFTs (r > 0.83 and R2 > 0.68) (except for NDVIE-LAI in June with r = 0.56 and R2 = 0.31). Usually, trees with different heights have different functions to maximize their photosynthetic efficiency in different environmental conditions [73].
To clarify the behavior dependence between remotely sensed vegetation indices and extracted LAIs with LP 100 results, the LP-LAIs were plotted against the used vegetation indices for each PFTs and months (Figure 8 and Figure 9). The results (Figure 8) verified the sound correlation (r > 0.47) and determination coefficients (R2 > 0.55, except for EVIE (R2 = 0.22)) between LP-LAI and vegetation indices. The results showed a positive correlation between remote sensing vegetation indices and LP-LAI in both study months (Figure 9). A similar trend was found for vegetation indices and LAI-extracted versus LP-LAI for all PFTs (except EVI-E). In addition, the un-similar and similar behavior of vegetation indices and LAI-extracted versus LP-LAI were confirmed, respectively, in June and July. To interpret these somehow conflicting results, it is suggested to record the species types of each monitored PFT in the future. Distinguishing the stand types of each PFT could also be helpful for our future research.
The accuracy assessment of the generated LAI maps was checked using MBE, MBias, RBias, MAE, and RMSE. Information on these methods is presented in Table 7. The calculated MBE and RBias for all remote sensing LAI in different months and PFTs were negative (−0.54 < MBE < −0.04; −84.81 < RBias < −25.88), indicating underestimation of the LP-LAI. The range of MBias values is between 0.15 and 0.74, indicating an acceptable agreement between the remote sensing and terrestrial measurement data [73]. Moreover, the MAE less than 0.54 and RMSE less than 1.59 indicated reliable results for study months and PFTs.
5. Conclusions
In the present study, the capability of the Landsat 8 Operational Land Imager (OLI) images processed using Google Earth Engine (GEE) and ENVI5.3 environments was evaluated in the Leaf Area Index (LAI) estimation. The accuracy was checked with LAI measured by LP 100 as a modern device. The advantages of the LP 100 device, in LAI estimation, in contrast to complicated and time-consuming methods, is it is user-friendly, has high accuracy, and takes less time in LAI estimation (in a large scale of studies). In our study, 822 ground truth points were collected from 10 different ecoregions in two months (June and July) and three PFTs (bush, shrub, and tree). The Enhanced Vegetation Index (EVI) and Normalized Difference Vegetation Index (NDVI), as widely used vegetation indices, were extracted. Then, the LAI was provided from EVI in the GEE system (EVIG-LAI), EVI, and NDVI in the ENVI5.3 software (EVIE-LAI, and NDVIE-LAI, respectively), and LP 100 (LP-LAI).
The main results could be summarized as below:
- -
- In terms of vegetation indices and their extracted LAIs, the spatial and temporal variations were confirmed throughout the Ardabil Province.
- -
- Similar trends were found for vegetation indices and LAIs in spatial and temporal scales.
- -
- The lowest vegetation indices and LAIs were extended from north to center and a small part from south of the province.
- -
- The results confirmed the applicability of remote sensing data to LAI estimation of ecoregions of the Ardabil Province.
- -
- High correlation was found between LAI values of remote sensing and LP 100 in June and July (r > 0.83 and R2 > 0.68; except for NDVIE-LAI in June with r = 0.56 and R2 = 0.31).
- -
- The most and least correlation and determination coefficients were attributed to the EVIE-LAI for the bush and tree, respectively.
- -
- Concerning LP-LAI for bush PFT, the higher correlation and determination coefficients were related to the EVIE-LAI rather than NDVIE-LAI and EVIG-LAI.
- -
- The Multiplicative Bias (MBias) between 0.15 and 0.74, the mean absolute error (MAE) less than 0.54, and root mean square error (RMSE) less than 1.59 verified an acceptable agreement between the remote sensing and LP 100 measurements of LAI. The scrutiny of the estimation method for LAI, with higher precision, is a problem that should be dealt with in future research. Accordingly, further research needs to be carried out to explore the relationships between environmental variables on the behavior of vegetation indices in the province. Furthermore, due to the novelty of LP 100 in the LAI study, more insightful investigations with other devices are recommended as complementary research to be considered in the future.
Author Contributions
L.A. (first author), original researcher/introduction author/methodologist/statistical analyst/writing—review and editing (30%); A.G. (second author), original researcher/methodologist/statistical analyst/discussion author/writing—review and editing (25%); M.M. (third author), methodologist/statistical analyst (20%); Z.H. (fourth author), assistant researcher/statistical analyst/writing—review and editing (10%); A.N. (fifth author), assistant researcher/writing—review and editing (5%); R.J. (sixth author), assistant researcher (5%), F.D. (seventh author), assistant researcher/writing—review and editing (5%). All authors have read and agreed to the published version of the manuscript.
Funding
The present work was financially supported by the Department of Natural Resources, University of Mohaghegh Ardabili, Iran, and the Department of Forest and Soil Sciences, University of Natural Resources and Life Sciences (BOKU), Austria.
Institutional Review Board Statement
Not applicable.
Informed Consent Statement
Not applicable.
Data Availability Statement
Available upon request.
Acknowledgments
The authors thank and appreciate the University of Mohaghegh Ardabili (Iran), and the University of Natural Resources and Life Sciences (BOKU; Austria), who provided the facilities to do the present study. The authors are grateful to André Große-Stoltenberg from the University Gießen (JLU; Germany), and Murat Alan from the University of Karabük (Turkey), for their valuable comments in the initial version of the manuscript, which substantially improved the paper.
Conflicts of Interest
The authors have no conflict of interest.
References
- Pourhashemi, M.; Eskandari, S.; Dehghani, M.; Najafi, T.; Asadi, A.; Panahi, P. Biomass and leaf area index of Caucasian Hackberry (Celtis caucasica Willd.) in Taileh urban forest, Sanandaj, Iran. Iran. Jungle Poplar Res. Q. 2011, 19, 609–620. [Google Scholar]
- Černý, J.; Krejza, J.; Pokorny, R.; Bednar, P. LP 100—A new device for estimating forest ecosystem leaf area index compared to the etalon: A methodologic case study. J. For. Sci. 2018, 64, 455–468. [Google Scholar] [CrossRef]
- Tan, C.W.; Zhang, P.P.; Zhou, X.X.; Wang, Z.X.; Xu, Z.Q.; Mao, W. Quantitative monitoring of leaf area index in wheat of different plant types by integrating NDVI and Beer-Lambert law. Sci. Rep. 2020, 10, 929. [Google Scholar] [CrossRef]
- Miri, N.; Darvish Sefat, A.A.; Zargham, N.; Shakeri, Z. Estimation of leaf area index in Zagros forests with Landsat satellite 8 data. Iran. J. For. 2017, 9, 29–42. [Google Scholar]
- Hadian, F.; Jafari, R.; Bashari, H.; Tarkesh, M. Modeling of semi-steppe rangelands degradation in Isfahan Province using MODIS images. Iran. J. Remote Sens. GIS 2019, 11, 1–20. [Google Scholar] [CrossRef]
- Ghorbani, A.; Dadjou, F.; Moameri, M.; Biswas, A. Estimating aboveground net primary production (ANPP) using Landsat 8-based indices: A case study from Hir-Neur rangelands, Iran. Rangel. Ecol. Manag. 2020, 73, 649–657. [Google Scholar] [CrossRef]
- Ma, H.; Song, J.; Wang, J.; Xiao, Z.; Fu, Z. Improvement of spatially continuous forest LAI retrieval by integration of discrete airborne LiDAR and remote sensing multi angle optical data. Agric. For. Meteorol. 2014, 1, 60–70. [Google Scholar] [CrossRef]
- Qiao, K.; Zhu, W.; Xie, Z.; Li, P. Estimating the seasonal dynamics of the leaf area index using piecewise LAI-VI relationships based on phenophases. Remote Sens. 2019, 11, 689. [Google Scholar] [CrossRef] [Green Version]
- Meyers, P.; Kyaw, T.P.U. Modelling the plant canopy micrometeorology with higher-order closure principles. Agric. For. Meteorol. 1987, 41, 143–163. [Google Scholar] [CrossRef]
- Zheng, G.; Moskal, L.M. Retrieving leaf area index (LAI) using remote sensing: Theories, methods and sensors. Sensors 2009, 9, 2719–2745. [Google Scholar] [CrossRef] [Green Version]
- Majasalmi, T.; Rautiainen, M.; Stenberg, P.; Lukeš, P. An assessment of ground reference methods for estimating LAI of boreal forests. For. Ecol. Manag. 2013, 292, 10–18. [Google Scholar] [CrossRef]
- Jesus, W.C.J.; Vale, F.X.R. Comparison of two methods for estimating leaf area index on common bean. Agron. J. 2001, 93, 989–991. [Google Scholar] [CrossRef]
- Bréda, J.J.N. Ground-based measurements of leaf area index: A review of methods, instruments and current controversies. Exp. Bot. 2003, 54, 2403–2417. [Google Scholar] [CrossRef] [PubMed]
- Jonckheere, I.; Fleck, S.; Nackaerts, K.; Muysa, B.; Coppin, P.; Weiss, M.; Baret, F. Review of methods for in situ leaf area index determination Part I. theories, sensors and hemispherical photography. Agric. Meteorol. 2004, 121, 19–35. [Google Scholar] [CrossRef]
- Weisis, M.; Baret, F.; Smith, G.J.; Jonckheere, l.; Coppin, P. Review of methods for in situ leaf area index (LAI) determination: Part II. estimation of LAI, errors and sampling. Agric. For. Meteorol. 2004, 121, 37–53. [Google Scholar] [CrossRef]
- Fang, H.; Yinghui, Z.; Wei, S.; Li, W.; Ye, Y.; Sun, T.; Liu, W. The field measurements and high resolution reference LAI data in Hailun and Honghe, China. PANGAEA 2019. [Google Scholar] [CrossRef]
- Yan, G.; Hu, R.; Luo, J.; Weiss, M.; Jiang, H.; Mu, X.; Xie, D.; Zhang, W. Review of indirect optical measurements of leaf area index: Recent advances, challenges, and perspectives. Agric. For. Meteorol. 2019, 265, 390–411. [Google Scholar] [CrossRef]
- Singh, V.; Singh, N. Assessment and comparison of phytoremediation potential of selected plant species against Endosulfan. Int. J. Environ. Sci. Technol. 2019, 16, 3231–3248. [Google Scholar] [CrossRef]
- Pierce, L.L.; Running, S.W. Rapid estimation of coniferous forest leaf area index using a portable integrating. Ecology 1988, 6, 1762–1767. [Google Scholar] [CrossRef]
- Hosseini, A.F.; Astaraei, A.; Sanaeinejad, S.H.; Mousavi, P.M.H. Estimation of leaf area index using IRS satellite data in Neishabour region. Iran. J. Crop. Res. 2013, 3, 577–582. [Google Scholar]
- Adl, H. Estimation of leaf biomass and leaf area index of two major species in Yasuj forests. Iran. For. Poplar Res. 2007, 15, 417–426. [Google Scholar]
- Moeser, D.; Roubinek, J.; Schleppi, P.; Morsdorf, F.; Jonas, T. Canopy closure, LAI and radiation transfer from airborne LiDAR synthetic images. Agric. For. Meteorol. 2014, 197, 158–168. [Google Scholar] [CrossRef]
- Nowruzi, A.; Jalali, N.; Miri, M.; Abbasi, M. Estimation of rice leaf area index in northern Iran. J. Soil Water Resour. Prot. 2013, 3, 1–10. [Google Scholar]
- Blanco, F.F.; Folegatti, M.V. A new method for estimating the leaf area index of cucumber and tomato plants. Hortic. Bras. 2003, 21, 666–669. [Google Scholar] [CrossRef]
- Nguy-Robertson, A.; Gitelson, A.; Peng, Y.; Viña, A.; Arkebauer, T.; Rundquist, D. Greenleaf area index estimation in maize and soybean: Combining vegetation indices to achieve maximal sensitivity. Agron. J. 2012, 104, 1336–1347. [Google Scholar] [CrossRef] [Green Version]
- Peng, D.; Zhang, H.; Liu, L.; Huang, W.; Huete, A.; Zhang, X.; Wang, F.; Yu, L.; Xie, Q.; Wang, C.; et al. Estimating the aboveground biomass for planted forests based on stand age and environmental variables. Remote Sens. 2019, 11, 2270. [Google Scholar] [CrossRef] [Green Version]
- Matsushita, B.; Wei, Y.; Jin, C.; Yuyichi, O.; Guoyn, Q. Sensitivity of the enhanced vegetation index (EVI) and normalized difference vegetation index (NDVI( to topographic effects: A case study in High—Density Cypress forest. Sensors 2007, 7, 2636–2651. [Google Scholar] [CrossRef] [PubMed] [Green Version]
- Kumar, L.; Mutanga, O. Google Earth Engine Applications. Remote Sens. 2019, 11, 420. [Google Scholar]
- Gorelick, N.; Hancher, M.; Dixon, M.; Ilyushchenko, S.; Thau, D.; Moore, R. Google Earth Engine: Planetary-scale geospatial analysis for everyone. Remote Sens. Environ. 2017, 202, 18–27. [Google Scholar] [CrossRef]
- Kibret, K.S.; Marohn, C.; Cadisch, R. Use of MODIS EVI to map crop phenology, identify cropping systems, detect land use change and drought risk in Ethiopia—An application of Google Earth Engine. Remote Sens. 2020, 53, 176–191. [Google Scholar] [CrossRef]
- Andalibi, L.; Ghorbani, A.; Moameri, M.; Sharari, M. Calculation of leaf area index (LAI) with the help of LP 100. In Proceedings of the 1st International and 4th National Conference on Conversation of Natural Resources and Environment, University of Mohaghegh Ardabili, Ardabil, Iran, 27–28 August 2019. [Google Scholar]
- Homolová, L.; Janoutová, R.; Lukeš, P.; Hanuš, J.; Novotný, J.; Brovkina, O.; Fernandez, R.L. In situ data collection supporting remote sensing estimation of spruce forest parameters at the ecosystem station Bílý Kříž. Beskydy 2017, 10, 75–86. [Google Scholar] [CrossRef] [Green Version]
- Patocka, Z.; Novosadova, K.; Haninec, P.; Radek, P.; Mikita, T.; Klimánek, M. Comparison of LiDAR-based Models for true Leaf Area Index and effective Leaf Area Index estimation in young beech forests. Acta Univ. Agric. Silvic. Mendel. Brun. 2020, 68, 559. [Google Scholar] [CrossRef]
- García-Gutiérrez, V.; Stöckle, C.; Gil, P.M.; Meza, F.J. Evaluation of Penman-Monteith Model Based on Sentinel-2 Data for the Estimation of Actual Evapotranspiration in Vineyards. Remote Sens. Environ. 2021, 13, 478. [Google Scholar] [CrossRef]
- Blinn, C.; House, M.; Wynne, R.; Thomas, V.; Fox, T.; Sumnall, M. Landsat 8 based leaf area index estimation in Loblolly Pine Plantations. Forests 2019, 10, 222. [Google Scholar] [CrossRef] [Green Version]
- Campos-Taberner, M.; García-Haro, F.; Busetto, L.; Ranghetti, L.; Martinez, B.; Gilabert, M.A.; Camps-Valls, G.; Camacho de Coca, F.; Boschetti, M. A critical comparison of remote sensing Leaf Area Index estimates over rice-cultivated areas: From Sentinel-2 and Landsat-7/8 to MODIS, GEOV1 and EUMETSAT polar system. Remote Sens. 2018, 10, 763. [Google Scholar] [CrossRef] [Green Version]
- Sidi Almouctar, M.A.; Wu, Y.; Kumar, A.; Zhao, F.; Koroma, J.M.; Sadek, M. Spatiotemporal analysis of vegetation cover changes around surface water based on NDVI: A case study in Korama basin, Southern Zinder, Niger. Appl. Water Sci. 2021, 11, 1–14. [Google Scholar] [CrossRef]
- Liu, Y.; Ju, W.; Chen, J.; Zhu, G.; Xing, B.; Zhu, J.; He, M. Spatial and temporal variations of forest LAI in China during 2000–2010. Chin. Sci. Bull. 2012, 57, 2846–2856. [Google Scholar] [CrossRef] [Green Version]
- Meng, S.; Xie, X.; Zhu, B.; Wang, Y. The relative contribution of vegetation greening to the hydrological cycle in the three-north region of China: A modelling analysis. J. Hydrol. 2020, 591, 125689. [Google Scholar] [CrossRef]
- Khanna, R.; Schmid, L.; Walter, A.; Nieto, J.; Siegwart, R.; Liebisch, F. A spatio-temporal spectral framework for plant stress phenotyping. Plant Methods 2019, 15, 1–18. [Google Scholar] [CrossRef] [Green Version]
- Fyfe, S.K. Spatial and temporal variation in spectral reflectance: Are seagrass species spectrally distinct. Limnol. Oceanogr. 2003, 48, 464–479. [Google Scholar] [CrossRef]
- Thenkabail, P.S.; Smith, R.B.; De Pauw, E. Hyperspectral vegetation indices and their relationships with agricultural crop characteristics. Remote Sens. Environ. 2000, 71, 158–182. [Google Scholar] [CrossRef]
- Jarocinska, A.; Kacprzyk, M.; Marcinkowska-Ochtyra, A.; Ochtyra, A.; Zagajewski, B.; Meuleman, K. The application of APEX images in the assessment of the state of non-forest vegetation in the Karkonosze Mountains. Misc. Geogr. 2016, 20, 21–27. [Google Scholar] [CrossRef] [Green Version]
- Sims, D.; Gamon, J. Relationships between Leaf Pigment Content and Spectral Reflectance Across a Wide Range of Species, Leaf Structures and Developmental Stages. Remote Sens. Environ. 2002, 81, 337–354. [Google Scholar] [CrossRef]
- Camoglu, G.; Genc, L. Determination of water stress using thermal and spectral indices from green bean canopy. Fresenius Environ. Bull. 2013, 22, 3078–3088. [Google Scholar]
- Towers, P.; Strever, A.; Poblete-Echeverrí, C. Comparison of vegetation indices for leaf area index estimation in vertical shoot positioned vine canopies with and without Grenbiule Hail-Protection Netting. Remote Sens. 2019, 11, 1073. [Google Scholar] [CrossRef] [Green Version]
- Goswami, S.; Gamon, J.A.; Vargas, S.; Tweedie, S.E. Relationships of NDVI, biomass, and Leaf Area Index (LAI) for six key plant species in Barrow, Alaska. PeerJ Prepr. 2015, 3, e913v1. [Google Scholar] [CrossRef]
- Bappa, D.; Rabi, N.; Sahoo, S.P.; Gopal, K.; Rakesh, V.; Viswanathan, C.; Vinay, K.S.; Vinod, K.G. Comparative analysis of index and chemometric techniques-based assessment of leaf area index (LAI) in wheat through field spectroradiometer, Landsat-8, Sentinel-2 and Hyperion bands. Geocarto Int. 2020, 35, 1415–1432. [Google Scholar] [CrossRef]
- Mani, J.K.; Varghese, A.O.; Rao, K. Estimation of leaf area index of teak forests of Central India using satellite remote sensing. In Proceedings of the 38th Asian Conference on Remote Sensing, New Delhi, India, 23–27 October 2017. [Google Scholar]
- Lovynska, V.; Lakyda, P.; Sytnyk, S.; Kharytonov, N.; Piestova, I. LAI estimation by direct and indirect methods in Scots pine stands in Northern Steppe of Ukraine. J. For. Sci. 2018, 64, 514–522. [Google Scholar] [CrossRef] [Green Version]
- Behbahani, N.; Falah Shamsi, S.R.; Farzadmehr, J.; Erfanifard, S.R.; Ramezani Gasak, M. Using vegetation indices of Aster-LB imagery of estimate single trees crown cover in arid rangelands, case study: Tag-Ahmadshhi, Southern of Khorasan. Iran. J. Rangel. 2010, 4, 93–103. [Google Scholar]
- Asadi, S.; Bannayan, M.; Jahan, M.; Farid, A. Comparison of different spectral vegetation indices for the remote assessment of winter wheat leaf area index in Mashhad. J. Agroecol. 2018, 10, 913–934. [Google Scholar]
- Kakehmami, A.; Moameri, M.; Ghorbani, A.; Ghafari, S. Analysis of land use/cover changes in Ardabil Province using landscape metrics. J. RS GIS Nat. Resour. 2020, 11, 68–86. (In Persian) [Google Scholar]
- Management and Planning Organization of Ardabil Province. Studies of the Planning Plan of Ardabil Province: Summary of Findings of Planning Studies of the Province, Planning and Development Council of Ardabil Province, Management and Planning Organization of the Country; Management and Planning Organization of Ardabil Province: Ardabil, Iran, 2012; p. 63.
- Daddeh, F.; Mostafazadeh, R.; Esmali Ouri, A.; Ghorbani, A. Determining the Seasonality of Monthly Rainfall using the Markham Method in the Ardabil Province Rain Gauge Stations. J. Spat. Plan. 2020, 10, 29–42. [Google Scholar] [CrossRef]
- Sharifi, J.; Akbarzadeh, M. Investigation of vegetation changes under precipitation in semi-steppic rangelands of Ardebil Province (Case study: Arshagh Rangeland Research Site). Range Watershed Manag. 2013, 65, 507–516. (In Persian) [Google Scholar]
- Sharifi, J.; Shahmoradi, A.; Zandi Esfahan, E.; Azimi Motem, F.; Nouri, A.; Mommadi, D. Vegetation cover dynamics in semi-steppe rangelands of Ardabil Province, Iran. J. Rangel. Sci. 2018, 8, 41–51. [Google Scholar]
- Akbari, H.; Vafakhah, M.; Sharifikia, M.; Ghorbani, A. Spatial and temporal variability of soil moisture in relation with topographic and meteorological factors in south of Ardabil Province, Iran. Environ. Monit. Assess. 2018, 190, 1–12. [Google Scholar] [CrossRef]
- Bernstein, L.; Adler-Golden, S.; Jin, X.; Gregor, B.; Sundberg, R. Quick atmospheric correction (QUAC) code for VNIR-SWIR spectral imagery: Algorithm details. Workshop on Hyperspectral Image and Signal Processing. Evol. Remote Sens. 2012, 1–4. [Google Scholar] [CrossRef]
- Huete, A.R.; Liu, H.Q.; Batchily, K.; Van Leeuwen, W. A comparison of vegetation indices over a global set of TM images for EOS-MODIS. Remote Sens. Environ. 1997, 59, 440–451. [Google Scholar] [CrossRef]
- Tucker, J. Red and photographic infrared linear combinations for monitoring vegetation. Remote Sens. Environ. 1979, 8, 127–150. [Google Scholar] [CrossRef] [Green Version]
- Boegh, E. Airborne multispectral data for quantifying leaf area index, nitrogen concentration, and photosynthetic efficiency in agriculture. Remote Sens. Environ. 2002, 81, 179–193. [Google Scholar] [CrossRef]
- Saito, K.; Ogawa, S.; Aihara, M.; Otowa, K. Estimation of LAI and Forest Management on Okutama. In Proceedings of the 22nd Asian Conference on Remote Sensing, Singapore, 5–9 November 2001; pp. 11–17. [Google Scholar]
- Photon Systems Instruments. LaiPen LP 100, Manual and User Guide; PSI (Photon Systems Instruments): Drasov, Czech Republic, 2015; p. 45. [Google Scholar]
- De Bei, R.; Fuentes, S.; Gilliham, M.; Tyerman, S.; Edwards, E.; Bianchini, N.; Smith, J.; Collins, C. VitiCanopy: A free computer app to estimate canopy vigor and porosity for grapevine. Sensors 2016, 16, 585. [Google Scholar] [CrossRef] [Green Version]
- Pichon, L.; Taylor, J.; Tisseyre, B. Using smartphone leaf area index data acquired in a collaborative context within vineyards in southern France. OENO One 2020, 54, 123–130. Available online: https://oeno-one.eu/article/view/2481 (accessed on 30 June 2021). [CrossRef]
- Babaei Kafaki, S.; Khademi, A.; Mataji, A. Relationship between leaf area index and physiographical and edaphical condition in a Quercus macranthera stand (Case study: Andebil’s forest, Khalkhal). Iran. J. For. Poplar Res. 2009, 17, 280–289. [Google Scholar]
- Ghanbari, A.A.; Shakiba, M.R.; Toorchi, M.; Choukan, R. Morpho—Physiological responses of common bean leaf to water deficit stress. Eur. J. Exp. Biol. 2013, 3, 487–492. [Google Scholar]
- Lazaro, R.; Rodrigo, F.S.; Gutierrez, L.; Domingo, F.; Puigdefabregas, J. Analysis of a 30-year rainfall record (1967—1997) in semi-arid SE Spain for implications on vegetation. J. Arid. Environ. 2002, 48, 373–395. [Google Scholar] [CrossRef]
- de O. Silveira, E.M.; Carvalho, L.M.; Acerbi-Júnior, F.W.; Mello, J.M. The assessment of vegetation seasonal dynamics using multitemporal NDVI and EVI images derived from MODIS. Cerne Lavras 2008, 14, 177–184. [Google Scholar]
- Zhu, W.; Xiang, W.; Pan, Q.; Zeng, Y.; Ouyang, S.; Lei, P.; Deng, X.; Fang, X.; Peng, C. Spatial and seasonal variations of leaf area index (LAI) in subtropical secondary forests related to floristic composition and stand characters. Biogeosciences 2016, 13, 3819–3831. [Google Scholar] [CrossRef] [Green Version]
- Friedl, M.A.; Michaelsen, J.; Davis, F.W.; Walker, H.; Schimel, D.S. Estimating grassland biomass and leaf area index using ground and satellite data. Int. J. Remote Sens. 1994, 15, 1401–1420. [Google Scholar] [CrossRef]
- Siuki, S.K.; Saghafian, B.; Moazami., S. Comprehensive evaluation of 3-hourly TRMM and half-hourly GPM-IMERG satellite precipitation products. Int. J. Remote Sens. 2017, 38, 558–571. [Google Scholar] [CrossRef]
Publisher’s Note: MDPI stays neutral with regard to jurisdictional claims in published maps and institutional affiliations. |
© 2021 by the authors. Licensee MDPI, Basel, Switzerland. This article is an open access article distributed under the terms and conditions of the Creative Commons Attribution (CC BY) license (https://creativecommons.org/licenses/by/4.0/).