
Research on Temporal and Spatial Resolution and the Driving Forces of Ecological Environment Quality in Coal Mining Areas Considering Topographic Correction

Abstract
1. Introduction
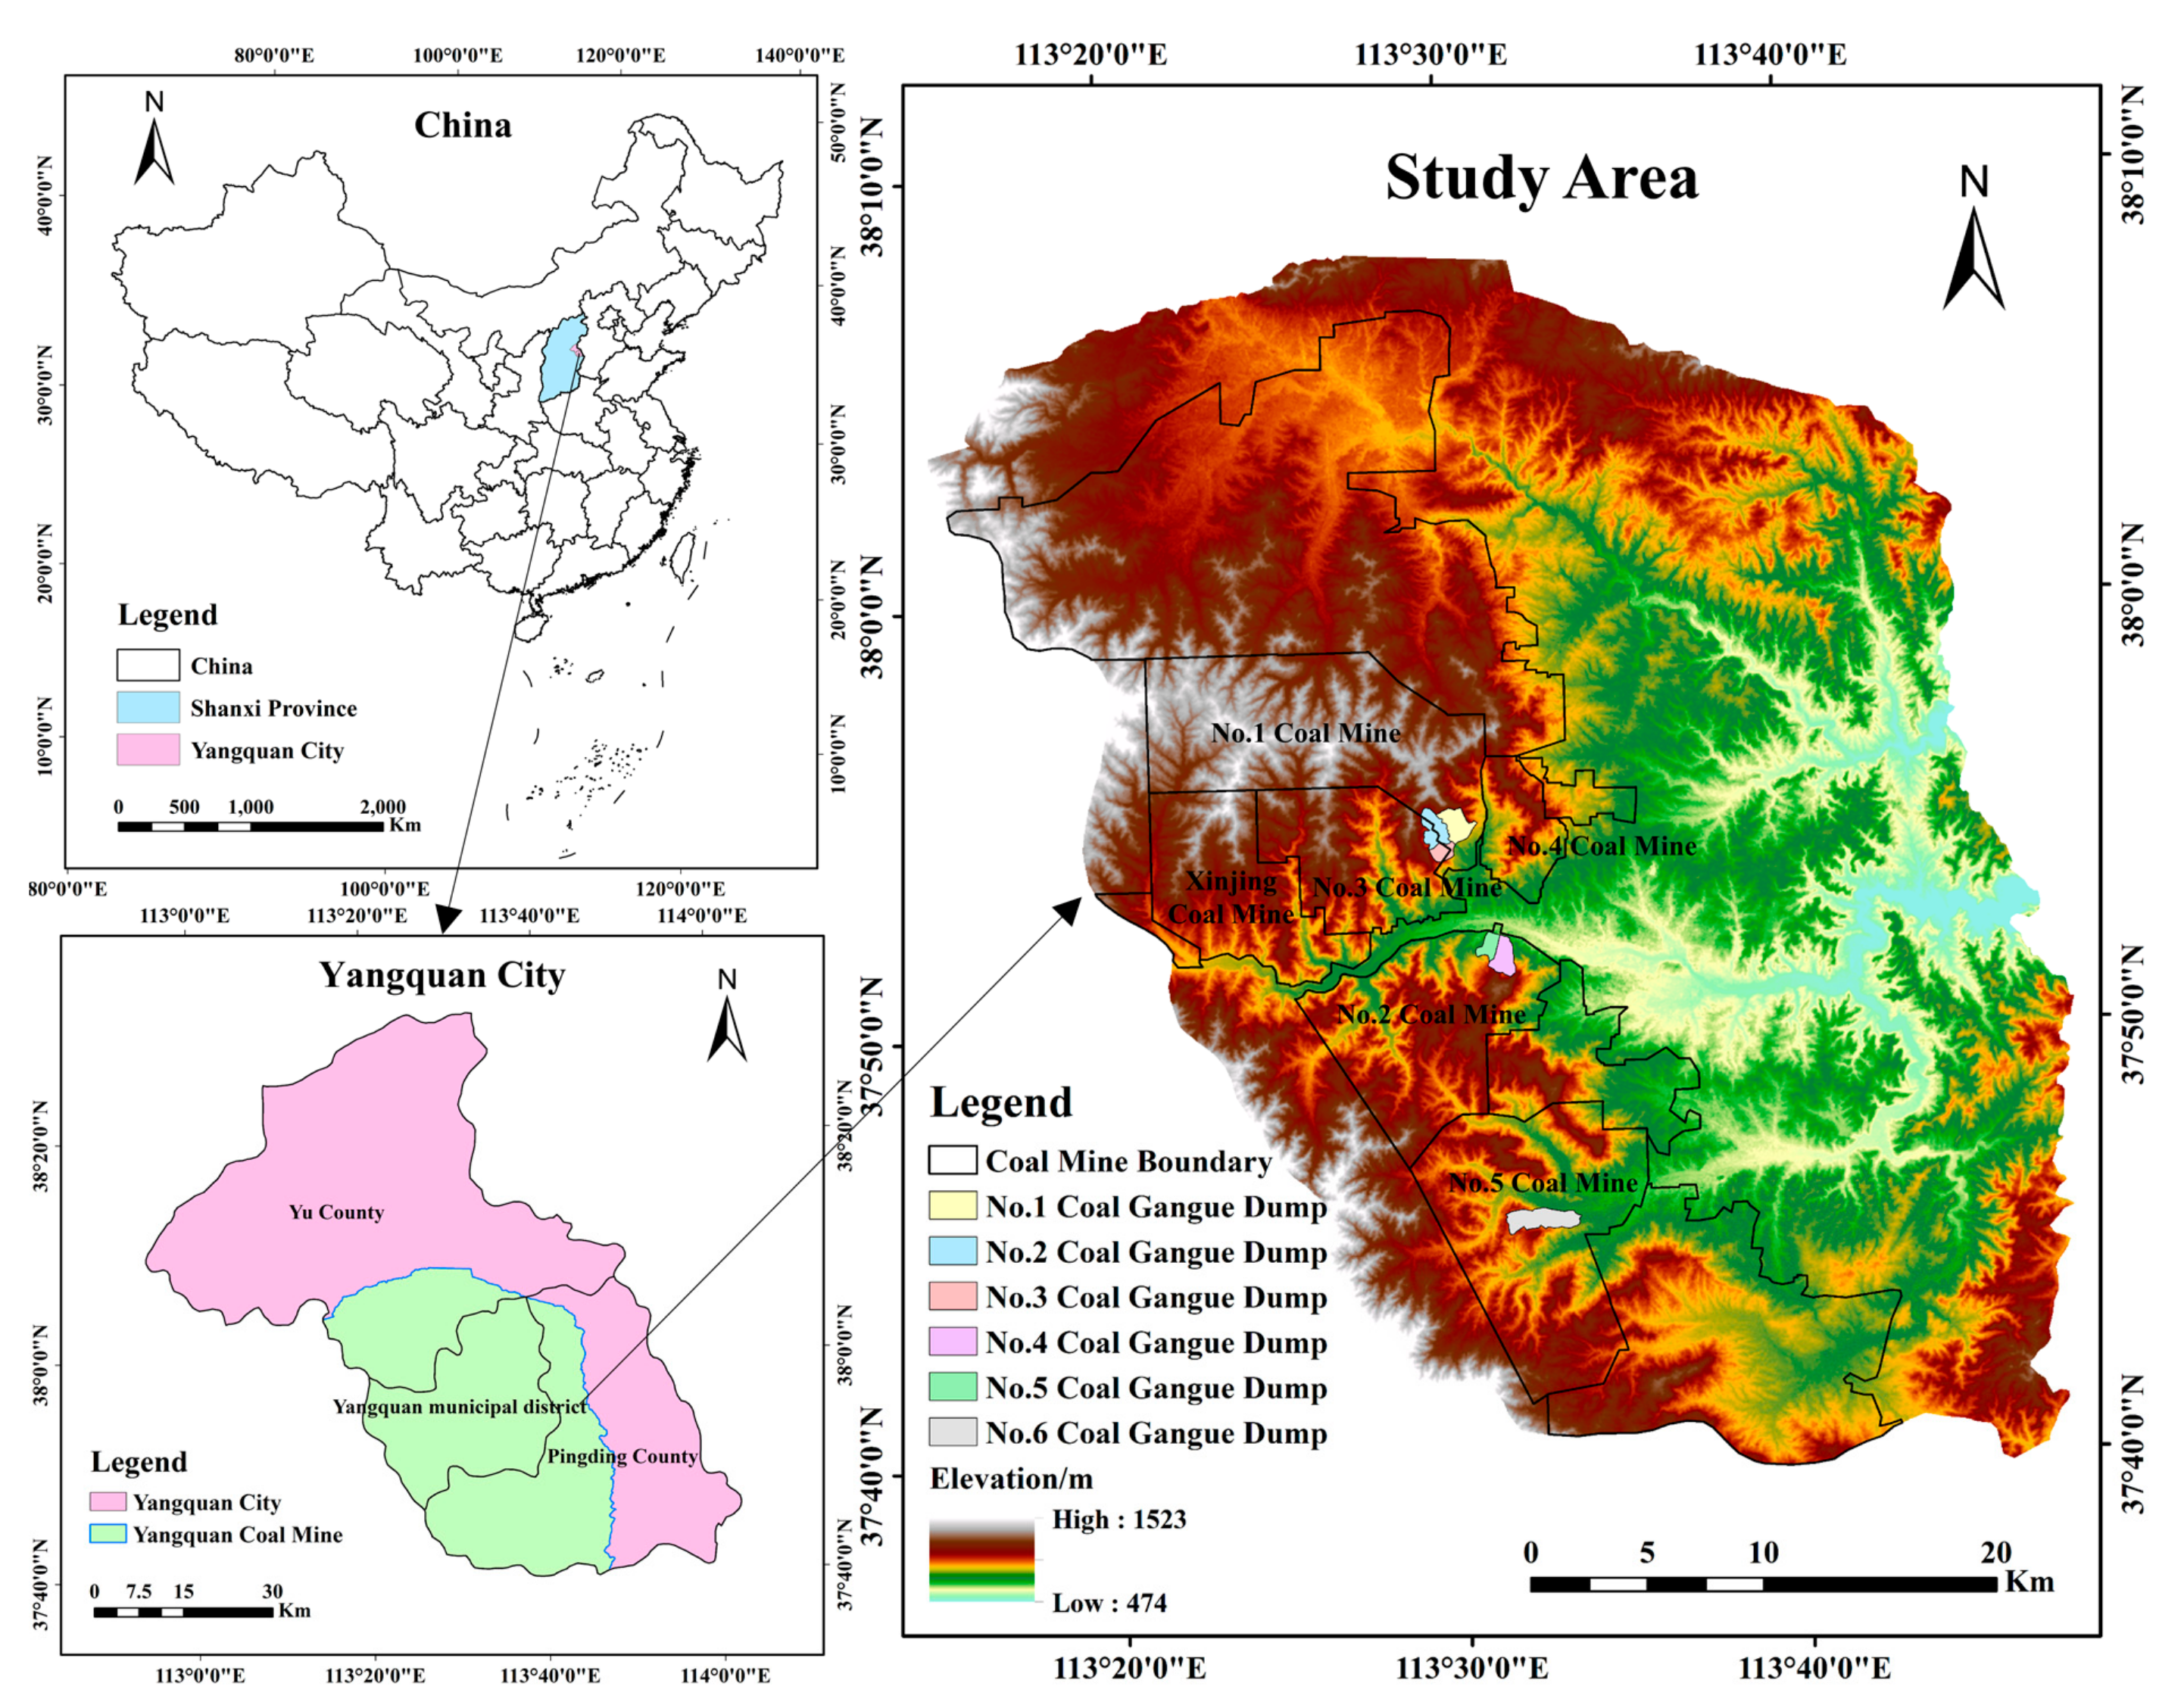
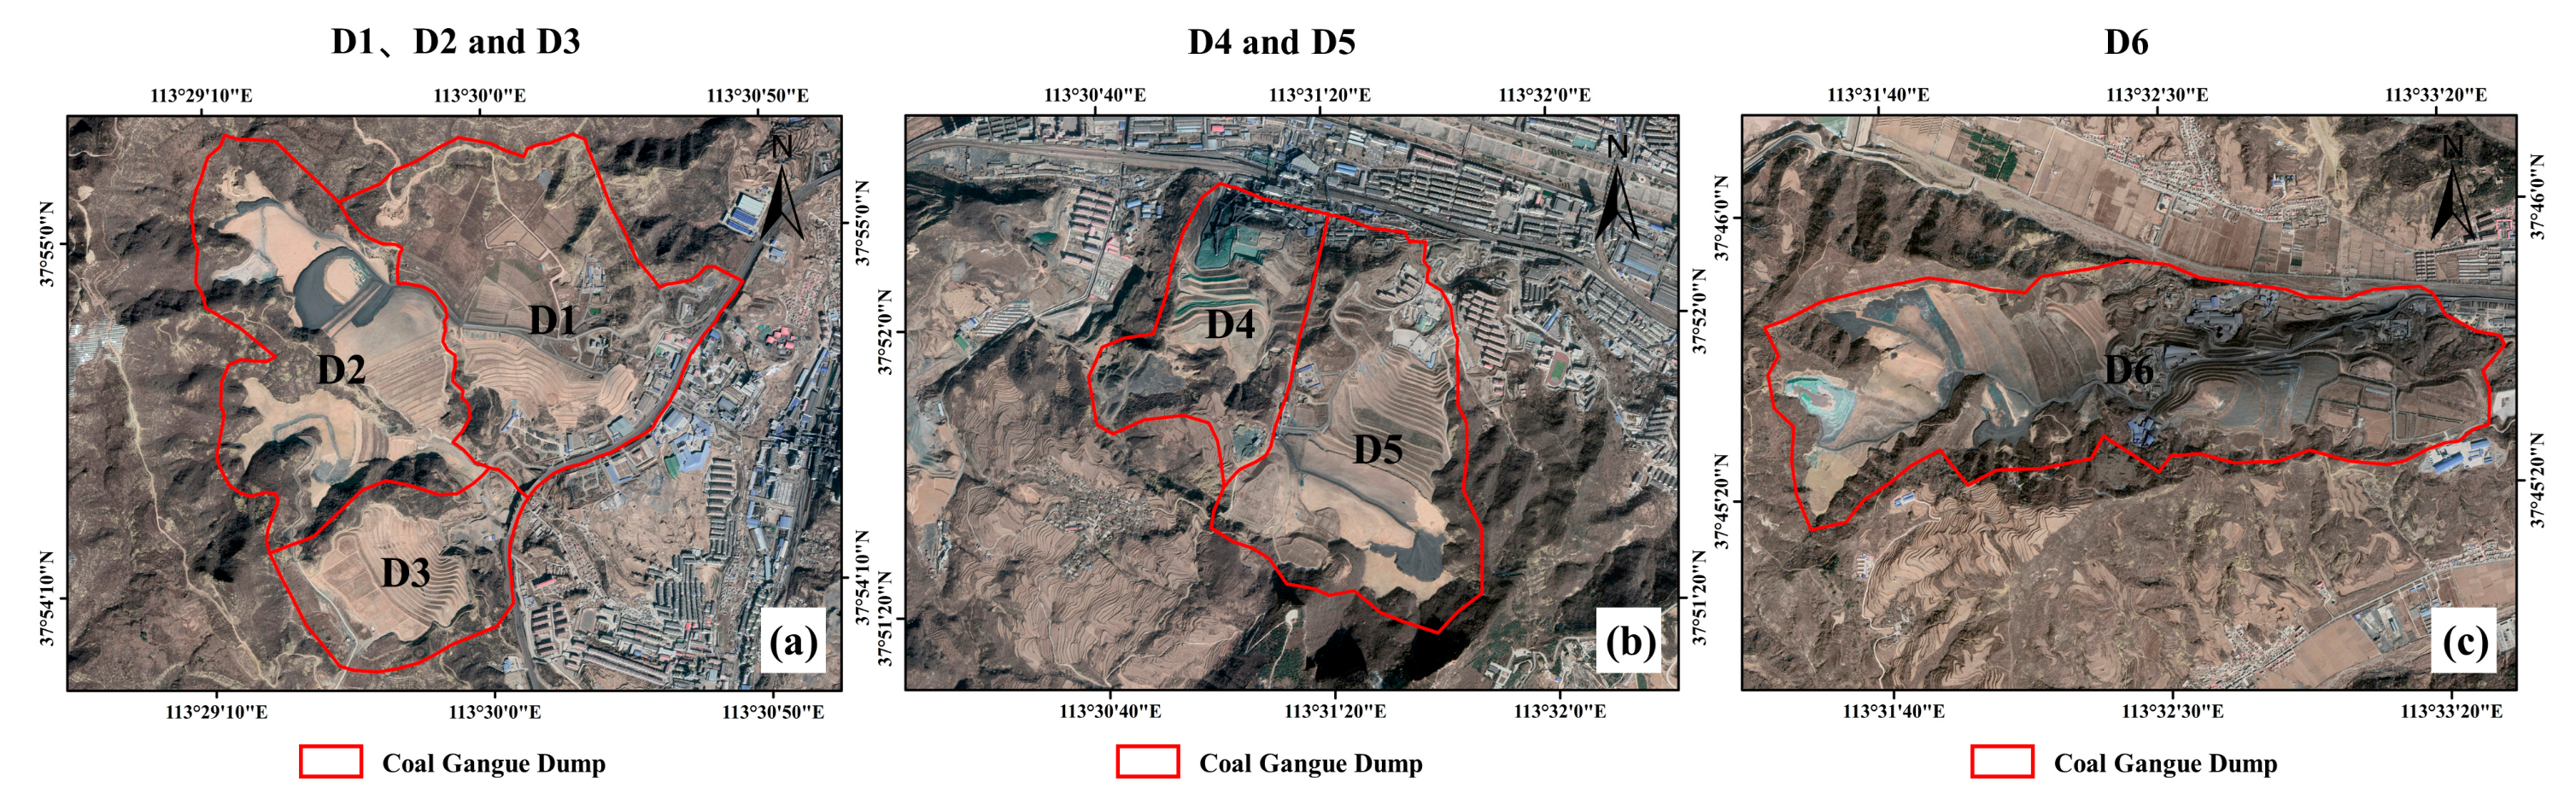
2. Study Area
3. Materials and Methods
3.1. Data Source and Processing
3.2. Topographic Correction Model
3.3. Remote Sensing Ecological Index
3.3.1. Greenness Index
3.3.2. Humidity Index
3.3.3. Dryness Index
3.3.4. Heat Index
3.3.5. Construction of Remote Sensing Ecological Index
3.4. Spatial Auto-Correlation Analysis
4. Results
4.1. Temporal and Spatial Evolution of Ecological Environment Quality in Coal Mine Area
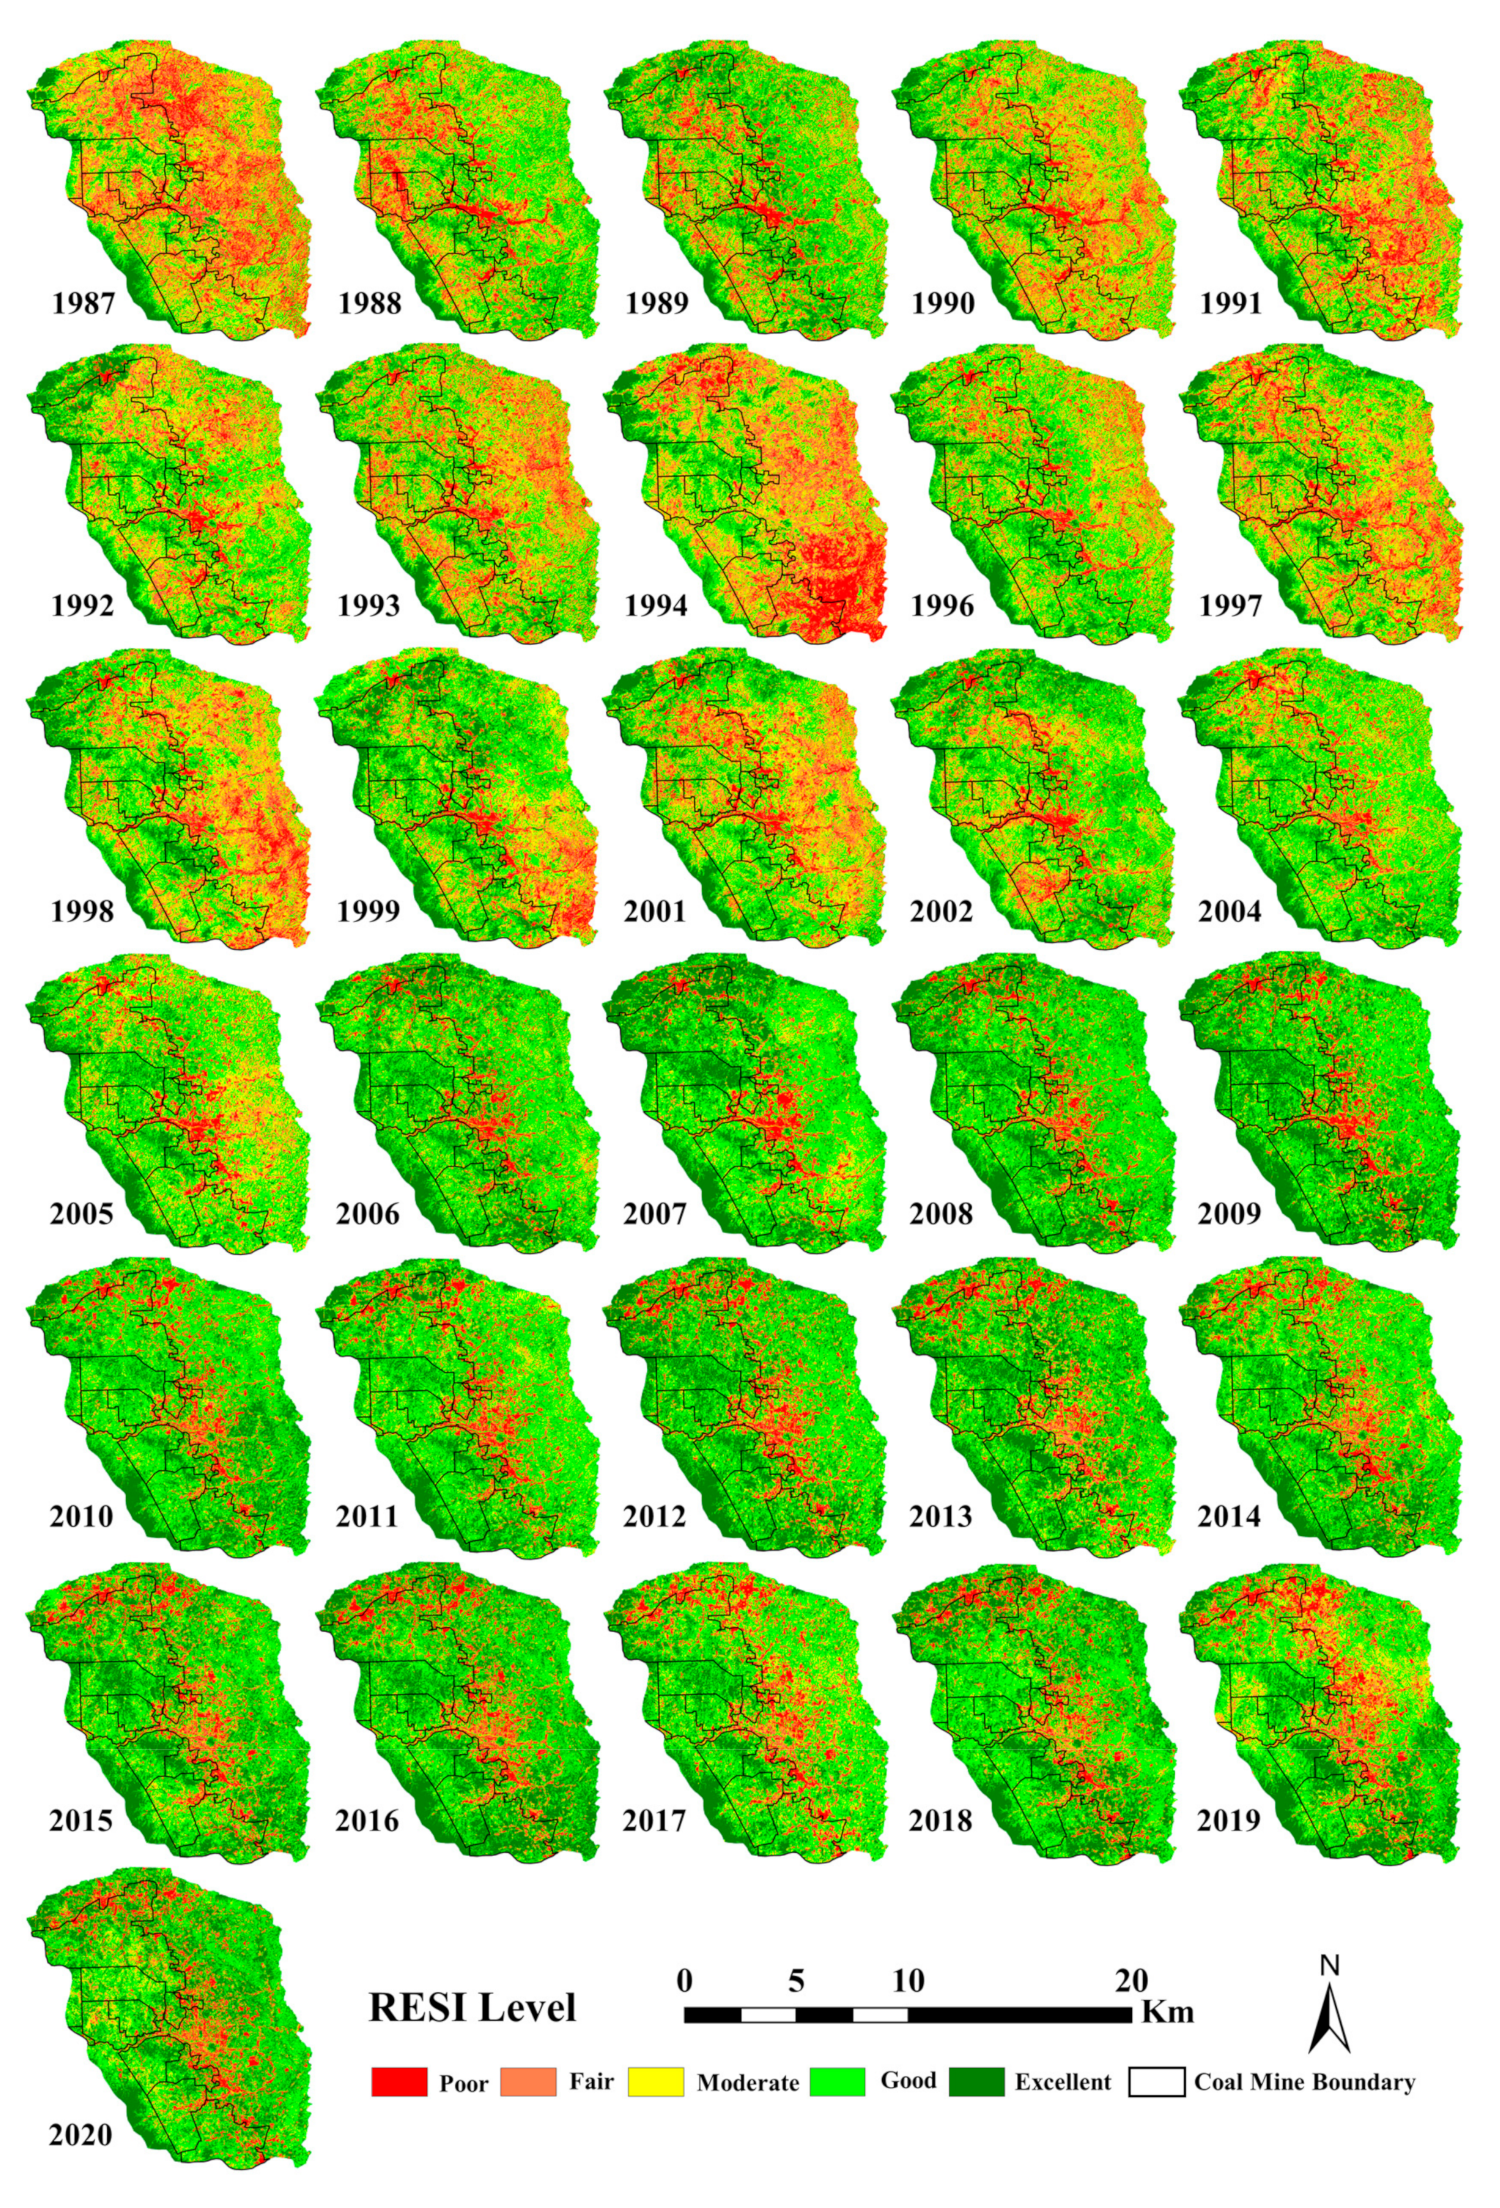
4.1.1. Temporal Evolution of Ecological Environment Quality
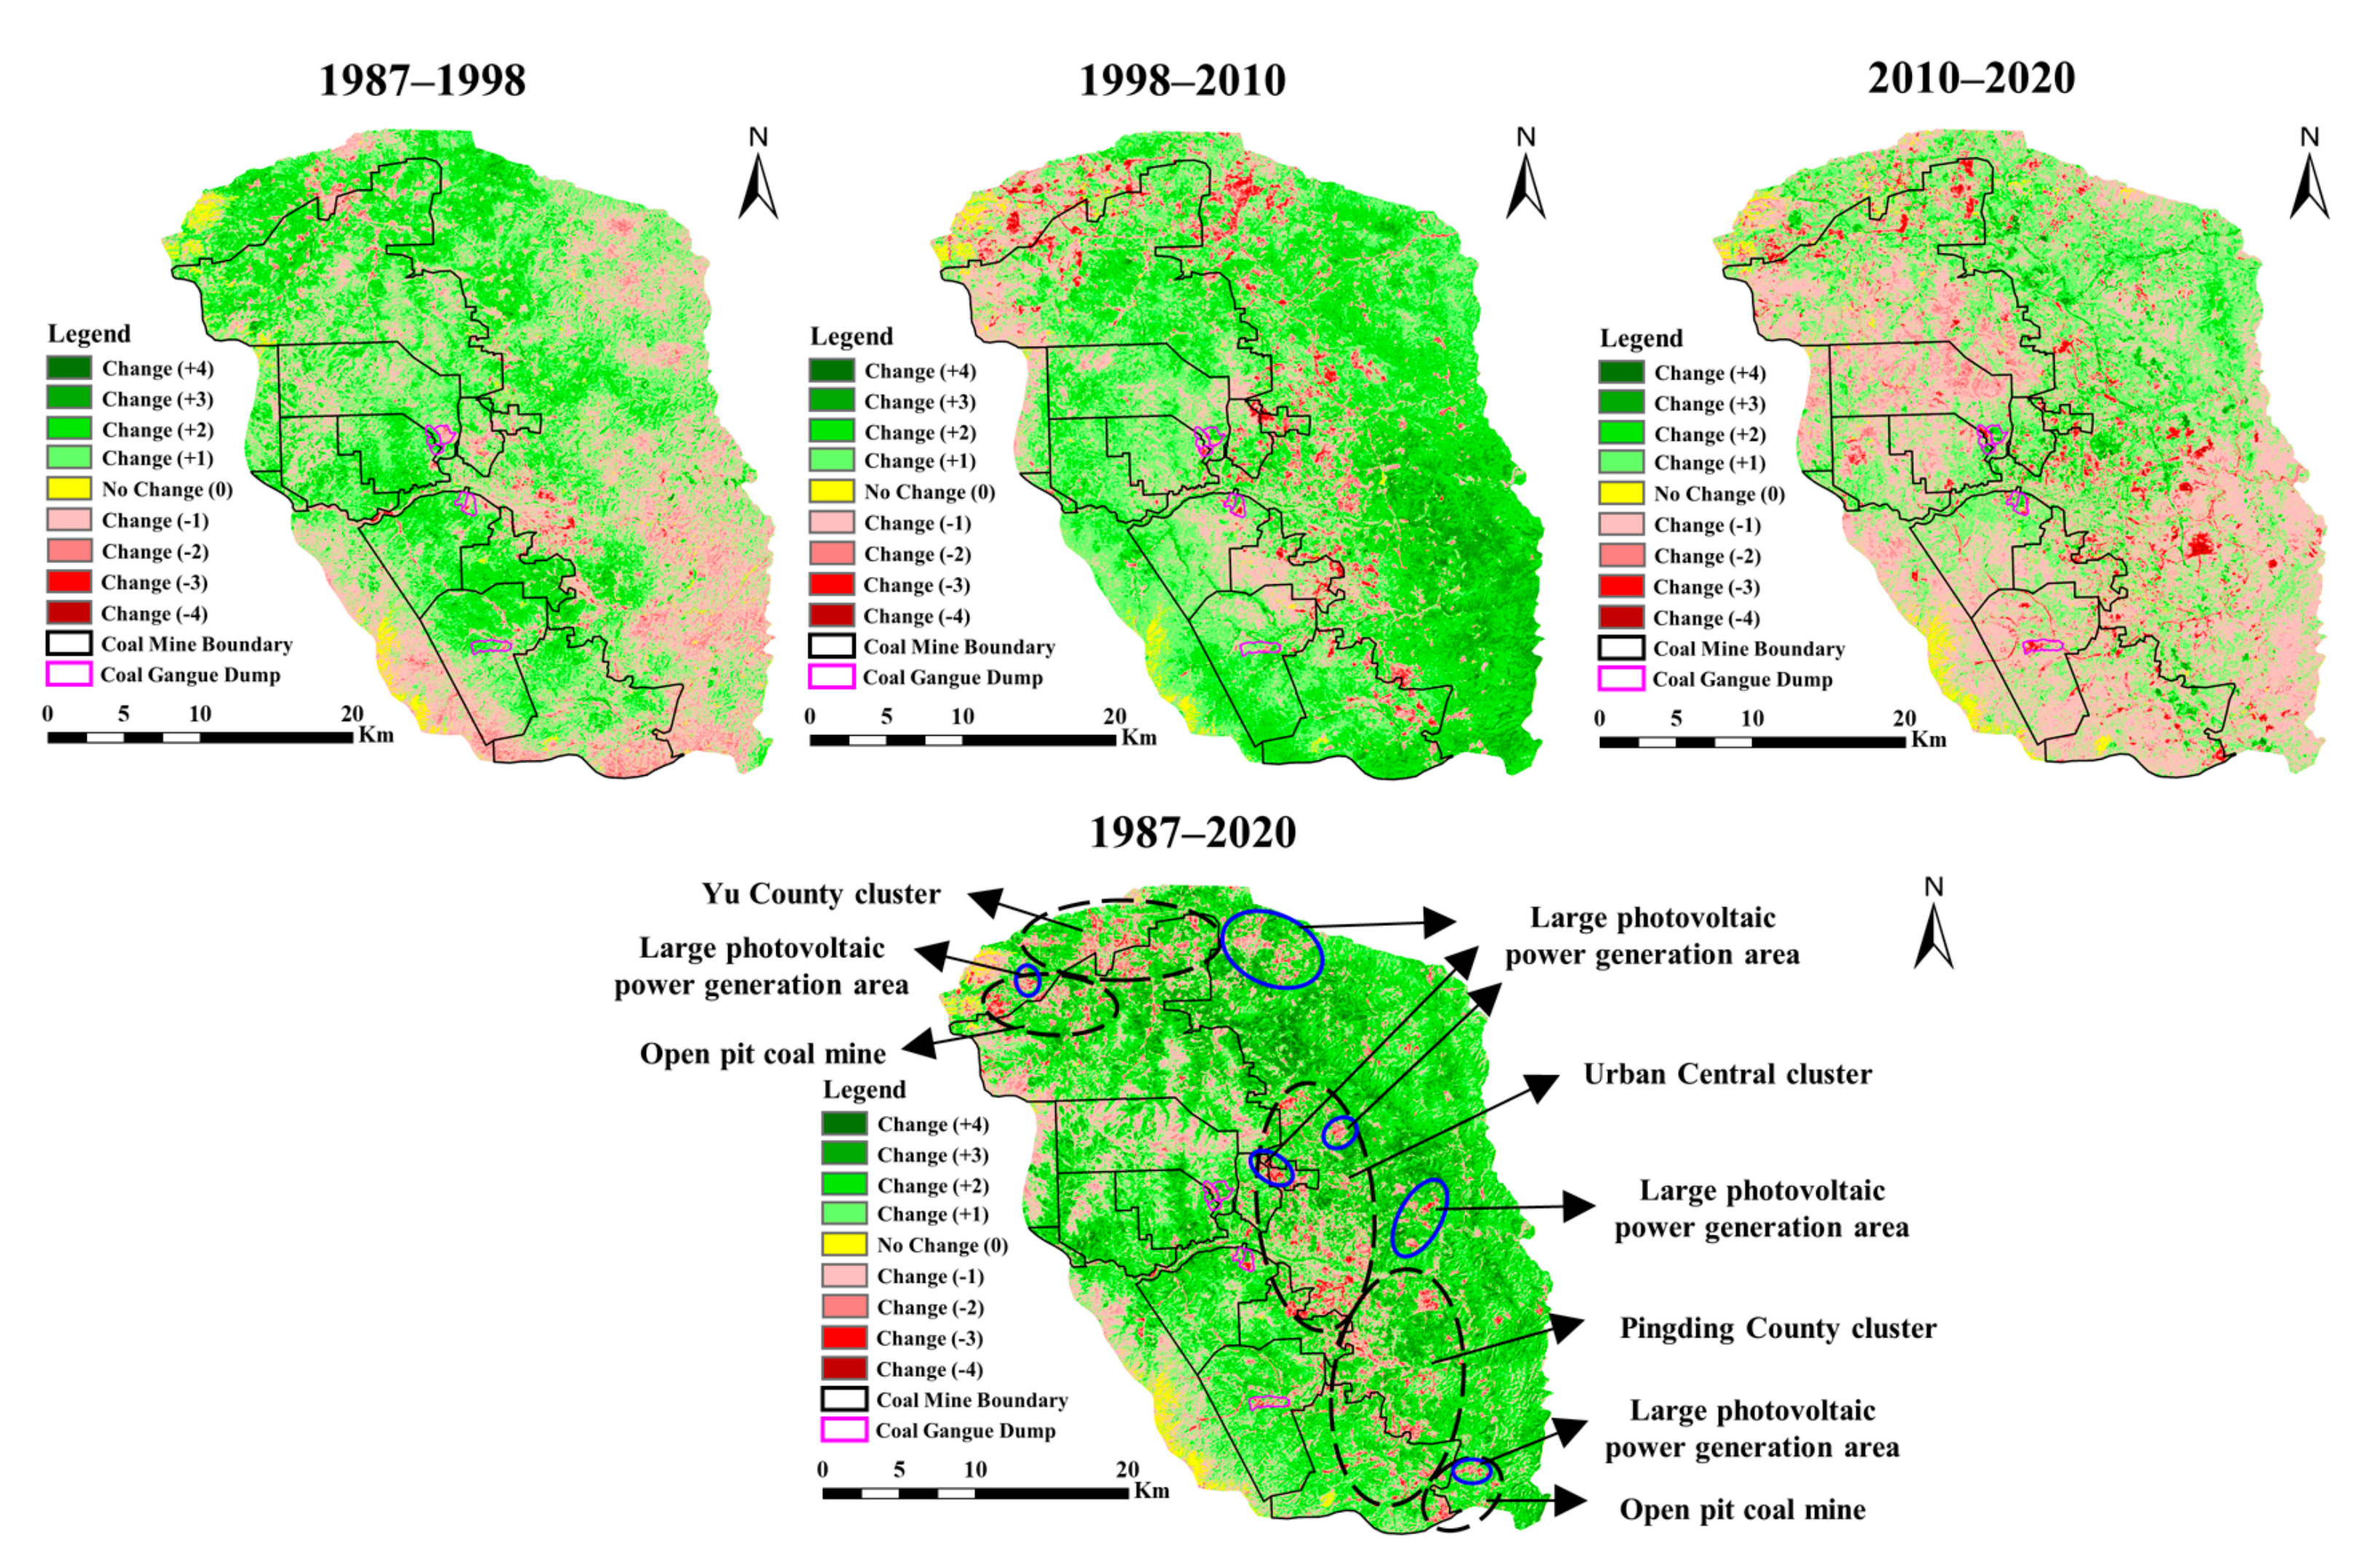
4.1.2. Spatial Evolution of Ecological Environment Quality
4.1.3. RSEI Modeling and Prediction
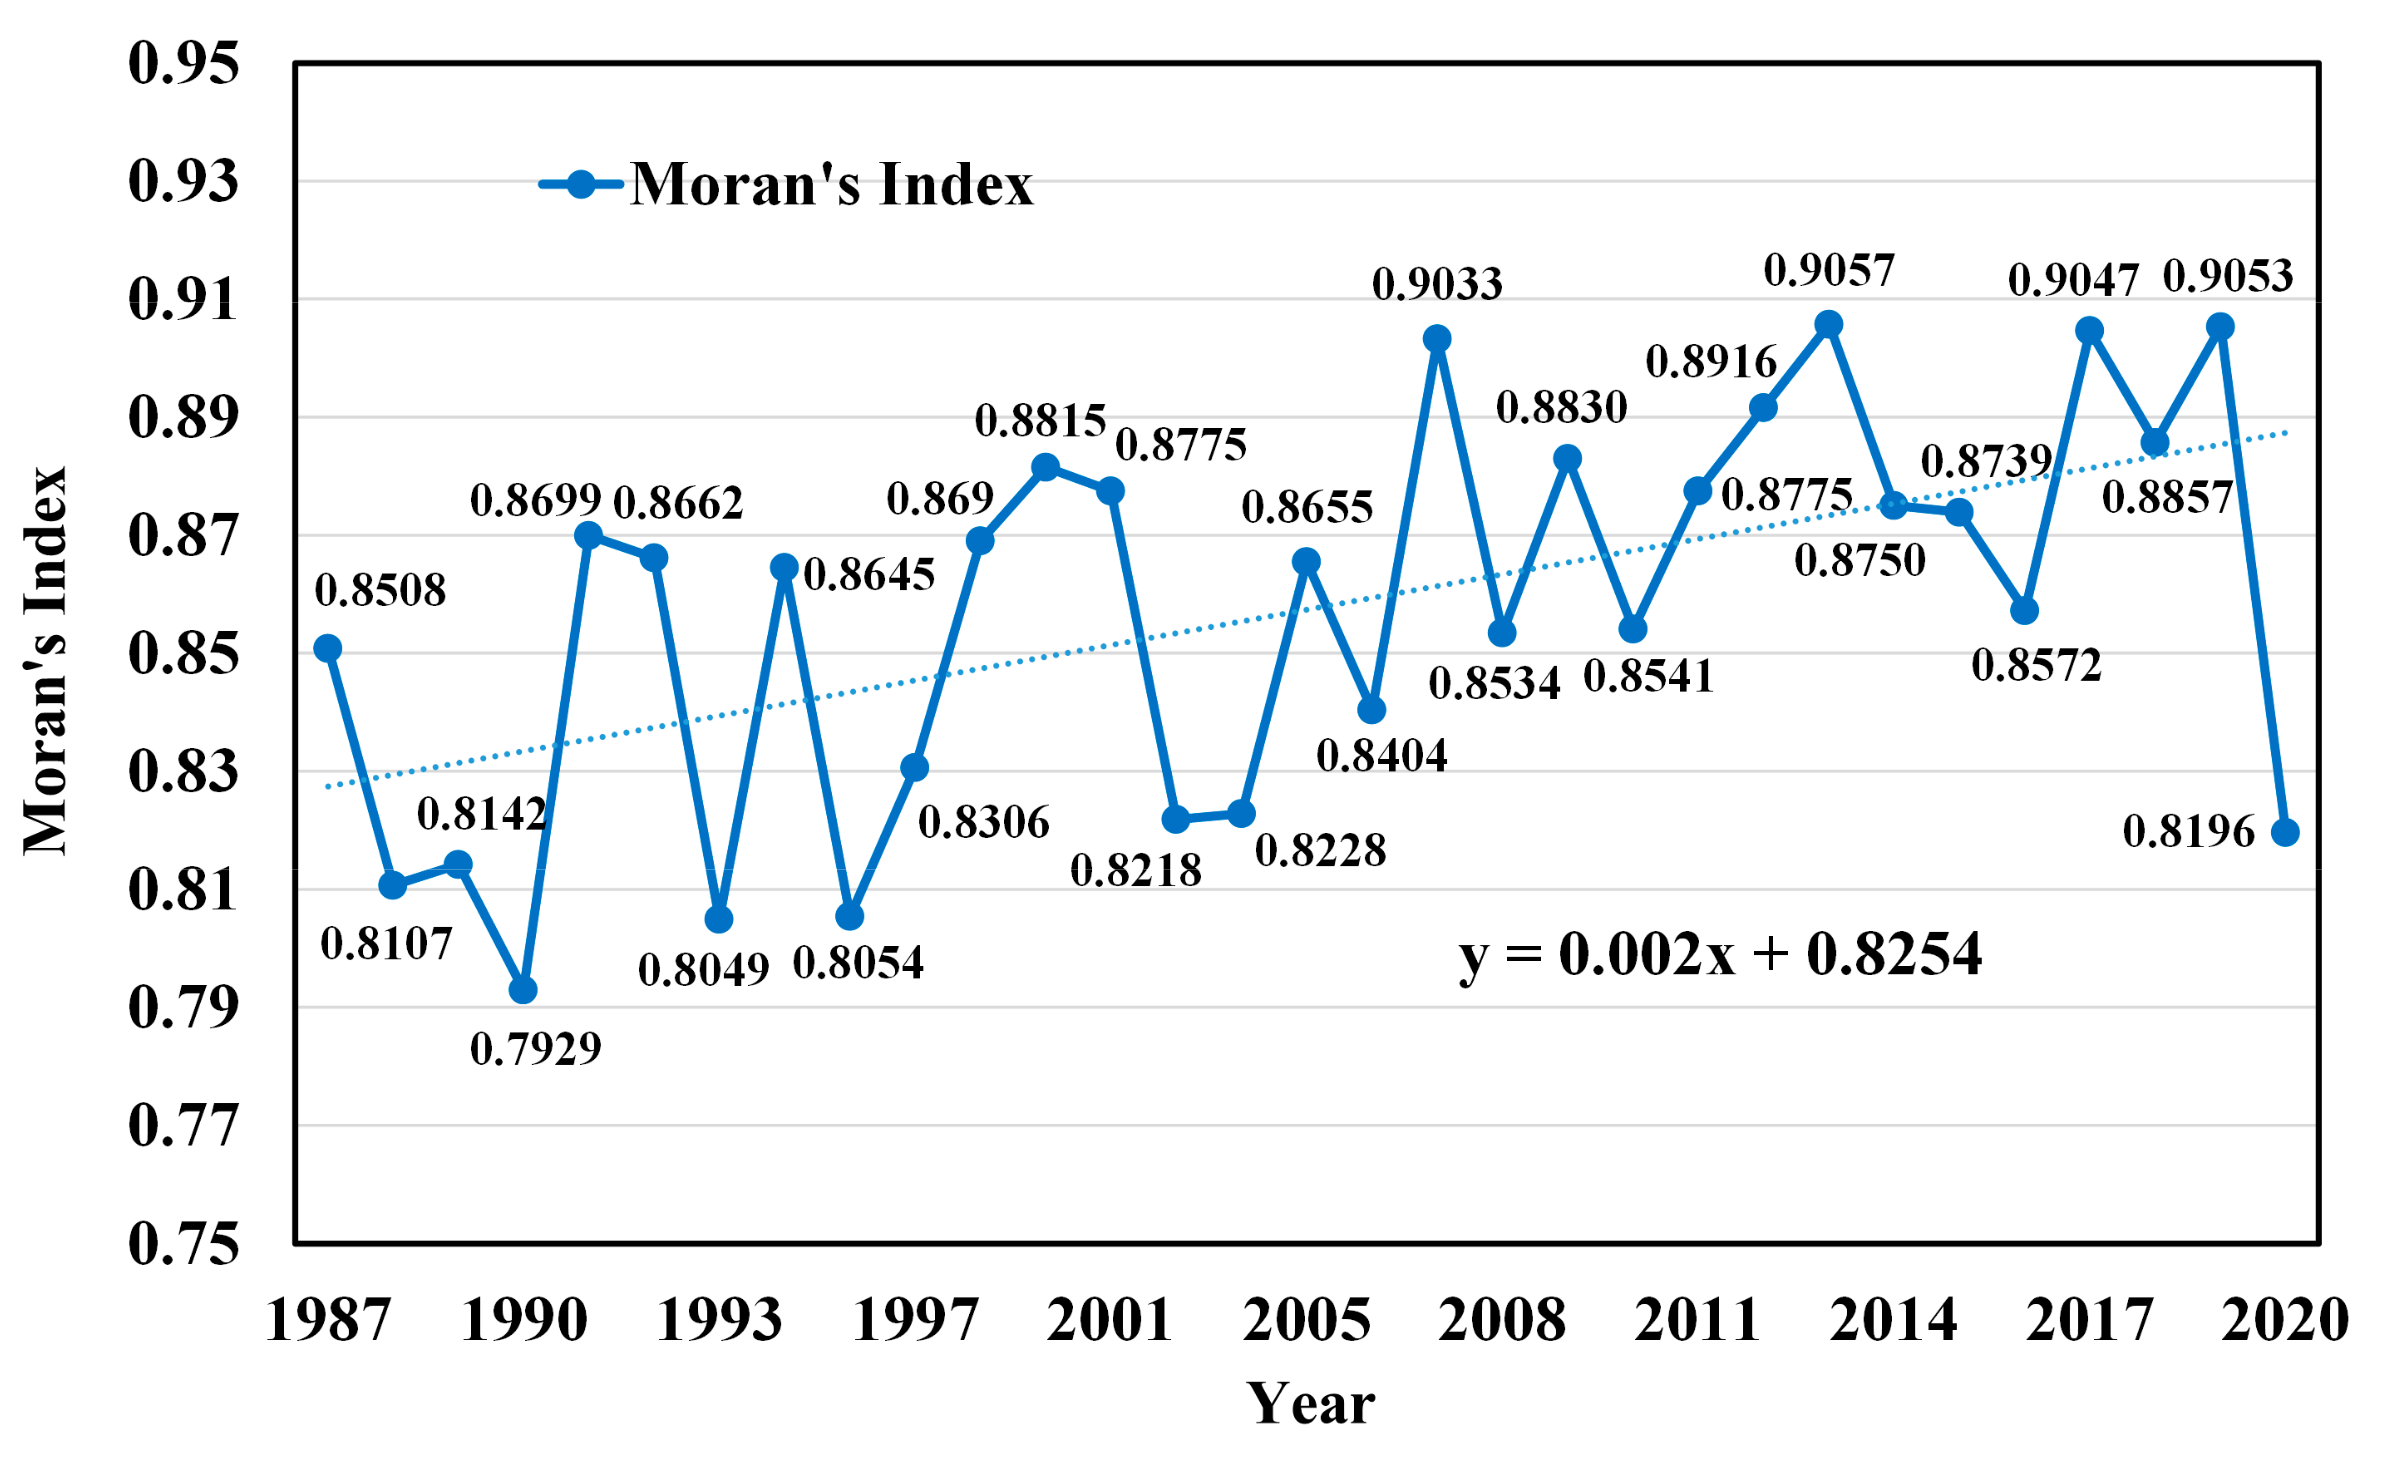
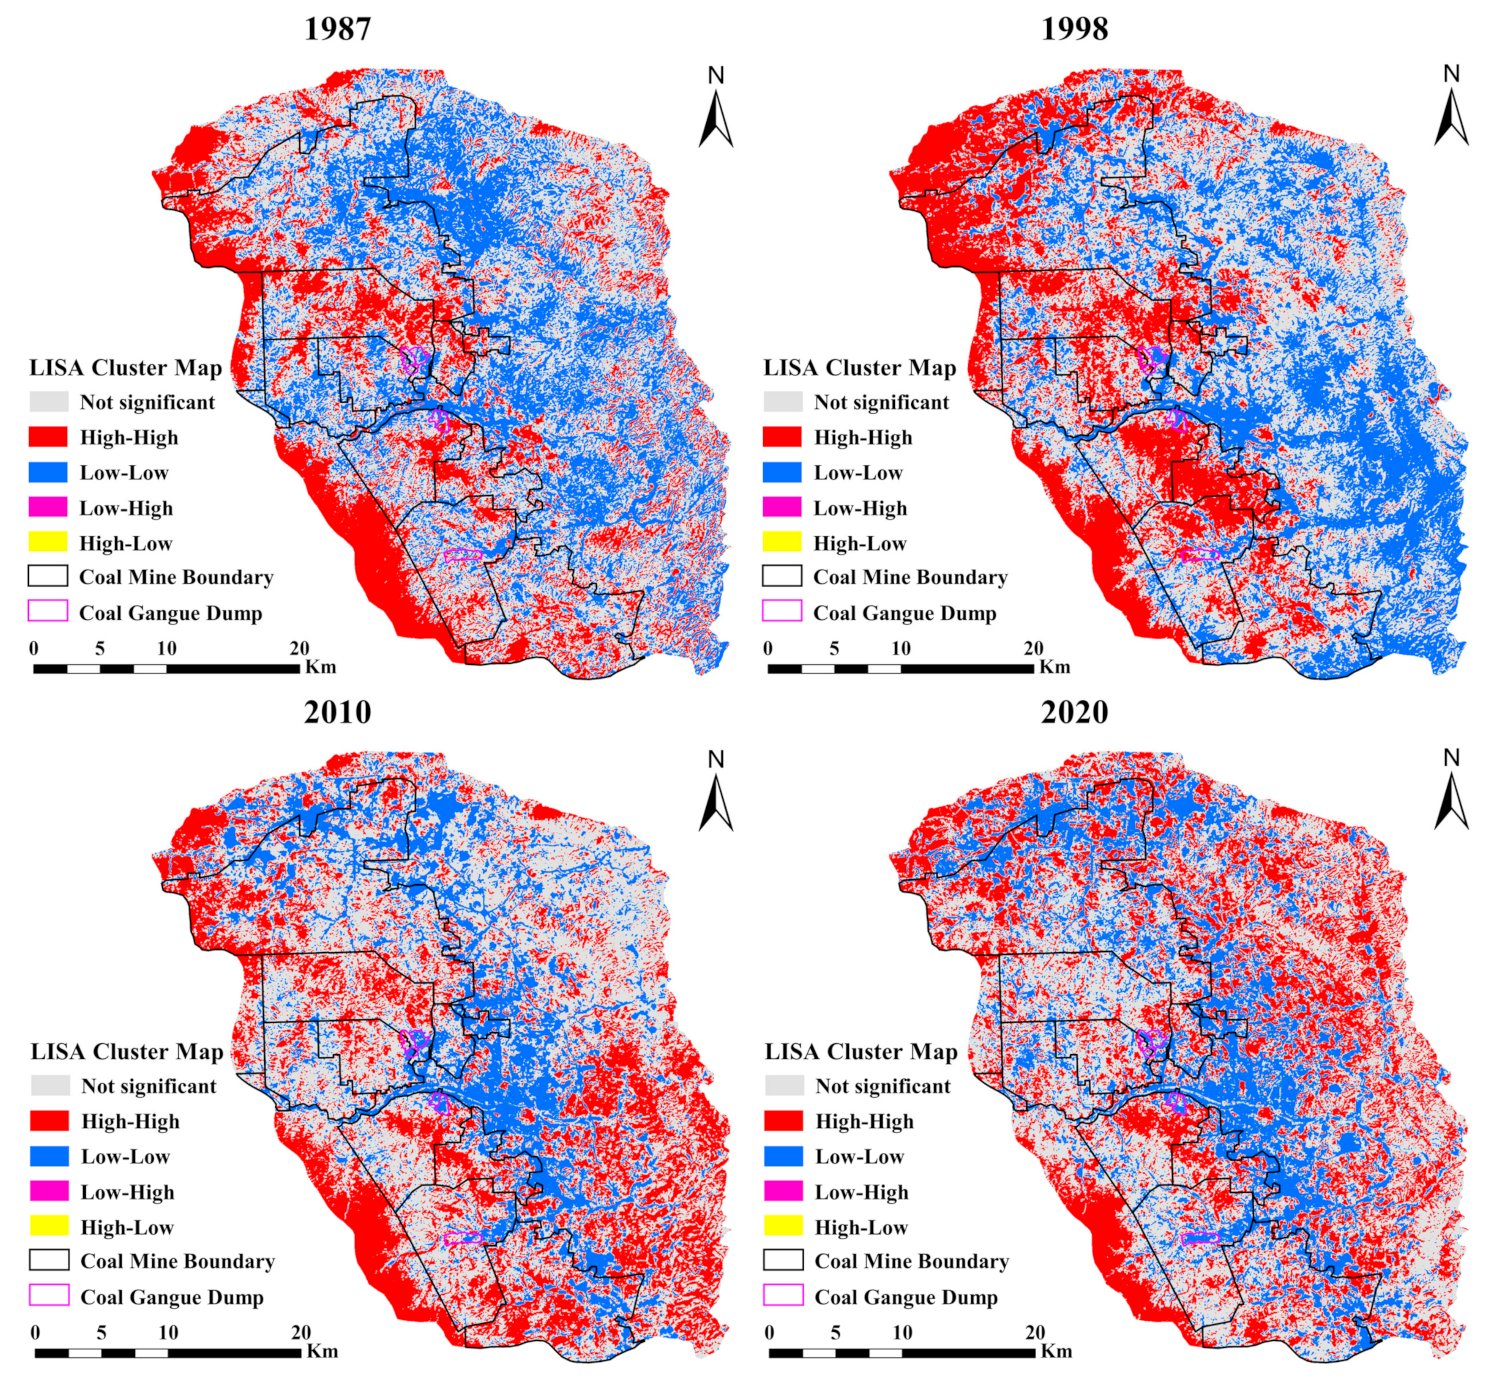
4.2. Spatial Auto-Correlation Analysis of RSEI in Coal Mine Area
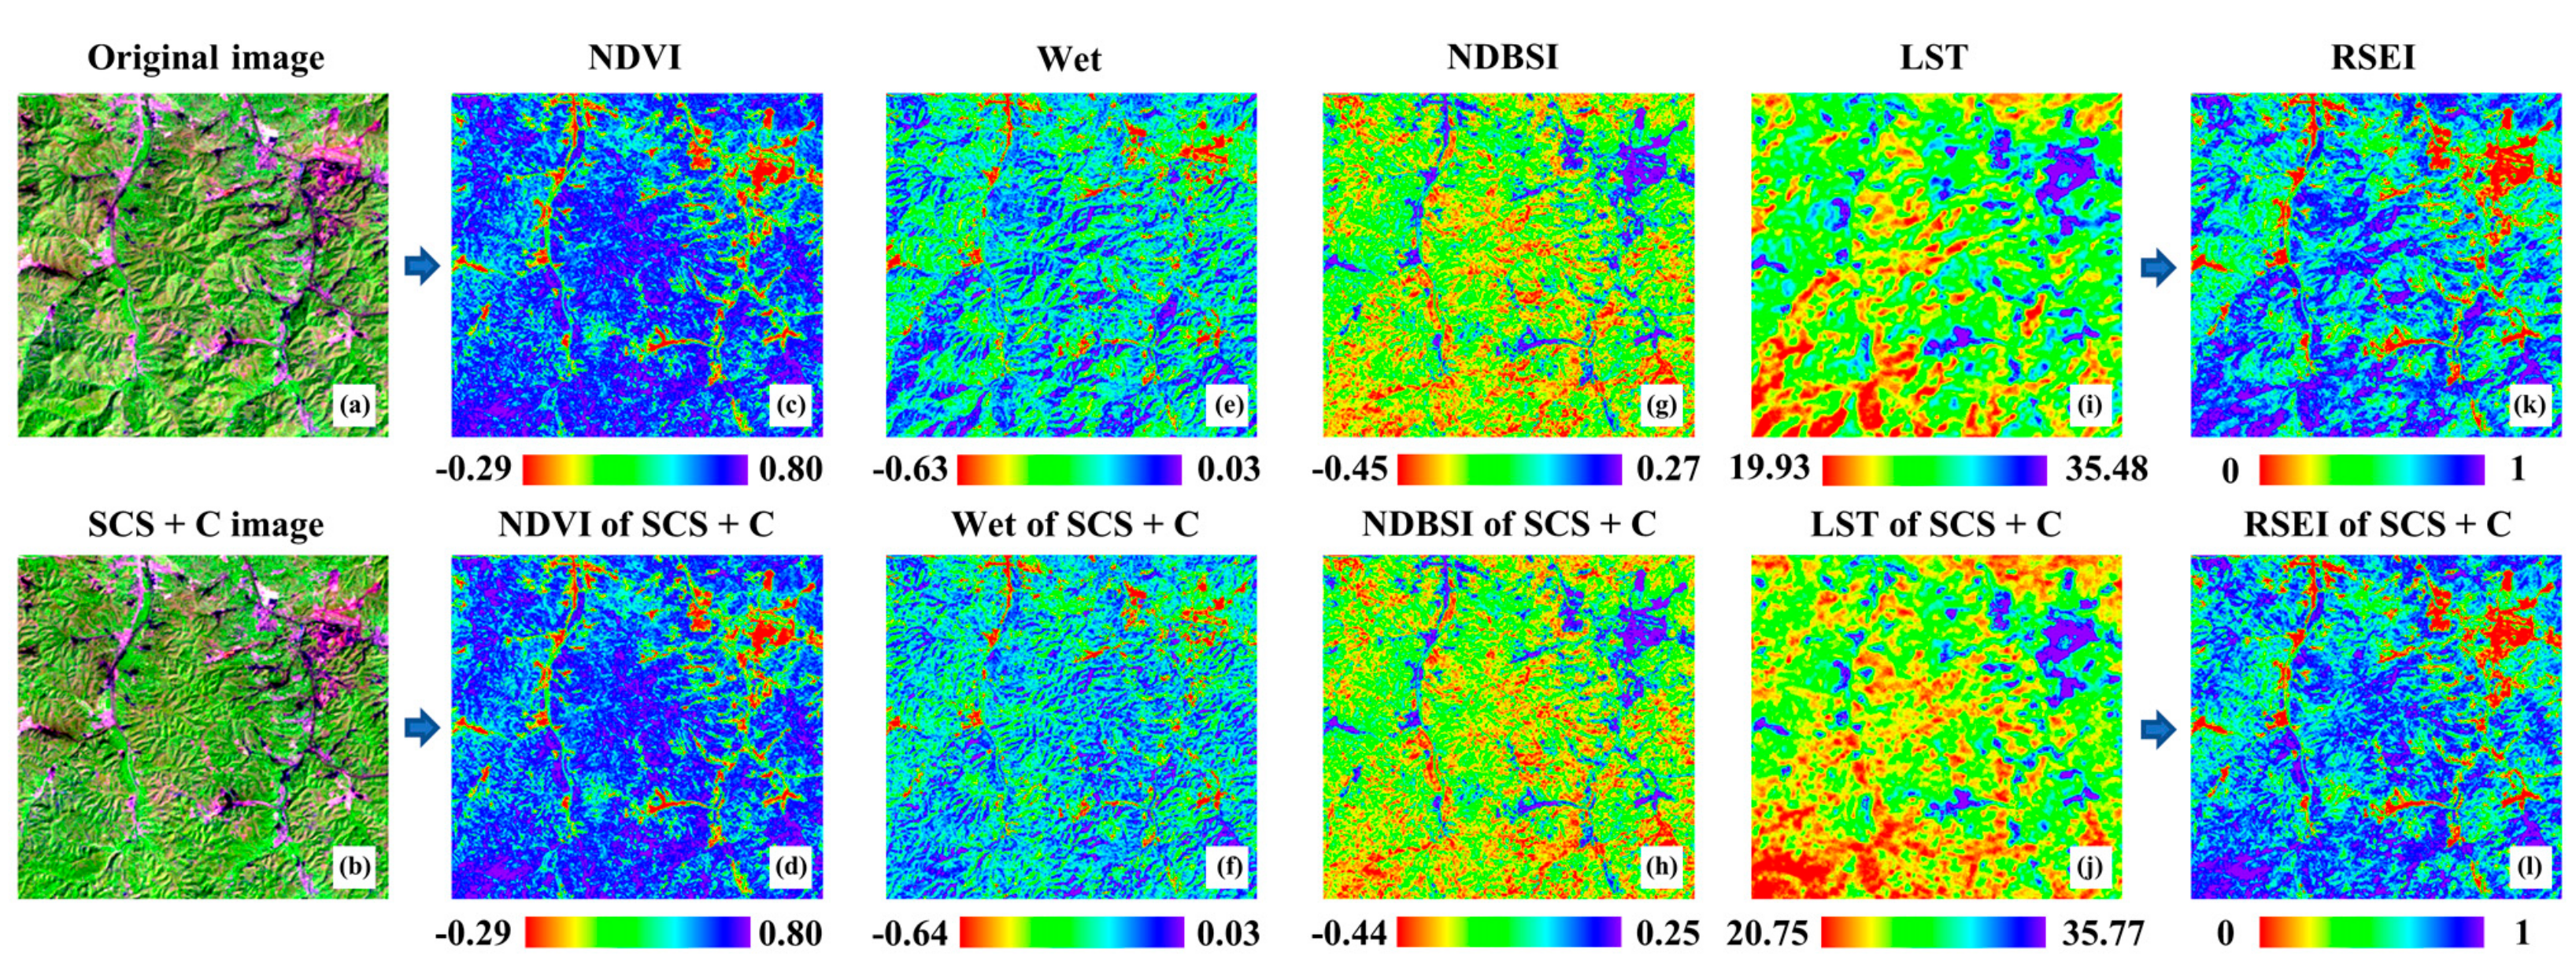
4.3. Comparison of Ecological Environment Indicators before and after Topographic Correction
5. Discussion
5.1. Analysis of Driving Forces for Changes in Ecological Environment Quality in Coal Mining Areas
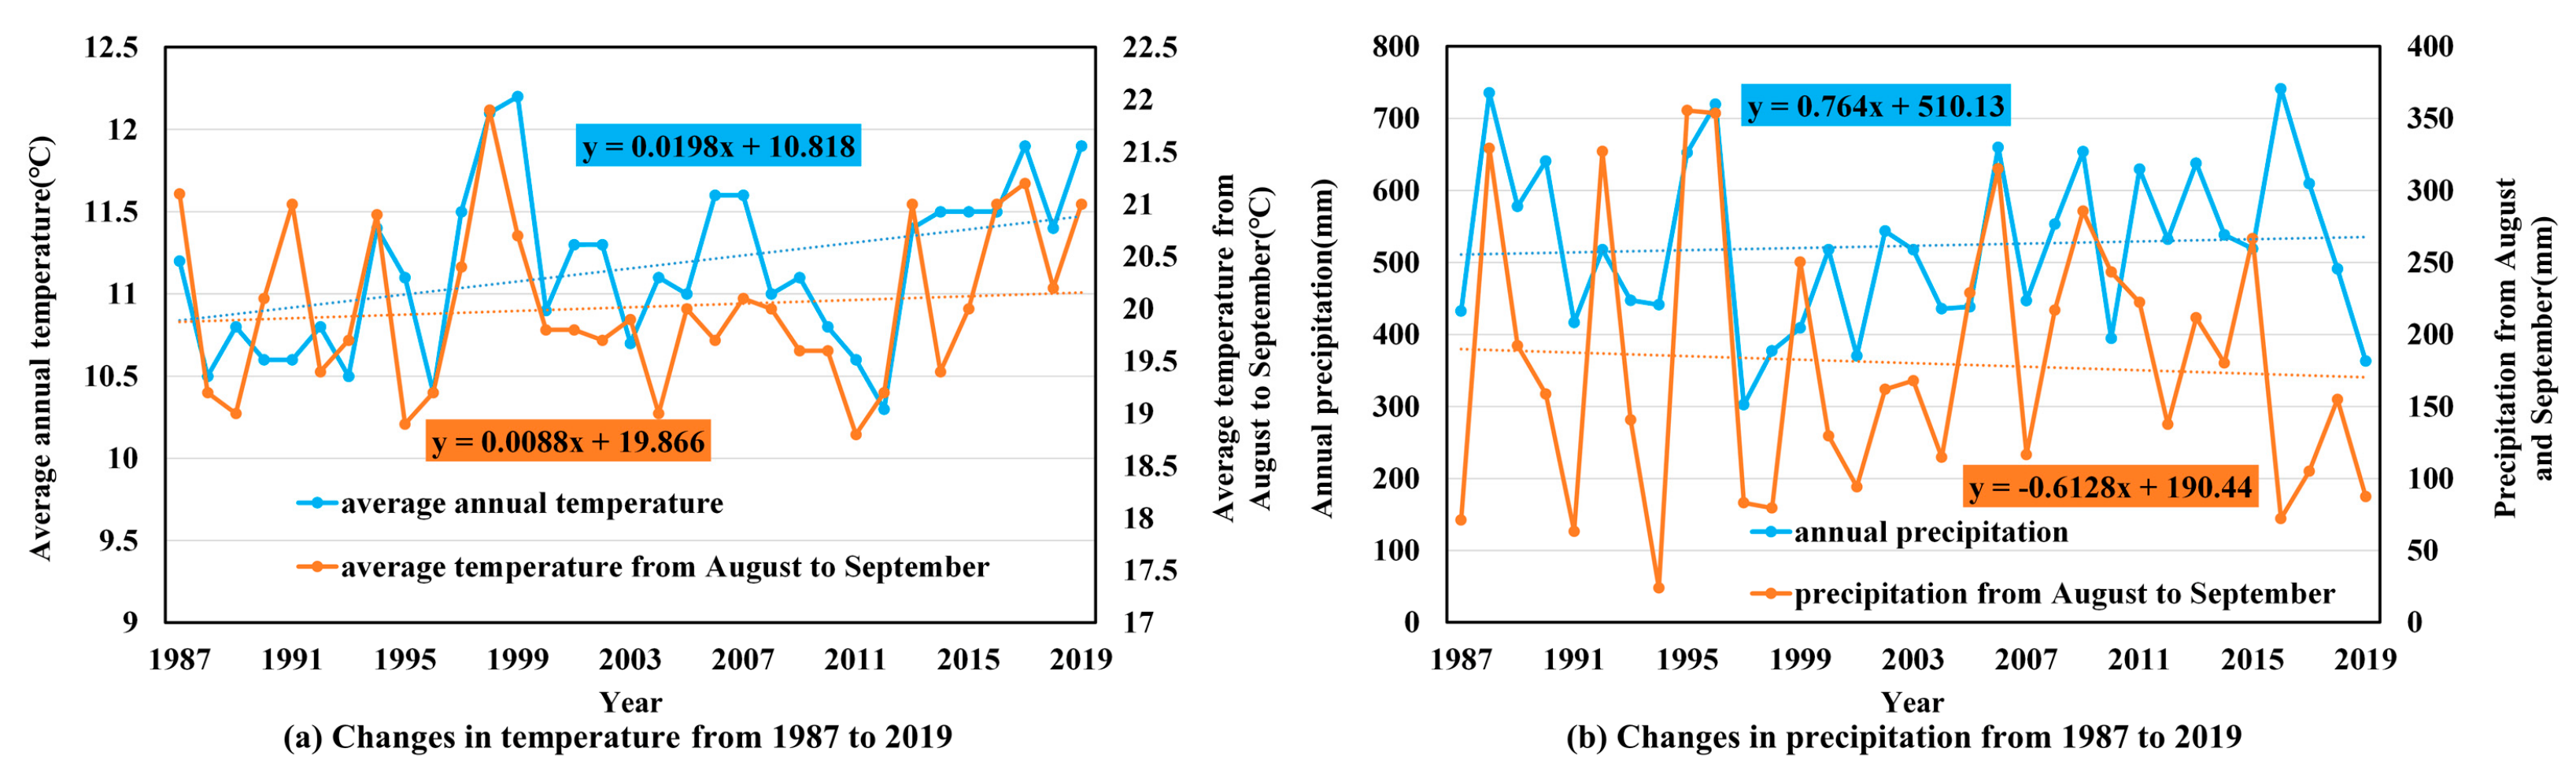
5.1.1. Climate Change
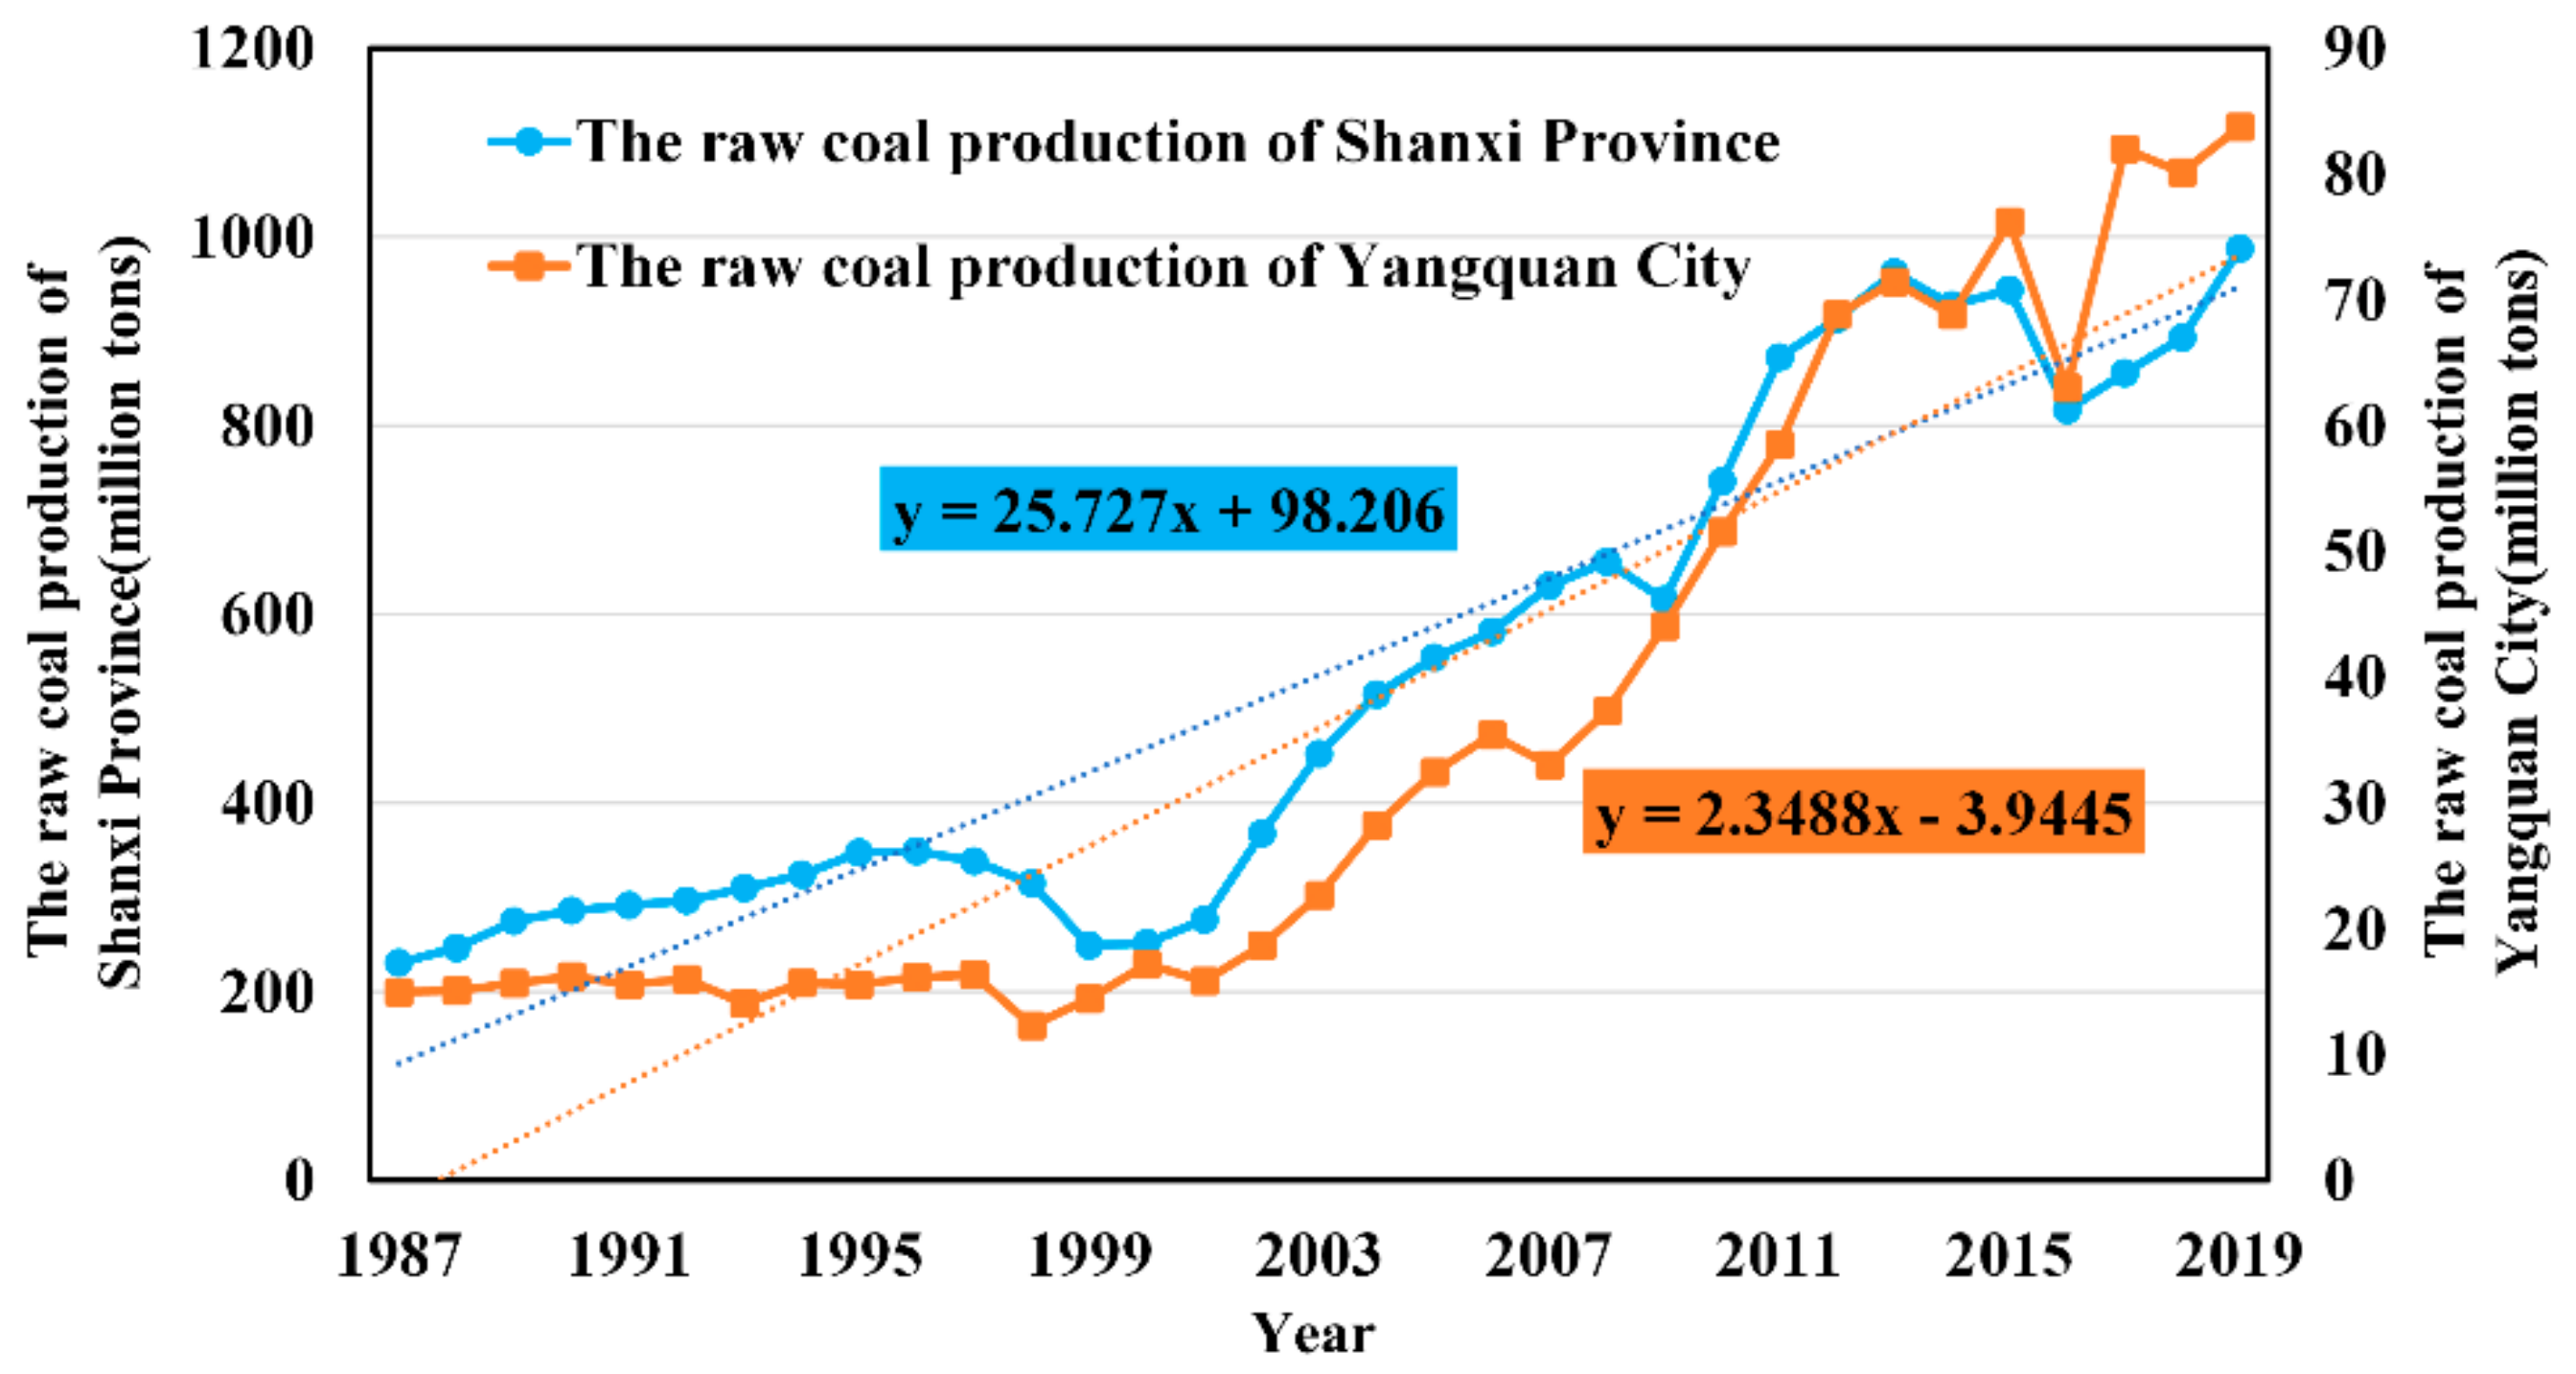
5.1.2. Coal Mining Activities
5.1.3. Ecological Restoration
5.1.4. Urbanization Construction
5.2. Limitations and Future Research Priorities
6. Conclusions
- (1)
- This study proved the feasibility of using topographic correction for ecological environmental quality assessment for the first time and provided new ideas for the improvement of ecological environmental quality assessment models. The NDVI is not sensitive to terrain, but topographic correction can further eliminate its terrain effects. Wet, the NDBSI, LST, and RSEI are sensitive to terrain and require topographic correction. The ecological environment quality evaluation model after topographic correction contains more information and is more representative than the ecological environment quality evaluation model without topographic correction. Therefore, we suggest that topographic correction should be used as a necessary element in data preprocessing in areas with large terrain fluctuations, which will help improve the practicability of the ecological environment quality evaluation model.
- (2)
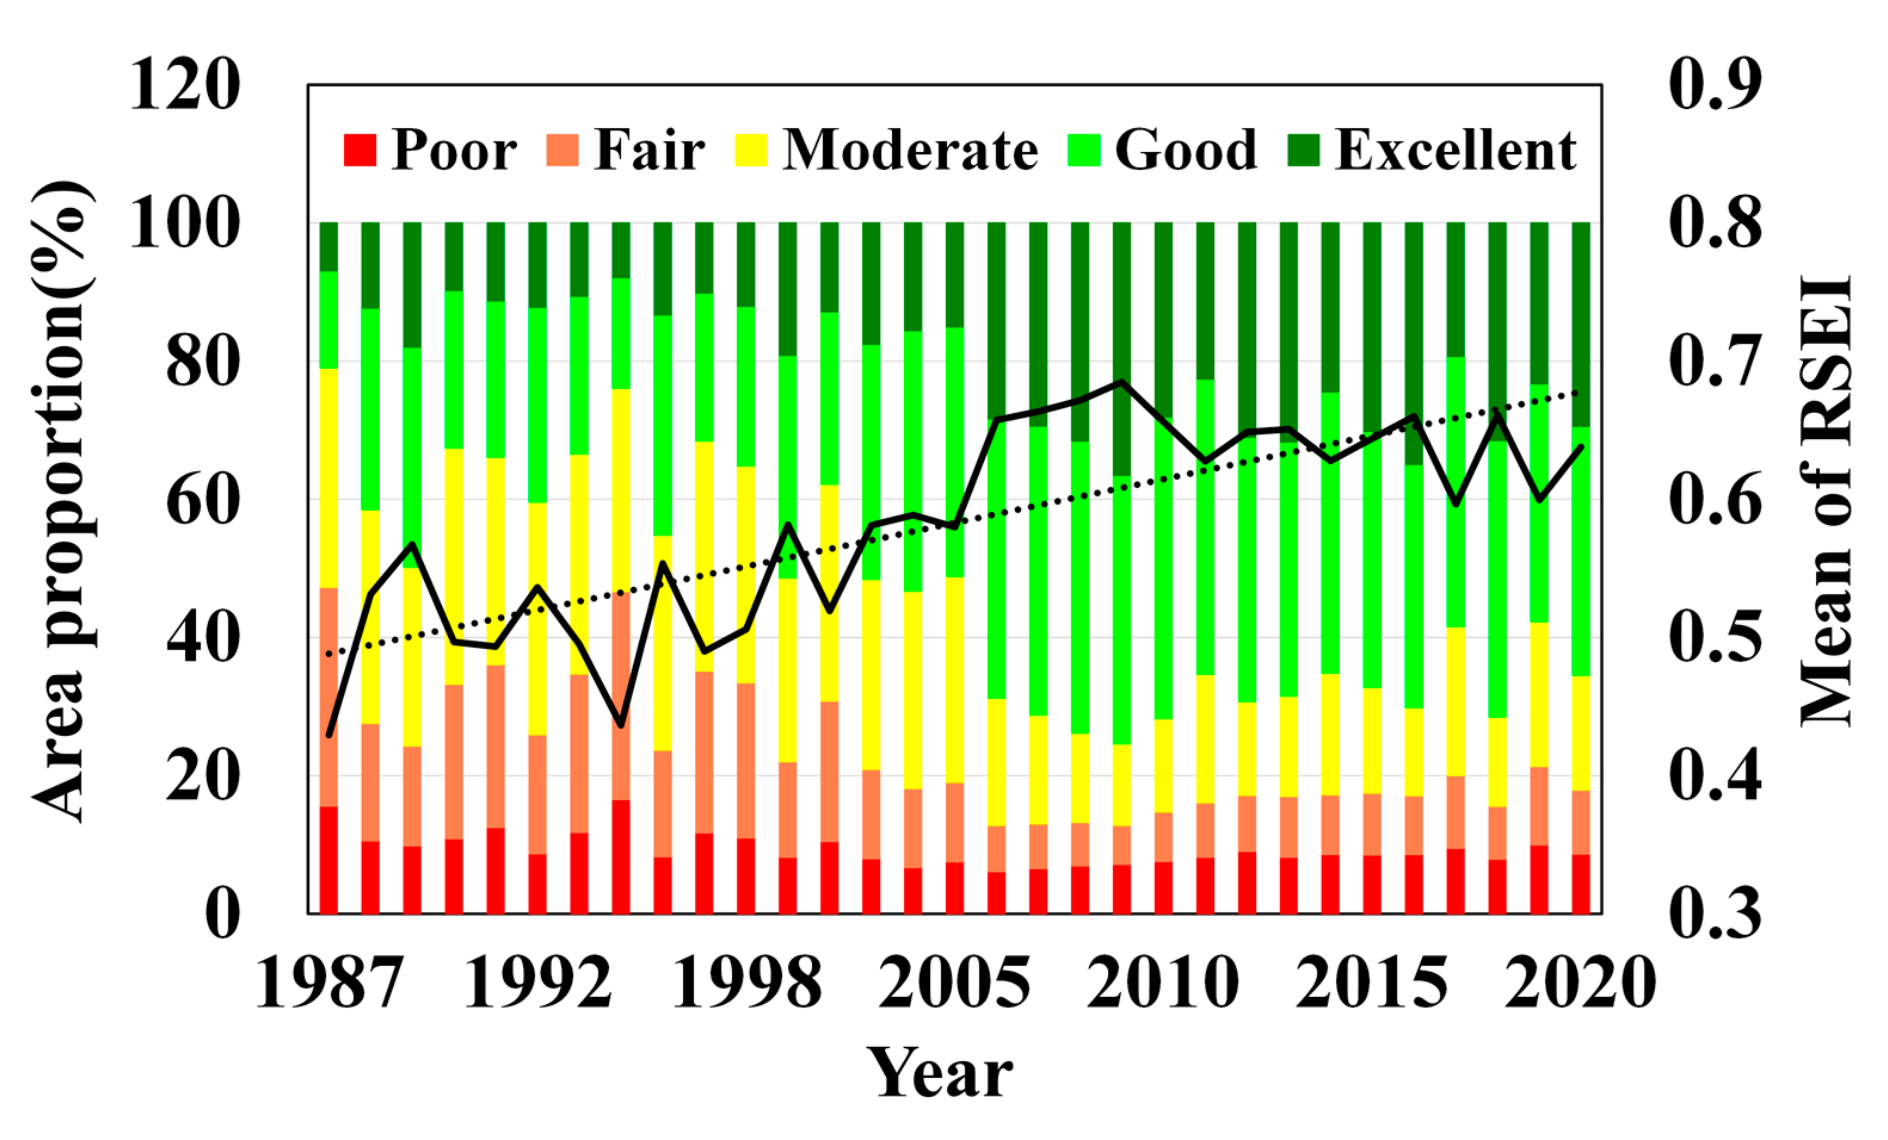
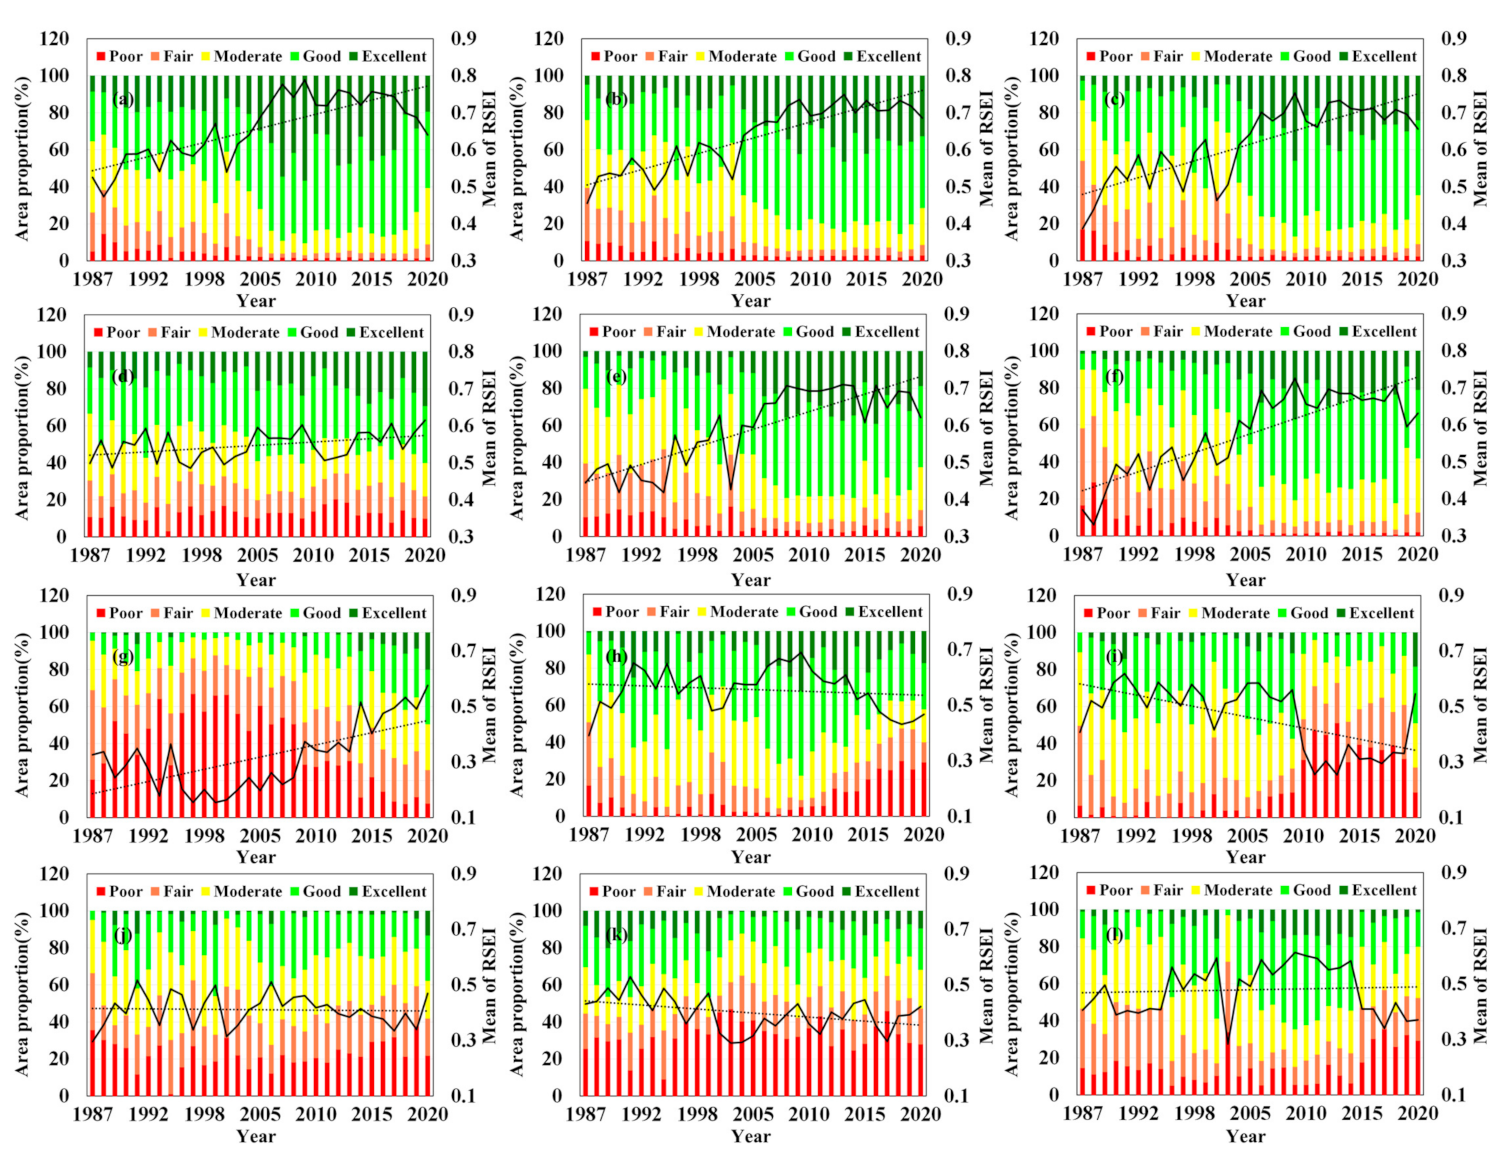
- From 1987 to 2020, the mean of the RSEI of Yangquan Coal Mine and its affiliated coal mines showed an overall upward trend, while the proportion of good and excellent areas also continued to increase. The improved, unchanged, and degraded areas of the ecological environment of the entire study area accounted for 1339.23, 17.2, and 281.02 km2, respectively. For the coal gangue dump, the ecological environment quality of D1, D2, D3, and D4 was generally improved, while the ecological environment quality of D5 and D6 was generally degraded.
- (3)
- The evolution of the ecological environment quality of Yangquan Coal Mine is the result of the combined effects of climate change and human factors, with human factors being the main driving force. Coal mining activities and urbanization have negative impacts on the ecological environment of Yangquan Coal Mine, while the increase in precipitation and the continuous development of ecological restoration have a positive impact on the ecological environment. Based on the results of stepwise regression analysis, greenness and dryness are the main indicators that determine the ecological environment quality of Yangquan Coal Mine, while humidity and heat are secondary indicators. Therefore, we suggest that the ecological restoration of coal mine areas in the future should focus on increasing vegetation coverage and reducing surface exposure. In coal gangue dumps with severe spontaneous combustion, it is also necessary to pay attention to fire prevention and cooling. For urban areas, the green construction of the city should be mainly ensured, while the speed of expansion and development direction of the built-up area should be reasonably controlled.
Supplementary Materials
Author Contributions
Funding
Institutional Review Board Statement
Informed Consent Statement
Data Availability Statement
Acknowledgments
Conflicts of Interest
References
- Zhou, A.; Hu, J.; Wang, K. Carbon emission assessment and control measures for coal mining in China. Environ. Earth Sci. 2020, 79, 1–15. [Google Scholar] [CrossRef]
- Liu, S.; Li, W.; Qiao, W.; Wang, Q.; Hu, Y.; Wang, Z. Effect of natural conditions and mining activities on vegetation variations in arid and semiarid mining regions. Ecol. Indic. 2019, 103, 331–345. [Google Scholar] [CrossRef]
- He, T.; Xiao, W.; Zhao, Y.; Deng, X.; Hu, Z. Identification of waterlogging in Eastern China induced by mining subsidence: A case study of Google Earth Engine time-series analysis applied to the Huainan coal field. Remote Sens. Environ. 2020, 242, 111742. [Google Scholar] [CrossRef]
- Karan, S.K.; Ghosh, S.; Samadder, S.R. Identification of spatially distributed hotspots for soil loss and erosion potential in mining areas of Upper Damodar Basin—India. Catena 2019, 182, 104144. [Google Scholar] [CrossRef]
- Ai, H.; Guan, M.; Feng, W.; Li, K. Influence of classified coal consumption on PM2.5 pollution: Analysis based on the panel cointegration and error-correction model. Energy 2021, 215, 119108. [Google Scholar] [CrossRef]
- Luan, J.; Zhang, Y.; Tian, J.; Meresa, H.; Liu, D. Coal mining impacts on catchment runoff. J. Hydrol. 2020, 589, 125101. [Google Scholar] [CrossRef]
- Fang, L.; Xinju, L.; Le, H.; Anran, S. A long-term study on the soil reconstruction process of reclaimed land by coal gangue filling. Catena 2020, 195, 104874. [Google Scholar] [CrossRef]
- Zhou, N.; Yao, Y.; Song, W.; He, Z.; Meng, G.; Liu, Y. Present situation and prospect of coal gangue treatment technology. J. Min. Saf. Eng. 2020, 37, 136–146. [Google Scholar] [CrossRef]
- Guo, W.; Chen, B.; Li, G.; Liu, M.; Liu, X.; Chen, Q.; Zhang, X.; Li, S.; Chen, S.; Feng, W.; et al. Ambient PM2.5 and Related Health Impacts of Spontaneous Combustion of Coal and Coal Gangue. Environ. Sci. Technol. 2021, 55, 5763–5771. [Google Scholar] [CrossRef]
- Yang, Z.; Li, W.; Pei, Y.; Qiao, W.; Wu, Y. Classification of the type of eco-geological environment of a coal mine district: A case study of an ecologically fragile region in Western China. J. Clean. Prod. 2018, 174, 1513–1526. [Google Scholar] [CrossRef]
- Zhao, W.; Yan, T.; Ding, X.; Peng, S.; Chen, H.; Fu, Y.; Zhou, Z. Response of ecological quality to the evolution of land use structure in Taiyuan during 2003 to 2018. Alex. Eng. J. 2021, 60, 1777–1785. [Google Scholar] [CrossRef]
- Jing, Y.; Zhang, F.; He, Y.; Kung, H.; Johnson, V.C.; Arikena, M. Assessment of spatial and temporal variation of ecological environment quality in Ebinur Lake Wetland National Nature Reserve, Xinjiang, China. Ecol. Indic. 2020, 110, 105874. [Google Scholar] [CrossRef]
- Song, W.; Song, W.; Gu, H.; Li, F. Progress in the remote sensing monitoring of the ecological environment in mining areas. Int. J. Environ. Res. Public Health 2020, 17, 1846. [Google Scholar] [CrossRef]
- Rouse, J.W.; Haas, R.H.; Schell, J.A.; Deering, D.W. Monitoring vegetation systems in the Great Plains with ERTS. NASA Spec. Publ. 1974, 351, 309. [Google Scholar]
- Yang, Z.; Li, J.; Zipper, C.E.; Shen, Y.; Miao, H.; Donovan, P.F. Identification of the disturbance and trajectory types in mining areas using multitemporal remote sensing images. Sci. Total Environ. 2018, 644, 916–927. [Google Scholar] [CrossRef] [PubMed]
- Karan, S.K.; Samadder, S.R.; Maiti, S.K. Assessment of the capability of remote sensing and GIS techniques for monitoring reclamation success in coal mine degraded lands. J. Environ. Manag. 2016, 182, 272–283. [Google Scholar] [CrossRef]
- Vorovencii, I. Changes detected in the extent of surface mining and reclamation using multitemporal Landsat imagery: A case study of Jiu Valley, Romania. Environ. Monit. Assess. 2021, 193, 1–24. [Google Scholar] [CrossRef] [PubMed]
- Zhang, M.; Wang, J.; Li, S. Tempo-spatial changes and main anthropogenic influence factors of vegetation fractional coverage in a large-scale opencast coal mine area from 1992 to 2015. J. Clean. Prod. 2019, 232, 940–952. [Google Scholar] [CrossRef]
- Song, Z.; Kuenzer, C.; Zhu, H.; Zhang, Z.; Jia, Y.; Sun, Y.; Zhang, J. Analysis of coal fire dynamics in the Wuda syncline impacted by fire-fighting activities based on in-situ observations and Landsat-8 remote sensing data. Int. J. Coal Geol. 2015, 141–142, 91–102. [Google Scholar] [CrossRef]
- Syed, T.H.; Riyas, M.J.; Kuenzer, C. Remote sensing of coal fires in India: A review. Earth Sci. Rev. 2018, 187, 338–355. [Google Scholar] [CrossRef]
- Yang, Y.; Zhang, Y.; Su, X.; Hou, H.; Zhang, S. The spatial distribution and expansion of subsided wetlands induced by underground coal mining in eastern China. Environ. Earth Sci. 2021, 80, 1–14. [Google Scholar] [CrossRef]
- Yue, H.; Liu, Y.; Qian, J. Soil moisture assessment through the SSMMI and GSSIM algorithm based on SPOT, WorldView-2, and Sentinel-2 images in the Daliuta Coal Mining Area, China. Environ. Monit. Assess. 2020, 192, 237. [Google Scholar] [CrossRef]
- Xu, J.; Yin, P.; Hu, W.; Fu, L.; Zhao, H. Assessing the ecological regime and spatial spillover effects of a reclaimed mining subsided lake: A case study of the Pan’an Lake wetland in Xuzhou. PLoS ONE 2020, 15, e238243. [Google Scholar] [CrossRef]
- Xiao, W.; Lv, X.; Zhao, Y.; Sun, H.; Li, J. Ecological resilience assessment of an arid coal mining area using index of entropy and linear weighted analysis: A case study of Shendong Coalfield, China. Ecol. Indic. 2020, 109, 105843. [Google Scholar] [CrossRef]
- Hou, H.; Ding, Z.; Zhang, S.; Guo, S.; Yang, Y.; Chen, Z.; Mi, J.; Wang, X. Spatial estimate of ecological and environmental damage in an underground coal mining area on the Loess Plateau: Implications for planning restoration interventions. J. Clean. Prod. 2021, 287, 125061. [Google Scholar] [CrossRef]
- Firozjaei, M.K.; Sedighi, A.; Firozjaei, H.K.; Kiavarz, M.; Homaee, M.; Arsanjani, J.J.; Makki, M.; Naimi, B.; Alavipanah, S.K. A historical and future impact assessment of mining activities on surface biophysical characteristics change: A remote sensing-based approach. Ecol. Indic. 2021, 122, 107264. [Google Scholar] [CrossRef]
- Xu, H.; Wang, M.; Shi, T.; Guan, H.; Fang, C.; Lin, Z. Prediction of ecological effects of potential population and impervious surface increases using a remote sensing based ecological index (RSEI). Ecol. Indic. 2018, 93, 730–740. [Google Scholar] [CrossRef]
- Xu, H.; Wang, Y.; Guan, H.; Shi, T.; Hu, X. Detecting ecological changes with a remote sensing based ecological index (RSEI) produced time series and change vector analysis. Remote. Sens. 2019, 11, 2345. [Google Scholar] [CrossRef]
- Hu, X.; Xu, H. A new remote sensing index based on the pressure-state-response framework to assess regional ecological change. Environ. Sci. Pollut. Res. 2019, 26, 5381–5393. [Google Scholar] [CrossRef] [PubMed]
- Shan, W.; Jin, X.; Ren, J.; Wang, Y.; Xu, Z.; Fan, Y.; Gu, Z.; Hong, C.; Lin, J.; Zhou, Y. Ecological environment quality assessment based on remote sensing data for land consolidation. J. Clean. Prod. 2019, 239, 118126. [Google Scholar] [CrossRef]
- Firozjaei, M.K.; Fathololomi, S.; Kiavarz, M.; Arsanjani, J.J.; Homaee, M.; Alavipanah, S.K. Modeling the impact of the COVID-19 lockdowns on urban surface ecological status: A case study of Milan and Wuhan cities. J. Environ. Manag. 2021, 286, 112236. [Google Scholar] [CrossRef] [PubMed]
- Matsuoka, M.; Moriya, H.; Yoshioka, H. Correction of canopy shadow effects on reflectance in an evergreen Conifer Forest using a 3D point cloud. Remote. Sens. 2020, 12, 2178. [Google Scholar] [CrossRef]
- Gao, M.; Gong, H.; Zhao, W.; Chen, B.; Chen, Z.; Shi, M. An improved topographic correction model based on Minnaert. GIsci. Remote. Sens. 2016, 53, 247–264. [Google Scholar] [CrossRef]
- Riano, D.; Chuvieco, E.; Salas, J.; Aguado, I. Assessment of different topographic corrections in Landsat-TM data for mapping vegetation types. IEEE T. Geosci. Remote 2003, 41, 1056–1061. [Google Scholar] [CrossRef]
- Teillet, P.M.; Guindon, B.; Goodenough, D.G. On the slope-aspect correction of multispectral scanner data. Can. J. Remote Sens. 1982, 8, 84–106. [Google Scholar] [CrossRef]
- Civco, D.L. Topographic normalization of Landsat Thematic Mapper digital imagery. Photogramm. Eng. Remote Sens. 1989, 55, 1303–1309. [Google Scholar] [CrossRef][Green Version]
- Gu, D.; Gillespie, A. Topographic normalization of landsat TM images of forest based on subpixel sun-canopy-sensor geometry. Remote Sens. Environ. 1998, 64, 166–175. [Google Scholar] [CrossRef]
- Yin, G.; Li, A.; Wu, S.; Fan, W.; Zeng, Y.; Yan, K.; Xu, B.; Li, J.; Liu, Q. PLC: A simple and semi-physical topographic correction method for vegetation canopies based on path length correction. Remote Sens. Environ. 2018, 215, 184–198. [Google Scholar] [CrossRef]
- Gao, Y.; Zhang, W. A simple empirical topographic correction method for ETM + imagery. Int. J. Remote Sens. 2009, 30, 2259–2275. [Google Scholar] [CrossRef]
- Soenen, S.A.; Peddle, D.R.; Coburn, C.A. SCS + C: A modified sun-canopy-sensor topographic correction in forested terrain. IEEE T. Geosci. Remote. 2005, 43, 2148–2159. [Google Scholar] [CrossRef]
- Vanonckelen, S.; Lhermitte, S.; van Rompaey, A. The effect of atmospheric and topographic correction methods on land cover classification accuracy. Int. J. Appl. Earth Obs. 2013, 24, 9–21. [Google Scholar] [CrossRef]
- Dong, C.; Zhao, G.; Meng, Y.; Li, B.; Peng, B. The effect of topographic correction on forest tree species classification accuracy. Remote Sens. 2020, 12, 787. [Google Scholar] [CrossRef]
- Huang, W.; Zhang, L.; Furumi, S.; Muramatsu, K.; Daigo, M.; Li, P. Topographic effects on estimating net primary productivity of green coniferous forest in complex terrain using Landsat data: A case study of Yoshino Mountain, Japan. Int. J. Remote Sens. 2010, 31, 2941–2957. [Google Scholar] [CrossRef]
- Tian, X.; Li, Z.; Su, Z.; Chen, E.; van der Tol, C.; Li, X.; Guo, Y.; Li, L.; Ling, F. Estimating montane forest above-ground biomass in the upper reaches of the Heihe River Basin using Landsat-TM data. Int. J. Remote Sens. 2014, 35, 7339–7362. [Google Scholar] [CrossRef]
- Jin, H.; Li, A.; Xu, W.; Xiao, Z.; Jiang, J.; Xue, H. Evaluation of topographic effects on multiscale leaf area index estimation using remotely sensed observations from multiple sensors. Isprs J. Photogramm. 2019, 154, 176–188. [Google Scholar] [CrossRef]
- Zhu, Z.; Wang, S.; Woodcock, C.E. Improvement and expansion of the Fmask algorithm: Cloud, cloud shadow, and snow detection for Landsats 4–7, 8, and Sentinel 2 images. Remote Sens. Environ. 2015, 159, 269–277. [Google Scholar] [CrossRef]
- Crist, E.P. A TM Tasseled Cap equivalent transformation for reflectance factor data. Remote Sens. Environ. 1985, 17, 301–306. [Google Scholar] [CrossRef]
- Sobrino, J.A.; Jiménez-Muñoz, J.C.; Paolini, L. Land surface temperature retrieval from LANDSAT TM 5. Remote Sens. Environ. 2004, 90, 434–440. [Google Scholar] [CrossRef]
- Roy, D.P.; Kovalskyy, V.; Zhang, H.K.; Vermote, E.F.; Yan, L.; Kumar, S.S.; Egorov, A. Characterization of Landsat-7 to Landsat-8 reflective wavelength and normalized difference vegetation index continuity. Remote Sens. Environ. 2016, 185, 57–70. [Google Scholar] [CrossRef]
- Vidal-Macua, J.J.; Nicolau, J.M.; Vicente, E.; Moreno-de las Heras, M. Assessing vegetation recovery in reclaimed opencast mines of the Teruel coalfield (Spain) using Landsat time series and boosted regression trees. Sci. Total Environ. 2020, 717, 137250. [Google Scholar] [CrossRef]
- Raynolds, M.K.; Walker, D.A. Increased wetness confounds Landsat-derived NDVI trends in the central Alaska North Slope region, 1985-2011. Environ. Res. Lett. 2016, 11, 85004. [Google Scholar] [CrossRef]
- Xu, H. A new index for delineating built-up land features in satellite imagery. Int. J. Remote Sens. 2008, 29, 4269–4276. [Google Scholar] [CrossRef]
- Rikimaru, A.; Roy, P.S.; Miyatake, S. Tropical forest cover density mapping. Trop. Ecol. 2002, 43, 39–47. [Google Scholar]
- Seddon, A.W.R.; Macias-Fauria, M.; Long, P.R.; Benz, D.; Willis, K.J. Sensitivity of global terrestrial ecosystems to climate variability. Nature 2016, 531, 229–232. [Google Scholar] [CrossRef] [PubMed]
- Hu, X.; Xu, H. A new remote sensing index for assessing the spatial heterogeneity in urban ecological quality: A case from Fuzhou City, China. Ecol. Indic. 2018, 89, 11–21. [Google Scholar] [CrossRef]
- Guo, B.; Fang, Y.; Jin, X.; Zhou, Y. Monitoring the effects of land consolidation on the ecological environmental quality based on remote sensing: A case study of Chaohu Lake Basin, China. Land Use Policy 2020, 95, 104569. [Google Scholar] [CrossRef]
- Martinez Batlle, J.R.; van der Hoek, Y. Clusters of high abundance of plants detected from local indicators of spatial association (LISA) in a semi-deciduous tropical forest. PLoS ONE 2018, 13, 93–115. [Google Scholar] [CrossRef]
- Wei, W.; Guo, Z.; Xie, B.; Zhou, J.; Li, C. Spatiotemporal evolution of environment based on integrated remote sensing indexes in arid inland river basin in Northwest China. Environ. Sci. Pollut. Res. Int. 2019, 26, 13062–13084. [Google Scholar] [CrossRef] [PubMed]
- Yan, X.; Li, J.; Shao, Y.; Hu, Z.; Yang, Z.; Yin, S.; Cui, L. Driving forces of grassland vegetation changes in Chen Barag Banner, Inner Mongolia. GISci. Remote Sens. 2020, 57, 753–769. [Google Scholar] [CrossRef]
- Li, S.; Yang, B.; Wu, D. Community succession analysis of naturally colonized plants on coal gob piles in Shanxi Mining Areas, China. Water Air Soil Pollut. 2008, 193, 211–228. [Google Scholar] [CrossRef]
- Li, S.; Liber, K. Influence of different revegetation choices on plant community and soil development nine years after initial planting on a reclaimed coal gob pile in the Shanxi mining area, China. Sci. Total Environ. 2018, 618, 1314–1323. [Google Scholar] [CrossRef]
- Querol, X.; Izquierdo, M.; Monfort, E.; Alvarez, E.; Font, O.; Moreno, T.; Alastuey, A.; Zhuang, X.; Lu, W.; Wang, Y. Environmental characterization of burnt coal gangue banks at Yangquan, Shanxi Province, China. Int. J. Coal Geol. 2008, 75, 93–104. [Google Scholar] [CrossRef]
- National Development and Reform Commission of China, National Energy Administration of China. 13th Five-Year Plan for Coal Industry Development; National Development and Reform Commission (NDRC): Beijing, China, 2016.
- Zheng, Z.; Wu, Z.; Chen, Y.; Yang, Z.; Marinello, F. Exploration of eco-environment and urbanization changes in coastal zones: A case study in China over the past 20 years. Ecol. Indic. 2020, 119, 106847. [Google Scholar] [CrossRef]
- Yang, K.; Sun, W.; Luo, Y.; Zhao, L. Impact of urban expansion on vegetation: The case of China (2000–2018). J. Environ. Manag. 2021, 291, 112598. [Google Scholar] [CrossRef] [PubMed]


| Type | Level | 1987–1998 | 1998–2010 | 2010–2020 | 1987–2020 | ||||
|---|---|---|---|---|---|---|---|---|---|
| Level Percent (%) | Sub-Total (%) | Level Percent (%) | Sub-Total (%) | Level Percent (%) | Sub-Total (%) | Level Percent (%) | Sub-Total (%) | ||
| Improved | +4 | 0.06 | 64.55 | 0.27 | 77.07 | 0.19 | 46.47 | 1.67 | 77.08 |
| +3 | 1.49 | 6.07 | 0.92 | 12.96 | |||||
| +2 | 17.65 | 27.68 | 5.18 | 32.26 | |||||
| +1 | 45.35 | 43.05 | 40.18 | 30.19 | |||||
| Unchanged | 0 | 1.31 | 1.31 | 1.15 | 1.15 | 1.45 | 1.45 | 0.99 | 0.99 |
| Degraded | −1 | 29.22 | 34.14 | 15.83 | 21.78 | 42.94 | 52.08 | 15.81 | 21.93 |
| −2 | 4.49 | 3.97 | 6.48 | 4.83 | |||||
| −3 | 0.37 | 1.70 | 2.11 | 1.14 | |||||
| −4 | 0.06 | 0.28 | 0.55 | 0.15 | |||||
| Year | NDVI | Wet | NDBSI | LST | Difference | Difference Percent (%) |
|---|---|---|---|---|---|---|
| 1987 | 0.2794 | 0.2850 | −0.4128 | −0.2918 | 0.1402 | 24.84 |
| 1998 | 0.2916 | 0.2422 | −0.4040 | −0.3157 | 0.1859 | 34.83 |
| 2010 | 0.3782 | 0.2129 | −0.3621 | −0.2374 | 0.0084 | 1.42 |
| 2020 | 0.3511 | 0.2456 | −0.3842 | −0.2077 | −0.0048 | −0.80 |
| Mean | 0.3251 | 0.2464 | −0.3908 | −0.2632 | 0.0824 | 14.42 |
Publisher’s Note: MDPI stays neutral with regard to jurisdictional claims in published maps and institutional affiliations. |
© 2021 by the authors. Licensee MDPI, Basel, Switzerland. This article is an open access article distributed under the terms and conditions of the Creative Commons Attribution (CC BY) license (https://creativecommons.org/licenses/by/4.0/).
Share and Cite
Nie, X.; Hu, Z.; Zhu, Q.; Ruan, M. Research on Temporal and Spatial Resolution and the Driving Forces of Ecological Environment Quality in Coal Mining Areas Considering Topographic Correction. Remote Sens. 2021, 13, 2815. https://doi.org/10.3390/rs13142815
Nie X, Hu Z, Zhu Q, Ruan M. Research on Temporal and Spatial Resolution and the Driving Forces of Ecological Environment Quality in Coal Mining Areas Considering Topographic Correction. Remote Sensing. 2021; 13(14):2815. https://doi.org/10.3390/rs13142815
Chicago/Turabian StyleNie, Xinran, Zhenqi Hu, Qi Zhu, and Mengying Ruan. 2021. "Research on Temporal and Spatial Resolution and the Driving Forces of Ecological Environment Quality in Coal Mining Areas Considering Topographic Correction" Remote Sensing 13, no. 14: 2815. https://doi.org/10.3390/rs13142815
APA StyleNie, X., Hu, Z., Zhu, Q., & Ruan, M. (2021). Research on Temporal and Spatial Resolution and the Driving Forces of Ecological Environment Quality in Coal Mining Areas Considering Topographic Correction. Remote Sensing, 13(14), 2815. https://doi.org/10.3390/rs13142815