Abstract
A Non-Binary Snow Index for Multi-Component Surfaces (NBSI-MS) is proposed to map snow/ice cover. The NBSI-MS is based on the spectral characteristics of different Land Cover Types (LCTs), such as snow, water, vegetation, bare land, impervious, and shadow surfaces. This index can increase the separability between NBSI-MS values corresponding to snow from other LCTs and accurately delineate the snow/ice cover in non-binary maps. To test the robustness of the NBSI-MS, regions in Greenland and France–Italy where snow interacts with highly diversified geographical ecosystems were examined. Data recorded by Landsat 5 TM, Landsat 8 OLI, and Sentinel-2A MSI satellites were used. The NBSI-MS performance was also compared against the well-known Normalized Difference Snow Index (NDSI), NDSII-1, S3, and Snow Water Index (SWI) methods and evaluated based on Ground Reference Test Pixels (GRTPs) over non-binarized results. The results show that the NBSI-MS achieved an overall accuracy (OA) ranging from 0.99 to 1 with kappa coefficient values in the same range as the OA. The precision assessment confirmed the performance superiority of the proposed NBSI-MS method for removing water and shadow surfaces over the compared relevant indices.
1. Introduction
The cryosphere, such as snow and ice cover, reflects electromagnetic radiation that strikes the earth’s surface from the sun, reducing global warming at medium and large scales [1,2] and contributing to the water supply cycle [3,4], among other advantages. Due to the hostile terrain conditions in cryosphere areas, Remote Sensing (RS) satellite technology conveniently complements manual field-based techniques.
The advantage of using remote sensing derives from the spectral and temporal resolution of the images as well as the extension of the area they cover, thus, providing information relevant to modelling, which is further validated by means of the field data set [5,6]. Hence, study of the cryosphere has been conducted by using RS from space since the mid-1960s [7]. The RS provides snow/ice cover data for long-term analysis; however, the lack of satellite records can limit the use of a single MultiSpectral Satellite Database (MSDB). This limitation could be resolved by combining Landsat-8 and Sentinel-2 MSDBs to provide snow/ice cover information with a 2.9-day global median average revisit interval [8,9,10].
Multiple investigations have been conducted for snow/ice cover mapping using MSDBs and several snow index methods have been applied for quantifying and categorizing the relevant information [4,11,12,13]. Snow Index-Based Methods (SIBMs) have proven to be effective as snow/ice cover extraction procedures due to their simplicity and low-cost implementation [4,14]. These methods are based on an algebraic combination of spectral bands for increasing the intensity contrast between snow and non-snow pixels. Among the SIBMs existing in the literature, the Normalized Difference Snow Index (NDSI) [14], the S3 Index [15], the Normalized Difference Snow and Ice Index (NDSII) [16], and the Snow Water Index (SWI) [17] are the most commonly used.
Hall et al. [14] introduced the NDSI method for snow-cover mapping in 1995. This index is based on the snow property of reflecting mainly visible light and absorbing radiation at infrared wavelengths; it operates via normalized differences by using the green and Near-Infrared (NIR) bands. Saito et al. [15] introduced the S3 index and proved its better accuracy over the NDSI [18]. The S3 index uses a combination of Red, NIR, and Shortwave-Infrared (SWIR) bands. It has proven efficacy for snow-cover mapping under high vegetation conditions [18].
Xiao et al. introduced the NDSII approach in 2001, following a methodology similar to NDSI, but with the green band replaced by the red band [16]. The NDSI and NDSII methods produce similar results when the Landsat Thematic Mapper (TM) data are used [16]. The NDSI, NDSII, and S3 methods proved significant separability for snow compared with ice and vegetation covers [19,20,21].
Nevertheless, several studies [6,17,22] have proven that these indices still classify dark forests and water as snow cover, thus, requiring additional masking techniques to remove spurious results from the snow-cover map [6,17,23,24]. In 2019, Dixit et al. [17] introduced the SWI technique to increase the contrast between snow/ice and other LCTs, including cloud, debris, vegetation, and water bodies. The SWI, which uses a combination of green, NIR, and SWIR bands, has shown better results over the NDSI, NDSII, and S3 methods [17].
To remove the effect of non-snow pixels from pure snow pixels, the NDSI, NDSII, S3, and SWI methods require an Optimal Threshold Value (OTHV) to binarize their snow map. However, to identify the Optimal Threshold Value is a challenge as it should be pixel-dependent across the scene and, thus, would require to be defined locally. A fixed threshold can lead to large uncertainties in the resulting snow-cover outcomes at the local scale. For snow-cover mapping based on higher-resolution imagery, a threshold value variable in space and time would be needed to improve the snow-cover map quality [25,26,27,28,29].
In this paper, toward the purpose of overcoming several limitations of the existing indices, the NBSI-MS method is proposed based on the spectral characteristics of different Land Cover Types (LCTs), such as snow/ice, water, vegetation, bare land, impervious, and shadow surfaces. The NBSI-MS method uses six spectral bands—Blue, Green, Red, NIR, SWIR1, and SWIR2—to increase the intensity contrast between snow and non-snow pixels. This index accurately delineates the edge of snow/ice cover without the need to set image thresholding as shown in Figure 1a, using data recorded by the TM, the Operational Land Imager (OLI), and the MultiSpectral Instrument (MSI) satellite sensors.
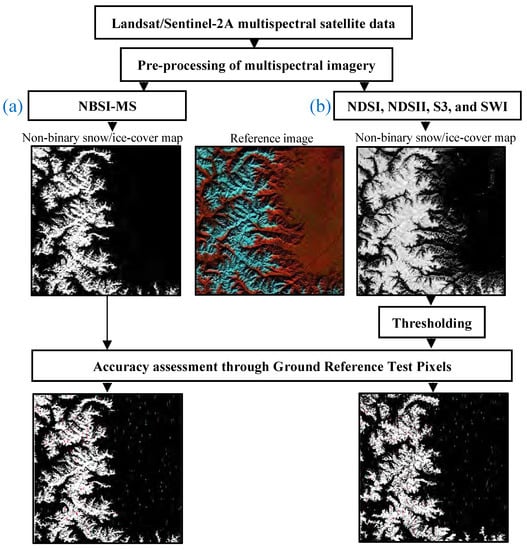
Figure 1.
Comparison of the workflows for (a) Non-Binary Snow Index for the Multi-Component Surfaces (NBSI-MS) and (b) standard Snow Index-Based (NDSI, S3, NDSII, and SWI) methods. (a) The proposed NBSI-MS does not require image thresholding to enhance the quality of snow/ice cover maps, as opposed to (b) the standard Snow Index-Based Methods. NDSI, S3, NDSII, and SWI require image thresholding analysis to improve the delineation of snow-cover maps [30]. The reference image is the false-color composite image of the region by using a combination of green, NIR, and SWIR-2 bands. It is used to visualize in blue the amount of snow cover in the image.
The snow-cover mapping performance of the proposed NBSI-MS is compared against the NDSI, NDSII, S3, and SWI methods in the presence of water, vegetation, bare land, impervious, and shadow surfaces. The snow/ice cover maps produced by all indices are evaluated in regions in Greenland and France–Italy with the same image conditions according to the pre-processing steps and in non-binarized results as follows: (a) qualitatively through visual inspection and (b) quantitatively based on GRTP validation data for precision assessment. The very good agreement between the qualitative and quantitative results confirmed the superiority of the NBSI-MS method to reject the water and shadow surfaces correctly, whereas the NDSI, NDSII, S3, and SWI failed to suppress them.
The remainder of this paper is organized as follows: Section 2 contains the description of the selected test areas, data collection, image pre-processing, and application of the Snow-Cover Indices (SCIs): NDSI, NDSII, S3, SWI, and the proposed NBSI-MS method. Section 3 reports the results of the SCIs evaluation as follows: (a) qualitatively through visual inspection and (b) quantitatively based on GRTPs in non-binarized snow-cover maps for the precision assessment. In Section 4, the most outstanding results are discussed. Finally, Section 5 reports our main conclusions.
2. Materials and Methods
Digital image processing was performed using the ENVI v5.3 (Exelis Visual Information Solutions, Boulder, CO, USA), Sen2Cor algorithm on the SentiNel Application Platform (SNAP) created by the European Space Agency (ESA), MATLAB R2019a, ArcGIS 10.5 (Environmental System Research Institute California, Redlands, CA, USA), and Google Earth Pro (Google Inc., Menlo Park, CA, USA) software packages.
2.1. Test Areas
A region of Greenland covered with snow/ice, bare land, and a large water surface was analyzed to evaluate the SCIs performance. Figure 2 shows the details of this area with a spatial extent of 97.95 × 72.99 km recorded by Landsat and Sentinel-2A, with the center located at 722215.01N, 222835.85W.
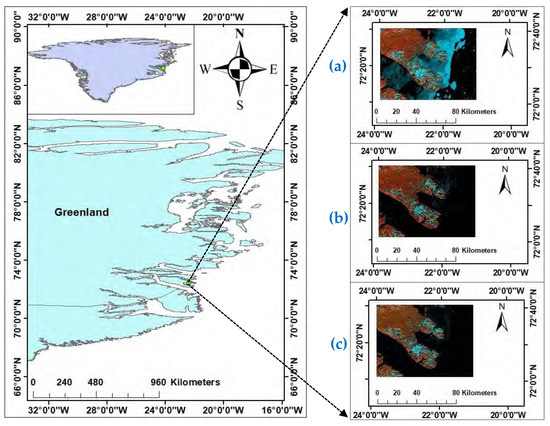
Figure 2.
Location of the Greenland area under study and the false-color composite images used to visualize the amount of snow cover. Left panel represents the precise location of the area. Right panels show the false color composite images using the green, NIR, and SWIR-2 bands of this region for (a) Landsat 5 TM, (b) Landsat 8 OLI, and (c) Sentinel-2A MSI.
Additionally, a region located at the France–Italy border was selected to evaluate all indices under highly diverse geographical conditions. The region’s LCTs include water, vegetation, bare land, urban areas, hilly land, and snow/ice. This scene also includes Hilly Shadow over Vegetation (HS-V) and Hilly Shadow over Bare Land (HS-BL). With such LCT diversity, it is challenging for the SCIs to map the snow/ice cover in this scene. The area is characterized by a spatial extent of 100.8 × 101.01 km and is centered at the coordinates 443840.65N, 7957.30E (see Figure 3).

Figure 3.
Location of the France–Italy region under study and false-color composite images of the region. Left panel represents the precise location of the study region between Italy and France. Right panels show the composite images using the green, NIR, and SWIR-2 bands for (a) Landsat 5 TM, (b) Landsat 8 OLI, and (c) Sentinel-2A MSI.
2.2. Data
The Landsat and Sentinel-2 datasets were downloaded from the United States Geological Survey (USGS) web portal (https://earthexplorer.usgs.gov/ (accessed on 28 June 2021)) [31]. The Landsat Level 1 Terrain Corrected (L1T) and Sentinel-2 Level 1C (L1C) data are in the Universal Transverse Mercator (UTM) map projection. Table 1 shows the specifications of the Landsat and Sentinel-2A datasets used in this research. Greenland and France–Italy test areas, recorded by Landsat 8 OLI and Sentinel-2A MSI in the same period of the year to have comparable snow/ice cover in the scenes, were examined. However, the datasets recorded by the TM sensor refer to a different period than the OLI and MSI sensors as Landsat 5 TM ceased in November 2011 [32].

Table 1.
Summary of the relevant data for Landsat and Sentinel-2A imagery in the Greenland and France–Italy regions.
Nonetheless, since Landsat 5 TM collected data continuously for nearly 29 years, it still constitutes an invaluable source for long-term RS analysis. Additionally, this study considered the percentage of snow/ice cover difference in the test areas (see Section 3.2 for precision assessment) registered by the TM sensor from those of the OLI and MSI sensors as reported in the fifth column of Table 1. Since the SCIs can remove the cloud-contaminated pixels only parly, the images of the three sensors with minimum cloud coverage were chosen on the basis of the cloud percentages as provided by each dataset.
Since different satellite sensors are used in this study, a comparison of the spatial and spectral resolutions must be considered [33]. Table 2 shows the specifications of the selected bands for the satellite sensors used in this research. To perform consistent algebraic operations, the Sentinel-2A SWIR bands were resized to the same spatial resolution (10 m) using the nearest neighborhood algorithm approach on the SNAP [34].

Table 2.
The wavelength and spatial resolution specifications of the bands used for estimating the Snow Cover Indexes for the Landsat 5 TM, Landsat 8 OLI, and Sentinel-2A imagery [35,36]. Note: The spatial resolution specifications are referred to one pixel.
2.3. Multispectral Image Pre-Processing
Pre-processing steps must be taken into account to reduce sensor, solar, diffraction [37], and atmospheric effects [38,39] among the satellite data recorded on different dates [40,41]. Figure 4 shows the pre-processing workflow for the Landsat and Sentinel-2A datasets used in this study. The Landsat satellite data were pre-processed in ENVI, employing radiometric calibration tools using the Landsat header MTL metadata file information to obtain the Top-Of-Atmosphere (TOA) reflectance data. On the other hand, the Sentinel-2A L1C data were pre-processed using the Sen2Cor algorithm on the SNAP to produce Bottom-Of-Atmosphere (BOA) reflectance data. According to Merzah et al. [42], the Internal Average Relative Reflectance (IARR) correction technique removes or reduces the effects of the atmosphere providing a clean spectral curve to be interpreted. In this research, the IAR reflectance correction was applied to the Landsat and Sentinel-2A datasets to reduce the atmosphere effects and obtain similar atmospheric conditions [43,44,45].

Figure 4.
Pre-processing steps applied to (a) Landsat and (b) Sentinel-2A satellite data before index calculation.
2.4. Methodology
The performance of the NBSI-MS snow cover delineation index was compared against well-known SIBMs: NDSI [14], S3 [15], NDSII [16], and SWI [17]. The selected bands to calculate all indices are specified in Table 2, and the mathematical expressions of NDSI, NDSII, S3, and SWI are shown in Table 3. According to Stevens’s taxonomy of measurement scales (nominal, ordinal, interval, and ratio) [46], the SCI indexes, including the proposed one, can be considered ordinal measurements as they permit a rank ordering of the relative snow content and remain invariant under monotonically increasing transformations.

Table 3.
Summary of the Snow Index-Based Methods (SIBMs) used in this research to compare the performance of the Non-Binary Snow Index for the Multi-Component Surfaces method.
2.5. Non-Binary Snow Index for Multi-Component Surfaces (NBSI-MS)
The infrared band registered by an optical sensor captures the thermal radiation of objects in a given scene. In contrast, a visible band mainly records optical reflection information [47]. The proposed NBSI-MS method takes advantage of six spectral bands (, , , , , and as defined in Table 2) to achieve the maximum separability between snow and non-snow pixels. According to Gong et al. [48], the global land cover resides in different LCTs, such as vegetation, water, impervious (e.g., urban areas, roads, and industrial areas), bare land (e.g., beaches, deserts, rocks, and gravel pits), and snow/ice [49].
The NBSI-MS is based on the spectral characteristics of these global LCT classifications plus HS-V and HS-BL. The seven LCTs spectral signatures were obtained using the mean reflectance values of one hundred samples selected on each LCT over the France–Italy region. Figure 5a,b shows these spectral signatures, and Table 4 displays the mean reflectance values using Landsat 8 OLI and Sentinel-2A MSI preprocessed data.
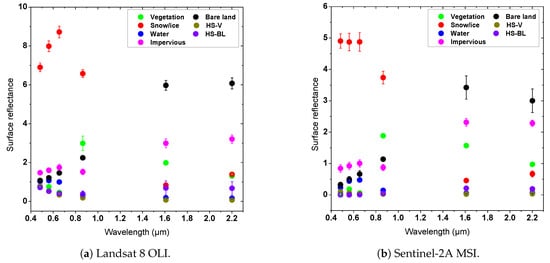
Figure 5.
Spectral signatures (mean ± standard deviation) for (a) Landsat OLI 8 and (b) Sentinel 2A MSI. The signatures were obtained by averaging over 100 pixels selected in each Land Cover Type. Note: HS-BL is the Hilly Shadow over Bare Land, and HS-V is the Hilly Shadow over Vegetation.

Table 4.
The mean reflectance values of one hundred pixels used in Figure 5a,b in the France–Italy region, where HS-BL is the Hilly Shadow over Bare Land, and HS-V is the Hilly Shadow over Vegetation.
The LCTs reflectance between Sentinel-2A MSI, Landsat 8 OLI, and Landsat 5 TM can be slightly different as these satellite technologies are similar but not identical [33]. In spite of the LCT reflectance differences, as shown in Table 4, the proposed NBSI-MS can take advantage of the spectral bands registered by Landsat and Sentinel-2A satellite technologies.
Typically, in the visible and NIR wavelengths, snow is brighter than vegetation, water, impervious, bare land, HS-V, and HS-BL [18,49], as shown in Figure 5a,b. The NBSI-MS method takes advantage of these snow/ice spectral characteristics by adding the , , and bands, to increase the separability of pure snow/ice surface from other LCTs. The NBSI-MS expression is given by:
For the Landsat imagery, each band must be multiplied by its assigned reflectance value allocated in the MTL metadata file. Fixed empirical coefficients can be determined based on examining the reflectance properties of different LCTs as in [50]. k = 0.36 is a fixed empirical coefficient used to increase the intensity contrast between snow and other LCT pixels. k was determined using an iterative process to identify the parameter [0.34 ÷ 0.38] that maximizes the separability of snow and non-snow surfaces. We found that k = 0.36 enhances separability by forcing snow pixels above 0 and other LCTs pixels below 0 to stabilize non-binarization maps.
The subtracting term of the NBSI-MS expression is called LCTs mask. This allows for suppression of the six LCTs apart from snow/ice with high performance. The effective operation of the NBSI-MS method relies on the LCTs mask, which uses the , which is the second band with the lowest reflectance across the snow spectral signature. At the same time, this band is highly reflected by bare land, impervious vegetation, and HS-BL, as shown in Figure 5a,b. Furthermore, is added to to obtain a high reflectance in the LCTs except for the snow.
The green band B is introduced to counterbalance the contribution of the B and B values in the snow areas. Thus, the term tends to take values close to 1 for snow covers and higher than 1 for the background, respectively. Finally, the is added at the end of the mask by the same criteria as . In this way, the NBSI-MS method can effectively remove the background with negative values since the LCT mask is subtracted. The calculation of the NBSI-MS index according to Equation (1) is intended to produce the following results:
- Deep-water and impervious surfaces are separated from snow since these LCTs well reflect blue light. The possible LCT saturated pixels of yield negative values since they appear in the LCT mask with the subtracting term.
- Vegetation is removed because it exhibits two reflectance peaks, respectively in the green and in the NIR bands, which are lower than snow/ice reflectance.
- Water and HS-V are suppressed, considering their lowest reflectance in the NIR. Their signatures appear with reflectance lower than snow in all six bands.
- Impervious and bare-land are suppressed as both show roughly flat spectral signatures at the visible and NIR bands with lower reflectance compared to snow. Both components will provide negative values due to their higher reflectance at the SWIR bands.
In summary, the added factors in the first parentheses of the NBSI-MS expression Equation (1) tended to enhance the snow/ice cover mapping, while the LCT mask term tended to suppress the contributions from vegetation, water, impervious, bare land, HS-V, and HS-BL.
To evaluate the NBSI-MS maps about the snow or not snow pixel classification we apply the following rule:
where x,y is the position of the reference test pixels, p(x,y) are the NBSI-MS index values according to Equation (1), and and correspond, respectively, to snow and non-snow. For the sake of completeness, we note that the snow not-snow rule described above reduces the range of values and information carried by the several bands involved in the Equation (1). The precision should be intended as a relative assessment of the NBSI-MS index in comparison to the indexes. Further multispectral visualization of the NBSI-MS index can be envisioned and will be a matter of future work.
3. Results
To compare the capability of the SCIs to differentiate between snow and background (land, impervious, vegetation, water, HS-V, and HS-BL) in the France–Italy region, these were computed using the LCTs mean spectral values of Table 4. Figure 6a,b depicts the resulting plots from the computed SCIs via Landsat 8 OLI and Sentinel-2A MSI. The NBSI-MS values were normalized in the range to compare all the indexes on the same scale.
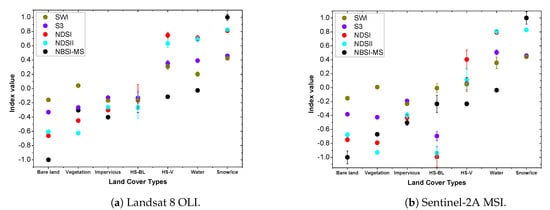
Figure 6.
Plots of the resulting index values (mean ± standard deviation) obtained by computing the mathematical expressions in Table 3 and Equation (1) by taking the values in Table 4 for the different Snow-Cover Indices (SCIs). The list of SCIs is given as the snow/ice index values increase. The NBSI-MS actual values were normalized to analyze the different SCIs under the same scale, while HS-BL is the Hilly Shadow over Bare Land, and HS-V is the Hilly Shadow over Vegetation.
The results reveal that the proposed NBSI-MS method can highlight the snow/ice surface with better performance over other SCIs since the background is suppressed with NBSI-MS values below zero. On the other hand, the NDSI, NDSII, S3, and SWI methods cannot identify the snow because their positive index values corresponding to water and HS-V are close to the snow ones. This result suggests the need to be masked or to find an optimal threshold value during snow cover delineation.
The normalized and not-normalized NBSI-MS SCI values shown in Table 5 were computed using the expressions in Table 3, Equation (1), and the mean spectral values of Table 4. The outcomes show that the proposed NBSI-MS method can highlight the snow/ice surface with a Maximum Positive Index Value (MPIV) of 8.10 for Landsat 8 OLI data. Large negative NBSI-MS values, ranging from −0.29 to −10.90, were found for the LCT components, thus, allowing us to easily remove the background.

Table 5.
Values of the indexes plotted in Figure 6a,b for the different Snow-Cover Indices. “The NBSI-MS values were normalized as shown in parenthesis in the range [−1, 1]” to compare the proposed method in the same range as NDSI, NDSII, S3, and SWI. Note: The snow index value is a single number that quantifies the snow cover computed by Equation (1) and the expressions in Table 3 taking the values in Table 4.
Likewise, when Sentinel-2A MSI data were used, the NBSI-MS method had an MPIV of 3.26, and the background was suppressed with negative NBSI-MS values, ranging from −0.34 to −9.32. As a result, the large contrast of the NBSI-MS values between snow/ice and background showed that there will be no doubt in separating them on an NBSI-MS image.
With the aim to compare the SCIs values between snow and water, the average index value of a square of 10 × 10 pixels was extracted from the resulting index maps and calculated for each of the two LCTs. The snow and water pixels were selected from large snow/water regions to guarantee the proper pixel designation in the Greenland region. The accurate location was verified by visually inspecting the area using the Landsat reference images shown in Figure 7 and the Google Earth platform. Table 6 displays the mean SCIs values corresponding to snow and water, and Figure 8 is the plot of the values of the Table 6.

Figure 7.
Visualization of the 10 × 10 pixel squares taken in the Greenland region recorded by Landsat 8 OLI: (a) sub-region of 10 × 10 water pixels (Yellow square), (b) reference color image used to visualize the amount of snow cover in blue color, and (c) sub-region of 10 × 10 snow pixels (Green square). These squares are used to compare the capability of the Snow-Cover Indices maps in separating snow from water.

Table 6.
The mean index values of one hundred pixels of water and snow taken from the Snow-Cover Indices maps for the Greenland region. Note: The NBSI-MS normalized values are in parentheses.
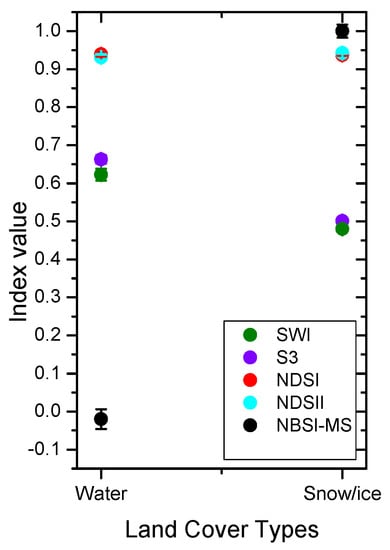
Figure 8.
The index values (mean ± standard deviation) of Table 6. The indices are ordered with increasing snow index values.
The results in Table 6 and Figure 8 show that the NDSI, S3, and SWI methods presented lower snow contrast compared to water, indicating the need for a water mask to remove it. In addition, the tied NDSII values between snow and water infer the need to identify an OTHV to improve the snow-cover map’s delineation. On the other hand, the large contrast of NBSI-MS values between snow and water reaffirmed the lack of uncertainty in removing water in an NBSI-MS image.
3.1. Snow Cover Extraction Maps
In this study, a qualitative comparison was made by visually inspecting the non-binary snow-cover extraction maps produced by the SCIs to identify their ability to delineate the snow-cover. Table 7 shows the description of the colored rectangles used to mark off the snow and non-snow spots presented in Figure 9 and Figure 10.

Table 7.
Description of the colored rectangles used to analyze the non-binary snow cover extraction maps produced by the Snow-Cover Indices. The color rectangles in the color composite images indicate the reference surface to inspect, and rejection means a surface that the index algorithm has removed.
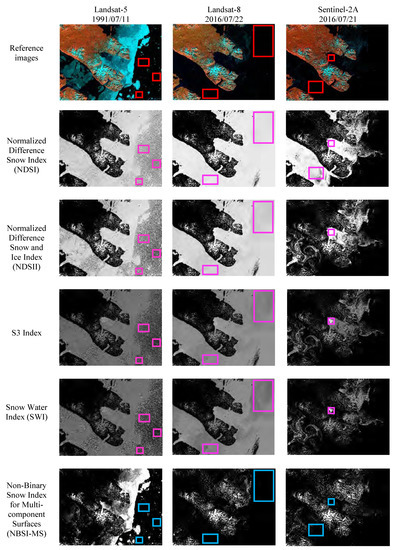
Figure 9.
Snow cover extraction maps produced by the Snow-Cover Indices without binarization in the Greenland region recorded by the Landsat and Sentinel-2A satellites on different dates. The reference images are used to visualize the amount of snow cover in blue color.
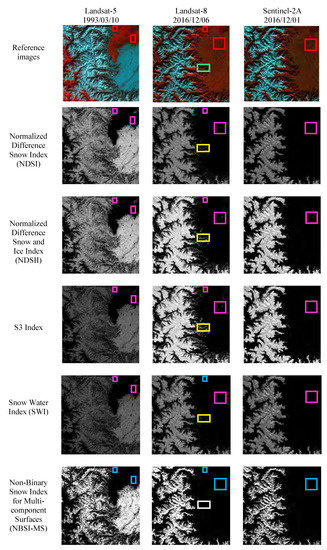
Figure 10.
Snow cover extraction maps produced by the Snow-Cover Indices without binarization in the France–Italy region recorded by the Landsat and Sentinel-2A satellites on different dates. The green rectangle in the resultant index maps of Landsat 8 highlights that NDSI, NDSII, S3, and SWI did not remove Hilly Shadow over Vegetation (yellow rectangles) as opposed to NBSI-MS (white rectangle). The reference color images are used to enhance the amount of snow cover in blue color.
Figure 9 shows the resultant snow cover extraction maps from the selected Greenland region produced by the SCIs. The NBSI-MS maps are visually compared against the NDSI, NDSII, S3, and SWI, taken as a reference to the false-color images. In the reference images, snow is blue, water is black, and land is brown, while in the resultant snow extraction map background should be black, and snow is white or gray. The visual inspection where Landsat 5 TM and Landsat 8 OLI data were used shows that the NBSI-MS can reject the water surface with high performance, while the NDSI, NDSII-1, S3, and SWI methods failed to reject this kind of surface.
Using Sentinel-2A MSI data, only the proposed NBSI-MS could reject the water surface correctly, where the other SCIs misclassified it. Similarly, in the France–Italy region shown in Figure 10, the proposed NBSI-MS method suppressed water surfaces with better precision than other SCIs in all three datasets. Furthermore, the NBSI-MS method discriminates hilly shadows in vegetation (HS-V) whereas the rest of the SCIs fail to suppress them. The NDSI, NDSII, S3, and SWI did not remove the shadows in vegetation (HS-V) in the France–Italy scene registered by Landsat 8. Green, yellow and white rectangles represents this feature in the reference and the other images of Landsat-8 in Figure 10.
The NBSI-MS method could accurately delineate the snow/ice cover on non-binary maps in the Greenland and France–Italy regions recorded by the Landsat 5 TM, Landsat 8 OLI, and Sentinel-2A MSI satellites.
According to [17], SWI has shown better results than the NDSI, NDSII, and S3 methods for removing water pixels. Therefore, a thorough comparison between SWI and the proposed NBSI-MS methods was considered in this visual analysis. Figure 11 shows the non-binary snow-cover maps in the France–Italy region produced by the SWI and the NBSI-MS methods. It can be seen that the NBSI-MS was capable of rejecting the water and HS-V surface with better performance compared with the SWI method.
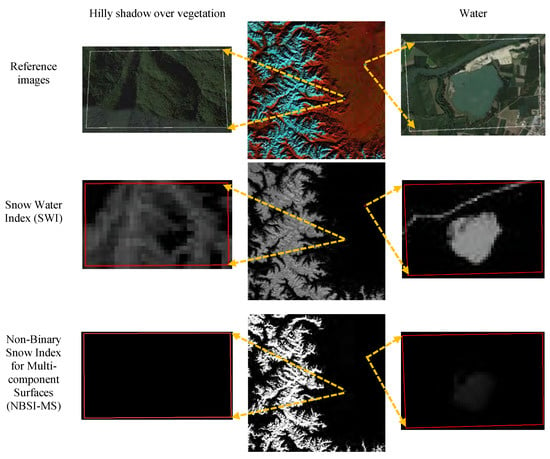
Figure 11.
Comparison of the performance for the NBSI-MS and SWI methods. The reference images of Hilly Shadow over Vegetation (HS-V) and water are high resolution taken with Google Earth , while the center reference image is the false color used to visualize snow in blue. On the left column, the extracted HS-V areas are shown. The middle images are the resulting snow maps representing from where the areas were taken. The right side panels represent the extracted water areas. It can be seen that the NBSI-MS was capable of rejecting the water and HS-V surface with better performance compared with the SWI method since the images show dark results, while the SWI presents gray pixels.
3.2. Precision Assessment
The SCIs must be evaluated based on the GRTPs reference data to quantitatively assess their efficiency in discriminating snow and non-snow pixels in the correct LCTs. In the virtue acquisition of the GRTPs reference data for evaluating the SCIs, over each scene, 150 GRTPs of snow and 150 GRTPs of non-snow were randomly generated. The 150 non-snow GRTPs were divided into six land cover types (Bare land, HS-BL, Impervious, Vegetation, HS-V, and water) in the France–Italy region. While in Greenland, they were divided into Bare land, vegetation, and HS-V as it only had three LCTs.
The confusing random pixels on the edges were eliminated for the different LCTs by obtaining an equal amount of snow and non-snow pixels. To differentiate confusing snow and non-snow pixels, a high-resolution Google Earth was used. The results are shown in Table 8. GRTPs using Landsat 5 TM data were generated separately from Landsat 8 OLI and Sentinel-2A MSI data to achieve the difference in snow-cover between scenes.

Table 8.
Numbers of designated snow and non-snow Ground Reference Test Pixels (GRTPs) over the Greenland and France–Italy regions.
The identification of mounting shadows in hilly areas was made by comparing the Landsat and Sentinel-2A data with the Digital Elevation Model (DEM) data, downloaded from the web portal https://search.earthdata.nasa.gov/search (accessed on 28 June 2021) [51]. Figure 12a,b depict the DEM in meters (m) of the Greenland and France–Italy regions with snow and non-snow validation points.
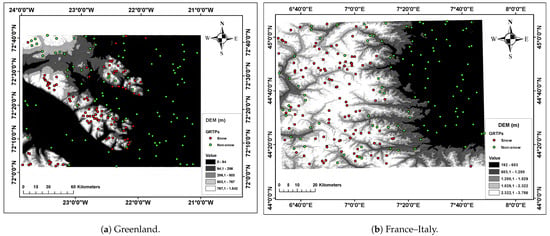
Figure 12.
Distribution of the Ground Reference Test Pixels (GRTPs) over the Digital Elevation Model (DEM) images registered by the Advanced Spaceborne Thermal Emission and Reflection Radiometer (ASTER) of (a) the France–Italy and (b) the Greenland area. The DEM was used to verify the elevation ranges of the areas. The size of the GRTPs were magnified to visualize the distribution. Moreover, the three red dots on the black area of (a) are snow over islands and can be visualized in the reference images of Figure 9.
For setting the OTHV, a range of separability between snow and non-snow index values must exist. Nevertheless, as shown in Table 6, the resulting mean of the water index values are larger than snow index ones for S3 and SWI, while those for NDSI and NDSII are in the same range. Therefore, this study found that thresholding NDSI, S3, and SWI images for the Greenland region will remove most snow pixels. For this reason, all indices were evaluated using Equation (2) to classify snow and non-snow pixels.
The precision assessment of the SCIs was performed by comparing the snow/non-snow index extraction maps with the GRTPs. The purpose was to compute the number of true positive (TP), false negative (FN), false positive (FP), and true negative (TN) pixels. In addition, these four-category pixel classifications were used to calculate the producer’s accuracy (PA), user’s accuracy (UA), overall accuracy (OA), and kappa coefficient [52,53], defined as:
where P is the total number of the reference test pixels shown in Table 8, and is the chance accuracy and is calculated as:
The PA, UA, and OA represent the accurate predictions ranging from 0 to 1, where 1 represents perfect accuracy. Nevertheless, these accurate predictions do not consider the agreements between datasets due to chance alone. The kappa coefficient typically ranges from −1 to 1, where 0 represents the agreement required from random chance, and 1 represents the absolute agreement between the raters [52,53]. The precision assessment results of the SCIs are shown in Table 9. The proposed NBSI-MS method has the highest OA and Kappa in a range of [0.99, 1]. Likewise, the quantitative evaluation confirms that the NBSI-MS method has high robustness for extracting the snow/ice cover in data recorded by the Landsat 5 TM, Landsat 8 OLI, and Sentinel-2A MSI satellites.

Table 9.
Precision assessment based on Ground Reference Test Pixel validation for different Snow-Cover Indices.
4. Discussion
In this study, the NBSI-MS method was proposed, and its performance for snow/ice cover mapping was compared with the well-known NDSI, NDSII, S3, and SWI methods. The analysis of the SCIs values in Table 5 showed that the NBSI-MS achieved considerable separability between the snow and background, whereas the NDSI, NDSII, S3, and SWI delivered close index values between water, HS-V, and snow. To analyze the separation of the index values between snow and other LCTs, the following equation was computed by using the SCI values of Table 5,
where S is equal to the separation value between snow and the different LCTs, SIV is the snow index value, and LCTIV is the index value corresponding to each land cover type.
Table 10 shows that the NBSI-MS separation value between snow and bare land was , while for the snow and water was using Landsat 8 OLI data. In the Sentinel-2A data, the NBSI-MS separation value between snow and bare land was 12.58, and for snow and water was 3.60. On the other hand, the NDSI, NDSII, S3, and SWI separation values corresponding to snow, HS-V, and water were close in both cases where Landsat 8 OLI and Sentinel-2A data were used.

Table 10.
The Snow-Cover Indices (SCIs) Separation values between snow and Land Cover Types (LCTs) in the France–Italy region using the Landsat 8 OLI and Sentinel-2A MSI datasets.
According to the visual inspection of Figure 9 and Figure 10, the worst performance of the NDSI, NDSII, S3, and SWI methods was exhibited by the Greenland region in the presence of a large water surface using Landsat 8 OLI data. In addition, the index value separation between snow and water revealed that NDSI, S3, and SWI enhanced water rather than snow, exhibiting negative values (Table 11). This finding implies that these indices still require a water mask to improve their snow-cover delineation. In contrast, the NBSI-MS separation value between snow and water was 8.29, indicating a net discriminative power.

Table 11.
The Snow-Cover Indices separation values between snow and water in the Greenland region. Note: The values were computed using Equation (8).
This work addresses the important issue for the remote sensing community of developing increasingly accurate methods to identify local areas from remotely sensed images. This can be possible by collecting higher-resolution images with newer satellite technologies in smaller areas. Therefore, while we have indexes (like the traditional NDSI) with the ability to analyze large (500-m) areas, the proposed non-binary multispectral indexes should be used to provide complementary information scaling down the investigated area sizes. Further developments of this work were devised to create a hierarchical structure of interrelated nested indexes within areas at different scales.
Several studies have addressed the issue of integrating high resolution pixel data from different bands in low resolution pixel data. For example, the NDSI snow index extracted from Landsat 30-m was scaled up and compared to the MODIS 500-m pixel based on a linear regression approach in [54,55]. Fully grasping and exploiting sub-pixel information content while tackling the computational complexities of dealing with a huge amount of data on a bidaily, automated, global basis still poses a challenge.
However, more realistic applications of the multiple-resolution approach with the integration of fractional and binary snow-cover data could be devised, as: (1) analyzing snow-cover metamorphisms to complement local-field measurements of the mechanical properties of snow to increase the ability of triggering real-time alerts in the case of adverse meteorological event conditions [27]; (2) providing sub-pixel information for calibrating or verifying hydrological models at small and intermediate scales [56].
The widely used binary (i.e., snow or non-snow) index data use the assumption that, above the threshold, the pixel is covered by snow. However the spatially fixed threshold might not be optimal for local applications with variations in landscape and satellite viewing conditions [29]. Further developments of this research have been devised to implement multiple resolution estimates in terms of a pixel-by-pixel scale-dependent approach (as in [28]) rather than the simple linear regression.
5. Conclusions
The main objective of this research was to develop the NBSI-MS method and compare its capability for mapping snow/ice cover against the NDSI, NDSII, S3, and SWI methods in the presence of vegetation, water, impervious, bare land, HS-V, HS-BL, and snow/ice. The analysis of all indices was done in the same image conditions according to the pre-processing steps in non-binarized results using Landsat 5, Landsat 8, and Sentinel-2A scenes. Image thresholding or the application of masking techniques were not implemented in this analysis since the proposed NBSI-MS method did not need any additional techniques to delineate snow/ice with high accuracy in different environmental conditions.
The NBSI-MS method showed a strong potential for snow cover mapping. The qualitative and quantitative results of this research demonstrated that the NBSI-MS method has a higher accuracy over the NDSI, NDSII, S3, and SWI methods. Furthermore, the NBSI-MS values confirmed that a non-normalized index increased the contrast between the snow and background, providing high-quality delineation of snow/ice cover on non-binary maps using Landsat and Sentinel-2A data. The most outstanding results of the comparison among the SCIs are:
- Figure 6a,b and Table 5 reveal that the proposed NBSI-MS method discriminated the background as bare land, impervious, vegetation, water, HS-V, and HS-BL with index values below zero. In contrast, the snow/ice is highlighted with positive NBSI-MS values. On the other hand, NDSI, NDSII, S3, and SWI delivered positive index values on water, and HS-V was close to their snow index values.
- Table 6 shows negative NBSI-MS values for water, while snow had positive NBSI-MS values, which confirmed a large contrast between them. Conversely, NDSI, S3, and SWI highlighted water over snow, and the close NDSII values between water and snow indicate the need for a water mask to enhance snow-cover maps in the Greenland region.
- Visual inspection presented in Figure 9 and Figure 10 show that NBSI-MS could reject the water and HS-V surfaces correctly, while NDSI, NDSII, S3, and SWI failed to suppress them. NDSI, NDSII, S3, and SWI performed better in the France–Italy region; however, they exhibit poor performance in the Greenland region in the presence of a large water surface.
- Precision assessment results of Table 9 show that the SCIs reached a high PA, which means high precision for extracting the snow-pixels. However, in the Greenland region using Landsat data, the NDSI, NDSII, S3, and SWI methods showed a low UA, which means the misclassification of non-snow pixels. Whereas, the proposed NBSI-MS method had the highest OA and Kappa in the range of [0.99, 1] in the Greenland and France–Italy regions, demonstrating higher precision over the NDSI, NDSII, S3, and SWI methods.
- As shown in Figure 4, pre-processing steps must be taken into account to obtain high-quality NBSI-MS maps since the algorithm demonstrated greater sensitivity to atmospheric conditions than the compared indices.
In summary, the very good agreement between the qualitative and quantitative results confirmed the performance superiority of the proposed NBSI-MS method for removing water and shadow pixels over the NDSI, NDSII, S3, and SWI methods. The NBSI-MS values confirmed the high selectivity of the index and its ability to discriminate between snow and background, providing high-quality delineation of snow/ice cover on non-binary maps of Landsat and Sentinel-2A data.
Author Contributions
Investigation, M.A.-E., M.D.-H., C.T.-Q., A.P.-V., G.O.-M. and A.C.; Conceptualization, M.A.-E., M.D.-H., C.T.-Q., A.P.-V., G.O.-M. and A.C.; Methodology, M.A.-E., and M.D.-H.; Software, M.A.-E., M.D.-H., C.T.-Q., A.P.-V., G.O.-M. and A.C.; Validation, M.A.-E.; Formal analysis, M.A.-E. and M.D.-H.; Funding acquisition, A.C.; Project coordination, A.C. and C.T.-Q.; Writing—original draft, M.A.-E., M.D.-H., C.T.-Q., A.P.-V., A.C. and G.O.-M. All authors have read and agreed to the published version of the manuscript.
Funding
This work was supported by the Consejo Nacional de Ciencia y Tecnología (CONACyT) (scholarships 858585 and 858588), the European Commission (Grant JTC-2016-004 FlagERA—FuturICT2.0) and the Politecnico di Torino (Fondi di Ateneo—Supporto Ricerca di Base).
Acknowledgments
M.A.-E. and M.D.-H. with 858585 and 858588 CVUs are thankful to Consejo Nacional de Ciencia y Tecnología (CONACyT) for the scholarship awarded. Also, M.A.-E. and M.D.-H. acknowledge financial support during their research stay at the Politecnico di Torino in October–November 2018 and May–June 2019 (Grant JTC-2016-004 Flagera FuturICT2.0).
Conflicts of Interest
The authors declare no conflict of interest.
References
- Rees, W.G. Remote Sensing of Snow and Ice; CRC Press: Boca Raton, FL, USA, 2005; pp. 1–5. [Google Scholar]
- Belart, J.M.; Magnusson, E.; Berthier, E.; Pálsson, F.; Aðalgeirsdóttir, G.; Jóhannesson, T. The geodetic mass balance of Eyjafjallajökull ice cap for 1945–2014: Processing guidelines and relation to climate. J. Glaciol. 2019, 65, 395–409. [Google Scholar] [CrossRef] [Green Version]
- Thirel, G.; Salamon, P.; Burek, P.; Kalas, M. Assimilation of MODIS snow cover area data in a distributed hydrological model using the particle filter. Remote Sens. 2013, 5, 5825–5850. [Google Scholar] [CrossRef] [Green Version]
- Yan, D.; Huang, C.; Ma, N.; Zhang, Y. Improved Landsat-Based Water and Snow Indices for Extracting Lake and Snow Cover/Glacier in the Tibetan Plateau. Water 2020, 12, 1339. [Google Scholar] [CrossRef]
- Liu, C.; Huang, X.; Li, X.; Liang, T. MODIS Fractional Snow Cover Mapping Using Machine Learning Technology in a Mountainous Area. Remote Sens. 2020, 12, 962. [Google Scholar] [CrossRef] [Green Version]
- Ali, S.; Cheema, M.J.M.; Waqas, M.M.; Waseem, M.; Awan, U.K.; Khaliq, T. Changes in Snow Cover Dynamics over the Indus Basin: Evidences from 2008 to 2018 MODIS NDSI Trends Analysis. Remote Sens. 2020, 12, 2782. [Google Scholar] [CrossRef]
- Ramsay, B.H. The interactive multisensor snow and ice mapping system. Hydrol. Process. 1998, 12, 1537–1546. [Google Scholar] [CrossRef]
- Li, J.; Roy, D.P. A global analysis of Sentinel-2A, Sentinel-2B and Landsat-8 data revisit intervals and implications for terrestrial monitoring. Remote Sens. 2017, 9, 902. [Google Scholar]
- Gascoin, S.; Grizonnet, M.; Bouchet, M.; Salgues, G.; Hagolle, O. Theia Snow collection: High-resolution operational snow cover maps from Sentinel-2 and Landsat-8 data. Earth Syst. Sci. Data 2019, 11, 493–514. [Google Scholar] [CrossRef] [Green Version]
- Li, J.; Chen, B. Global Revisit Interval Analysis of Landsat-8-9 and Sentinel-2A-2B Data for Terrestrial Monitoring. Sensors 2020, 20, 6631. [Google Scholar] [CrossRef]
- Kour, R.; Patel, N.; Krishna, A.P. Assessment of relationship between snow cover characteristics (SGI and SCI) and snow cover indices (NDSI and S3). Earth Sci. Inform. 2015, 8, 317–326. [Google Scholar] [CrossRef]
- Delgadillo, M.; Arreola, M.M.; Toxqui, C.; Padilla, A. Normalized difference indices in Landsat 5 TM satellite data. In Proceedings of the Current Developments in Lens Design and Optical Engineering XX, San Diego, CA, USA, 12 August 2019; Johnson, R.B., Mahajan, V.N., Thibault, S., Eds.; SPIE: Bellingham, DC, USA, 2019; Volume 11104. [Google Scholar]
- Wang, X.; Gao, X.; Zhang, X.; Wang, W.; Yang, F. An Automated Method for Surface Ice/Snow Mapping Based on Objects and Pixels from Landsat Imagery in a Mountainous Region. Remote Sens. 2020, 12, 485. [Google Scholar] [CrossRef] [Green Version]
- Hall, D.K.; Riggs, G.A.; Salomonson, V.V. Development of methods for mapping global snow cover using moderate resolution imaging spectroradiometer data. Remote Sens. Environ. 1995, 54, 127–140. [Google Scholar] [CrossRef]
- Saito, A.; Yamazaki, T. Characteristics of spectral reflectance for vegetation ground surfaces with snow-cover; Vegetation indices and snow indices. J. Jpn. Soc. Hydrol. Water Resour. 1999, 12, 28–38. [Google Scholar] [CrossRef] [Green Version]
- Xiao, X.; Shen, Z.; Qin, X. Assessing the potential of VEGETATION sensor data for mapping snow and ice cover: A Normalized Difference Snow and Ice Index. Int. J. Remote Sens. 2001, 22, 2479–2487. [Google Scholar] [CrossRef]
- Dixit, A.; Goswami, A.; Jain, S. Development and Evaluation of a New “Snow Water Index (SWI)” for Accurate Snow Cover Delineation. Remote Sens. 2019, 11, 2774. [Google Scholar] [CrossRef] [Green Version]
- Shimamura, Y.; Izumi, T.; Matsuyama, H. Evaluation of a useful method to identify snow-covered areas under vegetation–comparisons among a newly proposed snow index, normalized difference snow index, and visible reflectance. Int. J. Remote Sens. 2006, 27, 4867–4884. [Google Scholar] [CrossRef]
- Gupta, R.P.; Haritashya, U.K.; Singh, P. Mapping dry/wet snow cover in the Indian Himalayas using IRS multispectral imagery. Remote Sens. Environ. 2005, 97, 458–469. [Google Scholar] [CrossRef]
- Negi, H.S.; Kulkarni, A.V.; Semwal, B.S. Study of contaminated and mixed objects snow reflectance in Indian Himalaya using spectroradiometer. Int. J. Remote Sens. 2009, 30, 315–325. [Google Scholar] [CrossRef]
- Keshri, A.K.; Shukla, A.; Gupta, R.P. ASTER ratio indices for supraglacial terrain mapping. Int. J. Remote Sens. 2009, 30, 519–524. [Google Scholar] [CrossRef]
- Wang, X.Y.; Wang, J.; Jiang, Z.Y.; Li, H.Y.; Hao, X.H. An effective method for snow-cover mapping of dense coniferous forests in the Upper Heihe River Basin using Landsat Operational Land Imager data. Remote Sens. 2015, 7, 17246–17257. [Google Scholar] [CrossRef] [Green Version]
- Kulkarni, A.V.; Srinivasulu, J.; Manjul, S.S.; Mathur, P. Field based spectral reflectance studies to develop NDSI method for snow cover monitoring. J. Indian Soc. Remote Sens. 2002, 30, 73–80. [Google Scholar] [CrossRef]
- Sibze, P.; Mhangara, P.; Odindi, J.; Kganyago, M. A comparison of Normalised Difference Snow Index (NDSI) and Normalised Difference Principal Component Snow Index (NDPCSI) techniques in distinguishing snow from related land cover types. S. Afr. J. Geomat. 2014, 3, 197–209. [Google Scholar]
- Yin, D.; Cao, X.; Chen, X.; Shao, Y.; Chen, J. Comparison of automatic thresholding methods for snow-cover mapping using Landsat TM imagery. Int. J. Remote Sens. 2013, 34, 6529–6538. [Google Scholar] [CrossRef]
- Arreola, M.M.; Delgadillo, M.; Toxqui, C.; Padilla, A. Index-based methods for water body extraction in satellite data. In Proceedings of the Applications of Digital Image Processing XLII, San Diego, CA, USA, 12–15 August 2019; Tescher, A.G., Ebrahimi, T., Eds.; SPIE: Bellingham, DC, USA, 2019; Volume 11137. [Google Scholar]
- Carbone, A.; Chiaia, B.M.; Frigo, B.; Türk, C. Snow metamorphism: A fractal approach. Phys. Rev. E 2010, 82, 036103. [Google Scholar] [CrossRef] [Green Version]
- Valdiviezo-N, J.C.; Castro, R.; Cristóbal, G.; Carbone, A. Hurst exponent for fractal characterization of LANDSAT images. In Proceedings of the Remote Sensing and Modeling of Ecosystems for Sustainability XI, San Diego, CA, USA, 18–20 August 2014. [Google Scholar]
- Härer, S.; Bernhardt, M.; Siebers, M.; Schulz, K. On the need for a time-and location-dependent estimation of the NDSI threshold value for reducing existing uncertainties in snow cover maps at different scales. Cryosphere 2018, 12, 1629–1642. [Google Scholar] [CrossRef]
- Maher, A.I.; Treitz, P.M.; Ferguson, M.A. Can Landsat data detect variations in snow cover within habitats of arctic ungulates? Wildlife Biol. 2012, 18, 75–87. [Google Scholar] [CrossRef] [Green Version]
- Landsat-5, Landsat-8, and Sentinel-2A. Available online: http://earthexplorer.usgs.gov (accessed on 10 January 2020).
- Landsat-5. Available online: https://www.usgs.gov/core-science-systems/nli/landsat/legacy-landsat-5 (accessed on 6 December 2020).
- Mandanici, E.; Bitelli, G. Preliminary comparison of sentinel-2 and landsat 8 imagery for a combined use. Remote Sens. 2016, 8, 1014. [Google Scholar] [CrossRef] [Green Version]
- Hou, Y.; Dong, J.; Xiao, X.; Xiao, T.; Yang, Z.; Zhao, G.; Zou, Z.; Qin, Y. Open surface water mapping algorithms: A comparison of water-related spectral indices and sensors. Water 2017, 9, 256. [Google Scholar]
- Landsat Missions. Available online: https://www.usgs.gov/core-science-systems/nli/landsat/landsat-9 (accessed on 5 December 2020).
- MultiSpectral Instrument (MSI) Overview. Available online: https://sentinel.esa.int/web/sentinel/technical-guides/sentinel-2-msi/msi-instrument (accessed on 5 December 2020).
- Urcid, G.; Padilla, A. Far-field diffraction patterns of circular sectors and related apertures. Appl. Opt. 2005, 44, 7677–7696. [Google Scholar] [CrossRef]
- Olvera-Angeles, M.; González-Amador, E.; Arines, J.; Sasian, J.; Schwiegerling, J.; Acosta, E. Jacobi–Fourier phase masks to increase performance of wavefront-coded optical systems for random or varying aberration alleviation. Jpn. J. Appl. Phys. 2020, 59, SOOD07. [Google Scholar] [CrossRef]
- González-Amador, E.; Padilla-Vivanco, A.; Toxqui-Quitl, C.; Arines, J.; Acosta, E. Jacobi–Fourier phase mask for wavefront coding. Opt. Lasers Eng. 2020, 126, 105880. [Google Scholar] [CrossRef]
- Chander, G.; Markham, B.L.; Helder, D.L. Summary of current radiometric calibration coefficients for Landsat MSS, TM, ETM+, and EO-1 ALI sensors. Remote Sens. Environ. 2009, 113, 893–903. [Google Scholar] [CrossRef]
- Young, N.E.; Anderson, R.S.; Chignell, S.M.; Vorster, A.G.; Lawrence, R.; Evangelista, P.H. A survival guide to Landsat preprocessing. Ecology 2017, 98, 920–932. [Google Scholar] [CrossRef] [PubMed] [Green Version]
- Merzah, Z.F.; Jaber, H.S. Assessment of Atmospheric Correction Methods for Hyperspectral Remote Sensing Imagery Using Geospatial Techniques. In Proceedings of the IOP Conference Series: Materials Science and Engineering, 2020; IOP Publishing: Baghdad, Iraq, 2020; Volume 745, p. 012123. [Google Scholar]
- Kruse, F.A. Use of airborne imaging spectrometer data to map minerals associated with hydrothermally altered rocks in the northern grapevine mountains, Nevada, and California. Remote Sens. Environ. 1988, 24, 31–51. [Google Scholar] [CrossRef]
- Ben-Dor, E.; Kruse, F.A. The relationship between the size of spatial subsets of GER 63 channel scanner data and the quality of the Internal Average Relative Reflectance (IARR) atmospheric correction technique. Int. J. Remote Sens. 1994, 15, 683–690. [Google Scholar] [CrossRef]
- Pu, R. Hyperspectral Remote Sensing: Fundamentals and Practices; CRC Press: Boca Raton, FL, USA, 2017; pp. 119–123. [Google Scholar]
- Stevens, S.S. Measurement, statistics, and the schemapiric view. Sci. New Ser. 1946, 103, 677–680. [Google Scholar] [CrossRef]
- Ma, T.; Ma, J.; Yu, K. A Local Feature Descriptor Based on Oriented Structure Maps with Guided Filtering for Multispectral Remote Sensing Image Matching. Remote Sens. 2019, 11, 951. [Google Scholar] [CrossRef] [Green Version]
- Gong, P.; Wang, J.; Yu, L.; Zhao, Y.; Zhao, Y.; Liang, L.; Li, C. Finer resolution observation and monitoring of global land cover: First mapping results with Landsat TM and ETM+ data. Int. J. Remote Sens. 2013, 34, 2607–2654. [Google Scholar] [CrossRef] [Green Version]
- Ji, L.; Gong, P.; Geng, X.; Zhao, Y. Improving the accuracy of the water surface cover type in the 30 m FROM-GLC product. Remote Sens. 2015, 7, 13507–13527. [Google Scholar] [CrossRef] [Green Version]
- Feyisa, G.L.; Meilby, H.; Fensholt, R.; Proud, S.R. Automated Water Extraction Index: A new technique for surface water mapping using Landsat imagery. Remote Sens. Environ. 2014, 140, 23–35. [Google Scholar] [CrossRef]
- Earthdata. Available online: https://search.earthdata.nasa.gov/search (accessed on 5 November 2020).
- Acharya, T.D.; Subedi, A.; Lee, D.H. Evaluation of water indices for surface water extraction in a Landsat 8 scene of Nepal. Sensors 2018, 18, 2580. [Google Scholar] [CrossRef] [PubMed] [Green Version]
- McHugh, M.L. Interrater reliability: The kappa statistic. Biochem. Med. 2012, 22, 276–282. [Google Scholar] [CrossRef]
- Salomonson, V.V.; Appel, I. Estimating fractional snow cover from MODIS using the normalized difference snow index. Remote. Sens. Environ. 2004, 89, 351–360. [Google Scholar] [CrossRef]
- Wang, G.; Jiang, L.; Shi, J.; Su, X. A Universal Ratio Snow Index for Fractional Snow Cover Estimation. IEEE Geosci. Remote. Sens. Lett. 2020, 18, 721–725. [Google Scholar] [CrossRef]
- Zhang, H.; Zhang, F.; Zhang, G.; Yan, W.; Li, S. Enhanced scaling effects significantly lower the ability of MODIS normalized difference snow index to estimate fractional and binary snow cover on the Tibetan Plateau. J. Hydrol. 2021, 592, 125795. [Google Scholar] [CrossRef]
Publisher’s Note: MDPI stays neutral with regard to jurisdictional claims in published maps and institutional affiliations. |
© 2021 by the authors. Licensee MDPI, Basel, Switzerland. This article is an open access article distributed under the terms and conditions of the Creative Commons Attribution (CC BY) license (https://creativecommons.org/licenses/by/4.0/).