Abstract
We bring a practical and comprehensive GIS-based framework to utilize freely available remotely sensed datasets to assess wildfire ignition probability and spreading capacities of vegetated landscapes. The study area consists of the country-level scale of the Romanian territory, characterized by a diversity of vegetated landscapes threatened by climate change. We utilize the Wildfire Ignition Probability/Wildfire Spreading Capacity Index (WIPI/WSCI). WIPI/WSCI models rely on a multi-criteria data mining procedure assessing the study area’s social, environmental, geophysical, and fuel properties based on open access remotely sensed data. We utilized the Receiver Operating Characteristic (ROC) analysis to weigh each indexing criterion’s impact factor and assess the model’s overall sensitivity. Introducing ROC analysis at an earlier stage of the workflow elevated the final Area Under the Curve (AUC) of WIPI from 0.705 to 0.778 and WSCI from 0.586 to 0.802. The modeling results enable discussion on the vulnerability of protected areas and the exposure of man-made structures to wildfire risk. Our study shows that within the wildland–urban interface of Bucharest’s metropolitan area, there is a remarkable building stock of healthcare, residential and educational functions, which are significantly exposed and vulnerable to wildfire spreading risk.
1. Introduction
Climate change and global warming are expected to affect natural hazards like flooding and wildfires worldwide. These may have multiplied domino effect consequences on other natural and urban systems, leading to severe disasters at local scales [1,2,3]. While the emergence of flooding events relies mainly on the weather conditions and the natural/artificial properties of the catchment area, wildfires implicate human behavioral activities. The multifaceted character of the wildfire phenomena is acknowledged in the literature. Chapin et al. [4] defined wildfire as a wicked problem. According to Levin et al. [5], wildfires are multi-layered phenomena that implicate diverse interacting cycles between causes and effects acting in certain territories. Identifying the relevant factors that significantly correlate with the wildfire regimes remains a critical challenge to scientists [6,7,8].
In the classical wildfire assessment approach, the interaction of favorable hydrometeorological conditions with the study area’s geophysical and vegetation properties is considered the core prerequisite of the fire environment triangle, which consists of three pillars: weather, topography, and fuel [9]. Lightning strikes are the primary natural igniters [10]. However, most wildfires are reported to be caused by human activity, either intentionally or accidentally [11]. Human activity patterns have become a determinant during the wildfire ignition phase [12,13].
Mansuy et al. [14] contrast the anthropogenic factors to the macro-environmental ones and report that the human footprint affects almost equal wildfire risk inside and outside the North-American protected landscapes. The consequences of human activities on fire regimes are reported to overshadow the effects of climate change significantly [15]. The effect of societal habits like the Daylight-Saving Time (DST) alterations have been acknowledged to increase wildfire ignitions. For example, Kountouris [16] reports that DST transition during the Spring season has increased the number of non-prescribed wildfire ignitions by about 30% in the US, relying on around 2 million wildfire ignition of 23 years records.
A more recent study presents also the impact of COVID-19 lockdown on the wildfire regimes in a wildfire-prone region like the Mediterranean [3,17]. The authors report a significant decrease in the total burned area during this period compared to the estimations that counted for similar drought-related circumstances to previous years. The decrease in social activities has resulted in a significant reduction of wildfire events. Thus, the integration of anthropogenic factors within the wildfire risk assessment tools has become indispensable to increase the models’ sensitivity [18].
The impact of anthropogenic factors on wildfire regimes has gained considerable attention in the literature. However, their combined usage alongside with hydrometeorological and biophysical factors in wildfire spreading capacity models, is rarely present in the available published research. Unlike our previous studies [19,20], we introduced population density as a new criterion within the wildfire ignition probability/wildfire spreading capacity index (WIPI/WSCI) model, considering that the current literature tightly correlates to the population density and the wildfire ignition risk and frequency [21,22].
This study aims to develop a comprehensive and practical GIS-based model for assessing the wildfire ignition and spread capacities based on freely available and remotely sensed geospatial data. The proposed model is aimed to be reproducible to other vegetated surfaces where the remotely sensed data are available. Another goal is to test the utility of the Receiver Operating Characteristic/Area Under Curve (ROC/AUC) method in weighting each criterion’s impact factor by comparing with the Analytic Hierarchy Process (AHP), which is widely used in previous studies. Here we aim to deliver tangible graphical (maps) and statistical results about the wildfire ignition and spread capacities in Romania, supporting disaster risk reduction agendas nationwide.
2. Materials and Methods
2.1. Study Area
The study area is represented by Romania’s territory, a country located in the central-eastern part of Europe with an area of 238,391 km2 (Figure 1). Romania has a vast diversity of landforms, each with representative forestry variation, including the Transylvanian Depression located in the center of the Carpathian Mountains arc. This territory offers proper conditions for the extension of various types of deciduous forests (i.e., with species such as Carpinus betulus, Fagus sylvatica, Tillia tomentosa, Ulmus minor, Quercus petraea) over large areas. The Romanian Carpathian Mountains (Carpathians) occupy 57% of the country’s territory, where extensive forests are spread over large areas.
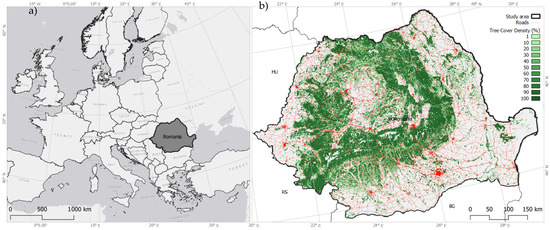
Figure 1.
Romania within Europe (a), and Romanian territory including Tree Cover Density (TCD) and transportation network distribution (b).
According to Romanian legislation, a forest is considered an area of at least 0.25 hectares of land occupied by forest vegetation. The mature specimens reach 5 m in height under normal vegetation conditions and have a coverage index (consistency) of more than 10% (0.1). These territories are added to the areas covered with junipers (Juniperus) in the high mountain area of over 1800–2000 m in altitude and forest protection curtains with more than 0.5 hectares and a width of more than 20 m. Forest protection curtains are accepted crucial interventions in forest protection policy. They are projected to have a significant protective effect on Romanian forest cover on the brink of climate change [23].
At the territorial level of Romania, 29.9% of the surface is covered by different forests, covering 7.13 million hectares [24]. Romania is one of the countries with the highest percentage of occupied forest areas, with the latest estimates having a significant growth rate (i.e., 19.3 million m3/year for conifers, 19 million m3/year for beech, 8.1 m3/year for quercinea, 8.6 million m3/year for hardwoods, and 3.4 million m3/year for softwoods), to which are added old forests and virgin forests in different stages of conservation. Large forest areas are predominantly in the mountainous and hilly areas and areas with lower altitudes. There is a higher density of human settlements, a crucial aspect considering the present study’s objectives. We have included further details about Romania’s forest structure in Table A1 (see Appendix A).
Changes over time in the areas covered by forest are under the direct impact of natural factors such as the influence of climate change on the consistency and composition of forests, the migration of forest species beyond known ecological limits, the negative influence of floods with short return periods, the degradation of physical and chemical properties of soils due to soil erosion, and vegetation fires with natural causes. Anthropic changes are also present due to deforestation caused by logging, legal and illegal, whose rate increased after 2000 [25,26] and contamination of soils and groundwater supplies [27]. However, some territories showed a forest gain due to the afforestation of large areas of abandoned pastures [26]. Furthermore, the spatio-temporal evolution of forest cover in Romania is tightly correlated with the forest management regimes affected by socio-political fluctuations from the early 19th century [28].
2.2. WIPI/WSCI Model and the Current Updates
This study methodologically relies on the Wildfire Ignition Probability/Wildfire Spreading Capacity Index (WIPI/WSCI). Initially, the method defines criteria that have proven relation with either the wildfire occurrence or behavior. The number of criteria varies according to the available data and the specifics of the study area. In this study, we shortlisted 16 criteria about the anthropogenic (S-social), hydrometeorological (E-environmental), geophysical (P-physical), and fuel (F) properties of the study area (Romania) following our earlier GIS-based method [19]. Through a literature review and evaluating the available open access geospatial data, we considered the following criteria: population density (S1), distance to settlements (S2), distance to transportation network (S3), distance to main roads (S4), agriculture distance (S5), solar radiation (E1), precipitation (E2), maximum temperature (E3), wind speed (E4), slope (P1), aspect (P2), altitude (P3), distance to water sources (P4), fuel type (F1), Tree Cover Density (TCD) (F2), and Normalized Difference Vegetation Index (NDVI) (F3).
The method starts by defining a regular grid of points. According to the inventory phase results, there are 70,410 reference point locations within Romania’s vegetated surfaces. The distance between points is 1 km, and each point represents a vegetated surface of 1 km2. Each reference point location within the vegetated surface is loaded with unique absolute values through a multi-criteria inventory procedure [19]. Each criterion’s relative weighted factor was initially assigned via AHP pairwise comparison method. The sensitivity of the model has been assessed via ROC/AUC method in another study focusing on the case of Montenegro [29].
Figure 2 presents the methodical workflow of this study. It includes the updates that we push forward as improvements of WIPI/WSCI, applied in Romania’s case. At this stage, the workflow consists of seven sequential stages. Besides the inventory procedure, the first stage includes defining the vegetated surfaces within the study area and the reference points that spatially represent the vegetation surfaces. The reference points serve as data collecting pivots loaded with all 16 criteria’ unique values, as shown in Figure 2. Among a regular points grid with a spatial distance of 1 km, we selected by location the points that overlapped with the vegetated surfaces derived from CORINE Land Cover (CLC) data.
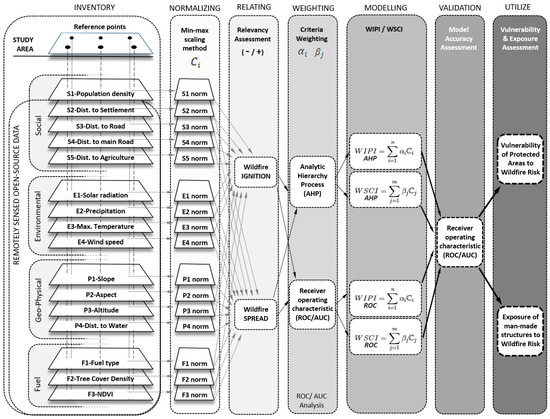
Figure 2.
Workflow showing the seven stages of the method.
Following the inventory phase, the unequal range of inventory values necessitates a normalizing procedure before indexing calculations. This stage equalizes the range of inventory values of each criterion into a gradient between 0 and 1. The max/min normalizing procedure is selected as it is accepted as the most suitable and straightforward method for well-known sets of records [30].
The third stage consists of subgrouping the criteria into two sets according to their relationship with either wildfire ignition or spreading (see Figure 2, third stage). This division is based on a literature review shown in our earlier work [19]. Moreover, a relevancy indicator is given to each criterion according to their direct or indirect relationship with wildfire regimes. This is explained in detail in Table 1. The first three methodical stages are borrowed from our previous studies.

Table 1.
The weighted impact factors (WIPI and WSCI) of each criterion via AHP and ROC/AUC methods.
In the fourth stage, we propose ROC/AUC analysis (via SPSS software) as a weighting method among criteria, besides the AHP pairwise comparison method. This relies on the specific characteristics of the study area and historical data on fire regimes. Indexing values are calculated as the sum of the products between inventory value and each criterion’s impact factor, as shown in Equations (1) and (2). Inventory values of criteria are freely accessible as explained in Data Availability Statement at the end of this article. Table 1 delivers the impact factors of criteria as calculated via AHP and ROC analysis.
where WIPI is the normalized wildfire ignition probability index, is the inventory value of criterion i, and is the weighted impact coefficient of criterion i.
where WSCI is the normalized wildfire spreading capacity index, is the inventory value of criterion j, and is the weighted impact coefficient of criterion j.
We compare the earlier model results (WIPI/WSCI) and the updated one (WIPI_ROC/WSCI_ROC) as applied in Romania’s case. During the sixth stage, the ROC/AUC method assesses both models’ accuracy, leading to a comparative discussion. At the final stage, the WSCI_ROC model results are used in vulnerability assessment of protected areas and exposure analysis of urbanized zones.
2.3. Data Acquisition
This study depends on a variety of free access to remotely sensed geospatial data. These data are acquired from various sources. We have included detailed information in Table A2 (Appendix B), which presents the complete list of the data name, data type, Minimum Mapping Unit (MMU), source, and utility within the method’s workflow. CLC is a pan-European data provided by the European Environment Agency (EEA), which delivers a hierarchical classification of 44 land cover types [31]. The original classification method simultaneously relies on both the Sentinel-2 satellite imagery (i.e., the 1st dedicated European satellite for land monitoring) and Landsat-8 images for gap-filling.
In this study, we rely on the CLC data of 2018 to gather geospatial information about vegetation surfaces, settlements (S2), fuel type (F1), and agricultural areas (S5). The precise data extraction method regarding fuel type and the relative weighting is explained in our previous work [20]. Land cover classes of vegetated surfaces were ranked according to their relative implication with either wildfire ignition or spread. For example, broad-leaved forests (CLC-311) lead the list of correlation with wildfire spreading capacity. EEA supplies other data such as Digital Elevation Model (DEM) and Tree Cover Density (TCD). DEM is delivering information about slope (P1), aspect (P2), and altitude (P3) in raster format of 25 m in resolution. The population density information is produced based on population records at the smallest local administrative unit level, as shown in Figure A1 (Appendix B) based on the data provided by the National Institute of Statistics of Romania. All maps in this study are projected according to ETRS89/ETRS-LAEA (ESPG: 3035) projection reference system in QGIS.
Normalized Difference Vegetation Index (NDVI) data is extracted from the Terra Moderate Resolution Imaging Spectroradiometer (MODIS) Vegetation Indices (MOD13Q1) Version 6. These data are produced in a resolution of 250 m by choosing the most reliable pixel value among daily values within 16 days. The low percentage of cloud coverage, low view angle, and the highest NDVI value are among the applied selection criteria [32,33]. In this study, we used the period between 28 July and 12 August within the fire season of 2018.
Raster data about solar radiation (E1), precipitation (E2), maximum temperature (E3), and wind speed (E4) are derived from WorldClim 2.0 database (http://www.worldclim.com/version2, accessed on 3 June 2020). It consists of raster images of 30 s (1 km2) resolution that provide monthly average values recorded between 1970 and 2000. These products rely on an interpolation method using historical data collected by 60,000 weather stations around the globe. Furthermore, remotely sensed data like maximum and minimum land surface temperature and cloud cover, as obtained via the MODIS satellite platform, were used as satellite-derived covariates for accuracy improvement [33]. Fick and Hijmans provide further details about the production process of remotely sensed data via Google Earth Engine in their previous work [34]. In this study, we use August’s average records as the weather conditions for wildfire spread are highest. The remaining criteria, like distance to water (P4) and transportation network (S2 & S3), stand on Open Street map (OSM) data enabled for free via the Geofabrik portal (https://www.geofabrik.de, accessed on 27 December 2020).
Another crucial data set used in this study is the Burned Area (BA) products acquired from Copernicus Climate Change Service (2019). They provide information about the total BA at the pixel level (250 m). The results are prepared via reflectance change analysis of medium resolution sensors like Terra MODIS, Sentinel-3 OLCI combined with the thermal data by MODIS. These products are vital raw data for research that focus on themes like climate change, land use and land cover dynamics, wildfire risk assessment, among others [35]. MODIS products are the most widely used global dataset by the scientific community [36,37,38].
According to the Burned Area Fraction (BAF) maps reported by Copernicus Climate Change Service during the fire season between 2015 and 2019 (Figure 3), 1980 points overlap with surfaces marking a cumulative BAF above 100%. In this study, this threshold is assigned considering that a cumulative BAF value above 100% (the sum of 5 years records) is considered a high probability that a particular location experienced a fire during the 5 years. Apart from BAF, we utilized the recorded large fires as derived from the EFFIS database. The wildfire occurrence and size are recorded based on the MODIS burned area product (MCD64A1) following the Globfire method [39]. MCD64A1 products use Terra and Aqua satellite imagery, resulting in dependable identification of large fires in different locations [40,41,42]. Nevertheless, Moreno-Ruiz et al. [43] conclude that there is still space for further improvement in the MODIS sensor-based burned area detection algorithms. Further details about the data used in this study are included in Table A2 (Appendix B).
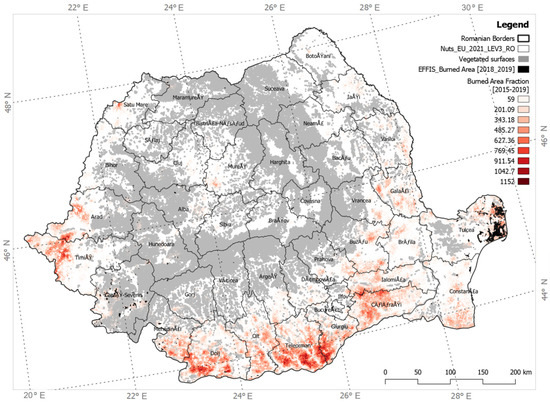
Figure 3.
The burned surfaces in Romania (EFFIS, 2018–2019) and the burned area fraction (%). (Copernicus Climate Change Service, 2015–2019).
3. Results
3.1. Multi-Criteria Inventory of Wildfire-Related Factors in Romania
First, the method delivers inventory results on an individual level per each criterion. Figure 4 presents the relative wildfire proneness map of vegetated surfaces (Figure 4q) in Romania based on each criterion. The color palette is set as the gradient of red-yellow-green, where red shows the highest risk areas while green the least risk. The range of inventory values are reclassified into 10 classes following Jenks natural break normalizing procedure. The gradient direction is assigned according to the relative indicator, as explained in Table 1. For example, criteria like solar radiation (E1) and precipitation (E2) are shown under reversed color gradient. In other words, the highest solar radiation values indicate the highest risk. In contrast, the highest precipitation records correlate with the lowest risk.
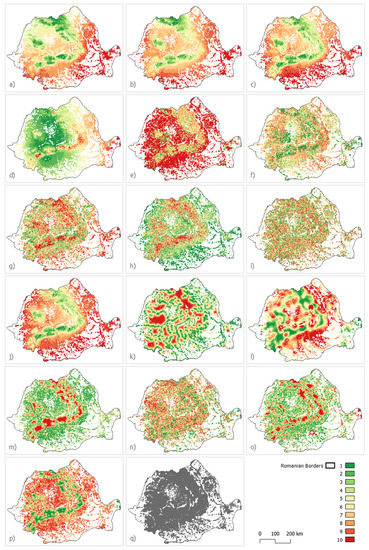
Figure 4.
The relative risk of each criterion: (a) solar radiation, (b) precipitation, (c) maximum temperature, (d) wind speed, (e) fuel type, (f) tree cover density, (g) NDVI, (h) slope, (i) aspect, (j) altitude, (k) distance to water, (l) distance to urban centers, (m) distance to settlements, (n) distance to any road, (o) distance to main roads, (p) distance to agriculture, and vegetated surfaces (q) in Romania.
According to Figure 4, the Carpathians that cross the Romanian territory in the central region from north to south-west direction stand as a determinant of the spatial distribution of the relative risk for the majority of the criteria. First, the hydrometeorological criteria visually correlate with the topography of the study area. Figure 4a shows that solar radiation (E1) is higher at lower altitudes, especially in Carpathians’ southeast, and lower at high altitudes. Similarly, the recorded maximum temperatures (E3) are on the same line as the altitude (P3) values presented in Figure 4j.
Wind speed (E4) is the only environmental criterion that is not tightly correlated with altitude (Figure 4d). The slopes of Carpathians face south and southeast and remain an exposed area to winds flowing from the Black Sea and the Mediterranean. Similarly, the remaining plain territories in Romania’s south-eastern region facing the Black Sea are exposed to considerable average wind speeds compared to the north-western plains (Figure 4d). Among geophysical criteria, slope (P1) is the only criterion that correlates with the altitude values (Figure 4h). Most of the sloped surfaces are found along with the Carpathian’s layout; whereas the aspect (P2) values are more uniformly dispersed in the territory (Figure 4i) and distance to water surfaces (P4) follows the spatial distribution of water elements in the landscape (Figure 4k), independently to the altitude values.
The visual results discussed earlier are on the same line as the correlogram presented in Figure 5. We performed a correlation analysis among all 16 criteria and BAF values for 70,410 point locations to determine which criteria correlate more with wildfire records of 2015–2019. We used the “corrplot” package in RStudio [44], to produce the correlogram. The default calculation is based on the Pearson correlation method. The following correlogram delivers both visual plotting and numerical evidence of the correlation coefficient of each pair of criteria. The larger the circle and the darker the blue color, the higher the positive correlation among criteria. Similarly, the larger the circle and the darker the red color, the higher the inverse correlation among the two variables.
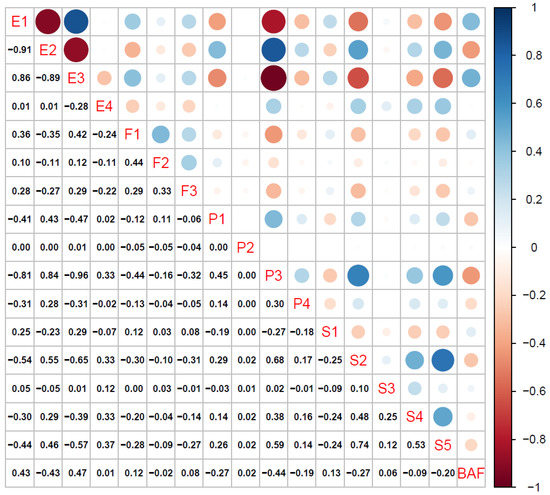
Figure 5.
Correlogram representing the correlation matrix analysis among 16 criteria and BAF for 70,410 points.
On the other hand, the smaller the circle, the less the correlation between the two variables. For example, there exists a significant positive correlation between precipitation (E2) and altitude (P3) (0.84). Similarly, there exist significant negative correlations between solar radiation/maximum temperature (E1/E3) and altitude (P3) (−0.81/−0.96). Cumulative BAF values (monthly, 2015–2019) positively correlate highest to solar radiation (E1) and maximum temperature (E3), respectively, 0.43 and 0.47; while they inversely correlate highest to precipitation (E2) and altitude (P3), respectively, −0.43 and −0.44.
3.2. Calibrated Weighting of Criteria
We adopted the weighted factors as assigned via an AHP pairwise comparison method from our previous study [20], as listed in Table 1. AHP was applied in two different levels and was based on experts’ evaluation. First, we compared four major categories of criteria (anthropogenic, hydrometeorological, geophysical, and fuel). Then we assigned a second level coefficient to each criterion by comparing within each category. The current coefficient is shown in Table 1 (AHP) and is the product of two coefficients. According to our previous results, distance to agriculture (S5) is the criterion that has the highest impact on wildfire ignition probability, almost one-third of all wildfire ignition coefficient distribution. On the other hand, the criterion that affects the most wildfire spreading capacity of vegetated surfaces is tree cover density (F2). Our previous study suggested that sensitivity analysis via ROC/AUC method should be tested in assigning weights of the impact factors.
According to each criterion’s sensitivity analysis concerning the historical fire regimes, the revised weighted impact factors are assigned. Figure 6 presents the ROC analysis values per each criterion under four groups; hydro meteorological-environmental (E), fuel (F), geophysical (P), and anthropogenic-social (S). The sensitivity analysis is performed in SPSS software via the ROC analysis tool. One-thousand-nine-hundred-and-fifty-six points out of 70,410 have a 5-year cumulative burned area fraction (2015–2019) value above 100%. These points are considered positive samples in the ROC analysis procedure in finding each criterion’s sensitivity. On the other hand, there are 41,683 points (about 60%) that have a BAF value of 0, indicating the areas that have been safest during the fire season of 2015–2019.
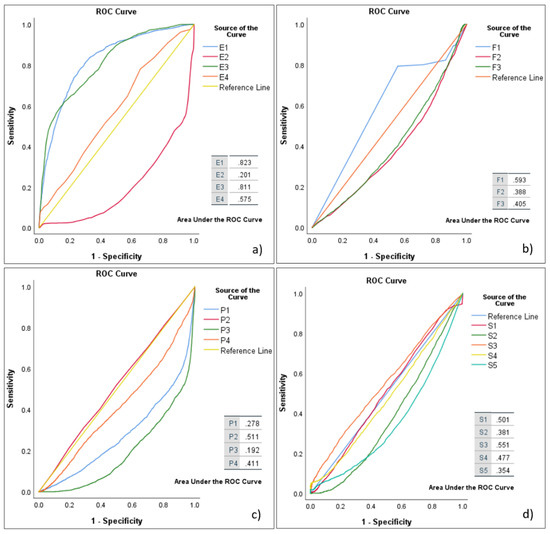
Figure 6.
ROC curve analyses for (a) hydrometeorological (E1—solar radiation, E2—precipitation, E3—maximum temperature, E4—wind speed), (b) fuel (F1—fuel type, F2—tree cover density, F3—ndvi), (c) geophysical (P1—slope, P2—aspect, P3—altitude, P4—distance to water), and (d) anthropogenic/social (S1—population density, S2—distance to settlements, S3—distance to any road, S4—distance to main roads) factors were relying on burned regime values.
The results presented in Figure 6 reveal the hypothetical models’ sensitivity that has a single determinant, being each criterion. It is a way to find the sensitivity of the model to each criterion based on the burned area fraction in Romania (see Figure 3). According to Figure 6, the highest AUC value belongs to E1 (solar radiation) and E3 (maximum temperature), respectively, 0.823 and 0.811. While the lowest AUC values are recorded for E2 (precipitation), P1 (slope), and P3 (altitude), respectively, 0.201, 0.278, and 0.192. In principle, the lower the AUC value, the higher the inverse correlation between the criterion and the wildfire recorded burned area fraction. The criteria that score an AUC value less than 0.5 have an inverse correlation with the wildfire records. These results converge with the correlation matrix analysis presented in Figure 5.
The first two columns of Table 1 present the absolute and normalized AUC values of all criteria. The following columns deliver each criterion’s relative impact factors as calculated via AHP pairwise comparison and ROC/AUC analysis. Besides, each criterion is assigned an indicator for either direct (+) or inverse (−) relation with the wildfire risk. This indicator is assigned based on assumptions inferred from the literature review on the relationship between wildfire regimes and driving factors [20]. For example, the higher the solar radiation, maximum temperature, fuel type, and aspect values, the higher wildfire ignition and spread probability. On the other side, the lower the precipitation, NDVI, and altitude values, the higher the wildfire risk. Simultaneously, anthropogenic criteria like distance to settlements and transportation networks are unevenly related to wildfire ignition and spreading phases.
3.3. Comparing between WIPI/WSCI and WIPI_ROC/WSCI_ROC Results
We calculated the WIPI and WSCI index values of each reference point according to Equations (1) and (2) using the weighted values via the AHP method. The results of the ROC/AUC analysis show the relatively low sensitivity of the model. An accumulative BAF record point higher than 100% (see Figure 3) was accepted as a positive case in the model. According to Figure 7, the AUC of WIPI is 0.705 and has an overall model quality of 0.69. It is significantly higher than the WSCI model sensitivity marking an AUC value of 0.587 and an overall model quality of 0.57. It can be inferred that the model, which relies on the weighted values calculated via AHP, is more accurate for predicting wildfire occurrence events rather than the wildfire spreading process.
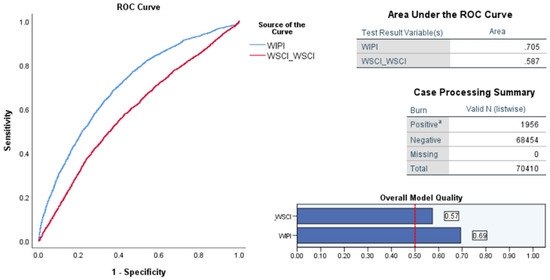
Figure 7.
Sensitivity analysis of the WIPI and WSCI models based on burned surfaces (2015–2019) as positive cases (1956 out of 70,410-point locations).
Later, we recalculated each reference point’s index values as the sum of the products between normalized inventory value and the weighted factor via the ROC/AUC method (Figure 2). The revised weights, as presented in Table 1, led to improved model sensitivity. Figure 8 presents a comparative ROC/AUC analysis between the former WIPI/WSCI and the revised WIPI_ROC/WSCI_ROC models.
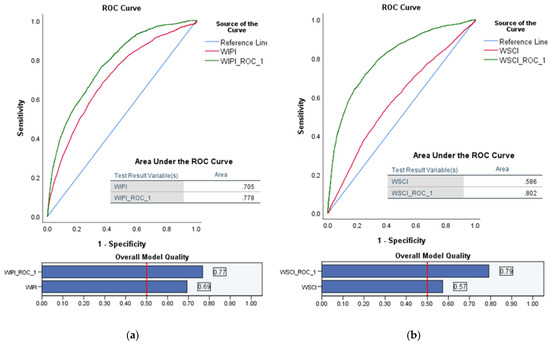
Figure 8.
Comparative Sensitivity analysis: (a) between WIPI and WIPI_ROC models, and (b) between WSCI and WSCI_ROC models.
The updated models’ curves are shown in green, while the previous versions are red. According to Figure 8a, the AUC value of WIPI_ROC increased to 0.778, marking a sensitivity increase of 0.073. The overall model quality of the WIPI model was improved by 12% (from 0.69 to 0.77). The improvement is more visible in the case of the WSCI model (Figure 8b). The revised model (WSCI_ROC) recorded an AUC value of 0.802, 37% higher than the earlier version. A similar escalation is recognized in the overall model quality. We rely on the WSCI_ROC results during the final stage of vulnerability and exposure analysis.
Beyond statistical analysis about the model accuracy, the results of the WSCI_ROC model deliver essential findings of the spatial distribution of the wildfire, spreading the capacity risk of vegetated surfaces in Romania. According to Figure 9, the highest wildfire spreading risk is concentrated in its eastern and southern regions. A secondary area under wildfire spreading capacity risk is along the western borders. Simultaneously, the central and the northern regions appear to be safer from wildfire, spreading the risk. These regions coincide with the surfaces that are high in elevation and located away from human activities. Among them, the sub-regions that record the lowest WSCI_ROC values are surfaces that are oriented towards the northern direction and gaining a minimum of solar radiation. The gradient of green color indicates these surfaces.
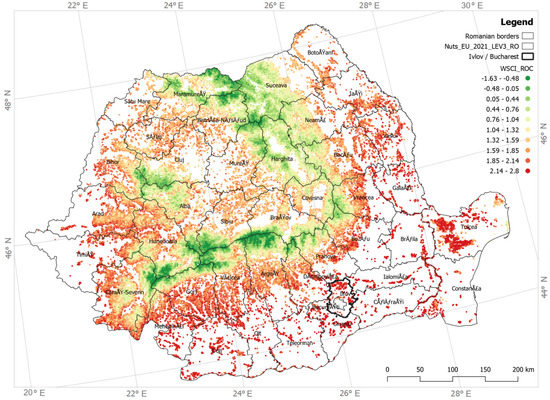
Figure 9.
Wildfire spreading capacity map of vegetated surfaces in Romania (WSCI_ROC) with the highlighted metropolitan area of Ilfov.
Furthermore, Figure 9 includes the administrative boundaries of the third level (Classification of Territorial Units for Statistics, NUTS-L3) of Romania. Referring to the Eurostat data, Romania has 42 local administrative units at the third level. According to the results presented in Figure 9, 41 units consist of at least 1 km2 of vegetated surface that has been indexed here. The only unit that has no wildland vegetated surface is the capital city of Romania. As highlighted in Figure 9, Bucharest is the smallest in surface area compared to the other units. However, it does not mean that it is safer. On the contrary, when jointly considered with the metropolitan area of Ilfov, which envelopes the urban area of Bucharest, the wildfire ignition and spreading risk in the wildland-urban interface (WUI) is critical and worth investigating. We further discuss this issue in the following sections while assessing human-made structures’ exposure to wildfire spreading risk.
The overlapping of wildfire spreading capacity risk and the local administrative units highlight the municipalities that need to enhance their wildfire prevention measures. Figure A2 (Appendix C) presents the box plots that show the WIPI_ROC and WSCI_ROC values distribution by local administrative units. According to the results plotted in Figure A2a, the administrative units with the highest WIPI_ROC index values are located in the country’s south-eastern and southern regions.
4. Discussion on the Vulnerability of Protected Areas and Exposure of Settlements
Wildfires are native events on earth estimated to have happened during the last 350 million years [45]. They are accepted to significantly contribute to vegetation recovery with their natural schedule, the biogeochemical cycles of carbon and nitrogen, and the atmosphere’s chemical properties [46,47,48]. However, they are also reported to have considerable consequences on the territory’s ecological and social systems. Protected areas are among the land surfaces where the ecological and socio-cultural interests converge with each other. Uncontrolled fires in the vegetated protected areas may cause unrecoverable consequences on the native vegetation structure. On the other side, the WUI zone is boldly highlighted in scientific reports. Wildfire events threaten human activities. We expand our findings by discussing further concerning protected areas’ vulnerability and exposure to human-made structures.
4.1. The Vulnerability of the Romanian Protected Areas to Wildfires
Globally speaking, the protected areas are under consistent threat caused by climate change processes, land-use alterations, provisioning of raw materials, socio-cultural activities, and flourishing of invasive species [49,50]. Jones et al. [51] conclude that only two-thirds of the protected areas are safe from globally intensive human activities. While Schulze et al. [52] list fire and fire suppression activities as the third out of 36 threats that protected areas usually face according to the list of level two threats included in the IUCN-CMP Threats Classification Scheme. Forest fires can lead to an invasive plant expansion in disturbed sites [53]. The native species in Romania’s protected areas have been at risk of several natural and human-induced hazards [54]. Thus, assessing the vulnerability of the protected areas to wildfires is of great concern in Romania.
This assessment relies on the European inventory of nationally designated protected areas, as acquired from the EEA open-source datasets. According to these data, Romania has 946 protected sites, covering a total area of 13,985 km2. Figure 10 presents the protected areas overlapping the WIPI_ROC results. Most of these areas are found in the alpine lands along with the Carpathians. About 13% of the 70,410 reference points within the vegetated surfaces we analyzed are located within the protected areas. Consequently, we may infer that 65% of Romania’s protected surfaces are vegetated and potentially vulnerable to wildfire risk.
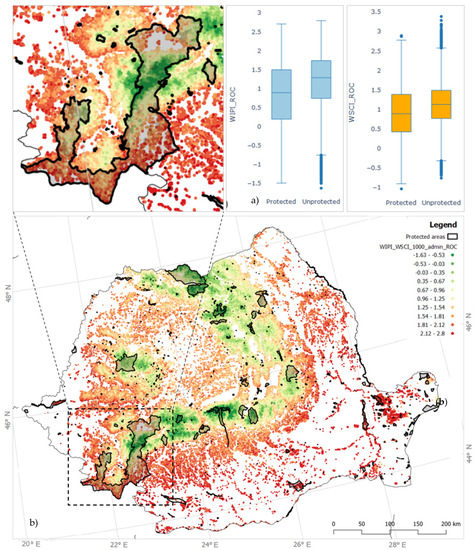
Figure 10.
Wildfire spreading risk exposure map of protected areas in Romania, and comparative box plot of WIPI_ROC (a) and WSCI_ROC (b) value distribution between protected and unprotected vegetated surfaces in Romania.
According to the box plot in Figure 10a, the protected areas have lower WIPI_ROC and WSCI_ROC values than unprotected surfaces. Furthermore, referring to Figure 10b, most vegetated surfaces within the protected patches are greenish, implying a relatively low wildfire spreading capacity (WSCI_ROC). These values’ main reasons are the high elevation and remote location of protected surfaces to human activities (settlement and transportation network). However, some cases consist of a gradient of WSCI_ROC values within the same protected surface (see the enlarged protected patch in Figure 10).
The relation between vegetated landscape patches and wildfire spreading risk has been a questionable literature topic [55]. O’Donnell et al. [56] report that the fragmentation among vegetated landscapes in unmanaged Australian semi-arid shrublands and woodlands directly impacted the reduction of wildfire intervals between 1940 and 2006. Thus, the connectivity among vegetated surfaces within the same protected area may boost the wildfire, spreading greenish areas’ risk. Future studies must focus on protected patches to assess the vulnerability to wildfire spreading risk at a finer spatial scale.
4.2. Wildfire Exposure of Populated Areas within the Metropolitan Area of Bucharest
The urban fringes are critical hybrid areas where the human-made structures are exposed to different environmental hazards [57]. Studies from developing countries report that uncontrolled urban expansion increases inhabited surfaces’ exposure to natural hazards like floods, landslides, fire, and sinkholes, among others [58]. Sestras et al. [58] report landslide assessment at a local scale as an inherent threat in Romania’s newly developed suburban zones. The wildland–urban interface represents an area of contradiction where both the settling interest and wildfire risk are significantly high [59,60,61].
We performed an exposure assessment of built structures to the wildfire spreading capacity of vegetated surfaces within the Romanian capital city’s metropolitan area (Figure 9). The wildfire exposure analysis relies on the juxtaposition between the WSCI_ROC results and existing building stock, as shown in Figure 11. We bring a demonstrative example from Ilfov metropolitan area, which includes the capital city, Bucharest. The hazard map of wildfire spreading capacity relies on the results reported in this article (see Figure 9). The WSCI_ROC point’s layer is utilized for preparing the hazard heatmap (kernel density estimation) with a selection radius of 1 km.
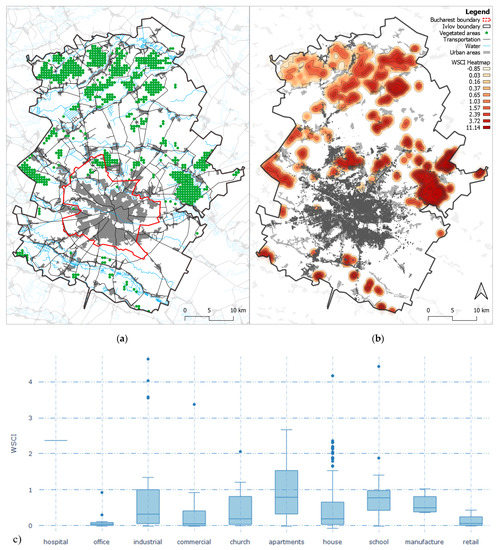
Figure 11.
The vegetated metropolitan area of Ilfov and Bucharest (a) including the wildfire exposure map of existing urban fabric (b) and the box plot of WSCI distribution per building type (c).
OSM data provide the building stock within the focal study area. Nevertheless, OSM data accuracy is still debatable due to the lack of professional backgrounds [62]. A substantial number of building features do not include building-use information. However, we bring this discussion forward as an exposure analysis method that can deliver critical information about the human-made structures under wildfire risk within WUI areas at a metropolitan scale if further improved by introducing validated building stock data.
According to Figure 11b, 9596 structures overlap with the WSCI_ROC heatmap, exposing the minimum wildfire spreading capacity. Furthermore, 1734 out of the total exposed structures are building types of significant socio-economic. This building stock’s exposure to wildfire spreading risk may have critical consequences on socio-economical processes and their users’ life security. Figure 11c presents the box plot of WSCI_ROC heatmap values distribution per building type. We included just the most critical building types like hospitals, industrial, residential, religious, leisure, and educational use. While other buildings like warehouses, greenhouses, and abandoned structures were ignored at this stage.
According to the box plot, just one hospital is located within the critical wildfire spreading capacity heatmap. Nevertheless, it has a WSCI_ROC heatmap value of 2.37, which indicates a significant exposure of its users to wildfire spreading risk. According to the outlier values (dots) shown in Figure 11c, there are four industrial, one house, and one school building highly exposed to wildfire, which can spread the risk.
5. Conclusions
This study presented the indexing of vegetated surfaces in Romania by Wildfire Ignition Probability and Spreading Capacity Index (WIPI/WSCI). The method offered here relies on open-source and available remotely sensed data, which supplies the analytical process with geospatial information about the anthropogenic, hydrometeorological, geophysical, and fuel properties of the study area. We identified 16 criteria that significantly impact either the wildfire ignition or spreading phase of the wildfire event in Romania. The impact of each criterion on wildfire is weighted via ROC/AUC analysis. During the analysis, the positive cases rely on the burned area fraction records between 2015 and 2019 (5 years).
According to our results, solar radiation (E1), precipitation (E2), and maximum temperature (E3) have the highest correlation to the cumulative burned area fraction reported for the 2015–2019 fire season. The vegetated surfaces in Romania’s eastern and southern regions face the highest wildfire spreading capacity index values. Considering that these regions make home to urbanized lands of high population density, the high WSCI records indicate an elevated risk. We performed the wildfire spreading risk exposure analysis of the building stock within the Bucharest metropolitan area, Ilfov. These results imply that critical structures like hospitals and residential and educational units are found at locations of significant risk.
On the other side, Romania’s central areas scattered along the Carpathians have the lowest index values. This is generally driven by high altitude values, which are directly correlated with other climatic criteria such as solar radiation, precipitation, and maximum temperature. These regions include most protected areas. According to our results, some protected vegetated surfaces in Romania hold a gradient of wildfire spreading risk within the same protected area geometry. In such cases, the whole area within the protection borders must be considered under risk, as the connectivity among vegetated surfaces in wildfire risk analysis is considered a weakness.
The method we presented in this study is reproducible in other wildfire-prone geographies. It is also flexible enough to integrate the most up-to-date and most reliable remotely sensed geospatial data available to the community in the future. The results presented in this study can help the institutions at the national and local levels responsible for wildfire risk reduction in Romania.
Author Contributions
Conceptualization, A.H. and P.S.; Data curation, A.H., S.R., A.K. and P.S.; Formal analysis, A.H. and A.K.; Funding acquisition, B.D.; Investigation, V.S., S.R., A.K. and Ș.B.; Methodology, A.H.; Project administration, V.S., B.D. and P.S.; Software, A.H.; Supervision, V.S., B.D., A.K. and P.S.; Validation, V.S. and Ș.B.; Visualization, A.H. and A.K.; Writing—original draft, A.H. and S.R.; Writing—review & editing, A.K. and P.S. All authors have read and agreed to the published version of the manuscript.
Funding
This research received no external funding.
Data Availability Statement
The data generated during this study are included in this published article via the PANGAEA database and can be accessed via the following link. https://issues.pangaea.de/browse/PDI-27019, accessed on 3 June 2020.
Acknowledgments
The authors are thankful to the institutions that supplied the open-access data that we utilized in our work. We acknowledge the use of data and/or imagery from NASA’s Land, Atmosphere Near real-time Capability for EOS (LANCE) system (https://earthdata.nasa.gov/lance, accessed on 3 June 2020), part of the NASA Earth Observing System Data and Information System (EOSDIS).
Conflicts of Interest
The authors declare no conflict of interest.
Appendix A
Vegetation Structure of Romania and Wildfire Regimes
The forests on the Romanian Carpathian Mountains consist of 2.13 million hectares of Pannonian mixed deciduous and coniferous forests, 0.87 million hectares of central European mixed forest, 0.53 million hectares of Balkan mixed forest coniferous forests, 3.31 million hectares with species such as Abies alba, Picea abies, Pinus sylvestris, Pinus nigra); the plains area represents the forest-steppe floor in which predominates Quercus petraea, Quercus cerris, Quercus frainetto, Quercus pedunculiferra; along the large watercourses (i.e., such as Crisuri and Mureș Rivers in western Romania, Olt, Jiu, Buzău Rivers in the south and Siret, Prut Rivers in the east of the country) hydrophytic vegetation develops, as well as mixed riparian forests (Quercus robur, Ulmus laevis, Fraxinus excelsior, Fraxinus angustifolia, Salix alba, Populus alba).
Analyzing Romania’s central relief units, the distribution of forested areas by categories of consistency highlights the Eastern Carpathians region, which covers 4128 km2 (representing 14.6% of their territory). It has a full consistency of forests and extended areas of 12,664 km2 (44.8% of the surface) with almost full consistency (Table A1).
Large areas of the arboretum with full consistency are also present in the significant relief units such as the Curvature Carpathians, the Apuseni Mountains, followed by the Southern Carpathians, were due to higher altitudes and their massiveness, arboretum develops on larger areas compared to the rest of the relief units with alpine vegetation area. At the opposite pole, there are relief units such as the Danube Delta, the Western Plain, the Romanian Plain, which have 90% of the area occupied by forest vegetation included in trees with degraded consistency. These are most often part of the category of forest vegetation outside the national forest fund, consisting of alignments of trees located along the transport and communication routes, along watercourses, forest vegetation developed on pastures with small consistency, forest plateaus, and trees located within the areas of protection of hydraulic works and land improvements.

Table A1.
Distribution of forests in Romania by consistency categories at the level of significant relief units.
Table A1.
Distribution of forests in Romania by consistency categories at the level of significant relief units.
| Major Relief Unit | Consistency Categories | |||||||
|---|---|---|---|---|---|---|---|---|
| Arboretum with Full Consistency (C = 100) | Arboretum with Almost Full Consistency (C = 70–90) | Arboretum with Sparse, Lighted, or Braced Consistency (C = 40–60) | Arboretum with Degraded Consistency (C = 10–30) | |||||
| Km2 | % | Km2 | % | Km2 | % | Km2 | % | |
| Romanian Plain | 45,459.89 | 92.9 | 881.28 | 1.8 | 1874.65 | 3.8 | 703.66 | 1.4 |
| Getic Plateau | 8358.95 | 60.5 | 1647.01 | 11.9 | 3580.86 | 25.9 | 234.7 | 1.7 |
| Western Hills south of Mures | 2458.28 | 54.3 | 394.81 | 8.7 | 1559.46 | 34.4 | 115.32 | 2.5 |
| Banat Mountains | 1429.78 | 20.4 | 612.92 | 8.7 | 4568.48 | 65.2 | 399.24 | 5.7 |
| Transylvanian Depression | 18,164.37 | 71.8 | 1970.75 | 7.8 | 4593.99 | 18.2 | 568.38 | 2.2 |
| Apuseni Mountains | 2319.16 | 21.7 | 1102.65 | 10.3 | 5275.04 | 49.4 | 1973.78 | 18.5 |
| Moldavian Plateau | 19,059.32 | 83.1 | 802.81 | 3.5 | 2766.84 | 12.1 | 300.88 | 1.3 |
| Subcarpathian | 8206.62 | 49.5 | 1941.2 | 11.7 | 4867.73 | 29.3 | 1574.77 | 9.5 |
| Dobrogea Plateau | 9136.14 | 60.5 | 160.5 | 11.9 | 765.5 | 25.9 | 90.79 | 1.7 |
| Danube Delta | 4289.01 | 72.52 | 87.99 | 10.18 | ||||
| Mehedinti Plateau | 333.11 | 41.6 | 112.58 | 14.1 | 350.02 | 43.7 | 5.46 | 0.7 |
| Western Plain | 15,337.49 | 97.8 | 236.43 | 1.5 | 504.67 | 3.1 | 99.38 | 0.6 |
| Eastern Carpathians | 8753.47 | 30.9 | 2738.64 | 9.7 | 12,664.1 | 44.8 | 4128.64 | 14.6 |
| Curvature Carpathians | 954.29 | 15.6 | 429.88 | 7.0 | 2605.22 | 42.5 | 2141.88 | 34.9 |
| Southern Carpathians | 3852.61 | 27.2 | 1092.47 | 7.7 | 7488.87 | 52.8 | 1741.48 | 12.3 |
| Western hills north of Mures | 5258.13 | 63.3 | 649.76 | 7.8 | 2090.52 | 25.2 | 305.84 | 3.7 |
| Total (km2) | 15,3370.62 | 14,846.21 | 55,643.94 | 14,394.38 | ||||
Forest fires primarily represent vegetation fires in Romania. These are part of the category of hazards that cause economic damage and losses in vegetation. In case of forest fires that the Inspectorates of Emergency Situations report at each county’s level, firefighters, gendarmerie service, managers, and staff of each forest district intervene to extinguish them. The leading cause of vegetation fires is due to the negligence of the population, combined with unfavorable weather conditions (successive days with temperatures over 30 °C), fires left unattended by tourists, and even rudimentary agricultural practice involving the burning of vegetation on land they own, the so-called prescribed burns of pastures. Our study has counted all anthropogenic, hydrometeorological, geophysical, and fuel factors that significantly correlate with Romania’s fire regimes.
Appendix B
Data Sources and Their Acquisition

Table A2.
The open-source raw data utilized in this study.
Table A2.
The open-source raw data utilized in this study.
| Data | Type | MMU | Utility within the Method | Source | |
|---|---|---|---|---|---|
| 1 | CORINE land cover | Vector | 25 ha | Vegetated surfaces; Settlements (S2); Fuel type (F1); Distance to agriculture (S5) | Copernicus/EEA |
| 2 | DEM | Raster | 25 m | Slope (P1); Aspect (P2); Altitude (P3) | Copernicus/EEA |
| 3 | NDVI | Raster | 250 m | NDVI (F3) | Earth data/NASA |
| 4 | TCD | Raster | TCD (F2) | Copernicus/EEA | |
| 5 | Weather data | Raster | 30 s | Solar radiation (E1); Precipitation (E2); Maximum Temperature (E3); Wind speed (E4) | Worldclim 2.0 |
| 6 | Burned area fraction | Raster | ROC/AUC analysis | Climate Change Service | |
| 7 | Burned areas | Vector | ROC/AUC analysis | EFFIS/JRC | |
| 8 | OSM | Vector | Distance to water (P4); Distance to any road (S3); Distance to the main road (S4); Exposure analysis | OSM Geofabrik | |
| 9 | Population Density | Raster | Population density (S1); Exposure analysis | National Institute of Statistics (RO) | |
| 10 | Administrative/NUTS | Vector | Exposure analysis | EUROSTAT | |
| 11 | Protected areas | Vector | Vulnerability analysis | Eionet/EEA |
The population density information is produced based on population records at the smallest local administrative unit level, as shown in Figure A1 based on the data provided by the National Institute of Statistics of Romania. Initially, the map consisted of a polygon layer showing each local administration subdivisions, i.e., 3181 units in total within Romania. The capital city, Bucharest, has the highest mean population density of 8975 inhabitants/km2. Each polygon’s centroid points generate the heatmap (i.e., kernel density estimation) of density distribution in a 50 m pixel raster. The searching radius is set as 20 km considering the upper bound of the Euclidean distance between centroids of adjacent local administrative units.
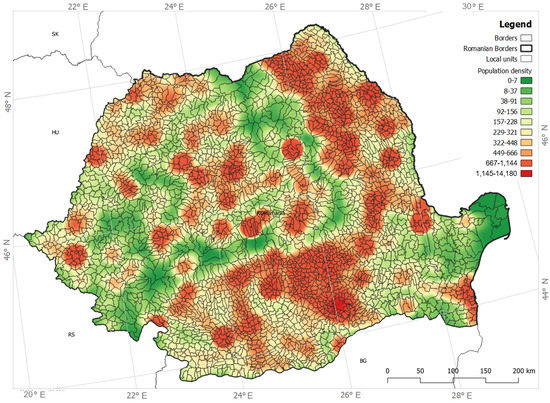
Figure A1.
Heatmap of population density (inhabitants/km2) distribution among administrative units (RO).
Appendix C
Data Sources and Their Acquisition
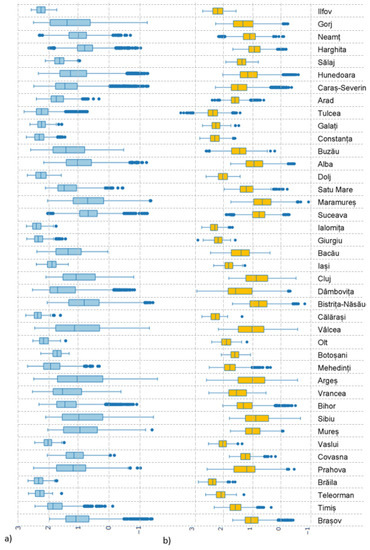
Figure A2.
Box plot of (a) WIPI_ROC and (b) WSCI_ROC distribution per administrative unit in Romania.
References
- AghaKouchak, A.; Huning, L.S.; Chiang, F.; Sadegh, M.; Vahedifard, F.; Mazdiyasni, O.; Moftakhari, H.; Mallakpour, I. How do natural hazards cascade to cause disasters? Nat. Cell Biol. 2018, 561, 458–460. [Google Scholar] [CrossRef] [PubMed] [Green Version]
- Naderpour, M.; Khakzad, N. Texas LPG fire: Domino effects triggered by natural hazards. Process. Saf. Environ. Prot. 2018, 116, 354–364. [Google Scholar] [CrossRef]
- Ruffault, J.; Curt, T.; Moron, V.; Trigo, R.M.; Mouillot, F.; Koutsias, N.; Pimont, F.; Martin-StPaul, N.; Barbero, R.; Dupuy, J.-L.; et al. Increased likelihood of heat-induced large wildfires in the Mediterranean Basin. Sci. Rep. 2020, 10, 1–9. [Google Scholar] [CrossRef] [PubMed]
- Chapin, F.S.; Trainor, S.F.; Huntington, O.; Lovecraft, A.L.; Zavaleta, E.; Natcher, D.C.; McGuire, A.D.; Nelson, J.L.; Ray, L.; Calef, M.; et al. Increasing Wildfire in Alaska’s Boreal Forest: Pathways to Potential Solutions of a Wicked Problem. Bioscience 2008, 58, 531–540. [Google Scholar] [CrossRef] [Green Version]
- Levin, N.; Tessler, N.; Smith, A.; McAlpine, C. The Human and Physical Determinants of Wildfires and Burnt Areas in Israel. Environ. Manag. 2016, 58, 549–562. [Google Scholar] [CrossRef] [PubMed]
- Ganteaume, A.; Camia, A.; Jappiot, M.; San-Miguel-Ayanz, J.; Long-Fournel, M.; Lampin, C. A Review of the Main Driving Factors of Forest Fire Ignition Over Europe. Environ. Manag. 2013, 51, 651–662. [Google Scholar] [CrossRef] [PubMed] [Green Version]
- Guo, F.; Su, Z.; Wang, G.; Sun, L.; Lin, F.; Liu, A. Wildfire ignition in the forests of southeast China: Identifying drivers and spatial distribution to predict wildfire likelihood. Appl. Geogr. 2016, 66, 12–21. [Google Scholar] [CrossRef]
- Ruffault, J.; Mouillot, F. Contribution of human and biophysical factors to the spatial distribution of forest fire ignitions and large wildfires in a French Mediterranean region. Int. J. Wildland Fire 2017, 26, 498–508. [Google Scholar] [CrossRef] [Green Version]
- Davis, R.; Yang, Z.; Yost, A.; Belongie, C.; Cohen, W. The normal fire environment—Modeling environmental suitability for large forest wildfires using past, present, and future climate normals. For. Ecol. Manag. 2017, 390, 173–186. [Google Scholar] [CrossRef]
- Granström, A. Spatial and temporal variation in lightning ignitions in Sweden. J. Veg. Sci. 1993, 4, 737–744. [Google Scholar] [CrossRef]
- Curt, T.; Frejaville, T.; Lahaye, S. Modelling the spatial patterns of ignition causes and fire regime features in southern France: Implications for fire prevention policy. Int. J. Wildland Fire 2016, 25, 785. [Google Scholar] [CrossRef] [Green Version]
- Hawbaker, T.; Radeloff, V.C.; Stewart, S.I.; Hammer, R.B.; Keuler, N.S.; Clayton, M.K. Human and biophysical influences on fire occurrence in the United States. Ecol. Appl. 2013, 23, 565–582. [Google Scholar] [CrossRef] [PubMed]
- Mahmoud, H.; Chulahwat, A. Unraveling the Complexity of Wildland Urban Interface Fires. Sci. Rep. 2018, 8, 1–12. [Google Scholar] [CrossRef] [Green Version]
- Mansuy, N.; Miller, C.; Parisien, M.-A.; A Parks, S.; Batllori, E.; A Moritz, M. Contrasting human influences and macro-environmental factors on fire activity inside and outside protected areas of North America. Environ. Res. Lett. 2019, 14, 064007. [Google Scholar] [CrossRef]
- Syphard, A.D.; Keeley, J.E.; Pfaff, A.H.; Ferschweiler, K. Human presence diminishes the importance of climate in driving fire activity across the United States. Proc. Natl. Acad. Sci. USA 2017, 114, 13750–13755. [Google Scholar] [CrossRef] [Green Version]
- Kountouris, Y. Human activity, daylight saving time and wildfire occurrence. Sci. Total. Environ. 2020, 727, 138044. [Google Scholar] [CrossRef] [PubMed]
- Rodrigues, M.; Gelabert, P.J.; Ameztegui, A.; Coll, L.; Vega-García, C. Has COVID-19 halted winter-spring wildfires in the Mediterranean? Insights for wildfire science under a pandemic context. Sci. Total. Environ. 2020, 765, 142793. [Google Scholar] [CrossRef] [PubMed]
- Mann, M.L.; Batllori, E.; Moritz, M.A.; Waller, E.K.; Berck, P.; Flint, A.L.; Flint, L.E.; Dolfi, E. Incorporating Anthropogenic Influences into Fire Probability Models: Effects of Human Activity and Climate Change on Fire Activity in California. PLoS ONE 2016, 11, e0153589. [Google Scholar] [CrossRef] [Green Version]
- Hysa, A.; Başkaya, F.A.T. A GIS based method for indexing the broad-leaved forest surfaces by their wildfire ignition probability and wildfire spreading capacity. Model. Earth Syst. Environ. 2018, 5, 71–84. [Google Scholar] [CrossRef]
- Hysa, A.; Teqja, Z. Counting fuel properties as input in the wildfire spreading capacities of vegetated surfaces: Case of Albania. Not. Bot. Horti Agrobot. Cluj-Napoca 2020, 48, 1667–1682. [Google Scholar] [CrossRef]
- Adámek, M.; Jankovská, Z.; Hadincová, V.; Kula, E.; Wild, J. Drivers of forest fire occurrence in the cultural landscape of Central Europe. Landsc. Ecol. 2018, 33, 2031–2045. [Google Scholar] [CrossRef]
- Pinto, G.; Rousseu, F.; Niklasson, M.; Drobyshev, I. Effects of human-related and biotic landscape features on the occurrence and size of modern forest fires in Sweden. Agric. For. Meteorol. 2020, 291, 108084. [Google Scholar] [CrossRef]
- Ioja, C.; Grădinaru, S.R.; Onose, D.A.; Vânău, G.O.; Tudor, A.C. The potential of school green areas to improve urban green connectivity and multifunctionality. Urban For. Urban Green. 2014, 13, 704–713. [Google Scholar] [CrossRef]
- Dumitrașcu, M.; Kucsicsa, G.; Dumitrică, C.; Popovici, E.-A.; Vrînceanu, A.; Mitrică, B.; Mocanu, I.; Șerban, P.-R. Estimation of Future Changes in Aboveground Forest Carbon Stock in Romania. A Prediction Based on Forest-Cover Pattern Scenario. Forests 2020, 11, 914. [Google Scholar] [CrossRef]
- Popovici, E.A.; Bălteanu, D.; Kucsicsa, G. Assessment of changes in land-use and land-cover pattern in Romania using Corine Land Cover Database. Carpathian J. Earth Environ. Sci. 2013, 8, 195–208. [Google Scholar]
- Kucsicsa, G.; Popovici, E.-A.; Bălteanu, D.; Dumitraşcu, M.; Grigorescu, I.; Mitrică, B. Assessing the Potential Future Forest-Cover Change in Romania, Predicted Using a Scenario-Based Modelling. Environ. Model. Assess. 2020, 25, 471–491. [Google Scholar] [CrossRef]
- Matei, I.; Pacurar, I.; Roșca, S.; Bilașco, Ș.; Sestras, P.; Rusu, T.; Jude, E.T.; Tăut, F.D. Land Use Favourability Assessment Based on Soil Characteristics and Anthropic Pollution. Case Study Somesul Mic Valley Corridor, Romania. Agronomy 2020, 10, 1245. [Google Scholar] [CrossRef]
- Munteanu, C.; Nita, M.D.; Abrudan, I.V.; Radeloff, V.C. Historical forest management in Romania is imposing strong legacies on contemporary forests and their management. For. Ecol. Manag. 2016, 361, 179–193. [Google Scholar] [CrossRef]
- Hysa, A.; Spalevic, V. Testing NDVI, tree cover density and land cover type as fuel indicators in the wildfire spread capacity index (WSCI): Case of Montenegro. Not. Bot. Horti Agrobot. Cluj-Napoca 2020, 48, 2368–2384. [Google Scholar] [CrossRef]
- Jain, A.; Nandakumar, K.; Ross, A. Score normalization in multimodal biometric systems. Pattern Recognit. 2005, 38, 2270–2285. [Google Scholar] [CrossRef]
- Büttner, G.; Kosztra, B.; Soukup, T.; Sousa, A.; Langanke, T. CLC2018 Technical Guidelines. Eur. Environ. Agency 2017, 25, 1–60. [Google Scholar]
- Didan, K. MOD13Q1 MODIS/Terra Vegetation Indices 16-Day L3 Global 250 m SIN Grid V006. NASA EOSDIS Land Processes DAAC. 2015. Available online: https://doi.org/10.5067/MODIS/MOD13Q1.006 (accessed on 27 December 2020).
- Palchaudhuri, M.; Biswas, S. Application of LISS III and MODIS-derived vegetation indices for assessment of micro-level agricultural drought. Egypt. J. Remote. Sens. Space Sci. 2020, 23, 221–229. [Google Scholar] [CrossRef]
- Fick, S.E.; Hijmans, R.J. WorldClim 2: New 1-km spatial resolution climate surfaces for global land areas. Int. J. Climatol. 2017, 37, 4302–4315. [Google Scholar] [CrossRef]
- Buontempo, C.; Hutjes, R.; Beavis, P.; Berckmans, J.; Cagnazzo, C.; Vamborg, F.; Thépaut, J.-N.; Bergeron, C.; Almond, S.; Amici, A.; et al. Fostering the development of climate services through Copernicus Climate Change Service (C3S) for agriculture applications. Weather. Clim. Extremes 2020, 27, 100226. [Google Scholar] [CrossRef]
- Loepfe, L.; Lloret, F.; Roman-Cuesta, R.M. Comparison of burnt area estimates derived from satellite products and national statistics in Europe. Int. J. Remote Sens. 2011, 33, 3653–3671. [Google Scholar] [CrossRef]
- Giglio, L.; van der Werf, G.; Randerson, J.T.; Collatz, G.J.; Kasibhatla, P. Global estimation of burned area using MODIS active fire observations. Atmos. Chem. Phys. Discuss. 2006, 6, 957–974. [Google Scholar] [CrossRef] [Green Version]
- Mouillot, F.; Schultz, M.; Yue, C.; Cadule, P.; Tansey, K.; Ciais, P.; Chuvieco, E. Ten years of global burned area products from spaceborne remote sensing—A review: Analysis of user needs and recommendations for future developments. Int. J. Appl. Earth Obs. Geoinf. 2014, 26, 64–79. [Google Scholar] [CrossRef] [Green Version]
- Artés, T.; Oom, D.; De Rigo, D.; Durrant, T.H.; Maianti, P.; Libertà, G.; San-Miguel-Ayanz, J. A global wildfire dataset for the analysis of fire regimes and fire behaviour. Sci. Data 2019, 6, 1–11. [Google Scholar] [CrossRef]
- Fornacca, D.; Ren, G.; Xiao, W. Performance of Three MODIS Fire Products (MCD45A1, MCD64A1, MCD14ML), and ESA Fire_CCI in a Mountainous Area of Northwest Yunnan, China, Characterized by Frequent Small Fires. Remote Sens. 2017, 9, 1131. [Google Scholar] [CrossRef] [Green Version]
- Hall, J.V.; Loboda, T.V.; Giglio, L.; McCarty, G.W. A MODIS-based burned area assessment for Russian croplands: Mapping requirements and challenges. Remote Sens. Environ. 2016, 184, 506–521. [Google Scholar] [CrossRef] [Green Version]
- Galizia, L.F.; Curt, T.; Barbero, R.; Rodrigues, M. Assessing the accuracy of remotely sensed fire datasets across the southwestern Mediterranean Basin. Nat. Hazards Earth Syst. Sci. 2021, 21, 73–86. [Google Scholar] [CrossRef]
- Moreno-Ruiz, J.A.; García-Lázaro, J.R.; Arbelo, M.; Cantón-Garbín, M. MODIS Sensor Capability to Burned Area Mapping—Assessment of Performance and Improvements Provided by the Latest Standard Products in Boreal Regions. Sensors 2020, 20, 5423. [Google Scholar] [CrossRef]
- Wei, T.; Simko, V. R package “corrplot”: Visualization of a Correlation Matrix. Statistician 2017, 56, e24. [Google Scholar]
- He, T.; Belcher, C.M.; Lamont, B.B.; Lim, S.L. A 350-million-year legacy of fire adaptation among conifers. J. Ecol. 2016, 104, 352–363. [Google Scholar] [CrossRef] [Green Version]
- Crisp, M.D.; Burrows, G.E.; Cook, L.G.; Thornhill, A.; Bowman, D.M.J.S. Flammable biomes dominated by eucalypts originated at the Cretaceous–Palaeogene boundary. Nat. Commun. 2011, 2, 193. [Google Scholar] [CrossRef] [Green Version]
- Pausas, J.G.; Keeley, J.E. Abrupt Climate-Independent Fire Regime Changes. Ecosystems 2014, 17, 1109–1120. [Google Scholar] [CrossRef]
- Zhu, C.; Kobayashi, H.; Kanaya, Y.; Saito, M. Size-dependent validation of MODIS MCD64A1 burned area over six vegetation types in boreal Eurasia: Large underestimation in croplands. Sci. Rep. 2017, 7, 1–9. [Google Scholar] [CrossRef]
- Radeloff, V.C.; Stewart, S.I.; Hawbaker, T.; Gimmi, U.; Pidgeon, A.M.; Flather, C.; Hammer, R.B.; Helmers, D.P. Housing growth in and near United States protected areas limits their conservation value. Proc. Natl. Acad. Sci. USA 2010, 107, 940–945. [Google Scholar] [CrossRef] [PubMed] [Green Version]
- Geldmann, J.; Joppa, L.N.; Burgess, N.D. Mapping Change in Human Pressure Globally on Land and within Protected Areas. Conserv. Biol. 2014, 28, 1604–1616. [Google Scholar] [CrossRef] [PubMed]
- Jones, K.R.; Venter, O.; Fuller, R.A.; Allan, J.R.; Maxwell, S.L.; Negret, P.J.; Watson, J.E.M. One-third of global protected land is under intense human pressure. Science 2018, 360, 788–791. [Google Scholar] [CrossRef] [PubMed] [Green Version]
- Schulze, K.; Knights, K.; Coad, L.; Geldmann, J.; Leverington, F.; Eassom, A.; Marr, M.; Butchart, S.H.M.; Hockings, M.; Burgess, N.D. An assessment of threats to terrestrial protected areas. Conserv. Lett. 2018, 11. [Google Scholar] [CrossRef] [Green Version]
- DiTomaso, J.M.; Brooks, M.L.; Allen, E.B.; Minnich, R.; Rice, P.M.; Kyser, G.B. Control of Invasive Weeds with Prescribed Burning. Weed Technol. 2006, 20, 535–548. [Google Scholar] [CrossRef]
- Grigorescu, I.; Kucsicsa, G.; Dumitraşcu, M.; Doroftei, M. Invasive terrestrial plant species in the Romanian protected areas. A review of the geographical aspects. Folia Oecol. 2020, 47, 168–177. [Google Scholar] [CrossRef]
- Martín-Martín, C.; Bunce, R.G.; Saura, S.; Elena-Rossello, R. Changes and interactions between forest landscape connectivity and burnt area in Spain. Ecol. Indic. 2013, 33, 129–138. [Google Scholar] [CrossRef]
- O’Donnell, A.J.; Boer, M.; McCaw, W.L.; Grierson, P. Vegetation and landscape connectivity control wildfire intervals in unmanaged semi-arid shrublands and woodlands in Australia. J. Biogeogr. 2010, 38, 112–124. [Google Scholar] [CrossRef]
- Brenner, J.C.; Franklin, K.A. Living on the Edge: Emerging Environmental Hazards on the Peri-Urban Fringe. Environ. Sci. Policy Sustain. Dev. 2017, 59, 16–29. [Google Scholar] [CrossRef]
- Sestras, P.; Bilașco, Ș.; Roșca, S.; Dudic, B.; Hysa, A.; Spalević, V. Geodetic and UAV Monitoring in the Sustainable Management of Shallow Landslides and Erosion of a Susceptible Urban Environment. Remote Sens. 2021, 13, 385. [Google Scholar] [CrossRef]
- Davis, J.B. The wildland-urban interface: Paradise or battleground? J. For. 1990, 88, 26–31. [Google Scholar]
- Hysa, A. Classifying the Forest Surfaces in Metropolitan Areas by Their Wildfire Ignition Probability and Spreading Capacity in Support of Forest Fire Risk Reduction. In Integrated Research on Disaster Risks: Contributions from the IRDR Young Scientists Programme; Djalante, R., Bisri, M.B.F., Shaw, R., Eds.; Springer Science and Business Media LLC: Cham, Switzerland, 2021; pp. 51–70. [Google Scholar]
- Hysa, A. Indexing the vegetated surfaces within WUI by their wildfire ignition and spreading capacity, a comparative case from developing metropolitan areas. Int. J. Disaster Risk Reduct. 2021, 63, 102434. [Google Scholar] [CrossRef]
- Basiri, A.; Jackson, M.; Amirian, P.; Pourabdollah, A.; Sester, M.; Winstanley, A.; Moore, T.; Zhang, L. Quality assessment of OpenStreetMap data using trajectory mining. Geo-Spatial Inf. Sci. 2016, 19, 56–68. [Google Scholar] [CrossRef] [Green Version]
Publisher’s Note: MDPI stays neutral with regard to jurisdictional claims in published maps and institutional affiliations. |
© 2021 by the authors. Licensee MDPI, Basel, Switzerland. This article is an open access article distributed under the terms and conditions of the Creative Commons Attribution (CC BY) license (https://creativecommons.org/licenses/by/4.0/).